Article

Absorption and Transport of Phosphorus in Nodulated Soybean Plants and Diagnosis of Phosphorus Status Using Xylem Sap Analysis

Department of Agricultural Chemistry, Faculty of Applied Biosciences, Tokyo University of Agriculture, Tokyo 156-8502, Japan
*
Author to whom correspondence should be addressed.
Agriculture 2024, 14(3), 403; https://doi.org/10.3390/agriculture14030403
Submission received: 19 January 2024 / Revised: 28 February 2024 / Accepted: 28 February 2024 / Published: 1 March 2024
(This article belongs to the Special Issue Advances in Legume Nitrogen Fixation in Agroecosystems)

Abstract

:
Phosphorus (P) is an essential major element for plants. The absorption and transport of P are important for soybean growth and yield, including nodule growth and N2 fixation. Through an analysis of xylem sap, we investigated how nodulated soybean plants absorb PO4 via the roots and transport it to the shoot. The nodulated soybean plants were treated with 0, 50, and 250 μM PO4 concentrations for 1, 3, 7, and 15 days. The PO4 concentration in the xylem sap significantly decreased after 1 day of P deprivation, and then it gradually decreased for 15 days. The high-concentration (250 μM PO4) treatment increased the PO4 concentrations in the xylem sap at 7- and 15-day timepoints but not at the 1- or 3-day timepoints. The soybean plants were treated with 0, 25, 50, 100, 150, 250, and 500 μM PO4 for 3 days. The PO4 absorption rate increased consistently in conjunction with the increase in the PO4 concentration; however, the PO4 concentrations in the xylem sap increased only from 0 to 50 μM PO4 but were constant under higher P concentrations. The soybean plants accumulated extra PO4 in the roots. The PO4 concentration in the xylem sap immediately reflected the P deficiency conditions; thus, this index may be used as an indicator for the diagnosis of P deficiency.

1. Introduction

Phosphorus (P) is an essential major element and plays key roles in photosynthesis, respiration, and energy transformation in plants. In addition, P is a component of nucleic acids and membranes and plays a regulatory role in enzymes [1]. P is sometimes a limiting factor in the growth and yield of crops because the available P levels in soils are generally low, and the P mobility in soil is slow [2,3]. Therefore, P fertilizers are applied to sustain modern agriculture; however, the crops use only 15–30% of the applied P fertilizers, and the rest is lost through fixation on the soil or via leaching into groundwater or rivers [4,5]. At natural pH conditions, PO4 is present as a mixture of HPO42− and H2PO4 and is predominantly present in the latter form [3]. Plant roots absorb P mainly in the form of H2PO4, and plants cannot directly absorb organic-P forms, which are relatively abundant in soils compared with inorganic P [1]. Plant roots depend on high-affinity phosphate transporters (PHTs) to absorb H2PO4 in the soil solution, and the uptake of H2PO4 is an energy-mediated process driven by a proton-motive force [1].
It has been reported that P is a limiting factor for soybean growth and seed yield, and P deficiency represses nodule formation and nitrogen fixation [6,7,8]. Therefore, it is necessary to understand the P absorption, P accumulation, and P transport processes to obtain optimum growth and high yield of soybean plants with the efficient use of P fertilizers.
Nutrients and water in the soil are absorbed by the epidermis and cortical cells in the plant’s roots and then transported through the endodermis by passing through the symplast to the stele. Then, P is transported to the shoot through the xylem vessels, forced via both transpiration through the stomata of the leaves and root pressure. The xylem sap flow from the cut surface of the stem depends on the root pressure due to the lack of transpiration by the shoot. The xylem sap composition obtained from the stem cut surface may reflect the original composition before cutting; however, the composition or concentration of nutrients may be changed by the shoot removal, especially a long time after cutting, for example, due to the lack of photoassimilate transport from the leaves. In previous studies, xylem sap analysis has been used to evaluate nitrogen fixation activities and N absorption rate in the roots of field-grown soybeans [9,10]. Additionally, Noguchi et al. proposed that the xylem sap method can be used for estimating nutrient availability in soil [11,12].
Although numerous studies have revealed the characteristics of P absorption in the roots and PO4 transporters [1,3,4,5,13,14,15], the comprehensive processes of absorption and transport of P from roots to shoots in nodulated soybean plants have not yet been fully understood. Li et al. [13] demonstrated, using dual-root systems in which P was supplied to one side of the roots, that P was a priori transported to the nodules in the P-free side from the shoots. The high-affinity P transporter GmPT5 may contribute to the transport of PO4 from the roots to the nodules [14]. On the other hand, Chen et al. reported that PO4 in a soil solution is absorbed directly from the nodule surface mediated by GmPT7 [15]. It has also not been investigated how the shoot cutting affects the P uptake and translocation of soybean plants. In this study, the xylem sap compositions of nodulated soybean plants were analyzed to investigate the P uptake by the roots and translocation rate from roots to shoots.
Nutritional disorders, such as nutrient deficiency or excess toxicity, can cause poor plant growth and crop yield [16]. The diagnosis of nutritional disorders is important to obtain optimum growth, yield, and quality of the crops with an adequate supply of nutrients, which can avoid the excess application of fertilizers, minimizing the fertilizer cost and environmental impacts. Usually, the diagnosis of nutritional disorders has been performed using visible symptoms, plant analysis, or soil analysis [16]. Sometimes, a nutrient deficiency or an excess of nutrients causes visible symptoms such as chlorosis, necrosis, or deformations in the leaves and specific toxic symptoms on fruits [17]. Generally, visible symptoms occur after a long-term deficiency or toxicity condition, and consequently, crops cannot recover when the visible symptoms have become evident. The plant analysis usually uses the mineral concentrations in leaves. The chemical analysis of the dried leaves requires grinding them into a powder and using chemical or heat digestion to decompose the organic materials in the plant samples, thus solubilizing the nutrient elements. These processes require a lot of labor and are time-consuming. The plant analysis that uses the squeezed juice of petioles or leaves and xylem sap is more rapid without any drying, grounding, or digestive processes required. Xylem sap from the cut end of stems or juice squeezed from petioles or leaf blades has been used for the diagnosis of nutrition of N, P, or micronutrients [18,19,20,21]. Roppongi [18] analyzed the NO3 concentrations in the petiole juice of cucumber and proposed the optimum range of NO3 concentrations. A similar NO3 diagnosis was reported for eggplants [21]. The xylem sap analysis of P from soybean cut stems indicated that the inorganic P (Pi) concentration in xylem sap following excess P fertilizer application was as much as that from the P-deficient plant without P fertilizer [20]. The concentrations of K, Ca, Mg, P, S, Zn, Fe, Mn, Cu, Mo, and Si rose initially and then fell during the reproductive stage [22]. To estimate the N derived from N2 fixation in the root nodules and the N absorbed from the roots, a relative ureide method was applied for the field-grown soybean, in which the concentrations of ureides, amides, and NO3 in the xylem sap were analyzed. The N concentrations of ureides were considered to be the N derived from N2 fixation, and the sum of N concentration of amides and NO3 was the N derived from N absorption [9,10]. It is possible that the concentration of PO4 in the xylem sap can be used as an indicator of current P status.
Generally, the P criteria for optimal growth is in the range of 0.3–0.5% based on leaf dry weight (DW) in the vegetative growth stage and the possibility of toxicity increases at concentrations higher than 1% [2]. Many food legumes are more sensitive to high concentrations of P, such as a concentration of 0.3–0.4% reported in pigeon pea leaves [2]. A reduction in leaf expansion occurs in plants suffering from P deficiency. The chlorophyll concentration in leaves tended to increase under P deficiency, which differed from N deficiency [23]. P starvation sometimes induces an anthocyanin accumulation in the stems and leaves [24]. The root growth is less inhibited under P deficiency than the shoot growth, and, as a result, the shoot/root dry weight ratio decreases [25]. Soybean plants require relatively large amounts of P, especially at the pod-setting stage [26]. The symptoms of P deficiency are not well defined in soybeans; however, it generally causes retarded plant growth, the presence of spindly and small leaves, and sometimes leaves with dark green color [26]. In our previous paper [27], the PO4 concentration in the culture solution was optimum at 50 and 100 μM, and higher PO4 concentrations over 150 μM reduced the plant growth and led to yellowing in the lower leaves. Foote and Howell [28] investigated the P tolerance and sensitivity of soybean varieties, and Lincoln plants exhibited decreased growth caused by P toxicity at P levels over 0.72 mM. Gremaud and Harper [29] used a culture solution with 100 µM P.
In this study, we investigated the absorption, transport, and accumulation of PO4 in nodulated soybean plants cultivated with the original culture solution without adding potassium bicarbonate to maintain pH [27]. In the first experiment of this study, the soybean plants were cultivated either in an N-free solution or in a 5 mM NO3 solution, and the changes in xylem sap flow rate and the concentrations of major nutrients in the xylem sap after cutting the shoot were measured. We compared the changes in xylem sap composition between N-free plants and NO3 supply plants because NO3 in the culture solution is rapidly absorbed and transported to the shoots [30], and a high concentration of NO3 may affect the xylem sap composition. In the second experiment, the long-term effects of PO4 treatment deficiency (0 μM), adequate (50 μM), or excess (250 μM) PO4 in the culture solution were investigated after 1, 3, 7, and 15 days of the P treatments. In the third experiment, soybean plants were grown with seven levels of PO4 for three days, and the effects of PO4 concentrations in the culture solution on the absorption, transport, and accumulation of P in each part were investigated. In addition, the concentrations of ureides and amides were measured to monitor the effects on N2 fixation and transport. Here, we tried to evaluate whether the xylem sap PO4 analysis can be used for judging the P status of soybean plants for diagnosis.

2. Materials and Methods

2.1. Plant Cultivation

Soybean (Glycine max [L.] Merr., cv. Williams) seeds were sterilized with 70% ethanol for 30 sec and 0.5% sodium hypochlorite solution for 5 min sequentially. Then, the seeds were thoroughly rinsed with tap water and inoculated with a suspension of Bradyrhizobium diazoefficience (strain USDA110, 108 cells/mL) [31]. Plants were cultivated in a biophotochamber (LH-350S; Nippon Medical & Chemical instruments Co. Ltd., Osaka, Japan) under 28 °C-day/18 °C-night temperatures, 55% relative humidity, and under a photon flux density of 228 μmol m−2 s−1 with a 16 h photoperiod and an 8 h dark period. At 7 days after planting (DAP), a seedling was transplanted into an 800 mL nitrogen-free nutrient solution in a 900 mL glass bottle covered with aluminum foil to shade the root and culture solutions. The composition of the nutrient solution was the same as the original composition in Table 1A in [27]. The pH of the culture solution was adjusted to 6.0 ± 0.2 with 0.1 M NaOH and 0.1 M HCl. The culture solution was continuously aerated by an air pump, changed every 2 or 3 days until starting the P treatments, and changed every day during the P treatment period.

2.2. Changes in the Xylem Sap Flow Rate and Its Chemical Compositions after Shoot Removal

Soybean plants were cultivated with an N-free solution or with 5 mM NO3 to investigate the appropriate time for xylem sap sampling. At 28 DAP, the basal part of the stem at 5 cm above the roots was cut with a razor blade, and the xylem sap that exudated from the cut surface was collected. The cut surface of the stem was wiped with a paper towel for 5 min after cutting; then, the xylem sap was collected in a 1.5 mL plastic tube with glass wool inside [10]. The xylem sap was collected sequentially from the same plant during 5–35, 35–65, 65–125, 125–185, and 185–245 min treatment periods in different tubes. The weight of xylem sap was measured by subtracting the weight of the tube with glass wool from the weight of the tube after xylem sap collection. The xylem sap was extracted from the glass wool by sucking the liquid out with an automatic pipette and then stored at −80 °C until analysis.

2.3. Effect of Period of PO4 Treatments on the P Absorption Rate and P Concentration in Xylem Sap

The soybean plants were cultivated with an N-free culture solution containing 50 μM PO4 until 23 DAP. After 23 DAP, some plants were grown with a 0 μM PO4 (P0), 50 μM PO4 (P50), or 250 μM PO4 (P250) treatment. The 1-day and 3-day treatments were conducted using the plants from 29 to 30 DAP and 27 to 30 DAP, respectively. Other plants were treated from 23 to 30 DAP (7-day treatment) or from 23 to 38 DAP (15-day treatment). The shoots and roots were separately dried in a ventilation dryer at 80 °C until reaching a constant weight. The shoots were separated into leaves and stems, including petioles and buds. The underground parts were separated into the roots and nodules. The dry weight of each part was measured; then, the dry sample was ground into a fine powder.

2.4. Effect of P Concentrations in Culture Solution on the P Absorption Rate and P Concentration in Xylem Sap and Each Part of Soybean Plants

Soybean plants were inoculated with B. japonicum and cultivated with an N-free solution containing 50 mM PO4 until 27 DAP. At 27 DAP, the plants were treated with seven concentrations of PO4, 0, 25, 50, 100, 150, 250, and 500 μM by changing the concentrations of K2HPO4, referred to as P0, P25, P50, P100, P150, P250, and P500, respectively. The K concentrations were kept constant by decreasing the same concentration of K2SO4 in the original solution. The culture solutions were changed at 29 DAP, and the PO4 absorption was determined through analysis of the P contents in a bottle before and after cultivation. At 30 DAP, the xylem sap was collected for 30 min, and the plants were sampled.

2.5. Chemical Analysis

2.5.1. Measurement of PO4 Concentration

The PO4 concentrations in the culture solution and the xylem sap were analyzed by a modified ascorbic acid-molybdenum blue method [32,33]. The reagents were as follows: 0.2 mM potassium antimonyl tartrate; 0.8% (w/v) ammonium molybdate with 2% (v/v) H2SO4; and 5% (w/v) ascorbic acid. The procedure was as follows. A 500 μL of 0.2 mM potassium antimonyl tartrate solution was put in a 1.5 mL plastic tube, and 10 μL of sample solution was added. Next, 50 μL of ammonium molybdate solution was added, and the tube was vortexed. Then, 20 μL of the ascorbic solution was added and vortexed. A total of 200 μL of the reaction mixture was put into the well of the microplate and left to stand overnight. The absorbance at 880 nm was read by a microplate reader (SSH-1000; Corona Electric Co., Ltd., Ibaraki, Japan).
Extraction of PO4 from the plant powder was carried out as follows. The 20 mg DW of plant powder was put into a 5 mL plastic tube and 1 mL pure water was added. The tube was heated in a boiling water bath for 15 min. Next, it was ultrasonicated for 5 min, and the supernatant was separated with a centrifuge at 10,000 rpm for 5 min. The residue was re-extracted twice with 1 mL of water, and the three supernatants were combined and filled up to 3 mL.
The total-P concentration in each part was determined after HNO3 digestion of plant powder. The 25 mg DW of powder was put into a glass bottle, and 5 mL of concentrated HNO3 was added and then digested by heating the bottle. The PO4 concentration in the digested solution was determined by the modified molybdenum blue method, as described above. The concentration of organic-P was calculated by subtracting PO4 concentration from total P concentration.

2.5.2. Measurement of Cation and Anion Concentrations

The concentrations of anions and cations in xylem sap were determined by ion chromatography (IC-2010; Tosoh Techno System, Inc., Tokyo, Japan) using a cation column (TSKgel superIC-Cation, Tosoh Techno System, Inc.) or anion column (TSKgel superIC-Anion, Tosoh Techno System, Inc.).

2.5.3. Measurement of Amide and Ureide Concentrations

The concentrations of nitrate, glutamine (Gln), asparagine (Asn), allantoin, and al lantoate in the xylem sap were analyzed using capillary electrophoresis (7100; Agilent Technologies, Inc., Santa Clara, CA, USA). A fused silica tube (inner diameter: 50 µm; length: 104 cm) and a commercial buffer solution (α-AFQ109; Ohtsuka Electronics Co., Ltd., Osaka, Japan) were used with an applied voltage of −25 kV. Signal peaks were detected with a signal wavelength of 400 nm and a reference wavelength of 265 nm.

2.6. Statistics

The experiments were conducted with four biological replications. The plants were cultivated using a random arrangement in a growth chamber. Statistical significance using Tukey’s test was determined using the statistical analysis program of Biomedical Statistics, Graduate School of Medicine, Osaka University [34].

3. Results

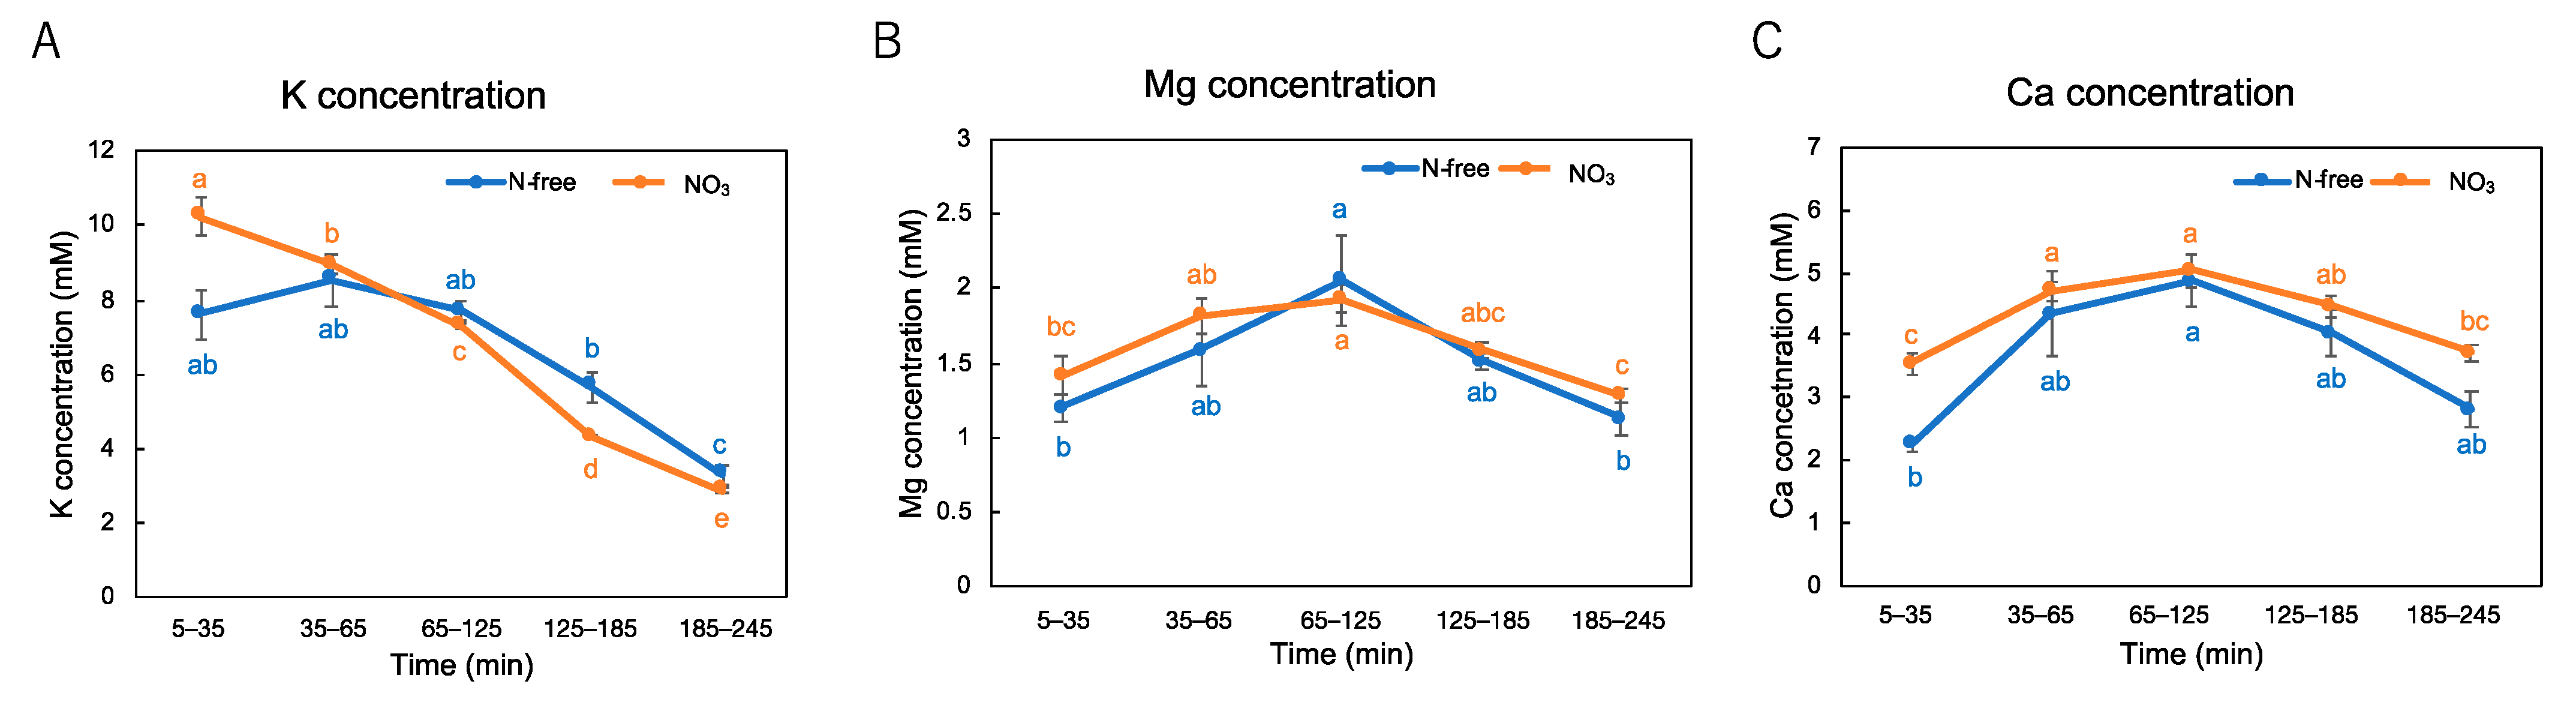
3.1. Changes in the Xylem Sap Flow Rate and the Concentrations of Nutrients after Shoot Removal

Changes in the xylem sap flow rate and the concentrations of nutrients were measured sequentially after the shoot removal of the nodulated soybean plant either cultivated in an N-free solution or a NO3 solution containing 5 mM NO3 to determine the appropriate time of xylem sap collection. The xylem sap flow rate was highest at the initial sampling period from 5 to 35 min after the shoot decapitation, then it decreased to about half and kept constant until 185–245 min in both the N-free solution and NO3 solution (Figure 1). The xylem sap flow rate during the initial 5–35 min in the plants in the NO3 solution was 560 μL/h and higher than that in the N-free solution (175 μL/h). This is because the plants cultivated with 5 mM NO3 grew bigger compared with the plants grown in an N-free culture solution in which plants only depended on nitrogen fixation.
Figure 2 shows the changes in the concentrations of major anions in the xylem sap of the plants cultivated with an N-free solution or NO3 solution. The PO4 concentrations in the xylem sap of the plants with an N-free solution are relatively constant at 1.2–1.6 mM during the sampling time. The PO4 concentration significantly increased in the xylem sap of soybeans cultivated with the NO3 solution after 125 min of sampling time (Figure 2A). The trend is different from the changes in PO4 concentrations in the xylem sap of the plants cultivated with an N-free solution. The SO4 concentration in the xylem sap from the N-free solution and the NO3 solution show similar trends: the SO4 concentration increased for an initial 65–125 min and then decreased (Figure 2B). The NO3 concentration in the xylem sap from the NO3 solution is 16.5 mM, the highest among the measured cations. The NO3 concentration remained constant until the 65–125 min period after cutting but decreased thereafter (Figure 2C). NO3 could not be detected in the xylem sap obtained from the N-free plants. The concentrations of Cl were different between the N-free and NO3 grown plants. The Cl concentration was the highest at the first sampling of the N-free plants, but it increased gradually in the xylem sap collected from the NO3 grown plants (Figure 2D).
Figure 3 shows the changes in the concentrations of principal cations in the xylem sap of the plants cultivated with N-free or NO3 solutions. While the trends were different from the changes in the concentrations of anions (Figure 2), the trends in the concentrations of cations were relatively similar between the N-free and NO3-grown plants. The K concentrations were the highest among the cations and decreased in line with the time after cutting (Figure 3A). The concentrations of Mg (Figure 3B) and Ca (Figure 3C) increased initially and then decreased, showing the maximum concentration during the 65–125 min period after cutting, irrespective of the presence or absence of NO3 in the culture solution.
From these experiments, the xylem sap flow rate was highest from 5–35 min and decreased thereafter both in N-free and NO3 cultivations (Figure 1). The concentrations of SO4, Cl, K, Mg, and Ca changed during sampling time after the shoot removal with N-free grown plants, and the concentrations of PO4, SO4, NO3, Cl, K, Mg, and Ca changed when cultivated with the NO3 solution. Therefore, we used the xylem sap collected from the initial 5–35 min period after shoot removal in the following experiments.

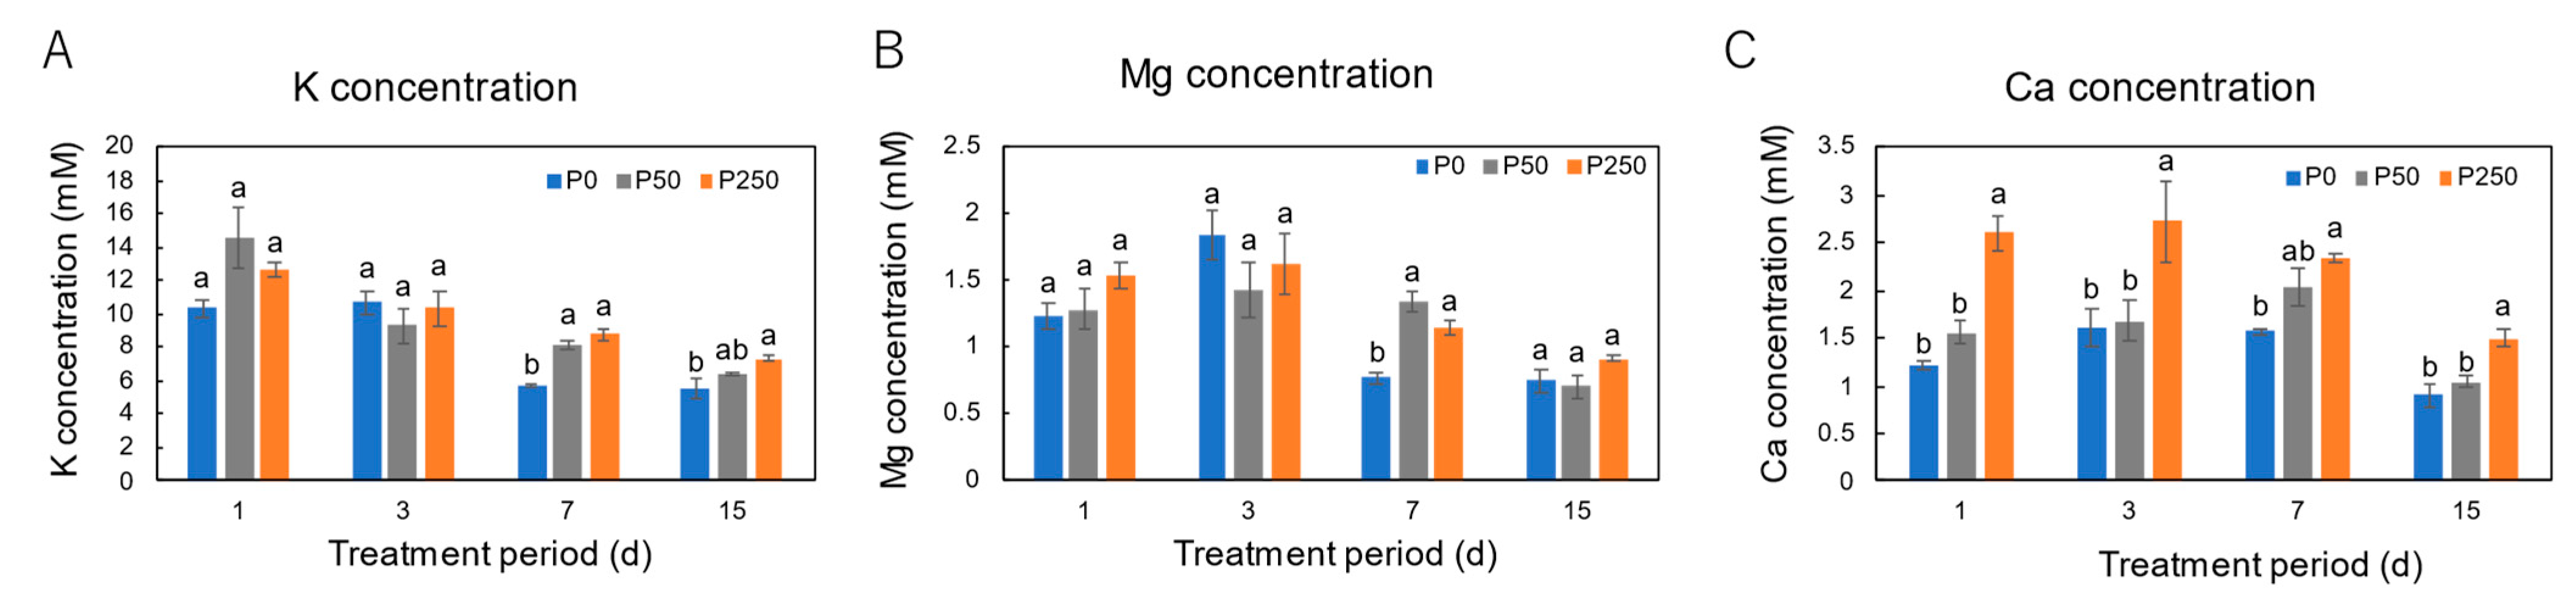
3.2. Effect of Period of P Treatments in Culture Solution on the P and Nutrient Concentrations in Xylem Sap of Soybean Plants Cultivated with an N-Free Culture Solution

The dry weight of roots, nodules, stems, and leaves are not affected by the P treatments at 1 day, 3 days, and 7 days (Figure 4A). The dry weight of nodules at 15-day treatment is significantly lower in the P0 treatment than in the P50 treatment (Figure 4B). The DW of roots, stems, and leaves tend to also be higher in the P50 and P250 treatments than the P0 treatment, although not statistically significant.
The daily transpiration rates were measured for the 15-day plants during the P treatments (Figure 5). The transpiration rates are higher with the P50 and P250 treatments than those with the P0 treatment.
As shown in Figure 6, only after 1 day of P0 treatment is the concentration of PO4 in xylem sap significantly lower (2 mM) than those of the control P50 treatment (3.7 mM) and P250 treatment (4.2 mM), suggesting that the P deficiency rapidly reflects the concentration of PO4 in xylem sap (Figure 6A). At 15 days, the PO4 concentrations in the xylem sap of P0 treatment further decreased to 0.3 mM. At 1 day and 3 days of treatment, the PO4 concentrations are not significantly different between the P50 and P250 treatments. However, it is significantly different at the 7-day and 15-day timepoints.
The SO4 concentrations are almost the same at 1 day and 3 days among the PO4 treatments, but the P0 treatment at the 7-day and 15-day timepoints are significantly lower than those of the P50 and P250 treatments (Figure 6B).
In relation to the cation concentrations, the K concentrations in the xylem sap in the P0 treatment are significantly lower than those in the P50 and P250 treatments at 7 days and 15 days of PO4 treatment (Figure 7A). Similar results are observed for the Mg concentration at 7 days (Figure 7B). Different from K and Mg, the Ca concentration is significantly higher in the P250 treatment than those in the P0 and P50 treatments from 1 day to 15 days of treatment (Figure 7C).
The concentrations of Asn (Figure 8A) and Gln (Figure 8B) are not significantly different at 1 day and 3 days of P0, P50, and P250 treatments. However, the Asn concentration in xylem sap significantly decreased at 7 days and 15 days with the P0 treatment compared with the control P50 treatment. The Gln concentration also decreased at 15 days with P0 treatment but not at 7 days of treatment.
The concentrations of allantoin (Figure 8C) and allantoate (Figure 8D) are not affected by the P treatments, including long-term P deficiency (P0) during the 15-day period. These results suggest that the P0 treatment did not bring about a depression in N2 fixation, N assimilation, and N transport from nodules.

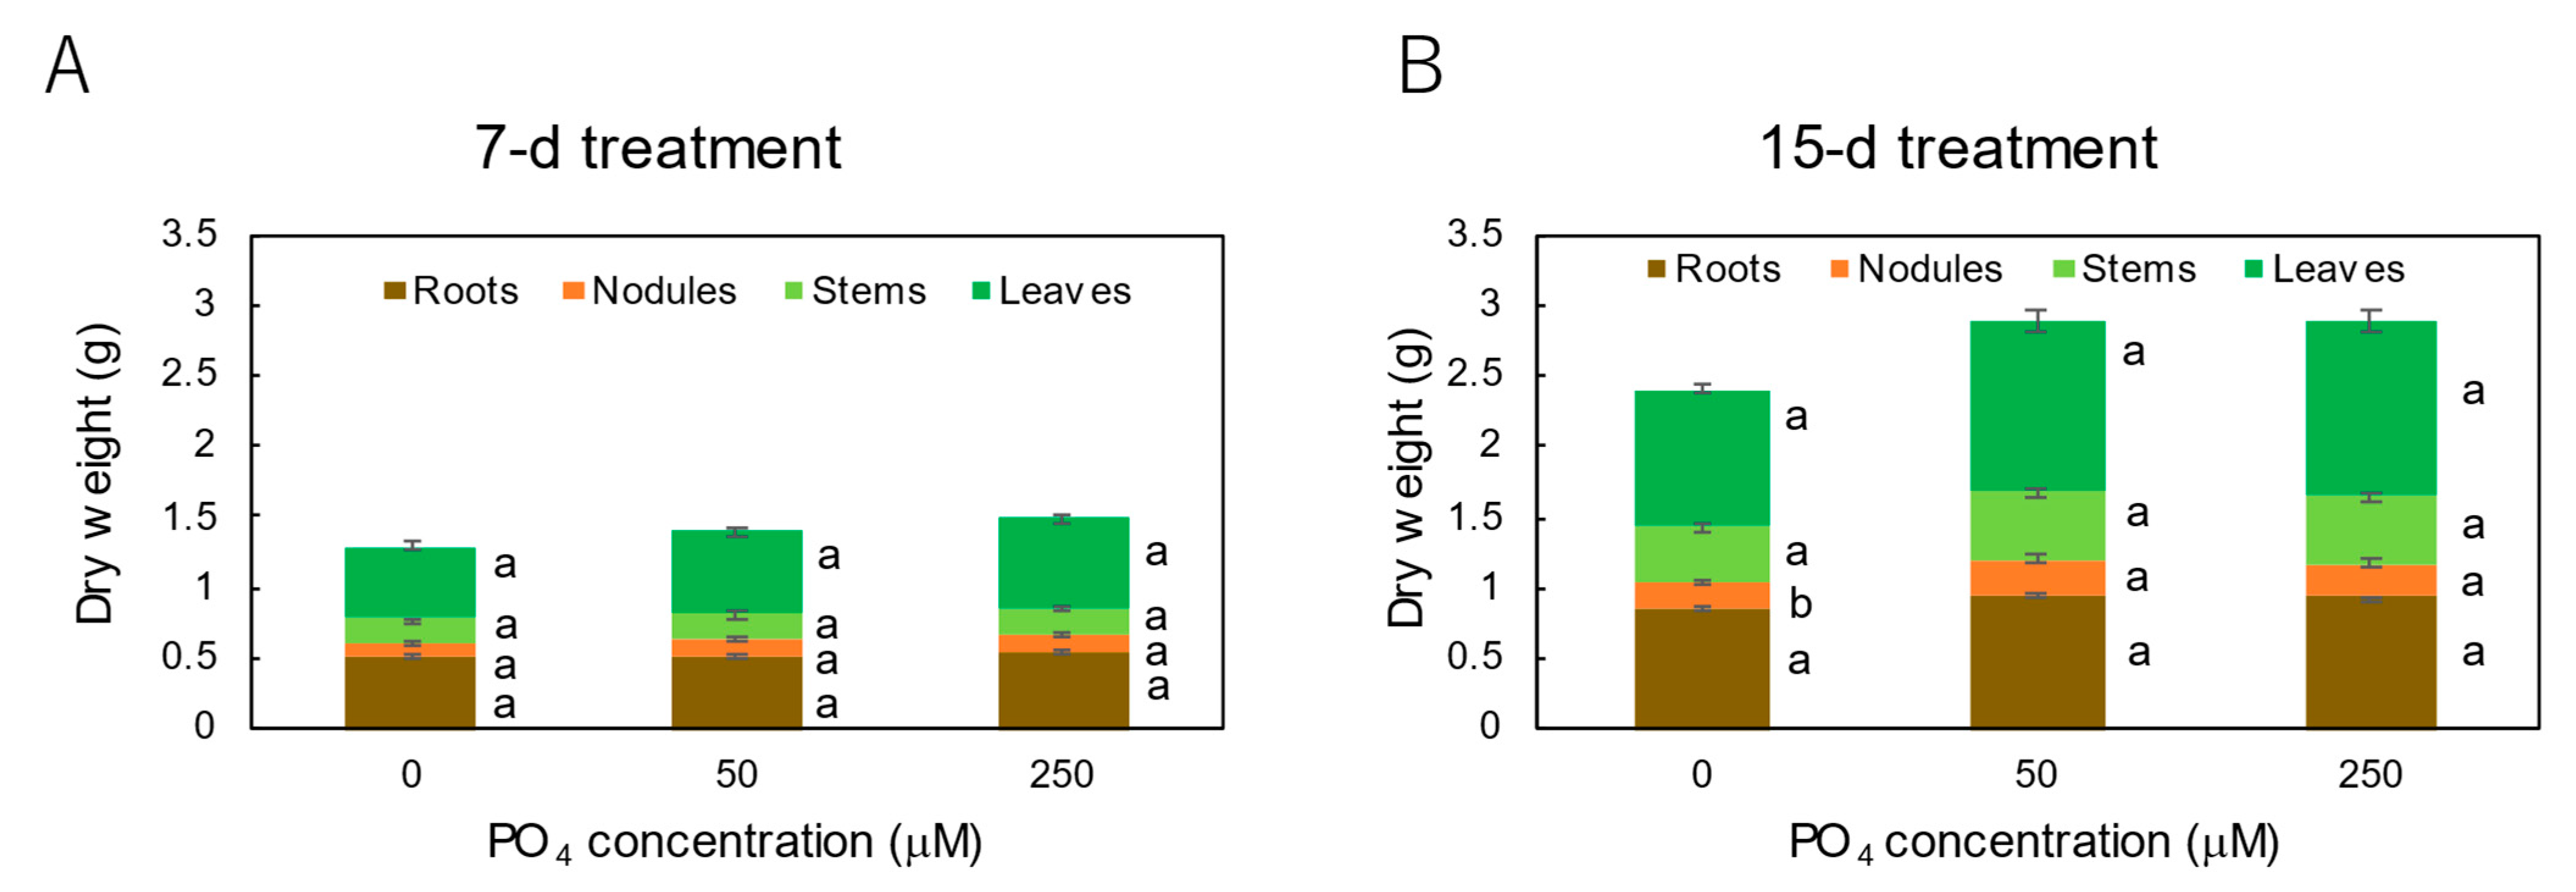
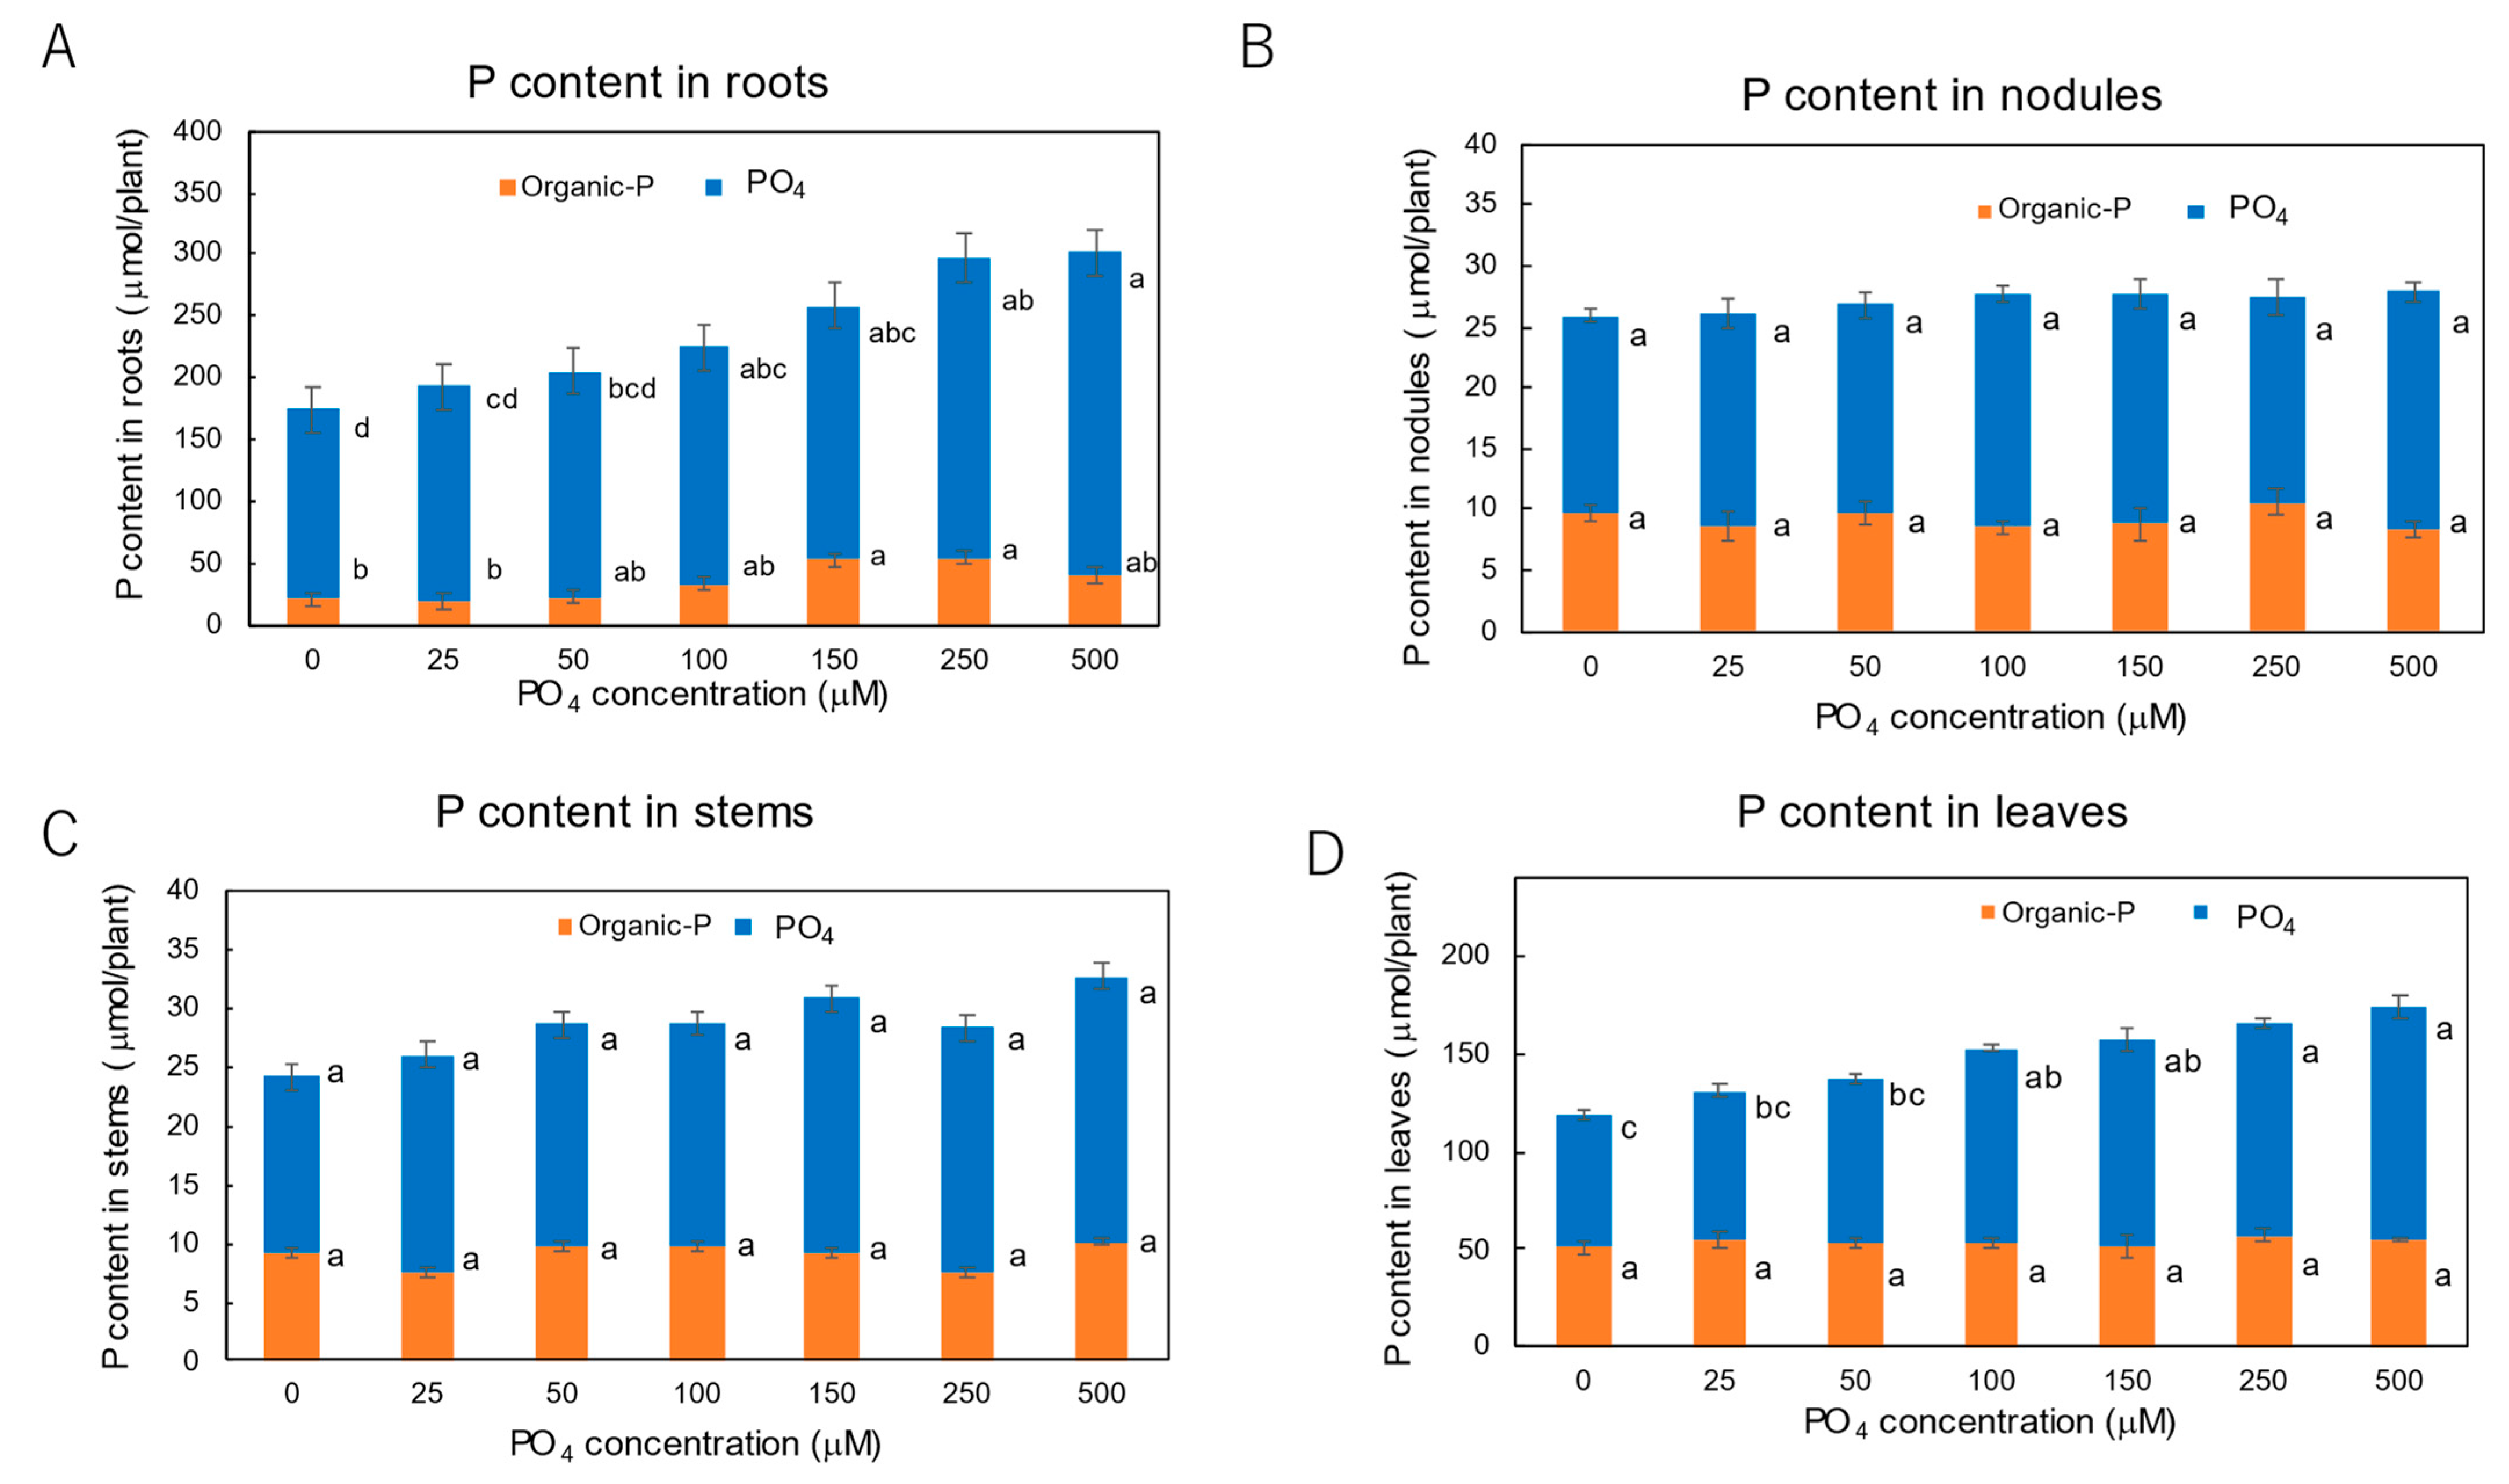
3.3. Effect of P Concentrations in Culture Solution on the P Concentrations in Xylem Sap and Plant Parts of Soybean Plants Cultivated with N-Free Culture Solution

Figure 9 shows the dry weight of each organ of the plants treated with various P concentrations for 3 days (Figure 9A) and the distribution of dry matter (Figure 9B). The average dry weight of the roots (0.54 g), nodules (0.18 g), stems (0.23 g), and leaves (0.87 g) across the seven treatments, and the dry weight in all organs is not significantly different among P treatments for 3 days (Figure 9A). The percentage distribution of the roots (30%), nodules (10%), stems (13%), and leaves (47%) is similar among the P treatments (Figure 9B).
Figure 10A shows the xylem sap flow rate. The average xylem sap flow rate among all P concentrations is 0.21 mL/h. The xylem sap flow rate tends to be lower in P0, P250, and P500 than in P100, although the flow rates are not statistically significant among P treatments. The transpiration rate is also not significantly different among P treatments, where the average is 49 mL/d (Figure 10B). The average transpiration rate is estimated to be 3.06 mL/h, to calculate which, the daily transpiration rate was divided by 16 because transpiration mainly occurs during the daytime for 16 h per day. The xylem sap flow rate (0.21 mL/h) is much slower than the transpiration rate (3.06 mL/h), which accounts for only about 7% of the transpiration rate. This result may be due to shoot removal in which the evapotranspiration from leaves ceased, and the exudation of xylem sap was only dependent on the root pressure.
Figure 11A shows the PO4 absorption rates estimated from the decrease in PO4 content in the culture medium from 27 to 29 DAP. The higher the P concentration in the culture medium, the PO4 absorption rate increases consistently.
The PO4 concentration in xylem sap is shown in Figure 11B. The PO4 concentration in the xylem sap of the P0 treatment is 1.28 mM, about half of the P50 treatment (2.58 mM), and therefore significantly lower. However, the xylem sap collected from soybean plants with higher concentrations of PO4 in the medium P100, P150, P250, and P500 are almost the same as that in P50. Interestingly, the PO4 absorption is higher in the higher concentration of PO4 in the culture solution (Figure 11A); meanwhile, the PO4 concentration in xylem sap reached the maximum of about 2.5–3.0 mM after P50 treatment with 50 μM PO4 (Figure 11B). The PO4 concentration in xylem sap may be a usable indicator of P deficiency, but it does not reflect the excess P conditions.
The total P contents in each part of the plants and the distribution are shown in Figure 12. After 3 days of P treatment, the P content in the roots and leaves increased significantly for the P250 and P500 treatments compared with the P0, P25, and P50 treatments; meanwhile, the P content in nodules and stems is not different among all P treatments (Figure 12A). The results indicate that the excess PO4 absorbed in the roots is mainly accumulated in the roots and leaves but not in the nodules and stems. The total-P distribution among organs (Figure 12B) shows that the percentage distribution of total-P in the roots increases from 37% (P0) to 45% (P250), but that in the leaves decreases from 44% (P0) to 41% (P500). This result indicates that the roots are the primary organ that accumulates extra-P from the culture solution under a high P concentration, and some PO4 may be transported to the leaves and accumulated there.
The PO4 and organic-P (total-P minus PO4) contents in each part of soybean plants after 3 days of P treatments are shown in Figure 13. The organic-P fraction consists of nucleic acids, phospholipids, phosphosugars, phosphoproteins, etc., which are fundamentally essential for maintaining biological components and physiological processes in the cells. In the alternative, low levels of inorganic PO4 are necessary to maintain energy, such as ATP, or regulatory processes, such as the phosphorylation of enzymes. In every organ examined, the inorganic PO4 was the predominant P form compared with the organic-P. Even in the P0 treatment, a large amount of PO4 remained after the 3-day period of P deficiency. The higher the P concentration of the culture solution, the more significant the increase in the PO4 content of roots and leaves, although the PO4 content was constant among P treatments in nodules and stems. The content of the organic-P was constant in stems, leaves, and nodules but significantly increased in the roots. These results showed that the extra PO4 absorbed mainly accumulated in the roots in the form of PO4 and was supplemented in the leaves. Some extra P absorbed in the roots assimilated into organic forms, but those were not remarkable in the leaves, stems, and nodules. However, after 3 days of P deficiency at P0 treatment, a high accumulation of PO4 compared with organic-P was observed. The rapid response of PO4 concentration in the xylem sap in P0 treatment may be related to the PO4 localization in the roots, where a PO4 pool at the transport pathway might be separated from the PO4 storage pool, possibly in the vacuoles.
The concentrations of amides (Asn, Gln) and ureides (allantoin, allantoate) are related to the N2 fixation activity and N metabolism in nodules and roots. As shown in Figure 14, the concentrations of Asn, Gln, allantoin, and allantoate between P0 and P25 treatments are not significantly different from the P50 control treatment. This suggests that P deficiency for 3 days did not affect the N2 fixation, N metabolism, and transport. On the other hand, the concentrations of N compounds in P250 and P500 tend to be higher than those in P0 and P25, although not statistically significant.

4. Discussion

4.1. Changes in the Xylem Sap Flow Rate and the Concentration of Nutrients after Shoot Removal of the Plants Cultivated with N-Free or NO3 Culture Solution

After shoot removal, the xylem sap flow rates and the concentrations of nutrients in xylem sap may be changed mainly due to the lack of photosynthate supply and evapotranspiration. So, we first measured the xylem sap flow rates and concentrations of major cations and anions in the xylem sap of soybean plants cultivated with N-free culture solution and 5 mM NO3 solution. In the previous report [30], the nodulated or non-nodulated soybean plants were supplied with an N-free solution or a solution with only NO3, NH4, urea, or NO3 + NH4 for 1 day. In the xylem sap of the nodulated plants with an N-free solution, ureides were the major N metabolites, followed by Asn and Gln, whereas, in the NO3 treatment, the ureide concentrations in the xylem sap decreased compared with the control plants.
In this experiment, the xylem sap flow rates were highest at the initial 5–35 min period, then decreased but continued until the 185–245 min period in the plants cultivated with an N-free solution and NO3 solution. The PO4 concentrations in the xylem sap were relatively constant when the plants were cultivated with an N-free solution. On the other hand, when the plants were grown with a NO3 solution, the PO4 concentration increased, while the NO3 concentrations decreased in line with the sampling period. The increase in PO4 and Cl concentrations in xylem sap collected from the plants with NO3 solution might be due to the compensation for the decrease in NO3 concentration. At any rate, the xylem sap flow rates and the chemical compositions were not constant after the shoot removal, so we used the xylem sap collected during the initial 30 min period from 5 to 35 min after the shoot removal.
Sato et al. [31] reported the concentrations of cations and anions in the xylem sap of the hypernodulation mutant lines and their parent type, cv. Williams, grown in a sandy dune field. The results showed that nitrate was the major anion (1.75 mM: average of all lines and sampling date at 50, 70, 90, 120 DAP), followed by phosphate (1.32 mM), sulfate (0.85 mM), and chloride (0.50 mM). Potassium was the predominant anion (5.72 mM), followed by magnesium (1.82 mM), calcium (1.77 mM), and sodium (0.45 mM). The results obtained here and shown in Figure 2 and Figure 3 are relatively the same as those obtained by Sato et al., while the NO3 concentration in xylem sap is much higher in this experiment (Figure 2) because 5 mM NO3 was supplied in the culture solution. Noodén and Mauk [22] also reported the mineral element concentrations in the xylem sap of the nodulated soybean during the reproductive stage cultivated in soil. The ranges of each element were similar to those obtained by Sato et al. [31]; however, the concentration of P decreased from the full-pod extension stage (2.5 mM) to the early leaf yellowing stage (0.4 mM) reported by Noodén and Mauk [22].

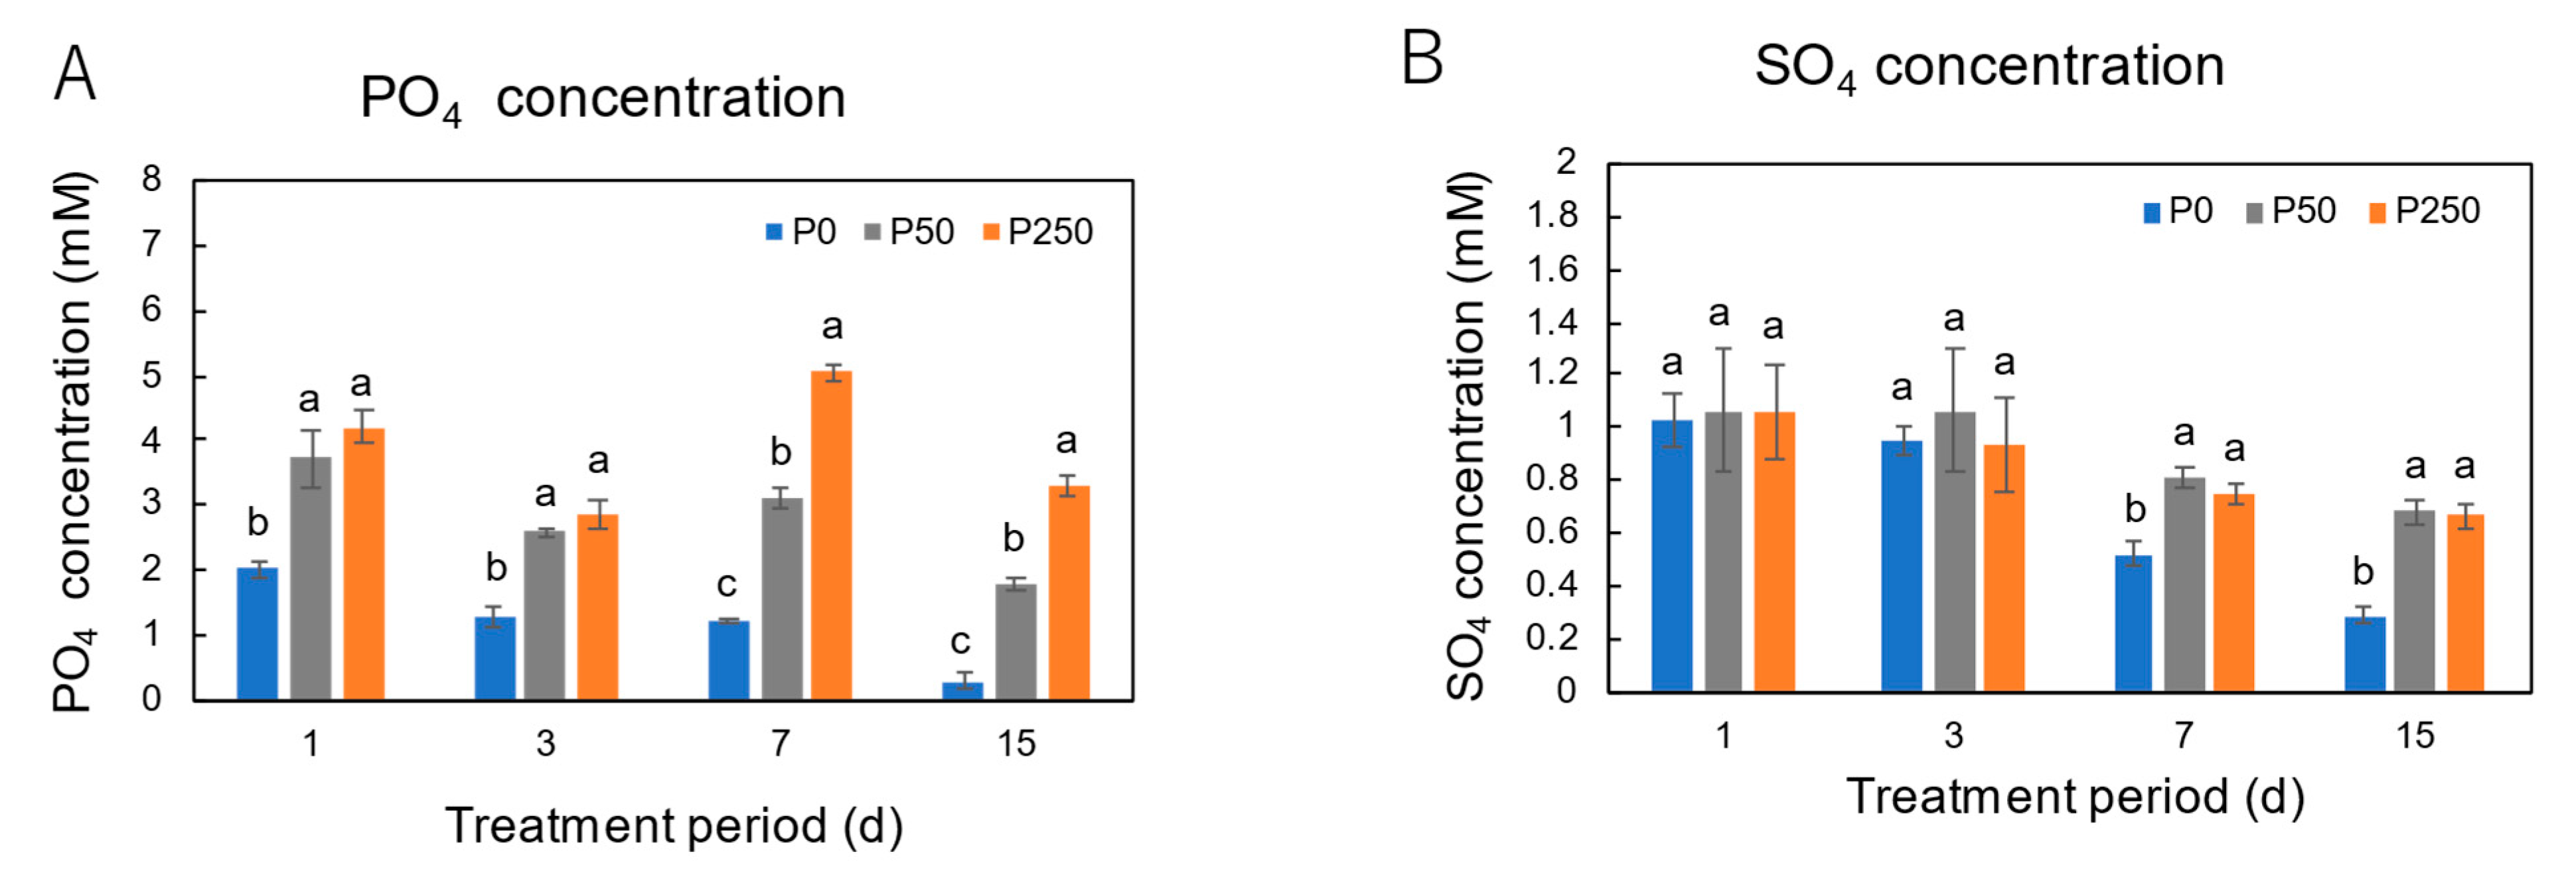
4.2. Long-Term Effect of Three Levels of P Treatment on the P and Nutrient Concentrations in Xylem Sap of Soybean Plants

Soybean plants were cultivated with 0 μM PO4 (P0), 50 μM PO4 (P50), or 250 μM PO4 (P250) for 1, 3, 7, and 15 days to investigate the long-term effects of P deficiency, adequate, and excess P conditions.
As shown in Figure 6A, the concentration of PO4 in the xylem sap with P0 treatment significantly decreased at 1 day compared with the control P50 treatment and further decreased at 15 days. Based on this result, it can be postulated that the PO4 concentration in xylem sap reflects the PO4 availability in the culture medium. The PO4 concentration in the xylem sap may be usable as an indicator for diagnosis of P deficiency. The PO4 concentrations of P250 were not different from the control P50 treatment at the 1-day and 3-day treatment periods, but those at the 7-day and 15-day treatment periods were significantly higher than the control treatment. The long-term excess conditions of P might increase the P absorption, accumulation, and P transport from roots to the shoots.
It has been established that ureides (allantoate, allantoin) are the principal N compounds with a small fraction of amides (Asn, Gln) from fixed N2 in the root nodules, while on the other hand, the N absorbed from roots is mainly transported to the shoots in the form of amides and NO3 with a small number of ureides [30]. However, the effects of P deficiency or P excess on the transport of ureides and amides have not been investigated. The concentrations of amides and ureides in the xylem sap were not significantly different at any period of P treatments (Figure 8). This suggested that P-deficient conditions did not inhibit N2 fixation in nodules until 15 days of P starvation. This indicated that the P already stored in the plants at the start of the P0 treatment could support the amount of P necessary for nodule growth and N2 fixation for 15 days at this stage. In addition, P-excess treatment (P250) did not inhibit the N transport in the xylem sap.

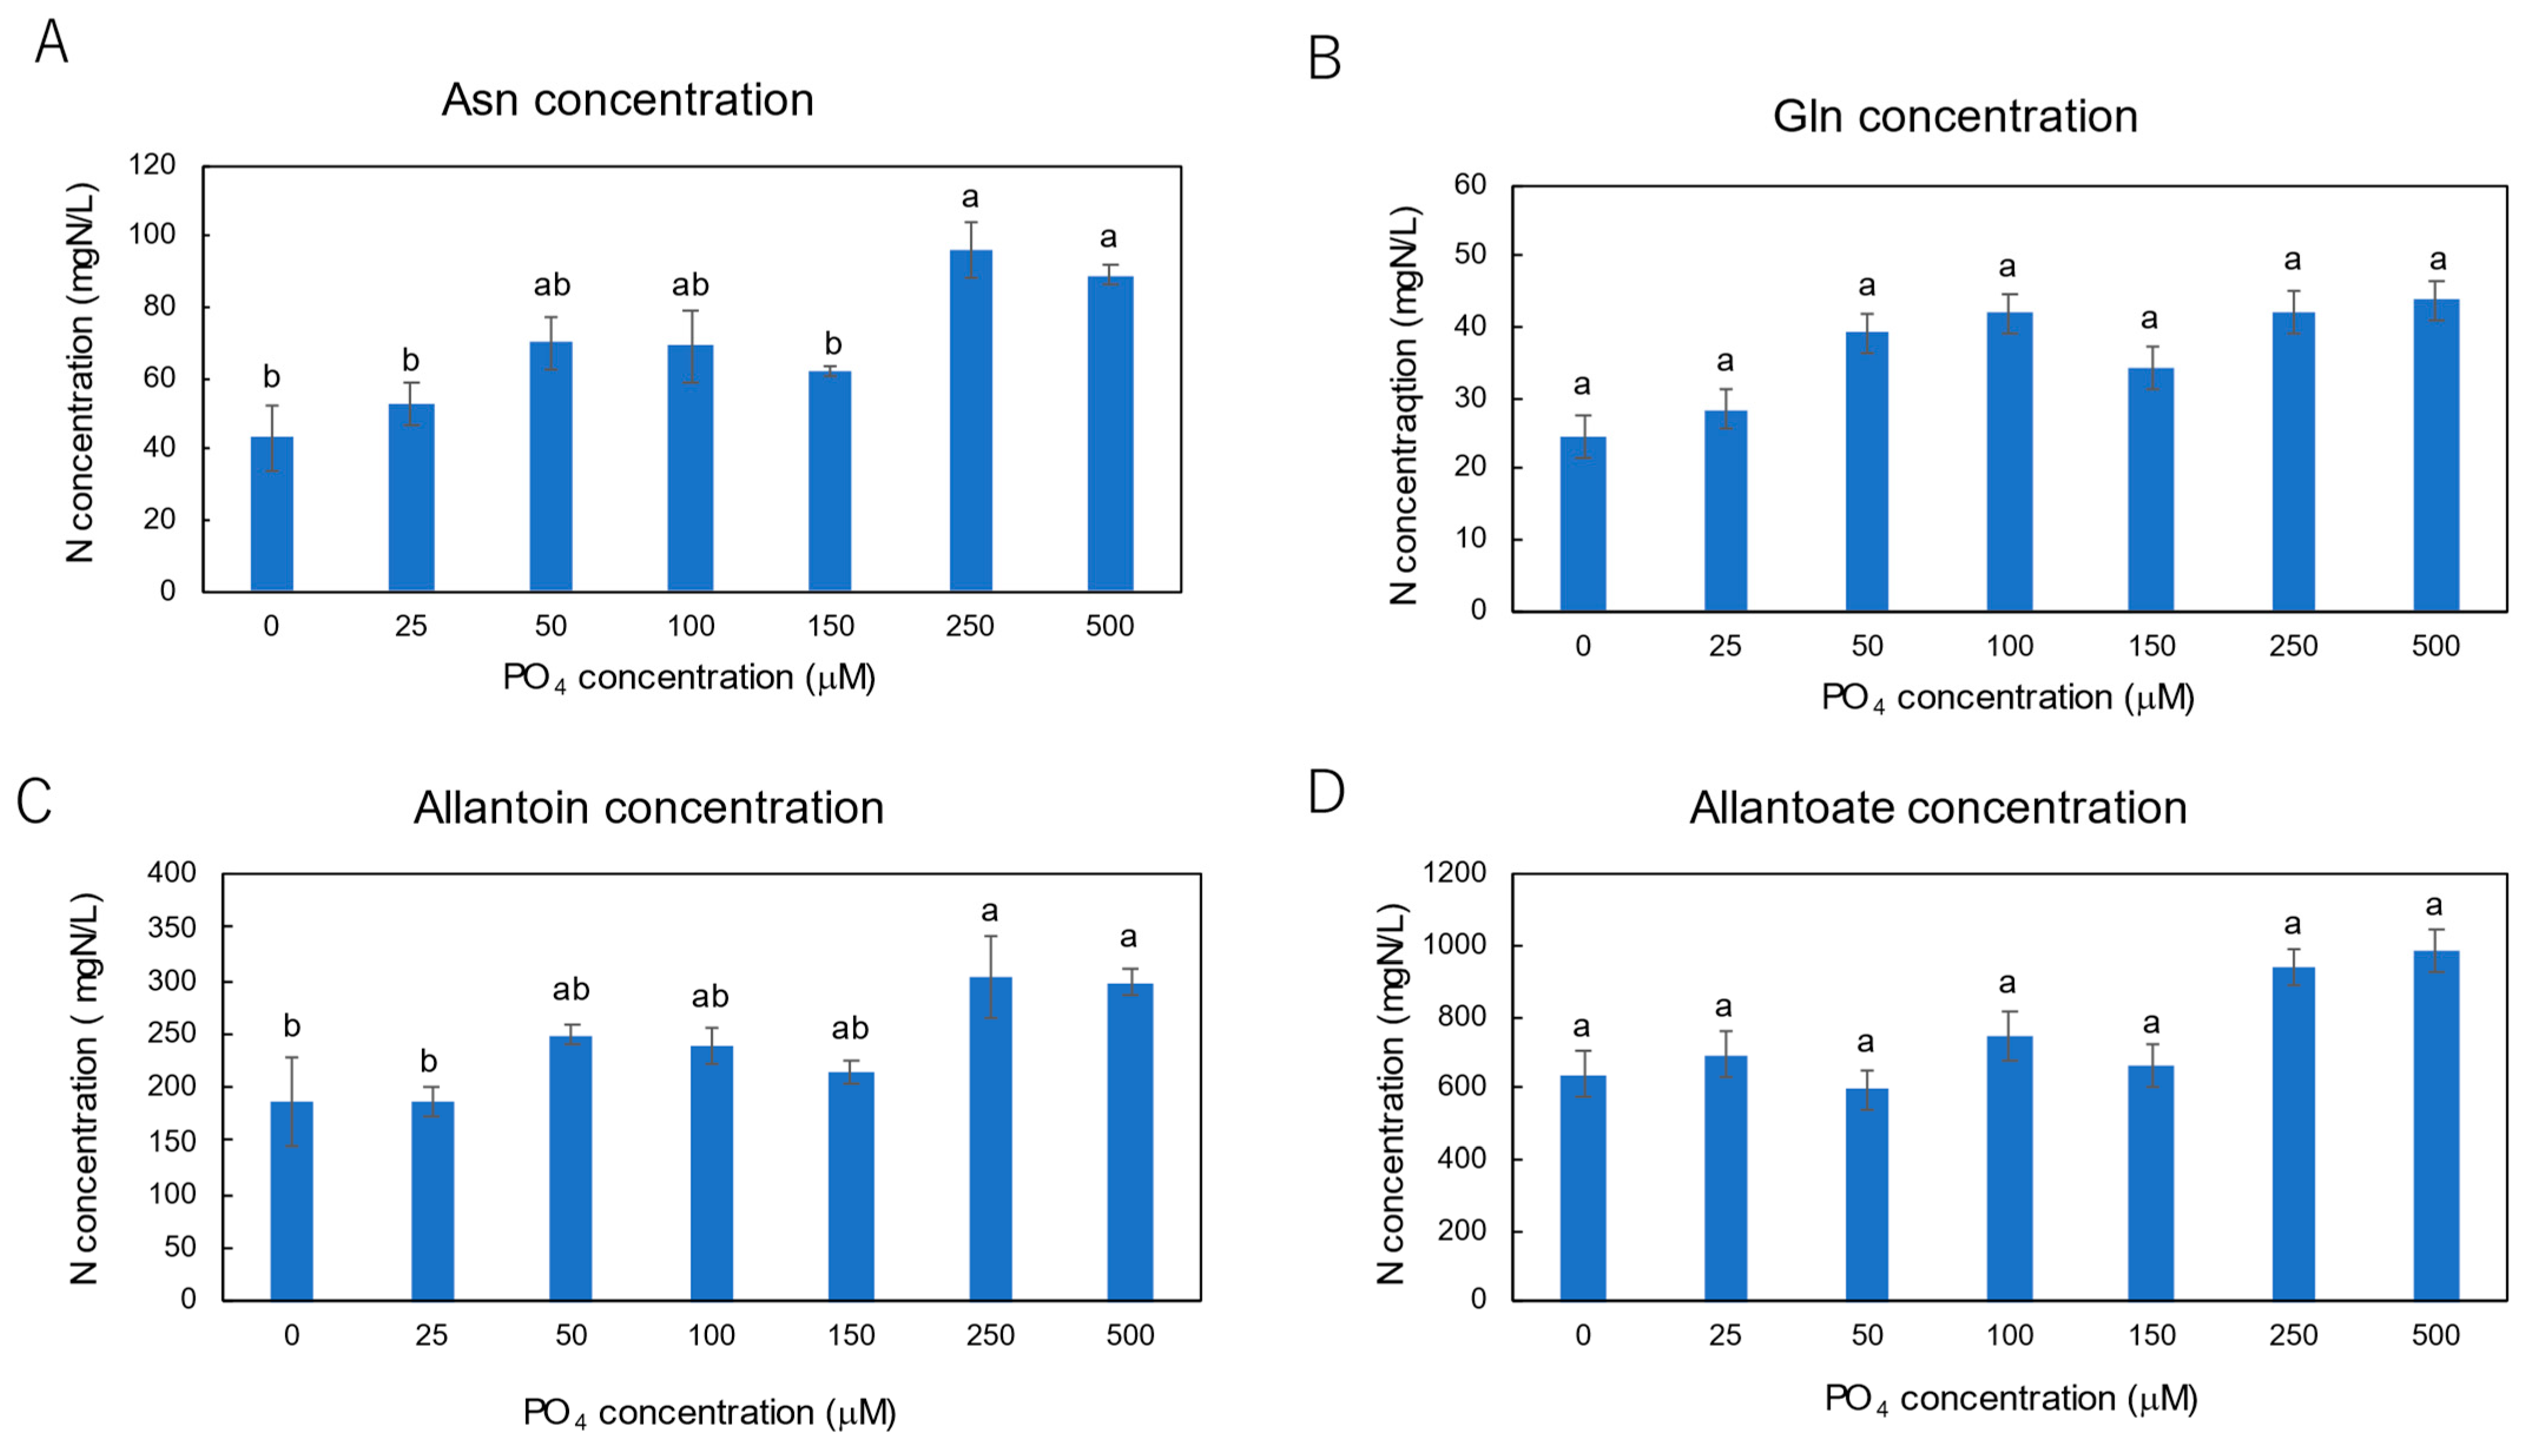
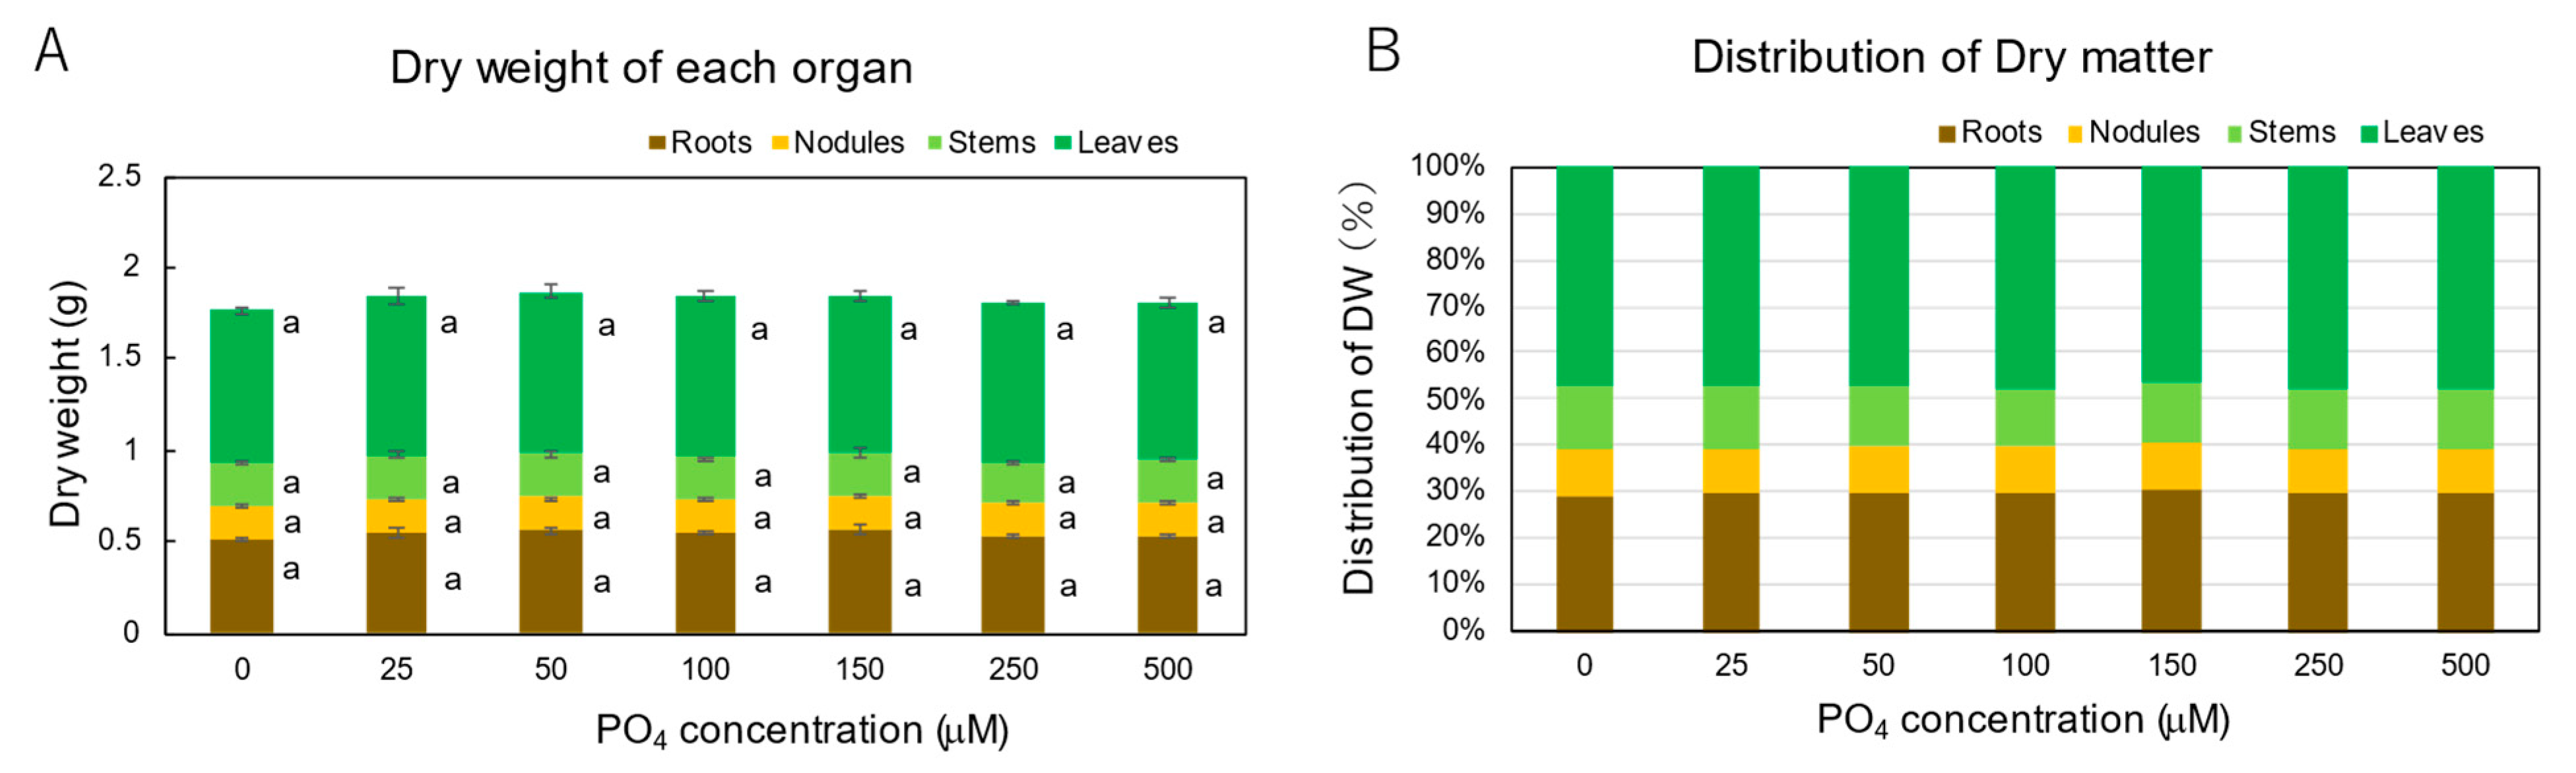
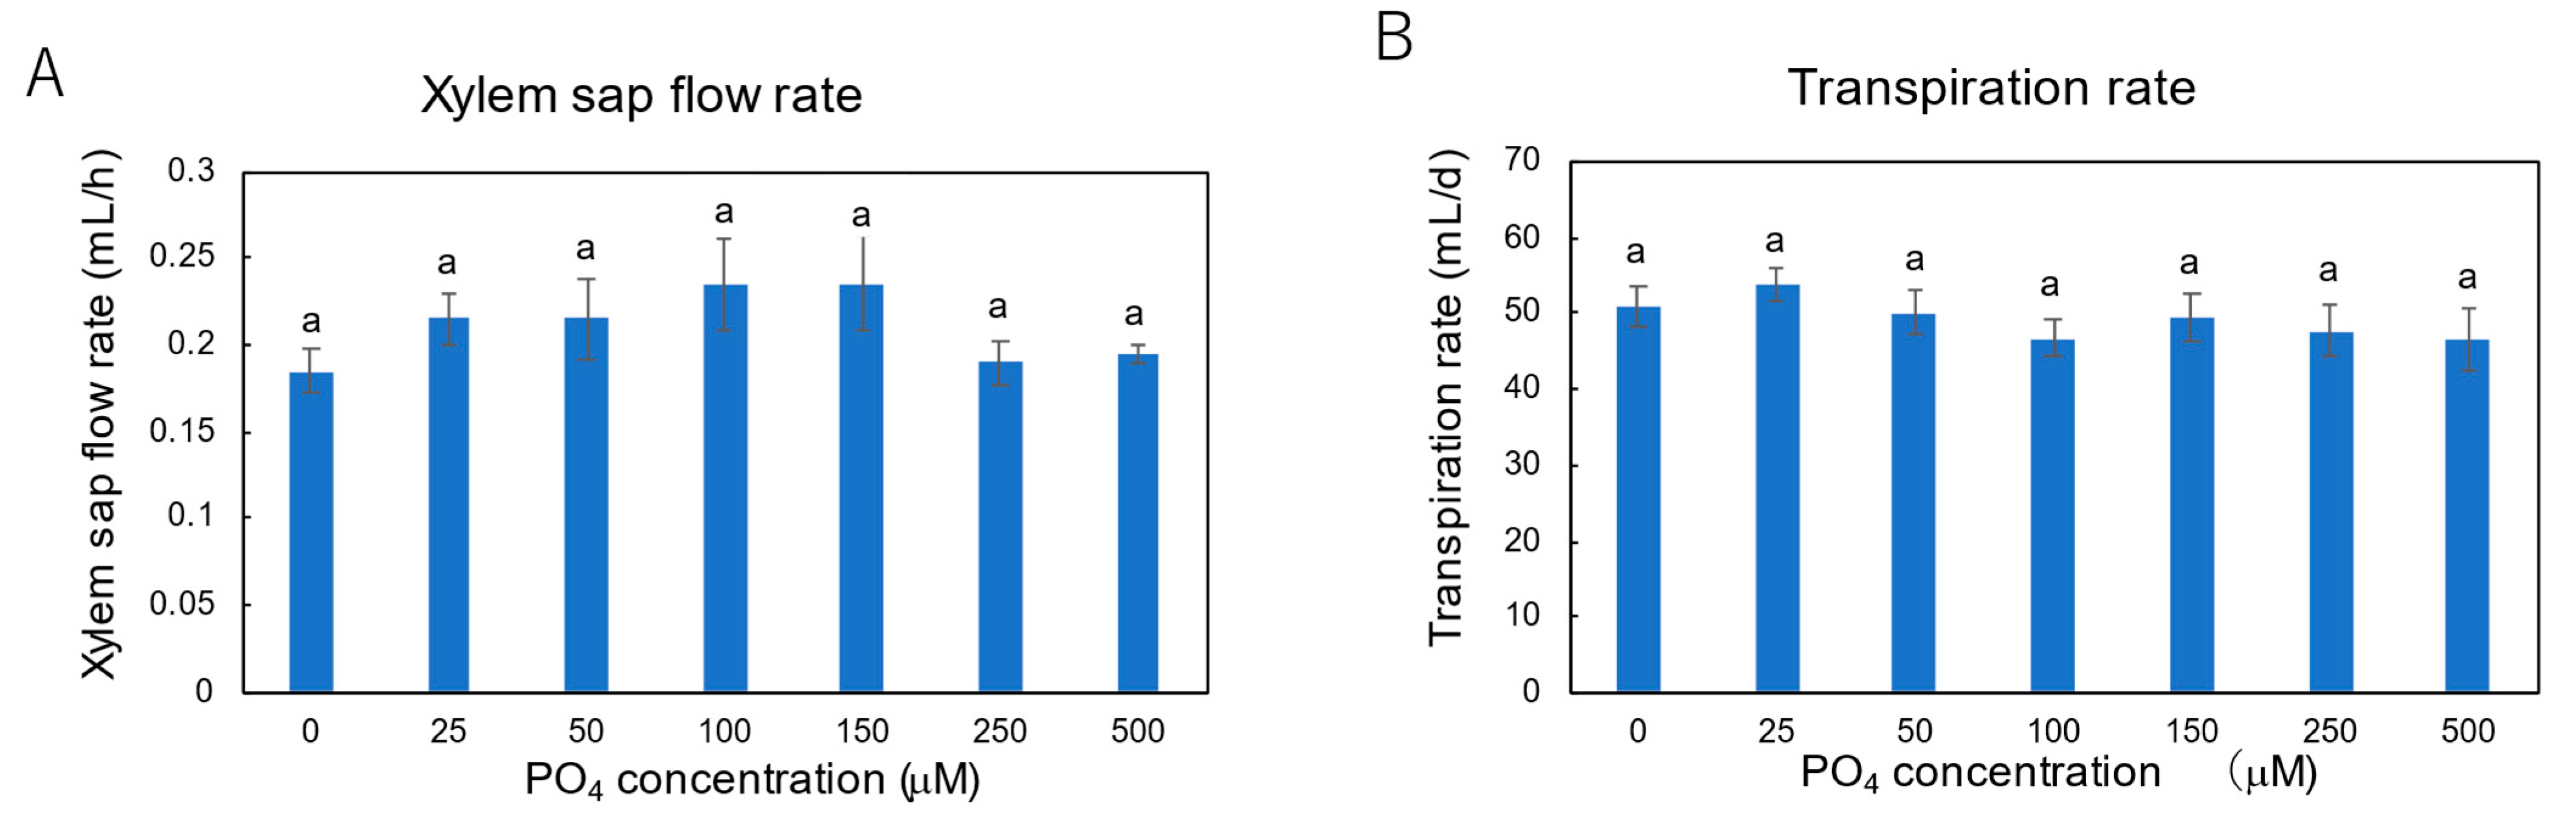
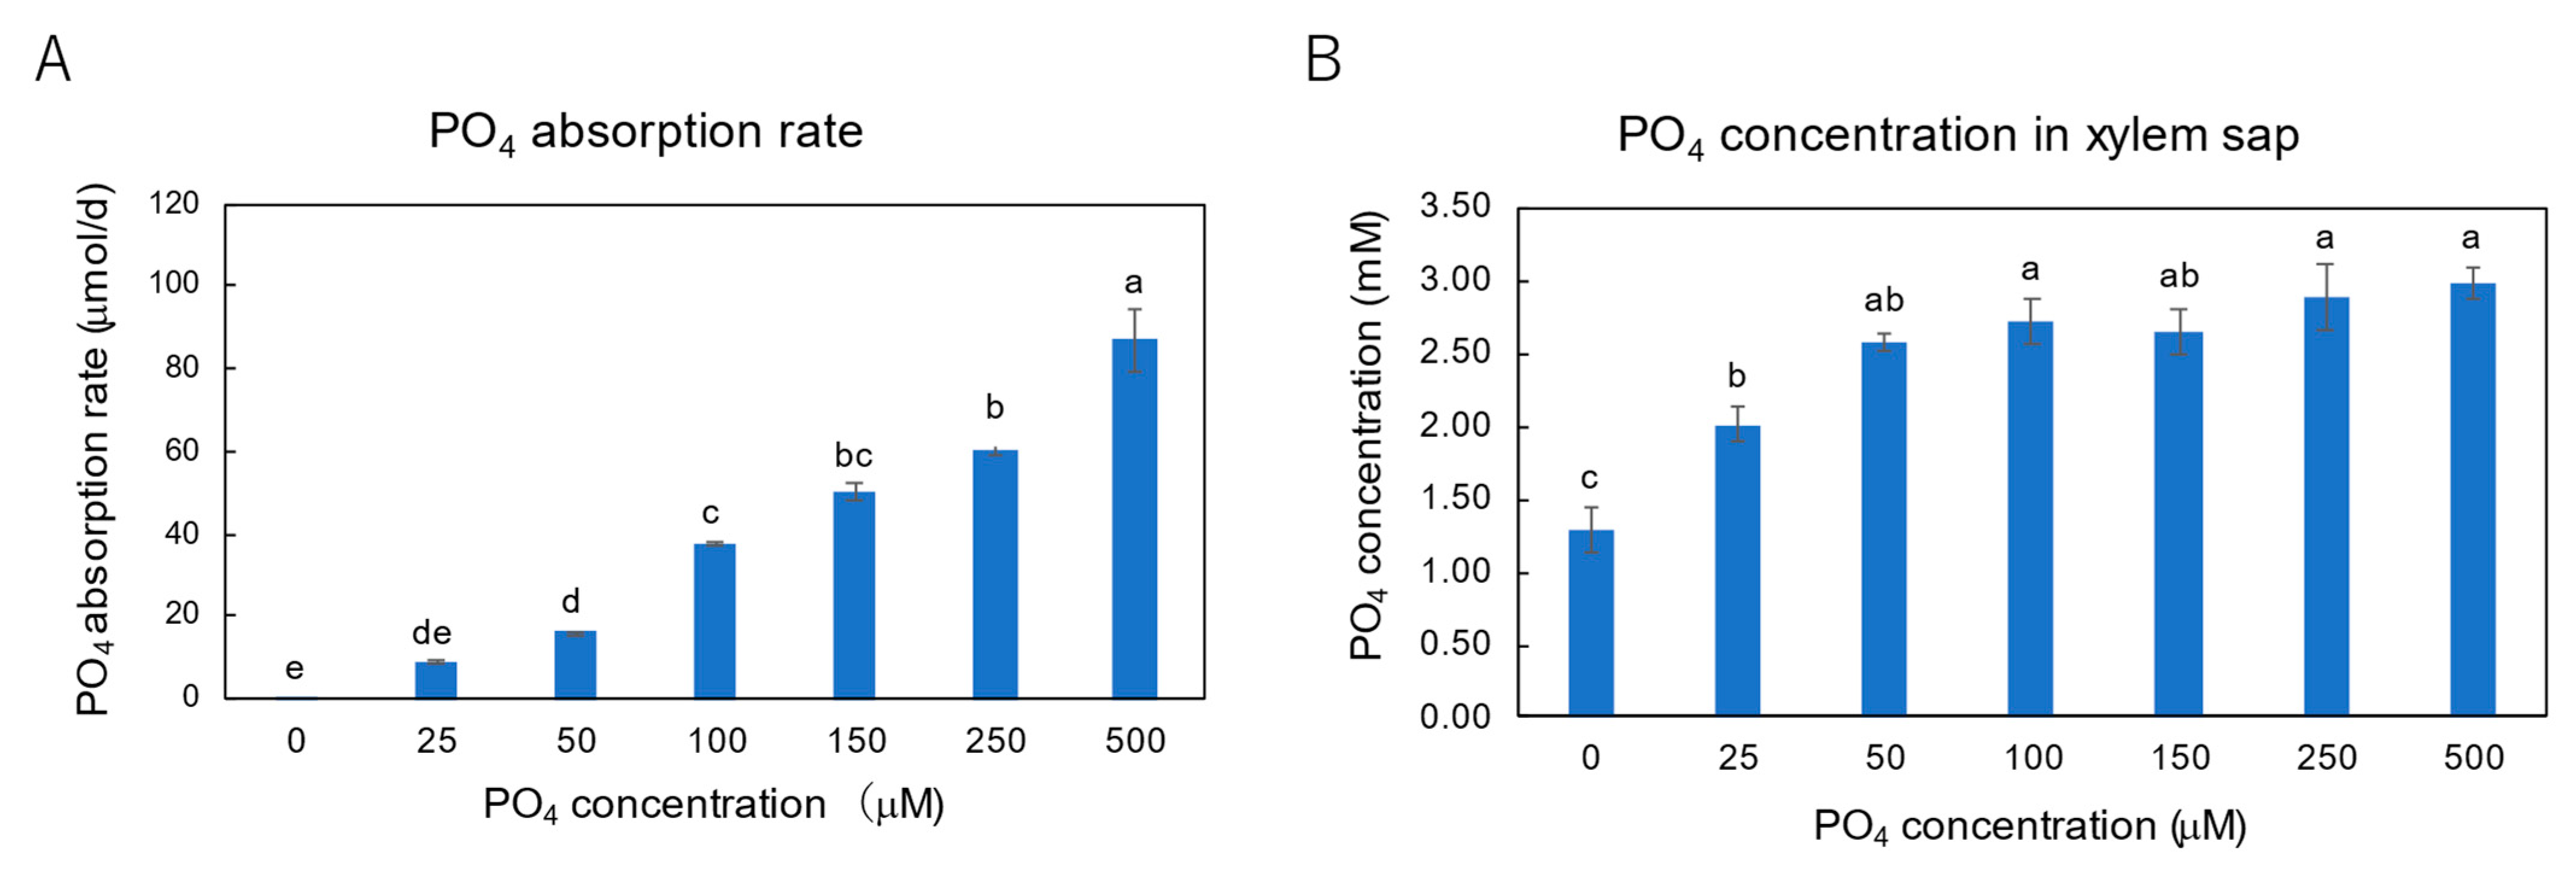
4.3. Effects of Seven Levels of P Concentration on the P Concentration in Xylem Sap and in Each Plant Part of Soybean Plants

The effects of seven levels of P concentration in culture solution for 3 days on the PO4 absorption in the roots and transport in the xylem sap were investigated. During the PO4 treatments, the dry weight of each part (Figure 9), xylem sap flow rate (Figure 10A), and transpiration rate (Figure 10B) were not significantly affected by PO4 levels. The PO4 absorption rate was increased consistently with increasing PO4 concentrations in the medium (Figure 11A), while the PO4 concentrations in the xylem sap increased from P0 to P50, and those reached a constant level among the P100, P150, P250, and P500 environments (Figure 11B). These results suggested that excess PO4 was absorbed in the roots when the PO4 concentration in the solution was high, but the bulk of them was not readily transported to the shoot through the xylem. Instead, the extra PO4 might be accumulated in the roots, possibly in the vacuoles of root cells [2]. With an adequate phosphorus supply to the plants, 85–95% of the total PO4 was reported to be located in the vacuoles [2].
PO4 is absorbed into root cells mediated by a high-affinity phosphate transporter (PHT1) located in the plasma membrane of root epidermal cells [35,36]. Shin et al. [37] demonstrated that Arabidopsis: PHT1;1 and PHT1;4 play a major role in P acquisition from both low (2 μM) and high (500 μM) PO4 environments. Members of the phosphate 1 (PHO1) transporter families were found to mediate root-to-shoot translocation by loading PO4 into xylem vessels [37,38]. Pratt et al. [39] reported that the cytosolic Pi concentration is very low (60–80 μM) and that it dropped very rapidly following the onset of Pi starvation by in vivo 31P-NMR analysis. The vacuole is a main storage pool of PO4, and vacuolar phosphate transporters (VPTs) facilitate Pi transport across the tonoplast [35,39]. However, the Pi efflux from the vacuole was insufficient to compensate for the absence of an external PO4 supply [39]. PHT1;1 is a key determinant of phosphorus acquisition in Arabidopsis. Plant vacuoles serve as the primary intracellular compartments for inorganic phosphate (Pi) storage. The passage of Pi across vacuolar membranes plays a critical role in buffering the cytoplasmic Pi level against fluctuations in external Pi and metabolic activities [38]. Liu et al. demonstrated that PHT5 functions as vacuolar Pi transporters [38], and it has further been shown that there are at least 14 PTH1 family genes in soybean [14,40].
Figure 12A shows the total-P contents in each part of soybean plants with seven levels of PO4 concentrations. The total-P contents increased mainly in the roots with increasing PO4 concentrations. In addition, total P contents in the leaves increased in line with PO4 concentrations. Figure 13 shows the PO4 and organic-P contents separately in each part of soybean plants with various PO4 treatments. After 3 days of P0 treatment, the PO4 accounted for a higher portion of the total P in all organs. This result suggests that the plants before the PO4 treatments at 27 DAP already stored a high accumulation of PO4 in each part. The organic-P content in the roots (Figure 13A) only increased with the increasing PO4 concentrations in the culture solution. This suggests that some PO4 was assimilated into organic forms of P in the roots. However, the organic-P content in the leaves, stems, and nodules did not significantly change with increasing PO4 concentrations in the culture solution.
The concentrations of Asn, Gln, allantoin, and allantoate in the xylem sap were not significantly affected by PO4 concentrations in the culture solution (Figure 14). This result supports the former speculation that the soybean plants with P0 treatment did not suffer physiologically from P deficiency because the PO4 stored before the P treatments served as sufficient P to support plant growth and metabolism for 3 days.

4.4. Diagnosis of P in Soybean Plants by Xylem Sap Analysis

Based on this experiment using young nodulated soybean plants, the PO4 concentration in the xylem may be used as an indicator of P deficiency because a lack of PO4 for only one day induced a decrease in PO4 concentration in the xylem sap (Figure 6A); additionally, the PO4 concentration decreased with the treatment period until 15 days (Figure 6A). Although soybean plants accumulate PO4 in all organs, when a high concentration of PO4 was supplied, it was mainly stored in the roots and supplemented in the leaves (Figure 13). Concerning the high concentrations of PO4 in the culture solution, the PO4 concentration in the xylem sap did not respond to PO4 concentrations in the solution over 100 μM PO4 at 3 days of treatment (Figure 11). However, long-term P treatment increased the PO4 concentration in xylem sap at 7 and 15 days (Figure 6A). Therefore, the PO4 analysis in xylem sap can be applicable in excess or toxic levels of PO4. In practical agriculture, excess P toxicity does not occur because PO4 concentrations in the soil solution are lower than 11 μM [3]. HPO4 is readily adsorbed in the soil particles and is taken up by soil microbes. In the case of the solution culture, excess P may occur, so diagnosis using the xylem sap may be beneficial.
Concerning the diagnosis of nutrients using xylem sap, there are several advantages compared with plant analysis using chemical digestion and extraction. First, xylem sap can be easily obtained from many crops cultivated in the field. Second, xylem sap is generally transparent and does not disturb colorimetric analysis. Real-time in situ analysis may be applicable when a portable analyzer can be used for determining the nutrient concentrations. Noguchi et al. [11,12] reported on the mineral concentrations in the xylem sap of loofah (Luffa cylindrica Roem), and they concluded that the nutrient concentrations in the xylem sap were proportional to those of the nutrients in the culture solution. Furthermore, the nutrient concentrations in the xylem sap were proportional to those of the nutrient content accumulated in shoots. Xylem sap analysis has been applied for investigating various compounds such as nutrients and microelements [41,42], phytohormones [43], or signal compounds for plant–microbe interactions [44]. Further experiments are necessary to establish the diagnosis of P by xylem sap, especially to ascertain the deficient, adequate, and excess range of PO4 in field-grown soybeans.

5. Conclusions

The flow rate and the concentration of anions and cations in the xylem sap collected from the basal cut stem of nodulated soybean plants cultivated with N-free solution or 5 mM NO3 solution changed gradually; therefore, we used the xylem sap obtained from the initial 5–35 min period for further experiments. The soybean plants were cultivated with deficient (0 μM PO4), adequate (50 μM PO4), or excess PO4 (250 μM PO4) for 1, 3, 7, and 15 days, and the concentrations of PO4 in the xylem sap was significantly lower in the P-deficient plants than in the control adequate plants after just 1 day. Therefore, the PO4 concentration in xylem sap can be used for the diagnosis of P deficiency. However, the excess P conditions did not change the PO4 concentration after 1 or 3 days of treatment, but it did become significantly higher after 7 and 15 days of treatment. The PO4 absorption rates and the concentrations of PO4 in the xylem sap were compared with those in plants cultivated with seven levels of PO4 concentration from 0 to 500 μM PO4. The PO4 absorption rate increased with the increase in the concentration of PO4, while the concentration of PO4 in the xylem sap increased only from 0 to 50 μM PO4, and it reached a constant over 100 μM PO4. The nodulated soybean plants cultivated with the control solution containing 50 μM PO4 accumulated relatively large amounts of PO4 compared with organic-P in the roots, nodules, stems, and leaves. Under excess PO4 conditions, the soybeans accumulated the extra PO4 mainly in the roots supplemented with leaves for 3 days. Based on the results, the diagnosis of P deficiency through xylem sap analysis can be applicable when more data on PO4 concentrations among various P concentrations, plant stages, varieties, and environmental conditions, and the range of adequate concentrations of PO4 in xylem sap are accumulated.

Author Contributions

Conceptualization and writing—original draft preparation; T.O.; investigation, Y.Y.; writing—review and editing, A.S. and K.H. All authors have read and agreed to the published version of the manuscript.

Funding

This research received no external funding.

Data Availability Statement

Data are contained within the article.

Conflicts of Interest

The authors declare no conflicts of interest.

References

  1. Lambers, H. Phosphorus acquisition and utilization in plants. Annu. Rev. Plant Biol. 2022, 73, 17–42. [Google Scholar] [CrossRef]
  2. Marschner, H. Functions of mineral nutrients: Macronutrients. In Mineral Nutrition of Higher Plants, 2nd ed.; Academic Press: London, UK, 1986; pp. 229–312. [Google Scholar]
  3. Lambers, H.; Plaxton, W.C. Phosphorus: Back to the roots. Annu. Plant Rev. 2015, 48, 3–22. [Google Scholar] [CrossRef]
  4. López-Arredondo, D.L.; Leyva-González, M.A.; González-Morales, S.I.; López-Bucio, J.; Herrera-Estrella, L. Phosphate nutrition: Improving low-phosphate tolerance in crops. Annu. Rev. Plant Biol. 2014, 65, 95–123. [Google Scholar] [CrossRef]
  5. Khan, F.; Siddique, A.B.; Shabala, S.; Zhou, M.; Zhao, C. Phosphorus plays key roles in regulating plants’ physiological responses to abiotic stresses. Plants 2023, 12, 2861. [Google Scholar] [CrossRef] [PubMed]
  6. Cassman, K.G.; Whitney, A.S.; Stockinger, K.R. Root growth and dry matter distribution of soybean as affected by phosphorus stress, nodulation, and nitrogen source. Crop Sci. 1980, 20, 239–244. [Google Scholar] [CrossRef]
  7. Israel, D.W. Investigation of the role of phosphorus in symbiotic dinitrogen fixation. Plant Physiol. 1987, 84, 835–840. [Google Scholar] [CrossRef] [PubMed]
  8. Yao, Y.; Yuan, H.; Wu, G.; Ma, C.; Gong, Z. Proteome analysis of the soybean nodule phosphorus response mechanism and characterization of stress-induced ribosome structural and protein expression changes. Front. Plant Sci. 2022, 13, 908889. [Google Scholar] [CrossRef] [PubMed]
  9. Takahashi, Y.; Chinushi, T.; Nakano, T.; Ohyama, T. Evaluation of N2 fixation activity and N absorption activity by relative ureide methods in field-grown soybean plants with deep placement of coated urea. Soil Sci. Plant Nutr. 1992, 38, 699–708. [Google Scholar] [CrossRef]
  10. Sakazume, T.; Tanaka, K.; Aida, H.; Ishikawa, S.; Nagumo, Y.; Takahashi, Y.; Ohtake, N.; Sueyoshi, K.; Ohyama, T. Estimation of nitrogen fixation rate of soybean (Glycine max(L.) Merr.) by micro-scale relative ureide analysis using root bleeding xylem sap and apoplast fluid in stem. Bull. Facul. Agric. Niigata Univ. 2014, 67, 27–41. [Google Scholar]
  11. Noguchi, A.; Kageyama, M.; Shinmachi, F.; Schmidhalter, U.; Hasegawa, I. Potential for using plant xylem sap to evaluate inorganic nutrient availability in soil. I. Influence of inorganic nutrients present in the rhizosphere on those in the xylem sap of Luffa cylindrica Roem. Soil Sci. Plant Nutr. 2005, 51, 333–341. [Google Scholar] [CrossRef]
  12. Noguchi, A.; Kageyama, M.; Shinmachi, F.; Schmidhalter, U.; Hasegawa, I. Potential for using plant xylem sap to evaluate inorganic nutrient availability in soil. II. Comparison between the xylem sap method and the extraction method. Soil Sci. Plant Nutr. 2005, 51, 343–350. [Google Scholar] [CrossRef]
  13. Li, H.; Wang, X.; Liang, Q.; Lyu, X.; Li, S.; Gong, Z.; Dong, S.; Yan, C.; Ma, C. Regulation of phosphorus supply on nodulation and nitrogen fixation in soybean plants with dual-root systems. Agronomy 2021, 11, 2354. [Google Scholar] [CrossRef]
  14. Qin, L.; Guo, Y.; Chen, L.; Liang, R.; Gu, M.; Xu, G.; Zhao, J.; Walk, T.; Liao, H. Functional characterization of 14 Pht1 family genes in yeast and their expressions in response to nutrient starvation in soybean. PLoS ONE 2012, 7, e47726. [Google Scholar] [CrossRef] [PubMed]
  15. Chen, L.; Qin, L.; Zhou, L.; Li, X.; Chen, Z.; Sun, L.; Wang, W.; Lin, Z.; Zhao, J.; Yamaji, N.; et al. A nodule-localized phosphate transporter GmPT7 plays an important role in enhancing symbiotic N2 fixation and yield in soybean. New Phytol. 2016, 221, 2013–2025. [Google Scholar] [CrossRef] [PubMed]
  16. Marschner, H. Diagnosis of deficiency and toxicity of mineral nutrients. In Mineral Nutrition of Higher Plants, 2nd ed.; Academic Press: London, UK, 1986; pp. 461–479. [Google Scholar]
  17. Bennett, W.F. Nutrient Deficiencies & Toxicities in Crop Plants; APS Press—The American Phytopathological Society: St. Paul, MN, USA, 1993. [Google Scholar]
  18. Roppongi, K. Studies on nutritional diagnosis in fruit vegetables. 1 The diagnosis of nitrogen nutrition in cucumber on nitrate density of petiole juice. Bull. Saitama Hortic. Exp. Stn. 1991, 18, 1–15. [Google Scholar]
  19. Yamazaki, H.; Roppongi, K. The diagnosis of cucumber based on inorganic phosphorus concentration in petiole sap. Jpn. J. Soil Sci. Plant Nutr. 2006, 77, 691–694. [Google Scholar]
  20. Yoneyama, T.; Yamazaki, H.; Yoshimitsu, S.; Fujiwara, S.; Takebe, M. Minor element concentrations on the leaf fluids and xylem sap for various crops. Jpn. J. Soil Sci. Plant Nutr. 1997, 68, 508–513. [Google Scholar]
  21. Kato, S.; Suzuki, S. Nutritional diagnosis of hydroponically grown eggplants based on the nitrate ion concentration in petiolar sap. Sci. Rep. Fac. Agric. Meijo Univ. 2018, 55, 7–14. [Google Scholar]
  22. Noodén, L.D.; Mauk, C.S. Changes in the mineral composition of soybean xylem sap during monocarpic senescence and alterations by depodding. Physiol. Plant. 1987, 70, 735–742. [Google Scholar] [CrossRef]
  23. Rao, I.M.; Terry, M. Leaf phosphate status, photosynthesis, and carbon partitioning in sugar beet. I. Changes in growth, gas exchange, and Calvin cycle enzymes. Plant Physiol. 1989, 90, 814–819. [Google Scholar] [CrossRef]
  24. Mo, X.; Zhang, M.; Zhang, Z.; Lu, X.; Liang, C.; Tian, J. Phosphate (Pi) starvation up-regulate GmCSN5A/B participates in anthocyanin synthesis in soybean (Glycine max) dependent on Pi availability. Int. J. Mol. Sci. 2021, 22, 12348. [Google Scholar] [CrossRef] [PubMed]
  25. Fredeen, A.L.; Rao, I.M.; Terry, N. Influence of phosphorus nutrition on growth and carbon partitioning in Glycine max. Plant Physiol. 1989, 89, 225–230. [Google Scholar] [CrossRef]
  26. Sinclair, J.B. Soybeans. In Nutrient Deficiencies & Toxicities in Crop Plants; Bennett, W.F., Ed.; APS Press—The American Phytopathological Society: St. Paul, MN, USA, 1993; pp. 99–103. [Google Scholar]
  27. Ohyama, T.; Takayama, K.; Akagi, A.; Saito, A.; Higuchi, K.; Sato, T. Development of an N-free culture solution for cultivation of nodulated soybean with less pH fluctuation by the addition of potassium bicarbonate. Agriculture 2023, 13, 739. [Google Scholar] [CrossRef]
  28. Foote, B.D.; Howell, R.W. Phosphorus Tolerance and Sensitivity of Soybeans as Related to Uptake and Translocation. Plant Physiol. 1964, 39, 610–613. [Google Scholar] [CrossRef] [PubMed]
  29. Gremaud, M.F.; Harper, J.E. Selection and initial characterization of partially nitrate tolerant nodulation mutants of soybean. Plant Physiol. 1989, 89, 169–173. [Google Scholar] [CrossRef] [PubMed]
  30. Ohyama, T.; Isaka, M.; Saito, A.; Higuchi, K. Effects of nodulation on metabolite concentrations in xylem sap and in the organs of soybean plants supplied with different N forms. Metabolites 2023, 13, 319. [Google Scholar] [CrossRef] [PubMed]
  31. Sato, T.; Yashima, H.; Ohtake, N.; Sueyoshi, K.; Akao, S.; Ohyama, T. Possible involvement of photosynthetic supply in changes of nodule characteristics of hypernodulating soybeans. Soil Sci. Plant Nutr. 1999, 45, 187–196. [Google Scholar] [CrossRef]
  32. Yasuda, K.; Kojima, T. Comparison of three methods for the determination of total phosphorus in industrial effluents and effect of iron on those methods. J. Environ. Lab. Assoc. 1984, 9, 71–75. [Google Scholar]
  33. Standard Methods for the Examination of Water and Wastewater, 18th ed.; Section 4500-P E. 4-115-116; American Public Health Association: Washington, DC, USA, 1992.
  34. MEdical and PHarmaceutical Statistics (MEPHAS). Available online: www.gen-info.osaka-u.ac.jp/MEPHAS/mokuji1-e.html (accessed on 24 May 2002).
  35. Dissanayaka, D.M.S.B.; Ghahremani, M.; Siebers, M.; Wasaki, J.; Plaxton, W.C. Recent insights into the metabolic adaptations of phosphorus-deprived plants. J. Exp. Bot. 2020, 72, 199–223. [Google Scholar] [CrossRef]
  36. Nussaume, L.; Kanno, S.; Javot, H.; Marin, E.; Nakanishi, T.M.; Thibaud, M.-C. Phosphate import in plants: Focus on the PHT1 transporters. Front. Plant Sci. 2011, 2, 83. [Google Scholar] [CrossRef]
  37. Shin, H.; Shin, H.S.; Dewbre, G.R.; Harrison, M.J. Phosphate transport in Arabidopsis: Pht1;1 and Pht1;4 play a major role in phosphate acquisition from both low- and high-phosphate environments. Plant J. 2004, 39, 629–642. [Google Scholar] [CrossRef] [PubMed]
  38. Liu, T.Y.; Huang, T.K.; Yang, S.Y.; Hong, Y.T.; Huang, S.M.; Wang, F.N.; Chiang, S.F.; Tsai, S.Y.; Lu, W.C.; Chiou, T.J. Identification of plant vacuolar transporters mediating phosphate storage. Nat. Commun. 2016, 7, 11095. [Google Scholar] [CrossRef] [PubMed]
  39. Pratt, J.; Boisson, A.M.; Gout, E.; Bligny, R.; Douce, R.; Aubert, S. Phosphate (Pi) starvation effect on the cytosolic Pi concentration and Pi exchanges across the tonoplast in plant cells: An in vivo 31P-nuclear magnetic resonance study using methylphosphonate as a Pi analog. Plant Physiol. 2009, 151, 1646–1657. [Google Scholar] [CrossRef] [PubMed]
  40. Tamura, Y.; Kobae, Y.; Mizuno, T.; Hata, S. Identification and expression analysis of arbuscular mycorrhiza-inducible phosphate transporter genes of soybean. Biosci. Biotechnol. Biochem. 2012, 76, 309–313. [Google Scholar] [CrossRef]
  41. Esteves, E.; Locatelli, G.; Bou, N.A.; Ferrarezi, R.S. Sap analysis: A powerful tool for monitoring plant nutrition. Horticulturae 2021, 7, 426. [Google Scholar] [CrossRef]
  42. Kan, M.; Yamazaki, K.; Fujiwara, T.; Kamiya, T. A simple and high-throughput method for xylem sap collection. BioTechniques 2019, 67, 242–245. [Google Scholar] [CrossRef]
  43. Noodén, L.D.; Singh, S.; Letham, D.S. Correlation of xylem sap cytokinin levels with monocarpic senescence in soybean. Plant Physiol. 1990, 93, 33–39. [Google Scholar] [CrossRef]
  44. Subramanian, S.; Cho, U.-H.; Keyes, C.; Yu, O. Distinct changes in soybean xylem sap proteome in response to pathogenic and symbiotic microbe interactions. BMC Plant Biol. 2009, 9, 119. [Google Scholar] [CrossRef]
Figure 1. Changes in the xylem sap flow rate after the shoot removal of nodulated soybean plants cultivated with an N-free solution and NO3 solution. Xylem sap was collected sequentially from the cut basal stem during the 5–35, 35–65, 65–125, 125–185, and 185–245 min periods after the shoot removal. Average and standard error (n = 4). Different letters indicate the significant difference in the values among treatments by Tukey’s method. Blue markers, lines, and letters show N-free solution and red ones show NO3 solution.
Agriculture 14 00403 g001
Figure 2. Changes in the concentrations of anions in xylem sap after the shoot removal of nodulated soybean plants cultivated with an N-free culture solution or NO3 solution. (A) PO4 concentration; (B) SO4 concentration; (C) NO3 concentration; (D) Cl concentration. The xylem sap was collected sequentially from cut basal stems during 5–35, 35–65, 65–125, 125–185, and 185–245 min periods after shoot removal. Average and standard error (n = 4). Different letters indicate the significant difference in the values among treatments by Tukey’s method. Blue markers, lines, and letters show N-free solution and red ones show NO3 solution.
Agriculture 14 00403 g002
Figure 3. The concentrations of major cations in the xylem sap of soybean plants after the shoot removal of soybean plants cultivated with N-free culture solution or 5 mM NO3 solution. (A) K concentration; (B) Mg concentration; (C) Ca concentration. Xylem sap was collected sequentially from cut basal stem during the 5–35, 35–65, 65–125, 125–185, and 185–245 min periods after the shoot removal. Average and standard error (n = 4). Different letters indicate the significant difference in the values among treatments by Tukey’s method. Blue markers, lines, and letters show N-free solution and red ones show NO3 solution.
Agriculture 14 00403 g003
Figure 4. Dry weight of each part after 7 days and 15 days of P treatments with 0, 50, and 250 μM PO4 in culture solution. (A) Dry weight at 7-day treatment, (B) dry weight at 15-day treatment. Average and standard error (n = 4). Different letters indicate the significant difference in the values among treatments by Tukey’s method.
Agriculture 14 00403 g004
Figure 5. Daily transpiration rate of soybean plants among P treatments with 0, 50, and 250 μM PO4 in culture solution. Average and standard error (n = 4).
Agriculture 14 00403 g005
Figure 6. Changes in the PO4 and SO4 concentrations in the xylem sap of nodulated soybean plants cultivated with N-free culture solution. (A) PO4 concentration; (B) SO4 concentration. Average and standard error (n = 4). Different letters indicate the significant difference in the values among treatments by Tukey’s method.
Agriculture 14 00403 g006
Figure 7. Changes in the K, Mg, and Ca concentrations in the xylem sap of nodulated soybean plants cultivated with N-free culture solution treated with different P concentrations and periods. (A) K concentration; (B) Mg concentration; (C) Ca concentration. Average and standard error (n = 4). Different letters indicate the significant difference in the values among treatments by Tukey’s method.
Agriculture 14 00403 g007
Figure 8. Concentration of asparagine, glutamine, allantoin, and allantoate in the xylem sap of nodulated soybean plants cultivated with N-free culture solution treated with different P concentrations and periods. (A) Asn concentration, (B) Gln concentration, (C) allantoin concentration, (D) allantoate concentration. Average and standard error (n = 4). Different letters indicate the significant difference in the values among treatments by Tukey’s method.
Agriculture 14 00403 g008
Figure 9. Dry weight and percentage distribution of dry weight of each part of soybean plants after 3 days of P treatment with 0, 25, 50, 100, 150, 250, and 500 μM PO4 in N-free culture solution. (A) Dry weight of each organ; (B) percentage distribution of dry matter. Average and standard error (n = 4). Different letters indicate the significant difference in the values among treatments by Tukey’s method.
Agriculture 14 00403 g009
Figure 10. Xylem sap flow rate and transpiration rate of soybean plants among P treatments with 0, 25, 50, 100, 150, 250, and 500 μM PO4 in culture solution. (A) xylem sap flow rate per h; (B) transpiration rate per d. Average and standard error (n = 4). Different letters indicate the significant difference in the values among treatments by Tukey’s method.
Agriculture 14 00403 g010
Figure 11. PO4 absorption rate from culture solution and PO4 concentration in xylem sap of soybean plants treated with 0, 25, 50, 100, 150, 250, and 500 μM PO4. (A) PO4 absorption rate; (B) PO4 concentration in xylem sap. Average and standard error (n = 4). Different letters indicate the significant difference in the values among treatments by Tukey’s method.
Agriculture 14 00403 g011
Figure 12. Total-P content and percentage distribution of total-P among plant parts after 3 days of P treatment with 0, 25, 50, 100, 150, 250, and 500 μM PO4 in culture solution. (A) Total-P content; (B) percentage distribution of total-P content. Average and standard error (n = 4). Different letters indicate the significant difference in the values among treatments by Tukey’s method.
Agriculture 14 00403 g012
Figure 13. PO4 and organic-P content in each part of plants after 3 days of P treatment with 0, 25, 50, 100, 150, 250, and 500 μM PO4 in culture solution. (A) P content in roots; (B) P content in nodules; (C) P content in stems; (D) P content in leaves. Average and standard error (n = 4). Different letters indicate the significant difference in the values among treatments using Tukey’s method.
Agriculture 14 00403 g013
Figure 14. Concentration of asparagine, glutamine, allantoin, and allantoate in xylem sap of soybean plants after 3 days of P treatment with 0, 25, 50, 100, 150, 250, and 500 μM PO4 in culture solution. (A) Asn concentration, (B) Gln concentration, (C) allantoin concentration, (D) allantoate concentration. Average and standard error (n = 4). Different letters indicate the significant difference in the values among treatments by Tukey’s method.
Agriculture 14 00403 g014
Disclaimer/Publisher’s Note: The statements, opinions and data contained in all publications are solely those of the individual author(s) and contributor(s) and not of MDPI and/or the editor(s). MDPI and/or the editor(s) disclaim responsibility for any injury to people or property resulting from any ideas, methods, instructions or products referred to in the content.

