
Seasonal Dynamics of Epigeic Arthropods under the Conditions of Ecological Management of the Triticum aestivum Crop
1
Department of Zoology and Anthropology, Faculty of Natural Sciences and Informatics, Constantine the Philosopher University in Nitra, 94974 Nitra, Slovakia
2
Faculty of Agrobiology and Food Resources, Slovak University of Agriculture in Nitra, 94976 Nitra, Slovakia
*
Author to whom correspondence should be addressed.
Agriculture 2024, 14(3), 482; https://doi.org/10.3390/agriculture14030482
Submission received: 26 January 2024
/
Revised: 3 March 2024
/
Accepted: 13 March 2024
/
Published: 16 March 2024
(This article belongs to the Section Crop Protection, Diseases, Pests and Weeds)
Abstract
:The policy of the European Union on land management promotes sustainable agriculture with an emphasis on the protection of biodiversity and the environment. Organic agriculture is the most appropriate alternative to ensure this common goal. The aim of this study was to determine the influence of factors such as pH, moisture, nitrogen potassium, phosphorus and grass herbaceous vegetation on the spatial structure of epigeic arthropods during the spring and summer seasons under organic farming conditions. Research took place between 2020 and 2022, and we recorded 14,988 individuals belonging to 16 taxa using pitfall traps. Between the years 2020 and 2022, we confirmed a decrease in the number of individuals and taxa of epigeic arthropods from the grass herbaceous vegetation to the interior of the field during the summer seasons. This decline was not confirmed in the spring seasons. Phosphorus, potassium, nitrogen, moisture and pH factors also had a significant influence on the spatial structure of epigeic arthropods. Our results show that the higher number of individuals and taxa at the grass herbaceous vegetation occurred only during the summer period. This fact contributes to an increase in biomass and, consequently, the yield of crops.
1. Introduction
Wheat is one of the most basic and important foods in developing and developed countries around the world. The importance of its cultivation will be even greater in the future because the global population is growing rapidly and the estimate for the year 2050 is around 9 billion inhabitants [1,2]. Agriculture dominates the world, and agricultural landscape homogenization through a decrease in seminatural cover, crop specialization and field enlargement represents a continuing worldwide threat to biodiversity; however, the decline in seminatural cover can benefit biodiversity in agricultural landscapes. Additionally, the amount of seminatural cover keeps decreasing in many agricultural landscapes, and the efficiency of policies focusing solely on maintaining or increasing seminatural cover has been questioned [3]. While half of the biodiversity in agricultural landscapes occurs exclusively in seminatural cover, the crop mosaic offers a wide range of resources to the other half, including species occurring exclusively in crop fields and providing key ecosystem services, such as crop biological pest control. It is therefore of increasing interest to evaluate whether enhancing landscape heterogeneity can also benefit biodiversity. There is growing pressure on agricultural land for food and energy production as well as for urbanization. Therefore, measures to benefit biodiversity consisting of a rearrangement of the production area, as opposed to measures focusing solely on its reduction, could provide valuable new sustainable policy options [4].
Ecological farming is based on the principles of returning to the traditional way of cultivating land and agricultural production focusing on the exclusion of harmful inputs from the chemical industry, such as artificial fertilizers, pesticides, herbicides, fungicides and others. Best practices of crop rotation in the field are preferred for the natural protection of crops against pests and diseases, while soil fertility is restored through the use of organic fertilizers from livestock farming. For ecological agriculture, the ecological harmlessness of production, respect for the country’s natural biodiversity and the production of healthy food for the population and fodder for farm animals are of primary importance. Ecological farming replaces the use of pesticides with natural pest control methods. Avoiding the use of sprays leads to an increase in communities of predatory insect groups that naturally destroy pests of agricultural crops [5,6]. It also replaces synthetic fertilizers with animal manure and uses grass strips to increase epigeic arthropods, serving as biocorridors. The creation of semi-natural habitats contributes to increasing diversity, abundance and protection, which in turn contributes to higher biomass and increased crop yield. All these changes are important for ensuring sustainable agriculture [7,8].
Special attention is paid to epigeic arthropods, which form a large component of the epigeic arthropods. They represent a high percentage, ranging from 54–75% of the biomass [9] and play an important role in biotic cycling (nitrogen, potassium, phosphorus, sulfur and carbon). Additionally, they contribute to the fragmentation and decomposition of toxic and waste substances, ensuring balance in ecosystems [10,11,12]. Some epigeic arthropods are sensitive to changes in soil quality and overall shifts in agroecosystems, making them vital contributors to the direction of a sustainable economy [13,14,15]. They also play a crucial role in ecosystem services that impact agroecosystems. Parasitic and predatory species are used in pest control and introduced in biological controls. Thus, the presence of epigeic arthropods is a very important part of the soil agroecosystem, although differences in abundance and diversity may occur during seasonal changes [16,17,18]. Boetzl et al. [19] found strong distance decays in maize and vegetables whereas richness and densities remained more stable in cereals, oilseed crops and legumes. They concluded that carabid assemblages in agricultural landscapes are driven by the complex interplay between crop types, adjacent non-crop habitats and other landscape parameters, with great potential for targeted agroecological management. Their synthesis indicates that a higher edge–interior ratio can counter the distance decay of carabid richness per field and thus likely benefits natural pest and weed regulation, hence contributing to agricultural sustainability.
The orders Coleoptera, Araneae and Hymenoptera are important environmental bioindicators. Among the significant factors determining their occurrence are the application of pesticides, the presence of toxic substances, changes in pH, soil moisture, potassium, nitrogen and phosphorus, trophic supply and vegetation structure in connection with various human interventions. Their effects change not only in natural ecosystems but also in agricultural ecosystems, depending on additional energy. These orders are also crucial in the transformation of organic substances [20,21]. The order Araneae, predaceous mites, pseudoscorpions, small spiders and centipedes are at higher trophic levels. In moist soils rich in organic matter, the total density of soil arthropods can be hundreds of thousands of specimens/m2 [22,23]. The biocenosis of soil depends on organic matter such as undecayed plant and animal residues, and its role is the degradation of such matter to make mineral nutrients (N, P and K) available to plants. This cycle is linked to the sequestration of a large amount of carbon; therefore, soil management and conservation can be considered a global interest from many points of view, from the regulation of climate processes to the productivity of agroecosystems [24,25].
The aim of the presented work is to assess the impact of grass herbaceous vegetation and the investigated factors (moisture, pH, potassium, phosphorus and nitrogen) on the dynamics of epigeic arthropods in the Triticum aestivum crop under ecological management.
2. Materials and Methods
Epigeic arthropod samples were collected over a three-year period, spanning from 2020 to 2022, in fields with Triticum aestivum crops and their neighboring herbaceous grass vegetation. The Triticum aestivum fields were also adjacent to other fields where various crops such as Brassica napus, Pisum sativum, Zea mays and Triticum spelled were planted. Each year, we collected epigeic groups in three fields, totaling nine fields over the three-year period. Figure 1 depicts one field during each harvest year.
Five pitfall traps were utilized for sampling and strategically placed as follows: the first two traps were positioned within the grass herbaceous vegetation, while the subsequent three traps were directed towards the interior of the field. We used a jam jar with a volume of 700 mL as the pitfall trap. We used a 4% formalin solution as a fixation fluid. The grass herbaceous vegetation had an average width of 15m, and the field areas ranged from 40 to 50 hectares. Figure 2 illustrates the placement of ground pitfall traps in both the grass herbaceous vegetation and the field. Pitfall traps were arranged in 40 m lines with a 10 m gap between each trap. Material collection occurred at regular 2-week intervals from March to July, totaling 10 sampling sessions during a single harvesting period each year in each field. The initial installation of pitfall traps took place in November of the previous year, coinciding with the planting of Triticum aestivum crops. The grass herbaceous vegetation mainly consisted of the following species: Arrhenatherum elatius, Achillea milefolium, Carduus acanthoides, Dactylis glomerata, Elytrigia repens, Lolium perenne, Pastinaca sativa, Poa pratensis and Vicia sativa. Epigeic arthropods were classified according to [26].
The research territory is situated within the geomorphological unit of the Danubian uplands in the cadastral territory of the city of Nitra (geographic coordinates = 48°17′19.6″ N 18°06′48.1″ E). The studied fields are located at an altitude of 130 m a.s.l., characterized by a warm climate with mild winters, and the soil type is brown soil.
The Triticum aestivum crop was cultivated on fields under ecological management conditions, owned by the private company Eco-Farm Nitra s.r.o. The field underwent a specific cultivation process, including annual pre-crop harvesting, followed by 2 rounds of discing, 2 rounds of undermining and 1 round of plowing, and then the Triticum aestivum crop was sown and rolled. Additionally, in the spring, 2 rounds of harrowing with rod harrows were conducted.
Environmental variables, including moisture (%), pH, nitrogen, potassium and phosphorus, were assessed using Kufrík (visicolor, Bodenkoffer, 931601, Macherey-Nagel, Düren, Germany) for soil analysis. A random location was chosen for each of the five pitfall traps (1–5), where soil samples were taken. This resulted in the collection of 5 soil samples from 15–20 cm depth, and samples with an area of 15 cm × 15 cm were taken from each field at monthly intervals. Before taking the soil samples, stones and fallen leaves were removed from the soil surface.
Subsequently, we analyzed the collected data using the Canoco 5 (Microcomputer, Ithaca, USA) program [27], employing Redundancy Analysis (RDA) to determine the influence of environmental variables (potassium, nitrogen, phosphorus, pH and moisture (%)) on the spatial structure of epigeic arthropods. We tested the significance of the environmental variables using the Monte Carlo permutation test. Principal Component Analysis (PCA) revealed the spatial structure of epigeic arthropods in pitfall traps (1–5) during the years and individual seasons (spring: March, April and May; summer: June and July).
Data were tested for normality using the Shapiro–Wilk Test in R 4.1.3. (Vienna, Austria) program [28]. Considering the normal distribution of the data (Shapiro–Wilk (SW) test, p = 0.0781), we applied the parametric multifactorial ANOVA test. The multifactorial ANOVA test confirmed significant differences between the years 2020, 2021 and 2022, as well as among pitfall traps (1–5).
3. Results
During the research period from 2020 to 2022, we recorded a total of 14,988 individuals representing 16 taxa. In the summer season, we observed a higher number of individuals (two times more) compared to the spring seasons. Throughout the entire research period, both Coleoptera (57%) and Collembola (18%) were the most prevalent (Table 1). Using Shannon’s diversity index, we found the greatest diversity in grass herbaceous vegetation (H = 1.435) and the lowest was in the crop Triticum aestivum (H = 1.359).
The spatial structure of the epigeic arthropods in the Triticum aestivum crop during the spring season and summer season was analyzed using Principal Component Analysis (PCA, SD = 2.5 on the first ordination axis). The variability of taxa was 67.49% on the first ordination axis and 78.25% on the second cumulative axis.
From the analysis results, it is evident that most taxa occurred during the summer months of 2022 in pitfall traps 1–2 (in grass herbaceous vegetation), while the number of taxa decreased towards pitfall traps 3–5 (inside the field). Based on the years 2020–2022, a significant change in taxa abundance was observed between the years 2021 and 2022. The years 2020 and 2021 showed similarities in the representation of individuals (Figure 3).
The impact of environmental variables on the dispersion of epigeic arthropods was analyzed using RDA analysis. The variability of taxa was 44.6% on the first ordination axis and 51.09% on the second cumulative axis. Due to the influence of environmental variables, the variability increased to 78.98% (first ordination axis) and on the second cumulative axis, it increased to 90.47%. We confirmed a significant influence on the spatial structure of epigeic arthropods for all variables: phosphorus (p = 0.032), potassium (p = 0.024), nitrogen (p = 0.038), moisture (p = 0.0064) and pH (p = 0.0073).
The graph illustrates that environmental variables (pH, nitrogen, phosphorus and potassium) influenced the largest part of the taxa (Figure 4).
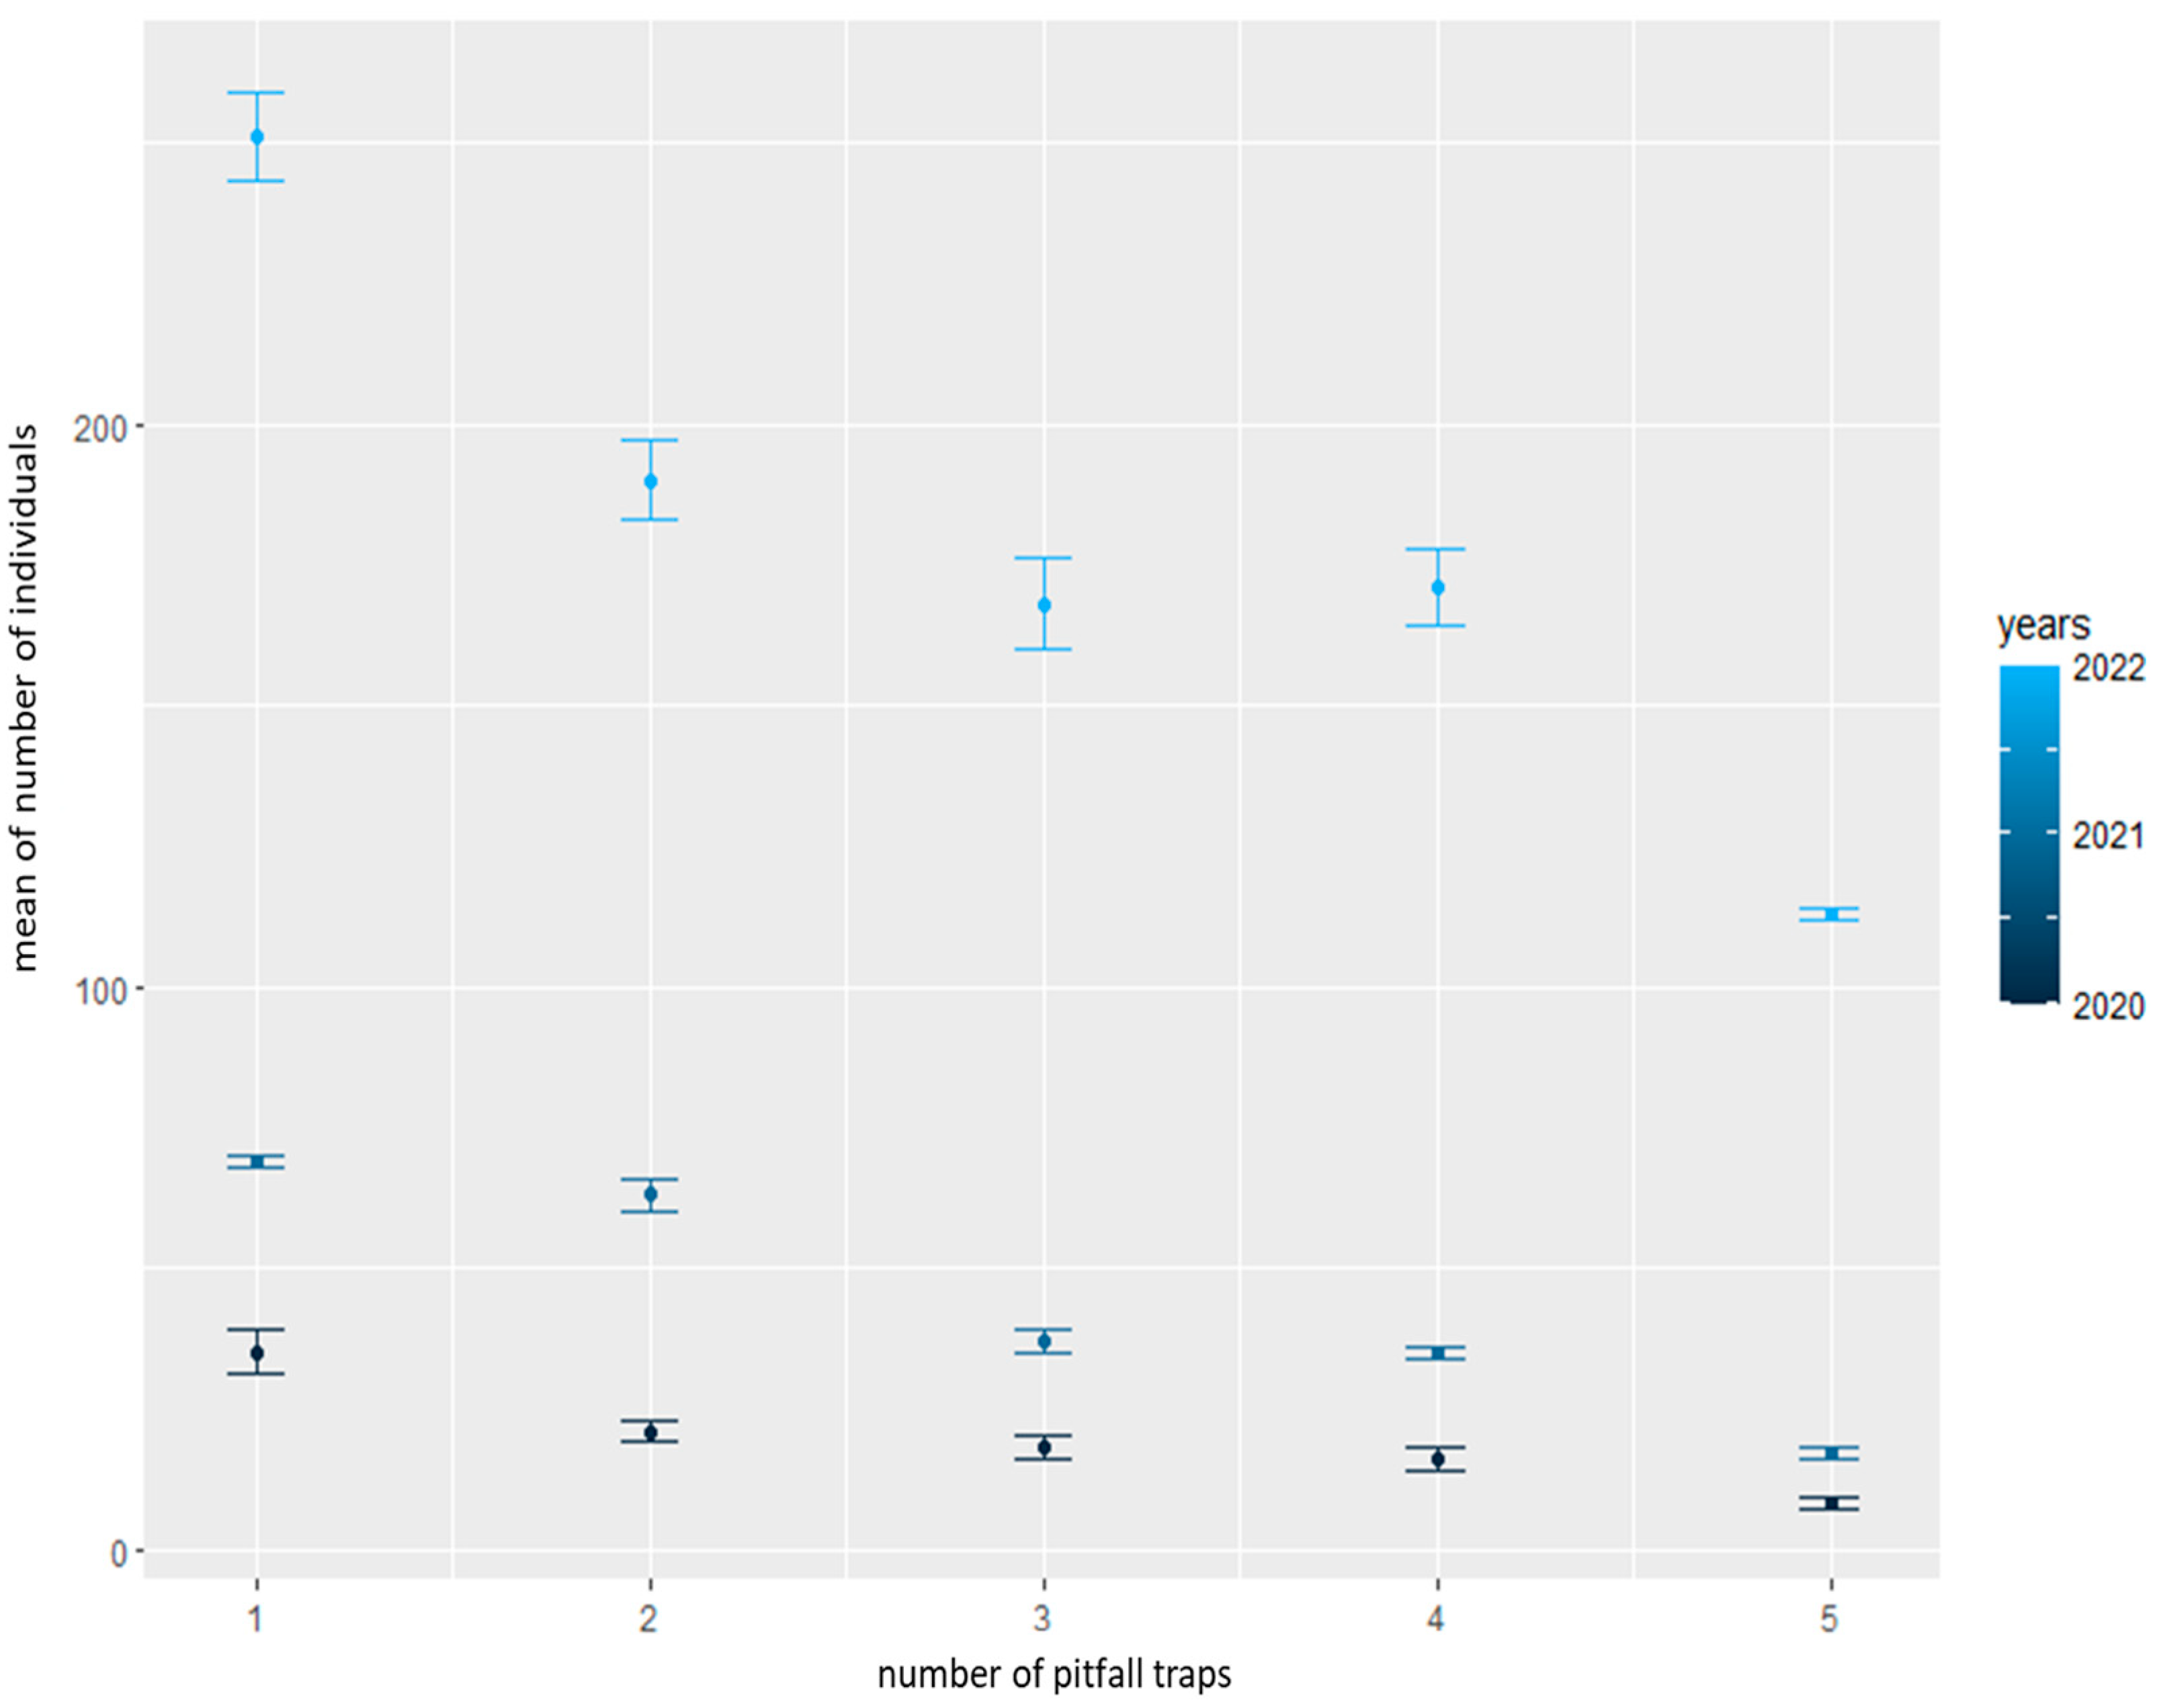
We confirmed a significant difference in individuals between the years 2020 and 2022 during the spring (p = 0.0010, F = 2.7368 and df = 4) (Figure 5) and summer (p = 0.0292, F = 2.19257 and df = 4) (Figure 6) seasons. Using the post hoc test (Tukey HSD), we supplemented the results of the differences between individual pitfall traps (1–5) and years (2020–2022) separately for spring (Table 2) and summer (Table 3). The results show a decrease in individuals in the direction of pitfall traps from 1 (in grass herbaceous vegetation) to 5 (inside the field) during the summer seasons. During the spring seasons, no decrease was found. We observed larger differences in the number of individuals caught in pitfalls between 2021 and 2022. However, during 2020 and 2021, we did not observe such variations.
4. Discussion
The pressure to increase food production to meet the demands of a growing human population (United Nations, 2017) poses a challenge for wildlife conservation. Biodiversity would likely benefit if we limited further agricultural expansion and removed land from production. However, the need to feed people can make such conservation-motivated recommendations impractical. A more practical approach would be to identify conservation actions that support biodiversity without taking land out of production. Wheat (Triticum aestivum) is the third most important crop worldwide with 600 million tons annual production. As a key crop for human consumption, it is crucial to ensure the sustainable production of wheat [29,30]. Given the global significance of this crop, it has been a focal point of our study.
Fahrig [31] proposed that biodiversity could be enhanced in agricultural landscapes without taking land out of production by increasing “farmland heterogeneity”, i.e., heterogeneity of the cropped portion of an agricultural landscape, including annual row crops, perennial forage crops and managed pasture. Farmland heterogeneity can be increased by decreasing crop field sizes. Decreasing crop field sizes increases the length of edges between different crop types and between crop and natural/semi-natural land cover types. Farmland heterogeneity can also be increased by increasing crop diversity, i.e., planting more types of crops and having a more even representation of the crop types in the landscape. Biodiversity responses to crop heterogeneity may be nonlinear and nonadditive. For instance, increasing the diversity of crops available in the landscape may benefit biodiversity in a given field only if the fields are small enough for adjacent fields to be reached easily. Additionally, the effects of increasing crop heterogeneity on biodiversity may depend on the amount of seminatural cover in the landscape. For instance, the “intermediate landscape-complexity” hypothesis predicts that the positive biodiversity–crop heterogeneity relationship is stronger in landscapes with intermediate amounts of seminatural cover (e.g., 5–20%) than in landscapes with little (e.g., <5%) or much seminatural cover (e.g., >20%) [32]. In our study, we also investigated the influence of grass herbaceous vegetation on biodiversity in the field. We confirmed a higher number of taxa and individuals on grass herbaceous vegetation (pitfall traps 1–2) during the summer season. Toward the interior of the field (pitfall traps 3–5), the number of taxa and individuals decreased. Thus, the heterogeneity of agricultural land is crucial for biodiversity conservation.
Organic agriculture is the most suitable alternative to establish sustainable land use. It incorporates management practices that include the creation of natural habitats in the vicinity of fields, often in the form of grass strips, contributing to the preservation of natural ecosystems [33]. It also includes management for the creation of natural habitats in the vicinity of fields in the form of grass strips, thus helping to maintain natural ecosystems [33]. It is a production management system that promotes and enhances agroecosystem health, including biodiversity, biological cycles and soil biological activity. It emphasizes the use of management practices in preference to the use of off-farm inputs, taking into account that regional conditions require locally adapted systems. This is accomplished by using, where possible, agronomic, biological and mechanical methods, as opposed to using synthetic materials, to fulfil any specific function within the system. From the point of view of this gentle approach to nature and the protection of epigeic arthropods, in our study, we chose a crop that was grown under the conditions of ecological agriculture. Another reason is the rising global trend in support of this way of farming. The transition from conventional farming to organic farming presents farmers with economic risks, including potential decreases in sales due to lower crop yields. However, this transitional period typically lasts 2–3 years, after which farmers often begin to experience economic benefits [34,35].
Disturbance in agroecosystems exceeds that in natural terrestrial habitats due to various agricultural practices, such as tillage for crop cultivation [36]. Numerous studies indicate that soil and crop management practices, including crop rotation, pre-cropping, fertilization and pesticide use, influence epigeic arthropods [37,38]. Epigeic arthropods that prefer agroecosystems have a wider ecological tolerance to environmental variables than those living in natural habitats. In fields, they have high local abundance and lower species diversity. By supporting grass strips and grass herbaceous vegetation (e.g., in the form of meadow belts), organic agriculture also increases the number of individuals and taxonomic diversity [12,39]. The presence of wildflowers in the grass herbaceous vegetation and a higher diversity of plants also contribute to a higher diversity of taxa and individuals of epigeic arthropods [40,41]. The results of our study also confirm the prevalence of epigeic arthropods in grass herbaceous vegetation (pitfall traps 1–2) during the summer season throughout the research period. We also recorded a higher number of individuals in the grass herbaceous vegetation (pitfall traps 1–2) compared to pitfall traps (3–5) heading inside the field. This increase was recorded only during the summer season. We did not notice this trend in the spring season. The results of our research also concur with the statements of [42], where they confirmed a decrease in both abundance and taxonomic diversity with increasing pressure in agroecosystems. The disparity in abundance and taxonomic diversity between seasons is also influenced by climatic factors [43], as evident in our work, where we observed this difference between spring and summer. Between 2021 and 2022, we observed differences in the number of individuals caught in pitfall traps during the spring and summer periods. We did not observe such differences between 2020 and 2021. The interannual variations in the number of individuals may be attributed to significant changes in the weather during the spring and summer between 2021 and 2022. In 2022, there was more precipitation in the spring and summer (maximum precipitation in 2022: March = 15 mm, April = 5 mm, May = 35 mm, June = 50 mm and July = 15 mm; 2021: March = 5 mm, April = 5 mm, May = 18 mm, June = 8 mm and July = 15 mm), and temperatures (average daily temperature in 2022: March = 5 °C, April = 10 °C, May = 18 °C, June = 23 °C and July = 24 °C; 2021: March = 8 °C, April = 9 °C, May = 15 °C, June = 27 °C and July = 28 °C) were lower compared to those in 2021.
Taxa such as Coleoptera, Araneae, Julida and Hymenoptera play a crucial role in maintaining the quality and health of soil by preserving the natural balance of elements in the ecosystem, including potassium, nitrogen, phosphorus, iron and carbon. Additionally, they contribute to the decomposition of plant parts and soil aeration [44]. The order of Collembola, in turn, participates in the processing of various nutritional values [45]. The orders Coleoptera and Araneae reduce the presence of pests; therefore, they are an important part of environmental services. All these taxa also indicate the quality of the environment and are often used as bioindicators [46]. In the results of our work, we recorded a higher representation of the taxa Coleoptera and Collembola and a dominant representation of the order Julida.
Land management has a profound impact on biodiversity structure, with field edges often serving as remnants that positively contribute to increased biodiversity in agricultural crops. These field edges not only enhance biodiversity but also provide refuge for beneficial species within agroecosystems. Several environmental factors, including soil moisture, temperature, pH and the concentrations of heavy metals, potassium, phosphorus, nitrogen and ammonia, further influence the abundance and biodiversity in agricultural landscapes [47,48,49,50]. In our study, we confirmed the influence of environmental variables (phosphorus, potassium, nitrogen, moisture and pH) on the spatial structure of epigeic arthropods. Collembola, for example, are known to be influenced by soil conditions and organic fertilizers, which impact their abundance [51]. Similarly, Coleoptera, Araneae and Hymenoptera are sensitive to environmental factors such as soil pH and the presence of inorganic substances in the soil (potassium, phosphorus and nitrogen) [21,24,25,52]. Our results also demonstrated the effects of these environmental variables on taxa such as Coleoptera, Collembola, Araneae and Hymenoptera. We observed the dominance of soil arthropods, with soil pH, phosphorus, nitrogen and potassium influencing their distribution. These findings align with previous research [53], which observed a decline in soil arthropods with increasing land use and the impact of environmental variables (phosphorus, nitrogen, potassium and soil pH). The response of soil organisms serves as a crucial component in assessing the sustainability of soil ecosystems, considering them as bioindicators of the environment [42]. Soil arthropods in agricultural landscapes exhibit a wider tolerance compared to those in natural habitats, achieving a high local density due to agricultural influences [54]. Our study recorded a soil arthropod community dominated by Coleoptera, Collembola and Julida. The abundance of these groups played a crucial role in maintaining the natural balance and substance cycle of biogenic elements in the ecosystem, including carbon, nitrogen, sulfur and phosphorus. Their activities accelerated the decomposition of plant residues, improved soil aeration and enhanced soil structure and quality. The presence of other soil arthropods exhibited heterogeneity, potentially influenced by the management regime and surrounding vegetation [55].
5. Conclusions
Our research findings have contributed novel insights into the spatial structure of epigeic arthropods in the Triticum aestivum crop cultivated under organic farming conditions. Throughout the research years from 2020 to 2022, we consistently observed a decrease in both the number of individuals and taxa of epigeic arthropods moving from pitfall traps 1–2 (in grass herbaceous vegetation) to 3–5 (located inside the field) during the summer season. However, this downward trend was not evident during the spring season. The distribution of epigeic arthropods in the crop was significantly influenced by environmental variables, including phosphorus (p = 0.032), potassium (p = 0.024), nitrogen (p = 0.038), moisture (p = 0.0064) and pH (p = 0.0073). The implementation of appropriate agricultural practices provided by organic farming contributes to a higher biodiversity of epigeic arthropods. These arthropods play a crucial role in pest control and nutrient cycling in the soil, ultimately influencing crop yield as a significant component of the biomass.
Author Contributions
Conceptualization, V.L.; methodology, V.L. and K.P.; software, V.L.; validation, V.L. and K.P.; formal analysis, V.L. and K.P.; investigation, V.L.; resources, V.L. and K.P.; data curation, V.L.; writing—original draft preparation, V.L.; writing—review and editing, V.L. and K.P.; visualization, V.L.; supervision, V.L.; project administration, V.L.; funding acquisition, V.L. All authors have read and agreed to the published version of the manuscript.
Funding
This research was supported by the grant KEGA (No. 002UKF-4/2022) Metaanalyses in Biology and Ecology (Databases and Statistical Data Analysis).
Data Availability Statement
Data on taxa are in Table 1.
Conflicts of Interest
The authors declare no conflicts of interest.
References
- Levy, A.A.; Feldman, M. Evolution and origin of bread wheat. Plant Cell 2022, 34, 2549–2567. [Google Scholar] [CrossRef]
- Farooq, M.U.; Bashir, M.F.; Khan, M.U.S.; Iqbal, B.; Ali, Q. Role of crispr to improve abiotic stress tolerance in crop plants. Biol. Clin. Sci. Res. J. 2021, 1, 1–9. [Google Scholar] [CrossRef]
- Batáry, P.; Fischer, J.; Báldi, A.; Crist, T.O.; Tscharntke, T. Does habitat heterogeneityincrease farmland biodiversity? Front. Ecol. Environ. 2011, 33, 152–153. [Google Scholar] [CrossRef]
- Holzschuh, A.; Dormann, C.F.; Tscharntke, T.; Steffan-Dewenter, I. Mass-floweringcrops enhance wild bee abundance. Oecologia 2013, 172, 477–484. [Google Scholar] [CrossRef]
- Bouvier, J.C.; Ricci, B.; Agerberg, J.; Lavigne, C. Apple orchard pest control strategies affect bird communities in southeastern France. Environ. Toxicol. Chem. 2011, 30, 212–219. [Google Scholar] [CrossRef]
- Crowder, D.W.; Northfield, T.D.; Strand, M.R.; Snyder, W.E. Organic agriculture promotes evenness and natural pest control. Nature 2010, 466, 109–112. [Google Scholar] [CrossRef]
- Pimentel, D.; Hepperly, P.; Hanson, J.; Douds, D.; Seidel, R. Environmental, energetic, and economic comparisons of organic and conventional farming systems. BioScience 2005, 55, 573–582. [Google Scholar] [CrossRef]
- Legrand, A.; Gaucherel, C.; Baudry, J. Long-term effects of organic, conventional, and integrated crop systems on Carabids. Agron. Sust. Dev. 2011, 31, 515–524. [Google Scholar] [CrossRef]
- Langraf, V.; Petrovičová, K.; Schlarmannová, J.; Chovancová, Z. Changes in the community structure of epigeic arthropods in the conditions of ecological farming of pea (Pisum sativum L.). Chil. J. Agric. Res. 2022, 82, 527–536. [Google Scholar]
- Dyman, T.; Yashchenko, S.; Mazur, T.; Dyman, N.; Zagoruy, L. Comparative analysis of the diversity of bees in agroecosystem habitats. Tehnol. Virobnictva Pererobki Produktìv Tvarinnictva 2022, 2, 70–77. [Google Scholar] [CrossRef]
- Barnes, A.D.; Allen, K.; Kreft, H.; Corre, M.D.; Jochum, M.; Veldkamp, E. Direct and cascading impacts of tropical land-use change on multi-trophic biodiversity. Nat. Ecol. Evol. 2017, 1, 1511–1519. [Google Scholar] [CrossRef]
- Vignozzi, N.; Agnelli, A.E.; Brandi, G.; Gagnarli, E.; Goggioli, D.; Lagomarsino, A.; Pellegrini, S.; Simoncini, S.; Simoni, S.; Valboa, G.; et al. Soil ecosystem functions in a high-density olive orchard managed by different soil conservation practices. Appl. Soil Ecol. 2019, 134, 64–76. [Google Scholar] [CrossRef]
- Ernst, D.; Kolenčík, M.; Šebesta, M.; Ubaďurišová, L.; Ďúranová, H.; Kšiňan, S. Agronomic Investigation of Spray Dispersion of Metal-Based Nanoparticles on Sunflowers in Real-World Environments. Plants 2023, 12, 1789. [Google Scholar] [CrossRef] [PubMed]
- Brygadyrenko, V.V. Community structure of litter invertebrates of forest belt ecosystems in the Ukrainian steppe zone. Int. J. Environ. Res. 2015, 9, 1183–1192. [Google Scholar]
- Dudley, N.; Alexander, S. Agriculture and biodiversity: A review. Biodiversity 2017, 18, 45–49. [Google Scholar] [CrossRef]
- Faly, L.I.; Kolombar, T.M.; Prokopenko, E.V.; Pakhomov, O.Y.; Brygadyrenko, V.V. Structure of litter macrofauna communities in poplar plantations in an urban ecosystem in Ukraine. Biosyst. Divers. 2017, 25, 29–38. [Google Scholar] [CrossRef]
- Berg, M.P.; Bengtsson, J. Temporal and spatial variability in soil food web structure. Oikos 2007, 116, 1789–1804. [Google Scholar] [CrossRef]
- Kolesnikova, A.; Lapteva, E.; Degteva, S.; Taskaeva, A.; Kudrin, A.; Vinogradova, Y. Biodiversity of foodplain soils in the European north-east of Russia. In River Basin Management; IntechOpen: London, UK, 2016; pp. 271–294. [Google Scholar]
- Boháč, J.; Jahnov, Z. Land Use Changes and Landscape Degradation in Central and Eastern Europe in the Last Decades: Epigeic Invertebrates as Bioindicators of Landscape Changes. In Environmental Indicators; Springer: Berlin/Heidelberg, Germany, 2015; pp. 395–420. [Google Scholar]
- Boetzl, A.F.; Sponsler, D.; Albrecht, M.; Batáry, P.; Birkhofer, K.; Knapp, M.; Krauss, J.; Maas, B.; Martin, A.E.; Sirami, C.; et al. Distance functions of carabids in crop fields depend on functional traits, crop type and adjacent habitat: A synthesis. Proc. R. Soc. B 2024, 291, 1–10. [Google Scholar] [CrossRef]
- Fazekašová, D.; Bobuľovská, L. Soil organisms as an Indicator of Quality and Environmental Stress in the Soil Ecosystem. Zivotn. Prostr. 2012, 46, 103–106. [Google Scholar]
- Coleman, D.C.; Wall, D.H. Soil fauna: Occurrence, biodiversity, and roles in ecosystem function. In Soil Microbiology, Ecology, and Biochemistry, 4th ed.; Paul, E.A., Ed.; Academic Press: New York, NY, USA, 2015; Chapter 5; pp. 111–149. [Google Scholar]
- Menta, C.; Remelli, S. Soil Health and Arthropods: From Complex System to Worthwhile Investigation. Insects 2020, 11, 54. [Google Scholar] [CrossRef]
- Murphy, B.W. Soil Organic Matter and Soil Function—Review of the Literature and Underlying Data; Department of the Environment: Canberra, Australia, 2014. [Google Scholar]
- Ondrasek, G.; Bakić, H.; Zovko, M.; Filipović, L.; Meriño-Gergichevich, C.; Savić, R.; Rengel, Z. Biogeochemistry of soil organic matter in agroecosystems & environmental implications. Sci. Total Environ. 2019, 658, 1559–1573. [Google Scholar]
- Schierwater, B.; DeSalle, R. Invertebrate Zoology: A Tree of Life Approach; CRC Press: London, UK, 2021; 644p. [Google Scholar]
- Ter Braak, C.J.F.; Šmilauer, P. Canoco Reference Manual and User’s Guide: Software for Ordination, Version 5.0; Microcomputer Power: Ithaca, NY, USA, 2012. [Google Scholar]
- R Version 4.1.3; The R Foundation for Statistical Computing: Vienna, Austria, 2020.
- Balqees, N.; Ali, Q.; Malik, A. Genetic evaluation for seedling traits of maize and wheat under biogas wastewater, sewage water and drought stress conditions. Biol. Clin. Sci. Res. J. 2020, 1, 1–6. [Google Scholar] [CrossRef]
- Javed, A.; Muhammad, S.; Ali, Q.; Manzoor, T. An Overview of Leaf Rust Resistance Genes in Triticum aestivum. Bull. Biol. Allied Sci. Res. 2022, 7, 1–6. [Google Scholar] [CrossRef]
- Fahrig, L.; Girard, J.; Duro, D.; Pasher, J.; Smith, A.; Javorek, S.; King, D.; Lindsay, K.F.; Mitchell, S.; Tischendorf, L. Farmlands with smaller crop fields have higher within-field biodiversity. Agric. Ecosyst. Environ. 2015, 200, 219–234. [Google Scholar] [CrossRef]
- Burel, F.; Butet, A.; Delettre, Y.R.; de la Pena, N.M. Differential response of selected taxa tolandscape context and agricultural intensification. Landsc. Urban Plan. 2004, 67, 195–204. [Google Scholar] [CrossRef]
- Magdoff, F. Ecological agriculture: Principles, practices, and constraints. Renew. Agric. Food Syst. 2007, 22, 109–117. [Google Scholar] [CrossRef]
- Kubicová, Ľ.; Dobák, D.; Kádeková, Z. Trends in consumption of milk and dairy products in Slovakia after EUaccession. Zesz. Nauk. SGGW Polityki Eur. Finans. I Mark. 2014, 12, 90–97. [Google Scholar]
- Porhajašová, J.; Babošová, M. Impact of arable farming management on the biodiversity of Carabidae (Coleoptera). Saudi J. Biol. Sci. 2022, 29, 1–9. [Google Scholar] [CrossRef]
- Whalen, J.K.; Hamel, C. Effects of key soil organisms on nutrient dynamics in temperate agroecosystems. J. Crop Improv. 2004, 11, 175–207. [Google Scholar] [CrossRef]
- Schuster, N.R.; Peterson, J.A.; Gilley, J.E.; Schott, L.R.; Schmidt, A.M. Soil arthropod abundance and diversityfollowing land application of swine slurry. Agric. Sci. 2019, 10, 150–163. [Google Scholar]
- Menta, C.; Conti, F.D.; Fondón, L.C.; Staffilani, F.; Remelli, S. Soil Arthropod Responses in Agroecosystem: Implications of Different Management and Cropping Systems. Agronomy 2020, 10, 982. [Google Scholar] [CrossRef]
- Magura, T.; Ferrante, M.; Lövei, L.G. Only habitat specialists become smaller with advancing urbanization. Glob. Ecol. Biogeogr. 2020, 29, 1978–1987. [Google Scholar] [CrossRef]
- Diehl, E.; Wolters, V.; Birkhofer, K. Arable weeds in organically managed wheat fields foster carabid beetles byresource and structure-mediated effects. Arthropod-Plant Interact. 2012, 6, 75–82. [Google Scholar] [CrossRef]
- Diehl, E.; Mader, V.L.; Wolters, V.; Birkhofer, K. Management intensity and vegetation complexity affect web-building spiders and their prey. Oecologia 2013, 173, 579–589. [Google Scholar] [CrossRef] [PubMed]
- Pérez-Bote, J.L.; Romero, A.J. Epigeic soil arthropod abundance under different agricultural land uses. Span. J. Agric. Res. 2012, 10, 55–61. [Google Scholar] [CrossRef]
- Liu, R.T.; Zhu, F.; Steinberger, Y. Effect of shrub microhabitats on aboveground and belowground arthropod distributionin a desertified steppe ecosystem. Pol. J. Ecol. 2015, 63, 534–548. [Google Scholar]
- Sticht, C.; Schrader, S.; Giesemann, A.; Weigel, H.J. Atmospheric CO2 enrichment induces life strategy- and species-specific responses of collembolans in the rhizosphere of sugar beet and winter wheat. Soil Biol. Biochem. 2008, 40, 1432–1445. [Google Scholar] [CrossRef]
- Magro, S.; Gutiérrez-López, M.; Casado, M.A.; Jiménez, M.D.; Trigo, D.; Mola, I. Soil functionality at the roadside: Zooming in on a microarthropod community in an anthropogenic soil. Ecol. Eng. 2013, 60, 81–87. [Google Scholar] [CrossRef]
- Holmstrup, M.; Maraldo, K.; Krogh, P.H. Combined effect of copper and prolonged summer drought on soil Microarthropods in the field. Environ. Pollut. 2007, 146, 525–533. [Google Scholar] [CrossRef]
- Bianchni, F.; Booij, C.; Tscherntke, T. Sustainable pest regulation in agricultural landscape: A review on landscape composition. Biodiversity and natural pest control. Proc. R. Soc. 2006, 273, 1715–1727. [Google Scholar]
- Bagyaraj, D.J.; Nethravathi, C.J.; Nitin, K.S. Soil Biodiversity and Arthropods: Role in Soil Fertility. In Economic and Ecological Significance of Arthropods in Diversified Ecosystems; Springer: Singapore, 2016; pp. 17–51. [Google Scholar]
- Ghiglieno, I.; Simonetto, A.; Donna, P.; Tonni, M.; Valenti, L.; Bedussi, F. Soil Biological Quality Assessment to Improve Decision Support in the Wine Sector. Agronomy 2019, 9, 593. [Google Scholar] [CrossRef]
- Ghiglieno, I.; Simonetto, A.; Orlando, F.; Donna, P.; Tonni, M.; Valenti, L. Response of the Arthropod Community to Soil Characteristics and Management in the Franciacorta Viticultural Area (Lombardy, Italy). Agronomy 2020, 10, 740. [Google Scholar] [CrossRef]
- Jasinski, M.; Twardowski, J.; Tendziagolska, E. The occurrence of soil mesofauna in organic crops. J. Res. Appl. Agric. Eng. 2016, 61, 193–199. [Google Scholar]
- Fazekašová, D.; Bobuľovská, L.; Angelovičová, L. Biological activity of soil as an indicator of soil fertility. Nővénytérmeles 2013, 62, 205–208. [Google Scholar]
- Langellotto, G.A.; Denno, R.F. Responses of invertebrate natural enemies to complex-structured habitats: A meta-analytical synthesis. Oecologia 2004, 139, 1–10. [Google Scholar] [CrossRef]
- Lenoir, L.; Lennartsson, T. Effects of timing of grazing on arthropod communities in semi-natural grasslands. J. Insect Sci. 2010, 10, 5–24. [Google Scholar] [CrossRef]
- Moço, S.K.M.; Gama-Rodrigues, F.E.; Gama-Rodrigues, C.A.; Machado, R.C.R.; Baligar, C.V. Relationships between invertebrate communities, litter quality and soil attributes under different cacao agroforestry systems in the south of Bahia. Appl. Soil Ecol. 2010, 46, 347–354. [Google Scholar] [CrossRef]
Figure 1.
Investigated agricultural crop Triticum aestivum during the years 2020 (A), 2021 (B) and 2022 (C).
Figure 1.
Investigated agricultural crop Triticum aestivum during the years 2020 (A), 2021 (B) and 2022 (C).
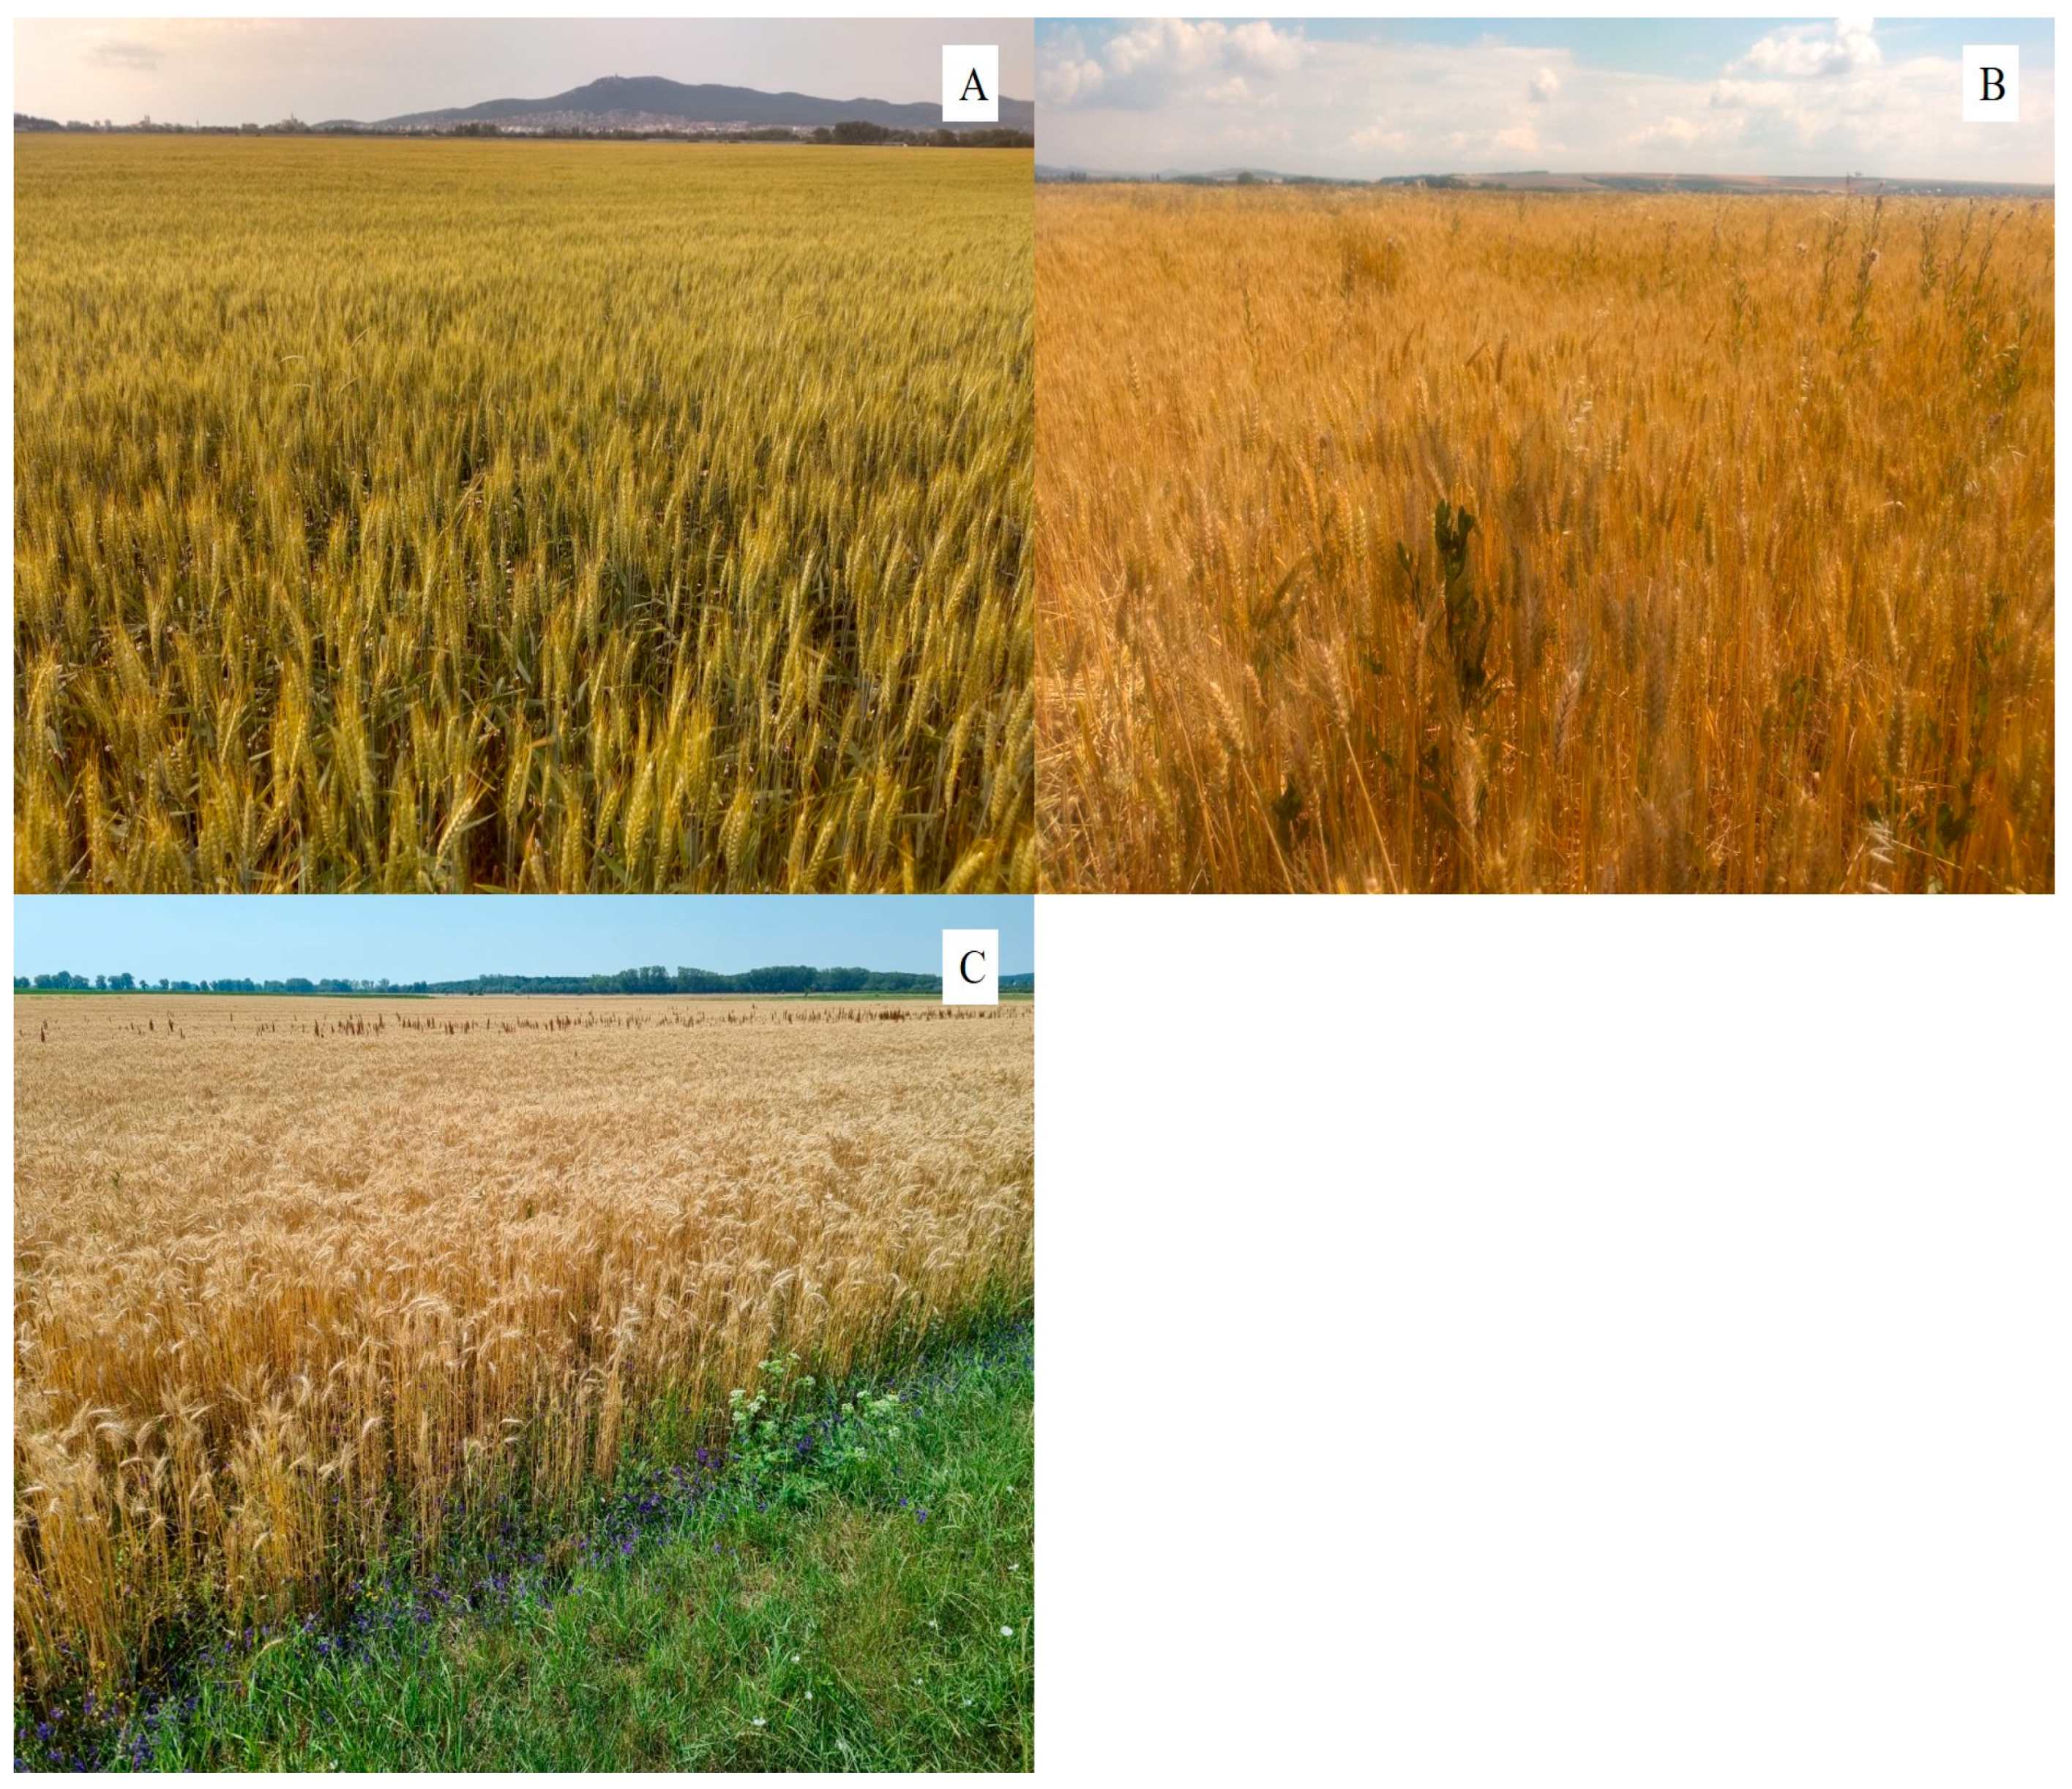
Figure 2.
Placement of pitfall traps in the field and grass herbaceous vegetation.
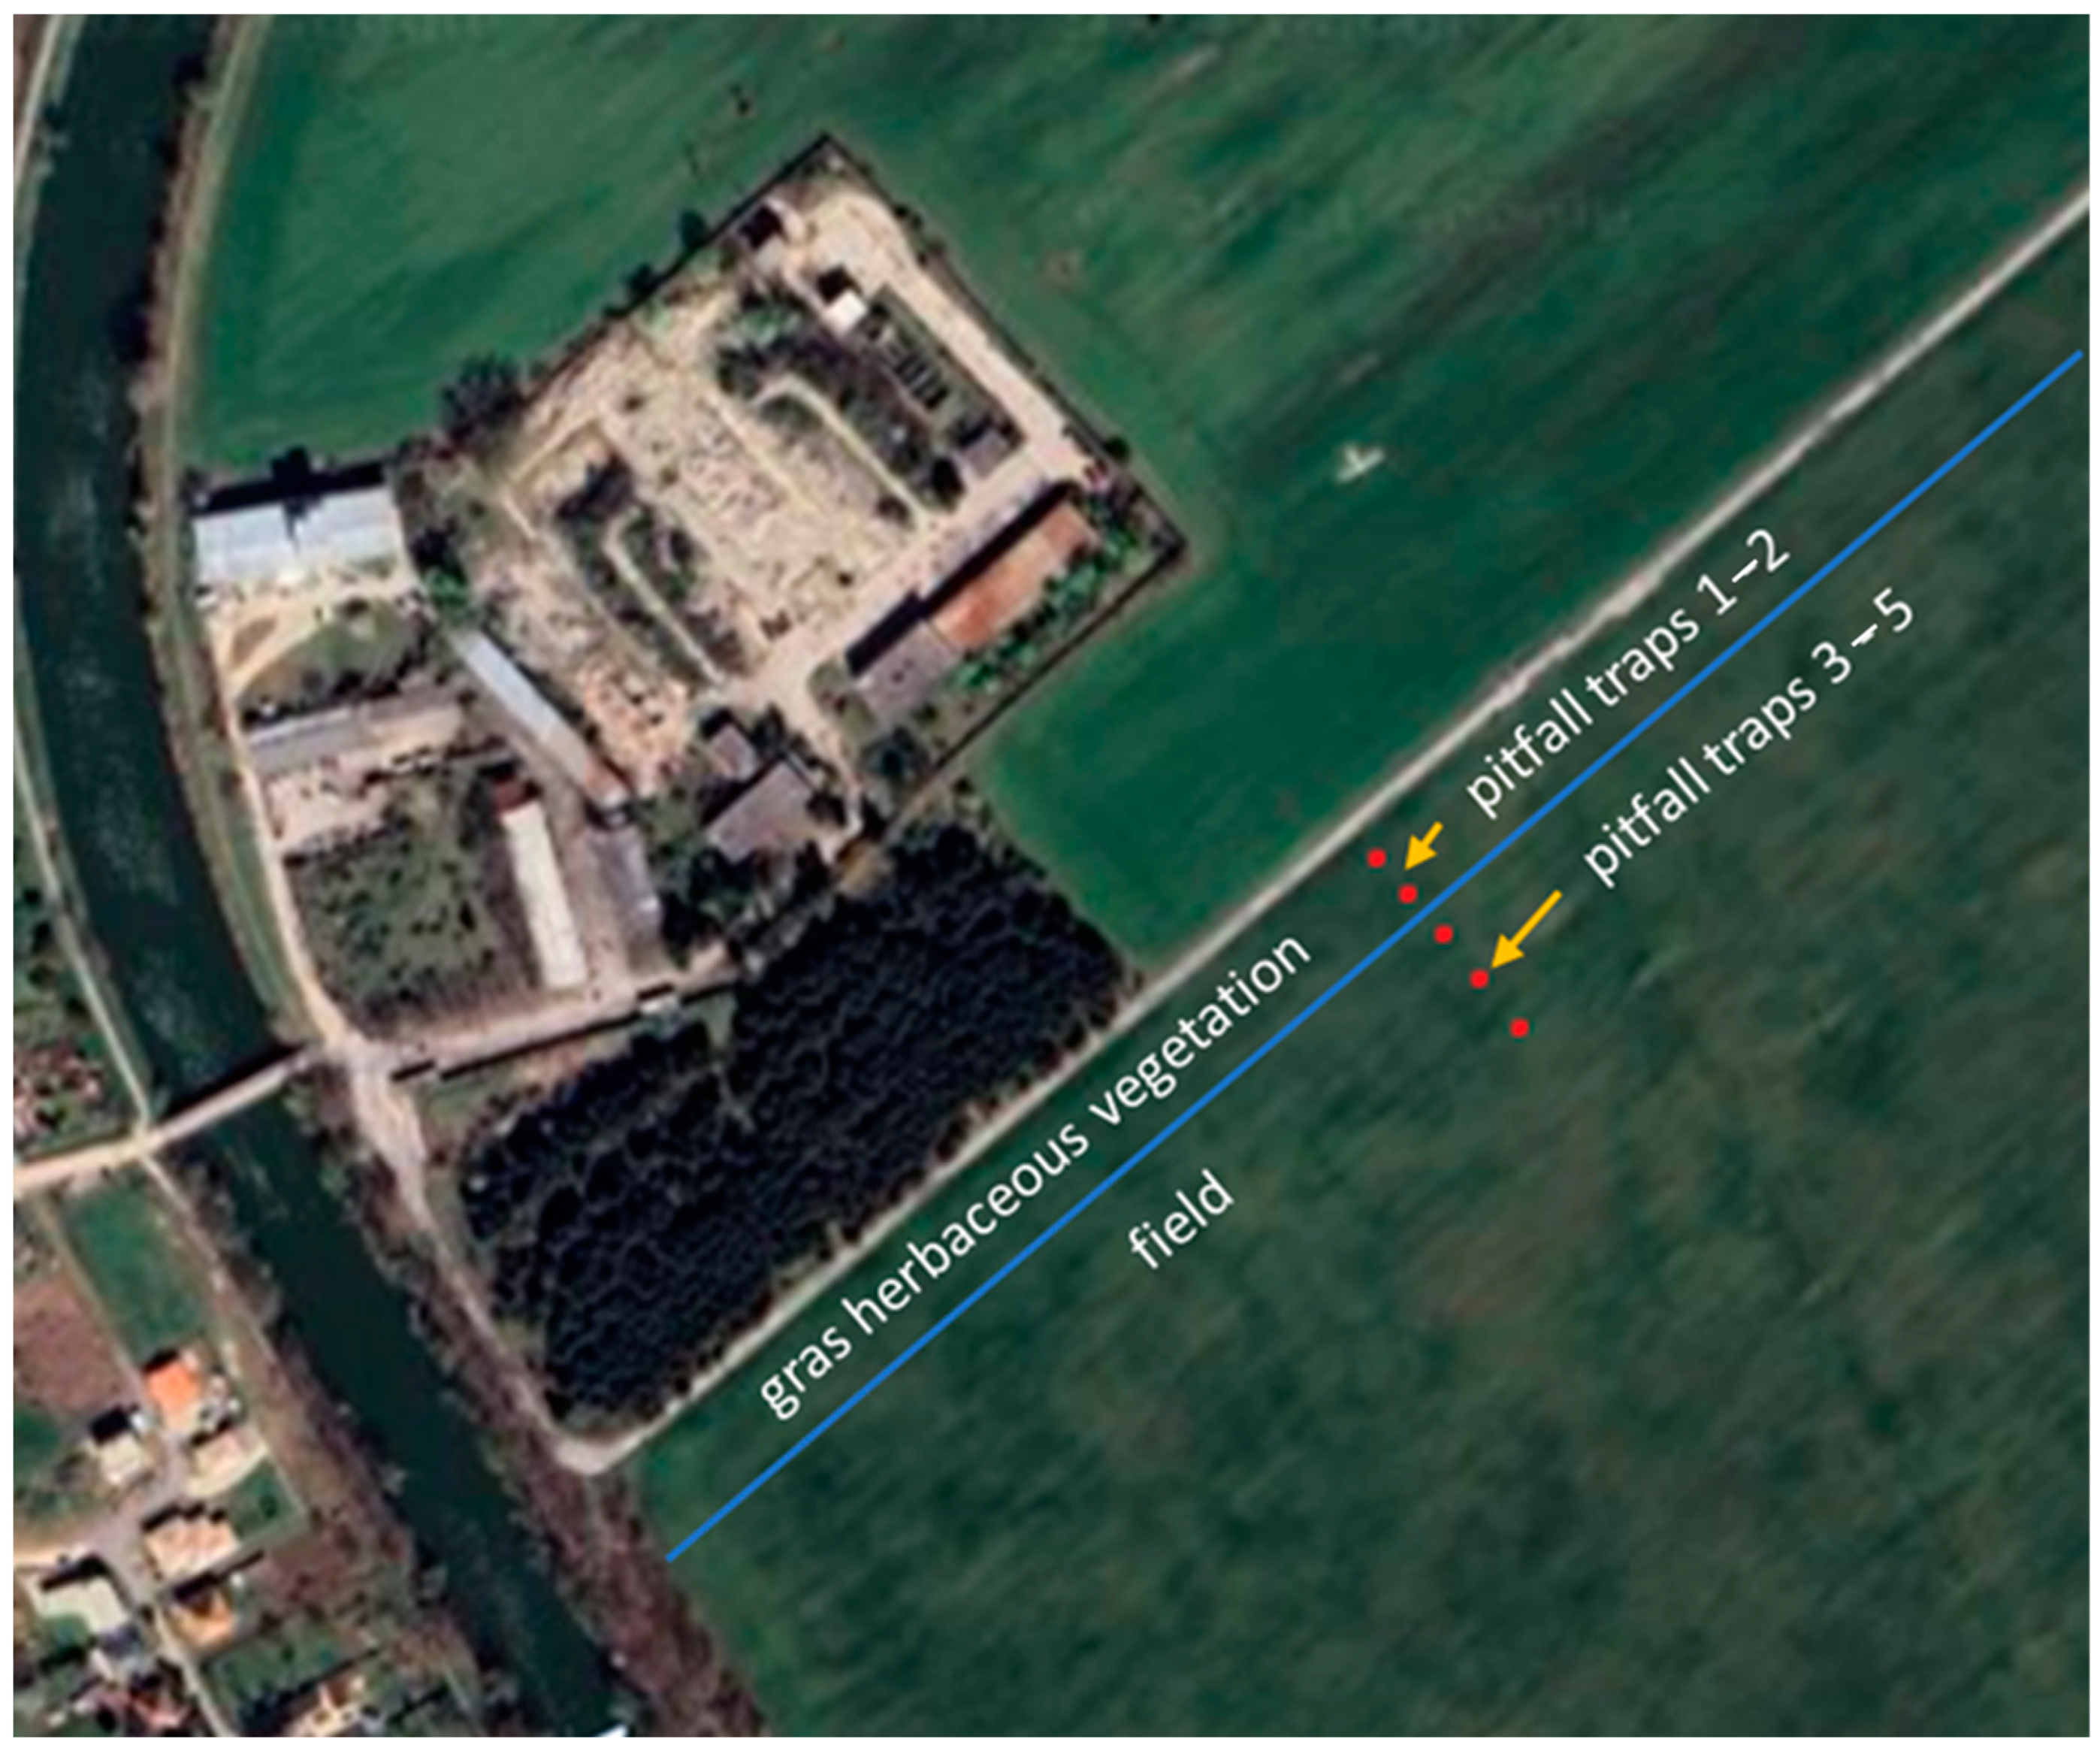
Figure 3.
Spatial structure of taxa in the Triticum aestivum crop in 2020–2022 during the spring and summer seasons. Note: pt = pitfall traps, sp = spring, su = summer, 20 = year 2020, 21 = year 2021, 22 = year 2022.
Figure 3.
Spatial structure of taxa in the Triticum aestivum crop in 2020–2022 during the spring and summer seasons. Note: pt = pitfall traps, sp = spring, su = summer, 20 = year 2020, 21 = year 2021, 22 = year 2022.
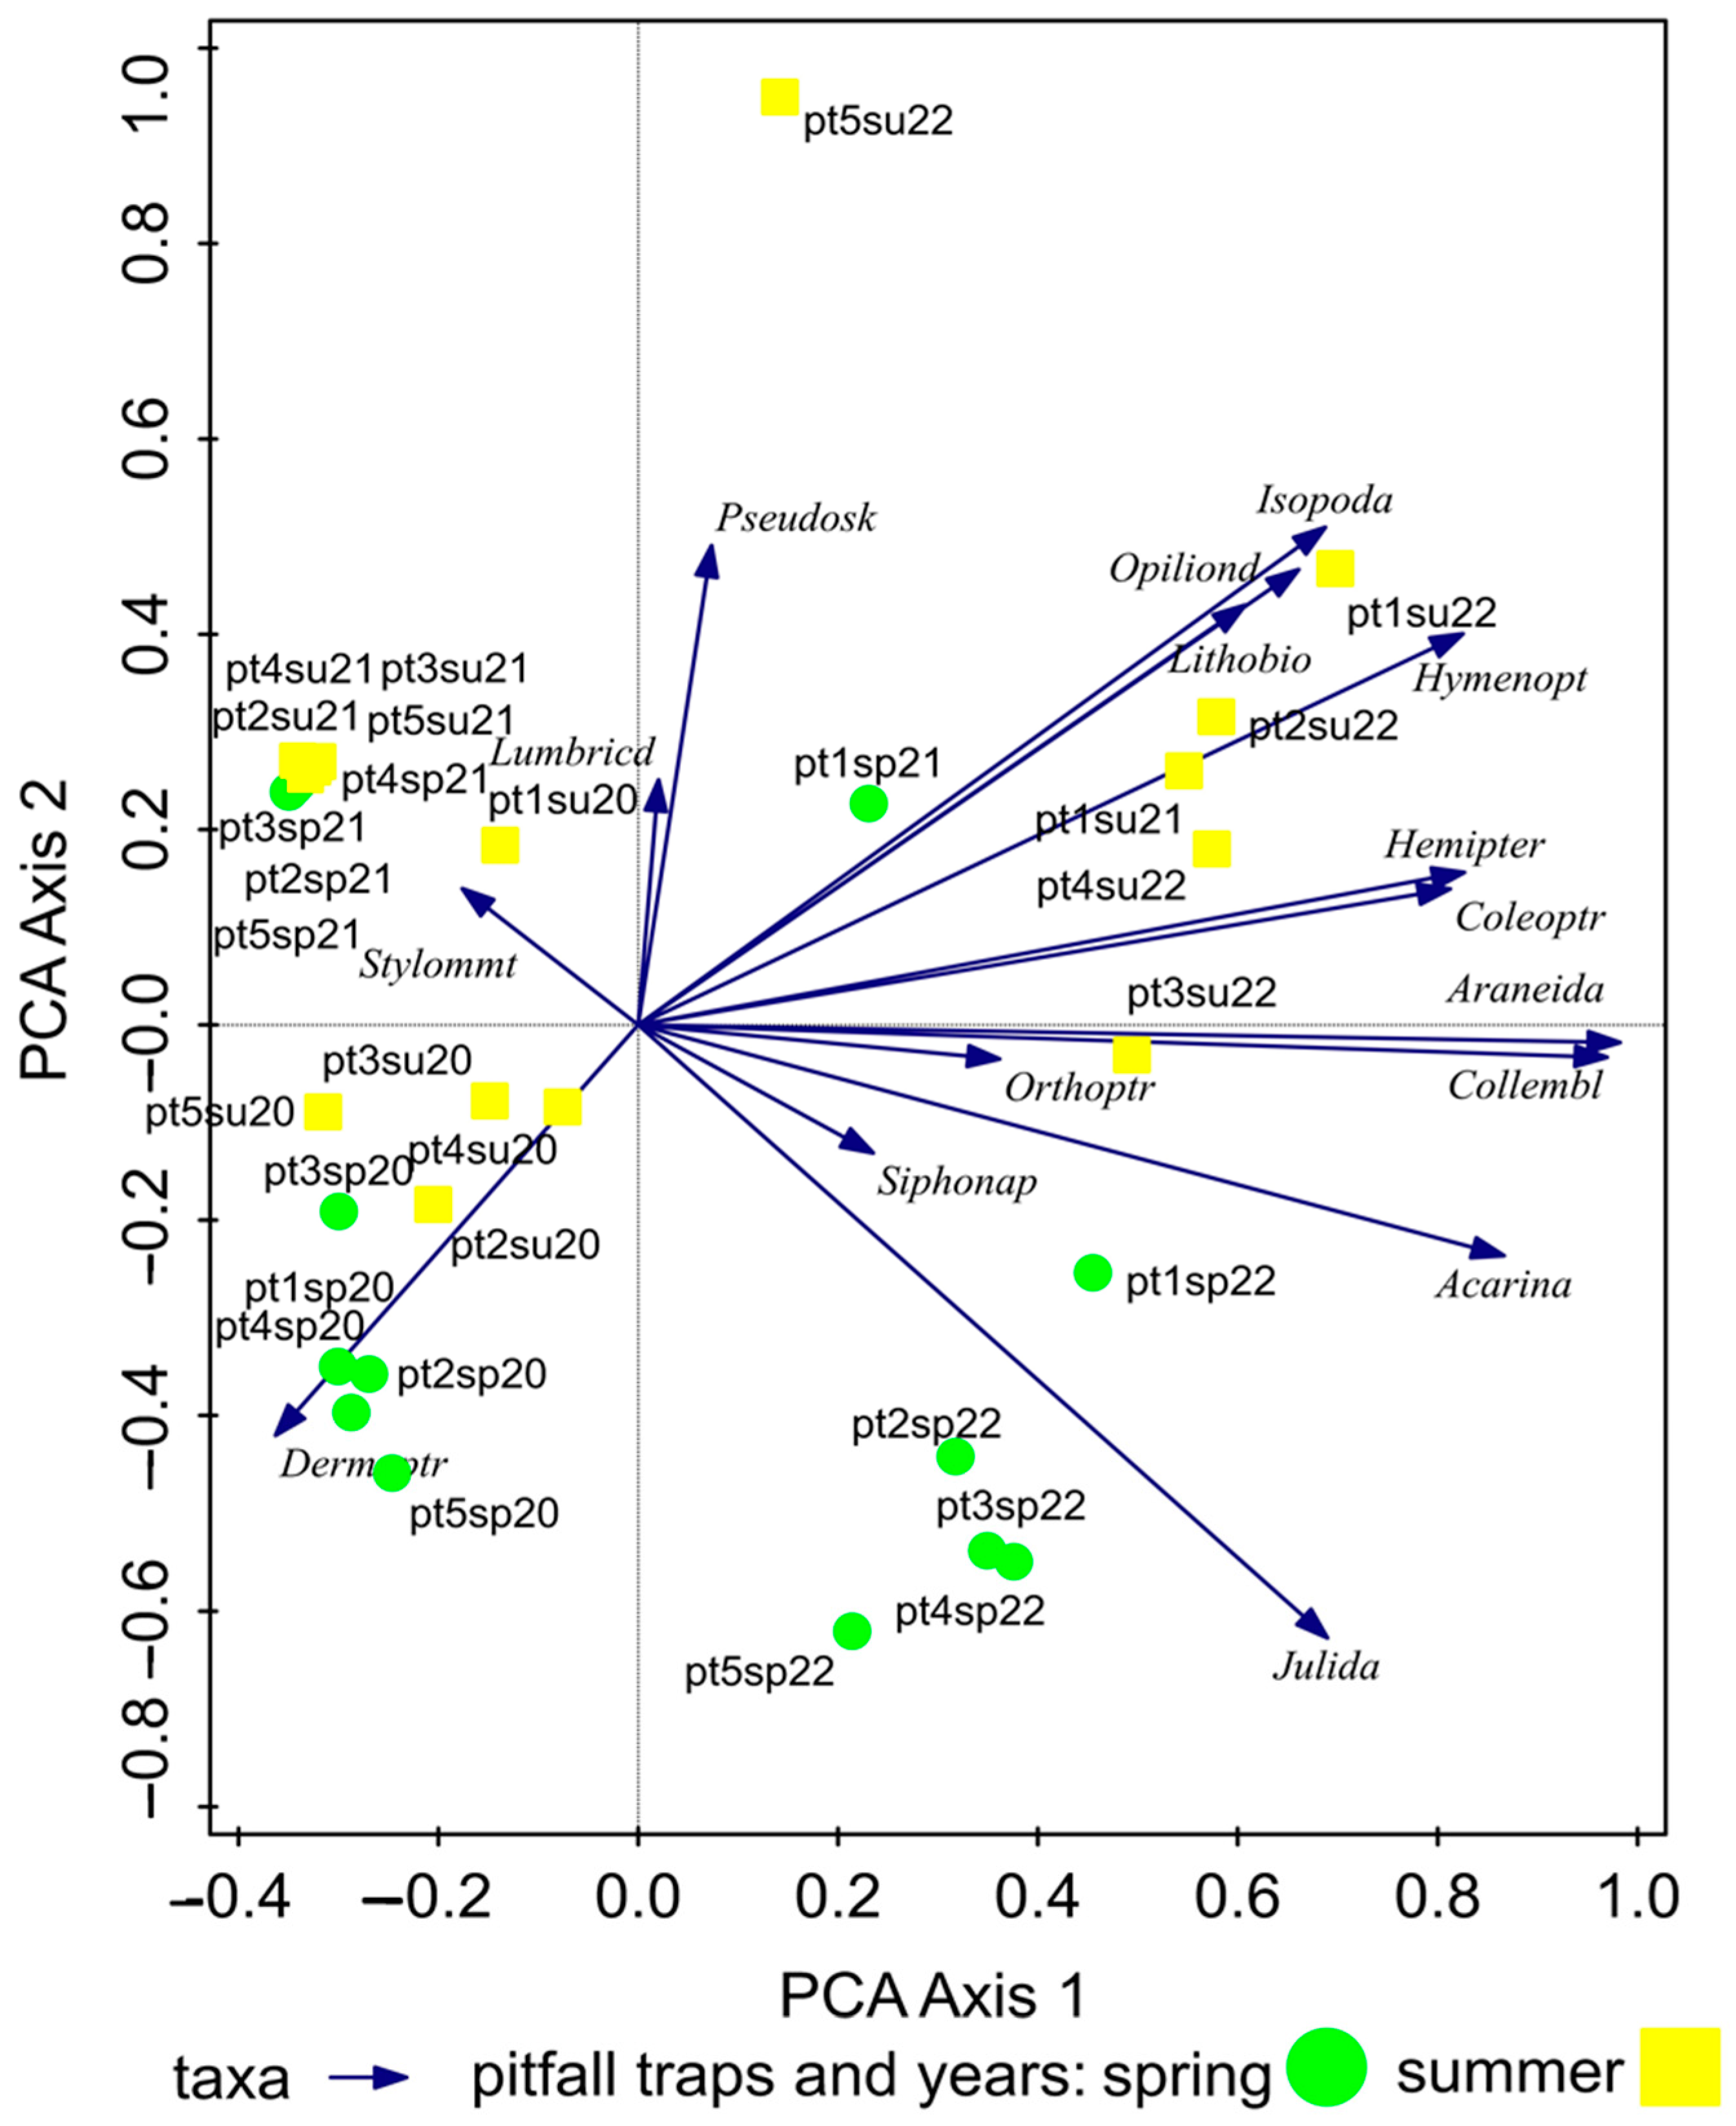
Figure 4.
The influence of environmental variables on the dispersion of taxa.
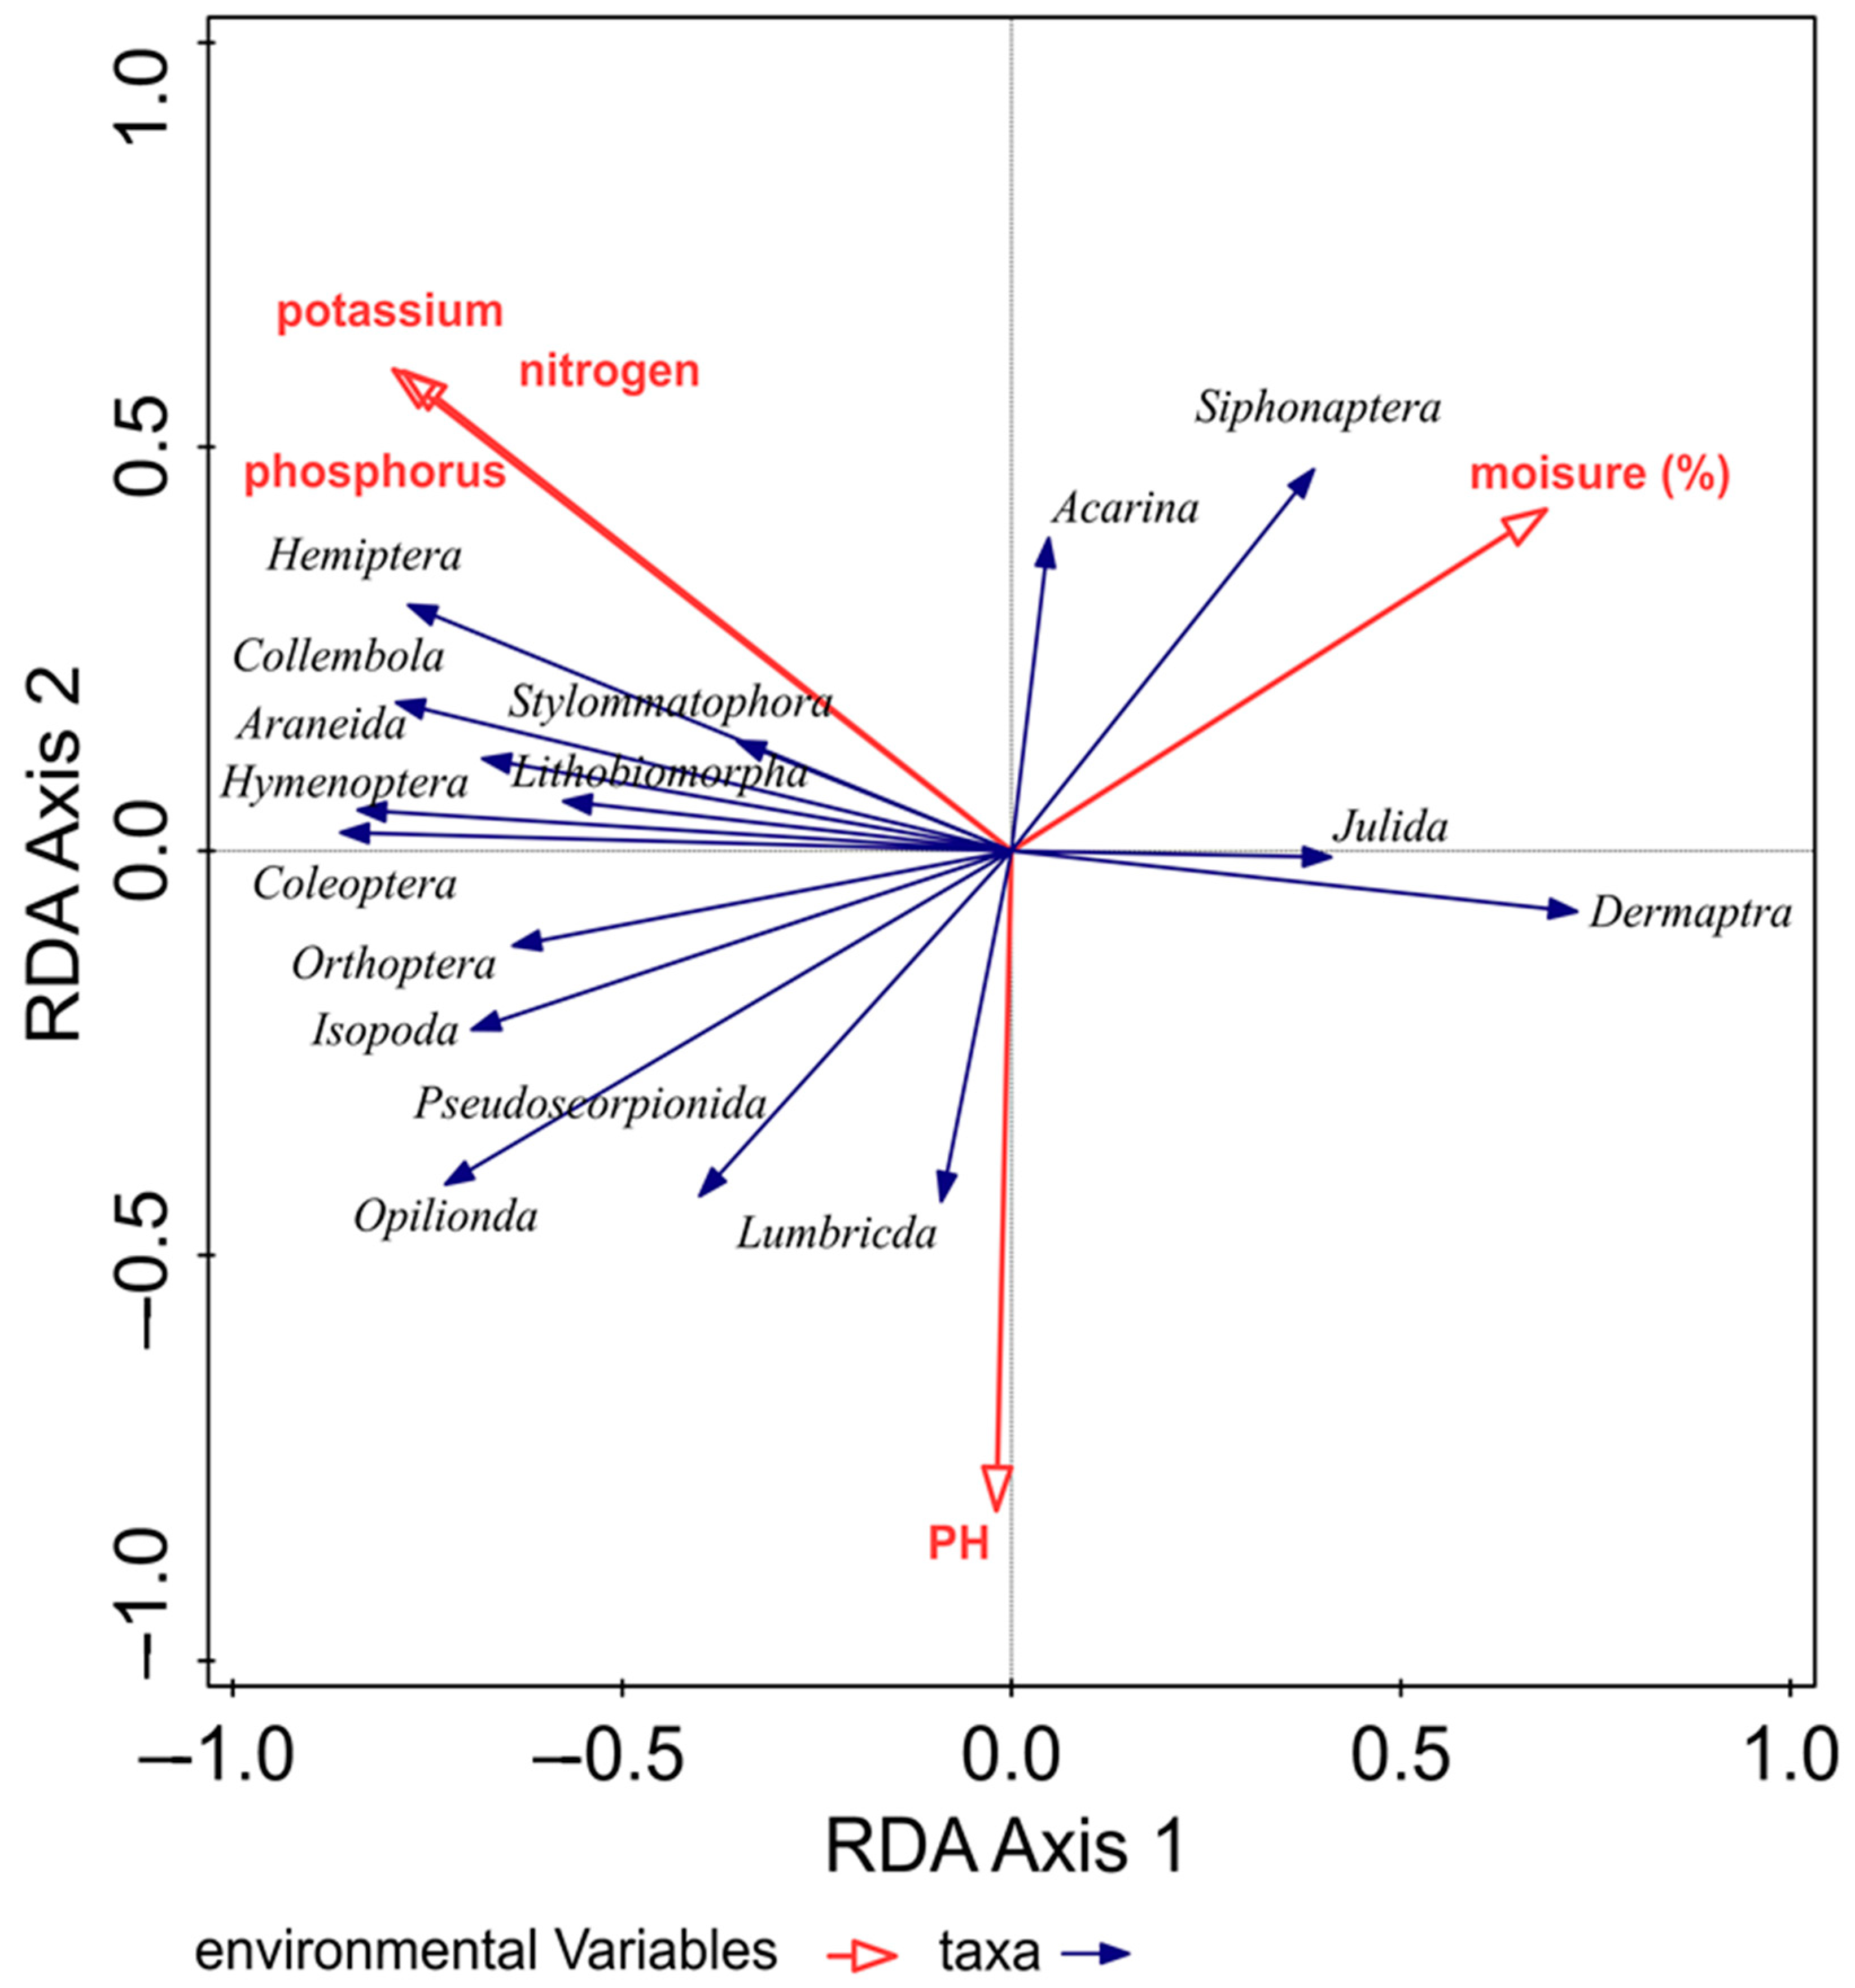
Figure 5.
Analysis of abundance between pitfall traps (1–5) during spring between years 2020 and 2022.
Figure 5.
Analysis of abundance between pitfall traps (1–5) during spring between years 2020 and 2022.

Figure 6.
Analysis of abundance between pitfall traps (1–5) during summer between years 2020 and 2022.
Figure 6.
Analysis of abundance between pitfall traps (1–5) during summer between years 2020 and 2022.

Table 1.
Recorded taxa in the crop Triticum aestivum.
| Period/Taxa | Year 2020 | Year 2021 | Year 2022 | ∑ N | ∑% | |||
|---|---|---|---|---|---|---|---|---|
| N | % | N | % | N | % | |||
| spring | 345 | 7.86% | 547 | 12.46% | 3499 | 79.69% | 4391 | 100.00% |
| Acarina | 0 | 0.00% | 6 | 0.14% | 163 | 3.71% | 169 | 3.85% |
| Araneida | 0 | 0.00% | 35 | 0.80% | 200 | 4.55% | 235 | 5.35% |
| Coleoptera | 125 | 2.85% | 300 | 6.83% | 1854 | 42.22% | 2279 | 51.90% |
| Collembola | 0 | 0.00% | 4 | 0.09% | 384 | 8.75% | 388 | 8.84% |
| Dermaptera | 35 | 0.80% | 0 | 0.00% | 0 | 0.00% | 35 | 0.80% |
| Hemiptera | 0 | 0.00% | 0 | 0.00% | 10 | 0.23% | 10 | 0.23% |
| Hymenoptera | 0 | 0.00% | 97 | 2.21% | 25 | 0.57% | 122 | 2.78% |
| Isopoda | 0 | 0.00% | 22 | 0.50% | 5 | 0.11% | 27 | 0.61% |
| julida | 161 | 3.67% | 74 | 1.69% | 847 | 19.29% | 1082 | 24.64% |
| Lithobiomorpha | 0 | 0.00% | 0 | 0.00% | 1 | 0.02% | 1 | 0.02% |
| Lumbricida | 12 | 0.27% | 1 | 0.02% | 4 | 0.09% | 17 | 0.39% |
| Opilionida | 0 | 0.00% | 5 | 0.11% | 0 | 0.00% | 5 | 0.11% |
| Orthoptera | 12 | 0.27% | 3 | 0.07% | 5 | 0.11% | 20 | 0.46% |
| Siphonaptera | 0 | 0.00% | 0 | 0.00% | 1 | 0.02% | 1 | 0.02% |
| summer | 725 | 6.84% | 886 | 8.36% | 8986 | 84.80% | 10,597 | 100.00% |
| Acarina | 0 | 0.00% | 2 | 0.02% | 62 | 0.59% | 64 | 0.60% |
| Araneida | 16 | 0.15% | 10 | 0.09% | 534 | 5.04% | 560 | 5.28% |
| Coleoptera | 537 | 5.07% | 680 | 6.42% | 5084 | 47.98% | 6301 | 59.46% |
| Collembola | 0 | 0.00% | 8 | 0.08% | 2371 | 22.37% | 2379 | 22.45% |
| Dermaptera | 4 | 0.04% | 0 | 0.00% | 0 | 0.00% | 4 | 0.04% |
| Hemiptera | 0 | 0.00% | 0 | 0.00% | 56 | 0.53% | 56 | 0.53% |
| Hymenoptera | 25 | 0.24% | 44 | 0.42% | 474 | 4.47% | 543 | 5.12% |
| Isopoda | 2 | 0.02% | 59 | 0.56% | 66 | 0.62% | 127 | 1.20% |
| julida | 77 | 0.73% | 2 | 0.02% | 238 | 2.25% | 317 | 2.99% |
| Lithobiomorpha | 0 | 0.00% | 1 | 0.01% | 5 | 0.05% | 6 | 0.06% |
| Lumbricida | 0 | 0.00% | 49 | 0.46% | 0 | 0.00% | 49 | 0.46% |
| Opilionida | 0 | 0.00% | 4 | 0.04% | 56 | 0.53% | 60 | 0.57% |
| Orthoptera | 64 | 0.60% | 3 | 0.03% | 40 | 0.38% | 107 | 1.01% |
| Pseudoskorpionida | 0 | 0.00% | 14 | 0.13% | 0 | 0.00% | 14 | 0.13% |
| Stylommatophora | 0 | 0.00% | 10 | 0.09% | 0 | 0.00% | 10 | 0.09% |
| ∑ | 1070 | 7.14% | 1433 | 9.56% | 12,485 | 83.30% | 14,988 | 100.00% |
Explanations: N = number of individuals.
Table 2.
Post hoc test results (Tukey HSD) between traps and years during spring.
| 2 | 3 | 4 | 5 | 6 | 7 | 8 | 9 | 10 | 11 | 12 | 13 | 14 | 15 | |
|---|---|---|---|---|---|---|---|---|---|---|---|---|---|---|
| 0.985 | 0.046 | 0.998 | 0.895 | 0.009 | 0.999 | 0.915 | 0.031 | 0.895 | 0.885 | 0.008 | 0.969 | 1.000 | 0.009 | 1 |
| 0.028 | 0.900 | 0.958 | 0.041 | 0.978 | 0.865 | 0.031 | 0.889 | 0.876 | 0.009 | 0.901 | 0.911 | 0.050 | 2 | |
| 0.049 | 0.046 | 0.008 | 0.041 | 0.031 | 0.992 | 0.042 | 0.034 | 0.010 | 0.014 | 0.042 | 0.010 | 3 | ||
| 1.000 | 0.009 | 0.895 | 0.895 | 0.036 | 0.785 | 0.875 | 0.009 | 0.954 | 0.812 | 0.023 | 4 | |||
| 0.046 | 0.659 | 0.575 | 0.042 | 0.986 | 0.951 | 0.006 | 0.701 | 0.784 | 0.043 | 5 | ||||
| 0.008 | 0.034 | 0.045 | 0.009 | 0.030 | 0.911 | 0.018 | 0.013 | 0.895 | 6 | |||||
| 0.975 | 0.029 | 0.989 | 0.966 | 0.031 | 0.975 | 0.994 | 0.033 | 7 | ||||||
| 0.047 | 0.900 | 0.995 | 0.043 | 0.879 | 0.895 | 0.021 | 8 | |||||||
| 0.030 | 0.042 | 1.000 | 0.018 | 0.021 | 1.000 | 9 | ||||||||
| 0.957 | 0.008 | 0.898 | 0.912 | 0.050 | 10 | |||||||||
| 0.007 | 0.895 | 0.942 | 0.019 | 11 | ||||||||||
| 0.015 | 0.042 | 0.800 | 12 | |||||||||||
| 0.932 | 0.037 | 13 | ||||||||||||
| 0.008 | 14 |
Note: 1 = pitfall traps = 1 and year 2020, 2 = pitfall traps = 1 and year 2021, 3 = pitfall traps = 1 and year 2022, 4 = pitfall traps = 2 and year 2020, 5 = pitfall traps = 2 and year 2021, 6 = pitfall traps = 2 and year 2022, 7 = pitfall traps = 3 and year 2020, 8 = pitfall traps = 3 and year 2021, 9 = pitfall traps = 3 and year 2022, 10 = pitfall traps = 4 and year 2020, 11 = pitfall traps = 4 and year 2021, 12 = pitfall traps = 4 and year 2022, 13 = pitfall traps = 5 and year 2020, 14 = pitfall traps = 5 and year 2021 and 15 = pitfall traps = 5 and year 2022.
Table 3.
Post hoc test results (Tukey HSD) between traps and years during summer.
| 2 | 3 | 4 | 5 | 6 | 7 | 8 | 9 | 10 | 11 | 12 | 13 | 14 | 15 | |
|---|---|---|---|---|---|---|---|---|---|---|---|---|---|---|
| 0.775 | 0.045 | 0.788 | 0.685 | 0.034 | 0.789 | 0.705 | 0.014 | 0.685 | 0.675 | 0.012 | 0.759 | 0.790 | 0.027 | 1 |
| 0.042 | 0.745 | 0.859 | 0.013 | 0.879 | 0.766 | 0.010 | 0.789 | 0.776 | 0.050 | 0.801 | 0.811 | 0.050 | 2 | |
| 0.018 | 0.006 | 0.014 | 0.046 | 0.027 | 0.548 | 0.021 | 0.014 | 0.013 | 0.050 | 0.019 | 0.014 | 3 | ||
| 0.776 | 0.034 | 0.665 | 0.671 | 0.033 | 0.561 | 0.651 | 0.010 | 0.730 | 0.588 | 0.049 | 4 | |||
| 0.042 | 0.560 | 0.476 | 0.020 | 0.887 | 0.853 | 0.040 | 0.602 | 0.686 | 0.038 | 5 | ||||
| 0.041 | 0.050 | 0.018 | 0.005 | 0.010 | 0.896 | 0.021 | 0.046 | 0.758 | 6 | |||||
| 0.627 | 0.033 | 0.640 | 0.617 | 0.019 | 0.627 | 0.645 | 0.026 | 7 | ||||||
| 0.467 | 0.900 | 0.995 | 0.043 | 0.879 | 0.895 | 0.021 | 8 | |||||||
| 0.018 | 0.039 | 0.758 | 0.018 | 0.009 | 0.875 | 9 | ||||||||
| 0.712 | 0.005 | 0.746 | 0.865 | 0.010 | 10 | |||||||||
| 0.011 | 0.678 | 0.875 | 0.039 | 11 | ||||||||||
| 0.018 | 0.037 | 0.986 | 12 | |||||||||||
| 0.811 | 0.010 | 13 | ||||||||||||
| 0.050 | 14 |
Note: 1 = pitfall traps = 1 and year 2020, 2 = pitfall traps = 1 and year 2021, 3 = pitfall traps = 1 and year 2022, 4 = pitfall traps = 2 and year 2020, 5 = pitfall traps = 2 and year 2021, 6 = pitfall traps = 2 and year 2022, 7 = pitfall traps = 3 and year 2020, 8 = pitfall traps = 3 and year 2021, 9 = pitfall traps = 3 and year 2022, 10 = pitfall traps = 4 and year 2020, 11 = pitfall traps = 4 and year 2021, 12 = pitfall traps = 4 and year 2022, 13 = pitfall traps = 5 and year 2020, 14 = pitfall traps = 5 and year 2021 and 15 = pitfall traps = 5 and year 2022.
Disclaimer/Publisher’s Note: The statements, opinions and data contained in all publications are solely those of the individual author(s) and contributor(s) and not of MDPI and/or the editor(s). MDPI and/or the editor(s) disclaim responsibility for any injury to people or property resulting from any ideas, methods, instructions or products referred to in the content. |
© 2024 by the authors. Licensee MDPI, Basel, Switzerland. This article is an open access article distributed under the terms and conditions of the Creative Commons Attribution (CC BY) license (https://creativecommons.org/licenses/by/4.0/).
Share and Cite
MDPI and ACS Style
Langraf, V.; Petrovičová, K. Seasonal Dynamics of Epigeic Arthropods under the Conditions of Ecological Management of the Triticum aestivum Crop. Agriculture 2024, 14, 482. https://doi.org/10.3390/agriculture14030482
AMA Style
Langraf V, Petrovičová K. Seasonal Dynamics of Epigeic Arthropods under the Conditions of Ecological Management of the Triticum aestivum Crop. Agriculture. 2024; 14(3):482. https://doi.org/10.3390/agriculture14030482
Chicago/Turabian StyleLangraf, Vladimír, and Kornélia Petrovičová. 2024. "Seasonal Dynamics of Epigeic Arthropods under the Conditions of Ecological Management of the Triticum aestivum Crop" Agriculture 14, no. 3: 482. https://doi.org/10.3390/agriculture14030482
Note that from the first issue of 2016, this journal uses article numbers instead of page numbers. See further details here.