1. Introduction
In 2011, about 45 percent of the petroleum consumed in the United States (US) was imported from foreign countries [
1]. Public opinion polls suggest that Americans regard the Nation’s dependence on foreign oil as a threat to national security, with 67 percent believing that the US should reduce its dependence on foreign oil [
2]. More generally, opinion polls suggest that public concern over energy and energy security has reached levels not experienced since the 1970s [
3]. These polls also suggest that the public generally supports increased domestic exploration and drilling as a means of reducing reliance on oil imports. For example, while the 2010 oil spill in the Gulf of Mexico created a short term dip in support for offshore drilling, by November of 2011 about 58 percent of the US public favored allowing more offshore oil and gas drilling in US waters [
4].
The use of ethanol as an alternative to gasoline can help reduce US reliance on foreign oil. Public support for ethanol, however, has been mixed. For example, while 59 percent of Americans favor continuing to increase the use of ethanol in our Nation’s fuel [
5], only 38 percent favor ethanol production subsidies [
4]. Public attitudes toward subsidies may suggest that, in the longer term, the public prefers that price signals from consumers rather than the government drive ethanol markets. There are a variety of reasons why the public might support or oppose increased domestic production of ethanol just as there are a variety of reasons why consumers might prefer more or less ethanol in fuel blends. While there is likely to be considerable overlap between public support for increased production of ethanol and consumer willingness-to-pay (WTP) for gasoline blended with ethanol, there are also likely to be differences. To the extent that the public prefers market signals rather than governmental policy to drive ethanol markets, then the factors that influence consumer WTP for ethanol blends take on added significance.
This study analyzes the extent to which the percent of fuel derived from foreign sources affects consumer WTP for a fuel blend and how WTP varies over consumer characteristics. For example, WTP for reducing imports through ethanol blends may vary regionally, since some regions produce ethanol feedstock, while other regions are more reliant on oil production and refining. This study complements previous research that has evaluated the effects of consumer demographics and attitudes on WTP for ethanol blends differentiated by feedstock source and the level of greenhouse gas (GHG) emissions reductions associated with the use of ethanol.
3. Prior Research
Public attitudes toward ethanol have been examined in a number of recent public opinion polls. In a 2007 CBS/New York Times Poll [
6], more respondents believed using ethanol was “mostly a good idea” (70%), than coal (43%), natural gas (51%) or nuclear (36%), but less than renewable energy more generally (87%). A Pew Research Center poll conducted in 2008 [
7] found that support for ethanol research had dipped to 57 percent from a 2006 level of 67 percent, with a lower percentage of respondents supporting it than favored improving automotive fuel efficiency (90%), or increasing funding for either alternative energy (81%) or mass transit (72%). However, support for ethanol research did exceed support for promoting more nuclear power (44%), tax cuts for oil exploration (42%), or increasing gasoline taxes (22%). This poll also showed that support for ethanol research funding was stronger among Independents, those who had attended college, and those living in the Midwest [
7]. In another 2008 poll, 59 percent of respondents favored continuing to increase the use of ethanol in our Nation’s fuel supply, while 30 percent opposed doing so [
5]. However, public support for ethanol subsidies has been found to be relatively weak with only 38 percent of the public favoring them [
4].
Several studies have examined consumer attitudes toward renewable fuels and the potential for these fuels to reduce reliance on foreign oil. Skipper,
et al. [
8] examined consumer perceptions of the tradeoff between food and renewable fuels in the US and Belgium. Results showed that respondents in both countries preferred lower food prices to lower fuel prices (67.6% in the US and 78.9% in Belgium). Their results also suggested that older respondents were more likely to choose lower food prices than lower fuel prices. Gender, education, and income level, on the other hand, did not significantly influence preferences for one over the other. Among the attitudinal variables, the stronger the consumer’s beliefs about the importance of domestic fuel production, the less likely they were to choose lower food prices over lower fuel prices.
Ulmer,
et al. [
9] used a stratified mail survey of 685 registered voters in Oklahoma to find that respondents generally considered cost to be more important than environmental impact, and environmental impact, in turn, to be more important than vehicle performance in their decision to purchase an ethanol blend. They also found that 59 percent of respondents viewed a reduction of dependency on imported oil as the greatest potential benefit from the use of ethanol blends, while nearly 58 percent believed that ethanol was better for the environment than gasoline. No significant correlation was found between willingness to purchase an ethanol blend and the respondent’s gender, education, income, age, or location of residence (rural or urban).
Van de Velde,
et al. [
10] investigated the views of Belgian consumers on the importance of various fuel characteristics along with consumer beliefs about biofuels. They found that fuel price, availability in fuel stations, safety, quality assurance, and environmental friendliness were perceived as very important to fuel choice by more than 80 percent of the respondents. However, whether the fuel was produced in-country was only rated as very important by about one-third of the respondents.
Li,
et al. [
11] found that energy security was also a concern among US residents, using data from both a national random digital telephone survey and an online survey. Based on the results of a contingent valuation exercise contained in the surveys, mean annual WTP, in the form of increased prices for electricity and gasoline, among US households for the creation of a fund that would invest in research and development for energy sources that were not reliant on fossil fuels was estimated to be $137. In addition, it was found that WTP was higher for females, liberals, those with higher incomes, and those who believed that it was important to reduce dependence on imported energy.
Solomon and Johnson [
12] reports the results of a survey of Michigan, Minnesota and Wisconsin residents that included a contingent valuation exercise to estimate WTP for ethanol produced from cellulosic feedstock. Respondent mean WTP for cellulosic ethanol was estimated to be $556 per capita per year, while median WTP was approximately 20 cents per gallon. Using the same survey, Johnson,
et al. [
13,
14] conducted a principal components analysis that identified seven different factors, including one titled “Energy Security” that grouped respondents based on their level of agreement (on a Likert scale of one to five) with the statements: “I am concerned about America’s energy security” and “America should produce all of its own energy”. However, when the factor loadings were regressed against WTP derived from a “Fair Share” valuation exercise, the Energy Security factor loadings were not statistically significant.
Petrolia,
et al. [
14] conducted a nationwide survey of consumer preferences for E10 and E85 using the contingent valuation methodology. They found that when the respondents were asked to choose the best approach to reducing gasoline consumption in the US, 51 percent of the respondents chose increased use of hybrid, fuel-cell, and other non-petroleum-based vehicles, 25 percent chose increased ethanol use, and 24 percent chose increased public transportation. They also found that 54 percent of the respondents believed that, compared to gasoline, increased use of E10 would have a positive effect on national security, while 45 percent believed that increased use of E10 would have little effect on national security, leaving only one percent who believed that increased use of E10 would have a negative effect on national security. Also, when given the choice for why the US should pursue an alternative-fuels program, 38 percent chose national security reasons (while 40 percent chose environmental reasons, 18 percent chose economic reasons, and 4 percent of the respondents saw no reason for the US to pursue an alternative fuels program). Estimated mean WTP for E10 ranged from 6.2 cents per gallon to 12.4 cents per gallon depending on the econometric method used, while mean WTP for E85 ranged from 13.1 cents per gallon to 15.2 cents per gallon.
Jensen,
et al. [
15] estimated WTP for E85 from various feedstocks from a contingent choice exercise contained in the same national, online survey of consumers used in this study. The choice exercise included E85 blends from three different feedstock sources (corn grain, switchgrass, and wood wastes) and an E10 blend (10 percent ethanol and 90 percent gasoline) with corn grain as the ethanol feedstock. Results from the study suggest consumers are willing to pay a premium for E85 from switchgrass compared with E10 from corn. WTP for E85 from switchgrass was nearly 1 cent per mile greater than E10 from corn, which translates to about 19 cents per gallon for a 20 mile-per-gallon vehicle. Concerns about land use for “food versus fuel” had a negative impact on WTP for E85 from corn grain, while greater concerns about fuel security relative to the environment had a positive impact.
4. Economic Model and Estimation
The analysis consists of two models. In the first model, the probability of choosing a given alternative given a set of fuel attributes is estimated. From these estimates, the WTP for fuel import levels (WTPI) is derived. In the second model, the willingness to pay for imported fuel reductions (WTPR, or −WTPI) is then regressed upon demographics and socioeconomic characteristics to ascertain market segments which may be willing to pay more for reducing import levels.
The modeling of product choice based upon product attributes draws from a discrete choice modeling literature built upon the assumptions that individuals choose the alternative providing them the greatest utility and that the utility generated by an alternative is a function of the various attributes of that alternative. Thus, for individual i, the utility received from alternative j can be expressed as:
Where Xij is a vector of observed attributes, β is a vector of marginal utility parameters, and εij is an error term that accounts for unobserved differences in individuals and alternatives.
The error term in Equation (1) is made necessary by the fact that individuals who are indistinguishable from each other on the basis of observed characteristics do not always choose the same alternatives. Many of the recent developments in discrete choice modeling have focused on reducing the restrictions imposed on the model by the heterogeneity in individual behavior. Mulinomial logit and probit models address this heterogeneity by assuming that individuals have homogeneous preferences for the alternatives’ observed attributes but heterogeneous preferences for unobserved attributes [
16]. Multinomial logit (MNL) assumes that the errors are independent and identically distributed (iid) across choices and individuals with extreme value distribution. For MNL, the probability of individual
i choosing alternative
j can be expressed as:
For MNL model, WTP for the mth non-price attribute is the negative of the ratio of the estimated parameters of attribute m and the price attribute, or
where
![Agriculture 02 00165 i004]()
is the estimated parameter of the
mth attribute and
![Agriculture 02 00165 i005]()
is the estimated price parameter.
The mixed logit model (ML) relaxes the assumption of homogeneous preferences for observed attributes and avoids the independence of irrelevant alternatives property by allowing the estimation of random or individual-level taste parameters ([
17,
18,
19,
20]). The representation of utility for ML is similar to Equation 1 except that the parameters are divided into a vector of mean attribute utility weights (
β) and a vector of individual specific deviations (
ηi) from these mean values, or
For the ML, WTP is estimated similarly to the MNL, using the means (
βs) of the estimated parameters. Hence in the case of Equation (4), consumers’ preferences for a particular attribute are allowed to vary individually, with the standard deviation of preferences for the attributes, (
ηi), being estimated along with the mean parameters on the attributes,
β. To this point, the model has been defined in “preference space” ([
21,
22,
23,
24]). However, because specification in preference space can pose some problems for WTP estimation, it is sometimes desirable to estimate the model in WTP space by setting the coefficient on the cost variable (
price in this study) to −1 ([
21,
25]). When this restriction is put in place, the WTP values on each attribute are directly specified, rather than having to take the ratio of the attribute’s coefficient divided by the estimated coefficient on price during post-estimation. The ML model was estimated using maximum simulated likelihood in the MIXLOGIT command [
26] in STATA, while the in-sample predicted values of the individual WTP estimates (WTP
I) were obtained using the estimates of
β and
ηi with MIXLBETA in STATA [
18,
26].
Once the individual values of WTP for the attribute of interest, import levels (WTPI), were obtained from the mixed logit, then a second model was estimated. In this second model, the WTP for import reductions (WTPR) was hypothesized to be a function of socioeconomic and demographic characteristics as well as attitudes toward fuel security, food security, and the environment. By regressing WTPR on the socioeconomic and demographic characteristics of consumers, enables investigation of how these variables impact the WTPR. The regression of the WTP for import reductions (WTPR) on the socioeconomic, demographic, and attitudinal variables was estimated using the REGRESS command in STATA.
5. Data
The data was collected from an online survey conducted via a MSN WebTV platform to a sample of members aged 18 or older of Knowledge Networks’ KnowledgePanel
®. The sample was designed to represent a general population sample. The survey was fielded on 16 January 2009 to 1425 panel members, 1010 responses were received, and 914 survived screening questions and provided useable responses. A more detailed description of sampling and survey methods is available in the field report from the survey [
27].
Respondents were asked to evaluate combinations of attributes for E85 ethanol blends in a contingent choice exercise. The exercise consisted of fourteen different choice tasks, with three of these that were constant across all respondents treated as holdout tasks. Each choice task had four alternative combinations of fuel attributes and respondents were asked to select their most preferred alternative from these four. In lieu of a “none” option (
i.e., the respondent would choose not to purchase any of the other three attributes), the fourth option in each choice task was a “fixed” alternative in which the attribute values did not vary from one choice task to another. The rationale for using the fixed alternative in lieu of a “none” option was that it was a better representation of the typical choice faced by automobile owners. The fuel blend for the fixed alternative was E10 (or a fuel blend composed of 10 percent ethanol and 90 percent gasoline). The other three alternatives were all E85, but varied in terms of fuel price ($/gallon and ¢/mile), ethanol feedstock, percent of fuel from imported sources, level of GHG reductions compared with E10, and availability of the fuel nearby. Price per mile was calculated using an example vehicle that gets 20 miles per gallon (MPG) with E85. The price levels used for the E85 alternatives were 6.7, 7.1, 7.5, 7.9, and 8.3 cents for each mile driven, while the fixed E10 alternative was priced at 7.5 cents per mile. Assuming a 20 mile per gallon vehicle, these prices per mile convert to $1.34, $1.42, $1.50, $1.58, and $1.66/gallon for E85 and $2.00/gallon for E10. These prices were based upon prevailing gasoline and ethanol blends at the time of the survey [
28]. The feedstocks for the ethanol in the E85 blends could come from a variety of feedstocks (including cellulosic), while the feedstock for the E10 blend was corn. The percentages of fuel from imported sources were 10, 33, and 50 percent, with the E10 alternative described as being 60 percent from imported sources. The levels of emissions reductions were 10 percent, 50 percent, and 73 percent compared with E10. Availability of the E85 alternative was stated as being located at a fuel station that was “on your way” or either 2 or 5 min “out of your way”. Work by Kitamura and Sperling [
29] suggests that most people prefer to refuel within 5 min from their origin or destination, with these trips accounting for 71.9% of refueling trips. The fixed E10 alternative was described as being available at a station that was 2 min out of the way. Names, definitions, and means of the fuel attribute variables are provided in
Table 1. Note that in this analysis each choice task completed by each individual respondent represents an observation and that the number of observations (10,027) is less than the total number of possible observations (10,054), or the product of the number of respondents (914) and the number of choice tasks (11) because a few respondents failed to complete all 11 choice tasks.
Data regarding respondent attitudes and demographics was also obtained (See
Table 1). This information was used to measure how WTP for imported fuel reductions might systematically vary across respondent views on food and fuel security and the environment, as well as demographic characteristics and behavior related to automobile ownership and driving patterns. As may be noted from
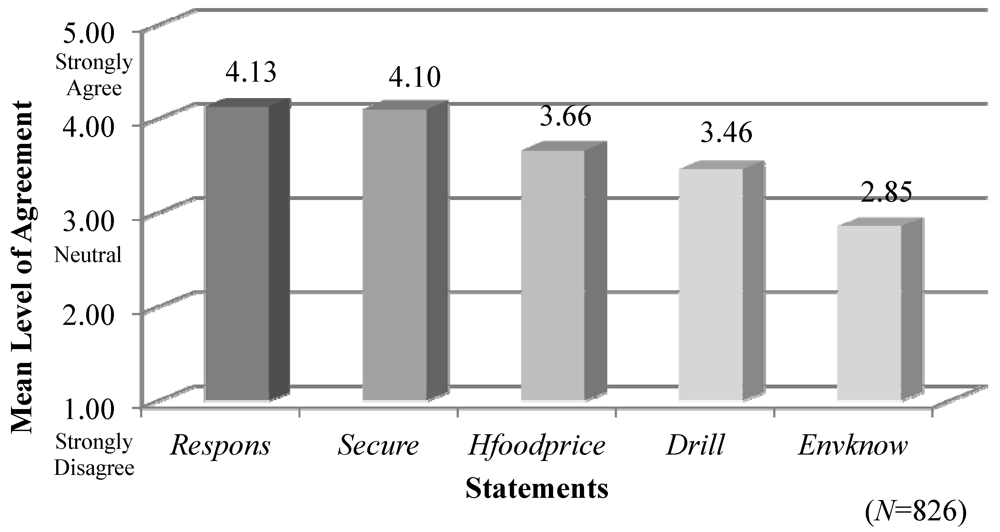
Table 1, this set of observations is for each individual respondent, rather than completed choice task. The number of observations (826) is less than the number of respondents who completed choice tasks (914) because it includes the number for which data was available for all explanatory variables included in the regression of individual WTP on individual characteristics. The attitudinal variables included the extent of respondent agreement with statements about reducing US dependence on foreign oil and national security, effect of corn ethanol on food prices, additional oil drilling, responsibility to protect the environment for future generations, and perceived level of knowledge about the environment. Demographics included gender, political party, urbanization, household income level, age, race, education level, regional location, household size, and head of household status. Automobile and driving behavioral variables included fuel efficiency of primary vehicle, frequency of carpooling or use of public transportation, and ownership or planned ownership of a hybrid vehicle.
Table 1.
Names, definitions, and means of variables used in the models.
Table 1.
Names, definitions, and means of variables used in the models.
| Variable Name | Definition | Mean |
|---|
| Mixed Logit on Choice | (
N = 10,027) |
| Price | 6.7, 7.1, 7.5, 7.9, and 8.3 cents per mile | 7.499 |
| Import | 10%, 33%, 50%, and 60% | 38.228 |
| Emission | 0%, 10%, 50%, and 73% reductions compared with E10 | 33.243 |
| Availability | 0, 2, or 5 minutes out of way | 2.248 |
| E85 | 1 if E85, 0 otherwise | 0.750 |
| Regression on WTPfor Import Reductions (WTPR) | (
N = 826) |
| Respons | We have a responsibility to future generations to protect the environment (1 if strongly disagree,…, 5 if strongly agree) | 4.1281 |
| Secure | Reducing our dependence on foreign oil is important to improving our national security (1 if strongly disagree,…, 5 if strongly agree) | 4.1004 |
| Hfoodprice | Increasing ethanol production from corn will lead to higher food prices (1 if strongly disagree,…, 5 if strongly agree) | 3.6621 |
| Drill | More land in the US should be opened up for oil drilling (1 if strongly disagree,…, 5 if strongly agree) | 3.4624 |
| EnvKnow | I don’t have enough knowledge to make well informed decisions on environmental issues (1 if strongly disagree,…, 5 if strongly agree) | 2.8544 |
| Age | Age in years | 46.1434 |
| Female | 1 if female, 0 otherwise | 0.4824 |
| Political Party | 1 if strong Republican,…, 7 if strong Democrat | 4.0305 |
| Female*Polit | Interaction between Female and Political Party | 2.0799 |
| Metro | 1 if reside in an MSA, 0 otherwise | 0.8258 |
| Lhs | 1 if less than high school graduate, 0 otherwise | 0.1052 |
| HS | 1 if high school graduate but less than college, 0 otherwise | 0.3007 |
| College | 1 if college education, 0 otherwise (omitted category) | 0.5940 |
| Inc025 | 1 if household income <$25,000, 0 otherwise | 0.1808 |
| Inc2550 | 1 if household income $25,000–$49,999, 0 otherwise (omitted category) | 0.3008 |
| Inc5075 | 1 if household income $50,000–74,999, 0 otherwise | 0.2256 |
| Inc75 | 1 if household income ≥$75,000, 0 otherwise | 0.2928 |
| White | 1 if white, 0 otherwise (omitted category) | 0.7635 |
| Black | 1 if black, 0 otherwise | 0.0757 |
| Hispanic | 1 if Hispanic, 0 otherwise | 0.1003 |
| Orace | 1 if other race, 0 otherwise | 0.0605 |
| HHead | 1 if head of household, 0 otherwise | 0.7905 |
| HHSize | Household size | 2.5705 |
| New Eng | 1 if state is CT, MA, ME, NH, RI, or VT, 0 otherwise | 0.0604 |
| Ostates | 1 if state is DC, DE, GA, MD, NJ, NY, NC, PA, SC, or VA, 0 otherwise (omitted category) | 0.2417 |
| MidSouth | 1 if state is AR, KY, TN, WV, 0 otherwise | 0.0548 |
| Oil | 1 if state is LA, OK, or TX, 0 otherwise | 0.0951 |
| Gulf | 1 if state is AL, FL, or MS, 0 otherwise | 0.0854 |
| MidWest | 1 if state is IA, IN, IL, KS, MI, MN, MO, ND, NE, OH, SD, WI, 0 otherwise | 0.2464 |
| West | 1 if state is AK, AZ, CA, CO, HI, ID, MT, NM, NV, OR, UT, WA, or WY, 0 otherwise | 0.2162 |
| MPG | Gas mileage of primary vehicle, 1 if <16 MPG, …, 6 if ≥33 MPG | 3.3473 |
| Hybrid | 1 if own or plan to purchase a hybrid vehicle, 0 otherwise | 0.0912 |
| Carpool | Frequency of carpooling, 1 = Never, …, 6 = 3 or more times per week | 1.7712 |
| PubTrans | Frequency of using public transportation, 1 = Never, …, 6 = 3 or more times per week | 1.6287 |
| MetroPubTrans | Interaction between Metro and Pubtrans | 1.4219 |
A number of the demographic variables in
Table 1 can be compared with the 2010 Census [
30]. Among the respondents about 48.12 percent were 18 to 44 years old, 36.03% were 45 to 64 years old, and 15.85 percent were 65 and older. This age distribution is similar to that of the 2010 Census data with 48.09 percent being 18 to 44 years old, 34.74 percent 45 to 64 years old, and 17.17 percent 65 and older. About 50.8 percent of the population is female according to the Census, while 48.24 percent of the respondents were female. According to the 2010 Census, 72.40 percent of the population is White, while 76.35 percent of the respondents used in the regression were White. While about 7.57 percent of the respondents were Black, the percent in the US according to the Census is 12.6. Our numbers are somewhat different, perhaps in part due to the fact that our respondents are limited to those 18 and older. According to the Census, about 80.70 percent of all people live in urban areas, while 82.58 percent of the survey respondents resided in urban areas. Average household size from the Census was 2.58 persons, while the average household size among the respondents was 2.57 persons.
We hypothesize that greater concerns about the environment (
Respons) and fuel security (
Secure) will both positively affect
WTPR. However, respondents who are concerned about pressure on food prices from ethanol development (
Hfoodprice) or support increased oil exploration or drilling (
Drill) will be less willing to pay to reduce imported fuel. It is hypothesized that those with less knowledge about environmental issues may place a higher priority on fuel security, thus resulting in a positive correlation between
EnvKnow and
WTPR. Skipper,
et al. [
8] found that older respondents were more likely to choose lower food prices than lower fuel prices; hence one might expect food security to have relatively greater importance over fuel security for older respondents and
Age to have a negative effect on
WTPR. Li,
et al. [
11] found WTP for renewable energy was higher for females, liberals, and those with higher incomes. Therefore, it is hypothesized that being female (
Female), and having a higher income will have a positive effect on
WTPR. Hence, compared with the most common income category (
Inc2550), the lower income category (
Inc025) will have a negative sign, while the higher income categories (
Inc5075, Inc75100) will likely carry positive signs. The sign on Democratic leanings (
Political Party) is not hypothesized
a priori. College education (
College) has been shown to have a positive effect on WTP for ethanol research funding [
7], and it is hypothesized that education levels below this (
Lhs and
HS) will have negative effects on
WTPR. No
a priori hypotheses are drawn about the effects of race/ethnicity (
Black,
Hispanic, or
Orace). Regional variables were included to measure the effects that being located in various parts of the US may have on
WTPR. For example, being from oil producing and refining states (
Oil) or Gulf states (
Gulf) impacted by offshore drilling might influence
WTPR. Respondents residing in economies more reliant on oil drilling might be expected to have a negative influence on
WTPR. Yet, part of their economies is also reliant on refining imported oil, so the potential impacts are less clear. On the other hand, residing in the Midwest (
MidWest), where most ethanol and feedstock production occurs, could be expected to have a positive influence on
WTPR or support ethanol research funding, as has been shown in previous research [
7]. Household size (
HHSize) may be negatively correlated with
WTPR as larger household size may imply additional budget pressures. Being the head of household (
HHead) could have a negative influence also as the head of household is likely responsible for paying household fuel bills.
Several automobile/driving behavioral variables were also included. In each case, the variable represents a potential means toward controlling fuel use. If the respondent has a highly fuel-efficient vehicle (MPG), the respondent may be less likely to be willing to pay to reduce import levels if he or she views fuel efficiency as a sufficient or better means to reduce imported fuel use. Driving a fuel efficient vehicle could also signal cost consciousness regarding fuel use. Another means for controlling fuel use is ownership of a hybrid vehicle. Therefore, current or intended ownership of a hybrid vehicle (Hybrid) is hypothesized to have a negative influence on WTPR. Two other variables, use of public transportation (PubTrans) and carpooling (Carpool) would be expected to have similar negative effects on WTP. The variable MetroPubTrans was included to examine how the effects of being in a metropolitan area and using public transportation might jointly impact WTPR. The variable Metro represents respondents living in metropolitan areas where there may be more opportunities to use public transportation, therefore it might carry a negative sign. When interacted with Pubtrans, this would reflect living in metro areas where public transportation is more readily used and the respondents actually do use it more frequently.
7. Conclusions
Although the American public generally agrees that energy security is a concern [
27], there is much less agreement on what to do about it. One way to ameliorate some of the concerns over energy security is to increase the domestic production of alternative fuels. However, public opinion polling suggests that the public’s attitudes toward ethanol, the most widely available alternative fuel, are mixed. This study examines how consumers view import levels in fuel, in choosing between a blend closely representing the national blend as it currently stands (around 10 percent ethanol) [
31] and different “varieties” of an 85 percent ethanol blend. The results from the study suggest that consumers significantly discount fuel derived from imported sources. In addition, preferences for import reductions in fuel appear to be driven at least in part by concerns over fuel security and the environment as those who were more concerned about these issues were willing to pay more for reduced imports than those who were not as concerned. The results also support the notion that there are likely to be demographic and regional differences in consumer willingness to pay for reductions in import levels. The lowest income consumers, those in metro areas, and in larger households are less willing to pay, while being female and having a high school education have a positive effect on willingness to pay. Consumers in the Midsouth (Arkansas, Kentucky, Tennessee, and West Virginia) are generally willing to pay more for these reductions than those from the eastern seaboard area. Interestingly, those consumers driving hybrids and achieving higher miles per gallon were less willing to pay, hence they may believe that driving more fuel efficient vehicles is a preferred avenue to reduce imports compared with paying a premium for import reductions. The significance of these two variables (
Hybrid and
MPG) suggest that future survey research might include questions enabling comparisons of perceived effectiveness of a fuel price premium, requiring higher fuel efficiency vehicles, providing incentives for additional domestic drilling, or incentives for alternative fuels development at reducing the US reliance on imported fuels.
While the magnitude of the willingness to pay estimates from a hypothetical market study such as this one should be interpreted cautiously, the premium that consumers appear to be willing to pay for lower import levels suggests that public attitudes toward, and consumer preferences for, ethanol may depend, in part, on awareness that it is domestically produced. The extent to which consumers and the public associate increased ethanol content in fuel blends with lower fuel import levels is largely unknown and worthy of further investigation as it could be an important motivator of public opinion of and consumer preferences for fuel blends with higher ethanol content. Similarly, a fuller exploration of the factors that motivate consumer preferences for lower import levels in fuel blends could improve our understanding of US public and consumer acceptance of ethanol as an alternative to fossil fuels. The positive WTP for import reductions through E85 is suggestive that further broader research examining WTP for import reductions through a variety of fuel alternatives or technologies would be of policy interest. It should also be noted that this study represents a snapshot in time of US consumers’ preferences. As discussed earlier in this paper, current events of the time, such as the 2010 oil spill in the Gulf of Mexico, can influence consumer attitudes. Hence, the preferences measured in this paper may not represent consumers’ attitudes ensuing into the future.


 is the estimated parameter of the mth attribute and
  is the estimated price parameter.
