Article

Biochar for Soil Improvement: Evaluation of Biochar from Gasification and Slow Pyrolysis

Energy Research Centre of the Netherlands (ECN), P.O. Box 1, 1755 ZG Petten, The Netherlands
*
Author to whom correspondence should be addressed.
Agriculture 2015, 5(4), 1076-1115; https://doi.org/10.3390/agriculture5041076
Submission received: 21 September 2015 / Revised: 13 October 2015 / Accepted: 13 October 2015 / Published: 5 November 2015
(This article belongs to the Special Issue Effects of Biochar on Soil Fertility and Crop Production)

Abstract

:
The growing need for food, energy and materials demands a resource efficient approach as the world’s population keeps increasing. Biochar is a valuable product that can be produced in combination with bio-energy in a cascading approach to make best use of available resources. In addition, there are resources that have not been used up to now, such as, e.g., many agro-residues that can become available. Most agro-residues are not suitable for high temperature energy conversion processes due to high alkali-content, which results in slagging and fouling in conventional energy generation systems. Using agro-residues in thermal processes, therefore, logically moves to lower temperatures in order to avoid operational problems. This provides an ideal situation for the combined energy and biochar production. In this work a slow pyrolysis process (an auger reactor) at 400 °C and 600 °C is used as well as two fluidized bed systems for low-temperature (600 °C–750 °C) gasification for the combined energy and biochar generation. Comparison of the two different processes focuses here on the biochar quality parameters (physical, chemical and surface properties), although energy generation and biochar quality are not independent parameters. A large number of feedstock were investigated on general char characteristics and in more detail the paper focuses on two main input streams (woody residues, greenhouse waste) in order to deduct relationships between char parameters for the same feedstock. It is clear that the process technology influences the main biochar properties such as elemental- and ash composition, specific surface area, pH, in addition to mass yield quality of the gas produced. Slow pyrolysis biochars have smaller specific surface areas (SA) and higher PAH than the gasification samples (although below international norms) but higher yields. Higher process temperatures and different gaseous conditions in gasification resulted in lower biochar yields but larger TSA, higher pH and ash contents and very low tar content (16-PAH). From the feedstock data looked at in more detail, a few trends could be deducted in the attempt to learn how to steer the biochar characteristics for specific uses.

1. Introduction

1.1. Background

The growing need for food, energy and materials demands a resource efficient approach as the world’s population keeps increasing. At the same time, counter-measures for increasing greenhouse gas (GHG) emissions and related climate change are imperative. Co-production of bioenergy and products in a cascading approach will achieve a more optimized use of resources while at the same time limiting the overall GHG emissions. Resources not used up to now, such as, e.g., many agro-residues need to be taken into account and new strategies must find a balance in agricultural applications, energy plus materials production and environmental effects. Part of the solution can be provided by extending the use of biomass not only for bio-energy but also for biochar as a soil amendment [1]. The EU recognizes biochar as a valid technology for long-term carbon storage in soils therefore aiming towards climate change mitigation [2]. In addition, the use of biochar as a soil amendment is a promising agricultural practice that reduces N losses achieving a more effective N fertilizer use, and at the same time promotes soil organic carbon (SOC) accumulation in soils [3]. The application of biochar as a soil amendment could even bring areas lost for agriculture back into production by compensating for acidity, too low organic carbon and water retention [4].
When reviewing the available and quickly growing literature on biochar, many different discipline angles and levels of detail become apparent. Some of the earlier literature focuses directly on plant growth responses and agricultural yields when using biochar as a soil amendment, which improvement is the main aim for using biochar in the first place [2,3,4,5]. However it quickly becomes apparent that soil type, soil structure and climate are important. The studies on the effect that biochar has on soil function and -processes then includes crop yield from multi-year field experiments (e.g., [6,7,8]), possible priming effects on soil organic matter (e.g., [9]), and effect on soil emissions and C stability [10]. Studies on the effect of well characterized biochars on crop yields in various soil types including acidic, low activity soils in the tropics and temperate soils are examined in [11,12,13,14,15,16]. Results show that biochar has a positive effect on some soil due to the liming effect and associated increased availability of nutrients but in other soils application of biochar produced phytotoxic effects due to excessive soluble salts and high pH. Plant growth responses in the acidic soils were most evident but demonstrated a strong contrast to one another. The crop yield increases are attributed to the ability of certain high nutrient biochar to increase N availability [17].
Because biochar is not always applied purely but also mixed with manures, minerals fertilizers and compost [18,19,20,21], another wealth of data becomes available from trails that, however, also contribute to the complexity to explain the observed effects.
Where earlier work on soil and crop effects often considered biochar as a fixed-high C product, biochar producers and researchers quickly started publishing data on the variations that could be obtained in the biochar when varying production parameters such as temperature and feedstock. Spokas et al. [22] present a literature survey reviewing the effects biochar on plant growth. In [23] results showed a significant influence of production processes on biochar properties, and identified threshold values suitable for soil amendment and carbon sequestration. The awareness that biochar can have different characteristics adds yet another level of complexity because no longer does biochar addition to the soil only depend on the location dependent variables (soil type, soil structure, climate, other fertilizers and crop) but biochar characteristics play a role in the total suite of interaction processes as well.
The growing level of complexity is a good example of how young the research topic on biochar is, but also how quickly this multi-disciplinary topic is coming to maturity. In an attempt to shed some light on possible relationships that can steer the use of biochar to a higher success rate, a number of reviews and meta-analyses have been performed on large parts of the available dataset in literature. The meta-analysis and reviews by Jeffery [24], Biederman [25] and Verheijen et al. [26,27] analyze in detail and summarize the current status on biochar research attempted a correlation among feedstock, process conditions, biochar properties and effect on soil fertility, their results imply that available data are not coherent enough to draw conclusions on the relation among parameters that influence biochar quality during production and effect of biochar on various soils. This is likely due to the steep learning curve which has led to the insight that more parameters per biochar need to be analyzed and that these have to be done in a consistent way. This study aims at enlarging the most recent dataset and to analyze the produced biochars in an internationally consistent way. The next questions to answer then are: how to achieve the variations during production and what to analyze for?

1.2. Production-Dependent Biochar Properties

First of all, a number of parameters are recognized that will largely contribute to different biochar properties. These are: (i) The feedstock and its original pore size and ash content, (ii) Temperature of production, (iii) The type of conversion process, more specifically the presence of a liquid or gas phase and the type of gas being present, (iv) Residence time at elevated temperature, and (v) practical procedure parameters (other than temperature and residence time).
Several studies confirm that the nature of the feedstock is a key factor for understanding the differences in the elemental composition and functionalities of the biochars which in turn has an impact on the performance of the various biochars as soil amendment; [28,29,30,31,32,33,34]. The original pore structure will be maintained under a large range of temperature- and gas conditions. For many biochars then the porosity is linked to the parent material and when a specific porosity (size distribution or volume) is required for a certain functionality, a good starting point is the structure of the parent material. The same is largely true for the ash content. For the lower temperature regime (400–600 °C) the parental ash composition will be found nearly identical in the biochar under slow pyrolysis and gasification conditions while for the higher temperatures (realistically up to 850 °C), knowledge from bio-energy processes learns that alkali (Na and K) and chlorine may be evaporated to a smaller or larger degree while other elements nearly completely stay in the solid (biochar) fraction.
The temperature of production has been shown to be the most important parameter in the ratio of labile to stabile carbon and by being the key parameter for devolatilization processes it largely determines the molar ratios of H/C and O/C as well as the surface area of biochar.
The variation in thermochemical conversion processes can be associated with various parameter differences, however, the most essential in giving a name to a certain process seems to be the gaseous or liquid environment. While pyrolysis is a process that excludes the additional input of an oxidant stream and thus exposes the produced biochar to its own product gas, gasification uses a sub-stoichiometric amount of oxidant (commonly air or steam), which has an enormous impact on the biochar characteristics. Hydrothermal carbonization occurs in a liquid environment under pressure, which also results in very different chars compared to the chars created in a gaseous environment, see, e.g., [35,36].
Residence time is an influential factor within a certain conversion technology, especially slow-pyrolysis versus flash pyrolysis. Also, in hydrothermal carbonization, the residence time has a direct effect on the physicochemical characteristics of the product. Residence time as a variable for comparing and evaluating processes is less straightforward to use though, when comparing chars from gasification and pyrolysis, as will be further investigated in this study. The process environment (composition of reactants) affects to a larger extent the physicochemical properties of the produced biochar than the residence time does, as an example, under gasification large porosity volumes and a high de-volatilization state can be achieved in very short time (seconds to minutes) even when using the same temperature as in slow pyrolysis.
The practical procedure and apparatus specific issues (other than residence time/temperature or gas/liquid environment) are hardly ever considered as being important for the biochar quality and characteristics. By practical procedure and apparatus specific issues we mean the feeding of feedstock, heating and cooling protocols (incl. trace heating), co-current or counter-current flow of the gas and char streams, temperature gradients in the installation, leak-in of air, the type of installation (rotation drum/screw pyrolyzer, etc.) and the position where the biochar is “harvested”. Especially the separation of gas and biochar, the cooling procedure in combination with the location of biochar harvesting are expected to be of key importance to the amount and types of PAH (poly-aromatic hydrocarbons) that condense on the biochar and hence influence an important quality parameter of the biochar. The latter is also further investigated in this paper.

1.3. Agronomical Important Parameters of Biochar

The above described production variations (feedstock used, temperature, reactor technology, residence time and practical procedure) affects the main biochar properties such as surface area, pore volume, pore (size) distribution, pH, cation exchange capacity (CEC) and surface functional groups, chemical structure and the form of carbon (aromatic or non-aromatic C) and elemental composition (available nutrient content such as Ca, P, K) [37,38,39]. These properties are believed to determine the quality of a given biochar as soil improver [31].
The link between biochar properties and its function as soil improver is well illustrated by the relation between water holding capacity of soils and biochar porosity. Some studies, e.g., [40] suggested that the increased porosity of biochar increases water retention in soils, depending on biochar feedstock, soil type, and blend rates. Nutrients dissolved in the water may be retained in the soil and therefore accessible to plants [4]. The ability of biochar to increase water-holding capacity will have profound effects on areas prone to drought [41]. Other studies link positively the use of biochar with increased water-holding capacity of soil [42,43,44] leading to improved crop productivity due to elevated soil moisture in reduced irrigated regimes. It was observed that hydrophobicity is well-correlated to the presence of C–H functional groups on the surface of biochar particles [45,46]. Therefore focus should be given on the control of water holding capacity and hydrophobicity by choice of pyrolysis temperature. However, water holding capacity cannot be fully explained based on either the chemical composition of surface groups or the micropore structure of the biochars but rather a combination of factors that still is fully to be elucidated. The high pH biochars have been recognized as providing a positive liming effect on acidic soils [32]. The difference in pore sizes in biochar are likely to be important for processes that adsorb polluting elements (heavy metals or PAH), for the interaction with organic complexes (organic matter) but also for the water holding capacity. The filtering and adsorption qualifications are likely to involve different pore sizes and pore distributions than the water holding capacity where water must also be released again. As stated by Jeffery et al. [47] not all functionalities can be obtained at the same time and choices have to be made for different benefits.

1.4. Environmental and Economic Aspects of Biochar Production and Use

When aiming for carbon storage by biochar as soil amendment, the recalcitrant carbon fraction must have a long-term stability in soil [12]. The volatile and ratios H/C and O/C are good indicators of the degree of carbonization but poor predictors of the agronomic properties of biochar. From an environmental and economic point of view it makes sense to balance the requirements for carbon storage with those required by the local ecosystems (plants and soil creatures) and/or local crop growth. Some literature [48] already links biochar production conditions on biochar yield and properties particularly its long-term stability and identifies the necessary modification steps for converting organic waste to agricultural use biochar and [49] links all reported biochar properties with the agronomic and environmental benefits in an engineering tool that aims to optimize the production of biochar on spec. Still much more information is needed since not all interaction processes of biochar with soil are understood and the relation of soil/biochar and soil life, fungi, bacteria is even more complicated.
When considering environmental and health safety, two main voluntary initiatives, the International Biochar Initiative (IBI) and the European Biochar Certificate (EBC) [50,51] have defined production criteria and biochar properties and limits on hazardous pollutants to prevent just any black stuff to be used as biochar. Those guidelines (IBI and EBC) provide mainly safety and quality criteria, aiming to prevent cutting down native forests to produce biochar, to exclude production processes with high pollutant emissions and to prevent biochar with high amounts of toxic elements (PAH, dioxins/furans, VOC) from entering the food chain. In particular, the EBC defines some elemental limits, such as a total organic carbon mass fraction >50% and O/C and H/C ratios <0.4 and 0.6, respectively; furthermore, heavy metal thresholds and limits for PAH (<12 mg·kg−1), PCB (<0.2 mg·kg−1), PCDD, and PCDF (<20 ng·kg−1) are provided.
Life cycle analysis and feasibility studies consider gasification or pyrolysis plants co-producing biochar [22,52,53,54,55], and make greenhouse gas balances of the total chain from forestry management to the field distribution of the resulting biochar. All show the potential of biochar to improve resource efficiency. Focusing on the value of CO2 reductions, Gaunt and Lehmann [56] determined that biochar application to agricultural land would provide greater GHG emission reductions than using the char for electricity generation, assuming (1) a fertilizer reduction of 10%, which would result in a reduction in N2O emissions of 50% compared to a case without any treatment and (2) the effect of biochar would remain for 10 years after application. If the cost of CO2 emissions is also considered not only the environmental balance but also the economic balance will become considerably attractive in favor of biochar co-production [57].
Some literature exists on the use of biochar as a co-product from biomass gasifiers [58,59]. The results from these studies seem promising regarding the possibility to combine an efficient bioenergy production with carbon sequestration and soil quality improvements. Low temperature gasification offers an option to use novel residual biomass streams from agriculture activities with low ash melting temperatures, compared with conventional combustion processes [59]. However, more information is needed for a thorough evaluation. In their work [60,61] Shackley et al. assessed the biochar from the gasification of rice husks at paddy mills in field and pot trials and the results suggest that the gasification-biochar systems offers an option to improve crop productivity, while providing a more sustainable disposal route for the low value biomass streams, otherwise often left to decay. We believe that the optimized resource-efficient way of making both energy and biochar may also help facilitate the biochar market introduction from a cost perspective. Ultimately the division of the feedstock going to energy and the fraction going to biochar will be determined by the market price of the products but also by the quality of the biochar required. The creation of sufficient porosity and stabile carbon will require a large part of the feedstock to be devolatilized, therefore the quality of the biochar and the yield will not be completely decoupled. The composition of the co-produced syngas needs to have sufficient energy content and be produced at a constant quality to be considered as a reliable energy source. Both products, no doubt, will have their own optimum. The precondition that the biochar must be a valuable and safe product is the first priority in this paper but at the same time experimental data are already gathered for the optimum division on biochar and bio-energy production from the experiments described here, to make sure that biochar quality is an important parameter in the optimum biochar/energy division question in a next paper.
From the above review, we can draw a few important conclusions. First, research on the effect of various biochars applied to soil is encouraging but still inconclusive, as the numerous influencing parameters such as, e.g., feedstock/process conditions and biochar/soil interaction cannot be directly linked with the results observed in field trials. Standardization is of key importance when results of more than one study are compared. Furthermore, the production of biochar is unlikely to be of a “one size fits all” character. This requires an understanding of which specific biochar characteristics are necessary for what application as well as good process control to direct the biochar production to the desired design qualifications. In addition, economic drivers will ask for an optimized division between char and bio-energy production that might be different than the optimized biochar quality conditions, although these are not completely decoupled either.

1.5. Scope of the Paper

The main driver of our work is the production of biochar in combination with energy in the frame of optimum use of agricultural and woody residues in a cascading approach to achieve higher resource efficiency than to date. By systematic variations on feedstock, conversion technology (pyrolysis or gasification), gaseous environment and temperatures it is aimed to establish relationships between production parameters and char qualifications. As the overview given above shows, there is no “one size fits all” for biochar, the coupling of biochar characteristics with known production parameters can lead to designer chars, qualified for an application of choice and adjusted for the local soil, climate and vegetation. Since the number of data in this study will be insufficient to establish all the relationships needed, it also aims to contribute to the existing world-wide dataset produced and analyzed in similar ways, as suggested by the International Biochar Initiative and the European Biochar certificate [50,51] (IBI and EBC) in order to address sufficiently all safety and quality criteria. Most available biochar characterisations in literature are from biochars produced by slow pyrolysis processes. To be able to compare experimental data on our biochars with the available data in literature, slow pyrolysis experiments were performed. However, as explained in the previous paragraph, the use of an oxygen containing input gas stream (air or steam) will allow for more variation in both the quality of the biochars and the choice in energy/biochar production division, therefore the main effort of our work focused on gasification tests. In order to set up a test matrix to compare slow pyrolysis versus gasification it is important to realize that these processes have their optimum at different temperature regimes. Therefore, the temperature conditions for slow pyrolysis were chosen at 400 °C and 600 °C, while low temperature gasification was operated at 600 °C and 750 °C allowing a comparison of the two technologies at 600 °C using the same feedstock.

2. Materials and Methods

2.1. Selected Feedstock

A large number of biochars from variable feedstocks were produced in the slow pyrolysis and the lab- scale gasification reactors in an effort to evaluate residual biomass streams for their suitability as biochar. Greenhouse waste from pepper (GHW 1) and tomato (GHW 2) cultivation as well as residual woody biomass from garden waste (wood SBB) and beech wood were then selected for detailed characterizations and production technology upscale, studying comparatively the effect on final biochar quality. Table 1 shows the prevailing temperatures for each feedstock and process (pyrolysis, gasification) for the biochar production. The characterizations of all materials are shown on Section 3.1.1.
The main feedstock used in this study is Greenhouse waste from pepper cultivation, shipped from the greenhouse areas in south of Spain, the largest concentration of greenhouses in the world, covering 26,000 hectares, by the research center of Tecnova, in Almeria. Several tons of greenhouse wastes are produced there annually as more than half of the Europe’s demand for fresh fruits and vegetables are grown in Almeria, boosting the province of Almeria’s economy. It represents a biomass waste that accumulates in enormous amounts and in several instances becomes a problem for the greenhouses that look for ways to handle and valorize this waste. Greenhouse waste may contain inorganic material (rope, wire) that may alter its ash composition and therefore quality regarding soil applications.
Another greenhouse waste tested only in blends with a maximum mass fraction of 20% input was tomato waste, from growers in the Netherlands in the region of Bleiswijk, as shown in Table 1. The mass fraction was limited because of its high ash and alkali content. Beech wood pellets (Rettenmaier Räucher Gold HBK 750/2000, company JRS, J. Rettenmaier & Söhne, Unternehmensgruppe, Rosenberg, Germany) was used as the first fuel after a scaling up exercise from the smaller to the larger lab-scale biochar production unit because this is used as a standard fuel at ECN for detailed characterization. The beech is of constant quality and particle size distribution and therefore very suitable for a first characterization. Wood and municipal garden clippings (also called green waste) is also a large stream that accumulates in and around large urban areas. It consists of woody material, mostly branches and small stems. The woody waste tested at the larger lab-scale facility in his study is normally burned in the city-heating installation of Purmerend, province North-Holland in the Netherlands. In this work this material is named wood SBB. Furthermore, Oak wood was obtained in the framework of the EU FP7 Project FERTIPLUS [62]. Finally, two types of manure (swine and chicken from farms in the Netherlands) as well as rice husk obtained from a large rice producing company in North Greece, were used in the smaller lab-scale fluidized bed reactor to evaluate their suitability for biochar. The manure and rice husk streams are very high in ash and nutrients so their use for biochar production is arguable as their physical and chemical characteristics will not comply to the definition given by IBI and EBC [50,51]. Those are rather high nutrient carbon materials that can function as fertilizers. The characterization results are shown for comparison with the biochars obtained for the lower-ash/higher carbon feedstock (woody feedstock).
Table 1. Pyrolysis and gasification conditions.
(a) Slow Pyrolysis Reactor
Residence time: 60 min. Inert atmosphere (O2 0%)Residence time: 60 min: Inert atmosphere (O2 1%)
Greenhouse Waste (Pepper, GHW 1)400 °C600 °C-600 °C
Oak Wood400 °C600 °C--
(b) Small Lab-Scale Fluidized Bed
Fluidizing agent: NitrogenFluidizing agent: AirFluidizing agent: Steam
Greenhouse Waste (Pepper, GHW 1)600 °C750 °C600 °C750 °C600 °C750 °C
Rice Husk (RH)---750 °C750 °C
Chicken Manure (CM)---750 °C750 °C
Swine Manure (SM)---750 °C750 °C
(c) Larger Lab-Scale Fluidized Bed
Fluidizing agent: Air
Greenhouse Waste (Pepper, GHW 1)670 °C750 °C
Wood SBB670 °C-
Wood SBB and GHW 2 (Blend 80% 20%)670 °C-
Beech Wood and GHW 2 (Blend 80% 20%)670 °C-

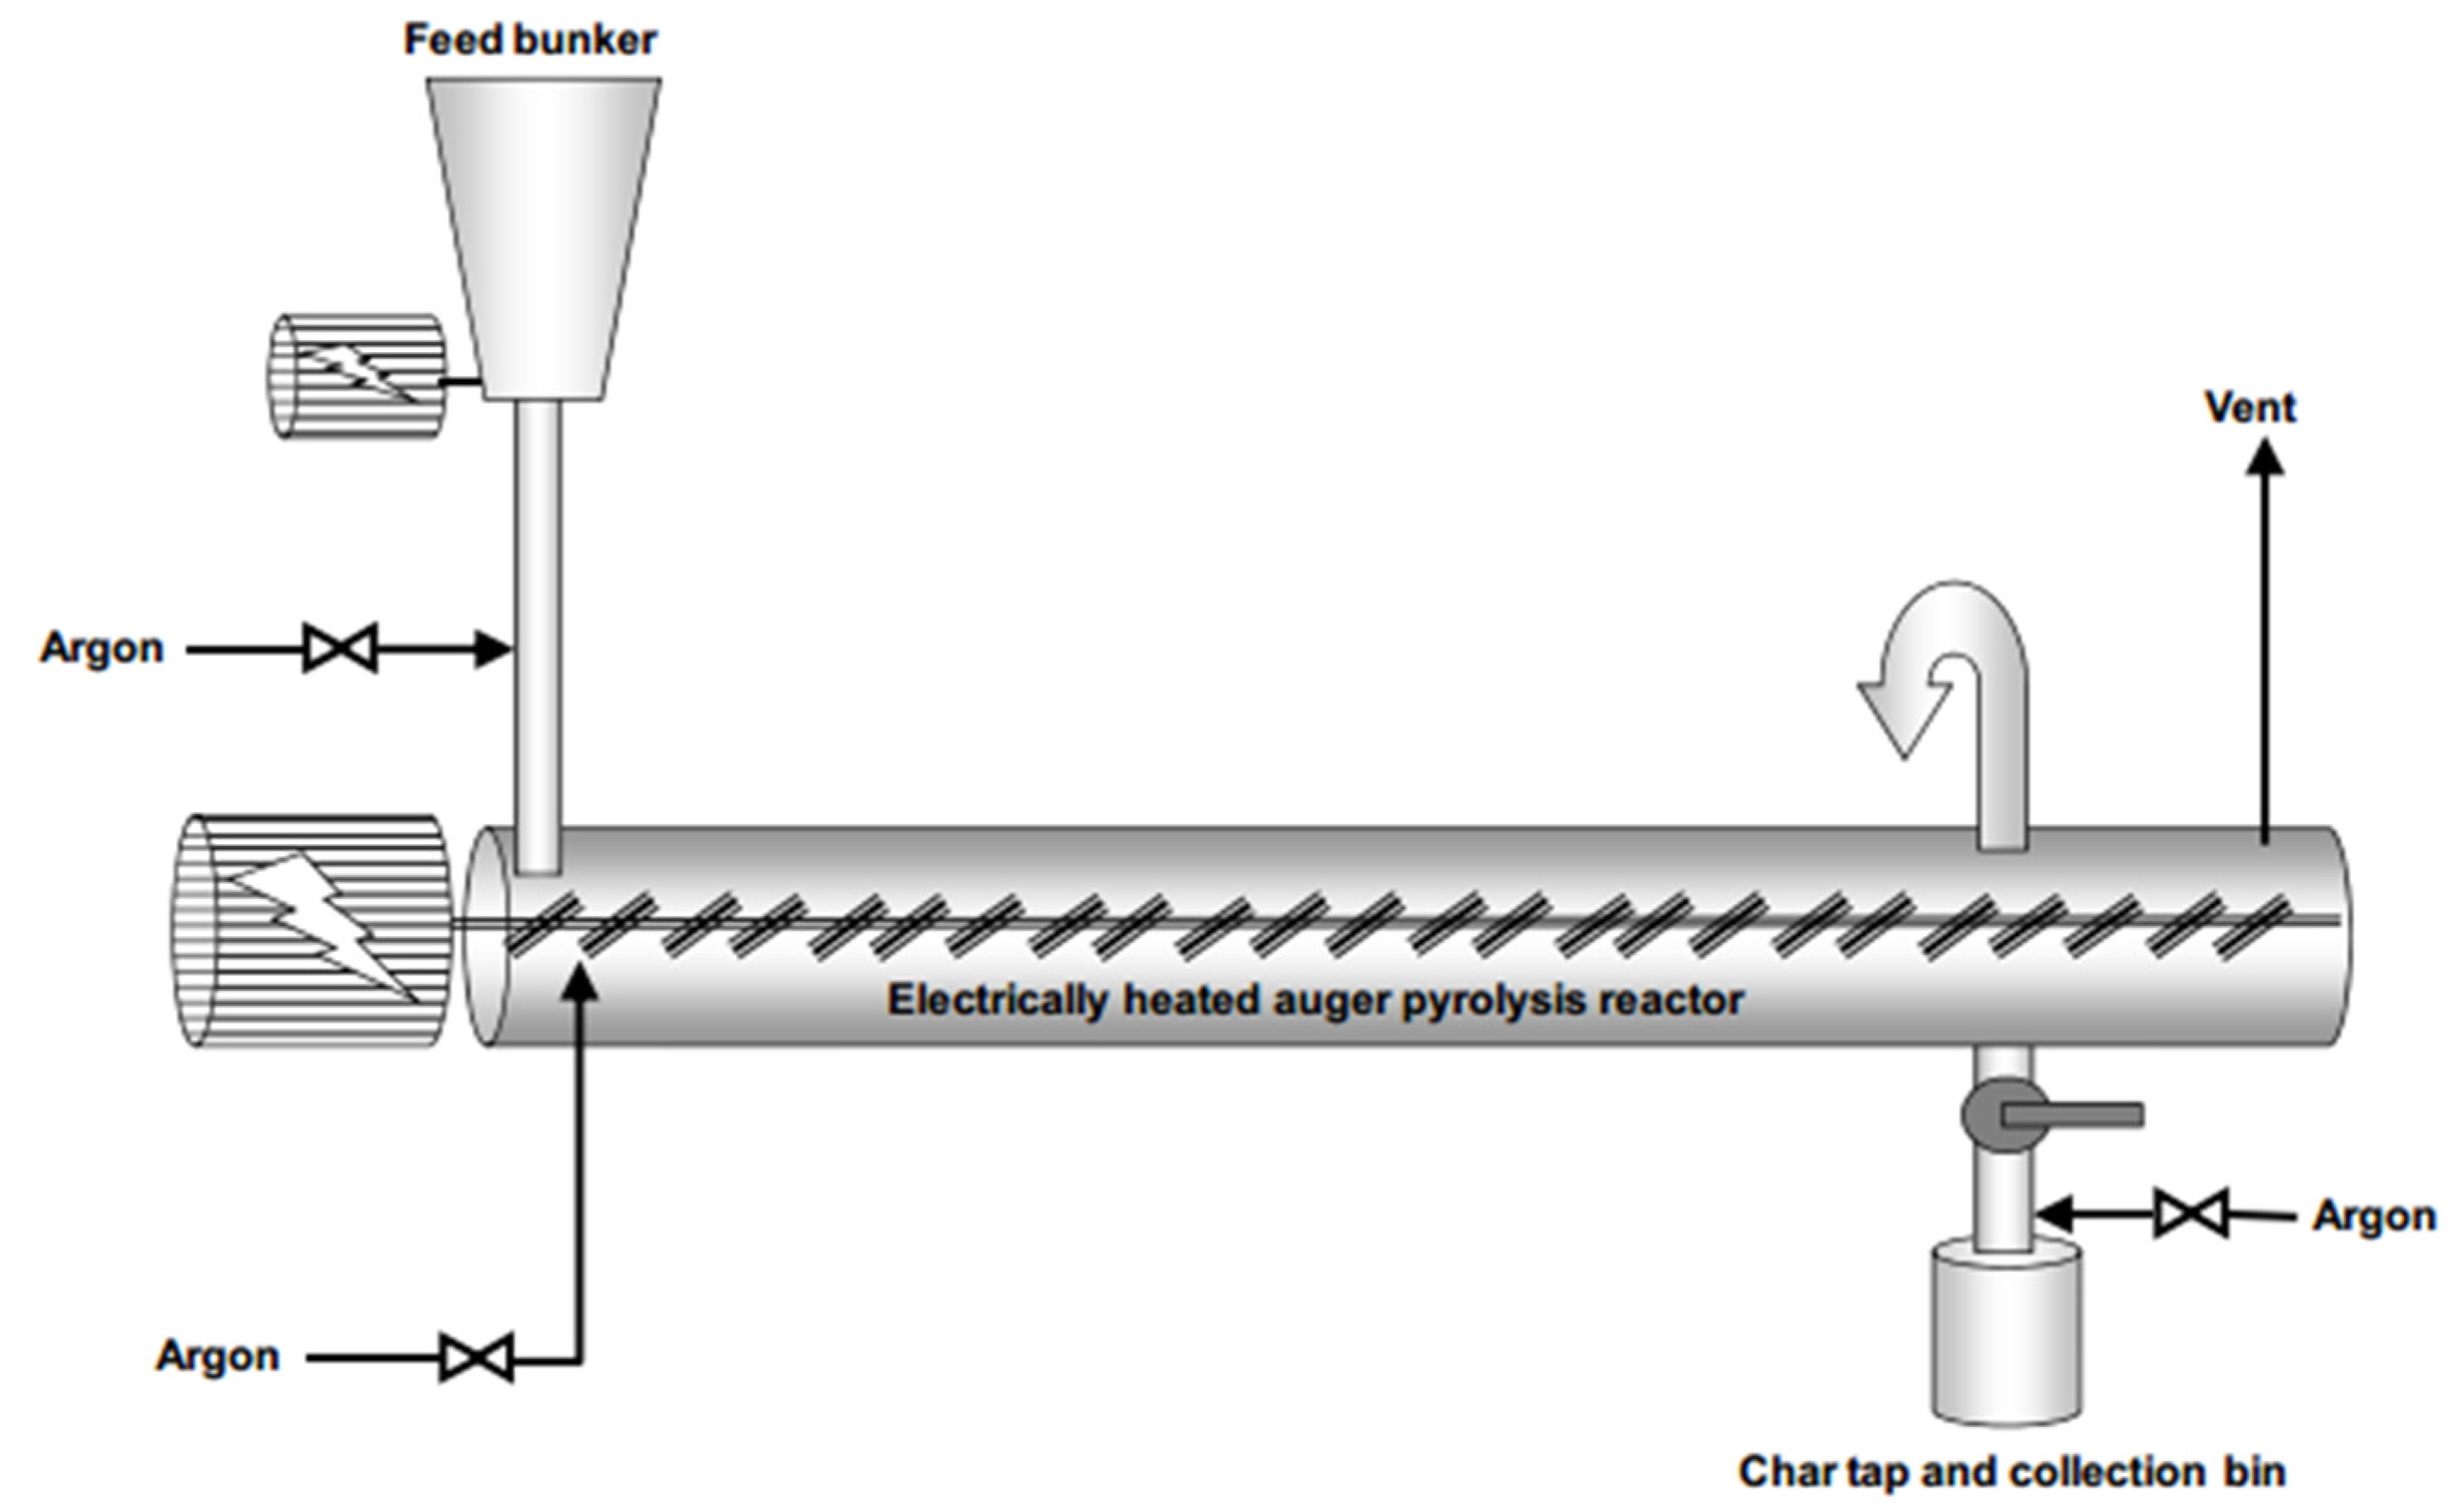
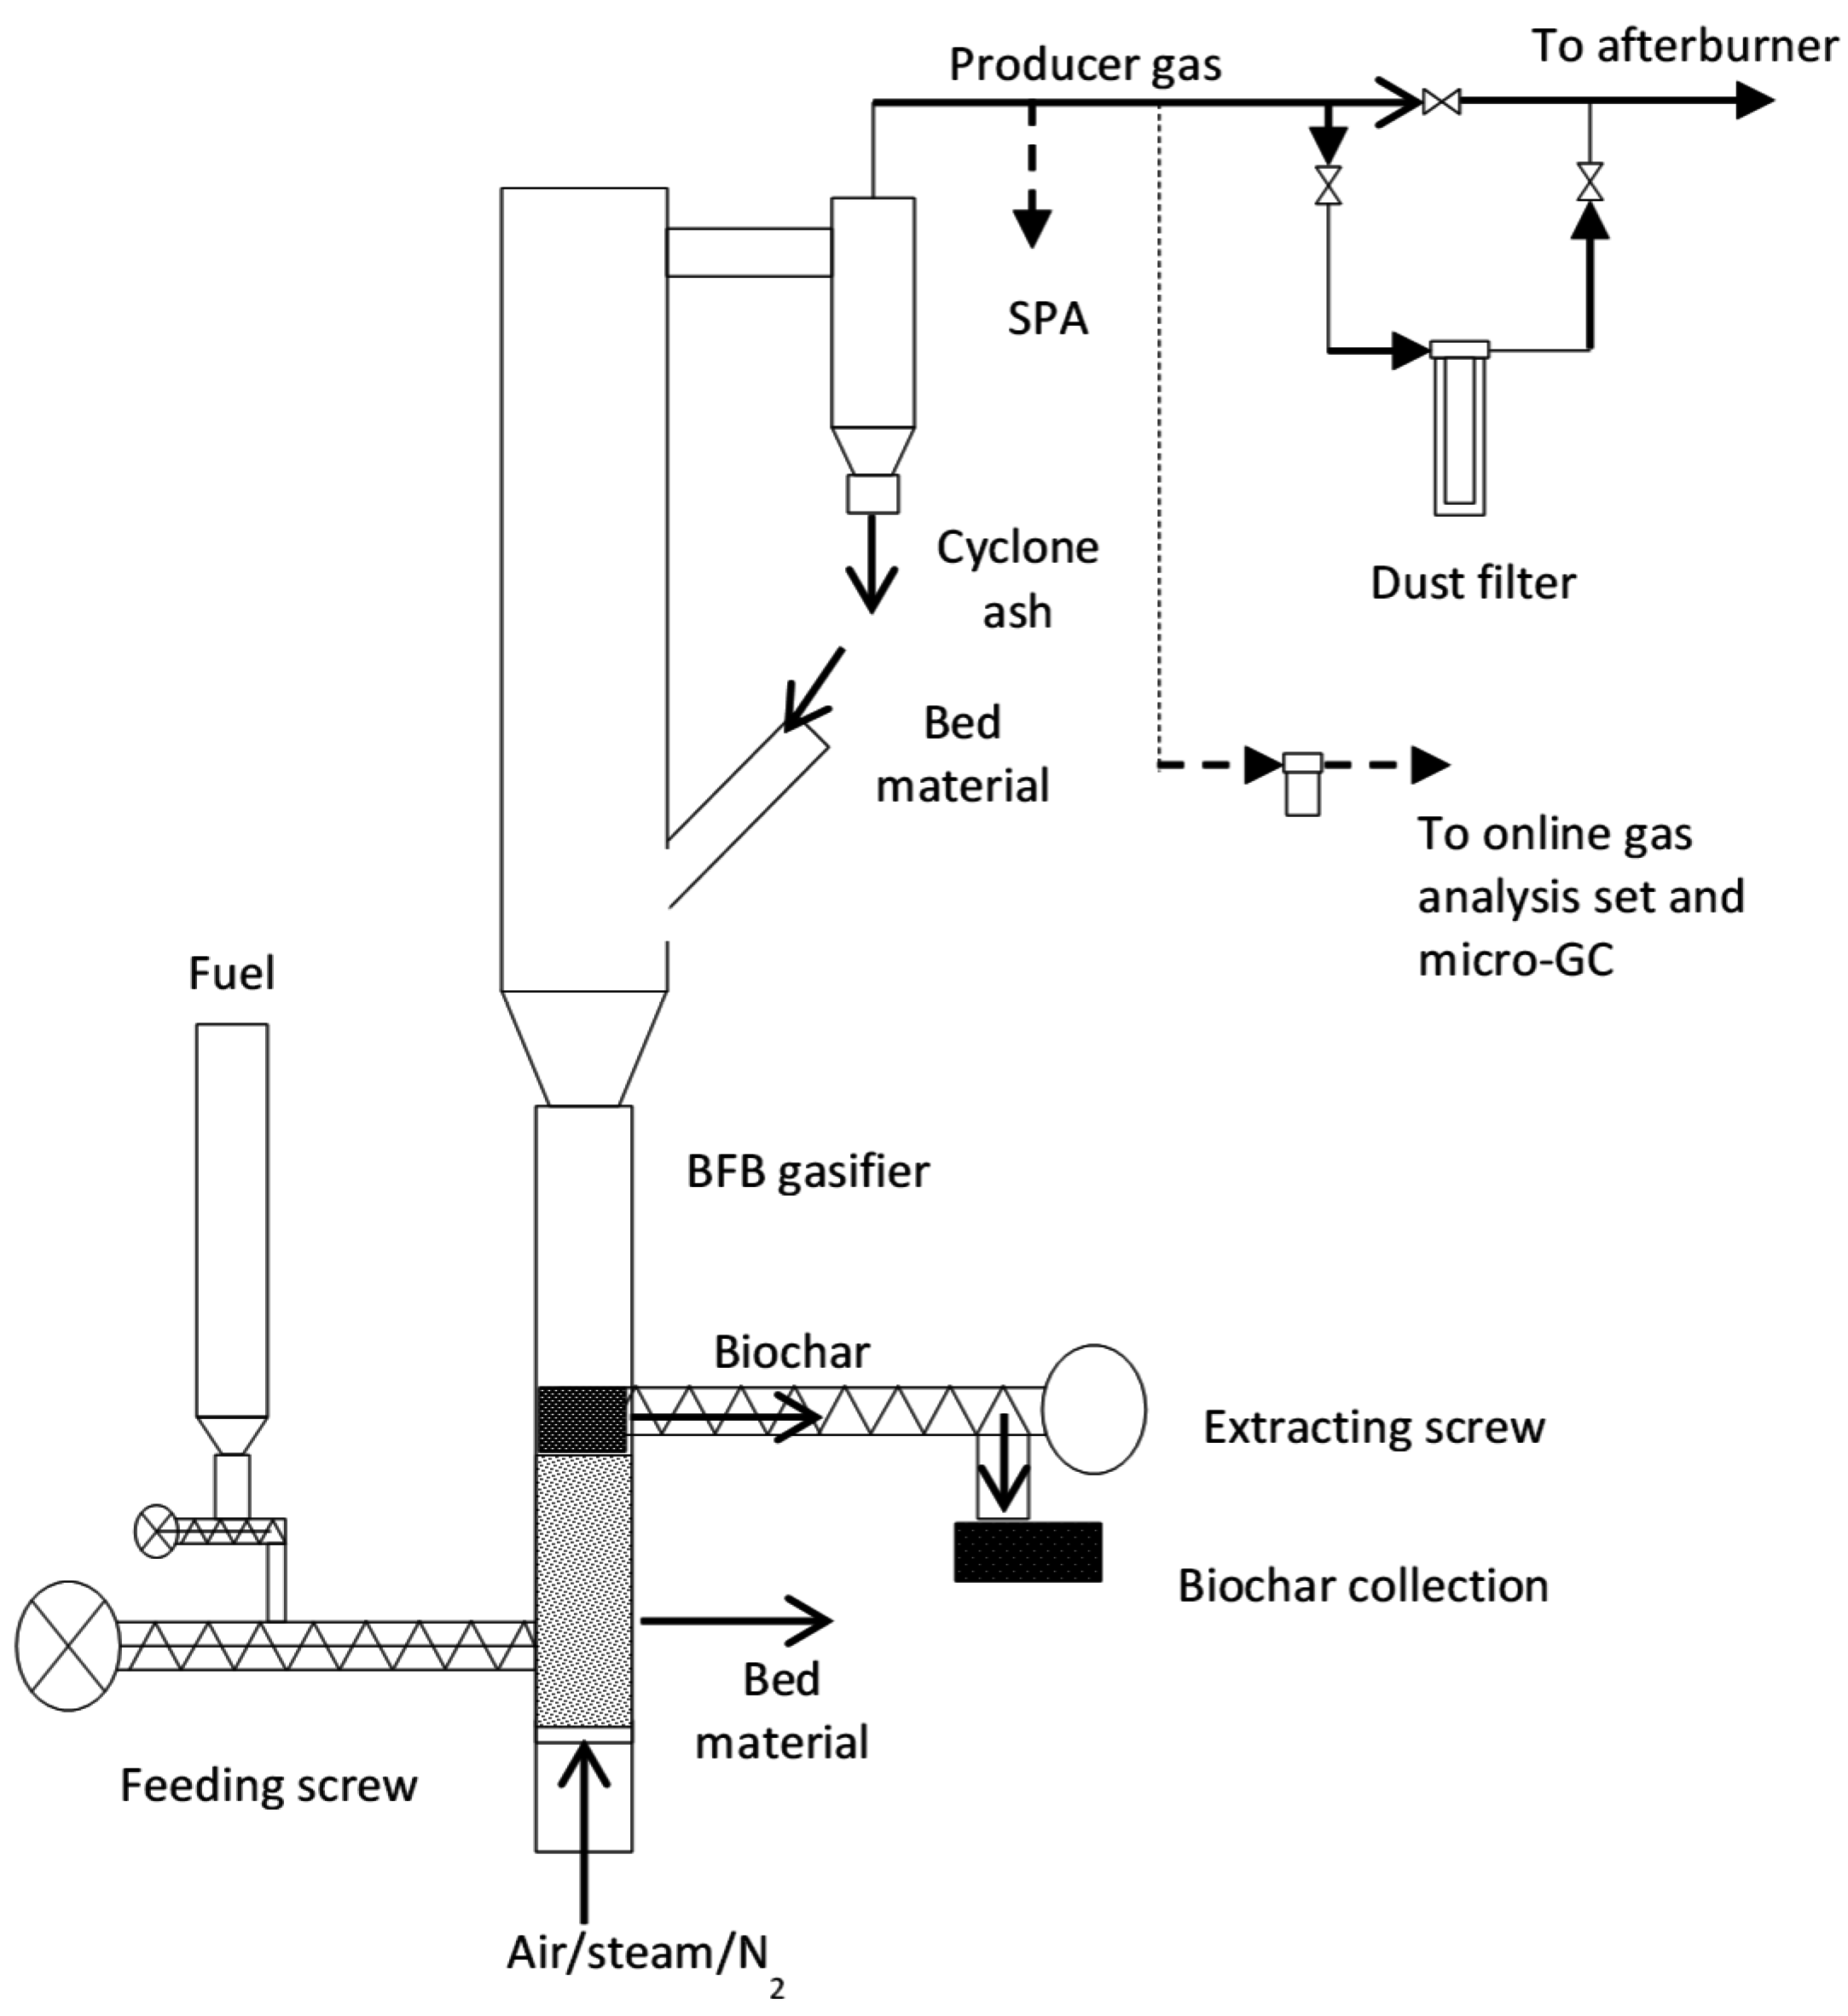
2.2. Production of Biochars

Biochar was produced in a slow pyrolysis reactor (auger pyrolysis unit called Pyromaat) shown in Figure 1. Pyromaat is an indirectly heated screw conveyer reactor, in which the biomass is moved along the reactor length at a fixed speed using a screw thread feeder. It is electrically heated with a thermal input of 25 kW and is able to convert typically 0.0015 kg·s−1 of fuel in an O2-free atmosphere at temperatures up to 600 °C. Solid fuel residence times range from 30 min to 1 h. The slow pyrolysis biochars were produced at 400 °C and 600 °C, with one tests allowing 1% O2 to simulate air leakage at real conditions. Near the end of the screw reactor the solid biochar product is taken out at the bottom (collection bin), while the product gas and the dust leaves the reactor (vent) which leads to an afterburner and gas cleaning system.
Figure 1. Schematic Layout of Pyromaat Auger Pyrolysis Reactor at Energy Research Centre of the Netherlands (ECN).
Agriculture 05 01076 g001
The gasification biochars were produced in two lab scale bubbling fluidized bed reactors, of which the smaller is depicted in Figure 2 (‘WOB’ gasifier). The small installation, with a thermal throughput of 5 kW, allows for a fast and extensive screening of numerous feedstocks and process conditions without extensive preparations between the experiments. After the small scale trials, the biochar plus energy production was carried out in a lab-scale fluidized bed installation of larger input, but of similar design. The larger scale facility allows the testing and development of both continuous feedstock feeding and biochar extraction options that were not possible at the small scale.
The smaller lab scale fluidized bed reactor operates on a scale up to 0.00015 kg·s−1 fuel input and the material is fed into the pre-heated zone of the reactor. The fluidizing agent can be air, steam, or blends with nitrogen/argon for research purposes. The use of various fluidizing agents allows for an extra variable in the attempt to steer biochar to certain characteristics. The biochar is extracted from the reactor continuously, while produced in the sand bed. In order to achieve this a second screw was used in the smaller set-up to take biochar out (Figure 2). For the larger (pilot scale) fluidized bed a more advanced system is being developed which is currently considered for a patent submission. The main concept in all installations (both the small lab scale and the larger pilot scale) is based on the principle of biochar–sand separation in the bed due to density difference and a proper selection of fluidization velocities, which requires fine tuning work.
The product gas, loaded with fine sand, ash and smaller biochar particles enters the cyclone, the most common gas cleaning device, for a first separation of gas and solids. As the cyclone is not heated to the reactor temperature, immediate condensation of tars on the solid matter takes place. Solid material harvested from the cyclone was also analyzed for its suitability as biochar. Gasification experiments were performed for each feedstock (e.g., greenhouse waste) at 600 °C and 750 °C in air, N2, steam and air/steam blends. The larger lab-scale biomass gasification reactor operates at higher mass flow throughput, namely at 0.0015 kg·s−1; however, operating the gasifier in an auto-thermal mode reduced its flexibility, hence stable operation could not be achieved at 600 °C. Therefore, the larger scale gasification experiments were carried out at 670 °C. The 670 °C was then chosen as the reference for the larger installation and in addition a few tests were also run at 750 °C to compare with the smaller scale set-up. The test plan is shown in Table 1.
Figure 2. Schematic layout of the small lab scale bubbling fluidized bed gasification reactor at ECN. The fluidizing agent keeps the sand bed in motion, which results in a very even temperature distribution. It avoids temperature peaks at the introduction of the fuel.
Agriculture 05 01076 g002
The temperature levels for all three reactors were chosen as being representative for biochar producing technologies (slow pyrolysis, gasification). Temperatures lower than 400 °C do not yield sufficient percentage of fixed carbon and it is not guaranteed that biochar can last long enough in the soil. Temperatures higher than 750 °C are not realistic from the point of view that agro-residues will be used for the co-production of energy and biochar in the gasification process.
The residence time varies between slow pyrolysis and gasification conditions. The variation in the fluidizing agent, including inert (N2), air, steam and a blend of air and steam, is expected to give insight into the effect of various oxidation media and residence times on the physicochemical properties of biochar, including surface area, porosity, element composition and water holding capacity.

2.3. Characterisation of Feedstock, Biochar and Product Gas

The biochar samples were characterized both at ECN (under EN ISO / IEC 17025 accreditation) and at external laboratories. Characterizations include proximate, ultimate and element (ash) analysis, surface area (BET) and porosity characterization, Scanning Electron Microscopy coupled with EDX (SEM/EDX) and finally 16-PAH (Polycyclic aromatic hydrocarbons) and dioxins (PCDDs, PCDFs, PCBs) analysis. Table 2 shows the methods and standards used for the materials characterization (biomass and biochar samples). The PCDDs, PCDFs, PCBs were determined by ALcontrol AB in Sweden, which is accredited by SWEDAC (Swedish Board for Accreditation and Conformity Assessment) in accordance with EN ISO/IEC 17025. Samples obtained in larger quantities were also submitted to analysis sets performed by EUROFINS Umwelt West (Wesseling, Germany), accredited laboratory by Germany’s National Accreditation Body (DakkS). The standards applied are given in Table 3. A description of the methodologies applied is either given in the following sections; the applied methodologies by EUROFINS can be found fully in the website of the European Biochar Certificate [51]. The DIN, EN and ISO standards can be purchased from e.g., Beuth Verlag [63] or BSI group [64].

2.3.1. Product Gas Composition and Higher Heating Value

A gas slip stream of the experiments entered an on-line gas analyzer as well as gas analysis with a Varian micro-GC. Argon gas was used as an internal standard to quantify the gas flows in the pilot plant. The GC used was a CP4900 micro-GC with four columns running on helium carrier gas with TCD detectors (CH1: Molsieve (at 80 °C), CH2+3: PoraPlot PPU (at 60 °C), CH4: CP-wax-52CB (80 °C)). The micro-GC detects N2, CO, CO2, CH4, C2H6, O2, C2 (ethane, ethylene and acetylene), H2S, C6H6 (benzene) and C7H8 (toluene) and Ar. An ABB on line monitoring system was used for H2 reading.
The higher heating value (HHV, MJ·kg−1) of the product gas (either pyrolysis or gasification product gas) was not directly measured but calculated from its composition. The overall composition of the gas mixture was then used in conjunction with the volume of gas collected and higher heating value of the measured gas species to calculate the HHV of the product gas. The composition of the product gas was corrected for the dilution effect of carrier gases Ar and/or N2.

2.3.2. Polycyclic Aromatic Hydrocarbons

Polycyclic aromatic hydrocarbons (PAHs) are included in the European Union and US Environmental Protection Agency priority pollutant lists because PAHs represent the largest group of compounds that are mutagenic, carcinogenic, and teratogenic. They could also pose potential threats to the marine environment [65]. The effect of PAHs is usually widespread and permanent in environmental media. Most PAHs have high hydrophobicity, and can be sorbed strongly by waterborne organic and inorganic particles. The International Biochar Initiative [50] set a range of maximum allowed threshold values (varying between different countries) for the sum of the 16 US Environmental Protection Agency’s (EPA) PAHs, PCDD/Fs, and PCBs in biochar to 6–20 mg·kg−1 dry weight (d.w.), 9 ng·kg−1 I-TEQ, and 0.2–0.5 mg·kg−1 d.w., respectively. Similarly, the European Biochar Certificate [51] requires PAHs to be below 4 mg·kg−1 and 12 mg·kg−1 d.w., in premium and basic grade biochars, respectively, and PCDD/Fs need to be below 20 ng·kg−1 I-TEQ, and 0.2 mg·kg−1 d.w., respectively.
Some of the biochar samples were analyzed by both ECN and EUROFINS, the differences observed are attributed to some slight modifications to the way the toluene extraction is being carried out, namely, whether toluene is heated above or being applied at room temperature as will be discussed in the results section. The duration of the extraction also affects the total final amount of lighter weight PAHS (mostly 2-ring PAH), observed and reported in other works.
Table 2. Set of analysis, standards and methods applied at ECN for the characterization of the biochars.
Variable MeasuredStandard and MethodComments
Proximate Analysis (CEN Solid Biofuels)
Ash Content (dry mass fraction %)EN 14775Solid biofuels–Method for the determination of ash content. Brussels, Belgium: European Committee for Standardization; 2004.
Moisture Content (as received. mass fraction %)EN 14774-1/2Solid biofuels–Determination of moisture content – Oven dry method – Part 1: Total moisture – Reference Method. Brussels, Belgium: European Committee for Standardization; 2009.
Volatile Matter (dry mass fraction %)EN 15148Solid biofuels–Determination of the content of volatile matter. Brussels, Belgium: European Committee for Standardization; 2010
Ultimate Analysis (CEN Solid Biofuels)
C, H, N Content (dry mass fraction %)EN 15104Solid biofuels–Determination of total content of carbon, hydrogen and nitrogen – Instrumental methods. Brussels, Belgium: European Committee for Standardization; 2011.
Calorific Value (MJ·kg−1)EN 14918Solid biofuels–Determination of calorific value. Brussels, Belgium: European Committee for Standardization; 2009.
S and Cl content (mg·kg−1 dry)BS EN 15289Determination of total content of sulfur and chlorine. Brussels, Belgium: European Committee for Standardization; 2011.
Ash Elements
Ash inorganic elements and heavy metals (mg·kg−1 dry)NEN 6966Al As B Ba Ca Cd Co Cr Cu Fe K Li Mg Mn Mo Na Ni P Pb S Sb Se Si Sn Sr Ti V Zn Hg- Analyses of selected elements in water, eluates and destruates - Atomic emission spectrometry with inductively coupled plasma (ICP-AES). The Netherlands.
BET Surface Area
Brunauer-Emmett-Teller (BET) Surface Area Analysis (m2·g−1) and Barrett-Joyner-Halenda (BJH) Pore Size and VolumeISO-9277

ISO-15901
Determination of the specific surface area of solid by gas adsorption-BET method
Pore size distribution and porosity of solid materials by mercury porosimetry and gas adsorption-part 1: Mercury porosimetry.
Pore size distribution and porosity of solid materials by mercury porosimetry and gas adsorption-part 2: Analysis of mesoporesand macropores by gas adsorption.
Pore size distribution and porosity of solid materials by mercury porosimetry and gas adsorption-part 3: Analysis of micropores by gas adsorption.
PAH
Main 2–6 ring PAH (mg·kg−1 dry)EN 15527 (extraction with toluene)16 USEPA PAHs: (Acenaphtene, Acenaphtylene, Naphthalene, Anthracene, Fluorene, Phenanthrene, Benzo(a) anthracene, Pyrene, Chrysene, Fluoranthene, Benzo(a)pyrene Benzo(k) fluoranthene, Benzo(b) fluoranthene, Dibenz(ah) anthracene, Benzo(ghi) perylene, Indeno(123-cd) pyrene, Coronene
Dioxins
Polychlorinated dibenzo-p-dioxins (PCDDs), Polychlorinated dibenzofurans (PCDFs), Polychlorinated biphenyls (PCBs) (ng kg-1)SS-EN-1948 High Resolution Gas Chromatography Mass SpectrometryBS EN 1948 Parts 1–3: 2006
Stationary source emissions - Determination of the mass concentration of PCDDs/PCDFs and dioxin-like PCBs
Table 3. Parameter package Biochar.
Variable measuredStandard and Method
sample preparationDIN 51701-3
water contentDIN 51718
ash content 550 °Canalog DIN 51719/EN 14775
ThermogravimetryISO 11358 (LECO)
C, H, NDIN 51732
SulfurDIN 51724-3
oxygen (calculation)DIN 51733
carbonate-CO2DIN 51726
Corg (calculation from Ctot und C in carbonate form)Calculation
H/C und O/CCalculation
trace metals Pb, Cd, Cu, Ni, Hg, Zn, Cr, B, Mn in microwave digestionEN ISO 17294-2 /EN 1483
main elements P, Mg, Ca, K, Na, Fe, Si, S in melting digestionEN ISO 11885 /EN ISO 17294-2
PAH (EPA)DIN EN 15527 (extraction with toluene)
pH-valueDIN ISO 10390 (CaCl2)
bulk densityDIN 51705
conductivity (salt content)DIN ISO 11265/BGK, Kap. III. C2
surface area analysis according to BET (incl. pure density)DIN 66132/ISO 9277
Gross calorific value HoDIN 51900
Net calorific value, Hu, pDIN 51900
PCB, dioxins/furans (high resolution)HRMS
water holding capacity (WHC) on fraction < 2mmE DIN ISO 14238
ash content 815 °CDIN 51719
volatile matterDIN 51720

2.3.3. Surface Area, (Micro) Porosity and Morphology Using SEM

A Quantachrome Nova 2200e surface area analyzer was used to determine the surface area of the biochars samples at ECN based on N2 adsorption at 77 K. Biochar weighing between 0.2 and 0.25 g was previously degassed overnight (for at least 8 h) and placed into the evacuated sample chamber of the surface area analyzer. BET surface area and pore size distribution output was obtained through the Nova 2200e automated software. The BET (Brunauer, Emmett and Teller) equation was used by the software to calculate the specific surface area of the biochars. Materials were also sent to EUROFINS for a detailed surface area as well as porosity and microporosity analysis. For the pore size distribution characterization based on N2 and CO2 adsorption, the procedure is as follows.
The exact procedure for the measurements as performed is:
(a)
Pretreatment: Drying of sample at 105 °C for 90 min, milling the sample (1 min, 30 s)
(1)
Weighing in as much sample as possible (~1.5 g), because of expected low specific surface area
(2)
Evacuating the sample at a temperature of 150 °C to remove adsorbed material from the surface, e.g., water (degassing), about 3 h
(3)
Filling the sample cell with gas (e.g., N2)
(4)
Weighing back the sample, to measure the net weight
(5)
Placing the sample in the measurement position, flushing with Helium, evacuating, placing the sample in liquid nitrogen (−197 °C)
(6)
Adding nitrogen until preset pressures, while measuring the adsorbed amount of nitrogen
(7)
After the measurement of a complete adsorption isotherm, calculating of the multipoint BET surface area in the range P/P0: 0.05–0.3
(8)
Calculating the porosity, using the appropriate model.
(b)
The methods and models applied:
(1)
BET method for determination of the total SSA
(2)
V-t method for the SSA corresponding to pores smaller than 2 nm (micropores) and larger than 2 nm (external surface area)
(3)
BJH method for determination of SSA and pore volume for pores bigger than 3 nm and characterization of PSD (also for pores larger than 3 nm).
To get more specific information about the pore size distribution though, for pores smaller than 2 nm, CO2 rather than N2 adsorption needs to be applied. CO2 adsorption (273 K) is used to characterize specially the microporosity of the sample, since with N2 only big micropores can be measured. This can explain the difference between the specific surface areas obtained for both gases (adsorbates). Using CO2, the following methods were applied: (1) BET method, for determination of the total specific area, (2) DR method for the determination of the microporous specific surface area, (3) DFT method for the PSD characterization of micropores; the NLDFT model is applied.

2.3.4. pH Values

For the pH measurements of biochar at ECN, a simple pH meter was used. Biochar samples (10 g) were soaked in demi water at ratio 1:10 for 2 h prior to pH measurement (Orion720A Model pH meter) as per ASTM D4972. The pH meter was calibrated with standard pH buffers at pH 4, 7 and 10 prior to analysis. All analyses were performed in triplicate and the results averaged. The results were confirmed by EUROFINS, who include pH values of the biochars in their standard package for biochar characterizations.

2.3.5. Water Holding Capacity (WHC)

The test according to DIN ISO 14238-2011consists of soaking the 2 mm fraction of the material in water for a period of 24 h. After this, the material has to be placed on a dry sand bed for 2 h for removing free water. The saturated material has to be weight and then dried at 40 °C in a compartment dryer. After drying the material has to be weight again for estimate the water holding capacity.

2.3.6. Carbonate CO2

The method is described in detail in the EBC website [51] (analogue DIN 51726). The contribution of C in the form of carbonates to the total C content of the biochar was not significant; it was taken into account however and subtracted from the total so that when C is mentioned in this work it means the organic C.

3. Results and Discussion

3.1. Physicochemical Properties of Feedstock and Biochars

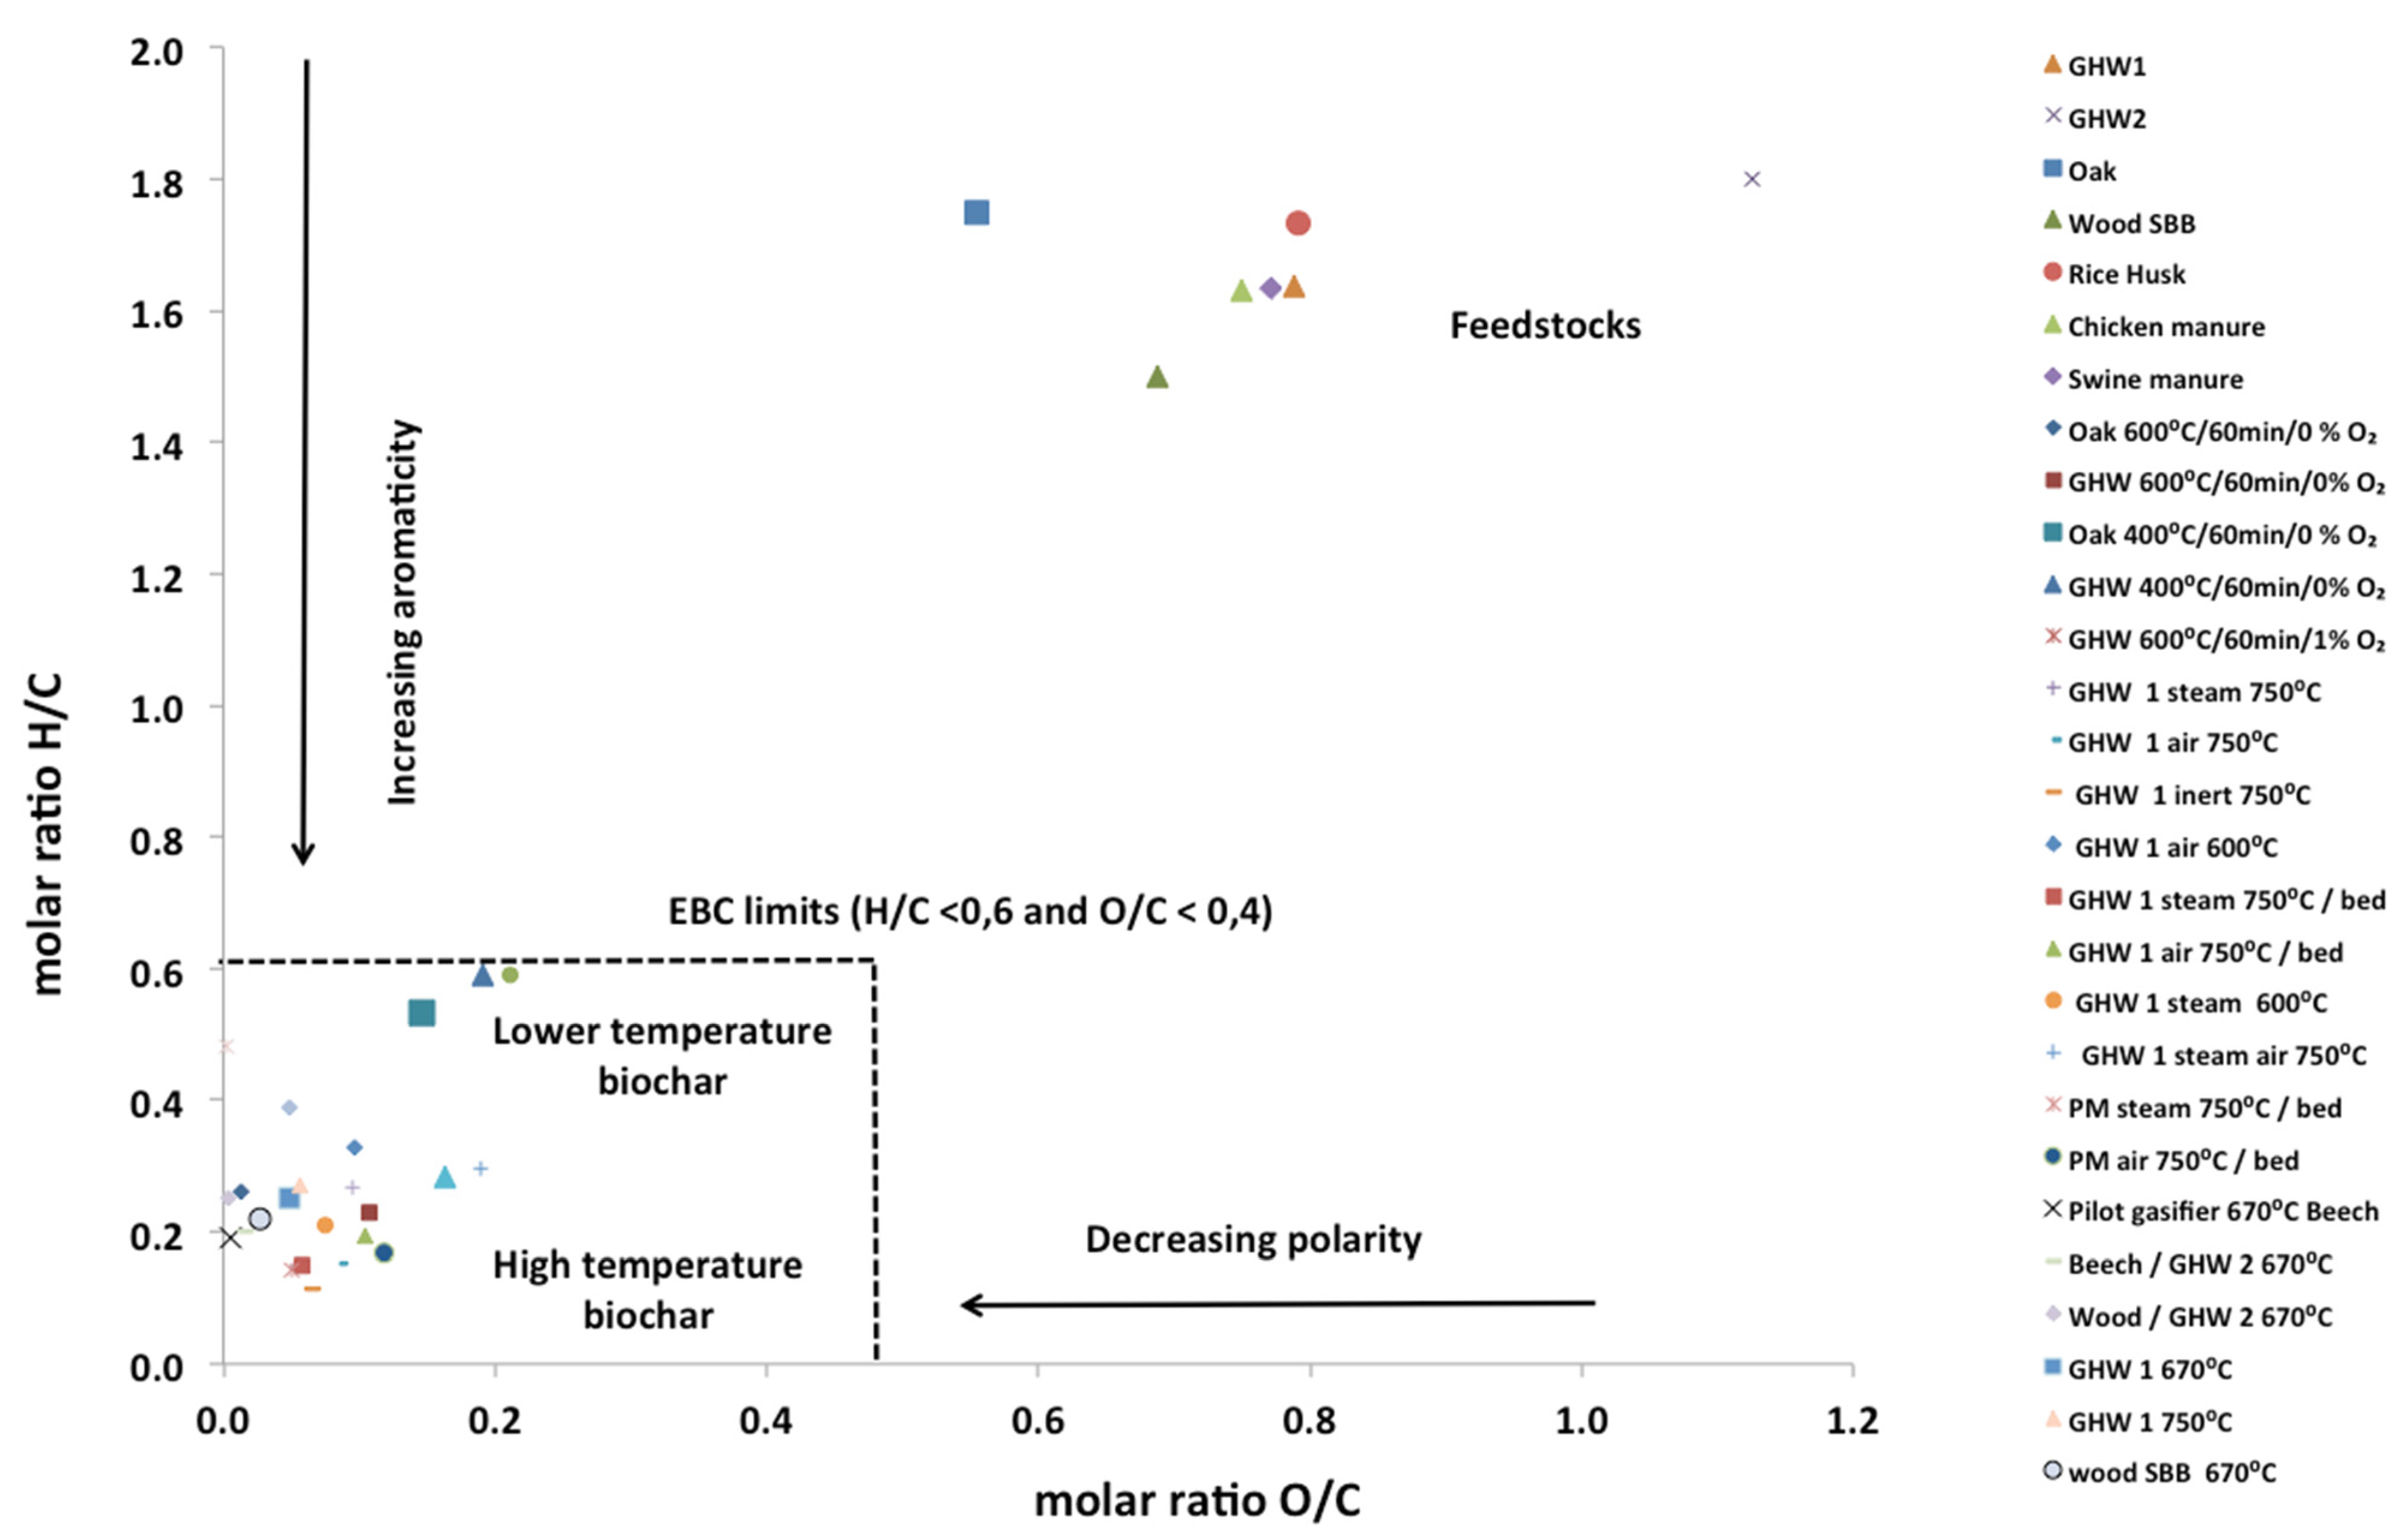
3.1.1. Proximate, Ultimate and Elements Composition

Table 4 shows the results on the biomass and biochars ultimate, proximate and main inorganic elements composition. As the data from ultimate analysis shows, pyrolysis and gasification leads to release of H and O, and retention of C, with increasing reactor temperature for all types of feedstock. The slow pyrolysis unit allows for a slow and gradual transformation of the feedstock to biochar, under an inert carrier gas and a residence time of 30–60 min. Gasification using an oxidant (air or steam) on the other hand, leads to transformation of most of the feedstock into product gas and a small yield of biochar, in a much more rapid way (residence times of a few seconds). Ideally there is no carbonaceous leftover from a gasification unit as this compromises the gas yield, which is the main product. However, the concept being developed at ECN aims at converting biomass feedstocks at lower temperatures, explicitly not allowing the complete conversion of the feedstock towards product gas, and thus allowing for the production of biochar. Special attention is given to the extraction process of the biochar in order to avoid any adsorption of hydrocarbons (tars) on the biochar surface. Therefore the chars or the high carbon containing ashes from the cyclone is not considered at all. The cyclone char samples have been analyzed but as the PAH levels exceeded both basic and premium biochar thresholds the samples were not further considered.
There are large differences in the inorganic composition of the materials (ash), the greenhouse residues GHW 1 and 2 as well as the animal manures showing increased concentration of P, K, Ca while the woody residues are low in ash concentration and the ash itself seems rather inert and low in nutrients. Rice husk is very high in silicon and poor in nutrients. The inorganic composition may give a first indication on the suitability of feedstocks for soil application. The high level of salts is linked with high electric conductivity, P and K are nutrients and therefore can replace some chemical fertilizers. Another aspect is the C content of the biochar, which is not directly a fertilizer element but contributes to the increase of soil carbon levels. Since highly nutrient feedstock such as animal manures also contain high levels of N (Table 4), which is largely devolatilized in the biochar production process, it is arguable to use these materials as biochar when N is required as nutrient. However, in those biochars, the ratio of P and K relative to N·(P+K)/N is increased therefore they can act as a slow release nutrient fertilizer. Another remark on the highly nutrient biochars shown on Table 4 (manures, GHW) is on the C content which does not exceed the 50% by mass, so these products are classified as nutrient rich ash. The nutrient content does not yet need to comply with certain limits, but the analyses of elements N P K, Mg, Ca need to be available and listed, according to IBI and European Biochar guidelines.
Biochar elemental ratios of O/C and H/C were used to construct the Van Krevelen diagram (Figure 3), typically used as a visual representation of the age/maturity and origin of hydrocarbon materials such as coal and petroleum [66]. The Van Krevelen diagram shows the transition from feedstocks to biochar, and even captures variations in to production technology (slow pyrolysis vs. gasification). Increasing pyrolysis temperature decreases the H/C and O/C ratios indicating that the structural transformations induce a carbonization process. It seems that almost all biochars have molar ratios H/C < 0.6 and O/C < 0.4, conforming to the IBI definition of biochar. The black-carbon content 10%–40% of overall carbon (C stability) was not determined.
The gasification biochars, produced at the same or higher temperatures, are accumulated in the low value corner of the H/C vs. O/C, showing a high degree of carbonation of the original material. Lower temperature pyrolysis biochars, at 400 °C, move further away from this corner but are still within the threshold levels. It can be concluded that gasification leads to higher stability biochar, as inferred from its higher degree of carbonization, due to higher production temperature. According to Spokas et al. [67] biochars with O/C ratio between 0.2 and 0.6, are thought to have a long half-life (100–1000 years). The combined application of ratios H/C and O/C were proposed as a tool to assess the biochar stability with threshold values of H/C < 0.6 and O/C < 0.4 in [23].
Figure 3. Van Krevelen Diagram of the feedstock and the obtained biochar samples.
Agriculture 05 01076 g003
Table 4. Ultimate, proximate and main inorganic elements of the feedstock and produced biochars.
Ash %C %H %N %O by diff.%Pmg·kg−1Kmg·kg−1Clmg·kg−1Smg·kg−1Camg·kg−1Simg·kg−1
GHW 1 Ppper6.942.55.81.244.7163820003121002670153031330
GHW 2 Tomato35304.53.4451016349455145312587378576440
Oak Wood2.8526.71.6388001380022020015500204
Wood SBB4.0465.80.542598309822650079815204
Beech Wood2.5476.40.24910513313572002965245
Chicken Manure17395.34.339127112345947005874406785393
Swine Manure2536.04.91.9372961317270470066672821219061
Rice Husk1836.05.20.33816048441311162676857
Pyrolysis Biochars
GHW 1 600 °C/60min25701.20.994299489782813541594365213707
GHW 1 600 °C/60min/1% O219671.51.39.3364751807280004575376855764
GHW 1 400 °C/60min27592.91.2123519395622119637913770224489
Oak 400 °C/60min11723.20.314718970015513143185715966
Oak 600 °C/60min10791.80.16794115083884616295306835
Small Scale Gasification
GHW1 steam 750 °C2765.90.80.209.86603516091997746374108824466
GHW1 air 750 °C2566.50.80.5015.14415737693340542943732815468
GHW1 inert 750 °C3160.10.60.1010.417682721447821245908012610
GHW1 air 600 °C3751.41.40.2013.3292449063116672264189637582
GHW1 steam 600 °C3754.80.960.2010.92655399407789213927805272
RH steam 750 °C8315.10.180.10.534254703281254251364759
RH air 750 °C82120.400.160.88221556597114679314492490
CM steam 750 °C78250.520.560.58485194730250001114626031737950
CM air 750 °C8670.330.20.089292328418003731161043261152
SM air 750 °C77210.300.33.9023750305152300114005914088502
SM steam 750 °C62340.400.54.6056456354443200113975419395397
Larger Scale Gasification
GHW1 670 °C33.5591.20.83.83100440002870049003700046000
GHW1 750 °C26.5591.30.94.53000590003620037003500044000
Wood SBB 670 °C10.7821.50.82.92600110007204702300017000
Beech wood 670 °C23.872.31.20.40.67001300011302401600085000
Beech wood & GHW2 670 °C17.3771.30.681.6240039000114006400280009300
Wood SBB & GHW2 670 °C22.567.91.40.950.36600360009150110005500020000
GHW1, Greenhouse waste 1 (pepper residue); GHW 2, Greenhouse waste 2 (tomato residue); wood SBB, residual garden waste; CM, chicken manure; SM, swine manure; RH, rice husk.

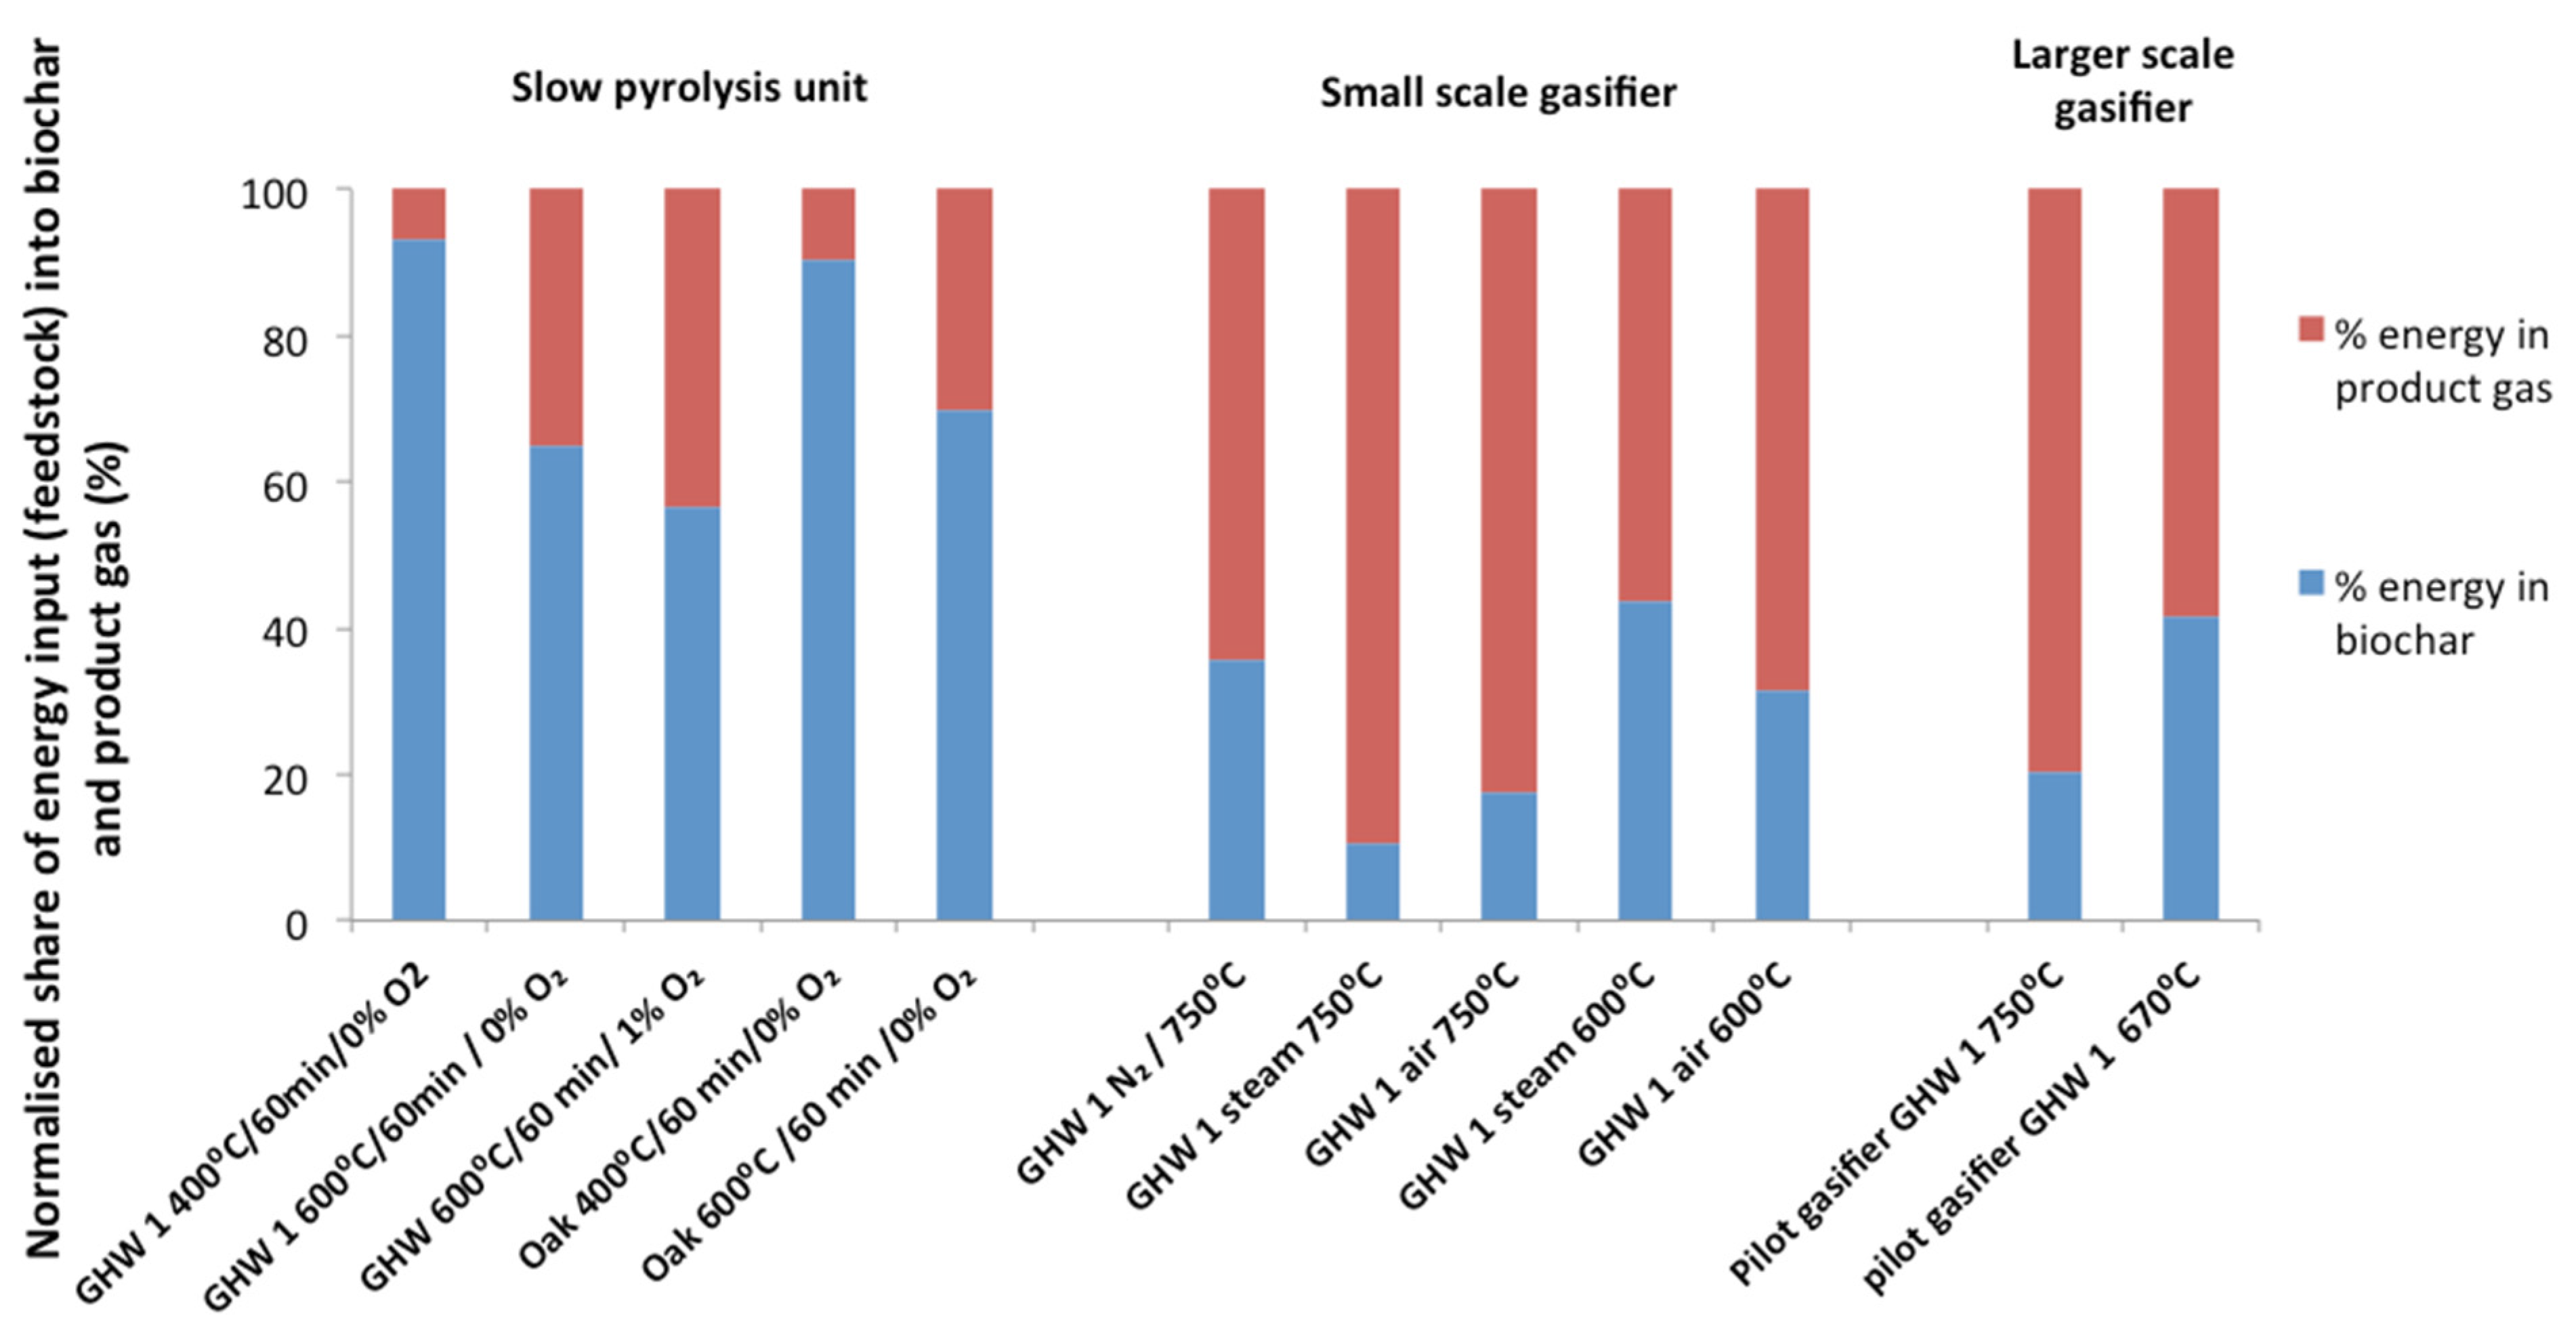
3.2. Product Distribution

The yields of biochar and product gas as well as the mass fraction of ash and C in the obtained biochars from each pyrolysis and gasification experiment are shown in Figure 4 and Figure 5.

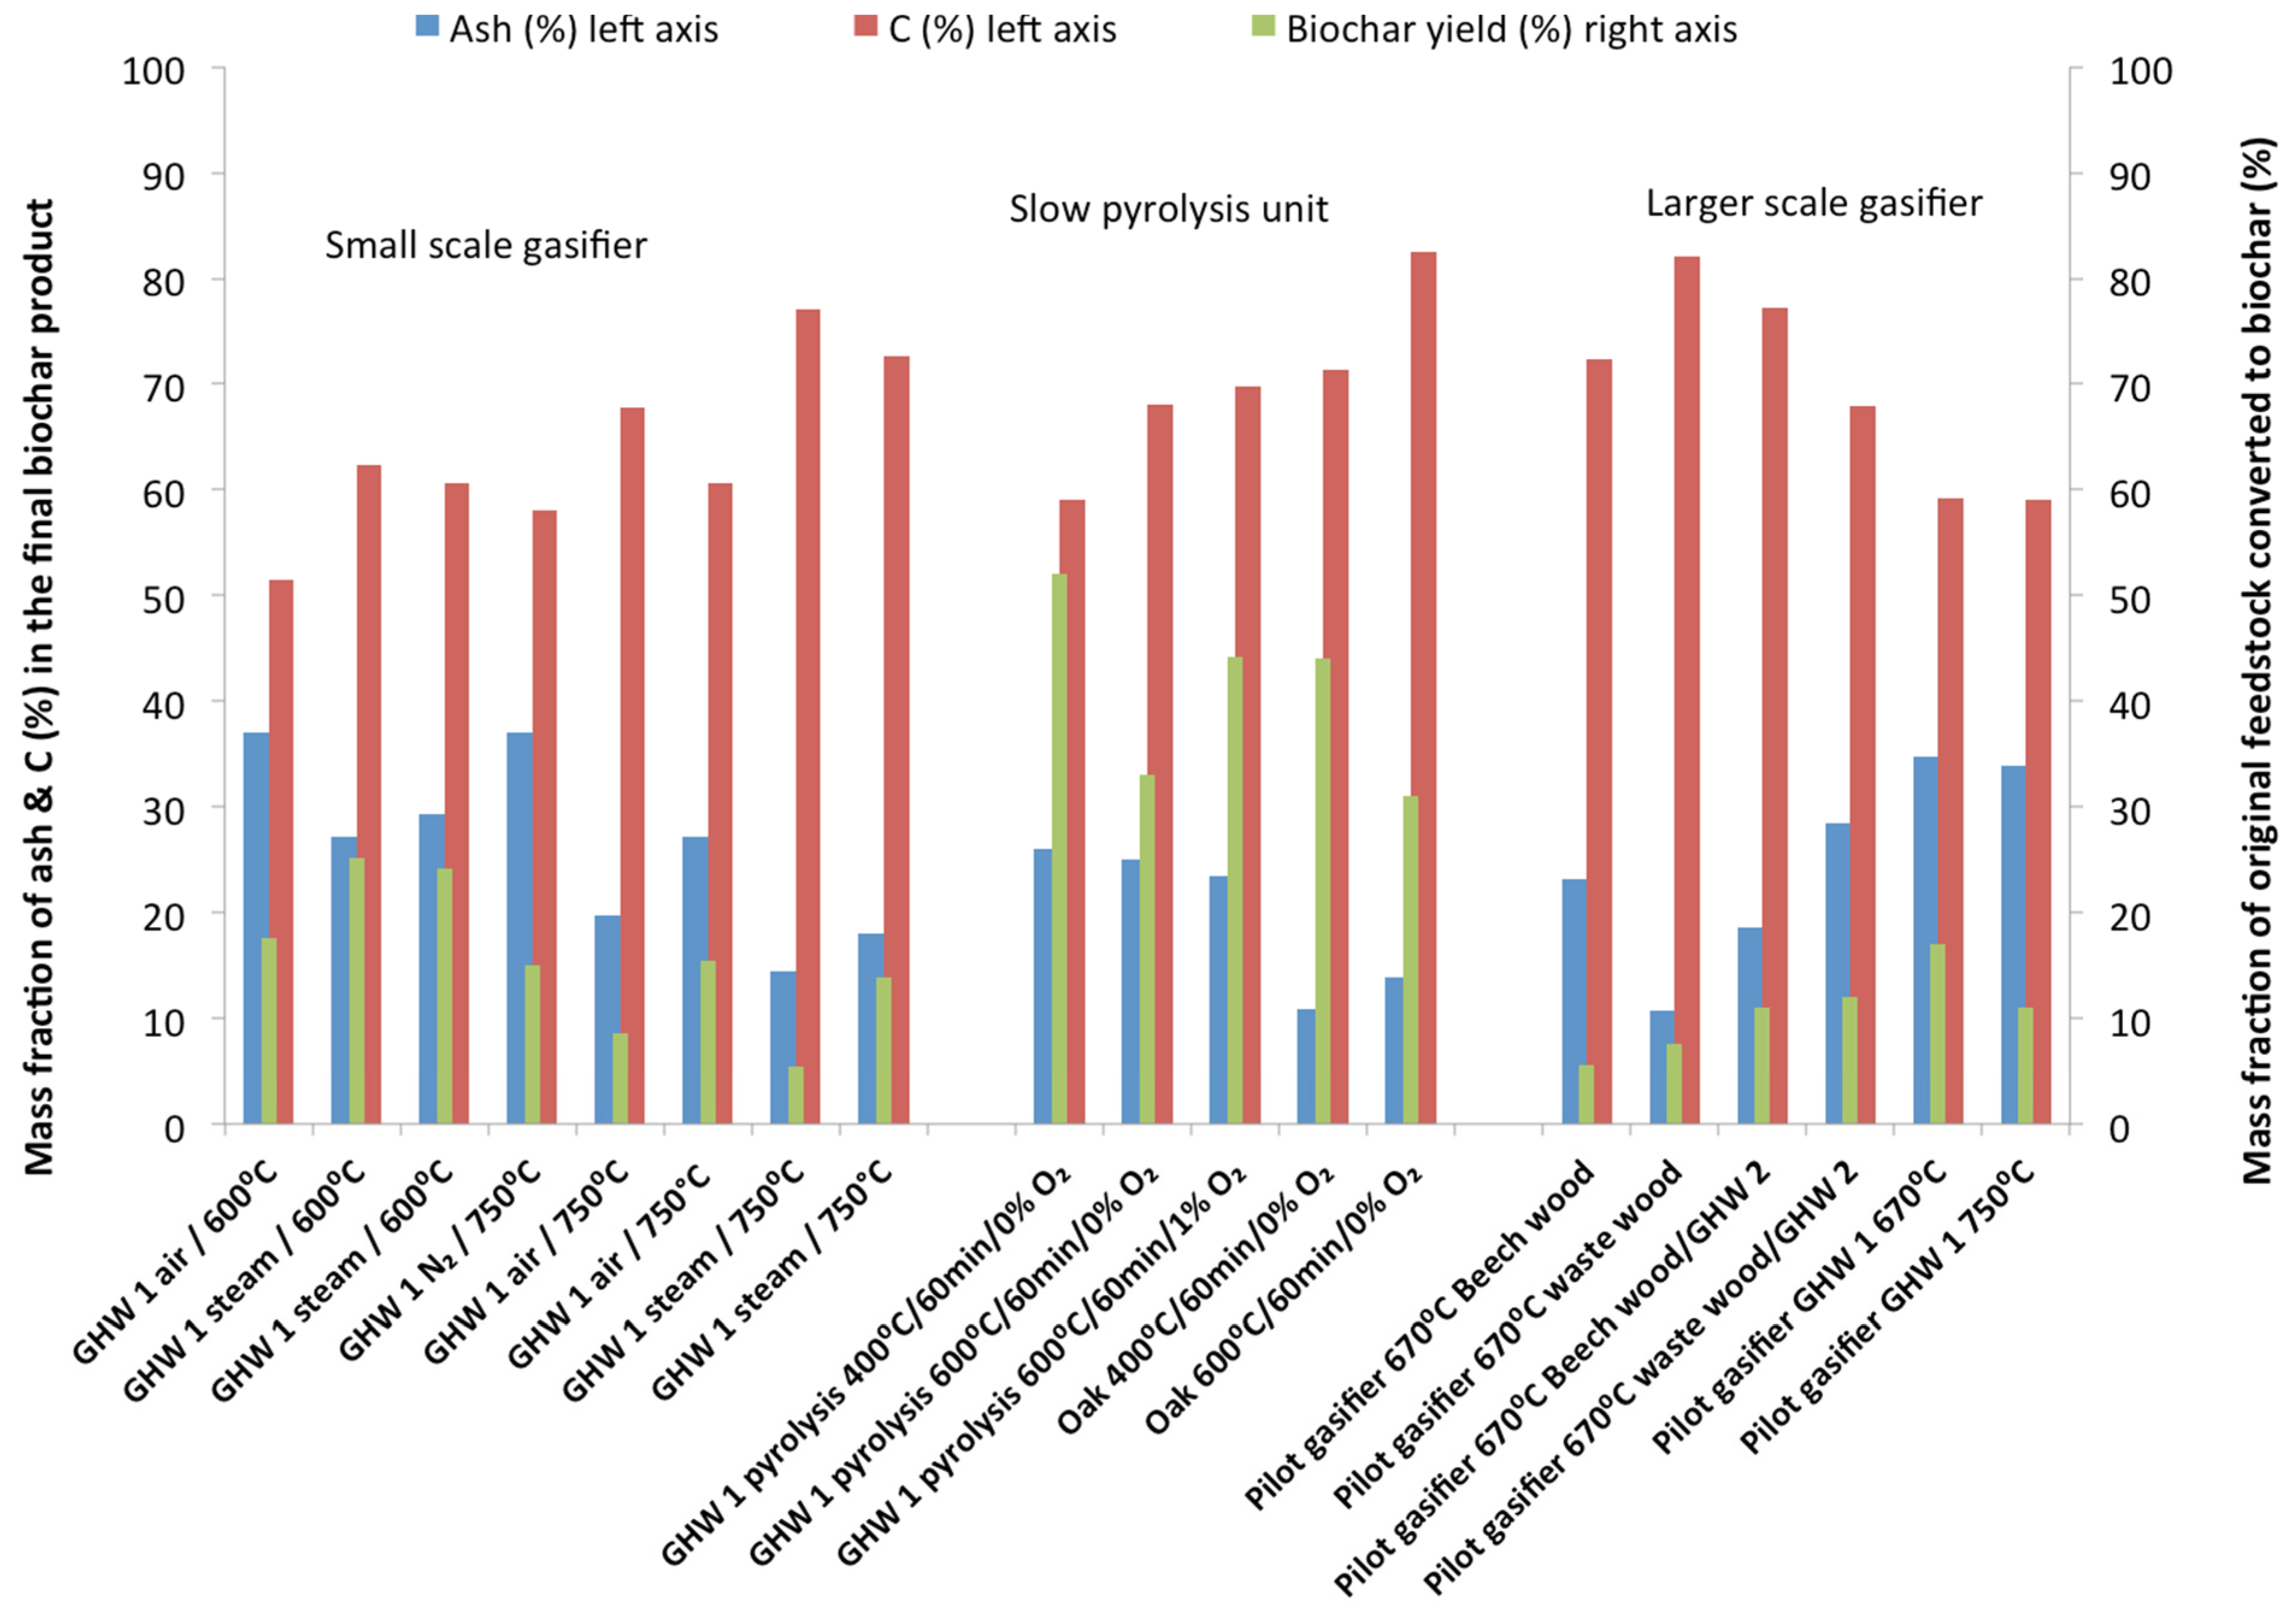
3.2.1. Effect of Temperature and Residence Time on Yield of Biochar

Figure 4 shows the fraction of C and ash in the final biochar product on a mass basis for the various test conditions. As seen in the left vertical axis, in some of the biochars the ash mass fraction % is very high, in that case the term biochar may have to be replaced by the term proposed by the EBC, namely Pyrogenic Carbonaceous Material (PCM). When PCM meet all other threshold criteria of this biochar certificate, they may be marketed as EBC certified Pyrogenic Carbonaceous Material (PCM). PCM have a high nutrient content, therefore representing possibly valuable fertilizers (additive). On the right vertical axis of Figure 4 the biochar yields (in green) are depicted, which represent the product obtained per kg fresh biomass input in the reactor. From Figure 4 we can observe that increasing the slow pyrolysis process temperature from 400 °C to 600 °C resulted in a decreased char yield and subsequent increase in the yields of product gas. With increasing process temperature, the biochar yield is decreasing, as more mass is reacting to product gas. The gasification medium also plays a major role; with more oxidative (reactive) environments the biochars yield decreases as more product gas is formed instead due to the reactive medium.
Figure 4. Biochar yield and C content in ash as mass fractions, %.
Agriculture 05 01076 g004
Figure 5 depicts the normalized distribution of input feedstock energy into biochar and product gas energy. The input feedstock energy is calculated from the mass flow (in kg·s−1) entering the reactor unit multiplied with the Higher Heating value of the feedstock. The energy contents of the product streams, either biochar or product gas is also their HHV, times the mass flows. In the pyrolysis unit the largest fraction of input energy remains in the biochar, which the main product in this case. The energy distribution does not differ between the small and the larger scale gasifier, as the same conditions and parameters were applied. Of course in that case the main product is gas that also receives the largest energy share of the parent material.
The ash content as well as composition plays a major role in actual yields, on the one hand, greenhouse waste (agro waste) is high in nutrients and volatile ash compounds, so at higher temperatures the ash content may actually decrease as shown in Figure 5. The carbon yield therefore depends on the total ash and biochar mass yield; both are affected by the feedstock and the process technology.
Figure 5. Normalized energy distribution of the input feedstock into biochar and product gas.
Agriculture 05 01076 g005

3.2.3. Biochar Properties of Agronomic Relevance (WHC, Density, pH, EC, Salt Content)

Table 5 shows the water holding capacity, the pH, electric conductivity, density and salt content of the biochar samples.
Biochar, as expected, show generally low bulk density. As density correlates with the ash concentration, high ash biochars show somewhat increased density compared with the biochars from rather pure woody feedstock.
The manure biochars as well as the agro-waste biochars (GHW 1 and the blends of GHW 2) show high values of electric conductivity (EC), which is due to the high concentration of salts, also shown in Table 5. The link between high EC values and high salt concentration is expected and obvious from the table. The pH values are generally rather high in all biochars, with the values increasing along with the nutrients concentration in the biochars, at least to some extent. In the next paragraphs a closer look into these values will be given and some discussion on possible correlation of those values is presented as well.
Not all biochars may be suitable as soil improvers when not being mixed with other streams. Some feedstocks (e.g., poultry and swine litter) are rich in minerals, and produce biochar with high pH values and salt (ash) content as shown in this work, and they would cause osmotic stress in plants when used in larger amounts. Quality criteria for biochar suggest pH values less than 10, but there are no definite conclusions based on soil trials, while the interactions between the biochar and the soil may also change the biochar pH value after some time. No limits yet exist on bulk density, specific surface area, porosity and water holding capacity, but they need to be available and listed as indicated in the IBI and EBC criteria and guidelines.
Table 5. Biochar properties of agronomic relevance.
WHC (%)Bulk Density (kg·m3)True Density (g·cm3)EC (μS·cm−1)pHSalt (g·kg−1)Salt (g·L−1)
Slow Pyrolysis
GHW 1 600 °C/60min1391501.89173009.346.87.03
GHW 1 400 °C/60 min-1971.67164009.444.68.8
GHW 1 600 °C/60min /1% O2-1361.68133009.0364.9
Oak 600 °C/60min772311.716609.74.51.04
Oak 400 °C/60min7.52731.5613208.33.60.48
GHW 1 steam 600 °C75n.a.n.a.n.a.12.0n.a.n.a.
GHW 1 air 600 °C82.5n.a.n.a.n.a.9.9n.a.n.a.
GHW 1 inert 750 °C162.5n.a.n.a.n.a.10.6n.a.n.a.
GHW 1 steam 750 °C194n.a.n.a.n.a.11.6n.a.n.a.
GHW 1 air 750 °C227.5n.a.n.a.n.a.10.6n.a.n.a.
RH steam 750 °C742022.3218208.92.40.49
RH air 750 °Cn.a.n.a.n.a.n.a.n.a.n.a.n.a.
CM steam 750 °C524122.563960012.452.321.5
CM air 750 °C237602.54280012.356.743.1
SM steam 750 °Cn.a.n.a.n.a.n.a.n.a.n.a.n.a.
SM air 750 °Cn.a.n.a.n.a.n.a.n.a.n.a.n.a.
GHW 1 670 °C2841041.8117001132.63.4
GHW 1 750 °C2341291.81290011.567.48.75
Wood SBB 670 °C2171021.755988.51.680.17
Beech wood 670 °C861432.1203011.95.50.79
Beech wood and GHW 2 blend (80%–20%) 670 °C1711311.7596010.216.72.19
Wood SBB and GHW 2 670 °C2101131.893801125.72.9
n.a., not analyzed (not enough material); GHW 1, Greenhouse waste 1 (pepper residue); GHW 2, Greenhouse waste 2(tomato residue); wood SBB, residual garden waste; CM, chicken manure; SM, swine manure; RH, rice husk.
Biochar produced from clean wood has very low ash content due to the very low ash content of the parent material. Peat based growing media are acidic and limed to adjust the pH. If biochar is used as an additive to peat, it can replace lime at the same time as replacing some of the peat. Adjusting pH and the selection of ideal particle sizes needs further research and enables optimization.

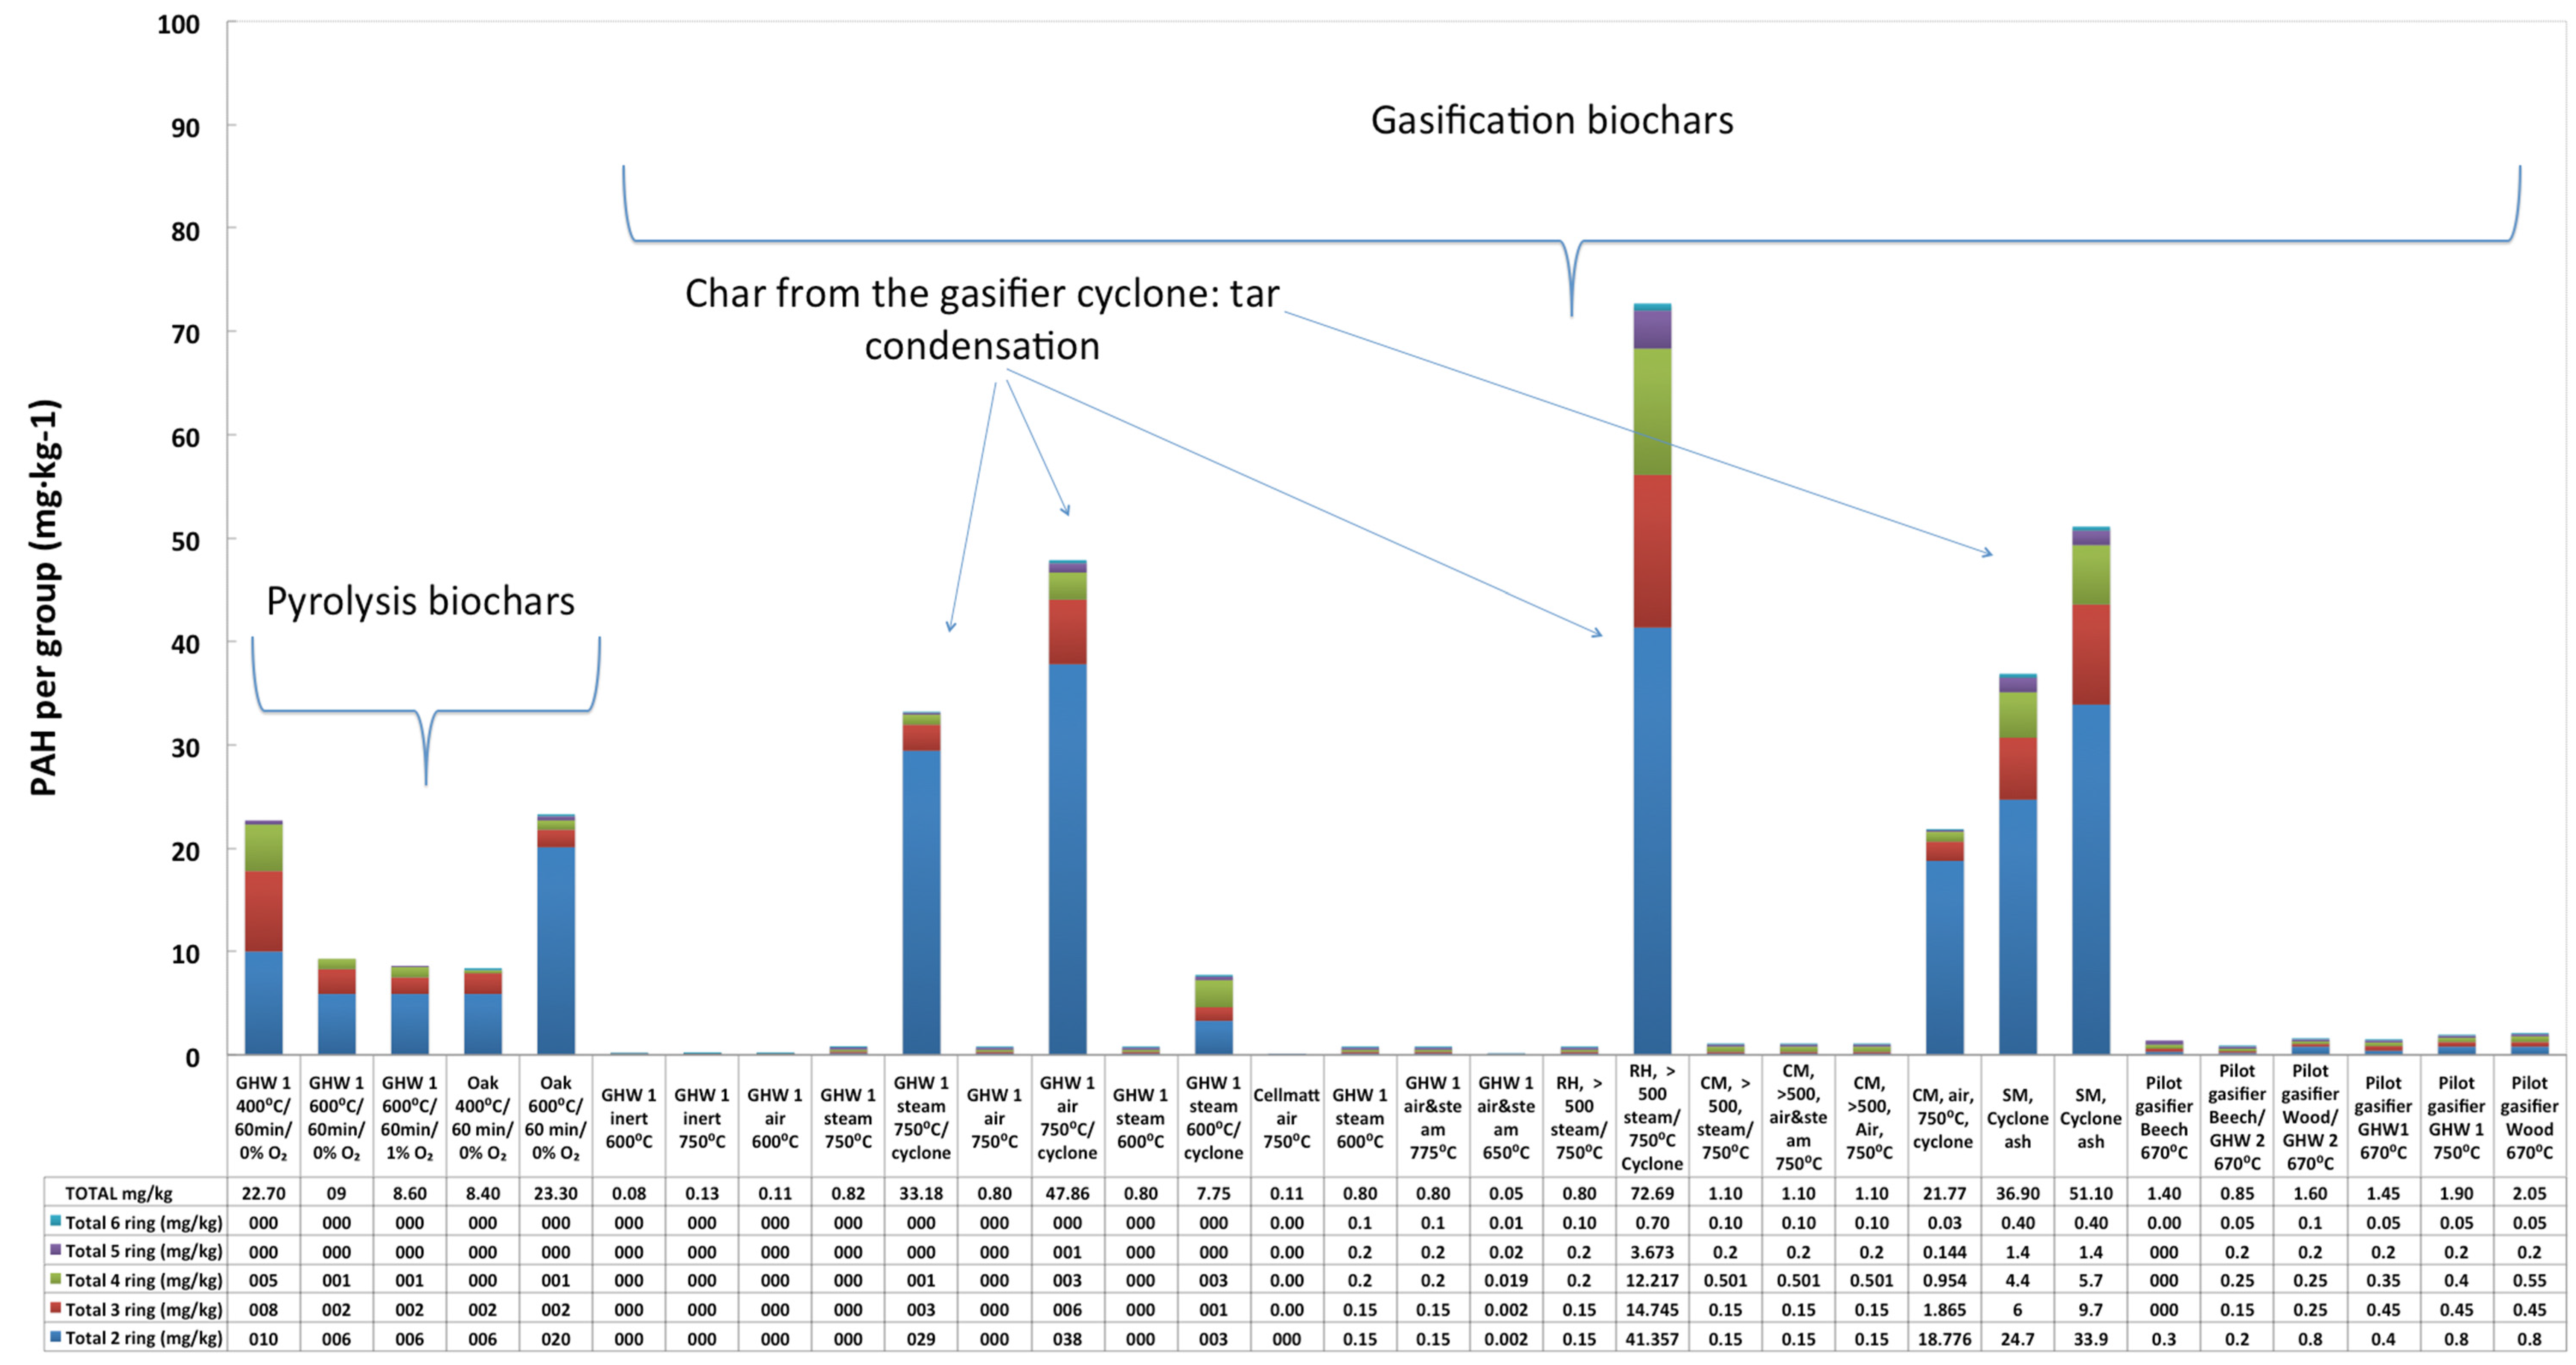
3.3. Polycyclic Aromatic Hydrocarbon Levels

In Figure 6, the biochar content of the 16 priority Polycyclic aromatic hydrocarbons (PAHs) according to the Environmental Protection Agency (EPA) are shown. The IBI and EBC guidelines agreed on these 16 compounds as the most critical to be measured. It can be seen that all gasification biochar samples obtained from the fluidized bed reactor show very low levels of tars. Pyrolysis PAH levels are significantly higher, making the influence of reactor temperature as well as process quite clear. During the gasification process in the bubbling fluidized bed, in an ECN-optimized process for biochar production, the biochar was “harvested” from the bed surface section (Figure 2), leading the tar-loaded product-gas away to prevent condensation of tars on the biochar surface. The collection of biochar in a container outside the bed is carried out under inert atmosphere to quench the product and prevent any further product-gas and biochar interaction. As can be seen in Figure 6, this is highly effective as the bed–derived gasification biochars result in 16 PAH values 1 mg·kg−1 to 2 mg·kg−1 compared to values of 8 mg·kg−1 to 23 mg·kg−1 for the pyrolysis samples, even though in the slow pyrolysis unit a counter-current gas flow of Ar or N2 was used along the production screw to flush away the tar loaded gas in attempt to prevent tar condensation. The comparison with the cyclone harvested char and ash of the gasification tests, which all have high PAH values (the higher bars in Figure 6, shows something very important for the biochar quality, namely, that the PAH concentrations is not solely related to the production process but also to contact-time of gas and char and the local temperature condition (still to reach the peak temperature or already in the cooling range). Taking the biochar out from the bed-section after some residence time at elevated temperature prevents the condensation of tars from the gas on the biochars, which were obviously present in the reactor, proven by the cyclone chars of the same experiment and hence the same char-production process and same process conditions.
According to the thresholds suggested by the IBI and the EBC, the total PAH (EPA’s 16 priority pollutants) need to be below < 12 mg·kg−1 for basic grade biochar and <4 mg·kg−1 for premium grade. The gasification biochars derived from the bed are within the Premium grade quality. There are currently discussions on whether the EPA 16 tars (16 major PAHs) is a sufficient quality marker for biochar in soil applications. The current thresholds in the IBI and the EBC stem from safety guidelines referring to leaching to the soil; with the most stringent limit of 4 mg·kg−1 that represents the Swiss guideline. Several research groups [68,69] have studied the effect of PAH under water leaching conditions in soil, or have further quantified polar as well as non-polar tar components because especially polar compounds such as phenols are believed to have phytotoxic effect on some plants growth; those compounds are not included in the EPA 16 PAH method. There are no conclusive studies so far on the identification and quantification of compounds with a toxic effect and on what plants, therefore it is expected that a number of studies will emerge looking on this issue.
The concentrations of 16 EPA PAHs determined by toluene extractions can differ from the concentrations of water-soluble PAHs that can be an order of magnitude lower. In [68,69,70] despite the concentrations of the 16 PAHs exceeding biochar guideline values, it was concluded that, the biggest concern for application to soil would be the co-occurrence of volatile organic compounds (VOCs) such as low molecular weight (LMW) organic acids and phenols, as these can be highly mobile and have a high potential to cause phytotoxic effects. Therefore, it is strongly suggested for VOCs to be included among criteria for assessment of biochar quality [68].
Figure 6. Polycyclic aromatic hydrocarbons (PAH) per group (1-5 ring tars) for each biochar sample. The first five columns refer to the pyrolysis biochar samples. The next biochars come from the gasifier, some of the columns are marked ‘cyclone’, representing material analyzed form the cyclone part at the reactor exit. The last six columns represent the biochar samples from the larger-scale gasifier (from the bed). Please note that in every column the results are presented, even if the amounts are hardly visible.
Agriculture 05 01076 g006
In order to avoid significant VOC levels in/on char altogether, sufficient residence time, temperature and/or oxidation is required but in case those criteria are met the condensation of VOC-rich gases onto the char surface must be avoided in the same way as for the PAH-condensation described above. In the cyclone, char that has moved co-current with the gas flows is expected to have VOC condensed on its surface as long as VOC are present in the gas phase. This is one of the major conclusions and needs to be taken into account when designing a production process for biochars to be used for soil application. At ECN, the larger-scale gasifier was already modified for the continuous “harvesting” of char from the bed so as to avoid tars condensing on the biochar. It is thought that it will work equally well for avoiding VOCs on biochar, but this still needs to be proven.
A relevant question, related to PAH/VOCs, would be if the product-gas with the non-converted carbons would not pose a technical or environmental problem at another part of the process. However, in contrast to the small-scale gasifiers used in this study, the aim for the larger scale will be to use secondary air in the freeboard (the free space above the bed section) and thereby combust the remaining hydrocarbons and lead the high temperature gas to a conventional stream (and cleaning) process for energy generation. Hereby, the tar-laden-chars from a cyclone will be gone, since the gas cleaning will come after burning the hydrocarbons in the gas phase and thereby the gas-cleaning will collect carbon-free ash only. For the larger scale we envisage this combined energy and char production therefore to take place in a two-step combustion installation, where the bed is operated at gasification mode to produce the biochar at relatively low temperatures while the second part of the installation will be under conventional combustion (higher temperature) conditions. ECN currently works on scaling-up this concept to include the secondary air combustion in a pilot-scale installation of (0.02–0.1) kg·s−1 feedstock mass flow input for combined energy and biochar production.

3.4. Surface Properties (Total and Specific Surface Area, Pore Volume and Pore Size)

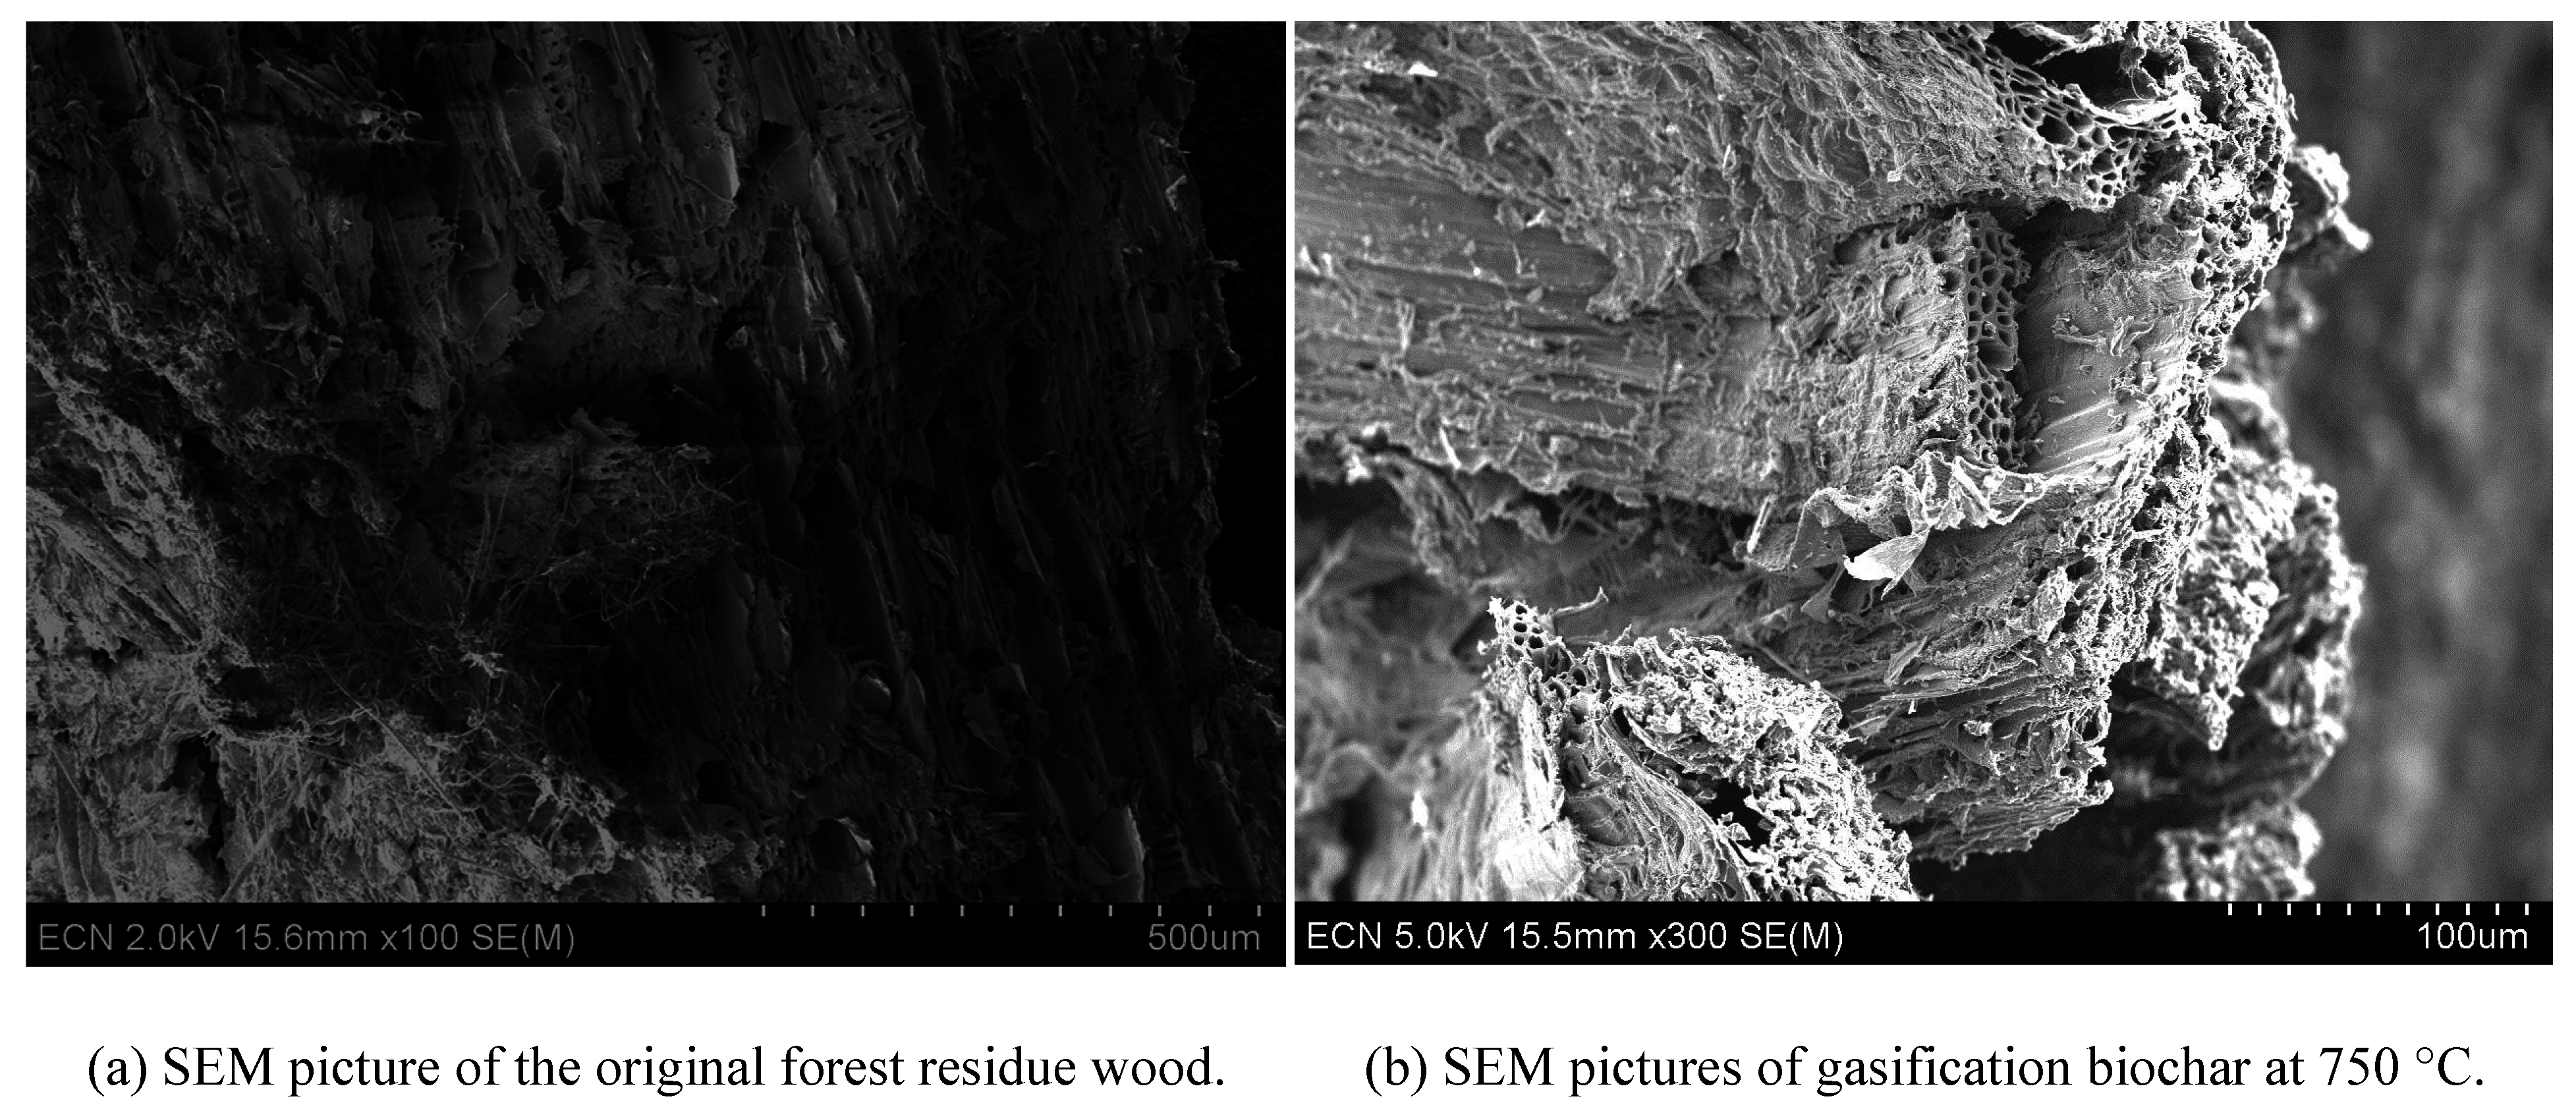
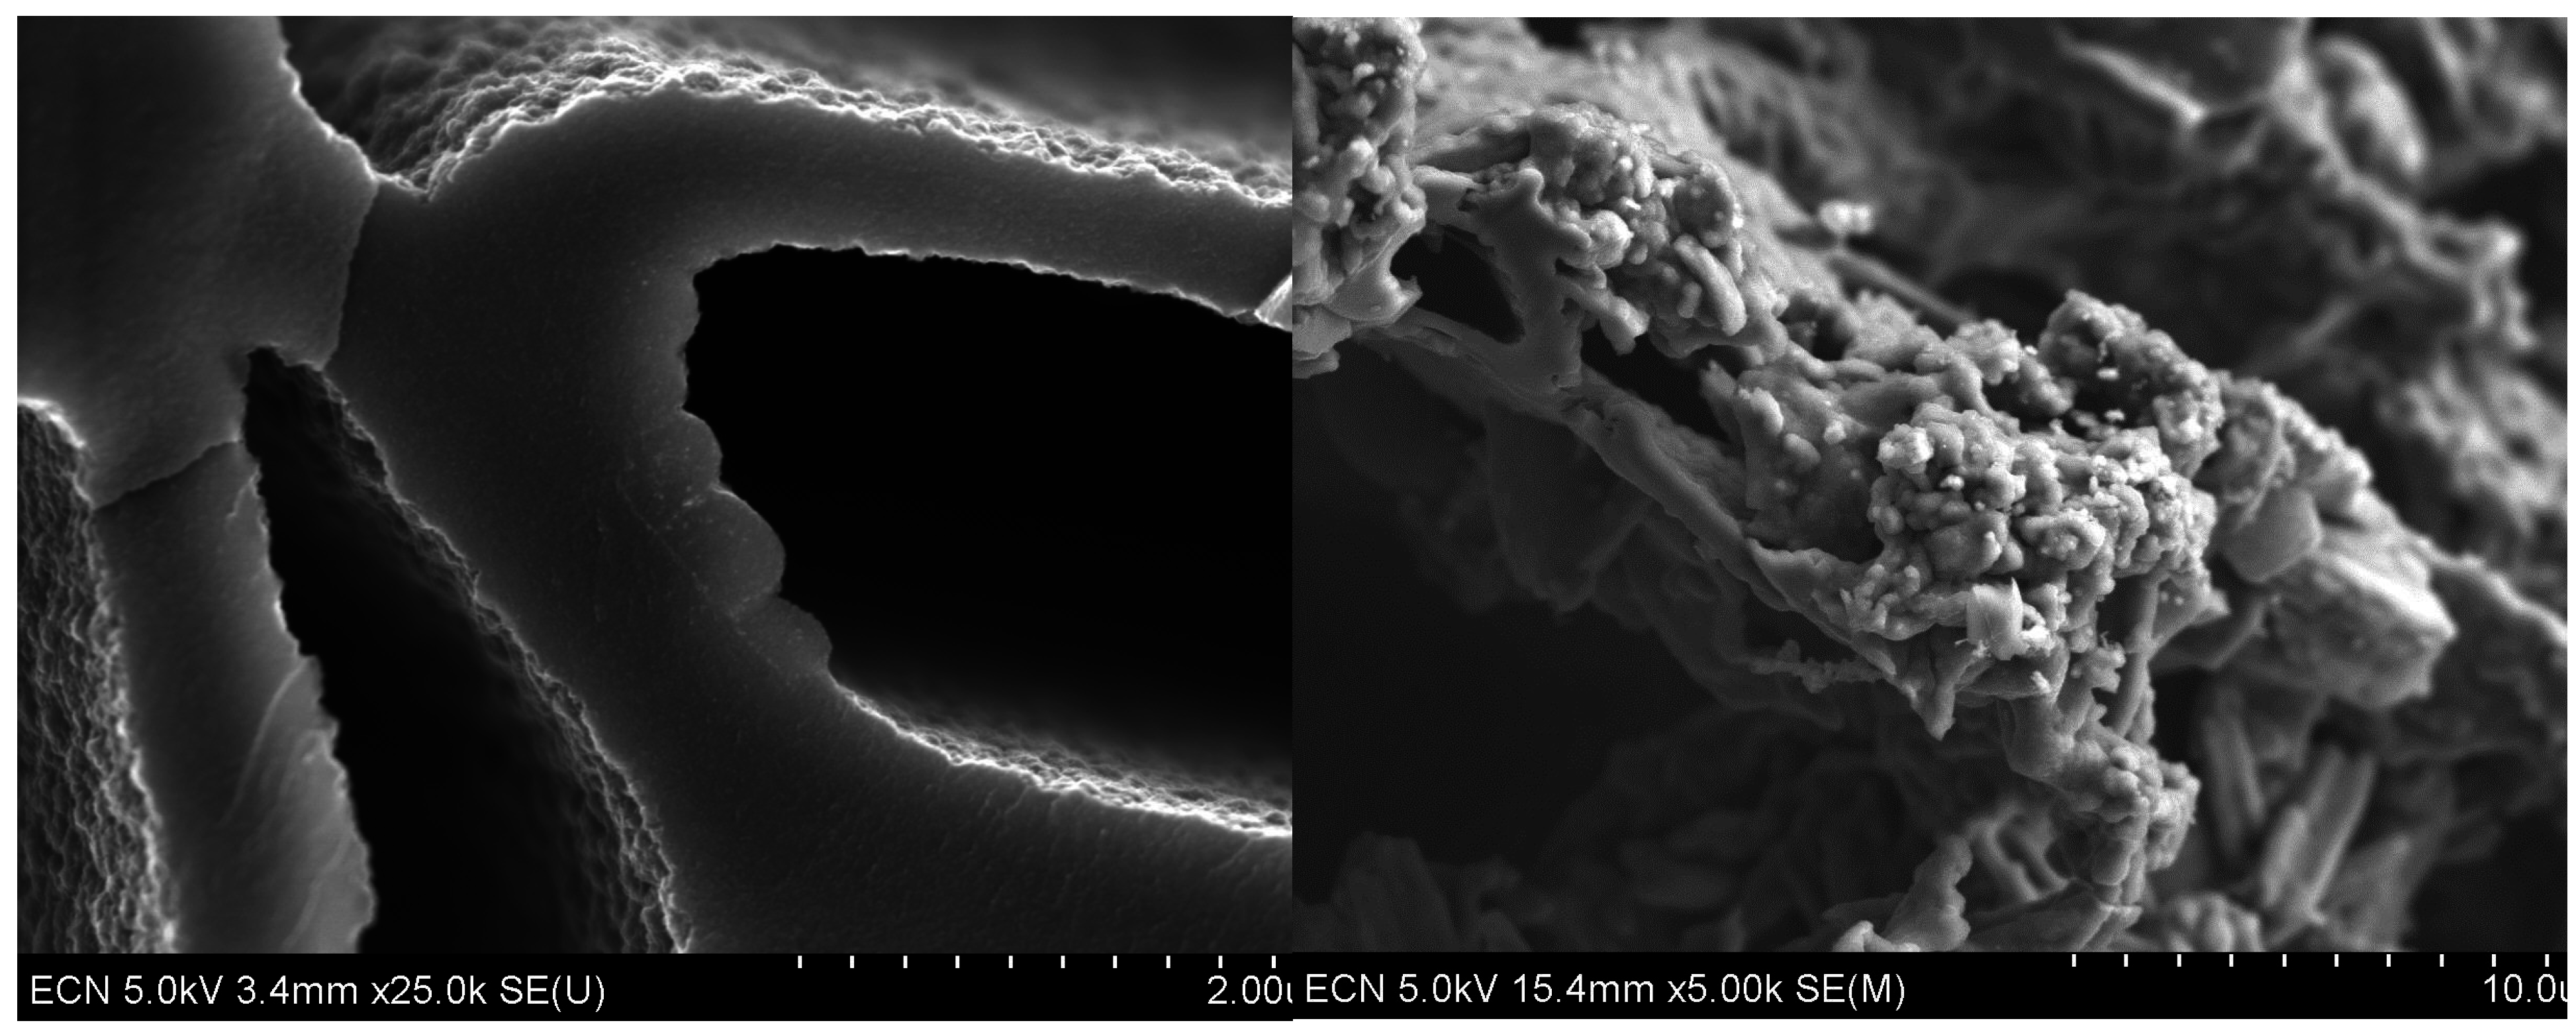
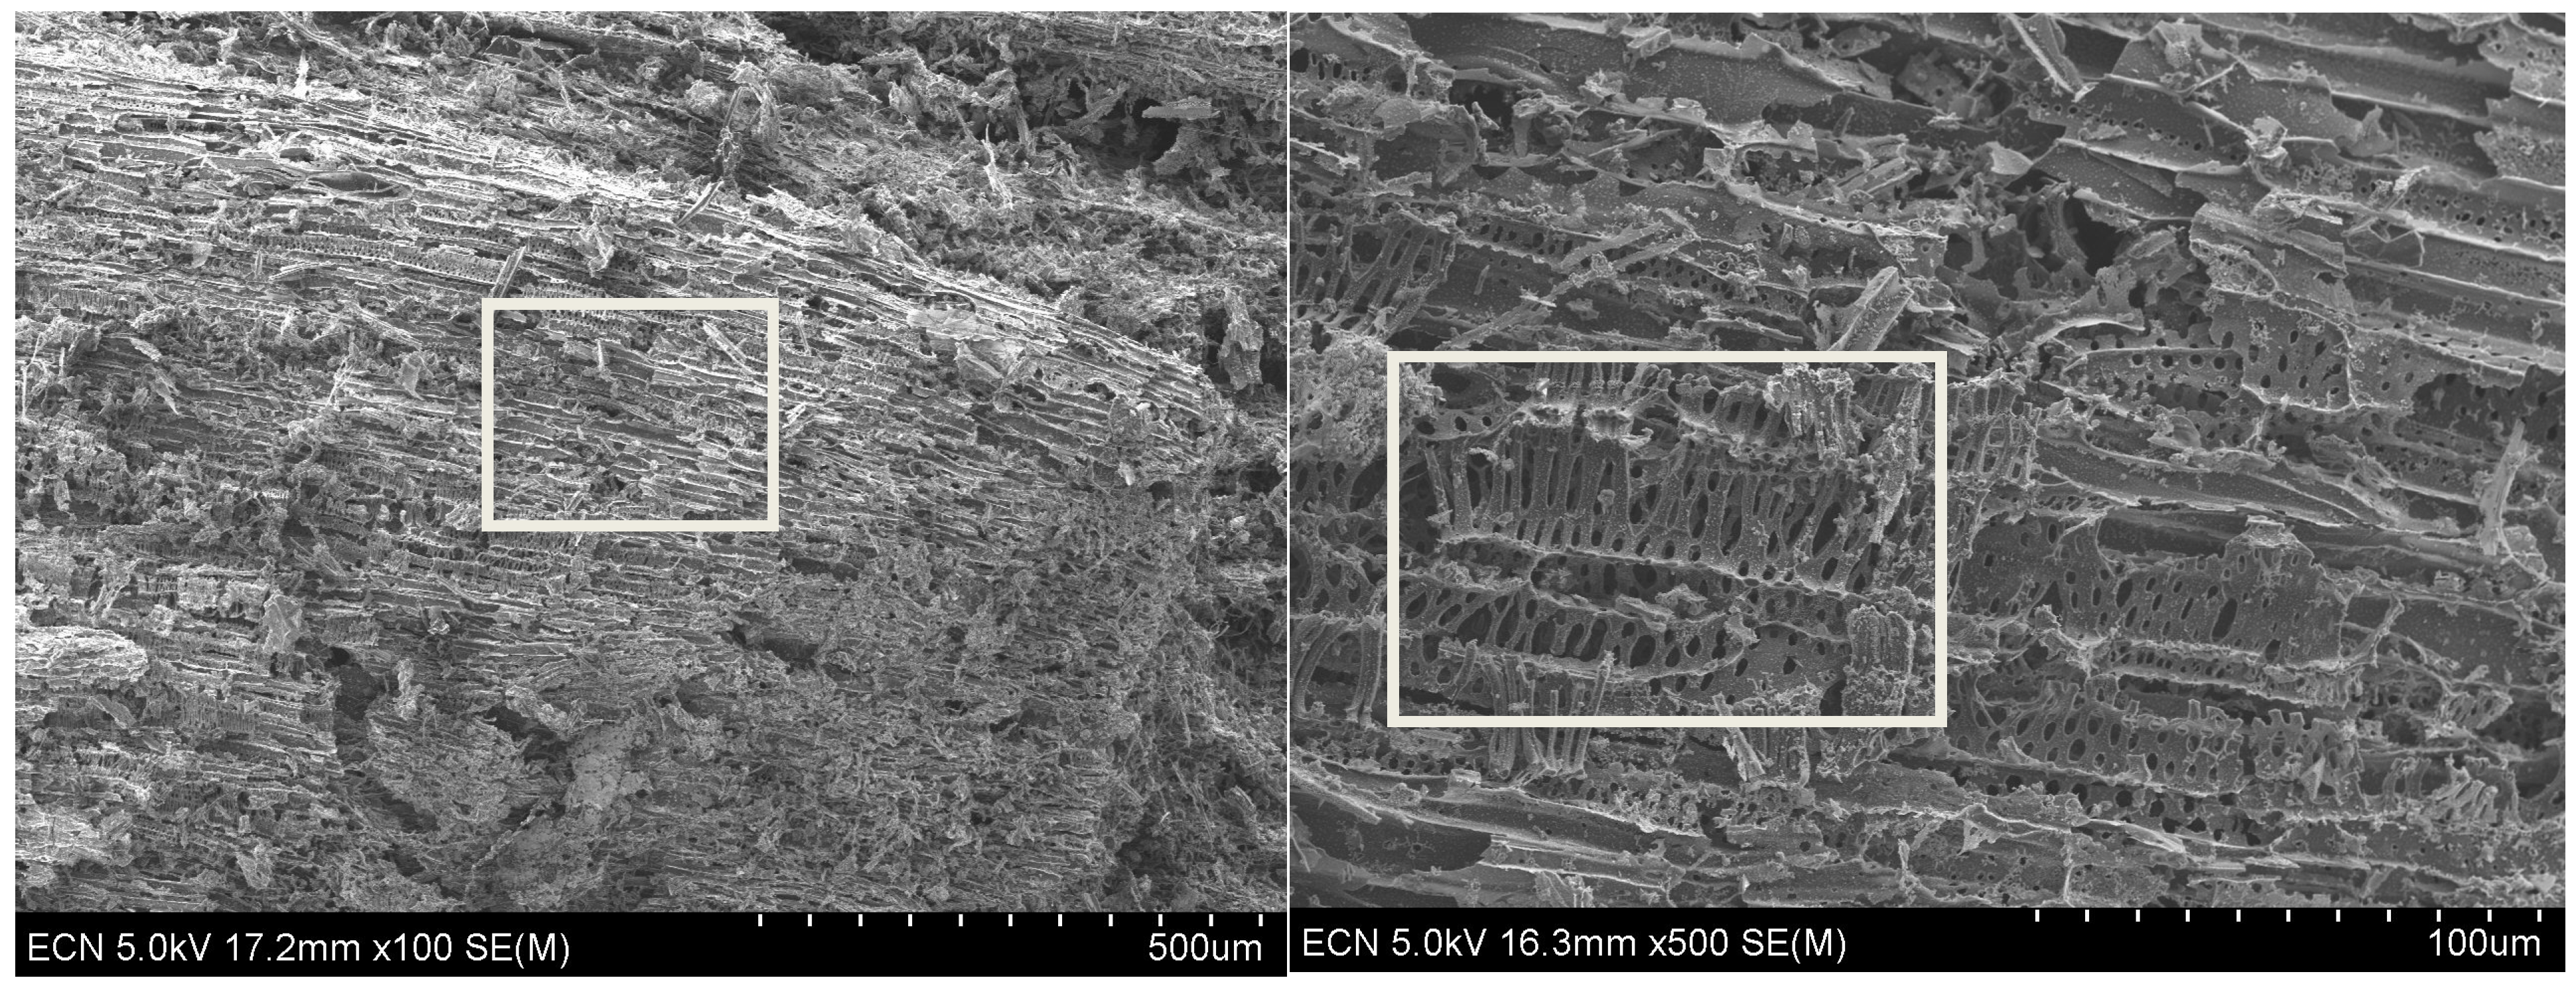
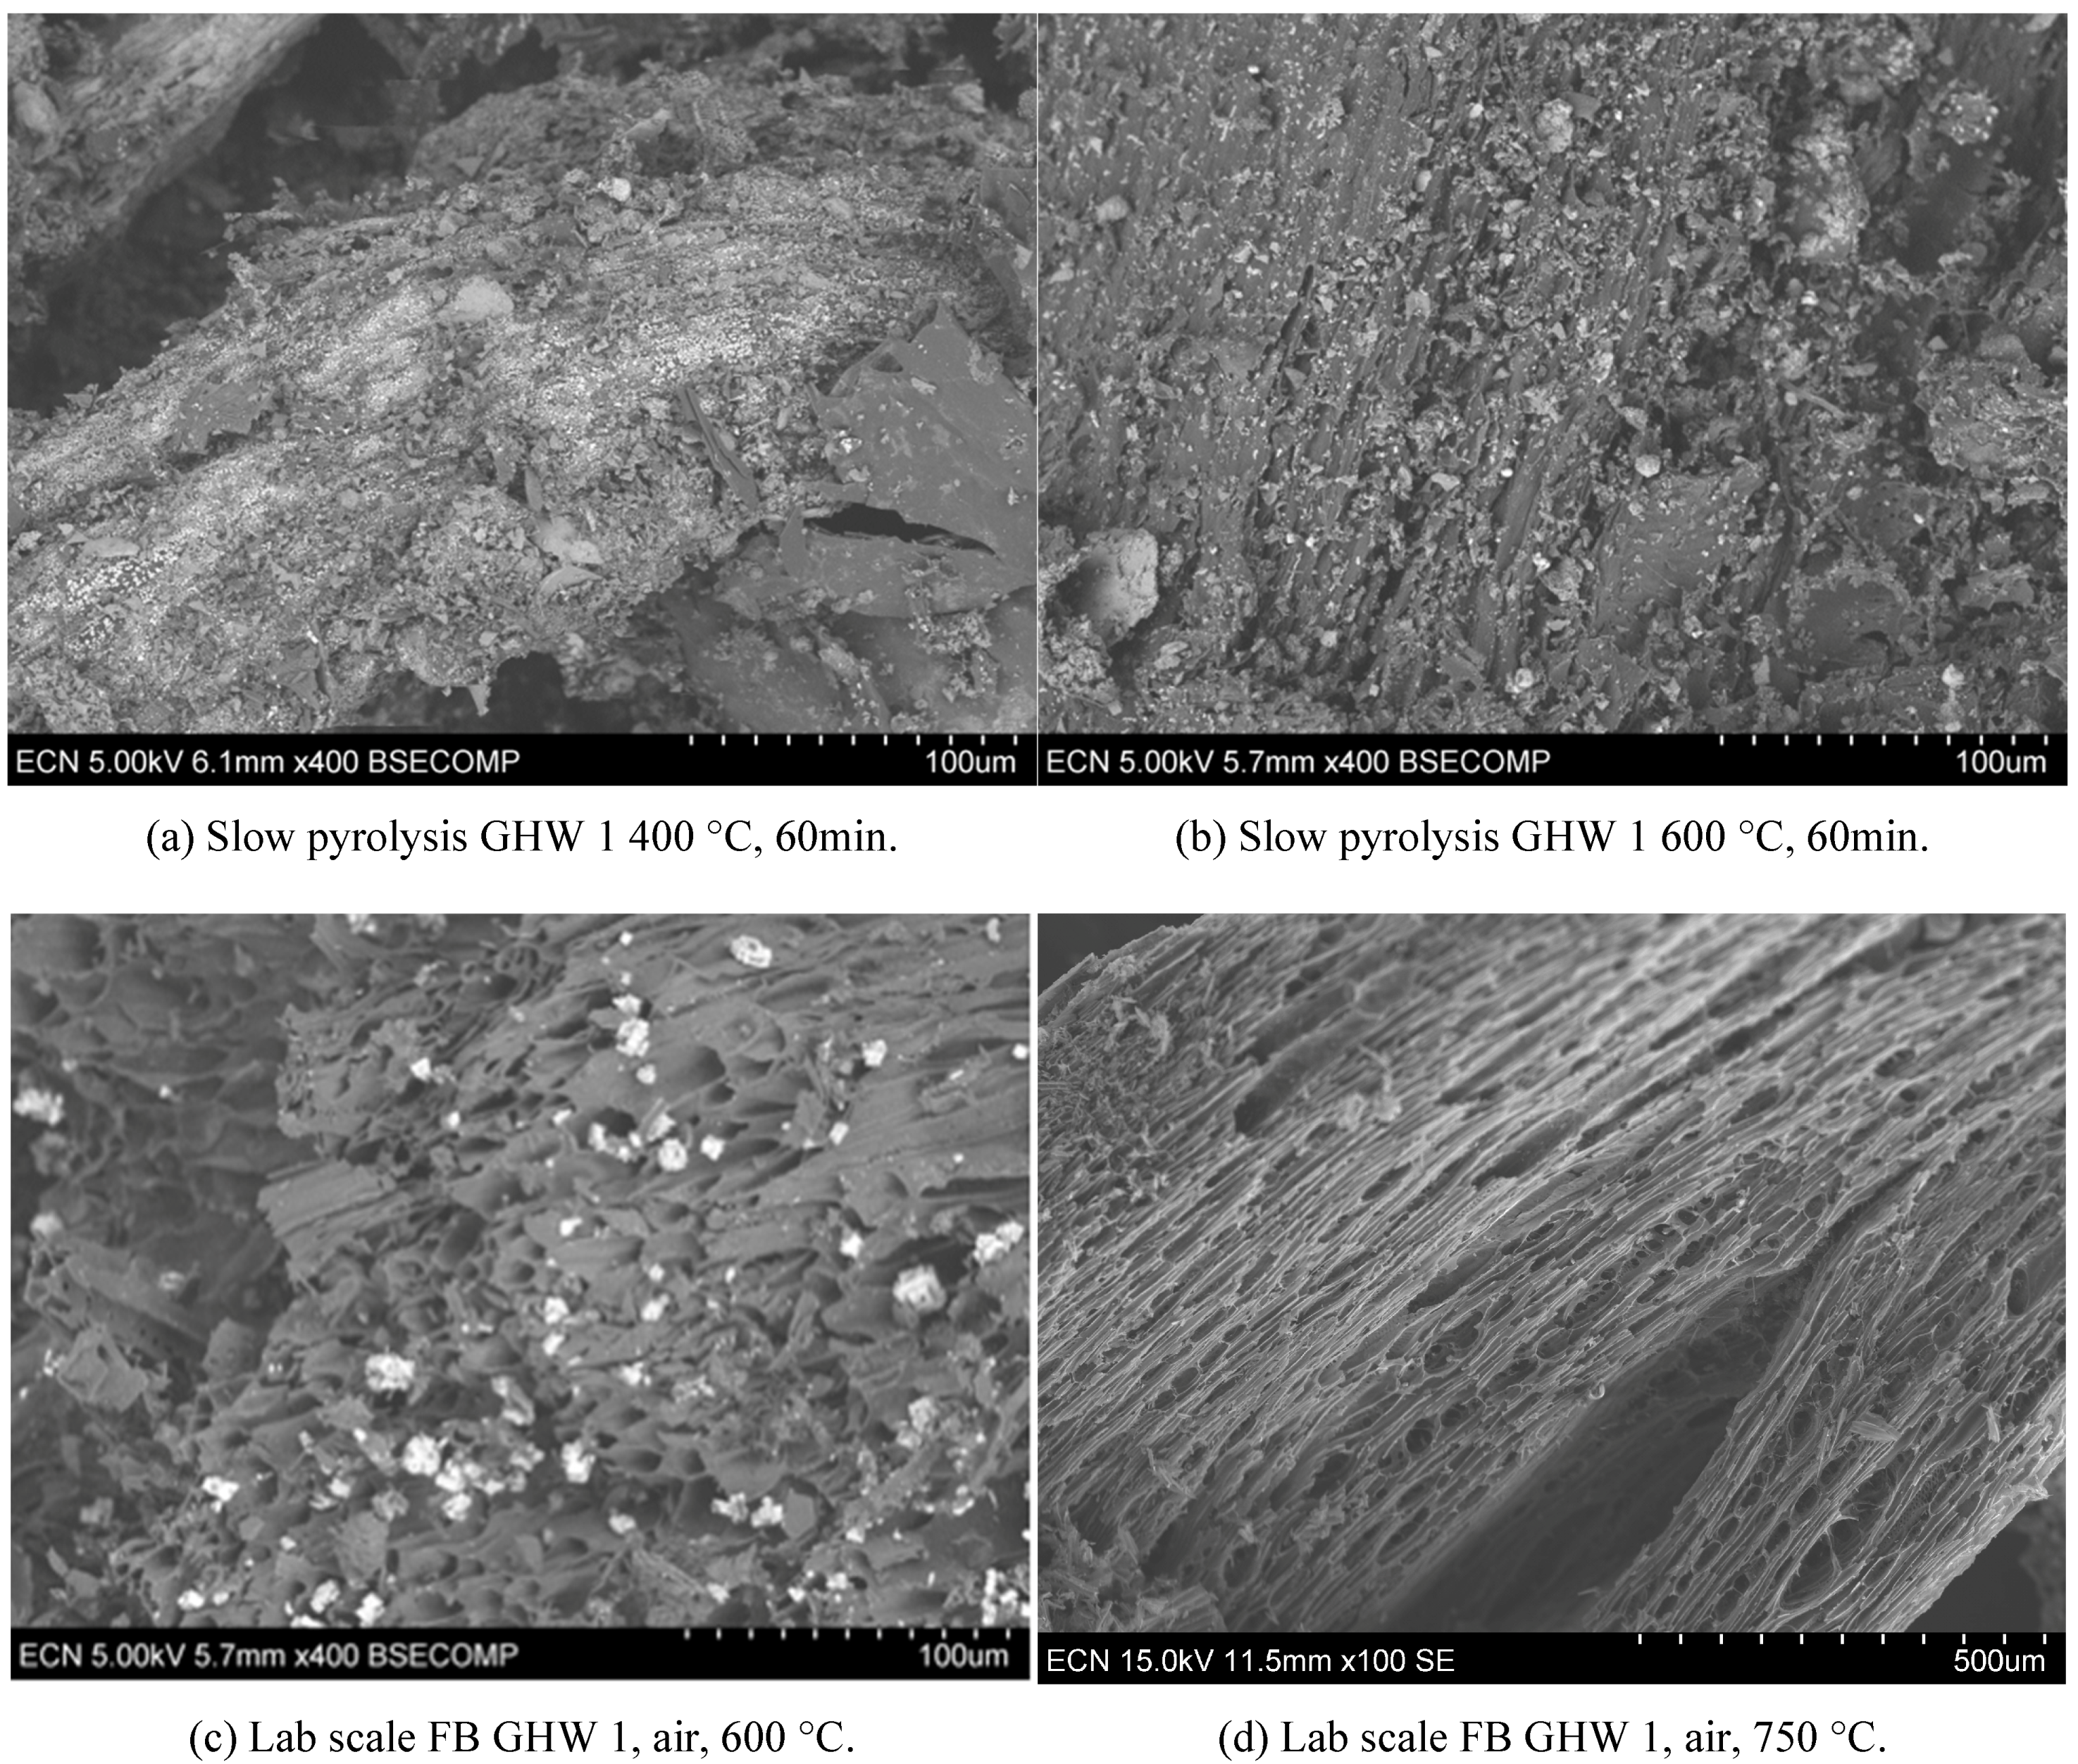
3.4.1. Scanning Electron Microscopy

Because porosity, volume, size and distribution are important parameters in the quality criteria and specific uses of biochar, scanning electron microscopy (SEM) is carried out to both visualize and confirm porosity distribution and pore sizes of the various residue materials. An important finding, in line with present general knowledge, is that the biochar porosity is largely but not completely determined by the porosity of the parent material. This is shown when comparing the pictures in Figure 7 on the forest residue wood (left) with the picture of the biochar made from this feedstock (right). The main porosity structure, as can be seen in Figure 7, consists of the typical long channels in wood, but also smaller pores can be recognized. In the right-hand side picture it can clearly be seen that the same channel-structure as in the original parent material (left-hand-side) is still present.
Figure 7. Comparison of the porosity in the original feedstock and the biochar.
Agriculture 05 01076 g007
Two pictures of the same biochar as shown in Figure 7 are taken at increased magnification and shown in Figure 8. While the large channels have prevailed and look very clean (left side picture) the finer porosity present in the parent material seems to have been lost. At the same time, some zones richer in ash and carbon condensates have been created as illustrated in the right-side picture in Figure 8.
A comparison can also be made between various biochars, produced at the same conditions but having different structures due to different parent material. Figure 9 below illustrates biochar made from greenhouse waste, more specifically from pepper leaves and stems (GHW 1), which can be compared with the wood biochar shown above. While at small magnification the channel structure of the GHW 1 biochar looks fairly similar to that of the wood, the differences become apparent while zooming in at higher magnifications. The structure remaining in the biochar is showing patterns of much finer porosity for the green house waste than for the wood and this will have important implications for the use and behavior of the biochar.
Figure 8. Magnifications on the forest wood residue biochar from the pilot scale gasifier. On the left-hand side the very clean large channel structure and on the right-hand side a zone with some condensed ash and carbon-condensates.
Agriculture 05 01076 g008
Figure 9. SEM microscopy photographs from the greenhouse waste from pepper (GHW) 1 biochar samples produced in the larger lab-scale gasifier.
Agriculture 05 01076 g009
Figure 10 shows SEM pictures taken from the pepper greenhouse waste biochar samples under pyrolysis and gasification conditions. It is observed that slow pyrolysis biochars show a less porous structure and a less clean appearance. Gasification biochars are more porous, especially those produced at higher temperatures.

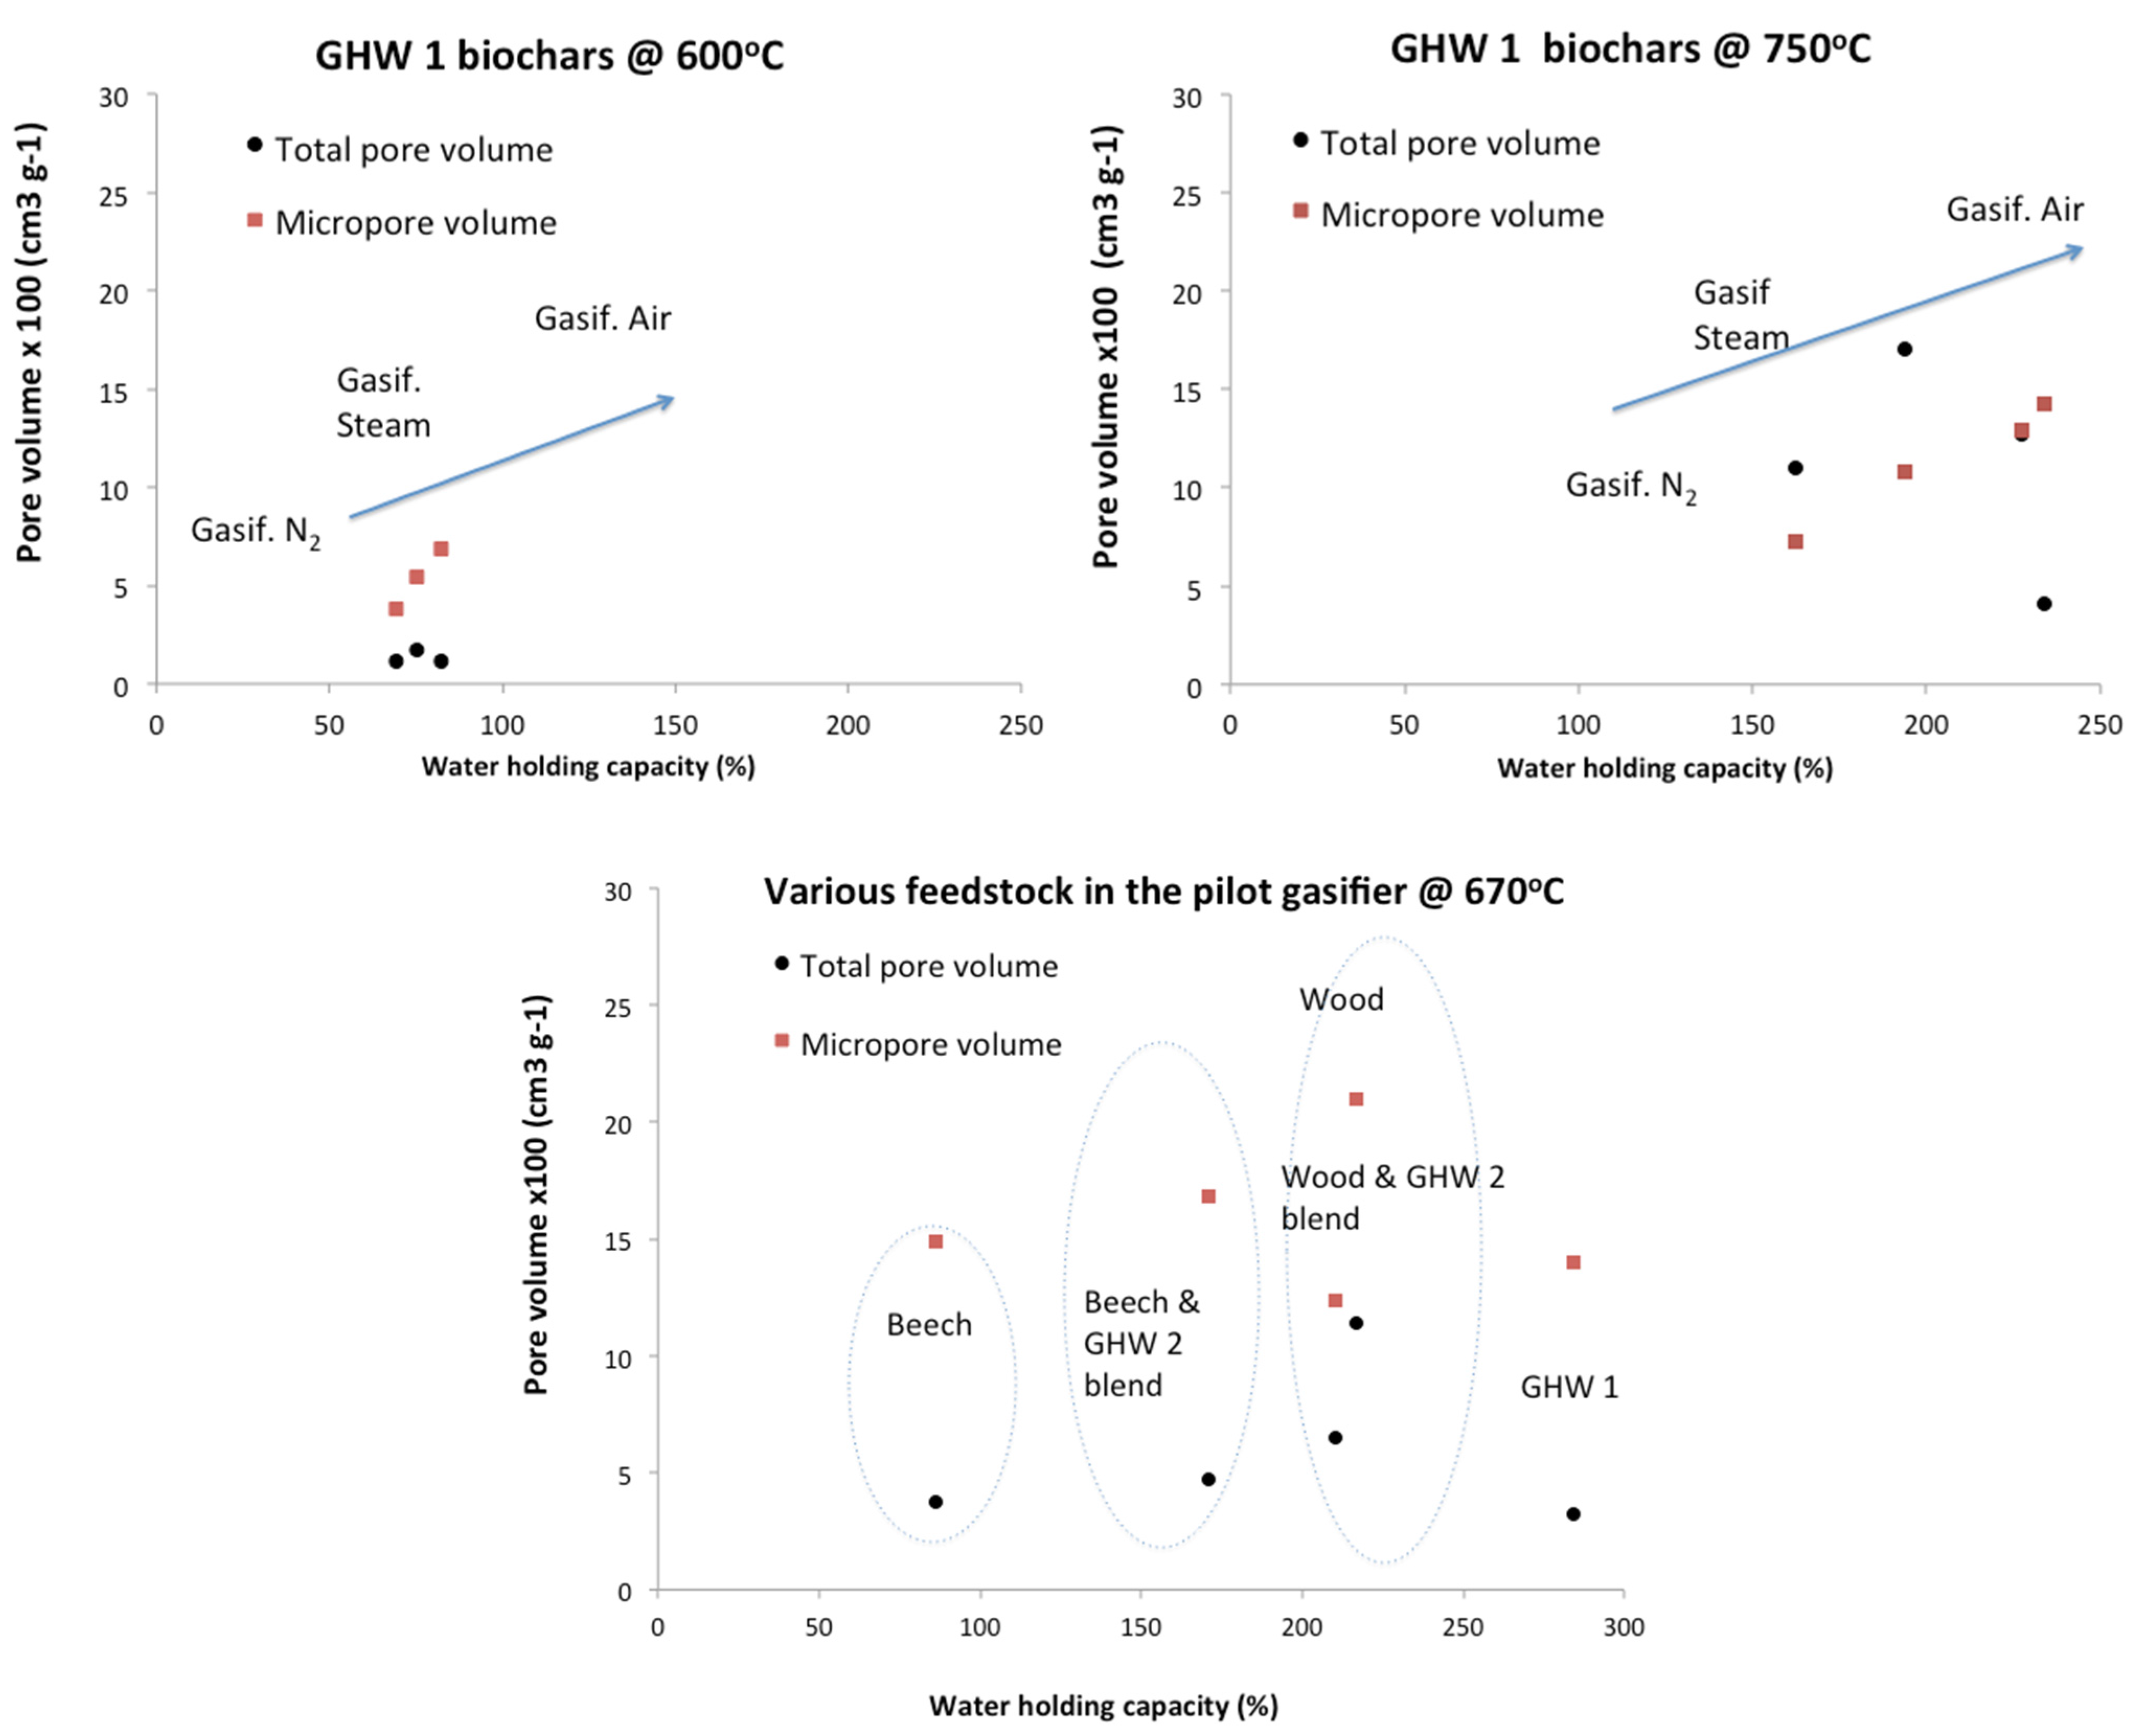
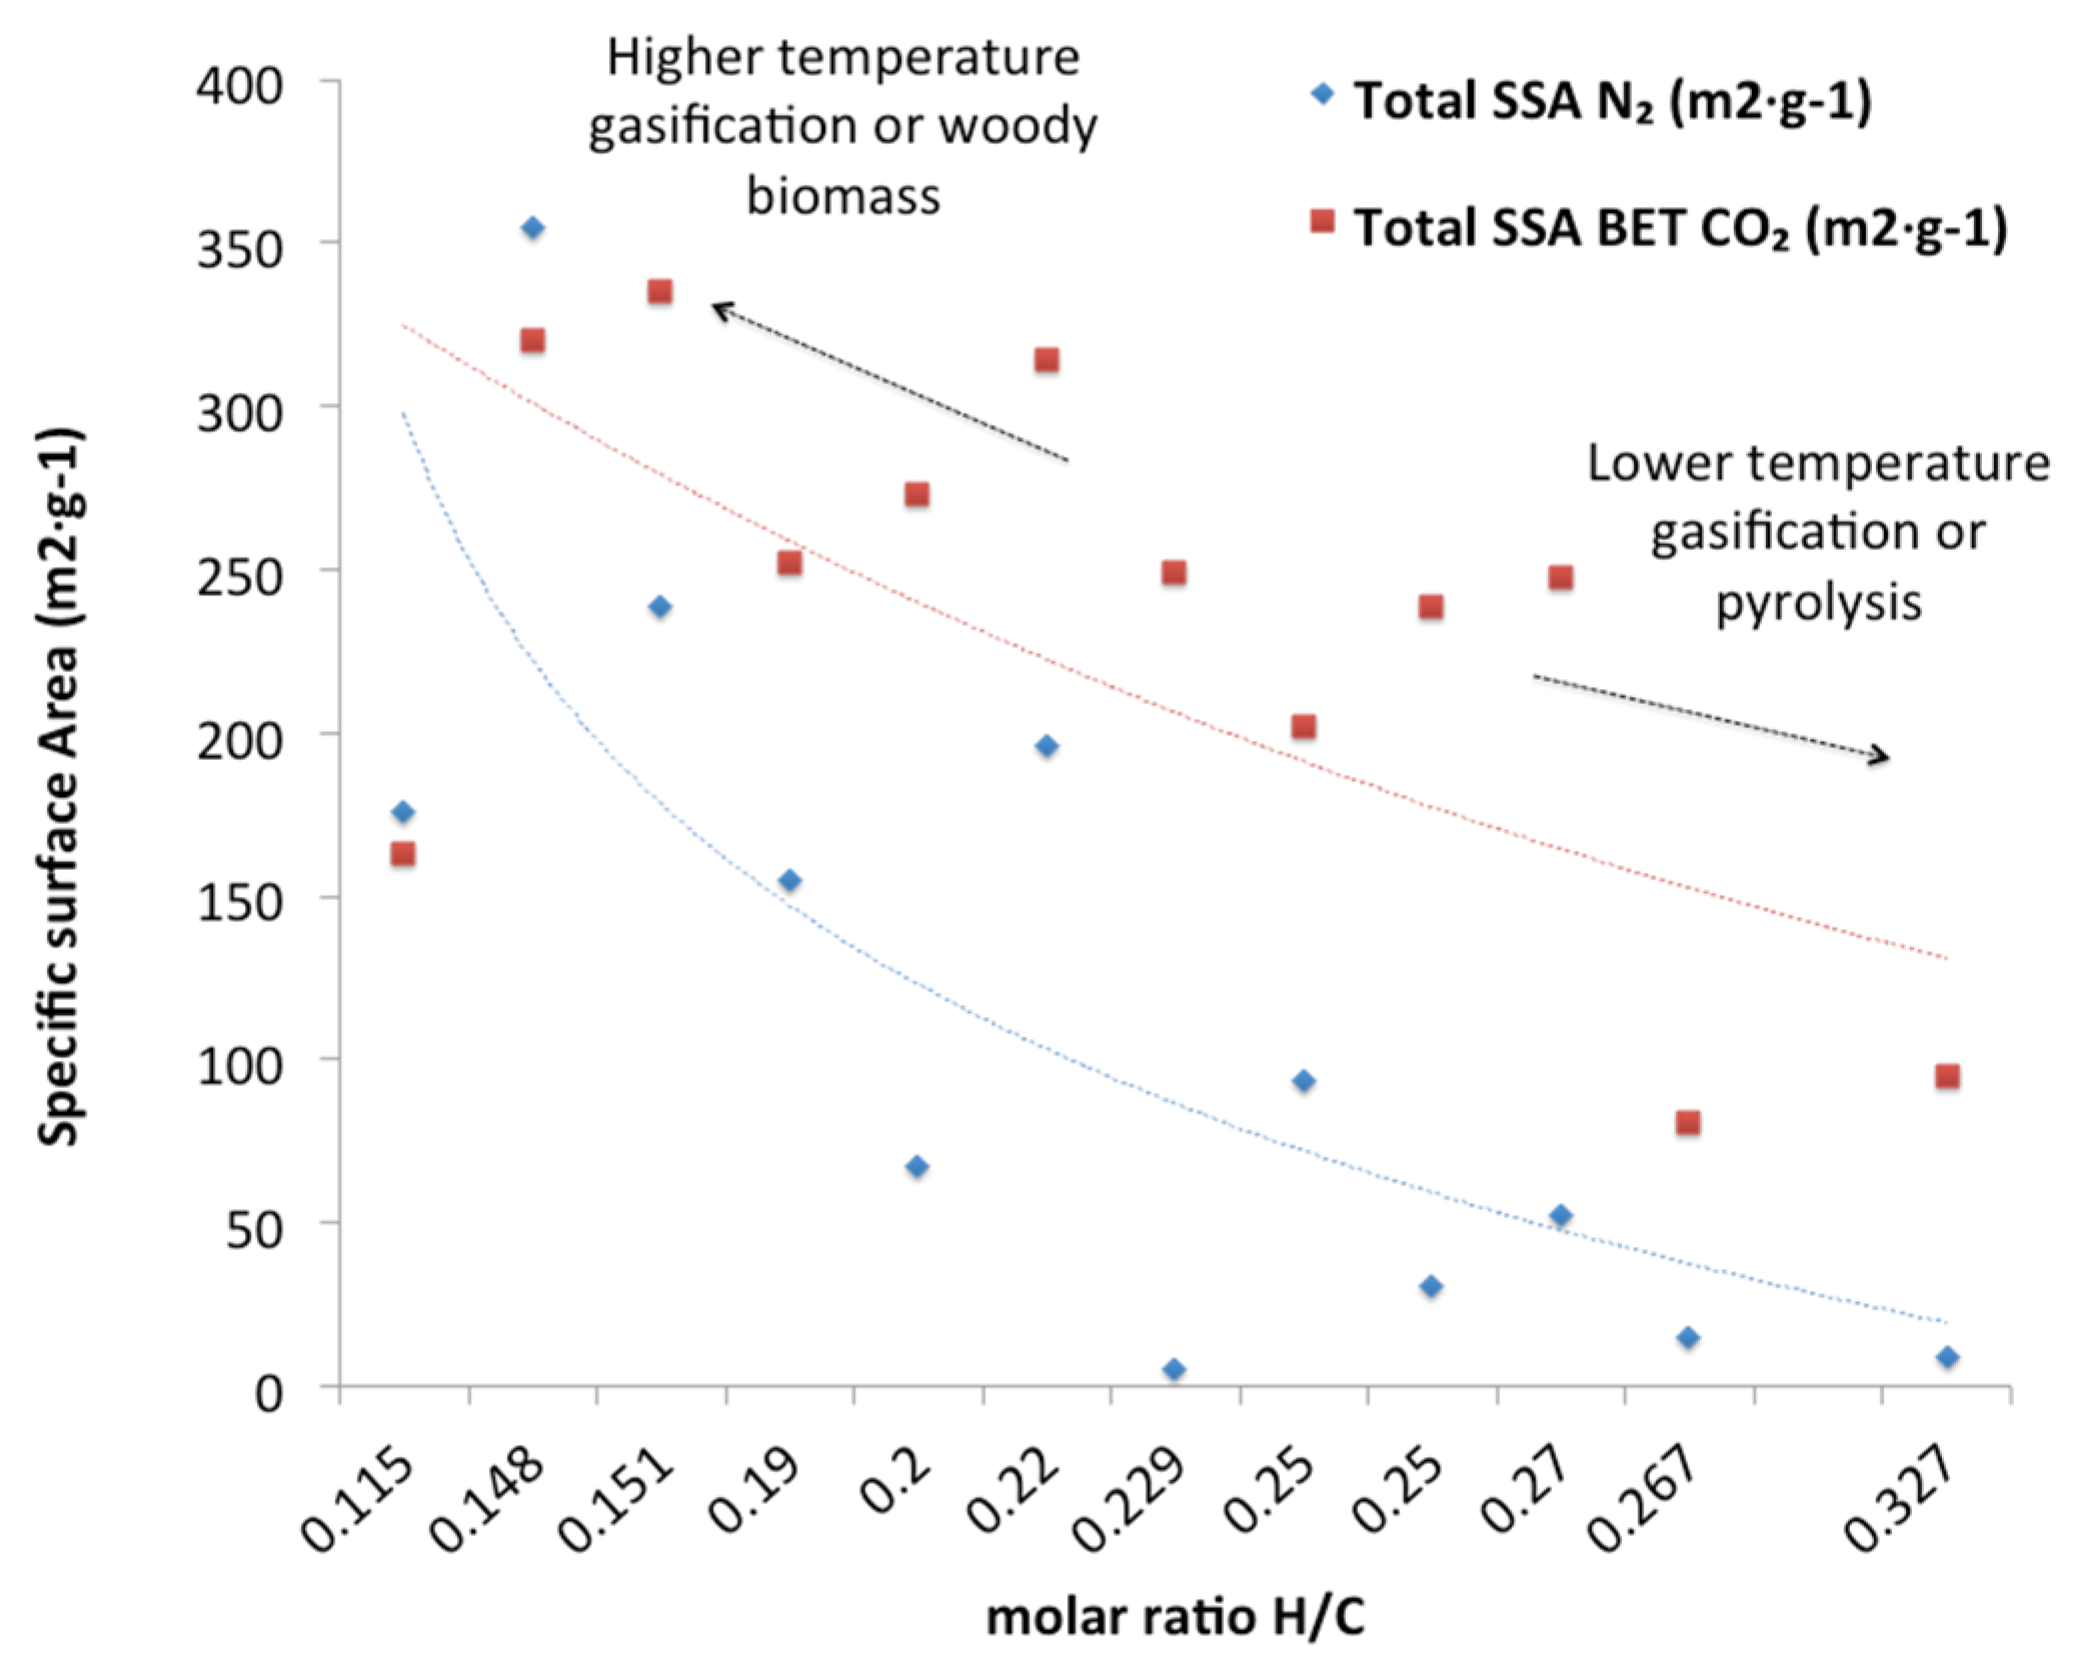
3.4.2. Surface Area, Pore Volume and Relation to Water Holding Capacity

In an attempt to zoom in further on the relation of process conditions and resulting porosity and related water holding capacity a series of samples was characterized in detail on the pore volume, pore-size distribution (at least larger or smaller than 2 nm) and total surface area. The findings from the SEM study must be taken into account, i.e., although porosity may be present it may have become partially blocked by condensed volatile components. This condensation phenomena is a process that will be both temperature related and procedure-related (contact time of char and gas). It is good to realize that the porosity observed at the SEM corresponds to the N2-measurement data and that the smaller pores measured by CO2 (< 2 nm) will not be visible.
Table 6 shows the results on a selection of the gasification samples, using either N2 for larger porosity and surface area or CO2 for microporosity and surface area while applying different models for the calculations (BET, DR, NLDFT), as explained in section 2. The smaller scale experiments are all performed with the same GHW feedstock to study the effect of different gaseous conditions (N2, air or steam) at the two reference temperatures. In the larger lab-scale, the lower temperature was limited at 670 °C due to operational restrictions and the aim was to establish the effect of varying feedstock at the same operational conditions on biochar surface and porosity. Only one test was performed at 750 °C to compare the two installations. The difference in results of the two experiments at 750 °C could be both indicative of the spread in results or of the difference between the two set-ups (e.g., difference in residence time). With both the pore volume and surface values measured with N2 being different (239 m2·g−1 in the smaller vs. only 52.5 m2·g−1 for total SA) but the water holding capacity (228% versus 234%) and the CO2 measured and DR modeled to be very similar (e.g., micropore surface DR/CO2 299 m2·g−1 versus 333 m2·g−1) this comparison gives a very mixed impression that requires further work on this issue.
Figure 10. SEM pictures of greenhouse waste (pepper) biochar under pyrolysis (a,b) and gasification (c,d) conditions. Note that going from (a) to (d) the temperature also increases. The general impression from the microscopy study is that samples look much more clean (less condensates/ more pores) going to higher temperatures and more so under gasification than under pyrolysis conditions at the same temperature (compare b and c).
Agriculture 05 01076 g010
In an attempt to visualize the varies result shown in Table 6, Figure 11 was made to show the surface area and the pore volume of the biochar samples both measured with N2 and CO2 for the main feedstock and conditions tested. The left axis depicts the specific surface area values in m2·g−1, determined with both N2 and CO2 as adsorbent, and the right hand axis depicts the pore volume of the biochars, in cm3·g−1, also using both N2 as well as CO2.
In general Table 6 and Figure 11 do not give a clear trend if all data is included, but still it is possible to take away a few important results on the relation of production on biochar characteristics, while other less-clear results can direct future research for more clarity.
Table 6. Surface Area and porosity results on selected gasification samples. The larger scale experiments were all performed with air as fluidizing agent.
Total SA (m2·g−1)WHC (%)Total PV cm3·g−1Total SA (m2·g−1)Micropore volume (cm3·g−1)Micropore SSA (m2·g−1)Micropore SSA (m2·g−1)Micropore volume (cm3·g−1)
SampleBET / N2BET/N2BET /CO2DR / CO2DR / CO2NLDFT (<1.5nm)NLDFT (<1.5nm)
Small scale gasification
GHW 1 air 600 °C8.782.50.0117810.0691591620.053
GHW 1 N2 600 °C6.9690.0112800.03888910.026
GHW 1 steam 600 °C15.3750.01721520.03887910.0262
GHW 1 air/steam blend 750 °C99.5140.60.009370.0224959.80.0177
GHW 1 N2 750 °C176162.50.10991630.0731692540.087
GHW1 steam750 °C3551940.25673200.108251447.90.158
GHW1 air 750 °C239227.50.12753350.1292995400.1745
Large scale gasification
GHW 1 670 °C30.872840.03272390.143253650.082
GHW 1 750 °C52.52340.04132480.1433333640.085
Wood SBB 670 °C1962170.11373140.214664610.108
Beech wood 670 °C54860.03772520.1493463720.087
Beech wood. And GHW 2 (80%–20%) 670 °C67.11710.04722730.1683904160.095
Wood SBB and GHW 2 (80%–20%) 670 °C93.5210.40.06512020.1242883020.071
Figure 11. Overview of the N2 and CO2–measured surface area and pore volume. The six bars on the left-hand side represent biochars produced in the smaller gasifier while the six samples on the right-hand side are from the larger scale gasifier. Temperatures and gaseous environments of the production procedures are indicated on the x-axis.
Agriculture 05 01076 g011
The three experiments at 600 °C clearly show lower total pore volumes than the higher temperature experiments for both N2 and CO2 measurements. The difference of only 70 degrees to 670 °C seems to have a large impact already on the pore volume, while the effects of raising the temperature from 670 °C to 750 °C is not directly clear. Although the N2 measured total pore volume for the three 750 °C experiments in the smaller scale are higher than for the 670 °C in the larger scale gasifier, the pore volume measured by CO2 is equally high or higher for the 670 °C experiments as for the 750 °C. Also clear is that the 600 °C experiments have the lowest water holding capacities. In fact there are only four values below 100% WHC and these are the three 600 °C experiments and the beech experiment at 670 °C in the larger scale. So the extra 70 degree rise in temperature also has a large effect on water holding capacity. Because the 670 °C data are from a different experimental set-up, it is good to look at the 750 °C data from the same set-up. This confirms the fact that the higher temperature biochars have a larger WHC due to higher pore volumes hence the relation: Higher temperature > larger pore volume > larger water holding capacity within the dataset of one feedstock when going from 600 °C to 670 °C/750 °C.
Some influence of feedstock can be derived from the dataset of the larger gasifier and some first indications of the effect of the gaseous environment from the dataset of the smaller gasifier. In order to make this more visible Figure 12a–c were constructed.
Figure 12a,b shows the water holding capacity (WHC) versus the pore volume for the pepper residue (GHW 1) biochars derived under gasification at 600 °C and gasification at 750 °C in separate graphs. As a first indication, the graphs show the small positive correlation between pore volume and WHC, being minimal for the lower temperature and being somewhat larger for the 750 °C data. However, when labeling the data points it becomes clear that the increasing WHC is also influenced to some extent by the gaseous environment, as this is the only variable left. In both graphs the order is that the WHC increases going from an inert N2 environment to steam to subsequently air as gasification medium. Although there are few data in these graphs it gives a first impression on the importance of the gaseous environment relative to, e.g., the temperature of formation. When looking at the WHC of the two graphs it is easily recognized that while the three data points at 600 °C are between 50% and 100%, the 750 °C data points are between 150% and 250% showing the temperature effect is much larger than the effect of the gaseous environment. The effect at 750 °C is, however, not negligible and both pore volume and WHC will increase going from N2 to air. Although the temperature seems to be a first order parameter, the gaseous environment can become important for fine-tuning the biochar quality with respect to porosity and WHC. To prove this beyond this first indication, more experiments are needed where the change in gaseous environment is the only variable.
While data shown in Figure 12a,b refer to the GHW 1 (pepper greenhouse waste) biochars produced in the smaller gasifier, Figure 12c depicts the biochar results obtained at 670 °C in the pilot (scale) for the various feedstock. The feedstocks used are: GHW 1, beech wood, forest residue (SBB) and the blends of the two woody residues with GHW 2.
In Figure 12 c the first thing that is apparent is the large difference in values for the pore volume as measured with N2 and CO2 (note that every feedstock corresponds to a lower dot and upper square at the same WHC), indicating that most likely a large fraction of the pore volume is in the form of micropores. Because the trends for the N2 and CO2 data are not very clear yet, it is impossible to conclude on the correlation of pore volume, microporosity, and the increase in WHC, whether it is a combination of pore volume and microporosity. The other very apparent fact is that over the total span of WHC values from 86%–284% are five different feedstock (mixtures). This indicates that the choice of feedstock is of a first order importance when steering for WHC. The range of changes is similar to that achieved by going from a production temperature of 600 °C to 670 °C/750 °C as described above. When looking at the type of feedstock, the lowest WHC is for the beech feedstock. This can, however be increased significantly by using a blend of 80% beech and 20% agro-residue. The third and fourth data points (going from low to high WHC in Figure 12c is for the forest residue and forest residue with 20% agro-residue. In this case, the 20% addition only seems to have an effect on the porosity but not on the water holding capacity and the larger WHC for the GHW 1 is the largest value measured although it is a biochar that has lower pore volume than the two samples with forest residue. This shows the major impact of the feedstock but also that the WHC cannot be solely related to the pores volume of the char when changing from one feedstock to another. The weak possible trend of WHC being related to pore volume within the dataset of one feedstock is completely “overshadowed” by the effect of different feedstock.
Figure 13 depicts the total surface area as defined by both N2 and CO2 measurements, in relation with the carbonation ratio. The higher degree of carbonization (lower ratio H/C) seems to lead to higher values of the specific surface area. A correlation between the surface area and the degree of carbonization can be established, shown in Figure 13, consistent with observations in prior biochar characterization studies [33,71,72].
Figure 12. Water holding capacity related to the total and micropore volume for the obtained greenhouse waste (pepper) biochar samples (a) at 600 °C and (b) 750 °C and (c) for all larger scale gasification biochar samples at 670 °C.
Agriculture 05 01076 g012
Figure 13. Specific surface area (m2·g−1), estimated by N2 and CO2 adsorption, as a function of the degree of carbonization (ratio H/C).
Agriculture 05 01076 g013
The above Figure 13 includes various feedstock and reactor conditions, that all have an effect on either carbonization or surface area. Biochar from woody material shows a higher surface area than an agro waste, despite the fact that both are produced under the same conditions. On the other hand, the same feedstock will show variable surface areas and carbonization degree if the production process has different temperatures. The porosity of biochar is influenced to a large extent by the parent material as the results in Figure 12c and the SEM study have shown. Choosing porous biomass feedstock is a good way to secure porosity in the biochar, as a starting point. In addition to that the process conditions influence the formation of pores as well, although this seems only a second order effect as shown by the first indication of the gasification biochars presented in Figure 12a,b.

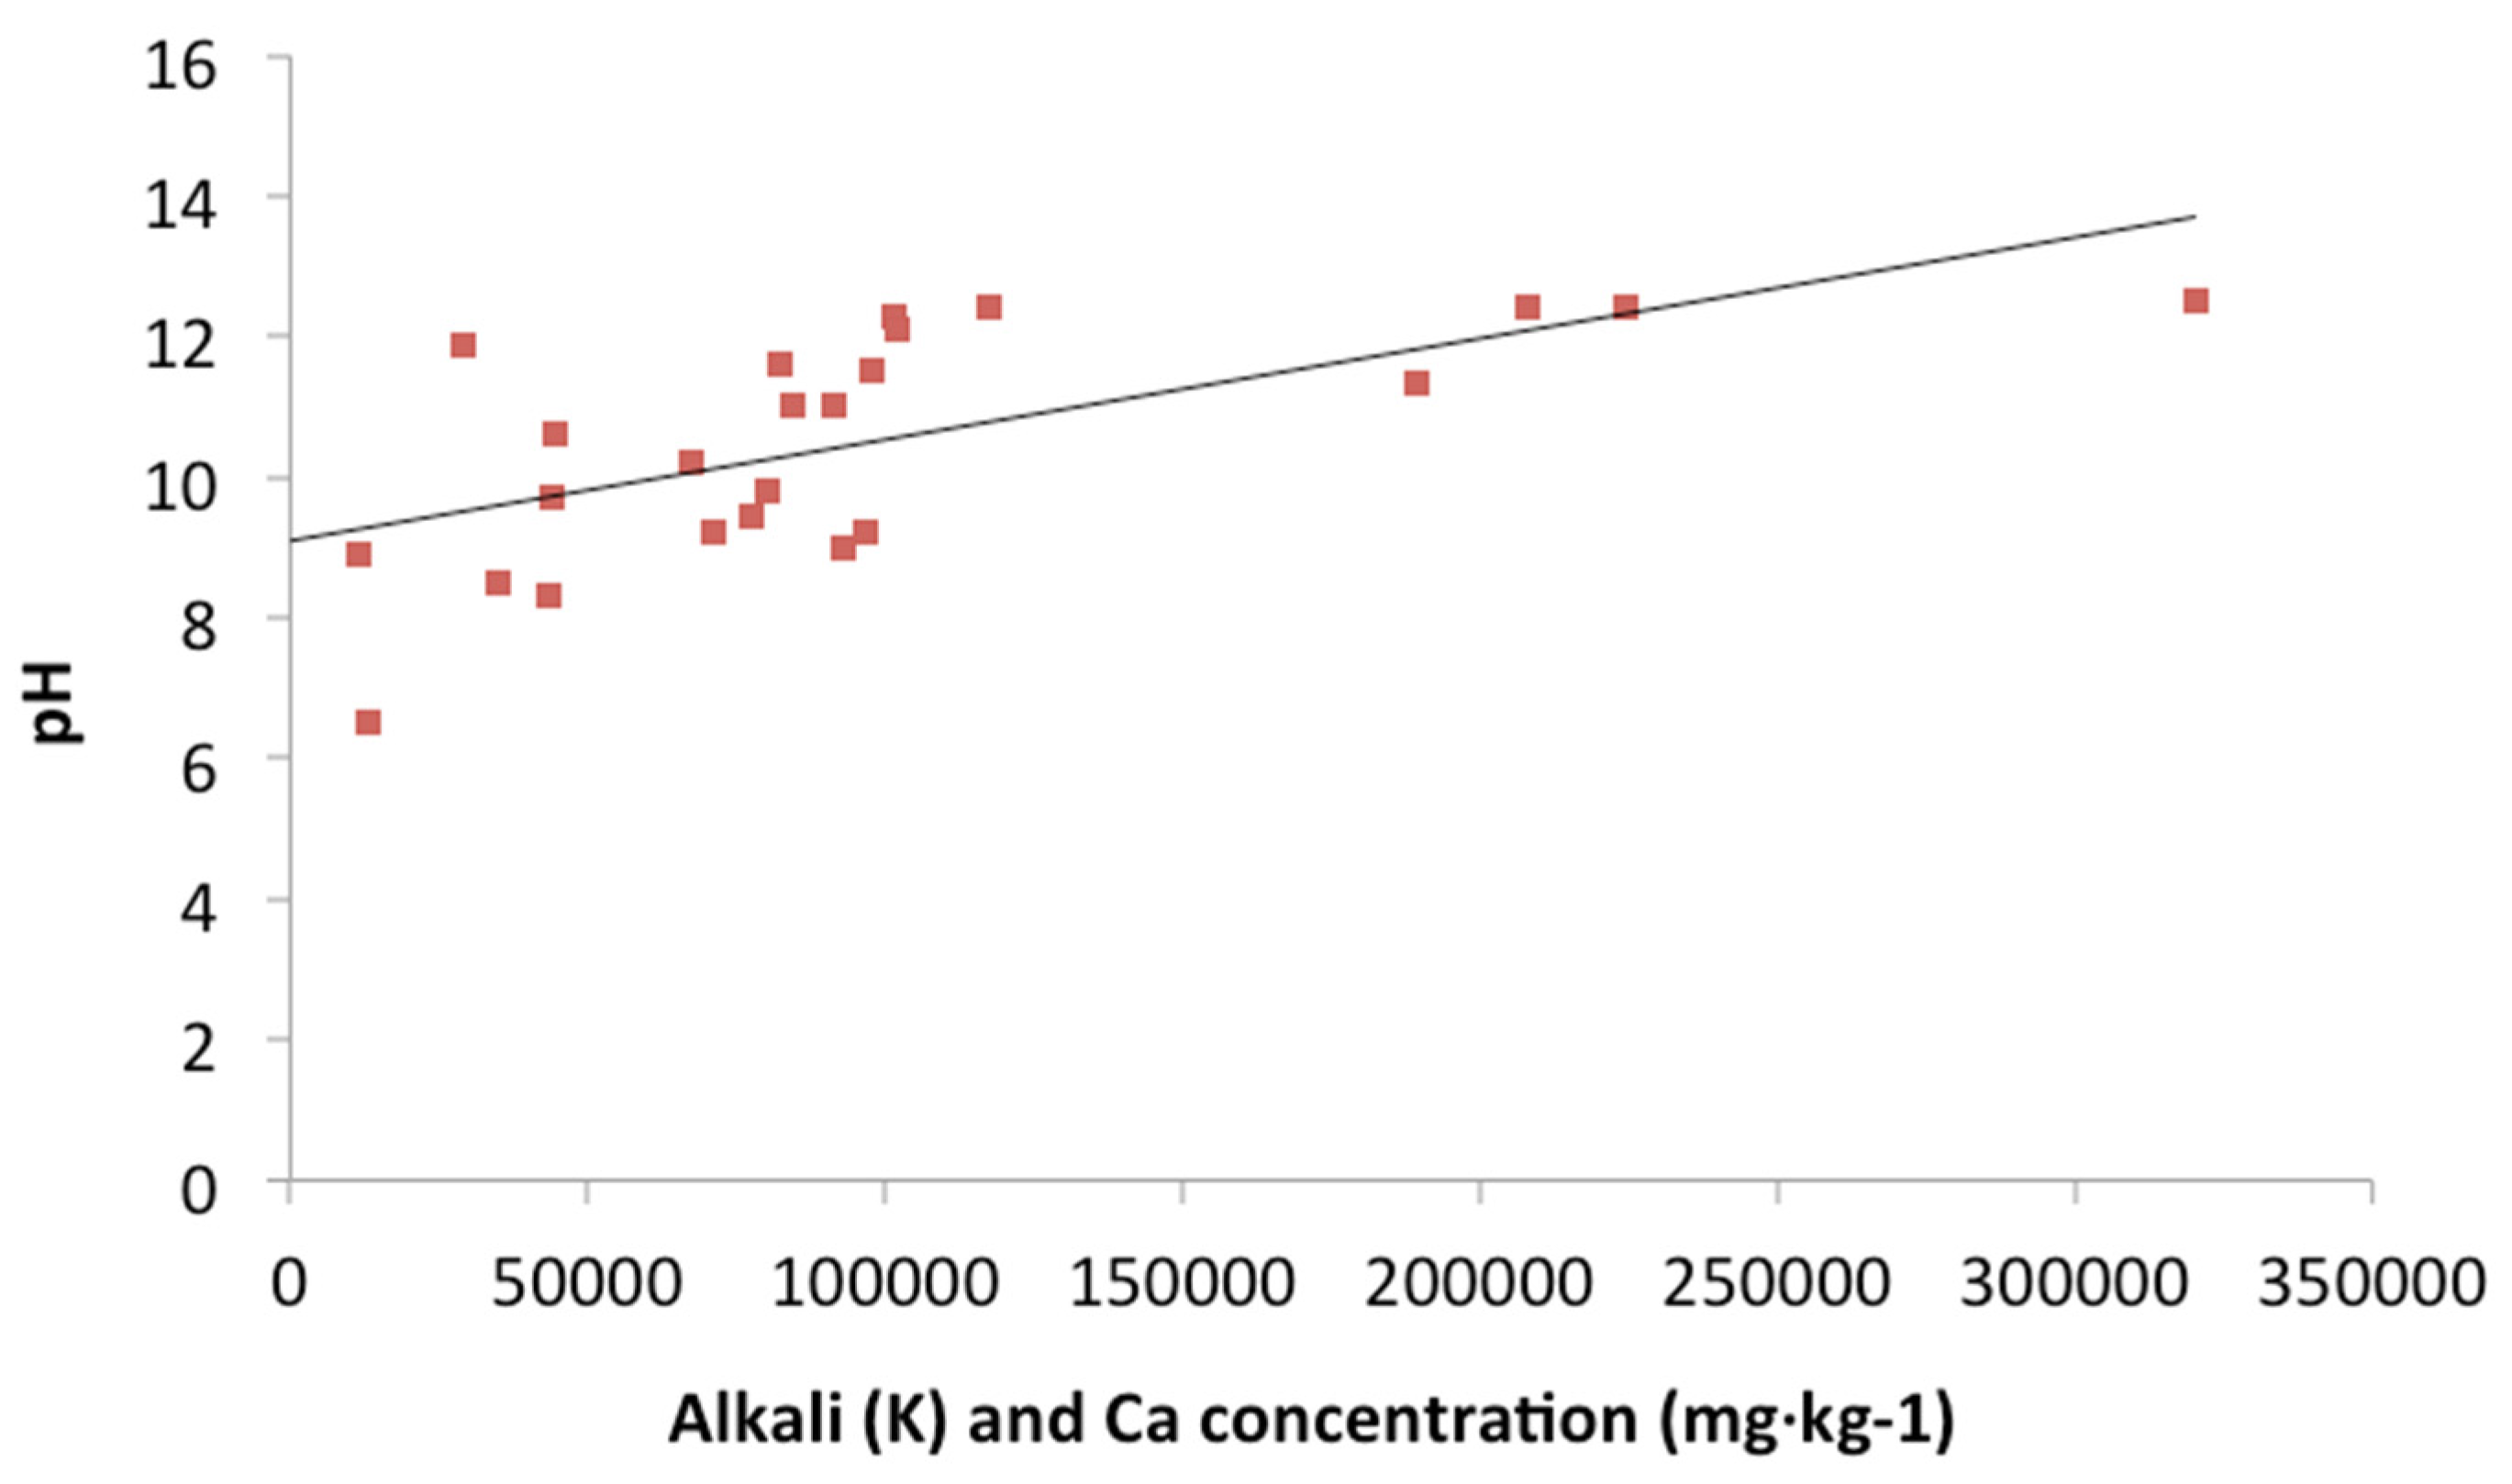
3.5. pH of Biochar Samples

Among the tested biochars, pH values ranged from slightly to strongly alkaline (pH = 8.8 (wood biochar) to 12.4 (manure biochar)). Beside the influence of feedstock, the relation of elevated pH with the high degree of carbonization has also been observed in some biochar characterization studies [33,71,72], which link a high surface area with a high carbonization degree shown in the previous section. The gasification biochars exhibit a higher degree of carbonization as indicated by its low H/C ratio than the pyrolysis biochars that were produced at lower temperatures (shown in Figure 3). This is therefore expected to influence the pH value [33,71,72].
Figure 14. Measured pH of the biochar samples vs. carbonization degrees.
Agriculture 05 01076 g014
Figure 14 depicts the pH value of all biochars relative to their H/C ratio, thus, their carbonization degree. The alkalinity (high pH value) of biochars at an increased extent of carbonization (reflected by their lower H/C ratios) is clearly shown, consistent with prior reports documenting a liming effect as biomass is converted to biochar [73]. However, the correlation is rather weak; the dispersion of the results implies that the pH is largely influenced by additional parameters. Because the high ash manures are on the highest alkali-side and the low-ash wood feedstock is on the other end of the spectrum, another graph was constructed in which the most important ash concentrations are considered as variable.
Figure 15 shows the relation of pH with the alkali and Ca concentration of biochars. In previous studies it was shown that production temperatures above 400 °C are sufficient to raise the pH up to 7.5 units above the fresh biomass pH values, rendering the biochars alkaline. The pH of our biochars increased from about 7 (fresh biomass) to even above 12 for the manure biochar as seen above and remained steady at higher temperatures. The alkalinity of the biochar reported in literature (e.g., rice straw) was mainly due to the presence of alkali metals in the inert biochar mass. Although other refractory elements dominate in the ash of the various feedstock, it is clear that the presence of K/Na and Ca in the biochar has an effect on pH values as shown in Figure 15. In [74] it was shown that as the acid functional groups, such as carboxyl (–COOH) and phenolic (–OH), become depleted with increasing pyrolysis temperature, alkalinity is strongly affected. This graph confirms the work presented in [72], where a very thorough analysis is presented on the parameters that affect the pH value, including the formation of insoluble salts (alkali metals).
From the above it can be concluded that it is not only the carbonization degree that matters but also the inherent ash composition (concentrations of K, Na, and Ca) of the original feedstock. The high fluctuation of pH with relation to molar ratio H/C and alkali content also reflect that more parameters likely have an influence on the pH value. Measuring surface functional groups, taking into account the organic and inorganic elements might provide valuable insight on the pH development in biochars.
Figure 15. pH values with alkali and Ca concentration for all biochars.
Agriculture 05 01076 g015
The low value of the correlation coefficients in the above graphs show that the relation between one influential parameter and its effect on a certain biochar characteristic or set of characteristics is not straightforward, and more than one parameters influence simultaneously one certain physicochemical property of biochar. This may render the representation of results in standard two-dimensional graphs confusing. However this verifies the fact that biochar characterization needs to take into account numerous input parameters all at the same time. We are currently enlarging our dataset by carrying out more tests, of which the results will be analyzed with advanced processing tools in order to study more clearly the effect on various influential parameters on the biochar properties.

3.6. Heavy Metals and PCB/Dioxins Furans

All the biochars were tested for dioxins and heavy metals content. In all cases the dioxins were either below the premium limits or under the detection limit while the heavy metal content was also very low, even for the stringent premium limits: Pb < 120 mg·kg−1; Cd < 1 mg·kg−1; Cu < 100 mg·kg−1; Ni < 30 mg·kg−1; Hg < 1 mg·kg−1; Zn < 400 mg·kg−1; Cr < mg·kg−1 on dry basis. As all biochars passed the quality test with respect to heavy metals and dioxins/PCB/dioxins and furans we chose to not discuss these in more detail.

4. Conclusions and Prospects for Biochar Research

In a lab-scale pyrolyzer and two different size lab-scale gasifiers ECN has co-produced biochar and energy from agro- and forest residues with the aim to study the quality of the biochars and try to find relationships between the production parameters and the chemical and physical properties of the biochar most important to agronomy. In our work all biochars produced demonstrate molar ratios H/C <0.6, and O/C <0.4, required by the IBI definition of biochar. The 16 PAH measurement showed all biochars to be of sufficient quality or even premium quality with respect to poly-hydrocarbon presence and heavy trace metals concentration were found to be well below high quality standards. The overall sufficient quality was a precondition for further work and this condition was met. The following conclusions can therefore zoom in to more complex relationships between production and biochar quality that need to be understood in order to be able to design biochars for certain applications or soil conditions.
In Section 1.2, a number of production parameters were identified from the literature review as being important for the quality and variation in biochar characteristics.
The type of feedstock (woody vs. herbaceous) proved to be an important parameter on the chemical and physical characteristics of biochar. Even at the same process production conditions, the wide range of input or starting parameters leads to the formation of biochar products that vary considerably in their elemental and ash composition, density, porosity, pore size distribution, surface area, pH and uniformity of biochars’ physical structure. The wood biochars exhibit pH values lower than the agro waste biochars, at the same time coupled with higher H/C ratios, while the manures feedstock are among the very highest pH-chars. The data suggest that a greater extent of carbon enrichment occurred during gasification of wood relative to other tested feedstock, however, the effect proved to be at least partly due to the ash content, with the lowest ash (wood) feedstock having lower pH than the feedstock with high initial alkali plus Ca content. When looking at the type of feedstock, a significant effect is visible on the water holding capacity (WHC) of biochar. In this study, the lowest WHC is for the beech feedstock, which could, however, be increased significantly by using a blend of a mass fraction 80% beech and 20% agro-residue. The relation of pore volume with WHC was only present within the dataset of one feedstock while varying the feedstock covered a much wider range of WHC’s than described by pore volume alone. This shows the major impact of the initial feedstock but also that the WHC cannot be solely related to the pore volume of the biochar when changing from one feedstock to another. The influence of the initial feedstock is considered a first-order parameter in the quality and characteristics of the biochar produced. More detailed attention on the starting material in future research would be very beneficial for the interpretation of the resulting char characteristics, in our opinion, based on this study.
The temperature of production has been shown in literature to be the most important parameter in the ratio of labile to stabile carbon and by being the key parameter for devolatilization processes. In this study it also largely determines the H/C and O/C ratios in the biochar as was expected. The most convincing argument can be found in the van Krevelen diagram (Figure 3) where the trend is from the feedstock ratios towards the origin of the graph with ever increasing temperatures. The yield of the amount of char versus product gas decreased with increasing temperature as can be expected. It was also found that the higher temperature biochars have a larger WHC due to higher pore volumes hence the relation: Higher temperature> larger pore volume> larger water holding capacity within the dataset of one feedstock. The temperature, within the range investigated, is also considered a first-order parameter in the quality and characteristics of the biochar produced.
Variation in process (especially gaseous environment). The largest differences are between pyrolysis and gasification for the few parameters investigated, such as the ratio (yield) of biochar and energy production. It is nearly impossible to compare pyrolysis versus gasification with the gaseous environment as the only variable. Especially temperatures of operations but most certainly residence times are very different for the two processes. In this study more detailed work was then performed within the gasifiers in varying the gaseous environment. Indicatively it was illustrated that for one feedstock at 600 °C the effect of the gaseous environment is very small. The effect at 750 °C is, however, not negligible and both pore volume and WHC will increase going from N2 to steam and then to air. Although the temperature seems to be a first order parameter in this case, the gaseous environment can become important for fine-tuning the char quality with respect to porosity and WHC. To prove this beyond this first indication, more experiments are needed where the change in gaseous environment is the only variable. Within the range investigated the gaseous environment is considered only of secondary importance as a hypothesis for further work but a possibility for fine-tuning the char quality.
Residence time is a parameter that is usually very different for slow-pyrolysis and the fluidized bed gasification processes used in this study. However, only a few experiments were performed at 600 °C which does not allow any comparison beyond the general quantities of biochar and energy produced. In general, residence time will have a larger effect at lower temperatures. It is however, worth considering this parameter for further research.
Practical Procedures. In this study it was shown that the PAH concentrations is not solely related to the production process but also to contact-time of gas and char and the local temperature condition (still to reach the peak temperature or already in the cooling range). Taking the char out from the bed-section of the gasifier, after some residence time at elevated temperature, prevented the condensation of tars from the gas on the chars. Tars that were obviously present in the reactor, proven by the cyclone chars of the same experiment and hence the same char-production process and the same process conditions. In general PAH content was low in all gasification obtained biochars, by separating the char and the produced gas at an early stage. The bed-derived gasification chars result in 16 PAH values 1 mg·kg−1 to 2 mg·kg−1 or even less compared to values of 8 mg·kg−1 to 23 mg·kg−1 PAH for the pyrolysis samples. Reactor design for char production should take into account best practice in practical procedures, such as early separation of char and gas, as much can be gained in terms of quality of the biochar without necessarily leading to extra costs. The production of biochar by gasification is still relatively novel, but as shown in this work, the data on the resulting biochar qualifications are highly encouraging.
Currently the relationship between biochar properties (physical properties and chemical functionalities on surface) and its applicability as a soil amendment does not yet allow a set of definite process conditions to produce biochar with desired characteristics, but every study providing solid experimental work will contribute towards this end. The need for collaboration among researchers working in different disciplines is very strong. The coupling between the char production/characteristics and the studies on biochar amendment and its effects on soil and on crop yields is essential. Only with the feed-back from soil-scientist and agricultural scientists will it be possible to establish the appropriate process conditions to produce a biochar with desired characteristics and increase the success rate of biochar applications.

Acknowledgments

The work presented in this paper was carried out with financial support from the EU FP7 project FERTIPLUS (Grant Agreement N° 289853), the Dutch national TO2 scheme project Optimalisatie Glastuinbouw (Optimizing greenhouse horticulture) and the Dutch Ministry of Economic affairs. We would like to thank and acknowledge a number of people whose help was very important in the realization of this work. Herman Bodenstaff, Dennis Slort, Peter Heere and Edwin Brouwer for preparing and carrying out the tests at the lab-scale installations at ECN, Marco Geusebroek and Arnold Toonen for preparing and carrying out the sampling (gas, solid, liquid). Finally we kindly thank the reviewers and editor of this journal for their constructive remarks and suggestions.

Author Contributions

The authors of this manuscript have equally contributed to its realization.

Conflicts of Interest

The authors declare no conflict of interest.

References

  1. Laird, D.A. The charcoal vision: A win-win-win scenario for simultaneously producing bioenergy, permanently sequestering carbon, while improving soil and water quality. Agronomy 2008, 100, 178–181. [Google Scholar] [CrossRef]
  2. Montanarella, L.; Lugato, E. The Application of Biochar in the EU: Challenges and Opportunities, Review. Agronomy 2013, 3, 462–473. [Google Scholar] [CrossRef]
  3. Field, J.L.; Keske, C.M.H.; Birch, G.L.; Defoort, M.W.; Cotrufo, M.F. Distributed biochar and bioenergy coproduction: a regionally specific case study of environmental benefits and economic impacts. GCB Bioenergy 2013, 5, 177–191. [Google Scholar] [CrossRef]
  4. Lehmann, J.; Joseph, S. Biochar for Environmental Management: Science and Technology; Earthscan: Sterling, VA, USA, 2012; pp. 127–146. [Google Scholar]
  5. Sohi, S.; Lopez-Capel, E.; Krull, E.; Bol, R. Biochar’s roles in soil and climate change: A review of research needs. CSIRO Land Water Sci. Rep. 2009, 5, 1–57. [Google Scholar]
  6. Kimetu, J.M.; Lehmann, J.; Ngoze, S.O.; Mugendi, D.N.; Kinyangi, J.M.; Riha, S.; Verchot, L.; Recha, J.W.; Pell, A.N. Reversibility of Soil Productivity Decline with Organic Matter of Differing Quality Along a Degradation Gradient. Ecosystem 2008, 11, 726–739. [Google Scholar] [CrossRef]
  7. Gaskin, J.W.; Speir, R.A.; Harris, K.; Das, K.C.; Lee, R.D.; Morris, L.A.; Fisher, D.S. Effect of peanut hull and pine chip biochar on soil nutrients, corn nutrient status, and yield. Agrono. J. 2010, 102, 623–633. [Google Scholar] [CrossRef]
  8. Major, J.; Rondon, M.; Molina, D. Maize yield and nutrition during 4 years after biochar application to a Colombian savanna oxisol. Plant and Soil 2010, 333, 117–128. [Google Scholar] [CrossRef]
  9. Zimmerman, A.R.; Gao, B. Positive and negative carbon mineralization priming effects among a variety of biochar-amended soils. Soil Biol. Biochem. 2011, 43, 1169–1179. [Google Scholar] [CrossRef]
  10. Mukherjee, A.; Lal, R.; Zimmerman, A.R. Effects of biochar and other amendments on the physical properties and greenhouse gas emissions of an artificially degraded. Soil. Sci. Total Environ. 2014, 487, 26–36. [Google Scholar] [CrossRef] [PubMed]
  11. Smider, B.; Singh, B. Agronomic performance of a high ash biochar in two contrasting soils. Agric. Ecosyst. Environ. 2014, 191, 99–107. [Google Scholar] [CrossRef]
  12. Rutherford, D.W.; Wershaw, R.L.; Rostad, C.E.; Kelly, C.N. Effect of formation conditions on biochars: Compositional and structural properties of cellulose, lignin, and pine biochars. Biomass Bioenergy. 2012, 46, 693–701. [Google Scholar] [CrossRef]
  13. Herath, H.M.S.K.; Camps-Arbestain, M.; Hedley, M. Effect of biochar on soil physical properties in two contrasting soils: An Alfisol and an Andisol. Geoderma 2013, 209, 188–197. [Google Scholar] [CrossRef]
  14. Rosa, J.M.; Paneque, M.; Miller, A.Z.; Knicker, H. Relating physical and chemical properties of four different biochars and their application rate to biomass production of Loliumperenne on a Calcic Cambisol during a pot experiment of 79 days. Sci. Total Environt. 2014, 499, 175–184. [Google Scholar] [CrossRef] [PubMed]
  15. Macdonald, L.M.; Farrell, M.; Van Zwieten, L.; Krull, E.S. Plant growth responses to biochar addition: An Australian soils perspective. Biol. Fertil. Soils 2014, 50, 1035–1045. [Google Scholar] [CrossRef]
  16. Rogovska, N.; Laird, D.A.; Rathke, S.J.; Karlen, D.L. Biochar impact on Midwestern Mollisols and maize nutrient availability. Geoderma 2014, 230, 340–347. [Google Scholar] [CrossRef]
  17. Chan, K.Y.; van Zwieten, L.; Meszaros, I.; Downie, A.; Joseph, S. Using poultry litter biochars as soil amendments. Aust. J. Soil Res. 2008, 46, 437–444. [Google Scholar] [CrossRef]
  18. Kammann, C.I.; Schmidt, H.P.; Messerschmidt, N.; Linsel, S.; Steffens, D.; Müller, C.; Koyro, H.W.; Conte, P.; Joseph, S. Plant growth improvement mediated by nitrate capture in co-composted biochar. Sci. Rep. 2015. [Google Scholar] [CrossRef]
  19. Glaser, B.; Wiedner, K.; Seelig, S.; Schmidt, H.P.; Gerber, H. Biochar organic fertilizers from natural resources as substitute for mineral fertilizers. Agron. Sustain. Dev. 2014, 35, 667–678. [Google Scholar] [CrossRef]
  20. Huang, M.; Yang, L.; Qin, H.; Jiang, L.; Zou, Y. Quantifying the effect of biochar amendment on soil quality and crop productivity in Chinese rice paddies. Field Crops Res. 2013, 154, 172–177. [Google Scholar] [CrossRef]
  21. Schimmelpfennig, S.; Müller, C.; Grünhage, L.; Koch, C.; Kammann, C. Biochar, Hydrochar and Uncarbonized Feedstock Application to Permanent Grassland—Effects on Greenhouse Gas Emissions and Plant Growth. Agric. Ecosyst. Environ. 2014, 191, 39–52. [Google Scholar] [CrossRef]
  22. Spokas, K.A.; Cantrell, K.B.; Novak, J.M.; Archer, D.W.; Ippolito, J.A.; Collins, H.P.; Boateng, A.; Lima, I.M.; Lamb, M.C.; McAloon, A.J.; Lentz, R.D.; Nichols, K.A. Biochar: A synthesis of its agronomic impact beyond carbon sequestration. J. Environ. Qual. 2012, 41, 973–989. [Google Scholar] [CrossRef] [PubMed]
  23. Schimmelpfennig, S.; Glaser, B. One step forward toward characterization: some important material properties to distinguish biochars. J. Environ. Qual. 2012, 41, 1001–1013. [Google Scholar] [CrossRef] [PubMed]
  24. Verheijen, F.G.A.; Jeffery, S.; Bastos, A.C.; van der Velde, M.; Diafas, I. Biochar Application to Soils, A Critical Scientific Review of Effects on Soil Properties, Processes and Functions; EUR24099EN; Office for the Official Publications of the European Communities: Luxembourg, Luxembourg, 2009; p. 149. [Google Scholar]
  25. Biederman, L.A.; Harpole, W.S. Biochar and its effects on plant productivity and nutrient cycling: A meta-analysis. GCB Bioenergy 2013, 5, 202–214. [Google Scholar] [CrossRef]
  26. Verheijen, F.G.A.; Graber, E.R.; Ameloot, N.; Bastos, A.C.; Sohi, S.; Knicke, H. Biochars in soils: new insights and emerging research needs. Eur. J. Soil Sci. 2014, 65, 22–27. [Google Scholar] [CrossRef]
  27. Jeffery, S.; Verheijen, F.G.A. A quantitative review of the effects of biochar application to soils on crop productivity using meta-analysis. Agric. Ecosyst. Environ. 2011, 144, 175–187. [Google Scholar] [CrossRef]
  28. Ojeda, G.; Mattana, S.; Àvila, A.; Alcañiz, J.M.; Volkmann, M.; Bachmann, J. Are soil–water functions affected by biochar application? Geoderma 2015, 249, 1–11. [Google Scholar] [CrossRef]
  29. Yao, Y.; Gao, B.; Zhang, M.; Inyang, M.; Zimmerman, R.A. Short Communication, Effect of Biochar Amendment on Sorption and Leaching of Nitrate, Ammonium, And Phosphate in a Sandy Soil. Chemosphere 2012, 89, 1467–1471. [Google Scholar] [CrossRef] [PubMed]
  30. Mimmo, T.; Panzacchi, P.M.; Baratieri, C.A.; Davies, G. Effect of pyrolysis temperature on Miscanthus (Miscanthus × giganteus) biochar physical, chemical and functional properties. Biomass Bioenergy 2014, 62, 149–157. [Google Scholar] [CrossRef]
  31. Manya, J.J. Pyrolysis for biochar purposes: A review to establish current knowledge gaps and research needs. Environ. Sci. Technol. 2012, 46, 7939–7954. [Google Scholar] [CrossRef] [PubMed]
  32. Mukherjee, A.; Zimmerman, A.R.; Harris, W. Surface chemistry variations among a series of laboratory-produced biochars. Geoderma 2011, 163, 247–255. [Google Scholar] [CrossRef]
  33. Li, X.; Shen, Q.; Zhang, D.; Mei, X.; Ran, W. Functional Groups Determine Biochar Properties (pH and EC) as Studied by Two-Dimensional 13C NMR Correlation Spectroscopy. PLoS ONE 2013. [Google Scholar] [CrossRef]
  34. Sun, H.; Hockaday, W.C.; Masiello, C.A.; Zygourakis, K. Multiple Controls on the Chemical and Physical Structure of Biochars. Ind. Eng. Chem. Res. 2012, 51, 3587–3597. [Google Scholar] [CrossRef]
  35. Crombie, K.; Mašek, O. Pyrolysis biochar systems, balance between bioenergy and carbon sequestration. GCB Bioenergy 2015, 7, 349–361. [Google Scholar] [CrossRef]
  36. Mašek, O.; Brownsort, P.; Cross, A.; Sohi, S. Influence of production conditions on the yield and environmental stability of biochars. Fuel. 2013, 103, 151–155. [Google Scholar] [CrossRef]
  37. Budai, A.; Wang, L.; Gronli, M.; Strand, L.T.; Antal, M.J.; Abiven, S.; Dieguez-Alonso, A.; Anca-Couce, A.; Rasse, D.P. Surface Properties and Chemical Composition of Corncob and Miscanthus Biochars: Effects of Production Temperature and Method. J. Agric. Food Chem. 2014, 62, 3791–3799. [Google Scholar] [CrossRef] [PubMed]
  38. Sohi, S.P.; Krull, E.; Lopez-Capel, E.; Bol, R. A Review of Biochar and Its Use and Function in Soil. Adv. Agron. 2010, 105, 47–82. [Google Scholar]
  39. Singh, B.; Singh, B.P.; Cowie, A.L. Characterisation and evaluation of biochars for their application as a soil amendment. Soil Res. 2010, 48, 516–525. [Google Scholar] [CrossRef]
  40. Novak, J.M.; Lima, I.; Xing, B.; Gaskin, J.W.; Steiner, C.; Das, K.; Ahmedna, M.; Rehrah, D.; Watts, D.W.; Busscher, W.J. Characterization of designer biochar produced at different temperatures and their effects on a loamy sand. Annals. Environ. Sci. 2009, 3, 195–206. [Google Scholar]
  41. Karhu, K.; Mattila, T.; Bergström, I.; Regina, K. Biochar addition to agricultural soil increased CH4 uptake and water holding capacity—Results from a short-term pilot field study. Agr. Ecosyst. Environ. 2011, 140, 309–313. [Google Scholar] [CrossRef]
  42. Yu, O.Y.; Raichle, B.; Sink, S. Impact of biochar on the water holding capacity of loamy sand soil. Int. J. Energy Environ. Eng. 2013, 4, 1–9. [Google Scholar] [CrossRef]
  43. Zhang, J.; You, C. Water Holding Capacity and Absorption Properties of Wood Chars. Energy Fuels 2013, 27, 2643–2648. [Google Scholar] [CrossRef]
  44. Akhtar, S.S.; Li, G.; Andersen, M.N.; Liu, F. Biochar enhances yield and quality of tomato under reduced irrigation. Agric. Water Manag. 2014, 138, 37–44. [Google Scholar] [CrossRef]
  45. Kinney, T.J.; Masiello, C.A.; Dugan, B.; Hockaday, W.C.; Dean, M.R.; Zygourakis, K.; Barnes, R.T. Hydrologic properties of biochars produced at different temperatures. Biomass Bioenergy 2012, 41, 34–43. [Google Scholar] [CrossRef]
  46. Gray, M.; Johnson, M.; Dragila, M.I.; Kleber, M. Water uptake in biochars: The roles of porosity and Hydrophobicity. Biomass Bioenergy 2014, 61, 196–205. [Google Scholar] [CrossRef]
  47. Jeffery, S.; Bezemer, T.M.; Cornelis, G.; Kuyper, T.W.; Lehmann, J.; Mommer, L.; Saran, P.S.; van de Voorde, T.F.J.; Wardlevand, D.A.; Groenigen, J.W. The way forward in biochar research: targeting trade-offs, between the potential wins. GCB Bioenergy 2015, 7, 1–13. [Google Scholar] [CrossRef]
  48. Shen, W.; Li, Z.; Liu, Y. Surface Chemical Functional Groups Modification of Porous Carbon. Recent Pat. Chem. Eng. 2008, 1, 27–40. [Google Scholar] [CrossRef]
  49. Morales, V.L.; Pérez-Reche, F.J.; Hapca, S.M.; Hanley, K.L.; Lehmann, J.; Zhang, W. Reverse Engineering of Biochar. Bioresour. Technol. 2015, 183, 163–174. [Google Scholar] [CrossRef] [PubMed]
  50. IBI. Standardized Product Definition and Product Testing Guidelines for Biochar that Isused in Soil; The International Biochar Initiative (IBI): Philadelphia, PA, USA, 2012. [Google Scholar]
  51. EBC. European Biochar Certificate: Guidelines for a Sustainable Production of Biochar; European Biochar Foundation (EBC): Arbaz, Switzerland, 2015. [Google Scholar]
  52. Peterson, S.C.; Jackson, M.A. Simplifying pyrolysis: Using gasification to produce corn stover and wheat straw biochar for sorptive and horticultural media. Ind. Crop. Prod. 2014, 53, 228–235. [Google Scholar] [CrossRef]
  53. Lugato, E.; Vaccari, F.; Genesio, L.; Baronti, S.; Pozzi, A.; Rack, M.; Woods, J.; Simonetti, G.; Montanarella, L.; Miglietta, F. An energy-biochar chain involving biomass gasification and rice cultivation in Northern Italy. GCB Bioenergy 2012. [Google Scholar] [CrossRef]
  54. The Biomass Environmental Assessment Tool, 2nd ed.; Provided by Defra, the Biomass Energy Centre and the Environment Agency as an aid to assessing the likely environmental impact of a biomass energy project; Defra: London, UK, 1990.
  55. Tsai, W.T.; Liu, S.C.; Chen, H.R.; Chang, Y.M.; Tsai, Y.L. Textural and chemical properties of swine-manure-derived biochar pertinent to its potential use as a soil amendment. Chemosphere 2012, 89, 198–203. [Google Scholar] [CrossRef] [PubMed]
  56. Gaunt, J.L.; Lehmann, J. Energy Balance and Emissions Associated with Biochar Sequestration and Pyrolysis Bioenergy Production. J. Environ. Sci. Technol. 2008, 42, 4152–4158. [Google Scholar] [CrossRef]
  57. Galinato, S.P.; Yoder, J.K.; Granatstein, D. The economic value of biochar in crop production and carbon sequestration. Energy Policy 2011, 39, 6344–6350. [Google Scholar] [CrossRef]
  58. Ahrenfeldt, J.; Thomsen, T.P.; Henriksen, U.; Clausen, R. Biomass gasification cogeneration: A review of state of the art technology and near future perspectives. Appl. Therm. Eng. 2013, 50, 1407–1417. [Google Scholar] [CrossRef]
  59. Hansen, V.; Müller-Stöver, D.; Ahrenfeldt, J.; Holm, J.K.; Henriksen, U.B.; Hauggaard-Nielsen, H. Gasification biochar as a valuable by-product for carbon sequestration and soil amendment. Biomass Bioenergy 2015, 72, 300–308. [Google Scholar] [CrossRef] [Green Version]
  60. Shackley, S.; Carter, S.; Knowles, T.; Middelink, E.; Haefele, S.; Sohi, S.; Cross, A.; Haszeldine, S. Sustainable gasification–biochar systems? A case-study of rice-husk gasificationin Cambodia, Part I: Context, chemical properties, environmental and health and safety issues. Energy Policy 2012, 42, 49–58. [Google Scholar] [CrossRef]
  61. Shackley, S.; Carter, S.; Knowles, T.; Middelink, E.; Haefele, S.; Haszeldine, S. Sustainable gasification–biochar systems? A case-study of rice-husk gasification in Cambodia, Part II: Field trial results, carbon abatement, economic assessment and conclusions. Energy Policy 2012, 41, 618–623. [Google Scholar] [CrossRef]
  62. Project FERTIPLUS ‘Reducing mineral fertilizers and agro-chemicals by recycling treated organic waste as compost and bio-char’. Available online: http://www.fertiplus.eu (accessed on 26 October 2015).
  63. Beuth Standard Solutions. Available online: http://www.beuth.de/en/ (accessed on 26 October 2015).
  64. BSI Shop. Available online: http://shop.bsigroup.com/Navigate-by/Standards (accessed on 26 October 2015).
  65. Dong, C.D.; Chen, F.; Chen, C.W. Determination of Polycyclic Aromatic Hydrocarbons in Industrial Harbor Sediments by GC-MS. Int. J. Environ. Res. Public Health 2012, 9, 2175–2188. [Google Scholar] [CrossRef] [PubMed]
  66. Van Krevelen, D.W. Graphical-statistical method for the study of structure and reaction processes of coal. Fuel 1950, 29, 269–84. [Google Scholar]
  67. Spokas, K.A. Review of the stability of biochar in soils: Predictability of O:C molar ratios. Carbon Manag. 2010, 1, 289–303. [Google Scholar] [CrossRef]
  68. Buss, W.; Mašek, O.; Graham, M.; Wüst, D. Inherent organic compounds in biochar—Their content, composition and potential toxic effects. J. Environ. Manag. 2015. [Google Scholar] [CrossRef] [PubMed]
  69. Hale, S.E.; Lehmann, J.; Rutherford, D.; Zimmerman, A.R.; Bachmann, R.T.; Shitumbanuma, V.; O’Toole, A.; Sundqvist, K.L.; Arp, H.P.; Cornelissen, G. Quantifying the Total and Bioavailable Polycyclic Aromatic Hydrocarbons and Dioxins in Biochars. Environ. Sci. Technol. 2012, 46, 2830–2838. [Google Scholar] [CrossRef] [PubMed]
  70. Spokas, K.; Novak, J.M.; Stewart, C.E.; Cantrell, K.B.; Uchimiya, M.; Du Saire, M.G.; Ro, K.S. Qualitative analysis of volatile organic compounds on biochars. Chemosphere 2011, 85, 869–882. [Google Scholar] [CrossRef] [PubMed]
  71. Yargicoglu, E.N.; Sadasivam, B.Y.; Reddy, K.R.; Spokas, K. Physical and chemical characterization of waste wood derived biochars. Waste Manag. 2015, 36, 256–268. [Google Scholar] [CrossRef] [PubMed]
  72. Yargicoglu, E.N.; Reddy, K.R. Characterization and Surface Analysis of Commercially Available Biochars for Geoenvironmental Applications. In Proceedings of the IFCEE2015, San Antonio, TX, USA, 17–21 March 2015.
  73. Cantrell, K.B.; Hunt, P.G.; Uchimiya, M.; Novak, J.M.; Ro, K.S. Impact of pyrolysis temperature and manure source on physicochemical characteristics of biochar. Bioresour. Technol. 2012, 107, 419–428. [Google Scholar] [CrossRef] [PubMed]
  74. Park, J.; Lee, Y.; Ryu, C.; Park, Y.K. Slow pyrolysis of rice straw: Analysis of products properties, carbon and energy yields. Bioresour. Technol. 2014, 155, 63–70. [Google Scholar] [CrossRef] [PubMed]

