
Detection and Differentiation between Laurel Wilt Disease, Phytophthora Disease, and Salinity Damage Using a Hyperspectral Sensing Technique


Abstract
:1. Introduction
2. Experimental Section
2.1. Host Plants and Inoculation in Greenhouse
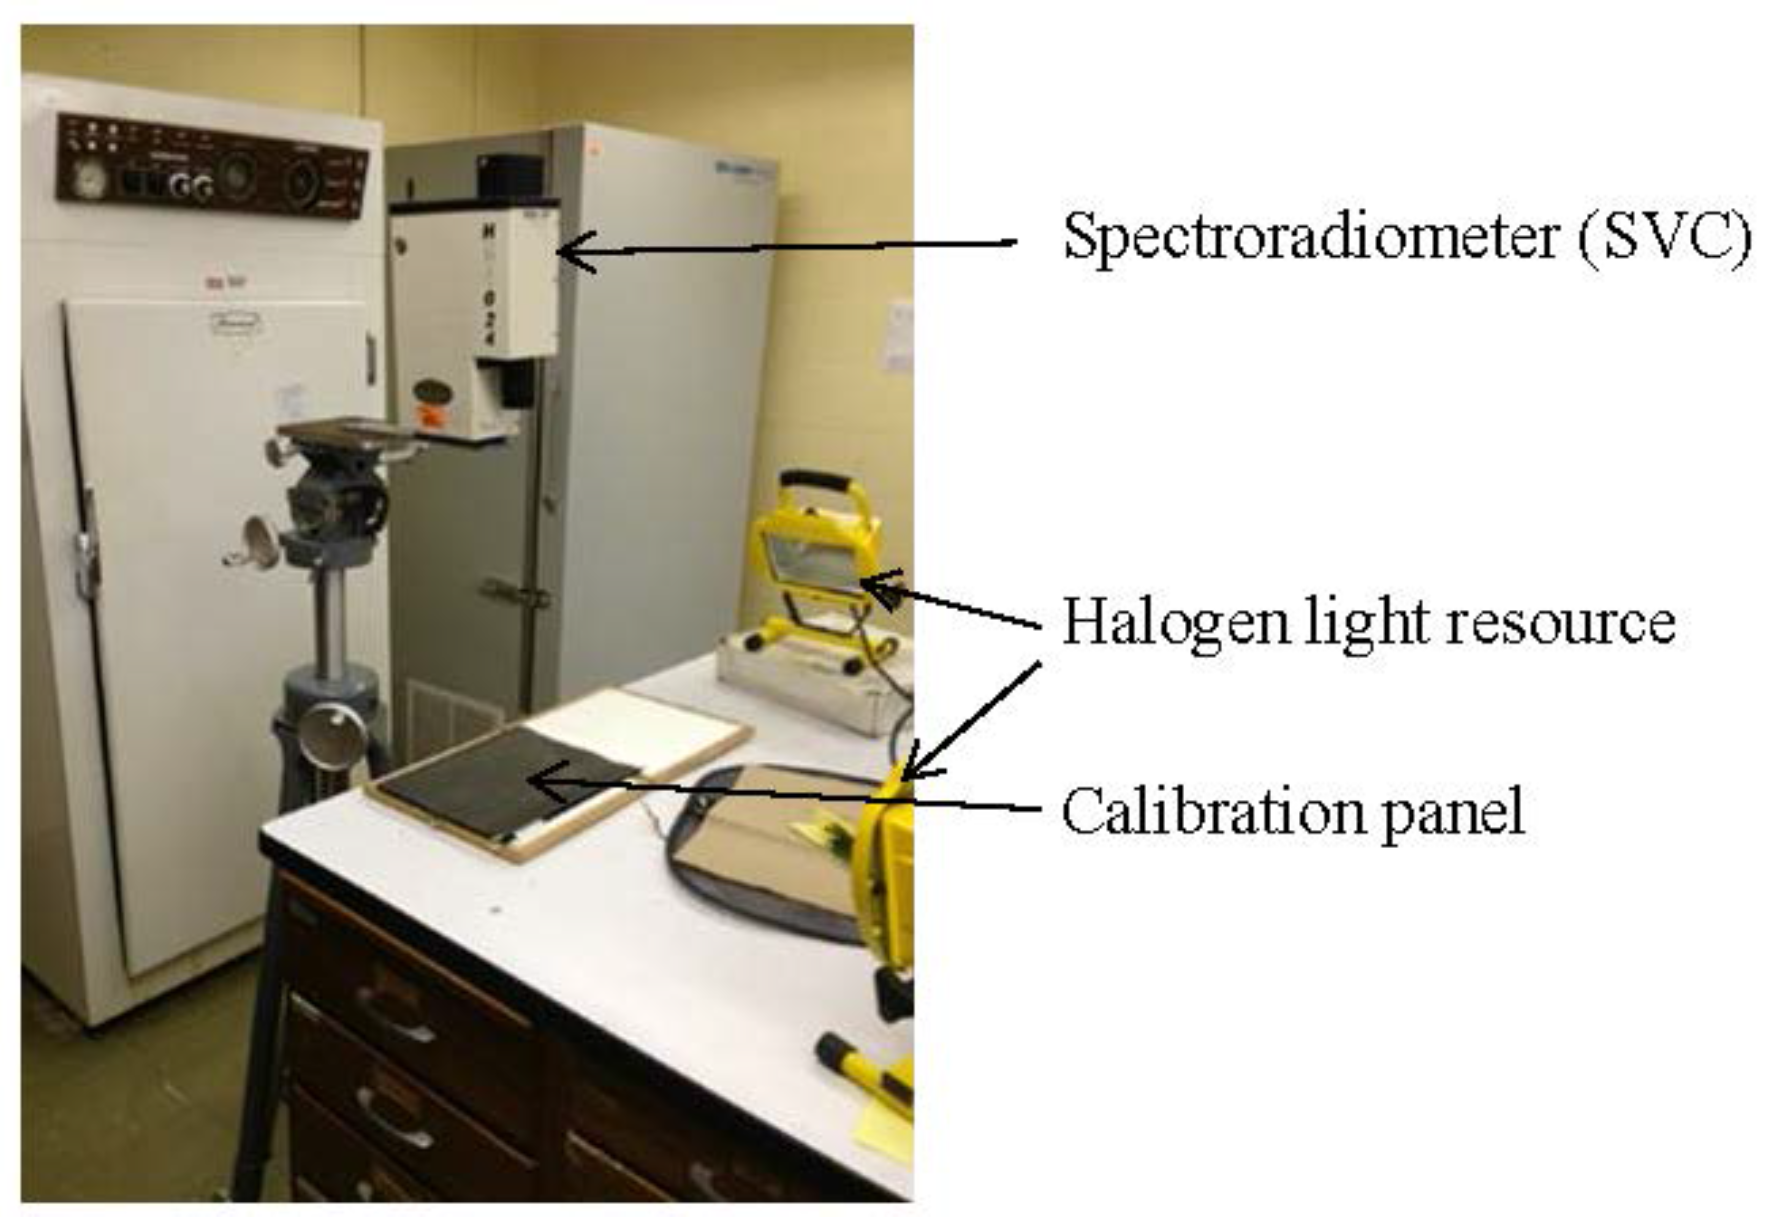
2.2. Spectral Data Collection
2.3. Data Analysis and Classification
2.3.1. Stepwise Discriminant Analysis
2.3.2. Neural Networks
3. Results
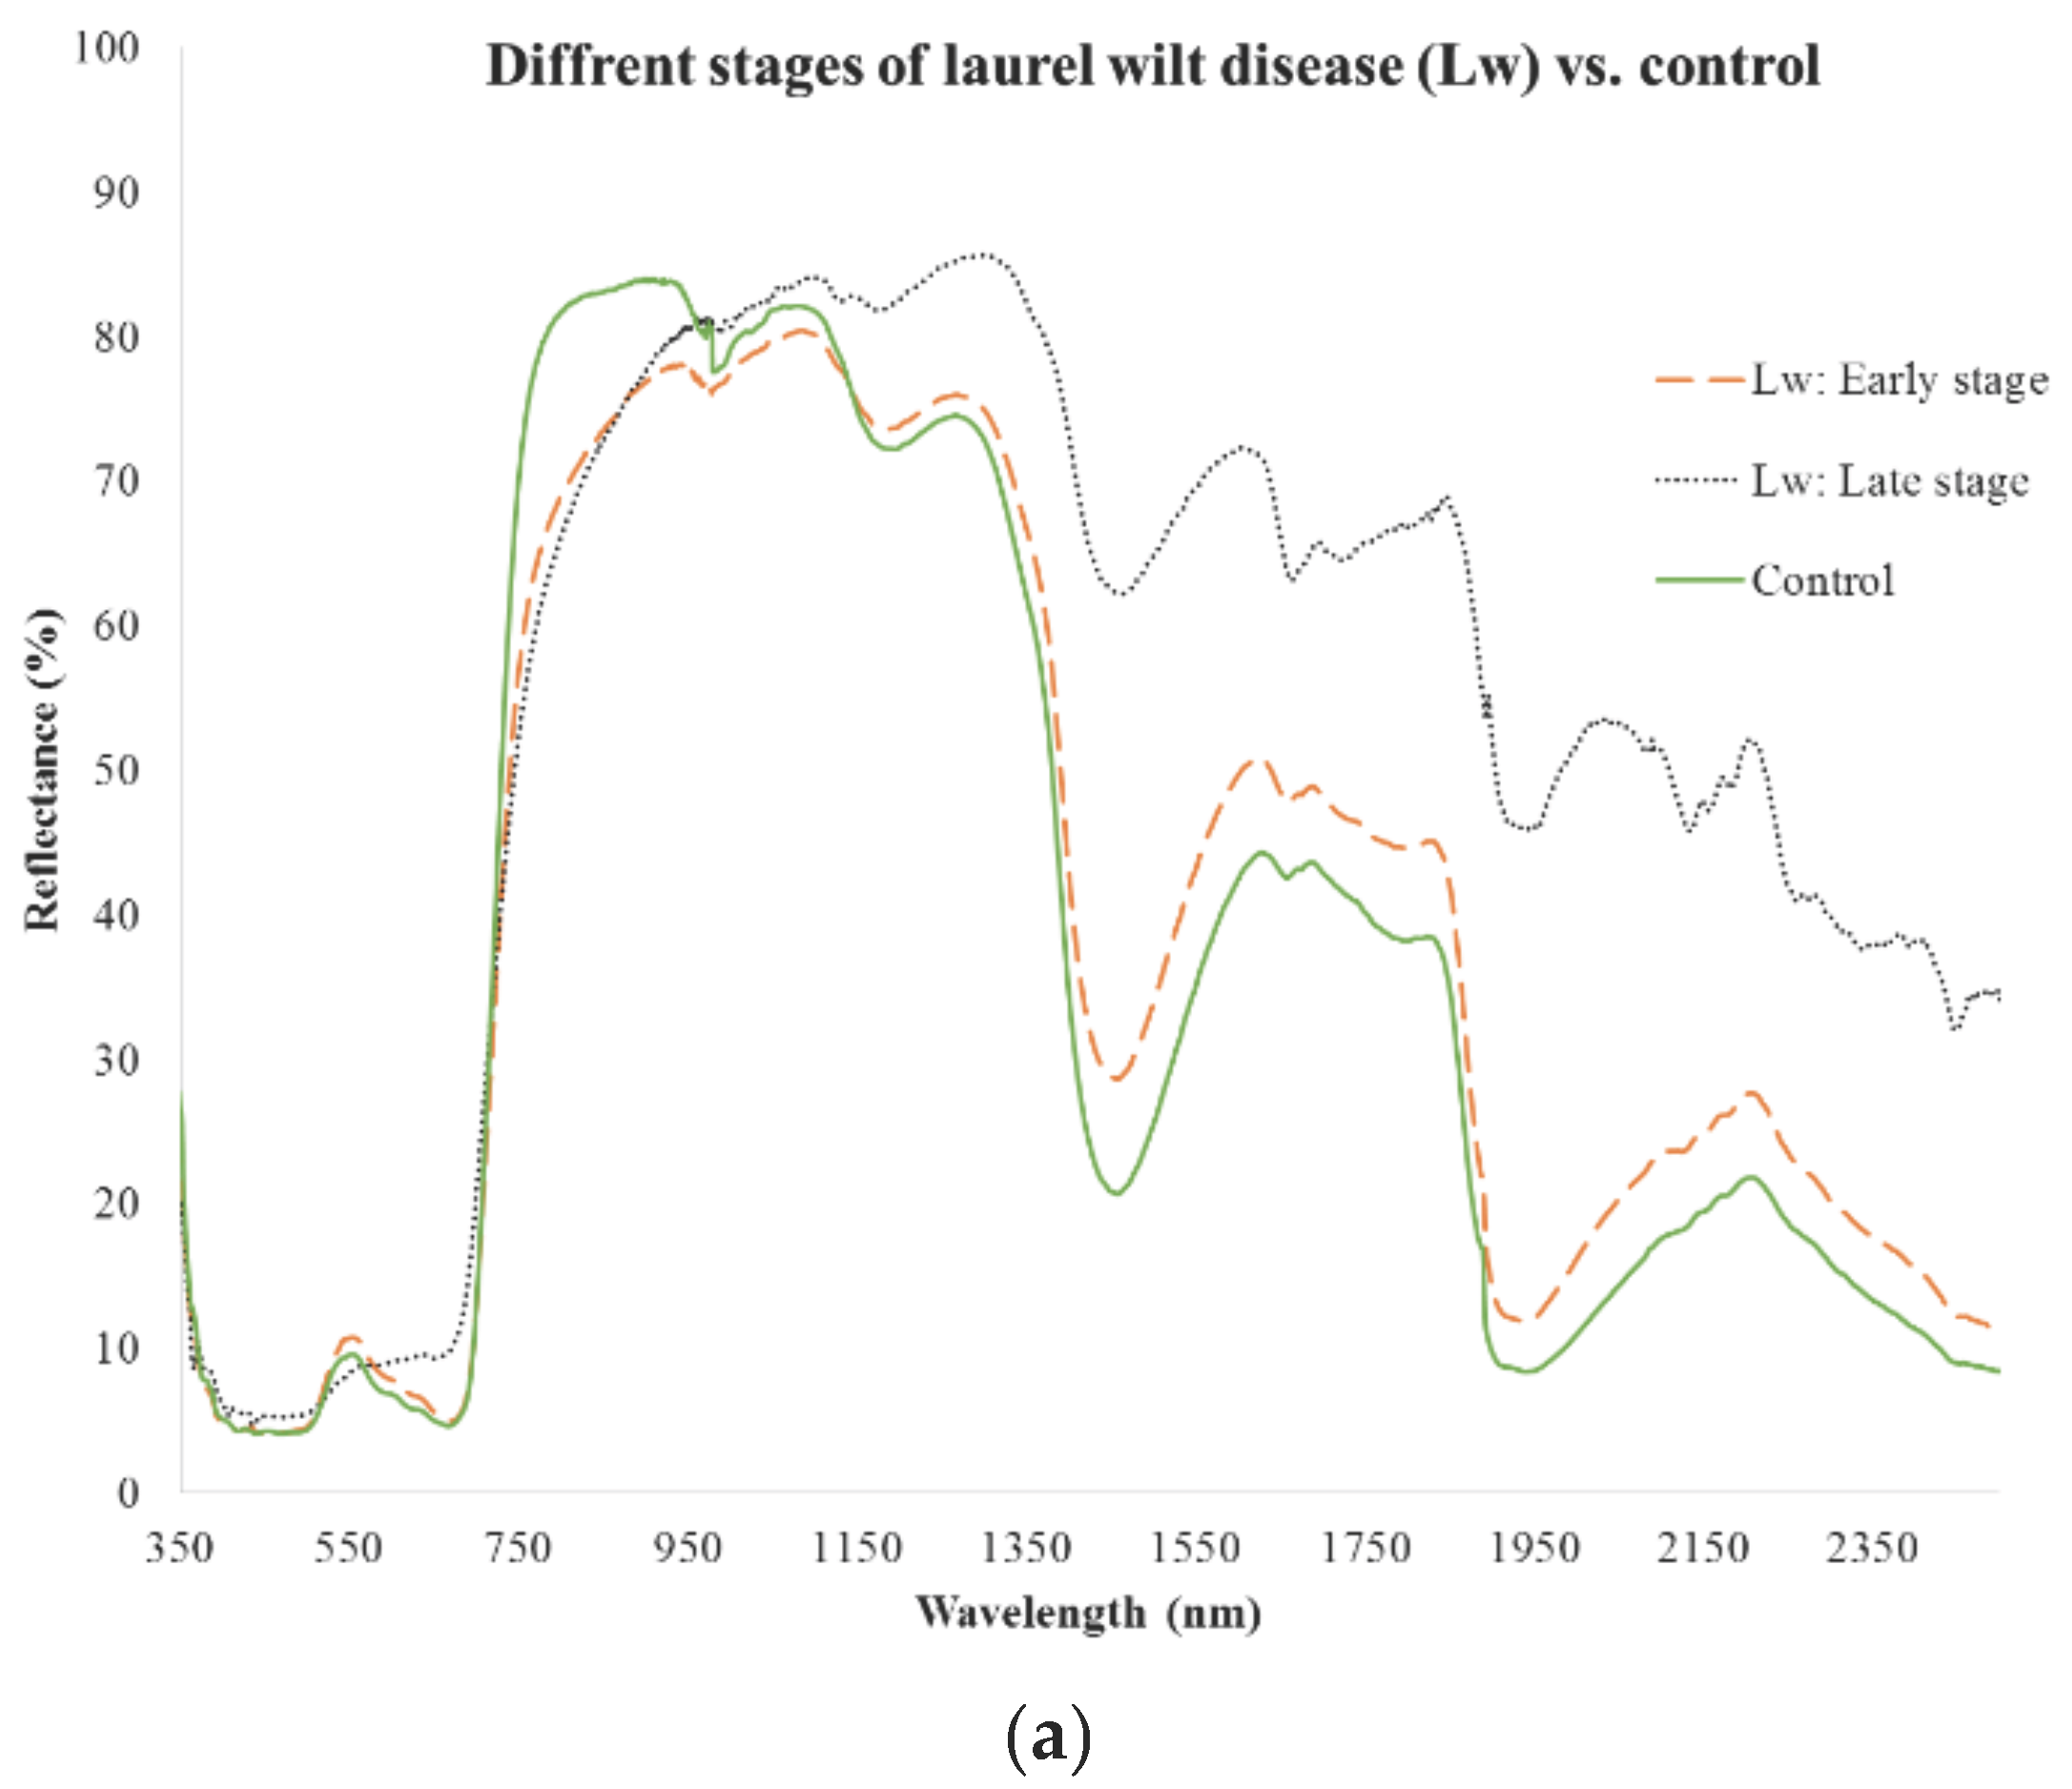
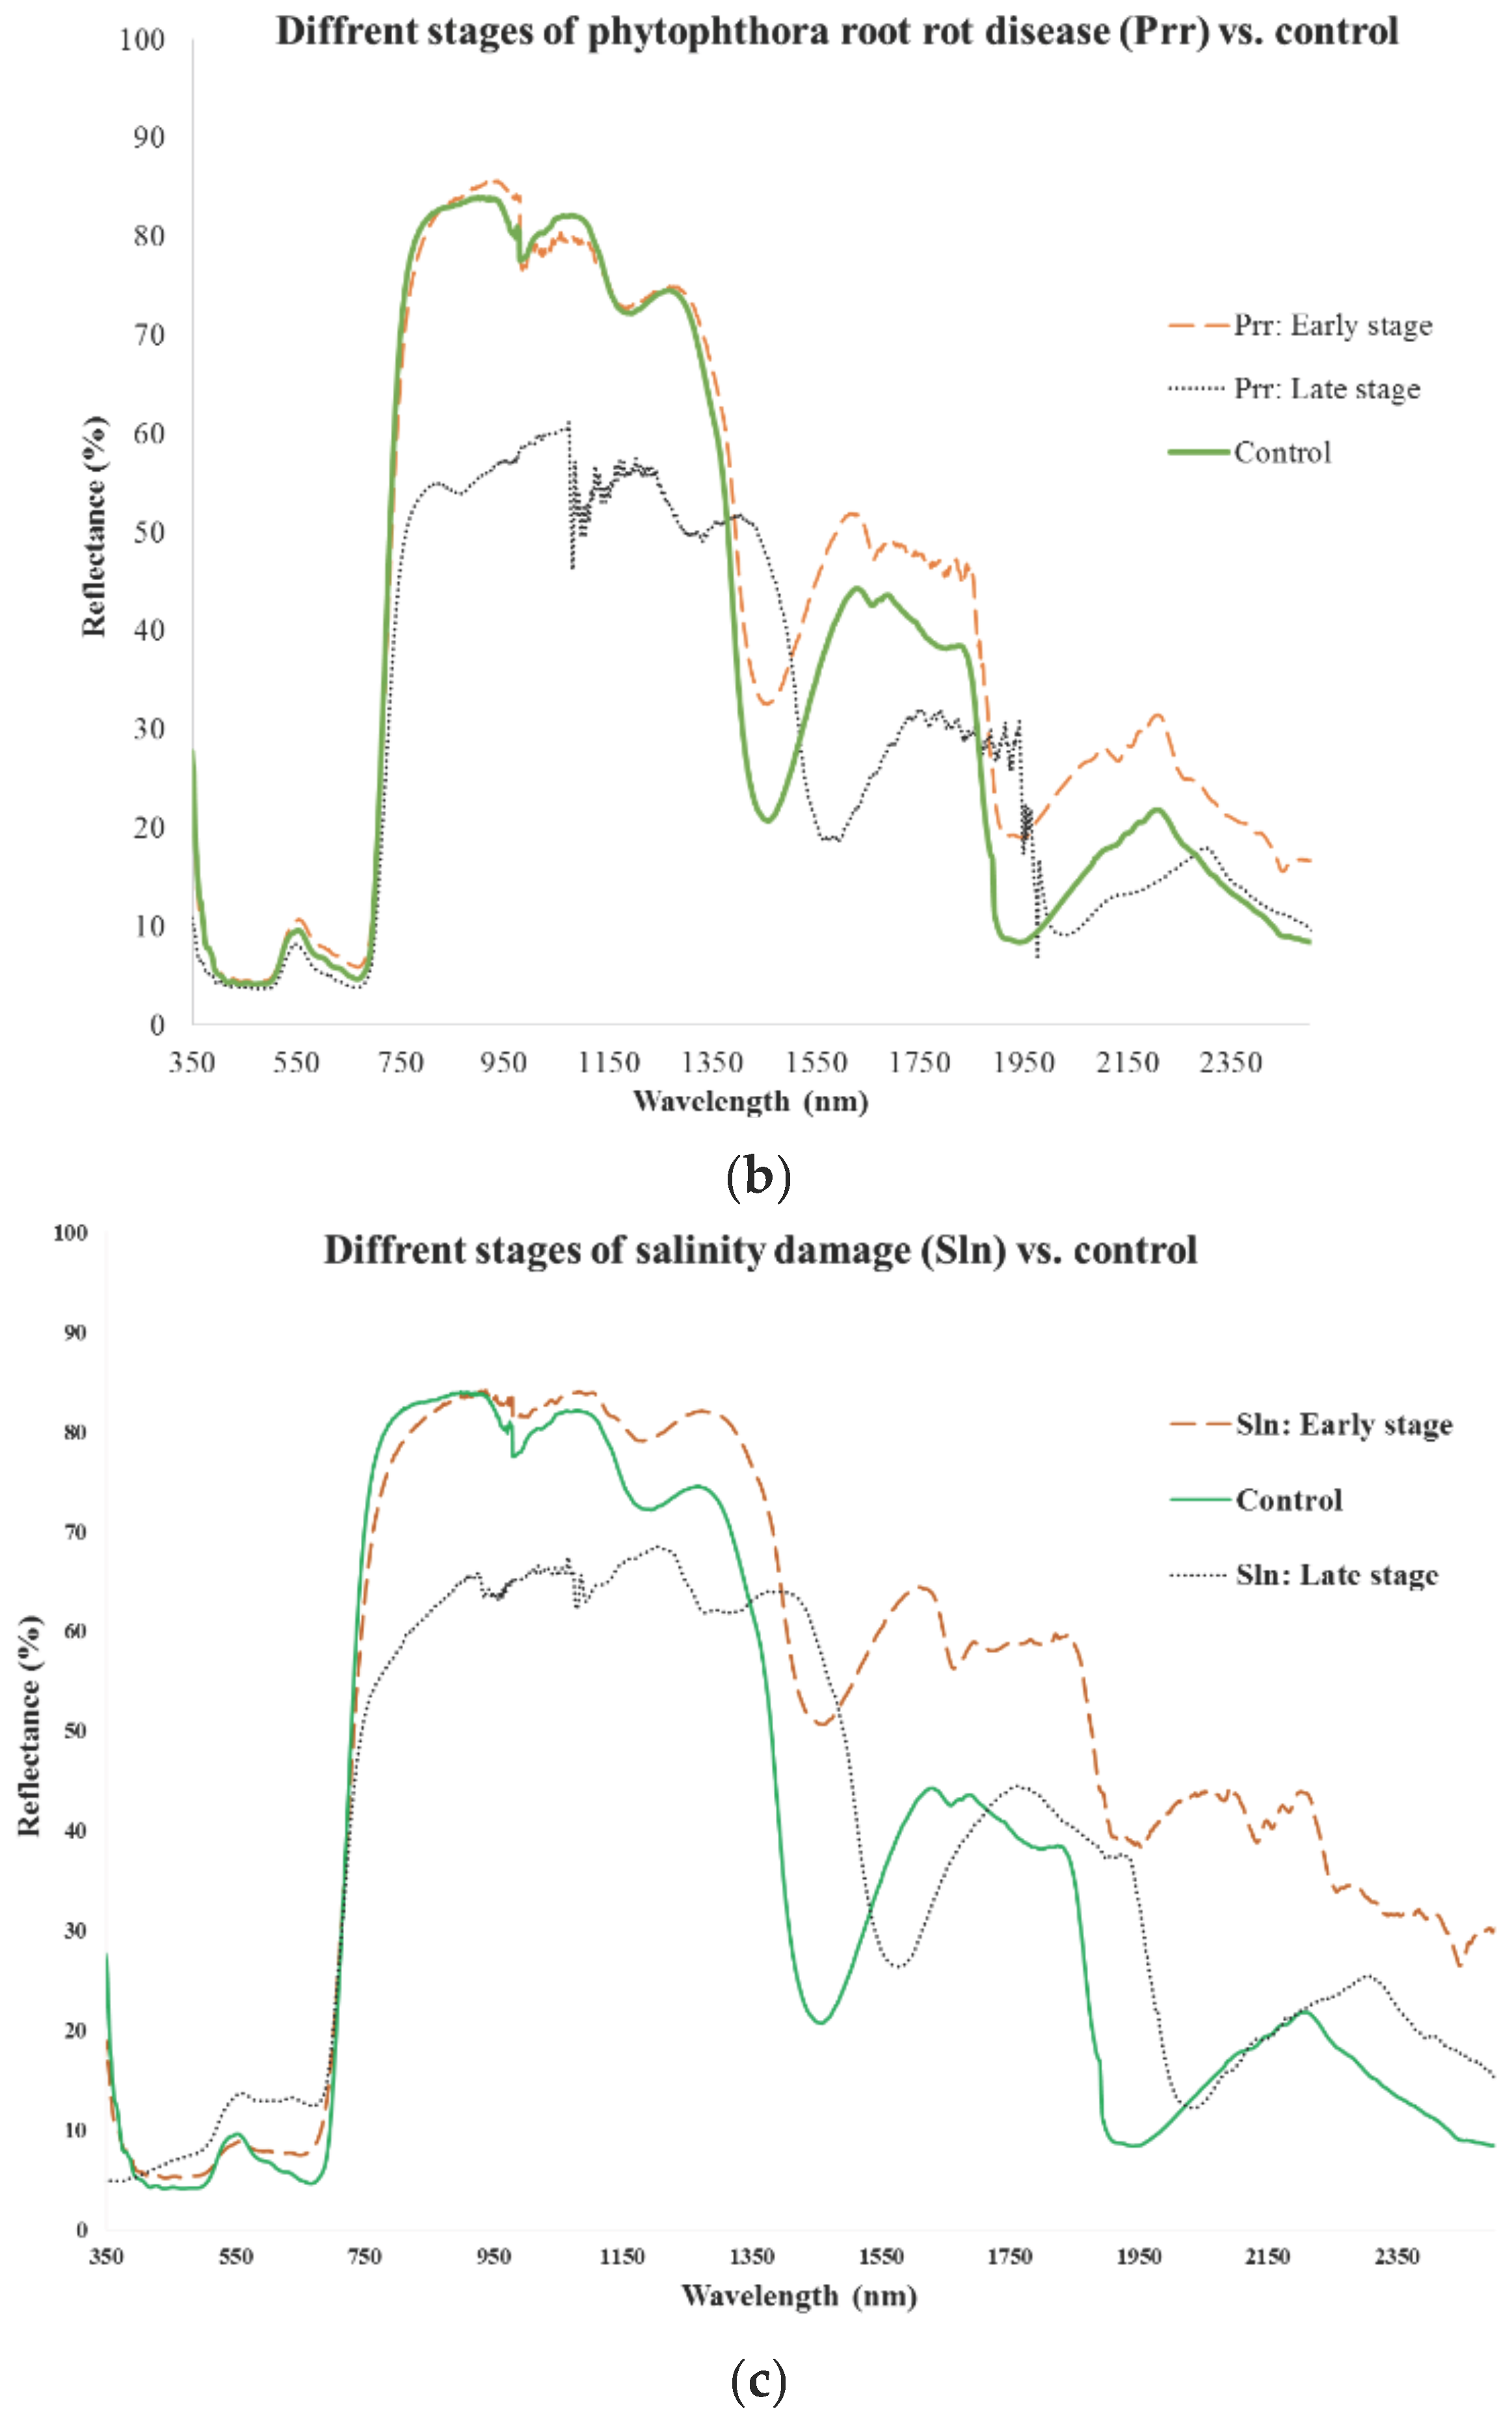
3.1. Early Stage
3.2. Late Stage
3.3. Combination of Early and Late Stages
4. Discussion
5. Conclusions
Acknowledgments
Author Contributions
Conflicts of Interest
References
- United States Department of Agriculture (USDA). Noncitrus Fruits and Nuts: 2008 Preliminary Summary. Available online: http://usda.mannlib.cornell.edu/usda/nass/NoncFruiNu//2000s/2009/NoncFruiNu-01-23-2009_revision.pdf (accessed on 18 August 2016).
- Evans, E.A.; Crane, J.; Hodges, A.; Osborne, J.L. Potential economic impact of laurel wilt disease on the Florida avocado industry. Horttechnology 2010, 20, 234–238. [Google Scholar]
- Evans, E.A. Sample avocado production costs and profitability analysis for Florida. In Electronic Data Information Source (EDIS) FE 837; Bernal Lozano, I., Ed.; Food and Resource Economics Department, University of Florida: Gainesville, FL, USA, 2015. [Google Scholar]
- Evans, J.P.; Scheffers, B.R.; Hess, M. Effect of laurel wilt invasion on redbay populations in a maritime forest community. Biol. Invasions 2014, 16, 1581–1588. [Google Scholar] [CrossRef]
- Carrillo, D.; Crane, J.H.; Pena, J.E. Potential of contact insecticides to control Xyleborus glabratus (Coleoptera: Curculionidae), a vector of laurel wilt disease in avocados. J. Econ. Entomol. 2013, 106, 2286–2295. [Google Scholar] [CrossRef] [PubMed]
- Ploetz, R.; Schaffer, B.; Vargas, A.; Konkol, J.; Salvatierra, J.; Inch, S.; Campbell, A.; Wideman, R. Physiological impacts of laurel wilt on avocado. Phytopathology 2013, 103, 114. [Google Scholar]
- Kendra, P.E.; Montgomery, W.S.; Niogret, J.; Pruett, G.E.; Mayfield, A.E., 3rd; MacKenzie, M.; Deyrup, M.A.; Bauchan, G.R.; Ploetz, R.C.; Epsky, N.D. North American Lauraceae: Terpenoid emissions, relative attraction and boring preferences of redbay ambrosia beetle, Xyleborus glabratus (Coleoptera: Curculionidae: Scolytinae). PLoS ONE 2014, 9, e102086. [Google Scholar] [CrossRef] [PubMed]
- Kuhns, E.H.; Martini, X.; Tribuiani, Y.; Coy, M.; Gibbard, C.; Pena, J.; Hulcr, J.; Stelinski, L.L. Eucalyptol is an attractant of the redbay ambrosia beetle, Xyleborus glabratus. J. Chem. Ecol. 2014, 40, 355–362. [Google Scholar] [CrossRef] [PubMed]
- Fraedrich, S.W.; Harrington, T.C.; Rabaglia, R.J.; Ulyshen, M.D.; Mayfield, A.E., III; Hanula, J.L.; Eickwort, J.M.; Miller, D.R. A fungal symbiont of the redbay ambrosia beetle causes a lethal wilt in redbay and other Lauraceae in the southeastern United States. Plant Dis. 2008, 92, 215–224. [Google Scholar] [CrossRef]
- Hanula, J.L.; Mayfield, A.E., III; Fraedrich, S.W.; Rabaglia, R.J. Biology and host associations of redbay ambrosia beetle (Coleoptera: Curculionidae: Scolytinae), exotic vector of laurel wilt killing redbay trees in the southeastern United States. J. Econ. Entomol. 2008, 101, 1276–1286. [Google Scholar] [CrossRef] [PubMed]
- Kendra, P.E.; Montgomery, W.S.; Niogret, J.; Epsky, N.D. An uncertain future for American Lauraceae: A lethal threat from redbay ambrosia beetle and laurel wilt disease (a review). Am. J. Plant Sci. 2013, 4, 727–738. [Google Scholar] [CrossRef]
- Carrillo, D.; Duncan, R.E.; Pena, J.E. Ambrosia beetles (Coleoptera: Curculionidae: Scolytinae) that breed in avocado wood in florida. Fla. Entomol. 2012, 95, 573–579. [Google Scholar] [CrossRef]
- Jeyaprakash, A.; Davison, D.A.; Schubert, T.S. Molecular detection of the laurel wilt fungus, Raffaelea lauricola. Plant Dis. 2014, 98, 559–564. [Google Scholar] [CrossRef]
- Ploetz, R.C.; Perez-Martinez, J.M.; Smith, J.A.; Hughes, M.; Dreaden, T.; Blanchette, R.; Held, B.; Inch, S.A. Laurel Wilt: A dangerous new disease of avocado in the Western Hemisphere. In Proceedings of the Caribbean Food Crops Society 46th Annual Meeting and T-Star Invasive Symposium, Boca Chica, Dominican Republic, 11–17 July 2010; pp. 97–106.
- Sankaran, S.; Ehsani, R.; Inch, S.A.; Ploetz, R.C. Evaluation of visible-near infrared reflectance spectra of avocado leaves as a non-destructive sensing tool for detection of laurel wilt. Plant Dis. 2012, 96, 1683–1689. [Google Scholar] [CrossRef]
- Ploetz, R.C.; Perez-Martinez, J.M.; Smith, J.A.; Hughes, M.; Dreaden, T.J.; Inch, S.A.; Fu, Y. Responses of avocado to laurel wilt, caused by Raffaelea lauricola. Plant Pathol. 2012, 61, 801–808. [Google Scholar] [CrossRef]
- Inch, S.A.; Ploetz, R.C. Impact of laurel wilt, caused by Raffaelea lauricola, on xylem function in avocado, Persea americana. For. Pathol. 2012, 42, 239–245. [Google Scholar] [CrossRef]
- Sankaran, S.; Ehsani, R.; Etxeberria, E. Mid-infrared spectroscopy for detection of Huanglongbing (greening) in citrus leaves. Talanta 2010, 83, 574–581. [Google Scholar] [CrossRef] [PubMed]
- Henson, J.M.; French, R. The polymerase chain reaction and plant disease diagnosis. Annu. Rev. Phytopathol. 1993, 31, 81–109. [Google Scholar] [CrossRef] [PubMed]
- Bravo, C.; Moshou, D.; West, J.; McCartney, A.; Ramon, H. Early disease detection in wheat fields using spectral reflectance. Biosyst. Eng. 2003, 84, 137–145. [Google Scholar] [CrossRef]
- Graeff, S.; Claupein, W. Quantifying nitrogen status of corn (Zea mays L.) in the field by reflectance measurements. Eur. J. Agron. 2003, 19, 611–618. [Google Scholar] [CrossRef]
- Curran, P. Introduction to environmental remote sensing (fourth edition). Geography 2000, 85, 376. [Google Scholar]
- Hunsche, M.; Buerling, K.; Noga, G. Spectral and time-resolved fluorescence signature of four weed species as affected by selected herbicides. Pestic. Biochem. Physiol. 2011, 101, 39–47. [Google Scholar] [CrossRef]
- Blackburn, G.A. Spectral indices for estimating photosynthetic pigment concentrations: A test using senescent tree leaves. Int. J. Remote Sens. 1998, 19, 657–675. [Google Scholar] [CrossRef]
- Broge, N.H.; Leblanc, E. Comparing prediction power and stability of broadband and hyperspectral vegetation indices for estimation of green leaf area index and canopy chlorophyll density. Remote Sens Environ. 2001, 76, 156–172. [Google Scholar] [CrossRef]
- Abdulridha, J.; de Castro, A.; Ehsani, R. Differentiate Laurel wilt disease and nutrient deficiency in avocado trees using Vis–NIR spectroscopy. In Proceedings of the 2015 ASABE Annual International Meeting, New Orleans, LA, USA, 26–29 July 2015.
- Moran, M.S.; Inoue, Y.; Barnes, E.M. Opportunities and limitations for image-based remote sensing in precision crop management. Remote Sens. Environ. 1997, 61, 319–346. [Google Scholar] [CrossRef]
- Pinter, P.J.; Hatfield, J.L.; Schepers, J.S.; Barnes, E.M.; Moran, M.S.; Daughtry, C.S.T.; Upchurchm, D.R. Remote sensing for crop management. Photogramm. Eng. Remote Sens. 2003, 69, 647–664. [Google Scholar] [CrossRef]
- Vrindts, E.; De Baerdemaeker, J.; Ramon, H. Weed detection using canopy reflection. Precis. Agric. 2002, 3, 63–80. [Google Scholar] [CrossRef]
- Mahlein, A.K.; Steiner, U.; Dehne, H.W.; Oerke, E.C. Spectral signatures of sugar beet leaves for the detection and differentiation of diseases. Precis. Agric. 2010, 11, 413–431. [Google Scholar] [CrossRef]
- Rumpf, T.; Mahlein, A.K.; Steiner, U.; Oerke, E.C.; Dehne, H.W.; Pluemer, L. Early detection and classification of plant diseases with Support Vector Machines based on hyperspectral reflectance. Comput. Electron. Agric. 2010, 74, 91–99. [Google Scholar] [CrossRef]
- Ma, R.; Yang, B.; Zhang, L.; Liu, Z. Design and implementation of a forest fire monitoring system using a miniature unmanned aerial vehicle. J. Zhejiang A F Univ. 2012, 29, 783–789. [Google Scholar]
- Menesatti, P.; Antonucci, F.; Pallottino, F.; Roccuzzo, G.; Allegra, M.; Stagno, F.; Intrigliolo, F. Estimation of plant nutritional status by Vis–NIR spectrophotometric analysis on orange leaves Citrus sinensis (L) Osbeck cv Tarocco. Biosyst. Eng. 2010, 105, 448–454. [Google Scholar] [CrossRef]
- Tomkiewicz, D.; Piskier, T. A plant based sensing method for nutrition stress monitoring. Precis. Agric. 2012, 13, 370–383. [Google Scholar] [CrossRef]
- Franke, J.; Menz, G. Multi-temporal wheat disease detection by multi-spectral remote sensing. Precis. Agric. 2007, 8, 161–172. [Google Scholar] [CrossRef]
- De Castro, A.; Ehsani, R.; Ploetz, R.; Crane, J.; Abdulridha, J. Optimum spectral and geometric parameters for early detection of laurel wilt disease in avocado. Remote Sens. Environ. 2015, 171, 33–44. [Google Scholar] [CrossRef]
- Pant, P.; Heikkinen, V.; Korpela, I.; Hauta-Kasari, M.; Tokola, T. Logistic regression-based spectral band selection for tree species classification: Effects of spatial scale and balance in training samples. IEEE Geosci. Remote Sens. Lett. 2014, 11, 1604–1608. [Google Scholar] [CrossRef]
- De Castro, A.I.; Jurado-Exposito, M.; Gomez-Casero, M.T.; Lopez-Granados, F. Applying neural networks to hyperspectral and multispectral field data for discrimination of cruciferous weeds in winter crops. Sci. World J. 2012, 2012, 630390. [Google Scholar] [CrossRef] [PubMed]
- Karimi, Y.; Prasher, S.O.; McNairn, H.; Bonnell, R.B.; Dutilleul, P.; Goel, P.K. Discriminant analysis of hyperspectral data for assessing water and nitrogen stresses in corn. Trans. ASAE 2005, 48, 805–813. [Google Scholar] [CrossRef]
- Thenkabail, P.S.; Gamage, M.; Smakhtin, V.U. The Use of Remote Sensing Data for Drought Assessment and Monitoring in Southwest Asia; Research Report; International Water Management Institute: Colombo, Sri Lanka, 2005. [Google Scholar]
- Park, J.; Sandberg, I.W. Approximation and radial-basis-function networks. Neural Comput. 1993, 5, 305–316. [Google Scholar] [CrossRef]
- Keranen, M.; Aro, E.M.; Tyystjarvi, E.; Nevalainen, O. Automatic plant identification with chlorophyll fluorescence fingerprinting. Precis. Agric. 2003, 4, 53–67. [Google Scholar] [CrossRef]
- Jayawardena, A.W.; Fernando, D.K.; Zhou, M.C. Comparison of multilayer perceptron and radial basis function network as flood forecasting. IAHS 1997, 239, 173–182. [Google Scholar]
- Burks, T.F.; Shearer, S.A.; Heath, J.R.; Donohue, K.D. Evaluation of neural-network classifiers for weed species discrimination. Biosyst. Eng. 2005, 91, 293–304. [Google Scholar] [CrossRef]
- Chernick, M.R.; Murthy, V.K.; Nealy, C.D. Estimation of error rate for linear discriminant functions by resampling—Non-Gaussian populations. Comput. Math. Appl. 1988, 15, 29–37. [Google Scholar] [CrossRef]
- Carter, G.A.; Knapp, A.K. Leaf optical properties in higher plants: Linking spectral characteristics to stress and chlorophyll concentration. Am. J. Bot. 2001, 88, 677–684. [Google Scholar] [CrossRef] [PubMed]
- West, J.S.; Bravo, C.; Oberti, R.; Lemaire, D.; Moshou, D.; McCartney, H.A. The potential of optical canopy measurement for targeted control of field crop diseases. Annu. Rev. Phytopathol. 2003, 41, 593–614. [Google Scholar] [CrossRef] [PubMed]
- Wang, F.M.; Huang, J.F.; Xu, J.F.; Wang, X.Z. Wavebands selection tor rice information extraction based on spectral bands inter-correlation. Spectrosc. Spectr. Anal. 2008, 28, 1098–1101. [Google Scholar]
- Sims, D.A.; Gamon, J.A. Relationships between leaf pigment content and spectral reflectance across a wide range of species, leaf structures and developmental stages. Remote Sens. Environ. 2002, 81, 337–354. [Google Scholar] [CrossRef]
- Sims, D.A.; Gamon, J.A. Estimation of vegetation water content and photosynthetic tissue area from spectral reflectance: A comparison of indices based on liquid water and chlorophyll absorption features. Remote Sens. Environ. 2003, 84, 526–537. [Google Scholar] [CrossRef]
- Carter, G.A. Primary and secondary effects of water-content on the spectral reflectance of leaves. Am. J. Bot. 1991, 78, 916–924. [Google Scholar] [CrossRef]
- Gamon, J.A.; Surfus, J.S. Assessing leaf pigment content and activity with a reflectometer. New Phytol. 1999, 143, 105–117. [Google Scholar] [CrossRef]
- Chang, C.I.; Liu, K.H. Progressive band selection of spectral unmixing for hyperspectral imagery. IEEE Trans. Geosci. Remote Sens. 2014, 52, 2002–2017. [Google Scholar] [CrossRef]
- Gomez-Casero, M.T.; Castillejo-Gonzalez, I.L.; Garcia-Ferrer, A.; Pena-Barragan, J.M.; Jurado-Exposito, M.; Garcia-Torres, L.; López-Granados, F. Spectral discrimination of wild oat and canary grass in wheat fields for less herbicide application. Agron. Sustain. Dev. 2010, 30, 689–699. [Google Scholar] [CrossRef]
- Li, S.; Qiu, J.; Yang, X.; Liu, H.; Wan, D.; Zhu, Y. A novel approach to hyperspectral band selection based on spectral shape similarity analysis and fast branch and bound search. Eng. Appl. Artif. Intell. 2014, 27, 241–250. [Google Scholar] [CrossRef]
- Sankaran, S.; Ehsani, R. Detection of huanglongbing disease in citrus using fluorescence spectroscopy. Trans. ASABE 2012, 55, 313–320. [Google Scholar] [CrossRef]
- Garrett, K.A.; Dendy, S.P.; Frank, E.E.; Rouse, M.N.; Travers, S.E. Climate change effects on plant disease: Genomes to ecosystems. Annu. Rev. Phytopathol. 2006, 44, 489–509. [Google Scholar] [CrossRef] [PubMed]


| Stage and Parameter Setting | Importance Variable (nm) | Overall Classification (%) |
|---|---|---|
| Early stage 10 nm | ||
| MLP: H, Lw, Sln | 717, 750, 739, 526, 952, 772 | 96 |
| MLP: H, Lw, Prr | 750, 739, 952, 728, 717, 772 | 96 |
| RBF: H, Lw, Sln | 615, 627, 649, 660, 671,681 | 65 |
| RBF: H, Lw, Prr | 794, 806, 783, 817, 705, 693 | 71 |
| Early stage 40 nm | ||
| MLP: H, Lw, Sln | 738, 780, 944, 615, 697, 656 | 97 |
| MLP: H, Lw, Prr | 491, 780, 697, 944, 615, 862 | 97 |
| RBF: H, Lw, Sln | 944, 697, 903, 615, 738, 862 | 73 |
| RBF: H, Lw, Prr | 409, 421, 433, 445, 457, 469 | 60 |
| Late stage 10 nm | ||
| MLP: H, Lw, Sln | 885, 874, 952, 852, 841, 761 | 99 |
| MLP: H, Lw, Prr | 491, 780, 697, 944, 615, 862 | 99 |
| RBF: H, Lw, Sal | 761, 874, 885, 728, 952, 739 | 77 |
| RBF: H, Lw, Prr | 409, 421, 433, 445, 457, 469 | 97 |
| Late stage 40 nm | ||
| MLP: H, Lw, Sln | 862, 780, 738, 944, 410, 903 | 98 |
| MLP: H, Lw, Prr | 862, 738, 410, 944, 697, 903 | 97 |
| RBF: H, Lw, Sln | 738, 944, 903, 410, 862, 697 | 77 |
| RBF: H, Lw, Prr | 410, 532, 450, 574, 862, 697 | 93 |
| Data Set | Classes | Per Class Accuracy (%) | Overall Classification (%) | |||
|---|---|---|---|---|---|---|
| H | Lw | Prr | Sln | |||
| Early stage 10 nm | H, Lw, Prr | 99 | 91 | 96 | - | 96 |
| H, Lw, Sln | 100 | 91 | - | 97 | 96 | |
| Early stage 40 nm | H, Lw, Prr | 95 | 98 | 98 | - | 97 |
| H, Lw, Sln | 100 | 100 | - | 89 | 97 | |
| Late Stage10 nm | H, Lw, Prr | 99 | 99 | 99 | - | 99 |
| H, Lw, Sln | 100 | 100 | - | 98 | 99 | |
| Late stage 40 nm | H, Lw, Prr | 98 | 96 | 98 | - | 97 |
| H, Lw, Sln | 99 | 97 | - | 98 | 98 | |
| Observed Spectra | Predicted Spectra | Per Class Accuracy | ||
|---|---|---|---|---|
| H | Lw | Sln | ||
| H | 30 | 3 | 0 | 99.1% |
| Lw | 0 | 39 | 0 | 90.9% |
| Sln | 0 | 2 | 44 | 100% |
| Overall classification | 95.8% | |||
| Stage-Waveband Input Data | Best Bands Selected | Wilks’s Lambda | Cross Validation |
|---|---|---|---|
| Early stage-10 nm | |||
| H, Lw, Prr | 806, 761, 548, 638, 885, 941, 537 | 0.2 | 82% |
| H, Lw, Sln | 908, 745, 852, 504, 445, 638, 604 | 0.2 | 86% |
| Early stage-40 nm | |||
| H, Lw, Prr | 618, 781, 822, 904, 657, 575, 410, 740, 451, 945, 493 | 0.2 | 83% |
| H, Lw, Sln | 595, 904, 781, 410, 534, 740, 698, 657, 616, 493 | 0.2 | 82% |
| Late stage-10 nm | |||
| H, Lw, Prr | 817, 829, 761, 409, 941, 548, 560, 421 | 0.0 | 98% |
| H, Lw, Sln | 560, 761, 806, 750, 885, 829, 409, 421, 504, 593, 515 | 0.05 | 92% |
| Late stage-40 nm | |||
| H, Lw, Prr | 817, 829, 761, 409, 941, 548, 560, 421 | 0.0 | 98% |
| H, Lw, Sln | 560, 761, 806, 750, 885, 829, 409, 421, 504, 593, 515 | 0.05 | 92% |
| Stage and Parameter Settings | Neural Network | Importance Wavebands (nm) | Overall Classification |
|---|---|---|---|
| H, Lw, Sal, 10 nm | MLP | 750, 717, 433, 705, 772, 693, 604 | 94% |
| H, Lw, Sal, 10 nm | RBF | 705, 537, 548, 409, 717, 560, 526, 941, 952, 433, 615 | 67% |
| H, Lw, Prr, 10 nm | MLP | 445, 515, 504, 433, 638, 705, 750, 817, 421, 739, 952, 493, 615, 761, 604 | 98% |
| H, Lw, Prr, 10 nm | RBF | 671, 681, 660, 649, 638, 693, 627 | 71% |
| H, Lw, Sal, 40 nm | MLP | 738, 780, 944, 862, 903, 450 | 93% |
| H, Lw, Sal, 40 nm | RBF | 944, 903, 862, 738, 656, 532, 450, 820, 491, 615, 574, 410, 780, 697 | 70% |
| H, Lw, Prr, 40 nm | MLP | 944, 821, 656, 862 | 93% |
| H, Lw, Prr, 40 nm | RBF | 944, 697, 903, 532, 738, 656, 574, 615, 862, 780, 821, 410 | 65% |
| Input Data | Best Bands Selected (nm) | Wilk’s Lambda | Cross Validation |
|---|---|---|---|
| H, Lw, Sln: 10 nm | 772, 794, 504, 548, 705, 638, 693, 681, 604, 717, 615, 445 | 0.0 | 87% |
| H, Lw, Prr: 10 nm | 750, 885, 829, 952, 548, 649, 693, 638, 705, 537, 515, 681 | 0.06 | 89% |
| H, Lw, Sln: 40 nm | 780, 820, 491, 532, 944, 410, 574, 697, 450, 656 | 0.05 | 80% |
| H, Lw, Prr: 40 nm | 780, 862, 944, 532, 574, 738, 697, 656, 410, 450, 615 | 0.03 | 81% |
© 2016 by the authors; licensee MDPI, Basel, Switzerland. This article is an open access article distributed under the terms and conditions of the Creative Commons Attribution (CC-BY) license (http://creativecommons.org/licenses/by/4.0/).
Share and Cite
Abdulridha, J.; Ehsani, R.; De Castro, A. Detection and Differentiation between Laurel Wilt Disease, Phytophthora Disease, and Salinity Damage Using a Hyperspectral Sensing Technique. Agriculture 2016, 6, 56. https://doi.org/10.3390/agriculture6040056
Abdulridha J, Ehsani R, De Castro A. Detection and Differentiation between Laurel Wilt Disease, Phytophthora Disease, and Salinity Damage Using a Hyperspectral Sensing Technique. Agriculture. 2016; 6(4):56. https://doi.org/10.3390/agriculture6040056
Chicago/Turabian StyleAbdulridha, Jaafar, Reza Ehsani, and Ana De Castro. 2016. "Detection and Differentiation between Laurel Wilt Disease, Phytophthora Disease, and Salinity Damage Using a Hyperspectral Sensing Technique" Agriculture 6, no. 4: 56. https://doi.org/10.3390/agriculture6040056