
Frequency Domain Probe Design for High Frequency Sensing of Soil Moisture

 , , and
Abstract
:1. Introduction
2. Materials and Methods
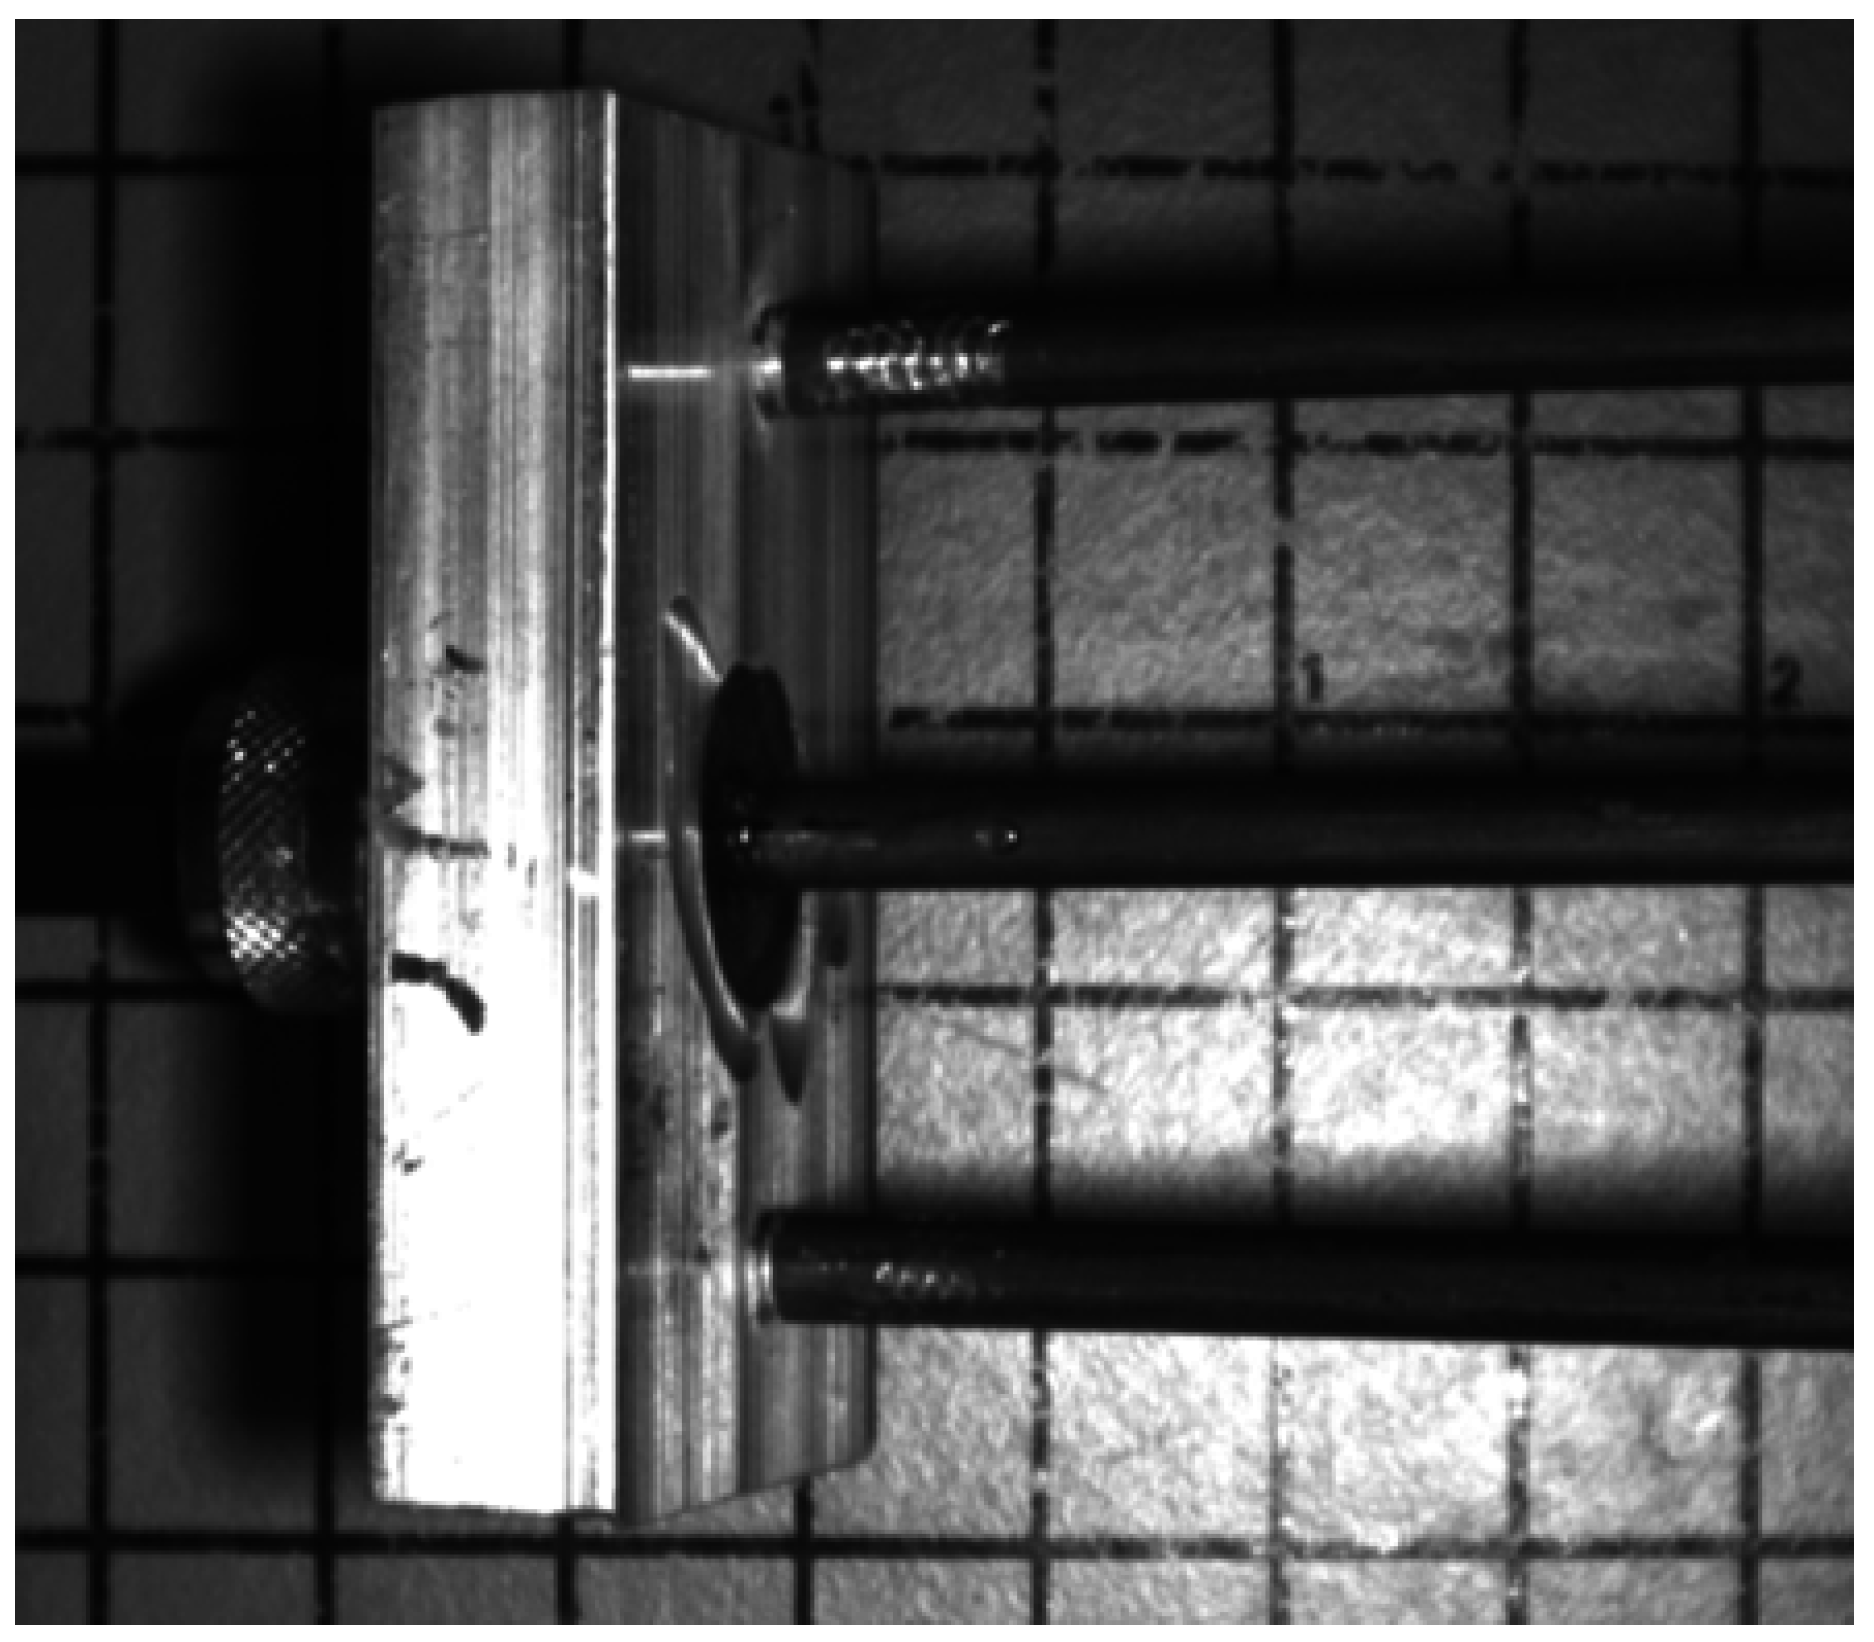
2.1. Probe Design
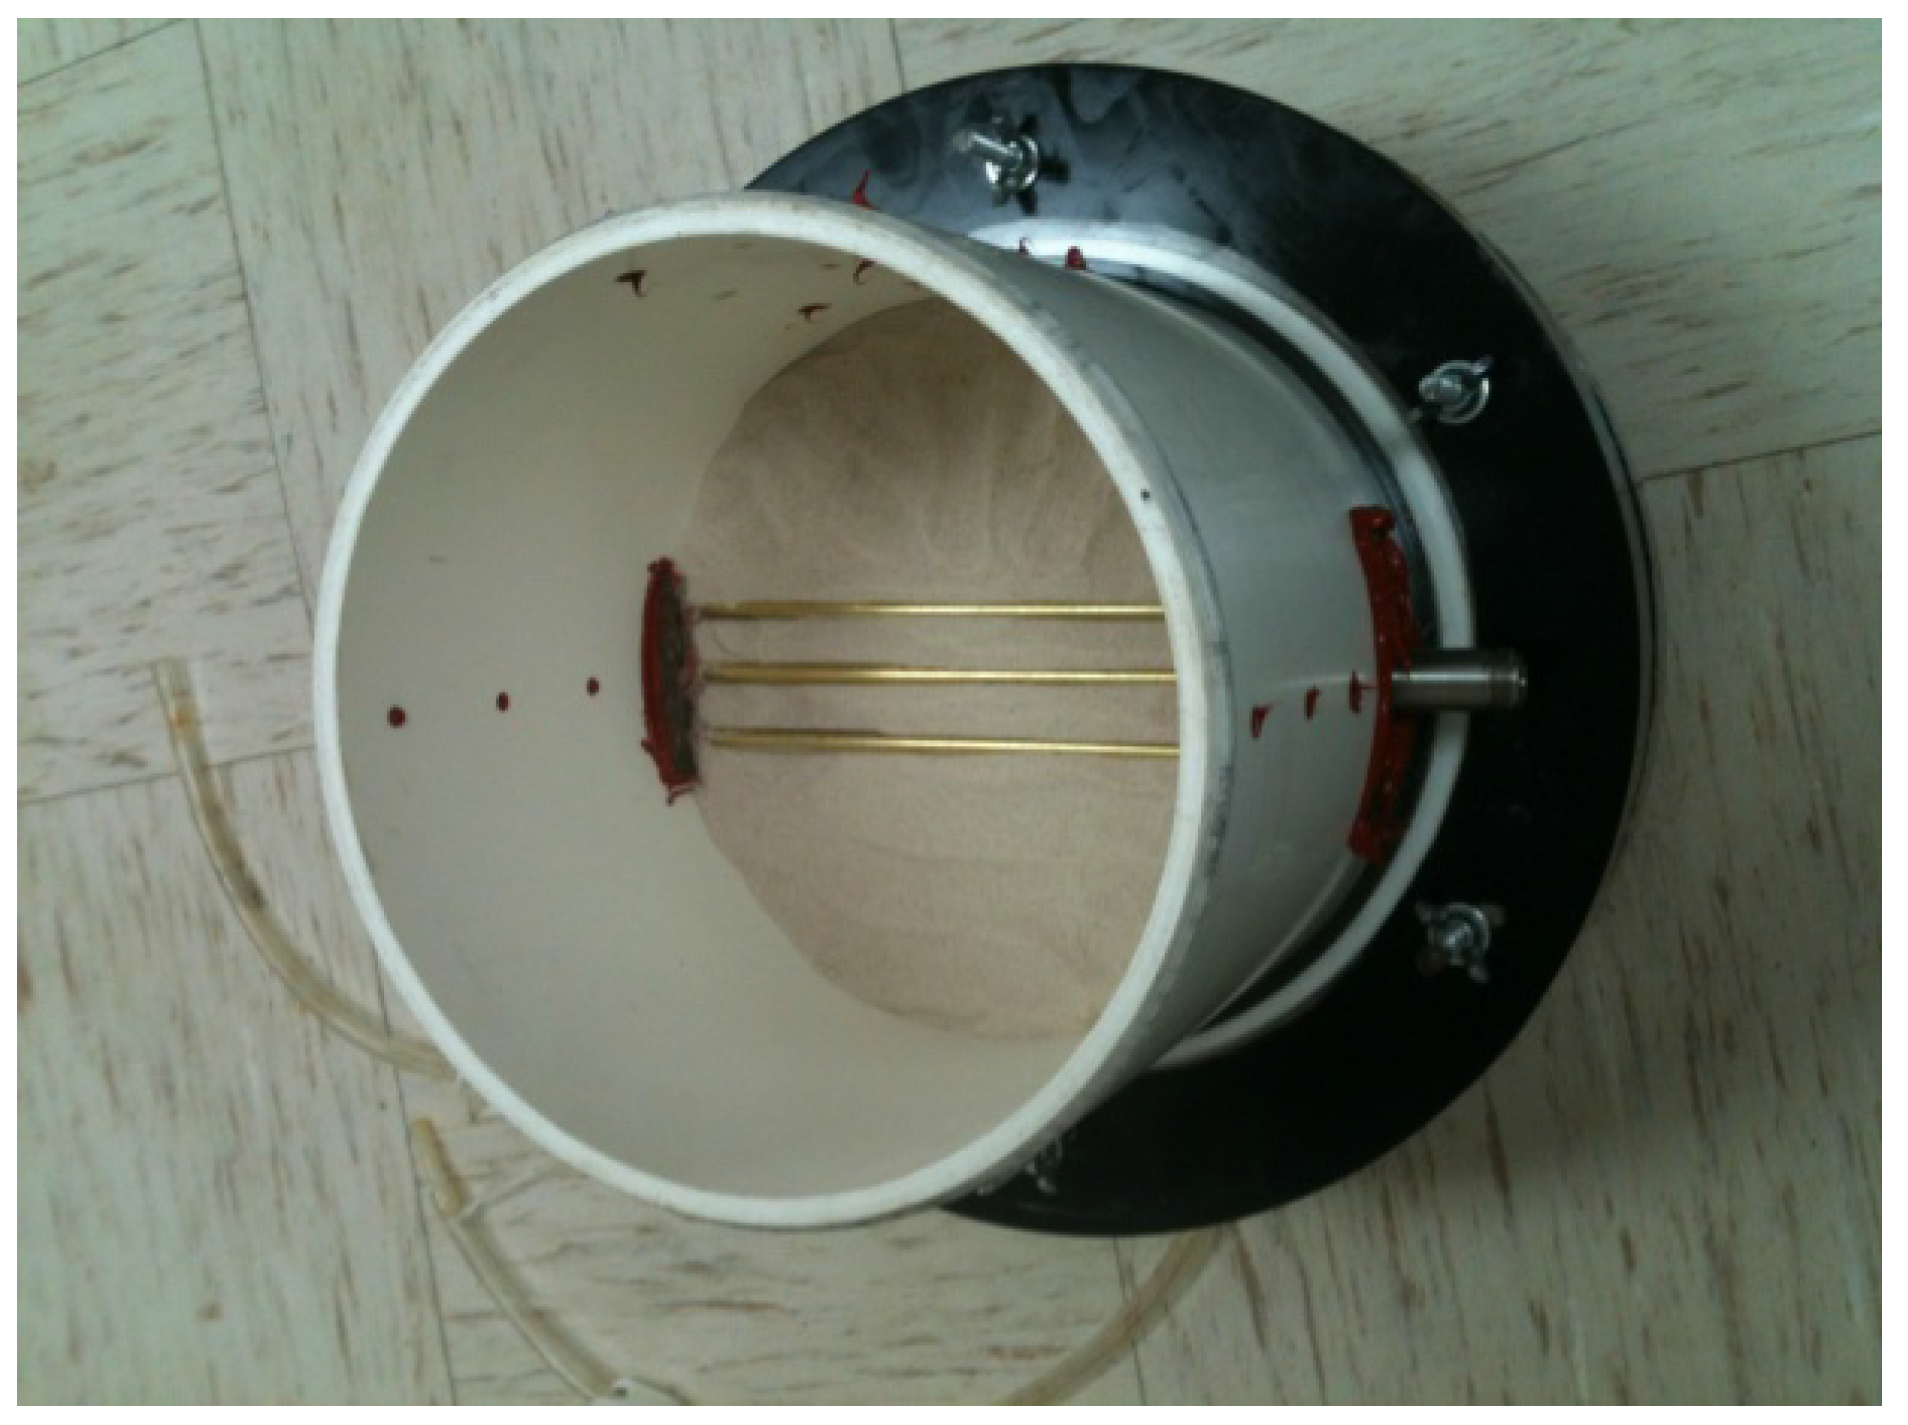
2.2. Construction
2.3. Test Protocol
2.4. Analysis
- γ ≡ complex propagation constant
- α ≡ propagation attenuation constant (neps/m)
- β ≡ propagation delay constant (rads/m)
- ε′ ≡ real portion of complex electrical permittivity (dielectric constant) (F/m)
- ε″ ≡ imaginary portion of complex electrical permittivity (dielectric damping)
- j ≡ imaginary number = [−1]0.5
- ω ≡ frequency of electromagnetic wave (rads/s)
- μo ≡ permeability of free-space (H/m)
- x ≡ j(ε″/ε′) in Mac Laurent series expansion.
- tanD ≡ (ε″/ε′) [13]
- (ε″/ε′) ≡ (2α/β) (low loss approximation for tanD was utilized in Equations (2) and (3)).
3. Results
- The criterion for selection of the liquid permittivity standard was to find a liquid that exhibits a high real permittivity (dielectric constant), which also has a loss similar to that of our Pullman clay loam of interest. The nearest surrogate that was identified for this purpose was ethylene glycol, EG, also known as ethanediol.
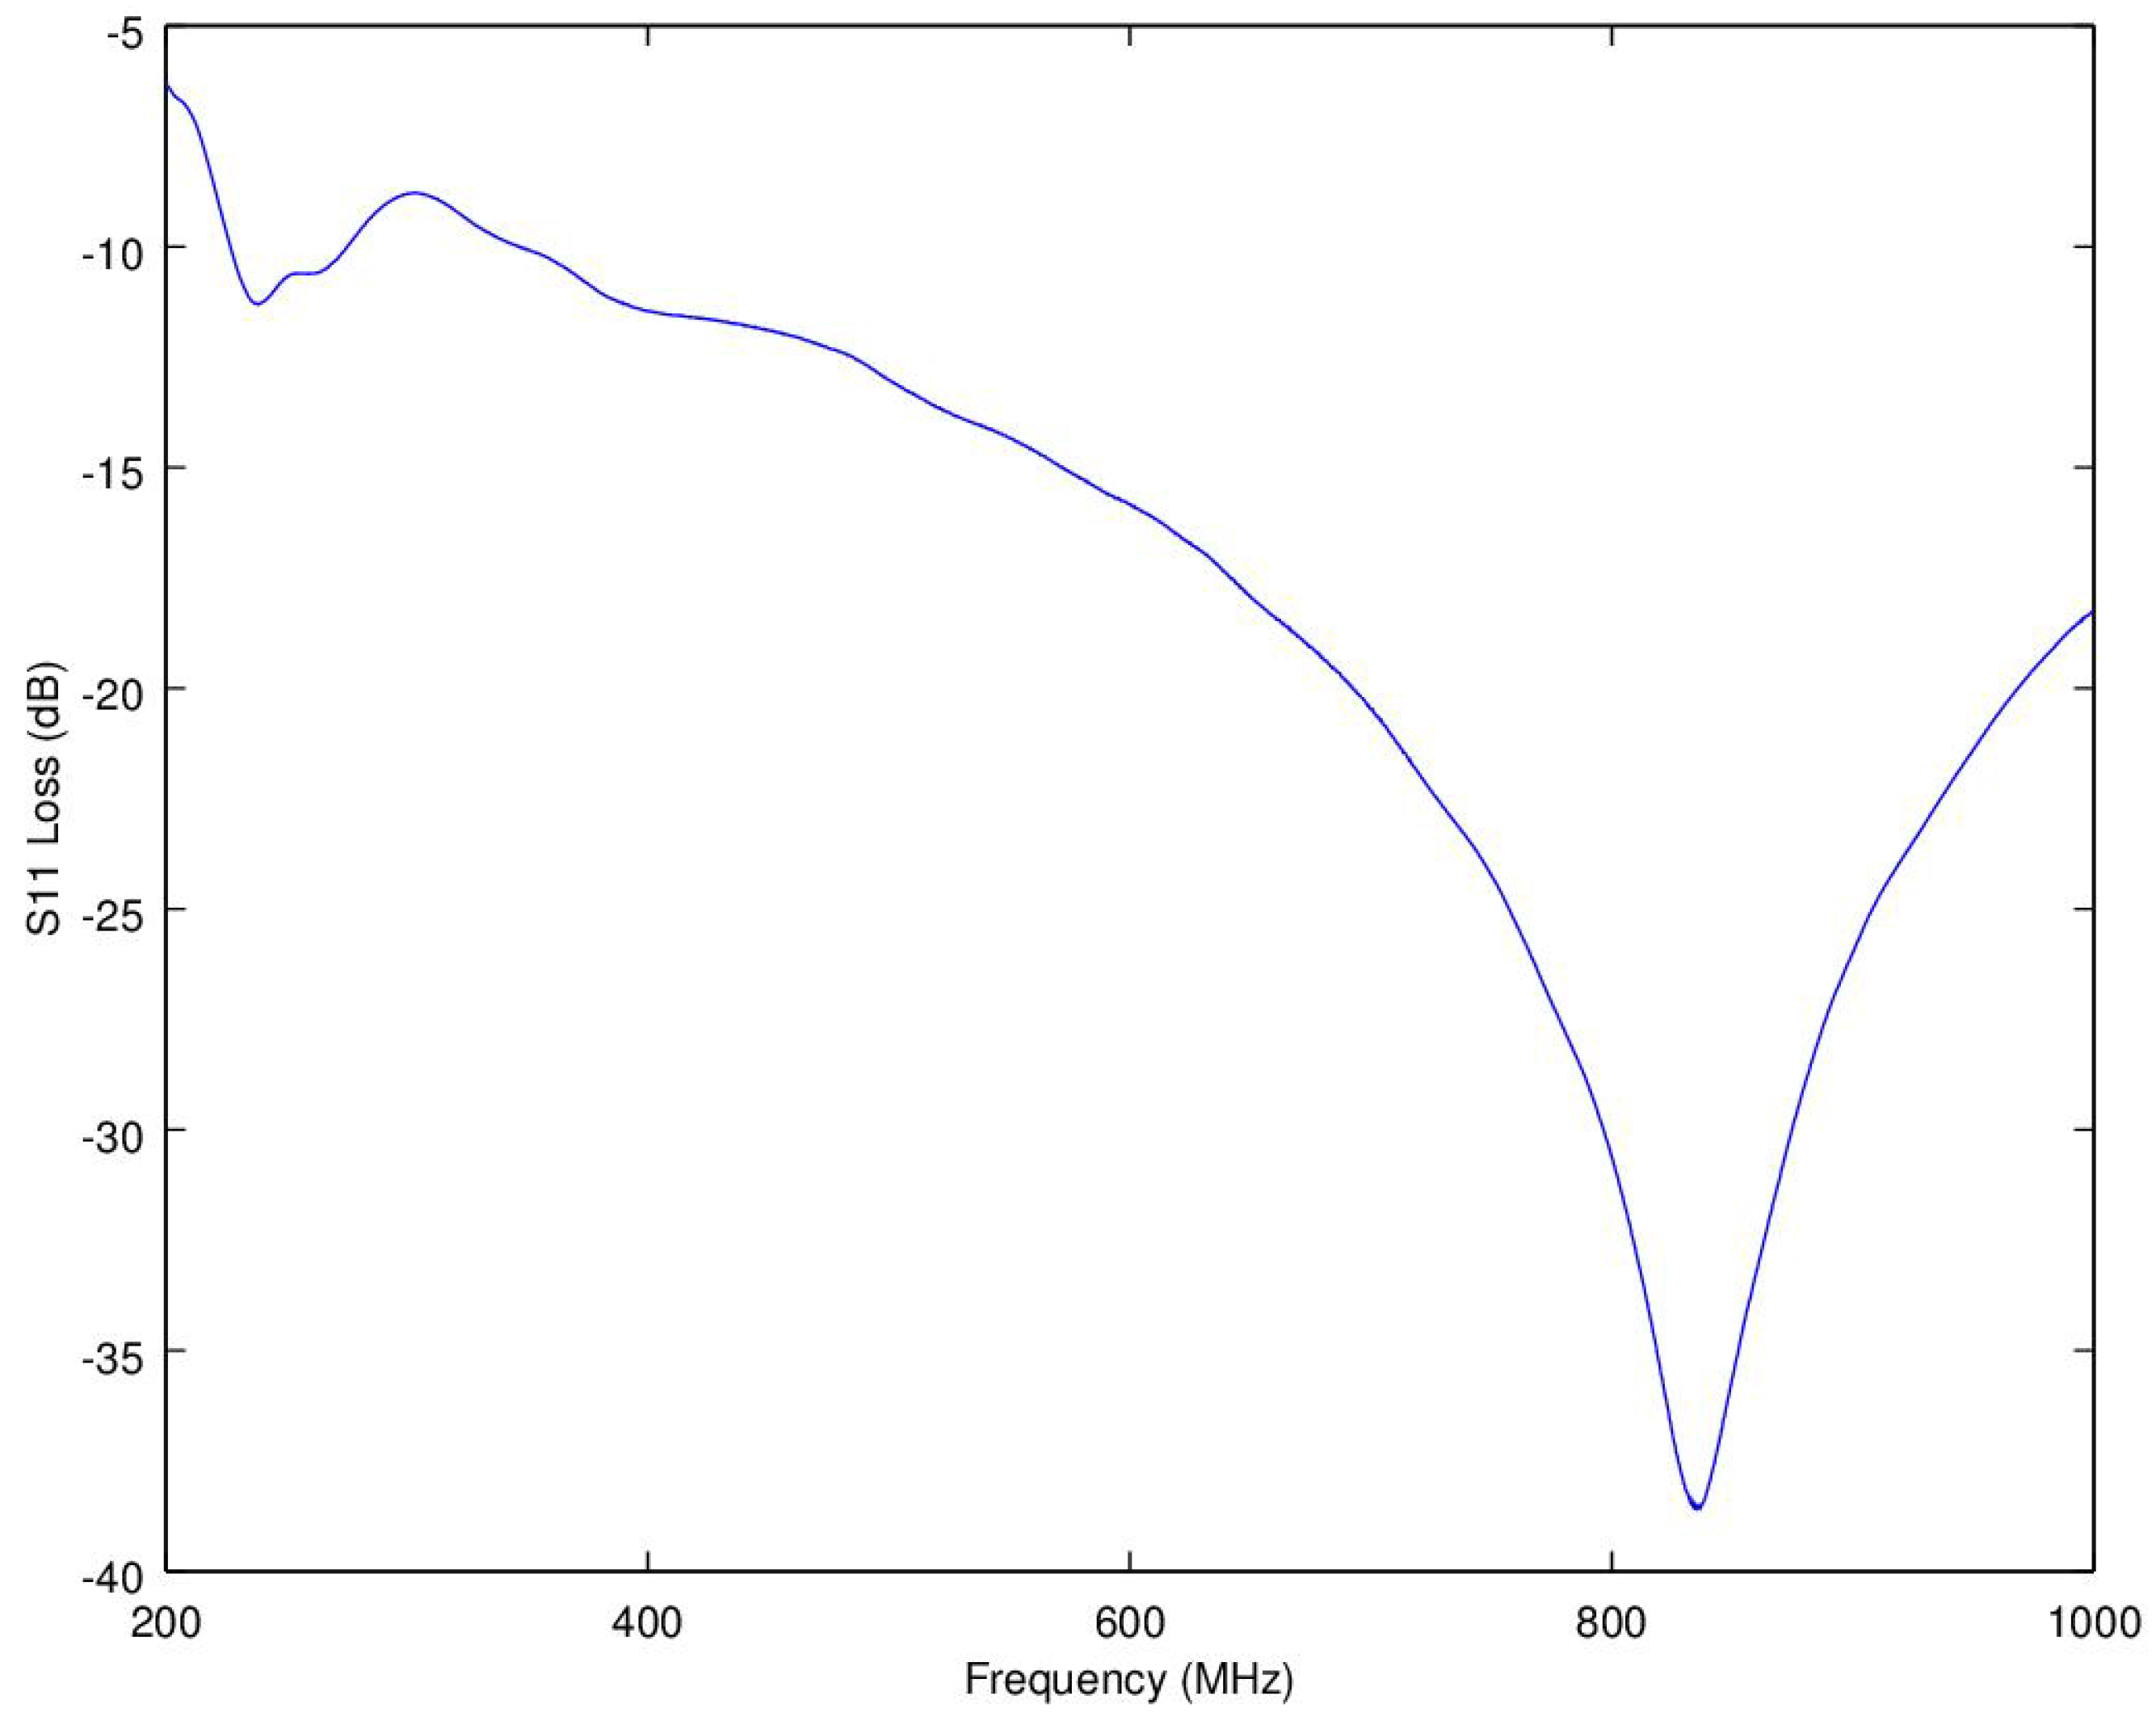
- Figure 4 shows how well the new probe is matched with EG as the surrounding material (wet soil should provide similar results as it will exhibit a similar electrical permittivity). From this result, it is apparent that for EG, and wet soils, the probe is well matched above 350 MHz and nearly all of the input power is being transmitted and available for through-transmission analysis.
- Below 300 MHz, the new probe design loses accuracy, likely due to the high impedance miss-match that was shown in Figure 4. Hence, for highest accuracy usage, the probe should be targeted for use above 300 MHz.
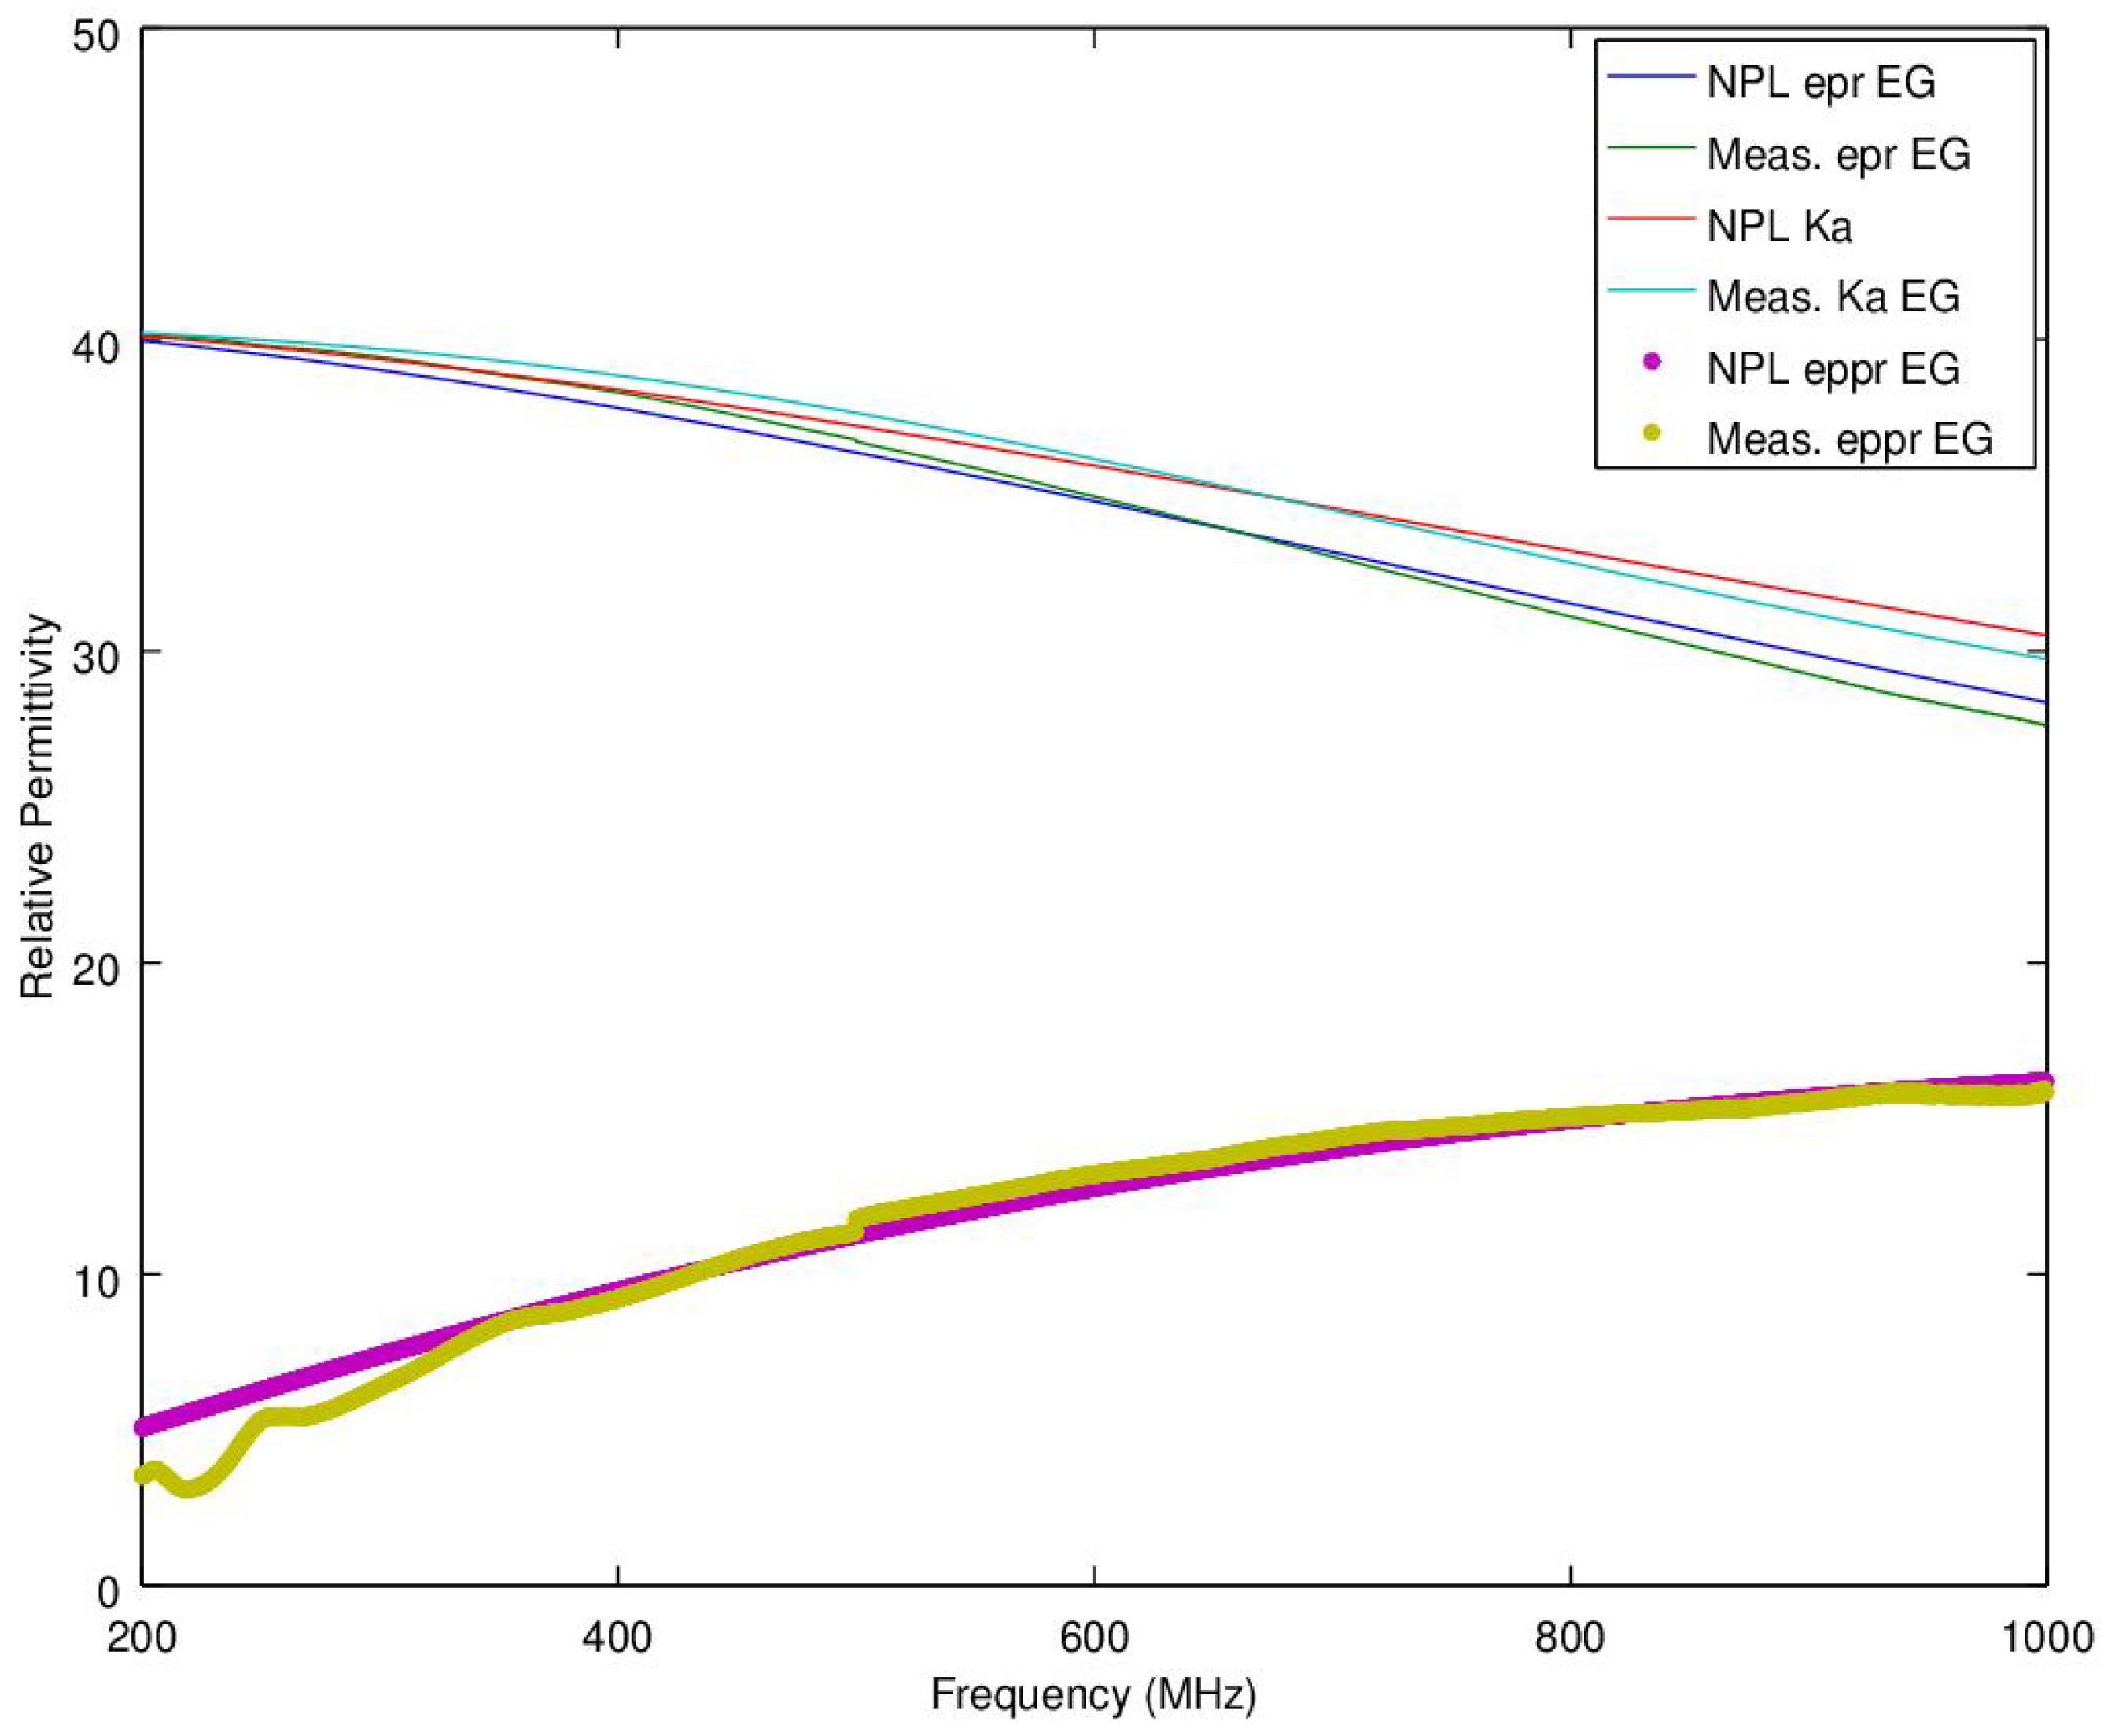
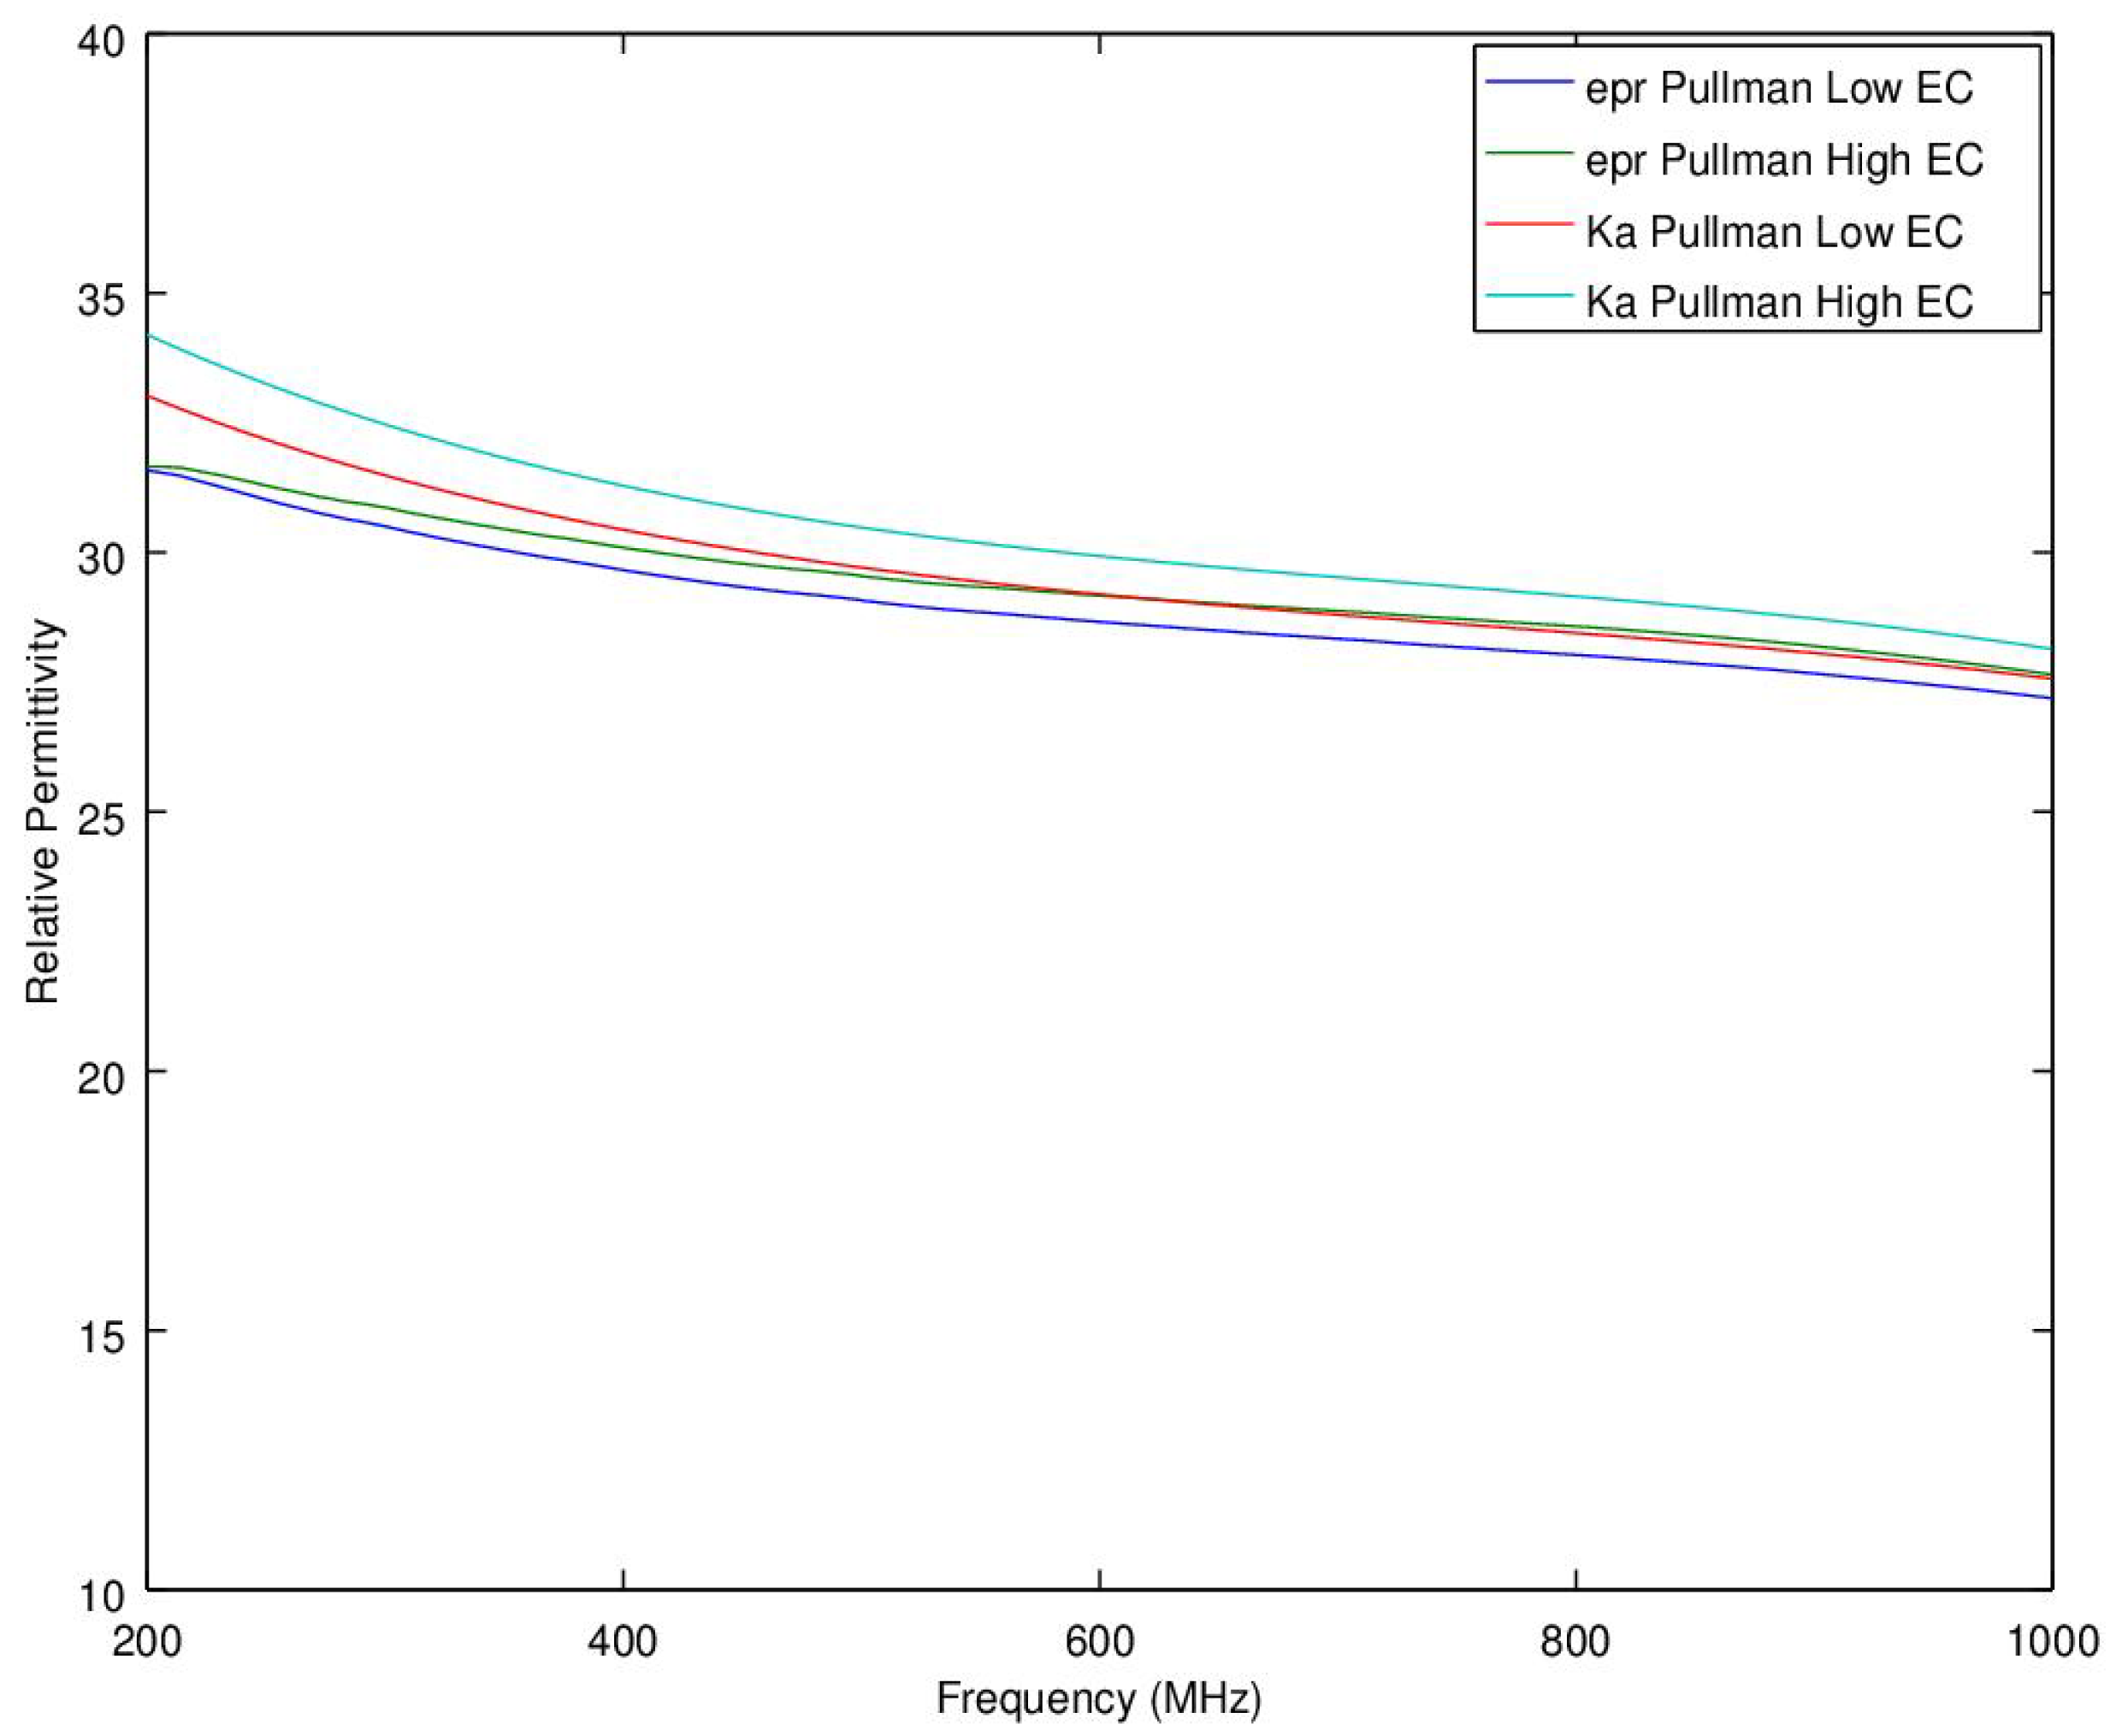
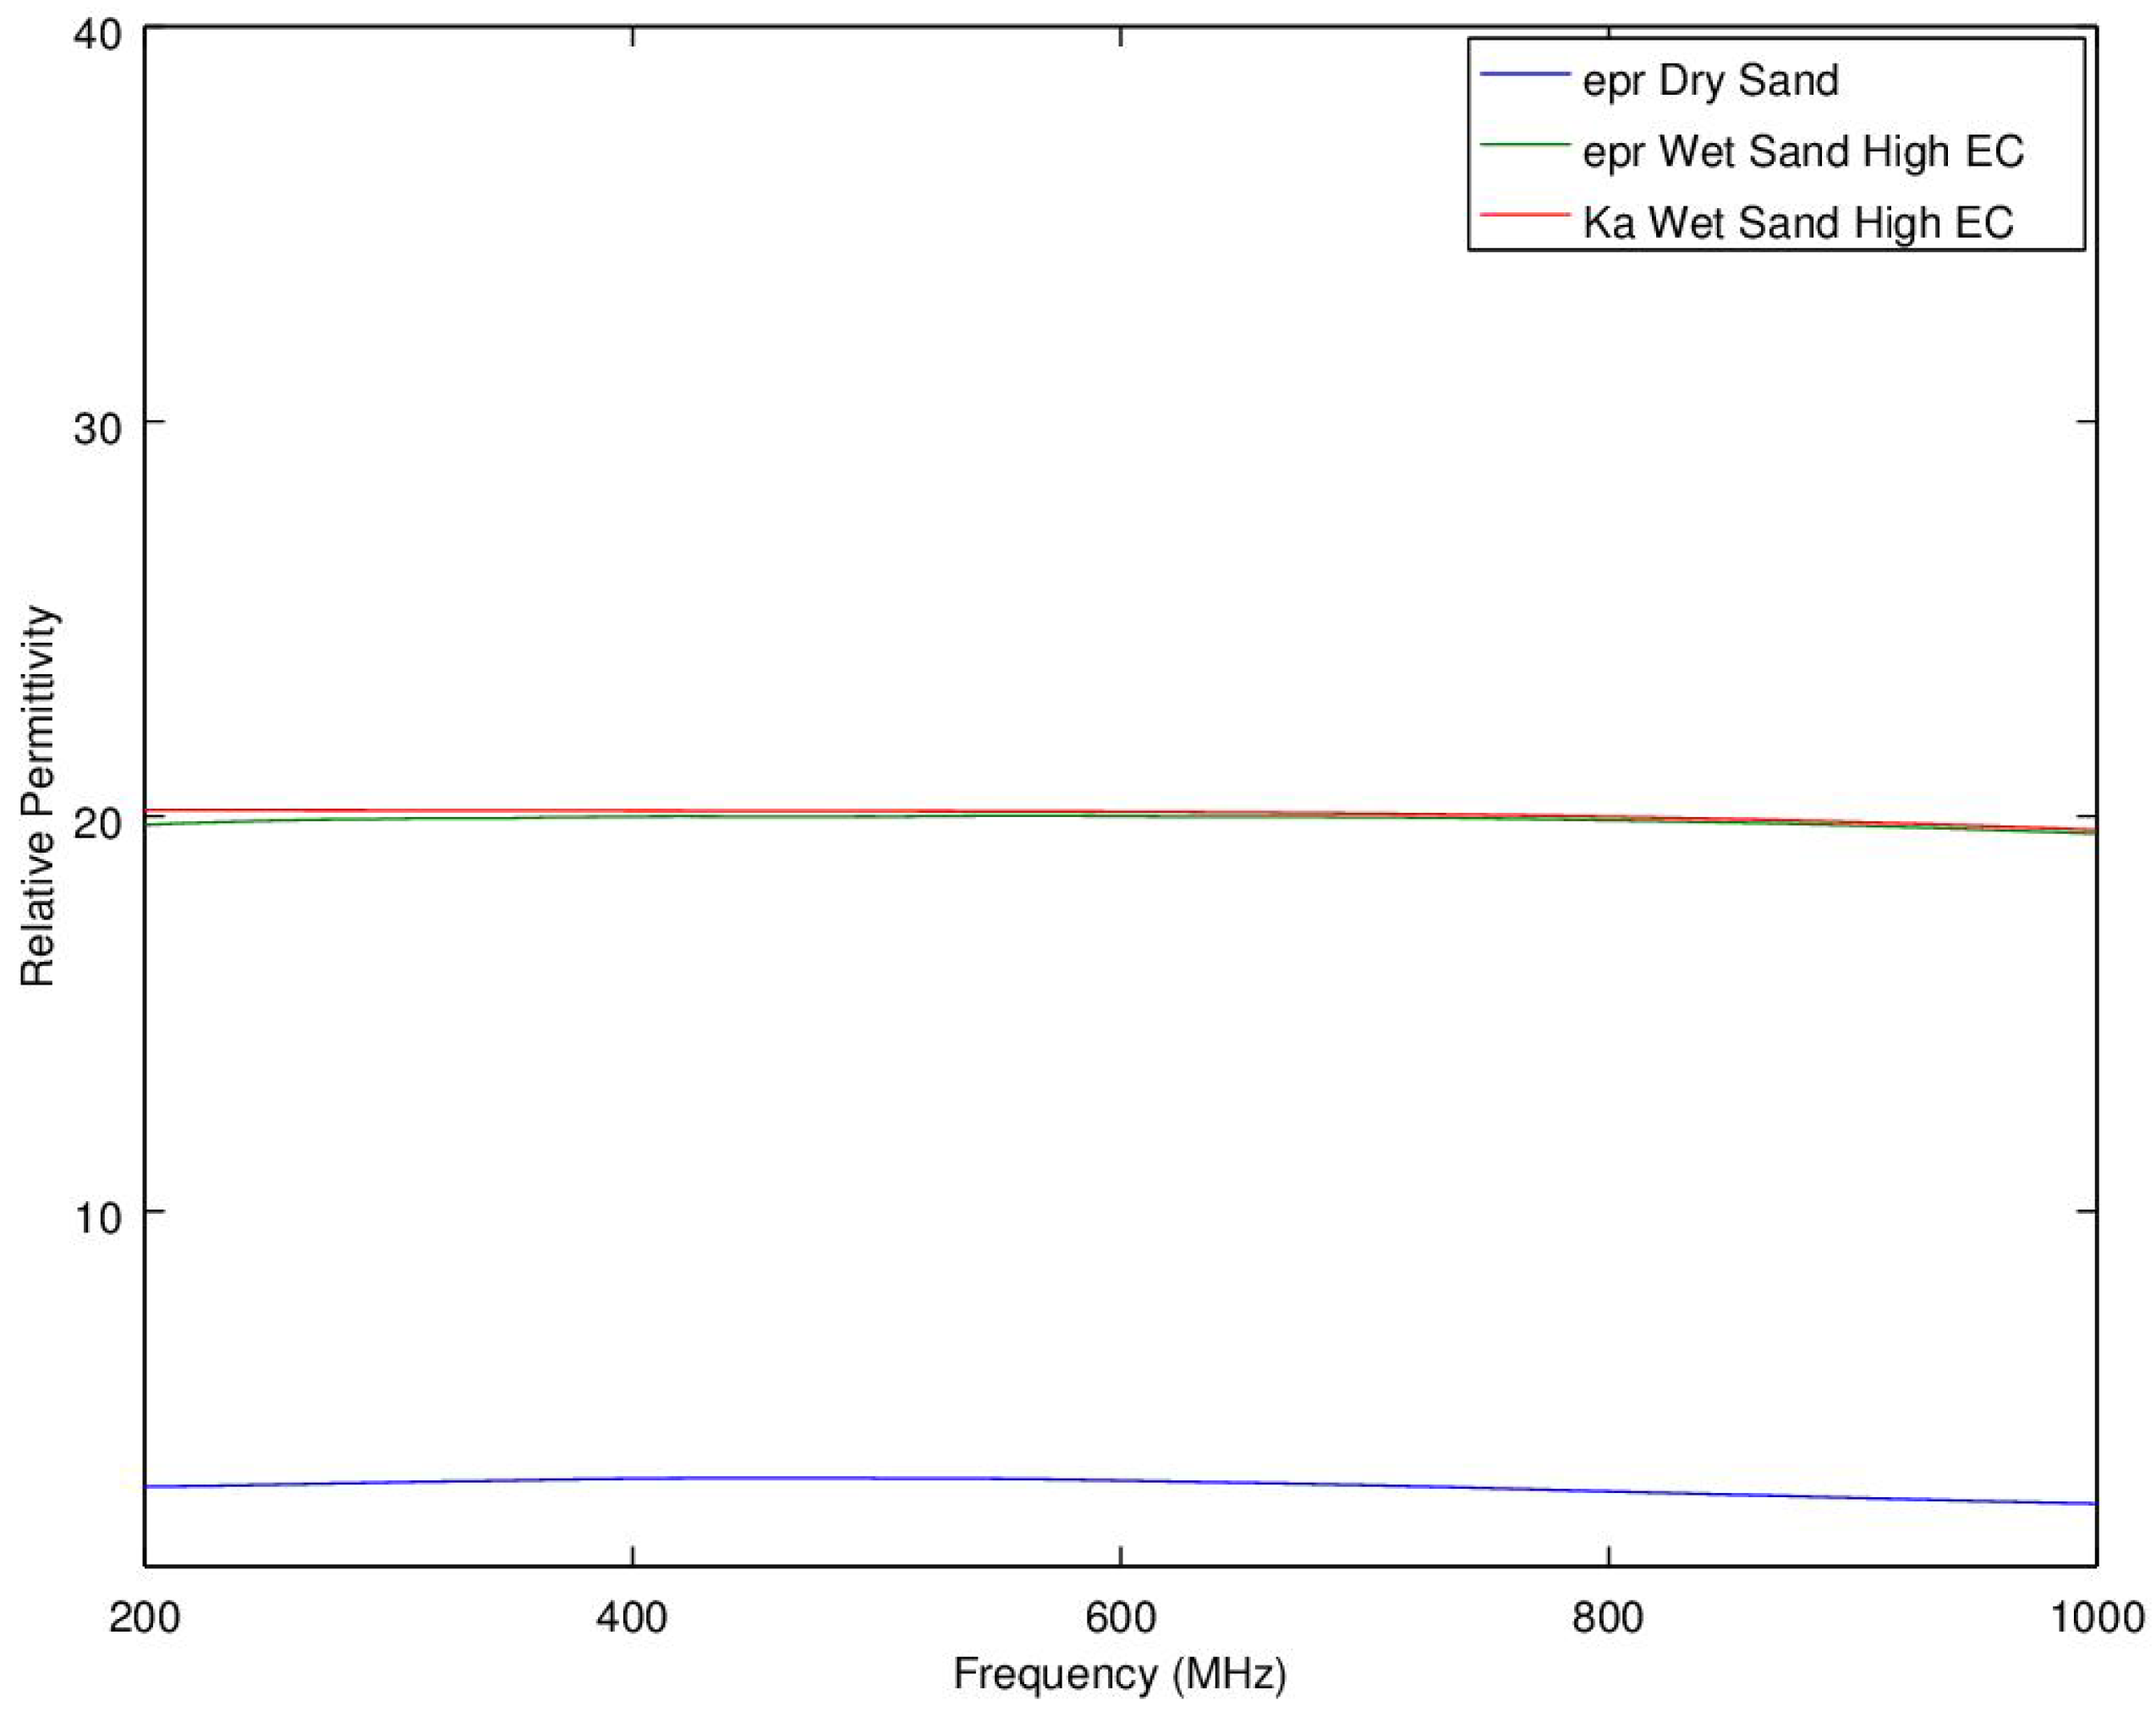
- At low frequencies, there is very little difference between the commonly used apparent permittivity, Ka, and dielectric constant. For lossy materials, such as EG, there is a significant deviation between Ka and relative dielectric constant, εr, especially at the higher frequencies where the loss is increasingly significant.
- In comparing the NPL results to the new probe design, of particular interest is how well the dielectric loss and dielectric constant are both predicted, especially at the higher frequencies.
4. Discussion
5. Conclusions
- TDR in these heavier soils exhibits a variable effective frequency, which when combined with a slope in permittivity versus frequency, results in a different measured permittivity due to the change in measurement frequency,
- Even at a fixed frequency, salinity affects Ka much more than the dielectric constant, ε′, which is easily measured utilizing frequency domain techniques (something which is difficult to do with TDR, due to problems in separating out dielectric damping from low frequency conductivity effects with the very broad-band approach that the time-domain based TDR technique depends upon).
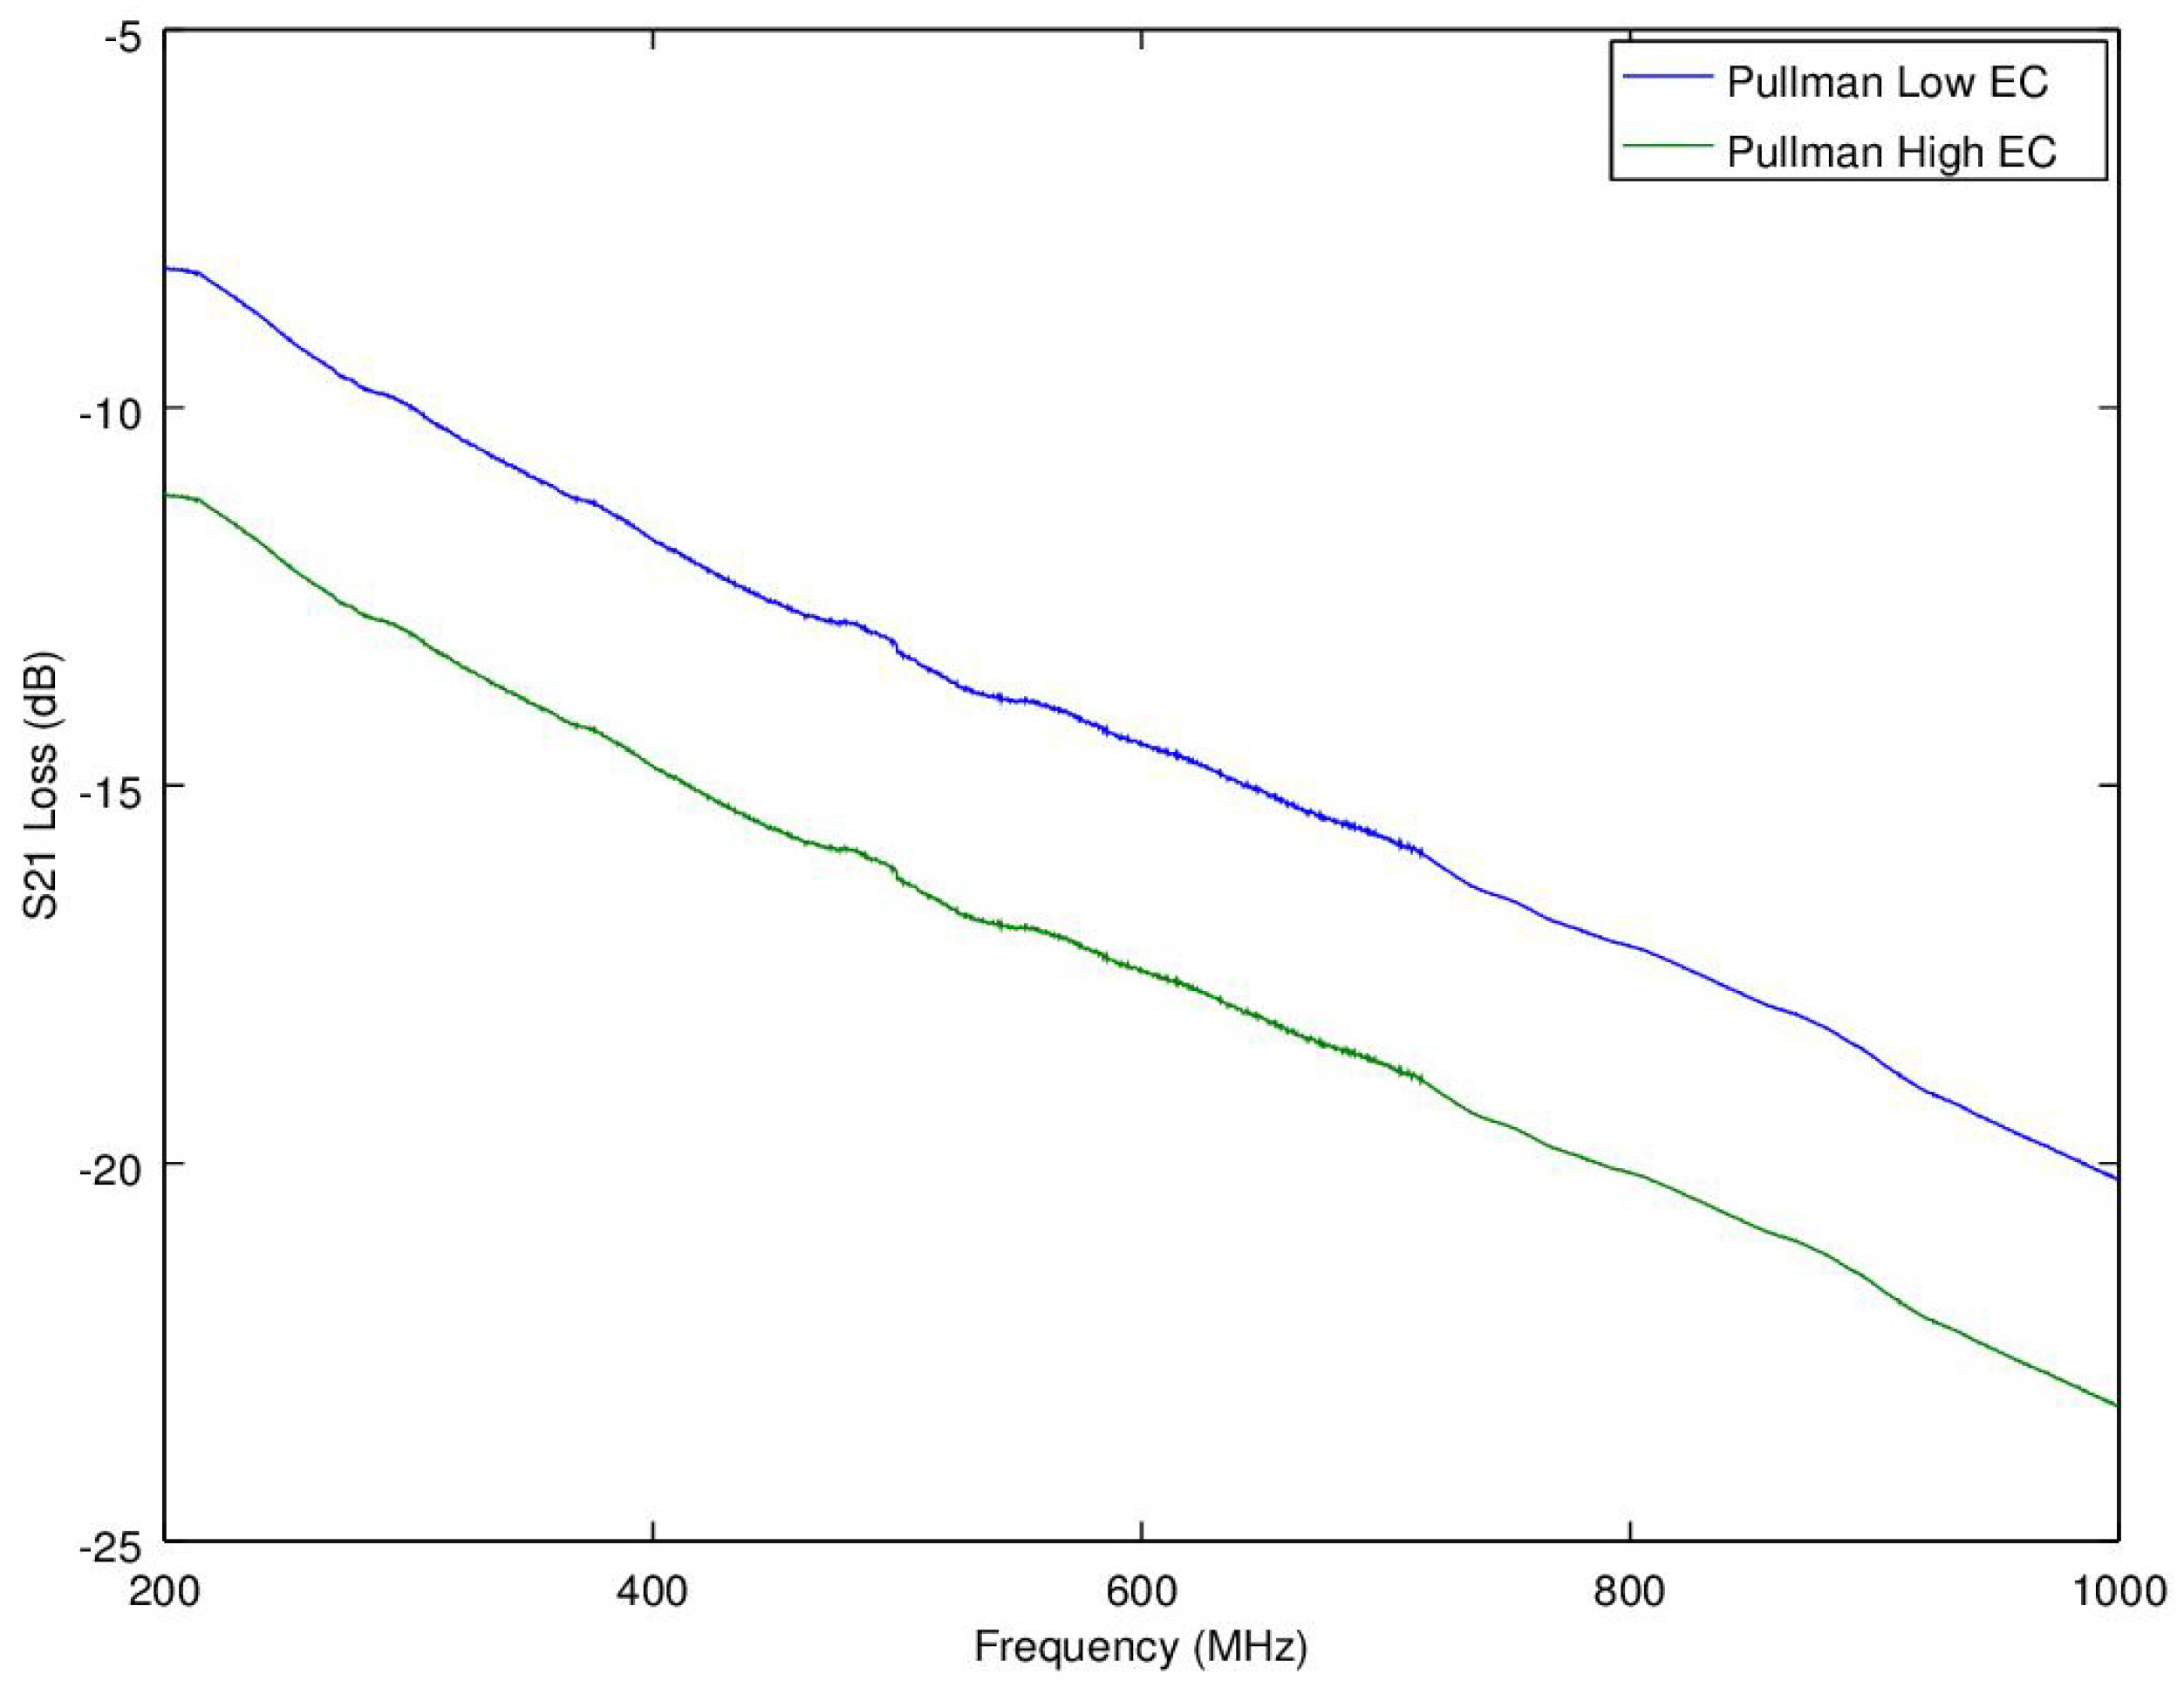
- In heavy soils, especially with high EC, signal attenuation is severe and most TDR instruments do not have the current sourcing capabilities nor dynamic range sufficient to provide a quality measurement. Conversely, network analyzers have in excess of 100 dB dynamic range and can provide high quality measurements even with these challenging conditions.
6. Summary
Acknowledgments
Author Contributions
Conflicts of Interest
Disclaimer
References
- Robinson, D.A.; Jones, S.B.; Wraith, J.M.; Or, D.; Friedman, S.P. A review of advances in dielectric and electrical conductivity measurement in soils using time domain reflectometry. Vadose Zone J. 2003, 2, 444–475. [Google Scholar] [CrossRef]
- Pelletier, M.G.; Schwartz, R.C.; Evett, S.R.; McMichael, R.L.; Lascano, R.S. Analysis of coaxial soil cell in reflection and transmission. Sensors 2011, 11, 2592–2610. [Google Scholar] [CrossRef] [PubMed]
- Pelletier, M.G.; Viera, J.A.; Schwartz, R.C.; Lascano, R.S.; Evett, S.R.; Green, T.R.; Wanjura, J.D.; Holt, G.A. Fringe capacitance correction for a coaxial soil cell. Sensors 2011, 11, 757–770. [Google Scholar] [CrossRef] [PubMed]
- Logsdon, S.D. Experimental limitations of time domain reflectometry hardware for dispersive soils. Soil Sci. Soc. Am. J. 2006, 70, 537–540. [Google Scholar] [CrossRef]
- Jones, S.B.; Or, D. Frequency domain analysis for extending time domain reflectometry water content measurement in highly saline soils. Soil Sci. Soc. Am. J. 2004, 68, 1568–1577. [Google Scholar] [CrossRef]
- Schwartz, R.C.; Evett, S.R.; Pelletier, M.G.; Bell, J.M. Complex permittivity model for time domain reflectometry soil water content sensing. I. Theory. Soil Sci. Soc. Am. J. 2009, 73, 886–897. [Google Scholar] [CrossRef]
- Heimovaara, T.J. Frequency domain analysis of time domain reflectometry waveforms. Water Resour. Res. 1994, 30, 189–199. [Google Scholar] [CrossRef]
- Minet, J.S.; Lambot, G.; Delaide, J.A.; Huisman, H.; Vereecken, H.; Vanclooster, M. A generalized frequency domain reflectometry modeling technique for soil electrical properties determination. Vadose Zone J. 2010, 9, 1063–1072. [Google Scholar] [CrossRef]
- Freil, R.; Or, D. Frequency analysis of time-domain reflectometry (TDR) with application to dielectric spectroscopy of soil constituents. Geophysics 1999, 64, 707–718. [Google Scholar] [CrossRef]
- Heimovaara, T.J.; de Winter, E.J.G.; van Loon, W.K.P.; Esveld, D.C. Frequency-dependant dielectric permittivity from 0 to 1 GHz: Time domain reflectometry measurements compared with frequency domain network analyzer measurements. Water Resour. Res. 1996, 32, 3603–3610. [Google Scholar] [CrossRef]
- Logsdon, S.D. Soil dielectric spectra from vector network analyzer data. Soil Sci. Soc. Am. J. 2005, 69, 983–989. [Google Scholar] [CrossRef]
- Pelletier, M.G.; Karthikeyan, S.; Green, T.R.; Schwartz, R.C.; Wanjura, J.D.; Holt, G.A. Soil Moisture Sensing via Swept Frequency Based Microwave Sensors. Sensors 2012, 12, 753–767. [Google Scholar] [CrossRef] [PubMed]
- Pozar, D.M. Microwave Engineering; Cambridge University Press: New York, NY, USA, 2011; pp. 18–54. [Google Scholar]


| NameFreq | 200 MHz | 500 MHz | 1000 MHz | TDR |
|---|---|---|---|---|
| εr (SC-LEC) | 32.7 | 29.1 | 27.6 | na |
| εr (SC-HEC) | 32.8 | 29.6 | 28.0 | na |
| Ka (SC-LEC) | 34.1 | 29.8 | 28.0 | 31.4 |
| Ka (SC-HEC) 1 | 35.3 | 30.5 | 28.8 | 39.5 |
© 2016 by the authors; licensee MDPI, Basel, Switzerland. This article is an open access article distributed under the terms and conditions of the Creative Commons Attribution (CC-BY) license (http://creativecommons.org/licenses/by/4.0/).
Share and Cite
Pelletier, M.G.; Schwartz, R.C.; Holt, G.A.; Wanjura, J.D.; Green, T.R. Frequency Domain Probe Design for High Frequency Sensing of Soil Moisture. Agriculture 2016, 6, 60. https://doi.org/10.3390/agriculture6040060
Pelletier MG, Schwartz RC, Holt GA, Wanjura JD, Green TR. Frequency Domain Probe Design for High Frequency Sensing of Soil Moisture. Agriculture. 2016; 6(4):60. https://doi.org/10.3390/agriculture6040060
Chicago/Turabian StylePelletier, Mathew G., Robert C. Schwartz, Greg A. Holt, John D. Wanjura, and Timothy R. Green. 2016. "Frequency Domain Probe Design for High Frequency Sensing of Soil Moisture" Agriculture 6, no. 4: 60. https://doi.org/10.3390/agriculture6040060