Article

Small-Scale Vegetable Farmers’ Participation in Modern Retail Market Channels in Indonesia: The Determinants of and Effects on Their Income

by
Alim Setiawan Slamet
1,2,*,
Akira Nakayasu
3 and
Masahiro Ichikawa
4
1
The United Graduate School of Agricultural Science, Ehime University, Matsuyama 790-8566, Japan
2
Department of Management, Faculty of Economic and Management, Bogor Agricultural University, Bogor 16680, Indonesia
3
Department of Resource and Environmental Policy, Faculty of Agriculture, Ehime University, Matsuyama 790-8566, Japan
4
Faculty of Agriculture, Kochi University, 200 Monobe Out, Nankoku, Kochi 783-8502, Japan
*
Author to whom correspondence should be addressed.
Agriculture 2017, 7(2), 11; https://doi.org/10.3390/agriculture7020011
Submission received: 31 August 2016 / Revised: 20 December 2016 / Accepted: 24 January 2017 / Published: 8 February 2017

Abstract

:
The rise of supermarkets in Indonesia since the end of the 1990s have been transforming the food retail sector and providing further market opportunities for small-scale farmers, in which most of Indonesia’s farmer falls into this category. The aim of this paper is to examine the supermarket participation and its effect on the well-being of small-scale farmers. We compare the differences between participants and non-participants in supermarket channels in order to explore the constraints on supermarket participation. By applying a treatment effects model which allows capturing the possibility of selection bias, we examine the factors that determine farmers’ participation as well as the effect on their income. The results show that younger farmers with higher levels of education, irrigated land, who have packaging equipment and storage facilities, and are located near paved roads, are more likely to participate in the supermarket channels. On the other hand, farmers who have sprayer equipment are more likely to participate in the traditional market channels. The effect analysis shows that small-scale farmer participation in the supermarket channels can boost their income.

1. Introduction

Modern retail sectors in Indonesia have been growing rapidly in the last two decades [1,2,3]. This trend is also similar with other developing countries [4], as indicated by the increasing share of supermarkets in food retail in China [5], Brazil [6], Kenya [7], Guatemala [8], Thailand [9], and Vietnam [10]. Supermarkets in Indonesia were first established in the 1970s [1], and since then their numbers have increased rapidly. In 2014, there were already more than 1362 supermarkets (a rise from 636 outlets in 1999), 269 hypermarkets (18 outlets in 1999), and 22,818 convenience stores and minimarkets (522 outlets in 1999) [11,12]. By 2014, the share of the modern retail sector (supermarkets, hypermarkets, convenience stores, and minimarts) in total grocery retail sales had reached 16%, having increased from 5% in 1999, while the share of traditional grocery retail in total grocery retail sales showed a decrease in number from 93% in 1999 to 83% in 2014 (Table 1).
The rapid expansion of supermarkets was driven by liberalization of foreign direct investment (FDI) in retailing, income growth, urbanization, and the modernization of retail procurement systems [4,5,8]. At the beginning, many of the supermarkets, such as Hero and Gelael, were owned by Indonesian companies [13]. However, since the Indonesian government adopted a more liberalized retail trade policy by Presidential Decree (No. 96/2000 and 118/2000), many foreign firms such as Carrefour, Giant, Lotte Mart, Super Indo, Circle K, 7-Eleven, Lawson, Aeon, Spar, Lulu, Family Mart, and Ministop have been allowed to operate retail outlets in most major urban areas. Table 2 shows the market share across modern retail outlets in 2014. In the hypermarket category, Carrefour (which was a French retail chain at first, then locally owned and operated by CT Corp as per November 2012) has the largest market share (35.7%) with 90 outlets. In the supermarket category, Super Indo—Delhaize Group Belgium—has the largest market share (8.6%) with 157 supermarket outlets. Meanwhile, in the convenience store category, almost 90% of the market share is dominated by Indomaret and Alfamart (both are owned and operated by a local company) with 11,400 and 10,377 outlets, respectively.
The development of modern markets in developing countries has affected the preferences of consumers and farmers. Alongside rising income, the spread of supermarkets contributes to encouraging the shifting of Asian diets away from common grain staples and increasingly towards livestock and dairy products, fats and oils, and also fruits and vegetables [15]. For example, in the food consumption data of Indonesian consumers (Table 3), retail sales of food-grain staples in comparison to the total food retail sales have been declining, with a from 33% in 1998 to 27% in 2014. Meanwhile, retail sales shares have been increasing in the consumption of livestock and dairy farm products (from 15% in 1998 to 17% in 2014), fish products (from 11% in 1998 to 14% in 2014), and fruits and vegetables (from 14% in 1998 to 21% in 2014). Furthermore, the share of fresh fruits and vegetables (FFV) was reported to represent an insignificant portion of supermarket retail sales in 1998 but increased to 8% in 2007 [1]. Based on interviews with the three leading supermarkets in Indonesia (Carrefour, Giant, and Hypermart), Sahara et al. [16] revealed that this share was almost doubled to 15% in 2014. Moreover, according to Slamet and Nakayasu [17,18], the modern retail formats share of urban consumer purchasing was almost 20% for vegetables and more than 35% for fruit in 2015, compared with traditional retail formats. It is expected that the share of FFV sales and modern food retail will continue to increase along with the rapid growth in economic and consumer demand for qualitative attributes such as food quality, safety, variety, healthfulness, easiness, availability, store convenience, brand, and traceability [1,6,17,18].
On the farmer side, the rapid growth of supermarkets and FFV sales presents small-scale farmers with new opportunities to participate in supermarket channels, which could potentially increase their income [7,8,20]. However, at the same time, these changes bring great challenges because supermarket procurement is more integrated than traditional channels and demands higher requirements such as quality, timing, safety, consistency, and packaging [4,21]. According to this situation, there is a growing awareness associated with the probability of small-scale farmers being excluded from the modern wholesale system [13]. Because the traditional wholesale system has low standards for quality and/or safety, inconsistent volumes and quality, and high transaction costs, the supermarket procurement model has shifted away from using the traditional wholesale system to a modern system using specialized/dedicated wholesalers as coordinating agents for supermarkets in the sourcing by the latter from farmers, and dedicated contractors for handling the sorting, packing, and delivering to supermarkets [3,4]. Specialized/dedicated wholesalers play roles as intermediaries by organizing teams of traders to collect products from farmers and by selling to supermarkets. They carry out their business by: (a) selling a specific or very few products to different actors from different market channels; or (b) they may sell a wide variety of products to actors from a specific market channel [22]. There are several examples of specialized/dedicated wholesalers in West Java such as Bimandiri, Putri Segar, and Saung Mirwan [1]. They make contracts with supermarkets and along with their traders are responsible for managing farmers by providing them with the necessary information regarding preferred varieties, sizes, color, quality, and timing, while also assisting farmers with production and management practices. Verbal agreements rather than written agreements are made between specialized/dedicated wholesalers and farmers, with agreements covering price, payment period, quantity, product specification, and seed/other inputs provided on credit [23].
The constraints for small-scale farmers in attempting to participate in supermarkets channels are related to their weak capacity to meet the requirements of supermarkets and their bargaining power [24]. This capacity refers to investments in various forms of capital such as land, irrigation equipment, and greenhouses in order to meet the quality and consistency requirements of supermarkets [25]. The small-scale farmers who are mentioned in this study are in reference to the categorization provided by BPS-Statistics Indonesia, with a small-scale farmer defined as a farmer with less than 0.5 ha in farm size. Indonesia’s 2013 Agricultural Census [26], which is published by BPS-Statistics Indonesia noted that most farmers’ (39.3%) cultivated land ranges between 0.10 and 0.49 ha. Based upon considering these cultivated lands, not all of them are privately owned by farmers, some are sharecropped with land owners. The land ownership rate recorded for farm sizes less than 0.1 ha is 16.6%, for farms between 0.5 and 1.99 ha it is 31.7%, and for farms larger than 2 ha it is 12.4%. In the case of West Java Province, which is one of the largest production zones of horticultural products, more than 75% of the farmers had a cultivated land area that was less than 0.5 ha. Furthermore, the other factors that affect farmer participation in the supermarket channel are related to incentives (including price, costs, and risk), contextual, and personal constraints [9,25]. The price variable refers to the price difference or premium price over the traditional wholesale market; however, it should be observed as the price average over the total product cost which includes all deductions for rejected products, shelf fees, and interest costs due to a lag in payment periods. Meanwhile, the costs and risks variable refers to the cost of post-harvest technologies in order to meet the supermarkets’ requirements, transactional requirements, and the relative market risk of dealing with supermarket channels as compared to traditional channels [25]. Contextual constraints (even though they seem to be similar to the incentives variable) include road conditions and access to extension services [9], plus transaction costs such as those associated with physical infrastructure and public communication can also affect the participation of small-scale farmers in the modern market channels. Personal constraints refer to the demographic variables of farmers such as age, education, and farming experience [3,16,20].
Different studies have examined the differences and determining factors surrounding the inclusion of small-scale farmers in supermarket channels in terms of capacity, incentives, and personal constraints. Supermarket farmers are often associated with farmers who have larger landholdings than traditional channel farmers [1,7,9,21], whereas Hernandez et al. [8] and Sahara et al. [16] found that there were no significant differences between the two channels. However, many studies [7,8,20,21] show similar results in that farmers with access to supermarket channels have more irrigated land compared with traditional channel farmers, whereas Sahara et al. [16] did not find any differences between the two channels. Having a larger farm area and better irrigated land are important in cultivating larger crop yields and growing multiple crops over a year [3,8]. The differences between the two channels are also found in terms of non-land assets and incentive variables. Farmers in the supermarket channels are reported to be more likely to have more vehicles [7,8,9,16,21], mobile phones, and storage facilities [7,16], mist blowers [16], good road conditions [9], and are closer to paved highways [8]. Meanwhile, in terms of personal constraints, supermarket farmers are younger in age [9,16], have higher education [7,9,16,21], and less experience in terms of number of farming years [16].
While the previous studies on the differences between the two channels show different patterns across countries, the effects of the capacity and incentive variables on the farmers’ decisions as to whether or not to participate in the modern channels have also been found to be unclear [3]. Farmers who have more assets have been shown to be more likely to participate in the supermarket channels, with relevant assets including irrigation [1,3,7,8] and land [1,3,7,9,21]. However, in other studies, land size [8,16] and irrigation [16] were not a significant factor for supermarket participation. Therefore, this study attempts to provide a better understanding regarding the conditions that are needed to link farmers to supermarket channels.
Moreover, despite the rapid increase in supermarket penetration, empirical research that examines the supermarket participation of small-scale farmers in Indonesia is still limited [3,16,22]. Since previous studies tended to focus on single-crop farmers, we have attempted to contribute to the emerging literature by exploring multi-crop farmers. Furthermore, there are also limited number of studies that comprehensively examine the effect of supermarket participation on household income and only consider the income effects by comparing the gross margin of farm crops between supermarket channel farmers and farmers linked to traditional channels [16]. The differences cannot be interpreted as net impacts of supermarket participation, because this method does not measure other factors that may influence household income [21]. Hence, the objective of this paper is to explore the supermarket participation and the effect of participation on the income of small-scale vegetable farmers. More specifically, this paper has three objectives: (1) to understand the difference in characteristics between traditional channel farmers and supermarket channel farmers; (2) to determine the factors that explain why farmers participate in supermarket channels; and (3) to examine the effect of supermarket participation on the household income of small-scale farmers. This paper is structured as follows, Section 2 describes data and methods used in this study. In Section 3, we present and discuss the results in two parts: differences between traditional and supermarket channel farmers, and the estimation results of supermarket participation and the effect on income. Section 4 offers a conclusion.

2. Materials and Methods

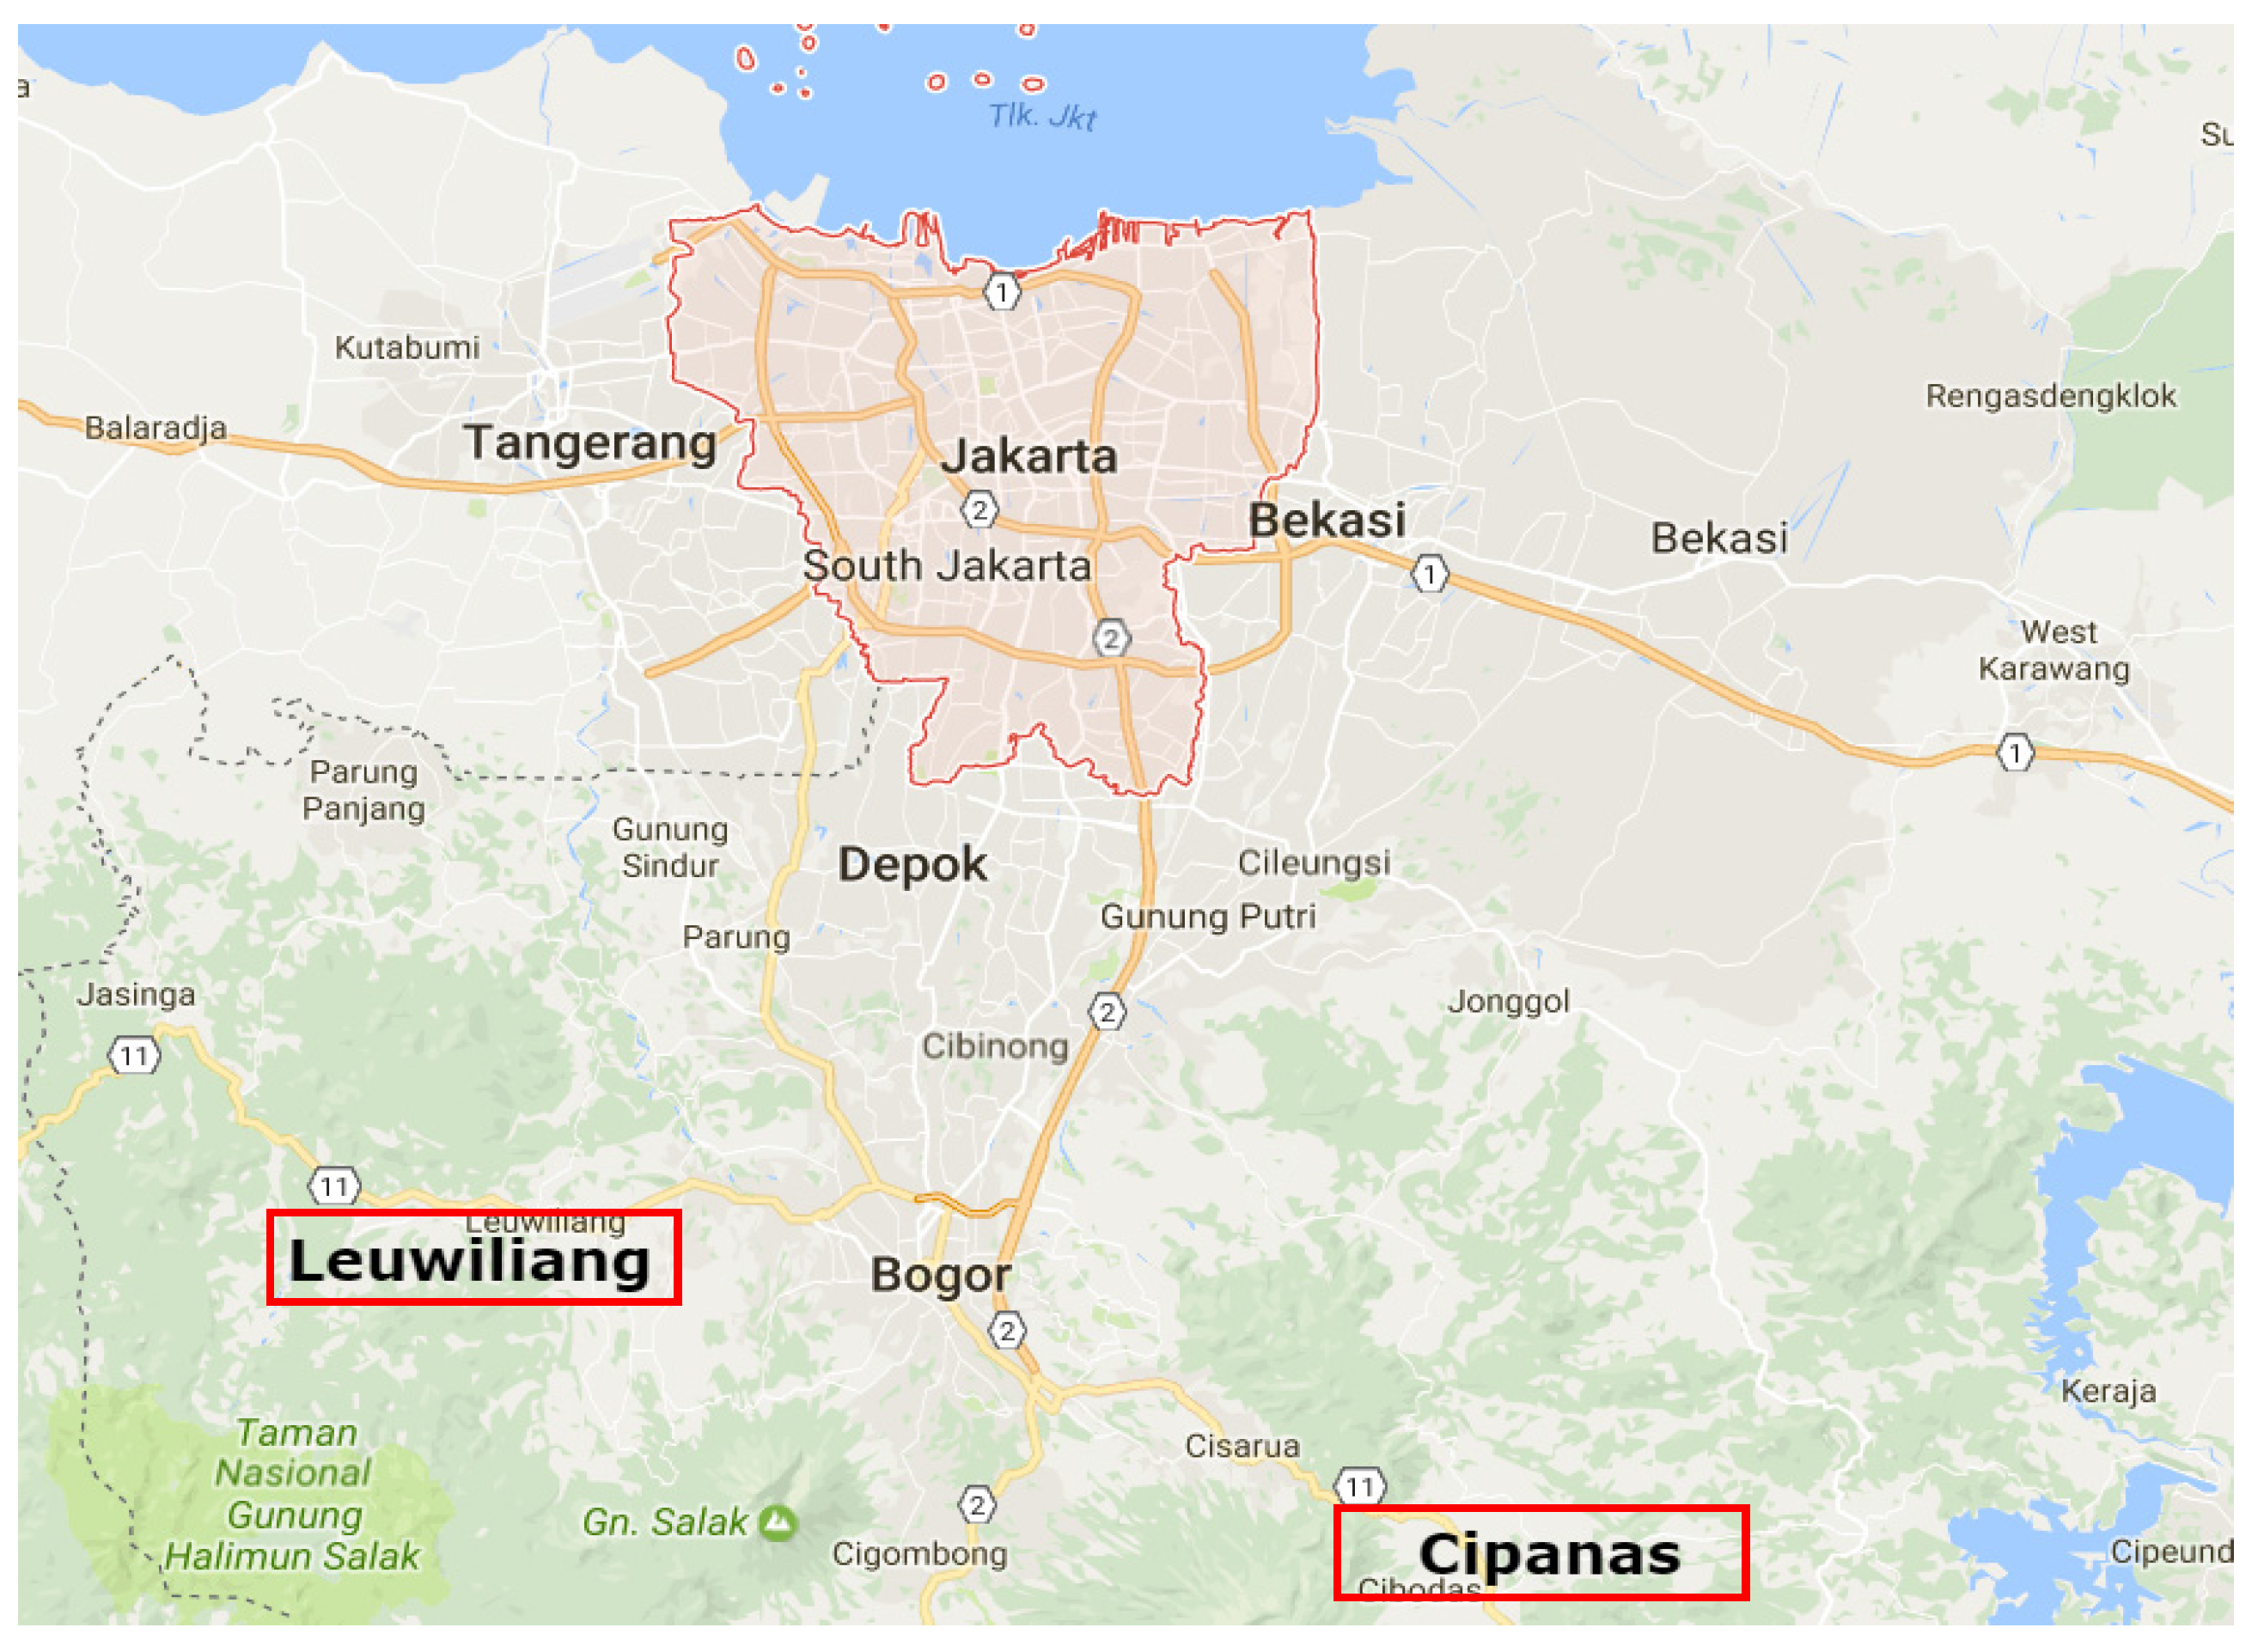
2.1. Data Collection

Data were collected in 2016 through a survey of vegetable farmer households in Cipanas-Cianjur Regency and Leuwiliang-Bogor Regency, West Java Province, Indonesia. Cipanas-Cianjur and Leuwiliang-Bogor are relatively close to Jabodetabek region, mega-cities surrounding the capital city of Jakarta (Figure 1). Cipanas-Cianjur and Leuwiliang-Bogor are located approximately 88 km and 73 km, respectively from Jakarta. Jabodetabek region has the highest concentration of supermarket outlets. West Java Province is one of the main vegetable producers in Indonesia and the supplier for the Jabodetabek market, while Bogor and Cianjur are important centers of vegetable production in West Java, especially for leafy-type vegetables. As an illustration, the share of several types of vegetable production from both areas is compared to the total production in West Java: spinach (48%), water spinach (31%), carrot (30%), green beans (29%), hot chili (27%), eggplant (25%), tomato (19%), yardlong beans (18%), scallion (16%), radish (14%), and mustard (13%).
We identified the vegetables production areas of traditional wholesalers and specialized wholesalers. Within the acquired locations, a non-probability sampling was undertaken to vegetable farmers. Prior to this study, we already acquired information on supermarkets’ distributors or wholesalers. Thus, by asking to which wholesalers or local collectors the farmers sold their products, we could then classify the farmers. Based on the list of farmers from local collectors of both channels, we then interviewed 150 growers in those areas (75 respondents from Bogor Regency and 75 respondents from Cianjur Regency). After removing the incomplete and invalid questionnaires, the final sample consisted of 137 farmers (with 72 respondents belonging to the traditional channel farmers and 65 respondents belonging to the supermarket channel). Farmers were asked to choose the main buyers for their vegetables based on their sales proportions. The buyers were categorized into traditional channels and supermarket channels. Traditional channels include direct sales to consumers in the traditional market, sales to local collectors, and sales to traditional wholesalers (traders), whereas supermarket channels involve sales through specialized/dedicated wholesalers. By using a structured questionnaire, farmers were interviewed to obtain information on their household characteristics, household and farm assets, vegetable production and marketing, and other farm and non-farm economic activities. The main vegetables produced were leafy-types (e.g., spinach, water spinach, cauliflower, kalian, broccoli, mustard, cabbage, etc.), carrot, tomato, scallions, and radish.

2.2. Method of Analysis

Descriptive statistics were used to provide a better understanding of the characteristics of farmers. The independent t-test was used to determine whether there is a difference in mean value between farmers in the traditional and supermarket channels with respect to the selected variables such as demographics, household and farm assets, change in production, postharvest activities and income. The null ( H 0 :   μ 1 = μ 2 ) and alternative ( H 0 :   μ 1     μ 2 ) hypotheses for the t-test are expressed as follows [28]:
H 0 =   μ ( x ¯ 1 x ¯ 2 ) = 0 ( the   mean   value   between   the   two   channels   are   equally )
H 1 =   μ ( x ¯ 1 x ¯ 2 ) 0 ( the   mean   value   between   the   two   channels   are   not   equally )
where x ¯ 1 is the sample mean of group 1 and x ¯ 2 is a sample mean of group 2. The null hypothesis is rejected if the probability p-value is equal to or less than a critical value set by the researcher (e.g., 0.005, 0.01, or 0.025, and so on).
Furthermore, we used two econometric components in order to analyze the household characteristics that were associated with participation between traditional channels and supermarket channels and the effect of supermarket channel participation on per capita income. First, we used a probit model to estimate a probability of a farmer participating in a supermarket channel. The determinants of supermarket participation can be analyzed using qualitative response statistical models. The simplest of these models has a binary dependent variable, so the outcome of farmer’s interest is either 1 or 0, where 1 denotes their interest on selling to supermarkets and 0 denotes their option to stay in traditional markets. The binary response model focuses on the factors that determine the probability of a farmer’s decisions. In the model, it is assumed that there is a decision function, where I is a random variable (dichotomous), which governs whether the supermarket channel is chosen (I = 1) or not (I = 0). The probability that observation Ii takes on the value 1 can be represented as a function of a vector of explanatory variables, with Xi, representing the characteristics of the farmer. In general, the probability of a farmer’s decision to participate in the market channels can be represented as:
Prob(I = 1| x) = β0 + β1X1 + …+ βiXi + εi
where Xi is a vector of explanatory variables, i is the number of independent variables, β is the beta coefficient, and ε is a random error term. Assuming the model’s random disturbance term, εi, follows the normal probability distribution, the probability of a farmer’s decision regarding participation in the channels can be defined as a probability value through the function of cumulative normal distribution. The probit model takes the form:
Prob ( I = 1 | x ) = X β Φ ( t ) d t =   Φ ( X β )
The function Φ is the normal cumulative probability distribution. The statistical relationship in this model is estimated using maximum likelihood estimation and the marginal effect of the independent variable can be computed using the estimated parameter coefficients [29].
In the participation model, explanatory variables include household characteristics, capacities and incentives, such as: age (years), level of education, household size (number of persons), proportion of adults between 15 and 65 years (%), farming experience (years); farm assets: land size (ha), irrigated land (dummy variable, 1 = irrigated; 0 = no), packaging equipment ownership (units), water pump ownership (units), sprayer ownership (units), storage house ownership (units); car/pickup truck (unit), motorcycle ownership (units), mobile phone ownership (units), source of capital (1 = loan, 0 = private), distance to asphalt road (km), and distance to market (km). Age of household’s head is expected to negatively affect participation so that younger farmers are more likely to participate in the supermarket channel. Educational level of the household head is expected to positively affect participation. Because participation in a supermarket channel may require higher labor intensity [20], household size and the proportion of adults between 15 and 65 years are incorporated into the model as a capacity variable. All the capacity variables related to household and farm assets are expected to positively affect participation. To avoid the endogeneity problem that could occur with current-period assets [7,8], we used the 2011 situation for asset variables (lagged assets) in the channel choice regression. As incentive variables, car/pickup truck, motorcycle, and mobile phone ownership are also expected to positively affect supermarket participation because they may increase a farmer’s access to both input and output markets which can reduce transaction costs. Source of capital, particularly access to loan/credit, is expected to positively affect participation. Meanwhile, distance from house to asphalt road and distance to market are expected to negatively affect participation. Compared with farmers who live close to an asphalt roads, farmers who live further from asphalt roads spend more time and incur higher costs when selling the products or buying inputs; these considerations were included because the farmers in the supermarket channel are sensitive to transaction costs.
Second, in order to assess the effect of supermarket participation on household income, we used an ordinary least squares (OLS) model to estimate per capita net household income as a function of household characteristics, capacities, and incentives variables, and a dummy variable representing participation in the supermarket channel. In this model, we used net household income as a dependent variable because vegetable farmers may allocate additional inputs and labor costs in order to participate in supermarket channels. Net per capita household income as a dependent variable was computed as the total net revenue from both on-farm and off-farm income in 2016 divided by household size. We also transformed the dependent variable into logarithmic form and used a log-form equation in order to provide a better interpretation of the result. The explanatory variables included in the participation model may also be able to explain the income equation, except distance from house to asphalt roads and distance to market, due to a low correlation with the income (Pearson correlation = 0.004 and 0.09, respectively; and a lack of significance at the 5% level). The farmer’s decision regarding the market channels is included in order to measure the effect of supermarket participation. Following Miyata et al. [20], the income equation is expressed as:
Y i =   β 0 +   β 1 X 1 + +   β i X i +   δ I i +   μ i
I i * =   α X i +   ε i
for Ii = 1 if Ii* > 0, otherwise Ii = 0, where Y is per capita net household income, i is the respondent household, and X is a vector of the explanatory variables, I is a dummy variable indicating supermarket participation where Ii = 1 if one participates in the supermarket and Ii = 0 otherwise, and μ is a random error term. However, this model does not consider possible selection bias in supermarket participation because the validity of this model depends on the assumption that there is no endogeneity problem. This problem will arise if participation is driven by unobservable factors (e.g., motivation, entrepreneurial skill, networking, risk aversion, etc.) that affect the outcome of the participation decision. Supermarket farmers who have higher abilities than traditional farmers may have relatively higher incomes regardless of whether or not they participated in the supermarket channel. The coefficient on that regressor will be biased and inconsistent if unobservable characteristics are correlated with both the dependent variable (per capita income) and a regressor (supermarket participation) or endogeneity in the model exists if εi in Equation (6) is correlated with μi in Equation (5). Hence, some previous studies have utilized the treatment effect model (also called Heckman selection procedures) to eliminate the bias associated with unobservable characteristics [20,21]. As this model uses a two-stage procedure and assumes a joint normal error distribution, the bias can be corrected. First, the participation probit model calculated the inverse Mills ratio for each observation. Second, this ratio was included as a regressor in the income model. This study used a maximum likelihood estimation where all parameters in the selection and outcome equation were estimated simultaneously.

3. Results and Discussion

3.1. Descriptive Analysis

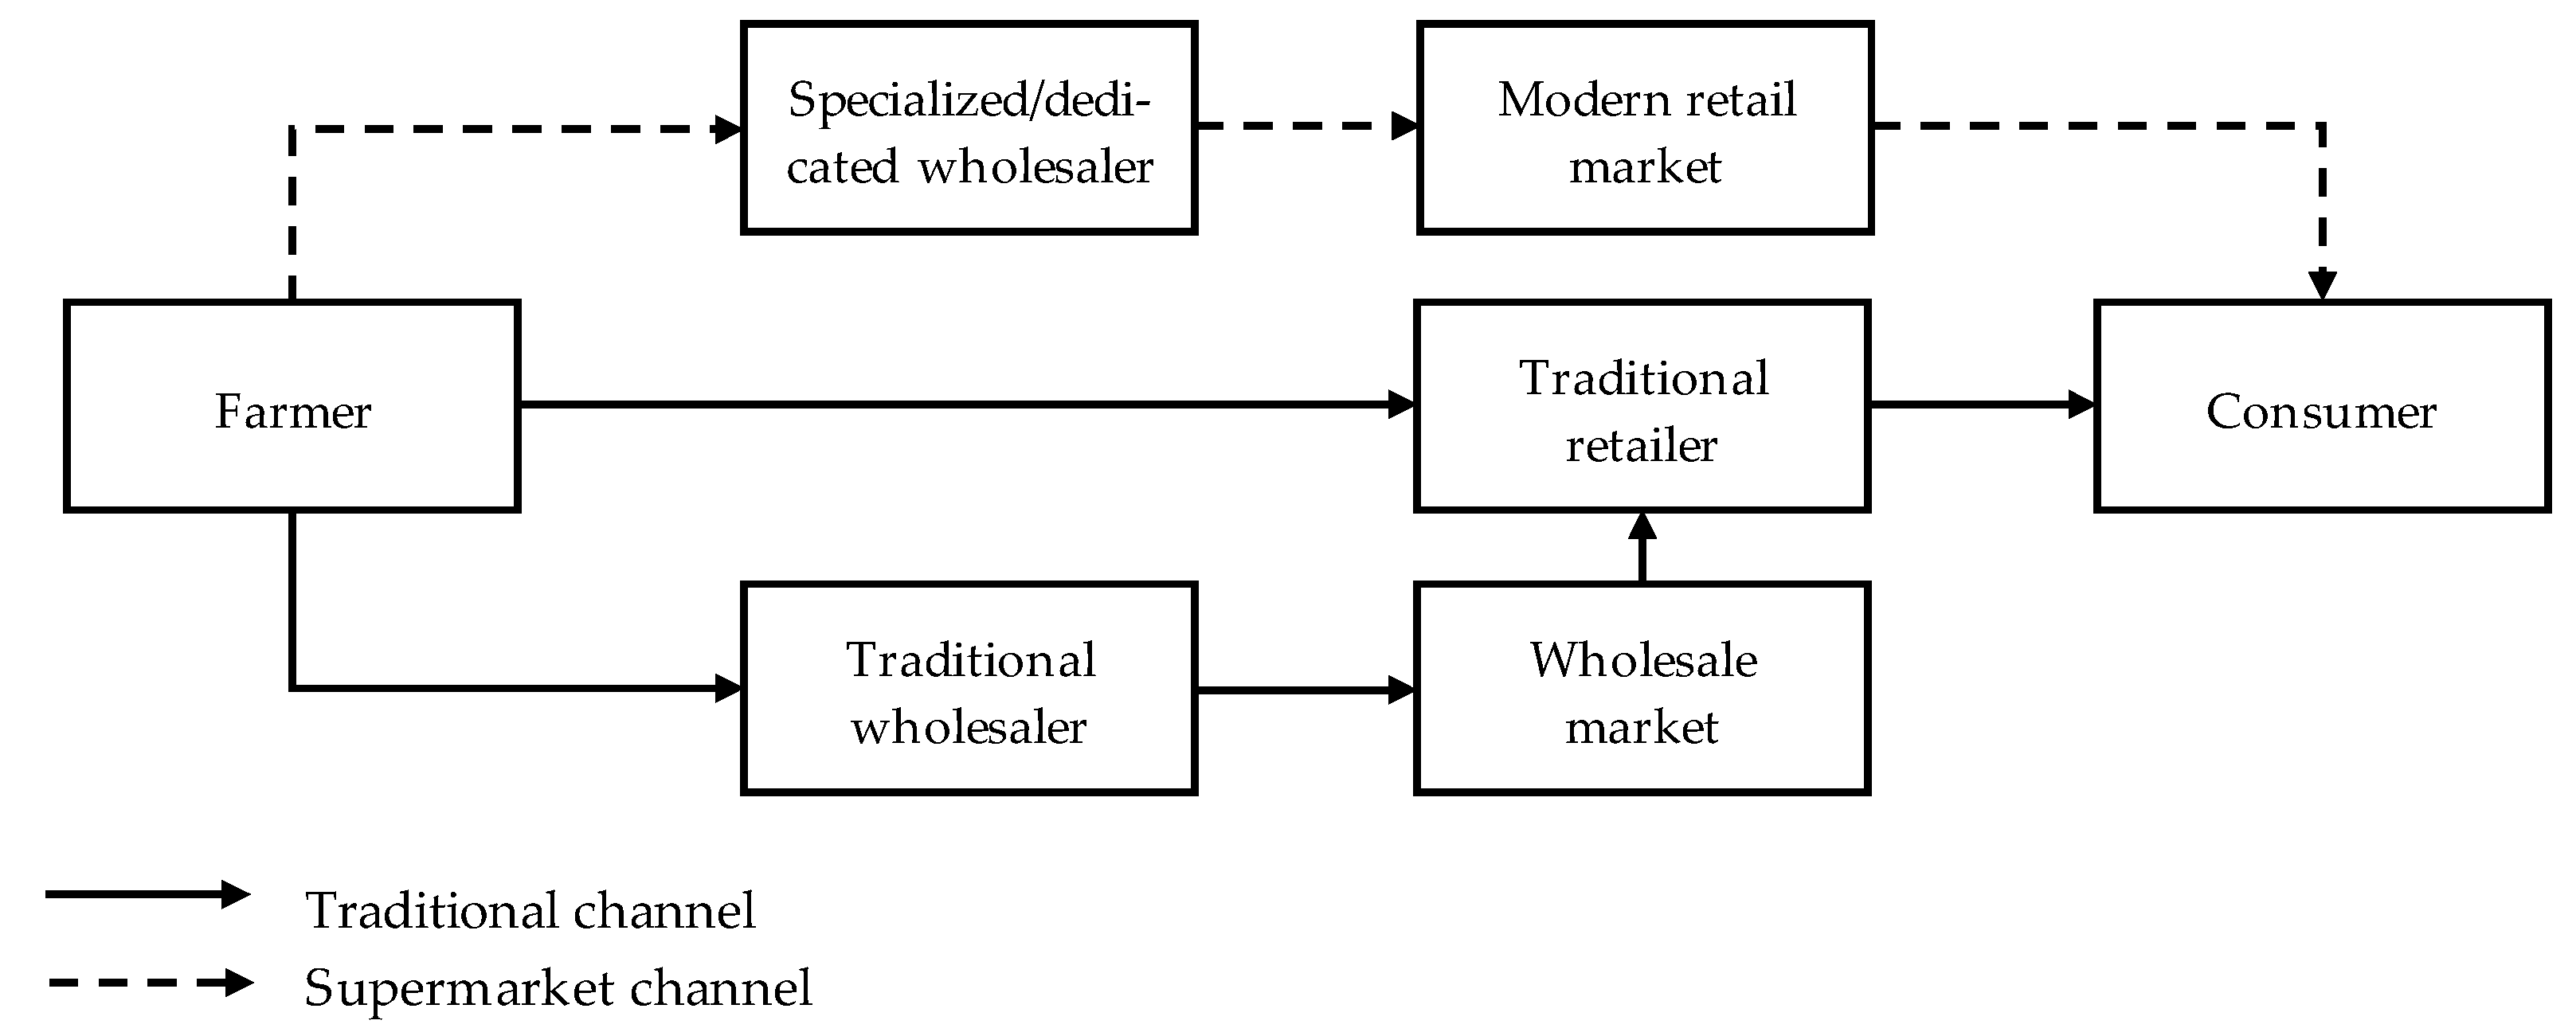
3.1.1. Vegetable Supply Chain

Figure 2 presents an analysis of the supply chain for vegetables from farms in Bogor-Cianjur, West Java to retailers in Jabodetabek region. Most vegetable sales took place through the traditional channel—from farmers, through traditional wholesalers to wholesale markets and distributed to consumers by traditional retailers. In general, the traditional wholesaler purchases the vegetables from farmers without grading, so almost 100% of the vegetable volume bought from farmers can be sold to the wholesale market. After a simple-handling process, the vegetables are then transported to the wholesale market. Furthermore, the traditional retailers purchase vegetables from the wholesale market. Vegetable farmers also sold their products to a traditional wholesaler by the local collector (medium), who charged a commission to distribute the product. Although a less significant channel, they could also sell directly to the consumer, via traditional market or warungs that are typically located close to farmers.
After the expansion of supermarkets, the traditional actors in the vegetable supply chain continued to play a role. At the same time, there is an increase in direct sourcing (not via wholesale markets) through specialized wholesalers who supply supermarkets by procuring vegetables from farmers. Specialized/dedicated wholesalers purchase mixed-graded products from the farmers and then sort, grade, and pack the vegetables themselves. In many cases (e.g., leafy-vegetables), the process of sorting, grading, and packing is conducted by farmers, and then farmers send their products to the specialized wholesaler in their final product forms. To a lesser extent, the specialized wholesalers also let the traditional wholesalers do the first stage of sorting or grading and then purchase the graded products from them. In the modern channels, aside from purchasing and adding value through better post-harvest handling, specialized wholesalers also play important roles by providing seeds, technology, and other inputs to attain the supermarket requirements. They also train farmers on how to achieve a high-quality product, set harvesting schedules, and sometimes link and assist farmers in obtaining credit from financial institutions.

3.1.2. Household Characteristics

The household characteristics of supermarket and traditional channel farmers are shown in Table 4. The average household has three to four individuals, which consists of at least 80% productive laborers (between 15 and 65 years) and only 3% non-productive laborers (over 65 years). These variables are similar between supermarket and traditional channel farmers. Significantly different household characteristics between supermarket and traditional channel farmers are age and education. From this study, most of the household heads of supermarket channel farmers were six years younger and attained higher education level than those of traditional channel farmers. The result that supermarket farmers are younger is similar with previous studies [16,30,31] and the result that supermarket farmers have a higher education level is also similar to previous studies [16,21,31,32]. In terms of farming experience, although traditional channel farmers have a greater number of years in vegetable farming than supermarket farmers, we did not find any significant differences in this variable. The variables that tend to be similar between these groups are source of capital, distance from house to asphalt road, and distance to market. In both groups, the main source of capital for their vegetable farm business was from personal savings.

3.1.3. Farm Characteristics

Table 5 shows the differences between supermarket and traditional channels regarding farm characteristics. The land sizes in both groups are quite small, with farms that are typically less than one hectare (the average farm size of traditional and supermarket channels farmer are 0.27 ha and 0.41 ha, respectively). This finding corresponds with the result of Indonesia’s Agricultural Census in 2013 which, as mentioned before, reported that most Indonesian farmers are managing farms that are less than 0.5 ha on average [26]. Although the supermarket channel farmers’ farm areas are typically seen to be larger than traditional channel farmers, this variable was not observed to be statistically different. This study also found that the majority of both farmer groups (more than 70%) held the land ownership rights of their farms. Meanwhile, 18% of traditional farmers are reported to be farming land which is owned by someone else in exchange for a share of the harvest (sharecrop). These findings are in line with Hernandez et al. [8]. Supermarket farmers can be distinguished by their significant differences from traditional farmers with respect to their irrigated land and several non-land asset variables. Supermarket channel farms are far more irrigated (88% have irrigation) than traditional channel farms (only 48% have irrigation). This supports the results of Hernandez et al. [8] and Miyata et al. [20]. In terms of non-land assets, we found a significantly higher share of supermarket farmers who owned water pumps and postharvest facilities such as simple packaging equipment and storage houses. The tendency for supermarket farmers to have storage facilities was also found in previous studies [7,16]. Furthermore, compared with farmers in the traditional channel, there were some changes in production over five-year periods for the majority supermarket farmers who reported higher significant improvements such as an increase in the area planted for vegetables (76% versus 36%), increased yield (89% versus 73%), producing more organic vegetables or reduced use of chemicals (40% versus 24%), and increasing use of inputs for vegetable production including seed saving (55% versus 36%), bio-pesticides (63% versus 44%), and hired labor (91% versus 67%). Almost 90% of supermarket farmers also perceived that their product quality increased over the five years versus 63% of traditional channel farmers.

3.1.4. Postharvest Activities and Income

This study also examined the differences in postharvest activities and income between the supermarket and traditional channels as shown in Table 6. All farmers conducted cleaning and removing of foreign material before selling their product to the buyer; however, compared with traditional channel farmers, supermarket farmers are more likely to conduct other postharvest activities, particularly in removing bad products, sorting by size, color, quality, packaging or labeling, and putting products in boxes. We also found that the number of supermarket farmers who keep written records on some aspects (i.e., planting and harvesting date, pesticide application, the quantities they sold, and received price) was significantly higher compared with traditional channel farmers. This supports the results of Sahara et al. [16]. Keeping records is important because supermarkets may require that kind of information as a result of the growing attention from consumers about traceability issues [17,18]. Farmers in the traditional and supermarket channels earn income from both farm and non-farm activities. The total and per capita household income of supermarket farmers is greater than traditional channel farmers, but the difference is not statistically significant. The net household income from vegetable farming for both supermarket and traditional channel farmers contributes mostly to net crop income or even total income. However, about 80% of the supermarket farmers stated that income from vegetables had increased over five years versus 62% of the traditional channel farmers. Net income from vegetable farming has become a more important share for supermarket channel farmers, which is also supported by the research finding that income from other activities for farmers in the traditional channels is significantly higher than for farmers in the supermarket channels.

3.2. Determinants of Farmers’ Participation in the Supermarket Channel and Impact on Household Income

3.2.1. Farmers’ Participation

Similar to Sahara et al. [16], the parameter of ath (ρ) in the treatment-effects model which is related to ρ, indicating the existence of correlation between the error terms in the selection equation and the outcome equation, was found to be statistically significant. This implies that there is selection bias, so we used the treatment-effect model to estimate per capita income in which the probit and OLS equation are estimated simultaneously. The estimates of the farmers’ participation equation and the net-household-income equation are shown in Table 7. Age of household head, education level of household head, irrigated land, packaging equipment, sprayer and storage house ownership, as well as distance to asphalt road variables have a statistically significant impact on the participation in the supermarket channels. Meanwhile, proportion of adults between 15 and 65 years, number of household members, farming experience, land size, pick-up truck, motorcycle, mobile phone, water pump, distance to market, and source of capital, were not shown to have a significant impact on the model.
This study noted that age negatively influenced participation in the channel-choice equation, whereas education level of household head had a significant and positive impact. This signifies that younger and more well-educated farmers are more likely to participate in supermarket channels, perhaps on account of higher education levels helping farmers to adjust to new market requirements and making the farmers more likely to adopt innovative production practices [9,21]. Furthermore, the coefficient for irrigated land was significantly positive, which means that farmers with more irrigation are more likely to participate in supermarket channels. Hernandez et al. [8] suggest that irrigation is an important determinant of participation in the supermarket channel because farmers with more irrigation may produce better quality and more consistent products and have greater ability to have multiple production cycles over a year. This study also reveals that households with their own storage houses and packaging equipment are more likely to participate in supermarket channels. In a previous study, Sahara et al. [16] argued that by storing vegetables in these dedicated buildings, farmers are better able to maintain a specific quality of their crops. Hence, they are able to sell their products to specialized wholesalers who supply to supermarket and offer high-quality products. Supply consistency in output quantity and product quality are attractive characteristics for suppliers to supermarkets [8].
We also found a significant relationship between sprayer ownership and supermarket participation, but the effect was negative. This finding means that farmers who have more sprayer equipment are less likely to participate in the supermarket channel, perhaps because higher shares of supermarket farmers produce more organic and less-chemical vegetables relative to traditional channel farmers (see Table 5). With that in mind, there is a form of incentive for farmers to reduce the use of chemical pesticides so that there is not so much need of sprayers for supermarket farmers. As an interview with one of the organic vegetable farmers who supply to the supermarket channel demonstrated, to overcome the problem of pests such as caterpillars on organic vegetables, for example, farmers manually removed them. This finding is in contrast to Hernandez et al. [8], who found that supermarket farmers use more chemicals than traditional channel farmers in order to attain consistency of their quality product and to reduce the risk of crop failure. In terms of the distance to asphalt road-related transaction costs, we found that those variables negatively influenced participation choice. This finding supports the results of previous studies [8,16]. Sahara et al. [16] suggested that farmers are more likely to sell their products through traditional channels due to increased travel time and transportation costs. In addition, in this study we used qualitative questions to ask the farmers about constraints encountered for selling their products to modern market channels. Farmers in both channels encountered several constraints, such as small production quantities, distance from buyers, low quality products, irrigation facilities, experience in supplying to supermarket, requirements to undertake the sorting and grading process, requirements to undertake the packaging process, and long payment periods.

3.2.2. Impact on Income

In the income model, we used the log form of net household income as a dependent variable. The results from the model show that supermarket participation had a positive impact on household income (Table 4). Farmers’ participation in the model was a dummy variable; therefore, the effect that the channel participation coefficient had with the base natural log (e = 2.718) can be interpreted as being equal to (e0.19 − 1) × 100 = 21% [16]. This indicated that per capita income of supermarket channel farmers was 21% higher than the traditional-channel farmers. This finding is similar to previous studies which have shown that household income can be increased by participating in the supermarket channels [16,20,21]. By using similar methods, Sahara et al. [16] suggested that in the case of chili farms in Indonesia, the participation of small chili farmers in supermarket channels increased farmers’ income up to 75% higher than farmers in the traditional channels. Miyata et al. [20], in the case of apple and green onion crops in China, also showed that participation in contracts with modern market channels raised per capita income up to 22% higher than the average income of apple growers and 45% higher than the average income of green onion growers. Meanwhile, Rao and Qaim [21], in the case of vegetables in Kenya, noted that participation in supermarket channels produced a net gain of 48% in per capita incomes. According to Reardon et al. [4], there are several factors that allows farmers who are participating in the modern channels to have greater net income compared with the traditional channel farmers. One of the factors is that the modern markets, via their traders, pay a higher price for higher quality products. The results of qualitative questions in this study provide some confirmation. When sampled farmers were asked about the advantages of selling into the modern channels, most of them (75%) answered “higher price”, while 11% said “getting technical assistance” and 10% reported “access to good seed”.
Per capita income was also positively and significantly affected by the share of working-age household members, farm size, mobile phone, and car/pick-up truck ownership; while age of household head and family size had a negative impact. These findings support the results of previous studies in terms of farm size [16,20], family size, and mobile phone ownership [16], and the share of working-age household members. The land area variable is important to farmers, as a larger land area may allow them to produce more products. Mobile phone ownership may also hold an important role, as it will allow farmers to engage more with their buyer and input supplier as well as access market information such as demand and price. Next, car/pick-up truck ownership is likely to increase farmers’ access to input and output markets while also allowing farmers to deliver a much larger volume of products and have greater efficiency in transportation costs. Meanwhile, there was no significant effect on household income resulting from education level of the household head, farming experience, irrigation, source of capital, and all the non-land asset variables except pick-up truck and mobile phone ownership.
Moreover, in analyzing farmers’ participation in supermarket channels and the impact of participation on income, this study used “lagged assets” rather than “current assets” in order to minimize potential endogeneity problems. However, this study also had its limitations when using farmers’ current income and with only having sampled once (after the participation of the farmers in the supermarket channel). In terms of methodology, further studies on impacts resulting from participation in modern market channels could be explored by using a data matrix that measured the exact portion of farmers’ overall earnings in the modern channel [4], and by analyzing farmers who had higher assets and incomes before participating in modern channels and/or by analyzing their potential to join the modern channels.

4. Conclusions

The expansion of modern retail markets in developing countries as well as changes in procurement systems have created both opportunities and challenges to vegetable farmers to participate in modern supply chains. This study attempted to analyze whether the small-scale farmers in rural areas have opportunities to participate in Indonesia’s modern channel and gain benefit from their participation. In summarizing the results of this study, we return to the three specific objectives stated in the introduction. First, related to the differences in characteristics, we found differences in the household characteristics between traditional channel farmers and supermarket channel farmers. Farmers who participated in supermarket channels were typified as being younger and more well-educated farmers, who had higher non-land assets, apply increased use of inputs and consequently had increased yields of production, better written records of their activities, and who were more likely to perform post-harvest activities before selling their products to the buyer and were more likely to have perceived their income from vegetable farming to have increased compared to five years ago in comparison to traditional farmers.
Second, the results of the channel-selection model showed that there were several constraints faced by small-scale farmers who participated in the supermarket channel that were related to their level of education, irrigated land, packaging equipment, and storage space ownership, rather than farm size, or other household and farm assets. This finding indicated that Indonesia’s modern market growth could also include small-scale farmer’s participation. Since the farm area operated by farmers is usually small, there might be a lack of individual economic scale at play; nevertheless through collective action it could be possible to operate under a higher economic scale by associating with specialized/dedicated wholesalers [4]. However, as stated in previous studies [4,8,22], small-scale farmers with non-land assets eventually need threshold investment in order to progress towards the modern market channel inclusion process; those assets include irrigation, packaging equipment, storage facilities, and access to asphalt roads. Irrigation, packaging equipment, and storage facilities seem to be important enablers for farmers participating in the supermarket channel, as these factors allow them to attain higher productivity and supply all year with consistency in quantity and quality [8,16]. Access to asphalt roads is also an important factor for participating in modern channels since it will affect transaction costs. Next, education and skill are equally important factors for encouraging small-scale farmers to participate in supermarket channels [16]. Therefore, our result conveys a message for the government to provide the training programs needed (in production methods, quality improvement, system traceability, and marketing access) and to improve rural infrastructure (irrigation, roads, packing houses). These are much needed in order to help some farmers to meet the requirements of supermarkets.
Third, the impact analysis has shown that participation in the supermarket channels generates a higher per capita household income than traditional channels, even after controlling for possible selectivity bias. This result is consistent with the previous literature on emerging modern channels [7,16,20,21]. High quality products are able to obtain better prices, thus supermarket channel farmers tend to have higher incomes than traditional channel farmers.

Acknowledgments

We thank the Directorate General for Higher Education (DIKTI) from the Indonesian Ministry for Higher Education, Research and Technology and Bogor Agricultural University for their financial support. We would also like to thank Eny Widiya Astuti, Fauzan Zamahsyarie, and Farida Nur Fitriana for their support in collecting data/information and for their valuable suggestions.

Author Contributions

Alim Setiawan Slamet and Akira Nakayasu conceived and designed this study. Alim Setiawan Slamet analyzed the data and wrote the manuscript. Masahiro Ichikawa provided many valuable suggestions for the manuscript. All authors read and approved the manuscript.

Conflicts of Interest

The authors declare no conflict of interest.

References

  1. Natawidjaja, R.S.; Reardon, T.; Shetty, S. Horticultural Producers and Supermarket Development in Indonesia; World Bank: Jakarta, Indonesia, 2007. [Google Scholar]
  2. Suryadarma, D.; Poesoro, A.; Akhmadi, A.; Budiyati, S.; Rosfadhila, M.; Suryahadi, A. Traditional food traders in developing countries and competition from supermarkets: Evidence from Indonesia. Food Policy 2010, 35, 79–86. [Google Scholar] [CrossRef]
  3. Natawidjaja, R.S.; Rum, I.A.; Sulistyowati, L.; Saidah, Z. Improving the participation of smallholder mango farmers in modern retail channels in Indonesia. Int. Rev. Retail. Distrib. Consum. Res. 2014, 24, 564–580. [Google Scholar] [CrossRef]
  4. Reardon, T.; Barrett, C.B.; Berdegué, J.A.; Swinnen, J.F.M. Agrifood Industry Transformation and Small Farmers in Developing Countries. World Dev. 2009, 37, 1717–1727. [Google Scholar] [CrossRef]
  5. Wang, H.; Dong, X.; Rozelle, S.; Huang, J.; Reardon, T. Producing and Procuring Horticultural Crops with Chinese Characteristics: The Case of Northern China. World Dev. 2009, 37, 1791–1801. [Google Scholar] [CrossRef]
  6. Mainville, D.Y.; Reardon, T. Supermarket market-channel participation and technology decisions of horticultural producers in Brazil. Rev. Econ. Sociol. Rural 2007, 45, 705–727. [Google Scholar] [CrossRef]
  7. Neven, D.; Odera, M.M.; Reardon, T.; Wang, H. Kenyan Supermarkets, Emerging Middle-Class Horticultural Farmers, and Employment Impacts on the Rural Poor. World Dev. 2009, 37, 1802–1811. [Google Scholar] [CrossRef]
  8. Hernandez, R.; Reardon, T.; Berdegue, J. Supermarkets, wholesalers, and tomato growers in Guatemala. Agric. Econ. 2007, 36, 281–290. [Google Scholar] [CrossRef]
  9. Schipmann, C.; Qaim, M. Spillovers from modern supply chains to traditional markets: Product innovation and adoption by smallholders. Agric. Econ. 2010, 41, 361–371. [Google Scholar] [CrossRef]
  10. Mergenthaler, M.; Weinberger, K.; Qaim, M. The food system transformation in developing countries: A disaggregate demand analysis for fruits and vegetables in Vietnam. Food Policy 2009, 34, 426–436. [Google Scholar] [CrossRef]
  11. Dyck, J.; Woolverton, A.E.; Rangkuti, F.Y. U.S. Indonesia’s Modern Retail Sector Interaction With Changing Food Consumption and Trade Patterns; EIB-97; U.S. Department of Agriculture, Economic Research Service: Washington, DC, USA, 2012.
  12. USDA GAIN Report. Indonesia Retail Foods 2015; U.S. Department of Agriculture: Jakarta, Indonesia, 2015.
  13. Chowdhury, S.K.; Gulati, A.; Gumbira-Sa’id, E. The Rise of Supermarkets and Vertical Relationships in the Indonesian Food Value Chain: Causes and Consequences. Asian J. Agric. Dev. 2005, 2, 39–48. [Google Scholar]
  14. The Development Bank of Singapore. ASEAN Grocery Retail; DBS Group Research: Singapore, Singapore, 2015. [Google Scholar]
  15. Pingali, P. Westernization of Asian diets and the transformation of food systems: Implications for research and policy. Food Policy 2007, 32, 281–298. [Google Scholar] [CrossRef]
  16. Sahara, S.; Minot, N.; Stringer, R.; Umberger, W.J. Determinants and Effects of Small Chilli Farmers’ Participation in Supermarket Channels in Indonesia. Bull. Indones. Econ. Stud. 2015, 51, 445–460. [Google Scholar] [CrossRef]
  17. Slamet, A.S.; Nakayasu, A. Consumers’ Choice for Vegetable Market Channels in Indonesia. In Proceedings of the 2nd International Conference of Agro-Industry; KnE Life Sciences: Matsuyama, Japan, 2016; Volume 3, pp. 167–172. [Google Scholar]
  18. Slamet, A.S.; Nakayasu, A. Factors Influencing Urban Consumer Preferences for Fruit Retail Formats: A Case Study in Jabodetabek Region of Indonesia. Agric. Mark. J. Japan 2016, 25, 1–14. [Google Scholar]
  19. BPS Statistic Indonesia. Available online: https://www.bps.go.id/Subjek/view/id/5#subjekViewTab3|accordion-daftar-subjek1 (accessed on 20 June 2016).
  20. Miyata, S.; Minot, N.; Hu, D. Impact of Contract Farming on Income: Linking Small Farmers, Packers, and supermarkets in China. World Dev. 2009, 37, 1781–1790. [Google Scholar] [CrossRef]
  21. Rao, E.J.O.; Qaim, M. Supermarkets, Farm Household Income, and Poverty: Insights from Kenya. World Dev. 2011, 39, 784–796. [Google Scholar] [CrossRef]
  22. Hernández, R.; Reardon, T.; Natawidjaja, R.; Shetty, S. Tomato Farmers and Modernising Value Chains in Indonesia. Bull. Indones. Econ. Stud. 2015, 51, 425–444. [Google Scholar] [CrossRef]
  23. Sahara, S.; Gyau, A. Contractual arrangements and commitment in the Indonesian supermarket channel. Br. Food J. 2014, 116, 765–779. [Google Scholar] [CrossRef]
  24. Ghezán, G.; Mateos, M.; Viteri, L. Impact of Supermarkets and Fast–Food Chains on Horticulture Supply Chains in Argentina. Dev. Policy Rev. 2002, 20, 389–408. [Google Scholar] [CrossRef]
  25. Reardon, T.; Berdegué, J.A.; Timmer, C.P.; Cabot, T.; Mainville, D.; Flores, L.; Hernandez, R.; Neven, D.; Balsevich, F. Links among Supermarkets, Wholesalers, and Small Farmers in Developing Countries: Conceptualization and Emerging Evidence; International Food Policy Research Institute: Washington, DC, USA, 2005. [Google Scholar]
  26. BPS Statistics Indonesia. Agricultural Censuses of 2013; Badan Pusat Statistik: Jakarta, Indonesia, 2013. [Google Scholar]
  27. Google Maps Jabodetabek Maps. Available online: https://www.google.co.id/maps/@-6.5950181,106.7218511,10z?hl=id (accessed on 15 December 2016).
  28. Weiers, R.M. Introduction to Business Statistic, 6th ed.; Thomson South-Western: Mason, OH, USA, 2008. [Google Scholar]
  29. Greene, W.H. Econometric Analysis, 5th ed.; Pearson Education, Inc.: Hoboken, NJ, USA, 2003. [Google Scholar]
  30. Blandon, J.; Henson, S.; Islam, T. Marketing preferences of small-scale farmers in the context of new agrifood systems: A stated choice model. Agribusiness 2009, 25, 251–267. [Google Scholar] [CrossRef]
  31. Schipmann, C.; Qaim, M. Supply chain differentiation, contract agriculture, and farmers’ marketing preferences: The case of sweet pepper in Thailand. Food Policy 2011, 36, 667–677. [Google Scholar] [CrossRef]
  32. Neven, D.; Reardon, T. The Rise of Kenyan Supermarkets and the Evolution of their Horticulture Product Procurement Systems. Dev. Policy Rev. 2004, 22, 669–699. [Google Scholar] [CrossRef]
Figure 1. Jabodetabek region map (locations of study are framed) [27].
Agriculture 07 00011 g001
Figure 2. The channels in the vegetable supply chain.
Agriculture 07 00011 g002
Table 1. Indonesia’s food retail sales and number of outlets.
Retail Sectord1999 a2004 a2009 a2014 b,c
SalesOutletsSalesOutletsSalesOutletsSalesOutlets
Millions US ($)NumberMillions US ($)NumberMillions US ($)NumberMillions US ($)Number
Total food retail31,466.00 2,134,892 45,686.00 2,207,739 52,383.00 2,568,479 99,186.88 2,555,474
Modern grocery retail
 Hypermarkets256 18 940.00 34 1897.00 141 5423.30 269
 Supermarkets1235 636 1852.00 695 2068.00 1162 3239.20 1362
 Convenience stores/minimarkets69 522 520.00 1435 1676.00 10,039 7366.10 22,818
Modern total1560 1176 3312.00 2164 5640.00 11,342 16,028.60 22,449
Modern share of total sales (%)4.96 7.25 10.77 16.16
Traditional grocery retail29,906.00 2,133,716 42,374.00 2,205,575 46,743.00 2,557,137 83,158.28 2,533,025
Traditional share of total sales (%)95.04 92.75 89.23 83.84
Source: a Dyck et al. [11]; b, c Development Bank of Singapore (DBS) [14] and USDA GAIN report [12]; d Other specialized stores are not included.
Table 2. Market share across modern retail outlets in Indonesia, 2014.
HypermarketSupermarketConvenience Store/Minimart
Brand (Ownership)Market ShareOutlets NumberBrand (Ownership)Market ShareOutlets NumberBrand (Ownership)Market ShareOutlets Number
Carrefour
(PT. Trans Retail Indonesia, local company, Indonesia)
35.7%90 outletsSuper Indo
(PT. Lion Superindo, Delhaize Group, Belgium)
8.6%157 outletsIndomaret
(PT. Indomarco Prismatama, local company, Indonesia)
46.4%11,400 outlets
Hypermart
(PT. Matahari Putra Prima Tbk, Temasek, Singapore)
33.0%111 outletsGiant/Hero supermarket
(PT. Hero Supermarket Tbk, Dairy Farm, Hong Kong)
4.0%120 Giant outlets
34 Hero outlets
Alfamart
(PT. Sumber Alfaria Trijaya Tbk, local company, Indonesia)
41.5%10,377 outlets
Giant
(PT. Hero Supermarket Tbk, Dairy Farm, Hong Kong)
25.1%53 outletsRamayana/SPAR
(PT. Ramayana Lestari Sentosa Tbk, local company, Indonesia)
3.0%110 outletsAlfa Midi
(PT. Midi Utama Indonesia, local company, Indonesia)
6.3%833 outlets
Others6.2% Others84.4% Others5.8%
Total100% 100% 100%
Source: DBS [14] and USDA GAIN Report [12].
Table 3. Average monthly food expenditure per capita a.
Commodity Group199820082014
IDR bShare (%)IDRShare (%)IDRShare (%)
Cereals and tubers12,7523339,0103063,80127
Fish42481115,3151231,84914
Livestock and dairy products57111519,1521538,90317
Fats and oils270878336612,6915
Fruits and vegetables53111424,3181949,31121
Legumes200355978510,3284
Beverage stuffs287888221613,4616
Spices149744312373743
Miscellaneous food items114035356477683
Total of food38,248 129,998 235,486
Source: Badan Pusat Statistik (BPS)-Statistics Indonesia, 2015 [19], a except prepared food and tobacco, b IDR= Indonesian Rupiah.
Table 4. Household characteristics of supermarket and traditional channel farmers.
VariableTraditional Channel FarmersSupermarket Channel FarmersAll Farmerst-Test of Difference
Household member (person)3.723.933.82−1.09
Proportion of family members between 15 and 65 years (%)82.9480.2981.680.74
Proportion of family members over 65 years (%)4.051.412.801.31
Age of household head (years)48.3642.9646.093.25 ***
Education level of household head (1 = elementary school, 2 = junior high school, 3 = senior high school, 4 = university )1.762.282.01−3.13 ***
Farming experience (years)18.4216.3217.421.11
Source of capital (0 = private, 1 = cash loan/credit)0.110.060.091.03
Distance from house to asphalt road (km) 0.730.710.720.24
Distance to modern market/Jakarta (km)80.4683.1281.72−1.44
*** Significant at the 1% level.
Table 5. Comparison of farm characteristics between groups.
VariableTraditional Channel FarmersSupermarket Channel FarmersAll Farmerst-Test of Difference
Household and farm assets
Cultivated land (ha) 0.270.410.33−1.55
Irrigated land (1 = yes, 0 = no) 0.480.880.67−5.42 ***
Water pump ownership (unit) 0.310.690.50−1.72 *
Sprayer ownership (unit) 0.650.620.64−0.37
Packaging equipment ownership (unit) 0.200.460.33−2.99 ***
Storage house ownership (unit) 0.050.230.13−3.27 ***
Motorcycle ownership (unit) 0.710.640.67−0.59
Car/pick-up truck ownership (unit)0.080.030.061.20
Mobile phone ownership (unit) 0.970.830.911.02
Landholdings (1 = yes, 0 = no)
Owned and farmed0.720.780.75−0.84
Owned and rented0.010.020.01−0.07
Rented from owner 0.060.090.07−0.81
Sharecropping with owner 0.180.050.122.55 **
Borrowed from owner 0.080.080.080.14
Change in production (1 = yes, 0 = no)
Increase in area planted0.360.760.56−5.26 ***
Increase in yield0.730.890.81−2.40 **
Producing organic vegetables or reduced use of chemicals0.240.400.32−2.07 **
Increase in seed saving 0.360.550.46−2.29 **
Increasing use of hybrid seed 0.720.800.76−1.07
Increasing use of chemical fertilizer 0.880.840.860.73
Increasing use of bio-pesticides 0.440.630.54−2.21 **
Increasing use of hired labor0.670.910.79−3.62 ***
Increase in quality standard buyers want0.820.880.85−0.94
Increase in quality of farmers’ output0.630.880.76−3.39 ***
* Significant at the 10% level; ** Significant at the 5% level; *** Significant at the 1% level.
Table 6. Postharvest activities and income differences over the last five years between the traditional and supermarket channel farmers.
VariableTraditional Channel FarmersSupermarket Channel FarmersAll Farmerst-Test of Difference
Postharvest activities (1 = yes, 0 = no)
Cleaning and removing foreign materials1.001.001.00-
Removing bad products0.931.000.96−2.30 **
Choosing fresh products0.681.000.83−5.73 ***
Sorting by size0.600.850.72−3.38 ***
Sorting by color0.570.860.71−4.01 ***
Sorting by quality0.640.850.74−4.84 ***
Packaging or labeling0.530.880.69−4.84 ***
Putting into boxes0.830.980.91−3.23 ***
Record-keeping (1 = yes, 0 = no)
Planting and harvesting date0.670.850.75−2.50 ***
Pesticide and fertilizer supplier0.400.750.57−4.43 ***
Type and brand of pesticide and fertilizer0.260.660.45−5.04 *
Time and amount of pesticide application0.560.710.63−1.86 ***
Output quantities0.710.910.80−3.07 ***
Product price0.690.910.80−3.25 ***
Income (IDR million)
Total net household income 62.3364.0563.14−0.27
Net household income per capita18.3718.7018.53−0.13
Net crop income48.2558.8253.54−1.90 *
Net income from vegetable farming46.6054.6850.64−1.58
Income from other activities14.085.239.663.00 ***
Income from vegetable farming increased compared with five years ago (1 = increase, 0 = otherwise)0.620.800.71−2.23 **
* Significant at the 10% level; ** Significant at the 5% level; *** Significant at the 1% level.
Table 7. Determinants of farmers’ participation in the supermarket channel and the effect on household income.
Variable CoefficientSEP(|Z| > z)
Selection equation
Dependent variable: supermarket participation dummy
Age of household head (years) −0.0320.0180.076 *
Proportion of adults between 15 and 65 years (%) 0.0090.0070.221
Number of household members (person/s) 0.2010.1380.147
Education level of household head (1 = elementary school–4 = university)0.5020.1760.005 ***
Farming experience (years) 0.0050.0160.783
Land ownership (ha) 0.7351.1510.524
Irrigated land (1 = irrigated, 0 = no) 0.7370.3370.031 **
Pick-up truck ownership (unit)0.9500.7050.181
Motorcycle ownership (unit) 0.0470.2490.849
Mobile phone ownership (unit) −0.3320.2150.127
Packaging equipment ownership (unit) 0.7830.3500.027 **
Water pump ownership (unit) 0.0240.1080.828
Sprayer ownership (unit) −0.6610.2710.016 **
Storage house ownership (unit) 1.6800.5030.001 ***
Distance from house to asphalt road (km) −0.4260.2200.055 *
Distance to modern market/Jakarta (km)0.0150.0120.218
Source of capital (1 = cash loan/credit, 0 = private)−0.7710.5710.180
Constant−2.6391.5910.100
Outcome equation
Dependent variable: net income per capita (log)
Age of household head (years) −0.0070.0030.033 **
Proportion of adults between 15 and 65 years (%) 0.0020.0010.096 *
Number of household members (person/s) −0.1160.0240.000 ***
Education level of household head (1 = elementary school–4 = university)−0.0260.0300.390
Farming experience (years) 0.0030.0030.318
Land ownership (ha) 0.1630.0550.003 ***
Irrigated land (1 = irrigated, 0 = no) −0.0500.0710.479
Pick-up truck ownership (unit)0.2830.1400.046 **
Motorcycle ownership (unit) 0.0300.0410.466
Mobile phone ownership (unit) 0.1090.0480.026 **
Packaging equipment ownership (unit) −0.0470.0580.420
Water pump ownership (unit) 0.0120.0170.489
Sprayer ownership (unit) −0.0350.0550.533
Storage house ownership (unit) 0.0980.0720.179
Source of capital (1 = cash loan/credit, 0 = private)−0.1270.1090.248
Channel participation (1 = supermarket, 0 = otherwise)0.1940.0180.000 ***
Constant6.6590.2090.000
Ath (ρ)−0.9720.0010.000 ***
SE = standard error, Log likelihood = −27.08. * Significant at the 10% level; ** Significant at the 5% level; *** Significant at the 1% level.

