Article

Durum Wheat Cover Analysis in the Scope of Policy and Market Price Changes: A Case Study in Southern Italy

1
Dipartimento di Ingegneria Civile, Ambientale, del Territorio, Edile e di Chimica, Politecnico di Bari, Via Orabona 4, Bari 70125, Italy
2
Institute for Sustainable Food Systems, University of Florida, Gainesville, FL 32608, USA
3
CIHEAM Mediterranean Agronomic Institute of Bari, Via Ceglie 9, Valenzano 70010, Italy
*
Author to whom correspondence should be addressed.
Agriculture 2017, 7(2), 12; https://doi.org/10.3390/agriculture7020012
Submission received: 30 September 2016 / Revised: 17 January 2017 / Accepted: 24 January 2017 / Published: 10 February 2017

Abstract

:
Agricultural land systems are the result of human interactions with the natural environment, and subjective evidence of socio-economic and environmental interactions has been demonstrated. Nevertheless, it is still difficult to analyze empirically the link between agricultural market and policy, as well as the environmental response due to changes in crop management by local stakeholders. In this study, we propose a cross investigation and analysis to bring the link between vegetation cover, policy, market and farmer’s behavior to light. Our methodology is a combination of a rational positive and analogical approach between the quantifiable and non-quantifiable agents on a temporal basis. The method is applied to a dominant mono-crop agricultural watershed in Southern Italy that has been dedicated to durum wheat cultivation. In this region, we studied the relationship between the Common Agricultural Policy (CAP), durum wheat market price, vegetation cover and land allocation. As a first step, we conducted a separate analysis for each factor, exploiting Moderate Resolution Imaging Spectroradiometer (MODIS) satellite observed Leaf Area Index (LAI) to analyze the land vegetation space–time distribution over the period 2000–2014 and three Land Satellite (Landsat) validated images as check-points for the agricultural pattern and CAP’s reforms. We used the Farm Accountancy Data Network (FADN) and Eurostat data to investigate the on-farm accountancy and the durum wheat market price changes, respectively. Based on the study period, we developed a storyline of the major relevant CAP’s policy changes. In a second step, we conducted a comparative analysis where the CAP’s reforms were used as interpretational support, the land allocation and the on-farm accountability for CAP’s implementation, the price of durum wheat and the LAI for analytical comparison. We found interesting insights regarding the non-agronomic driving forces of LAI dynamics. The behavior of the individual farmers is influenced by the CAP policy that has been implemented by using profitability as the stimulus for the decision making of the farmer. This explains the correlation of the trend between the market price, the LAI of durum wheat and their associated dynamics.

1. Introduction

While theoretical evidence for agricultural and environmental policy conflicts is still ambiguous, mounting environmental concerns and problems of sustainable agriculture linked to improvements in environmental performance underlie the urgent need for an integrated economic and environmental approach [1,2,3]. In fact, evolutions in agricultural production schemes are mainly driven by economic interests [4]. Future price volatility in food markets has an adverse effect on both consumers and producers, with risk implications for production, macro-economy and public finances. Moreover, according to [5,6], food production subsidies and related interventions act as a hindrance to the efficiency of food production. Future climate change is expected to affect crops yields. However, the result in terms of yield variability is uncertain and highly site dependent. This is due to the contrasting effects of temperature, precipitation, and CO2 concentration on wheat yield [7,8,9]. Even if the development constitutes a significant change in the type and intensity of use of a parcel of land, the social, economic, and environmental interactions often result in countervailing effects between price changes, land use and management [10,11,12]. Moreover, land change processes are potentially affected by complex spatial dynamics linking bio-physical processes and human decision making [10,11,12,13,14].
In the European (EU) context, agricultural policies play an important role in the viability of the farming sector [15]. The EU Common Agricultural Policy (CAP) is considered one of the major actors of change, affecting both direct income and the orientation of farming activities [16,17]. Recent studies [18] have shown that the abolishment of the CAP support could lead to a substantial portion of farmers to abandon farming, following economic opportunities outside agriculture. Without subsidies, costs and prices would be too high to compete internationally. Today, the EU investments seem to be driven, largely, by agricultural and energy policies [19], leading to a shift away from production-linked support towards various other types of payments which are frequently linked to land use (such as crop rotation, set-aside) [17,20]. On the other hand, CAP’s countries are trying to better address their internal policy on resource scarcity. In addition to the traditional concerns in EU agricultural policy making, such as farm incomes and maintenance of family farming, World Trade Organization (WTO) concerns have increasingly been accepted as a constraint within which the CAP evolves. This institutional layering has resulted in a gradual change of the CAP in which the underlying paradigm, the state-assisted paradigm, which has been sustained though it, has been rephrased by introducing the concept of multi-functionality. There has been a gradual change of policy instruments aimed at making the CAP more WTO compatible by applying less trade-distorting support measures [21,22,23,24].
Cereals account for one-quarter of the EU’s crop production and for one-eighth of the total agricultural products. Half of EU farms cultivate cereals, and cereal crops occupy one-third of the EU’s agricultural area [25]. The EU is the leading producer of wheat in the world with the largest producers [26], mainly concentrated in Mediterranean areas, where Italy is the main EU producer [27]. The Italian Durum wheat (Triticumturgidum L. cv. durum) is traditionally grown under rain-fed conditions. In these areas, water stress is one of the main production constraints [28,29]. The rainfed nature of durum wheat makes it easily affected by weather variability. Therefore, farmers are adapted to manage crops in suitable ways to compensate for such dynamics. Specifically, Capitanata (Puglia, Southern Italy) is one of the largest Italian agricultural regions and is the highest with respect to production, with more than 70% of the total area occupied by durum wheat cropped land. Within Capitanata, the Celone river basin was selected as the area of investigation for cross-analysis of CAP, durum wheat market price and yield relationship. The variability in yield, assessed with vegetation cover indices, in this environment was already proven to be higher temporally than spatially [30], and it cannot be explained only in terms of water availability, because water excess could also lead to reduction in grain quality and/or quantity while optimal conditions are met in terms of rainfall and temperature during the growing season [31]. Despite the numerous studies conducted in this region of Italy, little is known about non-physical factors influencing the durum wheat yield variation. In this paper, we present a new insight method for socio-economic impact assessment on durum wheat using vegetation cover as an indicator of yield productivity.

2. Materials and Methods

2.1. Theoretical Approach

Several factors are involved within the farmer’s crop/pattern choices based on a long-run perspective that revolves around the agronomic consequences of crop selection. Nevertheless, the importance of single-season economic factors like future prices and input costs reflect a short-term perspective consistent with maximizing the season’s net returns. The driving force influencing crop production, throughout the farmer’s management decision, can be classified into two main groups:
  • Physical forces: major focus is set to the weather and climate factors, since they are uncontrolled and directly affect the phenology and development of the crops.
  • Non-physical forces: for profitability purposes, knowledge of the implemented policy and market status is important (i.e., policy, market prices, and input costs).
The LAI, prices, CAP and land use are analyzed separately on a temporal basis. Special attention is given to LAI and durum wheat market price, as the LAI spatio-temporal dynamics are the main quantitative indicator we used for impact assessment, and it is our dependent variable. The durum wheat market price is our quantifiable independent variable used for the cross analysis. The CAP’s storyline is used for base interpretation of the analogy correspondence between the price and LAI. Figure 1 shows the flowchart of the work procedure and the variable classification used in the analysis.
We conducted a discrete land use pattern change and on-farm accountancy analysis to check for the CAP’s land allocation and subsidies reforms application. Also, a cross, dynamic and continuous analysis study was performed for the three main factors involved, which are the CAP’s policy, durum wheat market price and vegetation cover changes.

2.1.1. Objectives

Our aims are to investigate and assess the socio-economic factor prevalence with respect to crop system behavior and outputs, a demonstration of the level of control that can be reached in real world of the system dynamics. This comprises the establishment of causality relationships on a temporal base and analogy correspondences between the different agents composing the non-physical aspect of the crop system mechanism.
A holistic impact assessment approach in a real case study, with close criteria relative to an experiment, supports the viability and representativeness of our analysis and brings an explicit contribution to the debate of the socio-economic role in crop system. Indeed, by providing a consistent analytical knowledge base, the results can be used to underpin future policy-makers’ debate to improve environmental performance and sustainability.

2.1.2. Assumptions

This storyline’s comparison assumes the monetary stimulus as the predominant driver of agricultural productivity. As such, available markets, the agricultural subsidies and income stabilization available to farmers in the region, principally guided by the CAP, was the focus for this storyline comparison.
The agronomic factors, i.e., pests, nutrients and crop management practices and decisions [2,32,33,34], are assumed to be part of the farmers’ decision-making adjusted to maximize profit. It does not mean that they do not affect LAI or final yield. Indeed, they do affect the crop phenology and vegetative development, but are not considered as “independent variables”. In addition, our study addresses only one part of the components involved in the agricultural system mechanics (socio-economic) and how it behaves.

2.2. Study Area

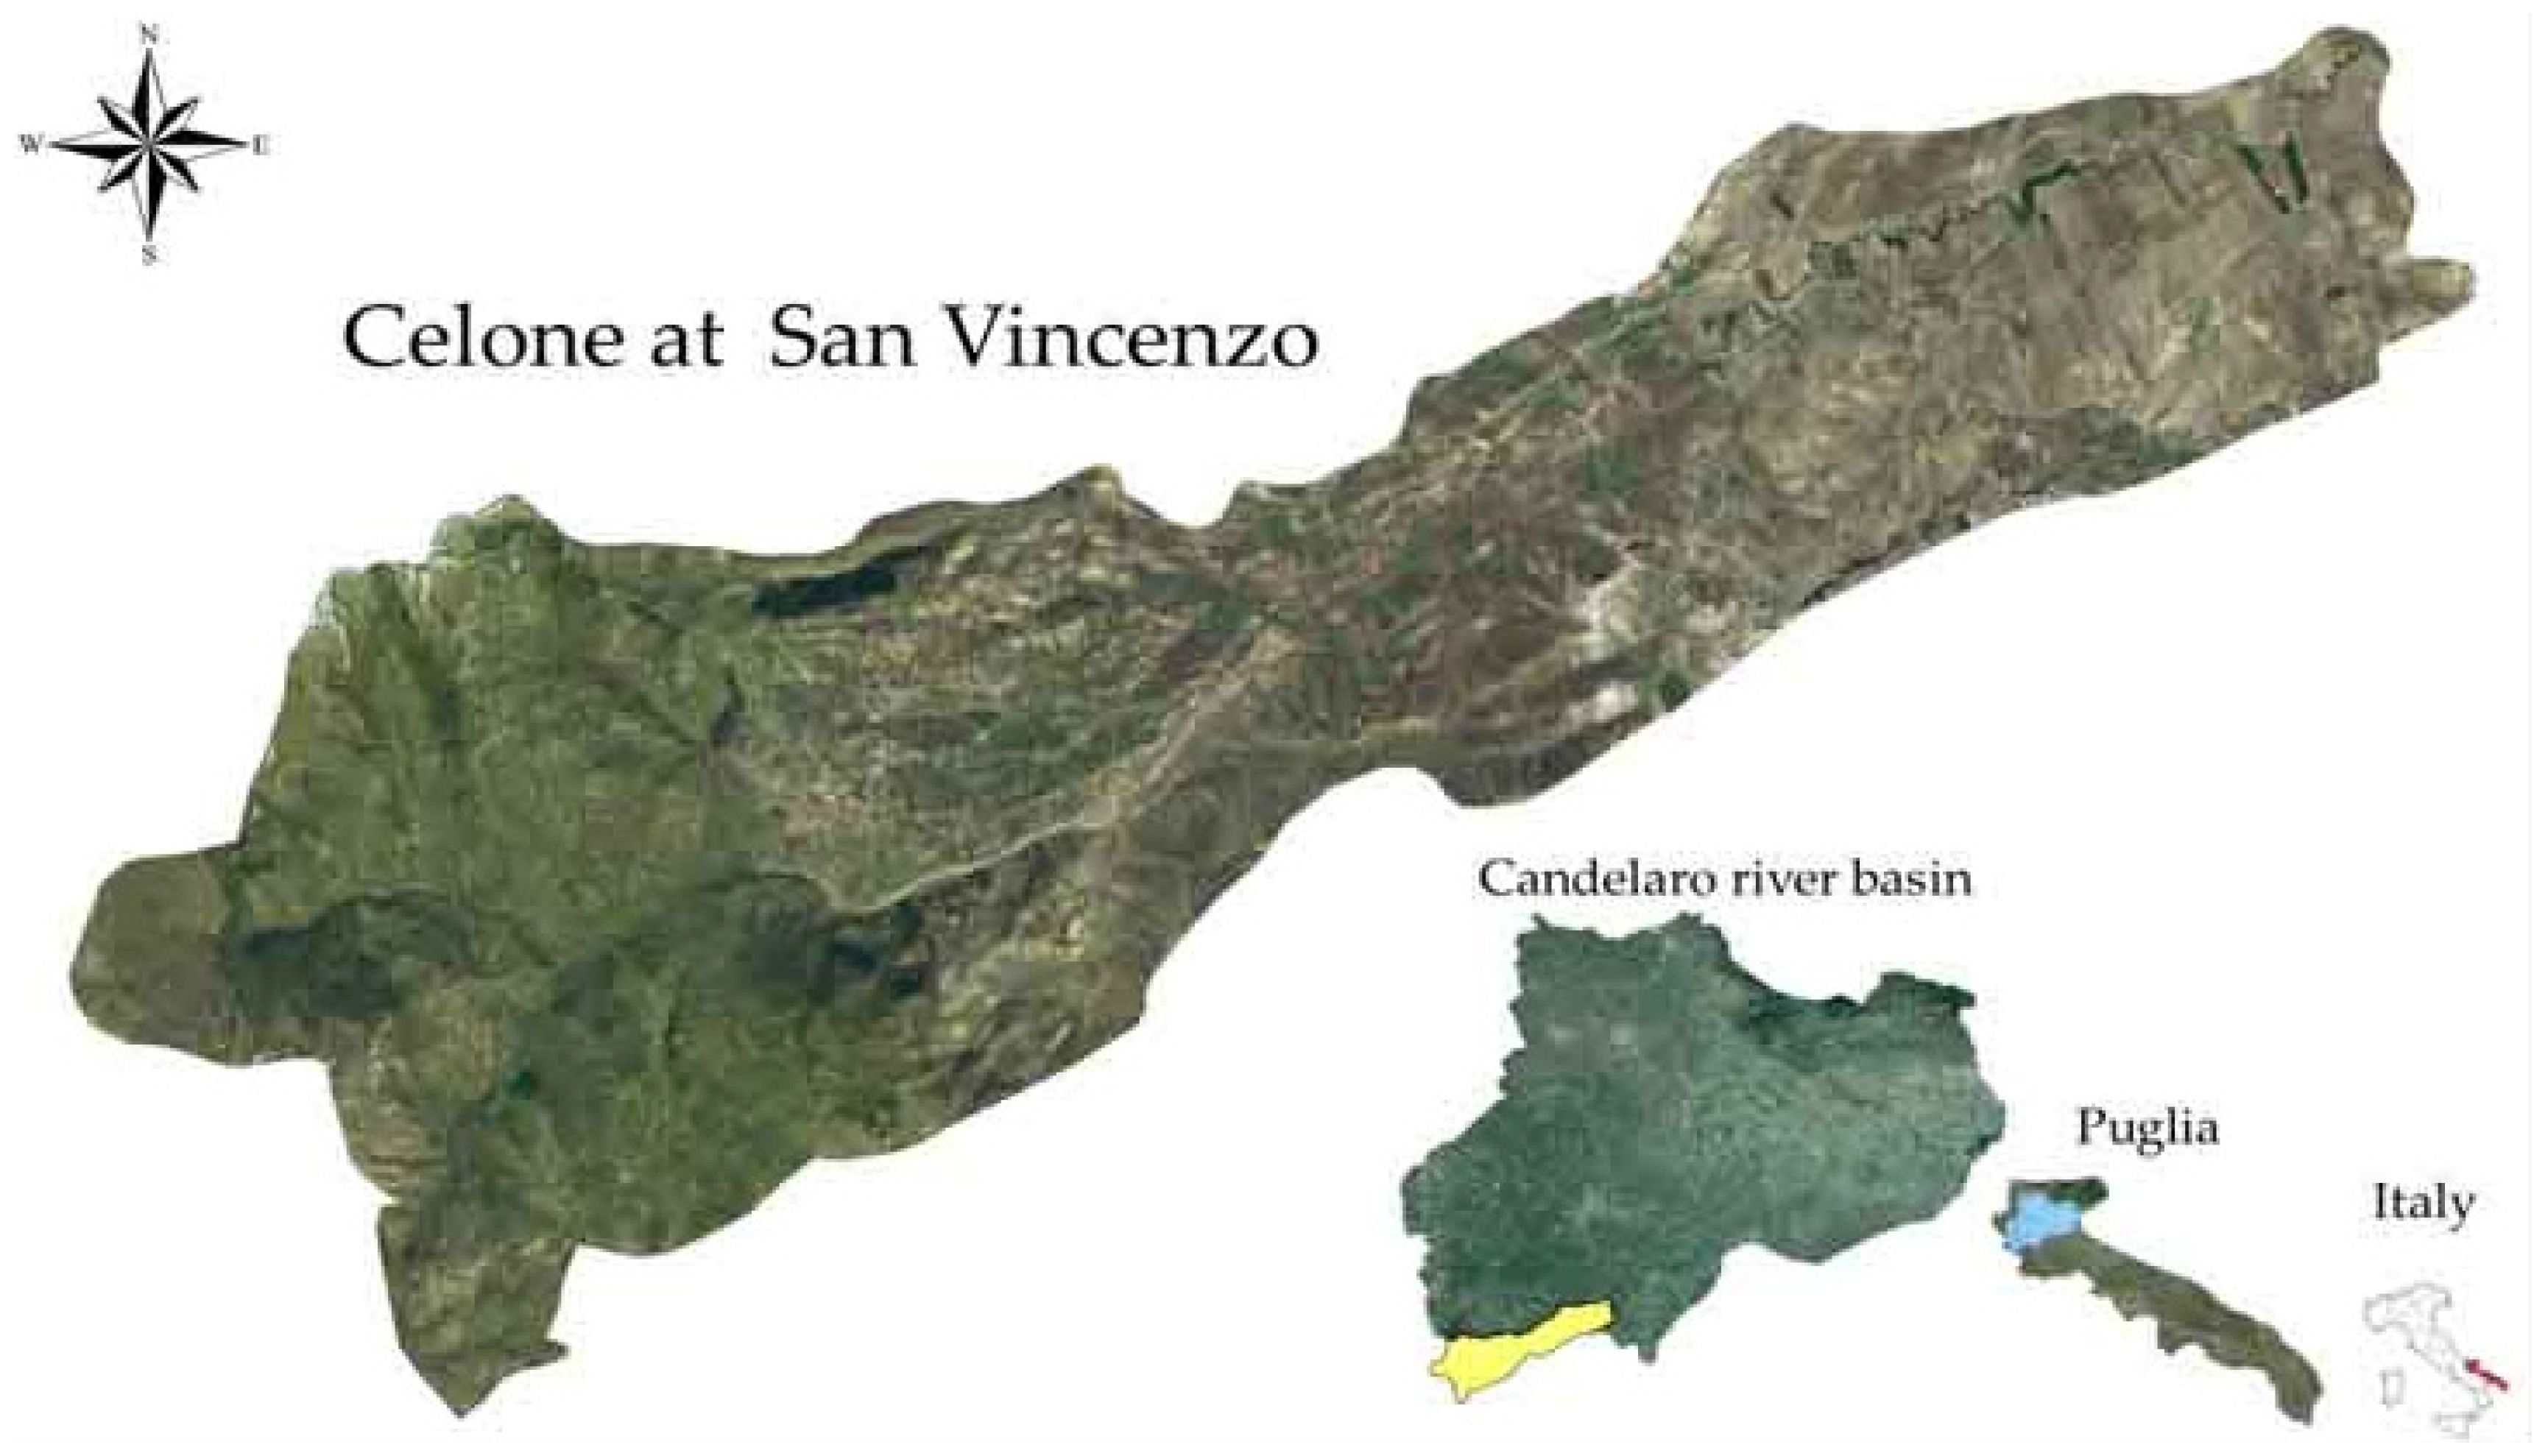
The area chosen as the case study is the Celone river basin, an agricultural watershed located in the northern part of Puglia in Southern Italy. Celone is one of the most important tributaries of the Candelaro river basin (Figure 2), with a total basin area of 92 km2. The main river course has a length of about 59 km and the average basin altitude is 532 m, with maximum and minimum altitudes of 1152 m and 188.49 m, respectively [35].
The watershed is characterized by a typical Mediterranean climate, with warm to hot, dry summers and mild, wet winters. Precipitation events are often characterized by heavy rain, with a high intensity during a short period of time [36,37]; rainfall is unevenly distributed and often occurs as convective thunderstorms [38,39,40,41]. The Celone at San Vincenzo sub-basin is situated in mountainous areas characterized by Flyschoid formations. Soils predominantly belong to the class of Entisols [42] or Fluvisols [43] and have a fine clayey–loamy texture, low organic matter content, poor natural fertility and lower water-holding capacity. The Celone watershed is characterized by intensive agriculture. This area is one of the main zones for the production of durum wheat (75% of the total basin area), followed by broad-leaved forest (5%), annual crops (4%), land principally occupied by agriculture with areas of natural vegetation (3%) and olive groves (2.7%) [30]. The residential area covers less than 2% of the whole area [44]. Deciduous and mixed forests are present at the highest elevations where some pasture lands can be found. Industrial activity is not relevant in this area. The irrigation in the plain part of the watershed is managed by a local authority “Consorzio per la Bonifica della Capitanata” of Foggia (CBC), that provides irrigation water on demand through a pipeline network. In the areas equipped with the irrigation systems, the durum wheat is cultivated in rotation with tomatoes or sugar-beet. The sowing date for the tomatoes is generally in late April or after the harvesting of durum wheat in the rotation. A marked differentiation exists between seasonal and permanent vegetation (for instance between winter wheat and olives) [45]. During the winter season, the watershed is covered almost completely by rainfed cereal durum wheat. Planting is generally in November, while harvesting occurs during spring, according to the weather conditions. Tree crops, such as olives, grapes and citrus, have lower percentages of vegetation ground cover [30,44].

2.3. Satellite Data

Land Use Data Classifications

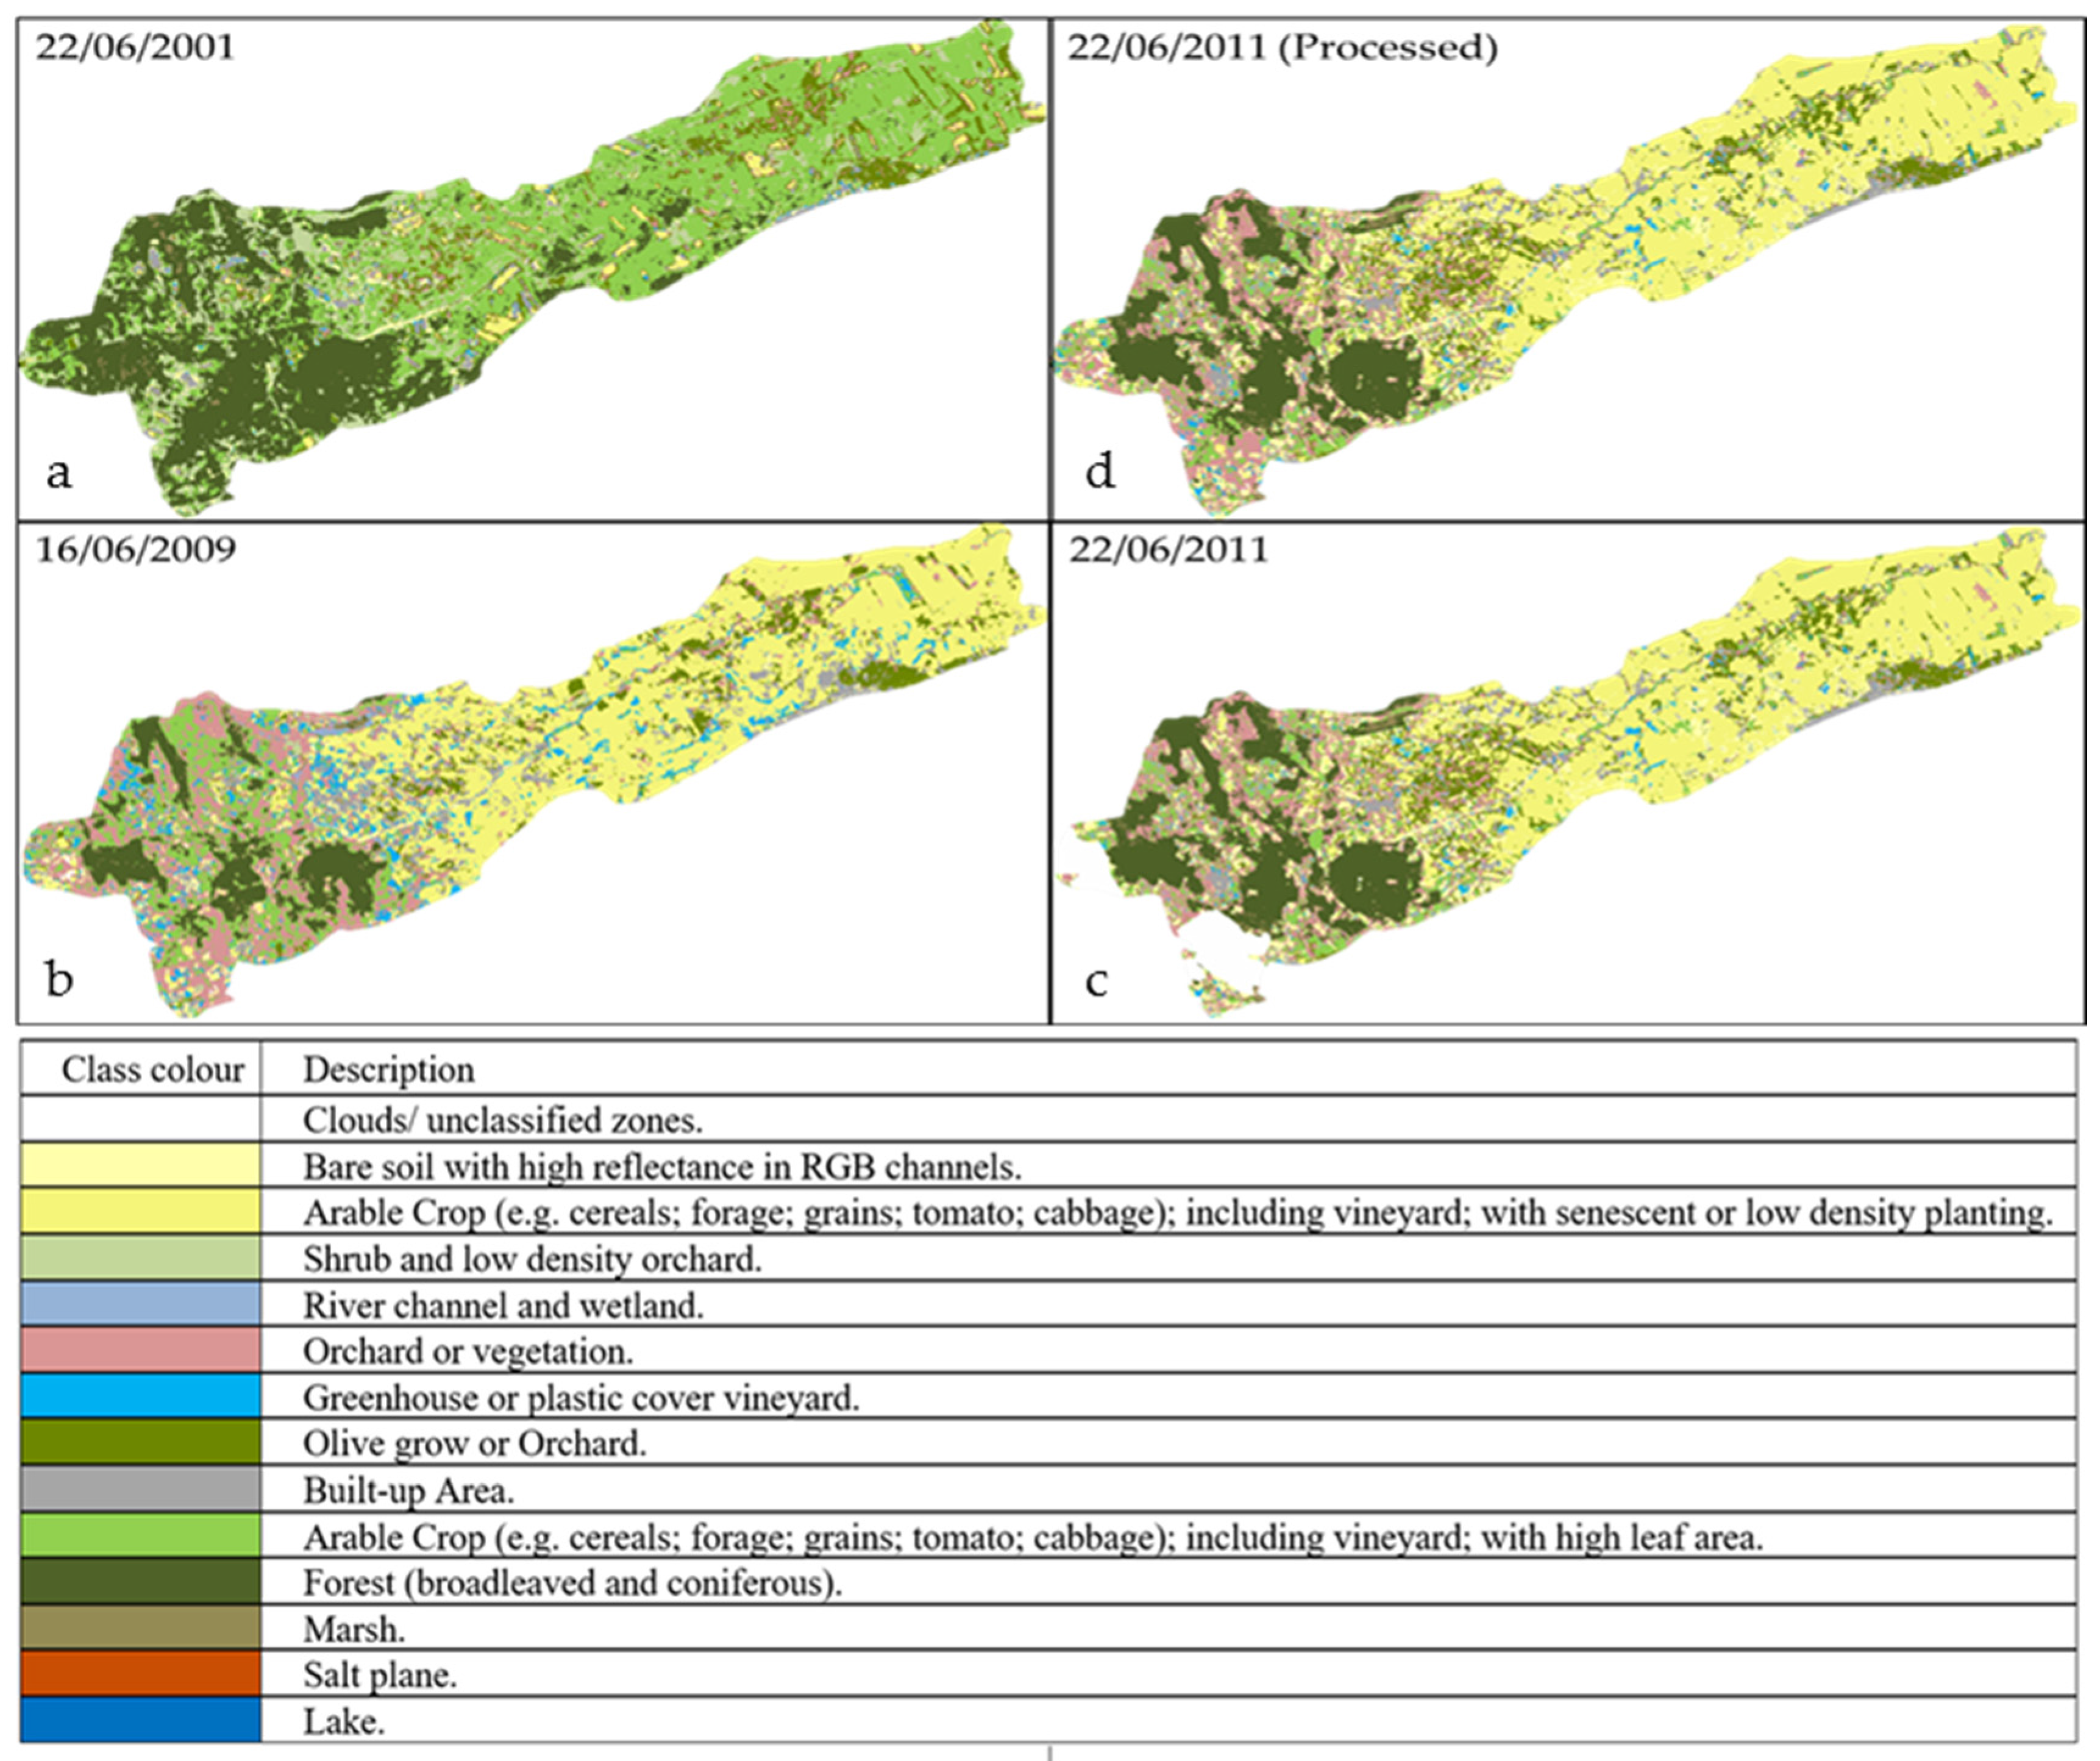
With the current availability of global spatial datasets, a common way to map land cover changes is through satellite image classifications [38,46,47,48,49]. During the past decade, scientific literature has shown different approaches to achieve this task, and the Artificial Neural Network Classification (ANNC) is nowadays a common supervised tool to obtain thematic information from satellite data. In this study, the thematic information of the basin area was extracted from ANNCs of Landsat data. Particularly, the classifications were provided by a previously performed study [50] from which the basin area thematic information was extracted. The selected scenes were characterized by a geometric resolution of 30 m, a dynamic range of 8 bit and a cartographic projection (UTM WGS84 Zone 33N). Table 1 shows the selected Landsat scenes.
Before the classification stage, each scene was pre-processed to maximize the classification performance in each scene:
  • The digital numbers were converted to top of atmosphere reflectance and then further corrected for sun elevation angle by using the information stored in each scene metadata. This is a standard procedure suggested by the United States Geological Survey (USGS).
  • The dark object subtraction procedure [51] was adopted to reduce atmospheric artifacts.
  • The corrected data were used to create synthetic bands as input for the ANNC. Particularly, for this purpose we used the principal component analysis outputs, the tasseled cap, brightness temperature and vegetation indices.
The use of synthetic bands proved useful as demonstrated by the results. A complete description of the Landsat data computation is beyond the scope of this paper; however, further details for the ANNC procedure can be found in [46,50], which followed the same classification procedure (Figure 3).
The Leaf Area Index (LAI) use in agricultural management is an active topic in the scientific community [50,52,53]. The level-4 MODIS global LAI and Fraction of Photosynthetically Active Radiation (FPAR) product (MOD15A2) is provided every 8 days at 1-km resolution on a Sinusoidal grid. Science Data Sets available in the MOD15A2 dataset include LAI, FPAR, a quality rating and standard deviation for each variable. Version-5 MODIS/Terra LAI products are “Validated Stage 2”; accuracy has been assessed over a widely distributed set of locations and time periods via several ground-truth and validation efforts [54]. MODIS LAI data images were collected over a timespan of fifteen years (2000–2014) to characterize the changes in land vegetation cover. Lastly, using the capabilities of the MODIS Reprojection Tool [55], the data were projected in the cartographic reference system WGS 84 zone 33 Nord from the original MODIS Sinusoidal Projection System.

2.4. Economic Data

The EU Farm Accountancy Data Network (FADN) database is a system of sample surveys conducted each year to collect structural and accounting data on farms in the EU Member States. The aim is to monitor the income and business activities of agricultural holdings and to evaluate the impacts of the CAP [56]. The FADN surveys only include farms exceeding a minimum economic size (threshold) so as to cover the most relevant part of each Member State’s agricultural activity, that is around 90% of the standard output and 90% of the utilized agricultural area covered in the Farm Structure Survey [57]. The data are extensive and cover most farming activities (Table 2), but production costs are recorded only on sample farms and are aggregated [56]. To cover the study period 2000–2014, the price records were obtained from the Eurostat database since the FADN data only start in 2004. For consistency, each data set was used separately.

2.5. CAP’s Storyline

Over the past two decades, the CAP has been reformed considerably. The most important CAP reforms for the scope of our study began in 1992 and intensified in 2003. The MacSharry reforms decreased the level of market price support and introduced a concept of direct support, which gave prices a stronger role in determining production, by dissociating the subsidies and production. In other words, to receive subsidies, farmers are no longer obliged to produce specific crops, sometimes for which there is no market. Instead, they are now free to produce what the market and consumers need, and to be market driven. The Agenda 2000 reforms made a further reduction in market distortions and introduced an environmental focus. In 2003, other reforms were marked by decoupling almost all direct payments from production to give a clearer market signal to farmers. Indeed, the exceptional CAP interventions in 2008 to 2011, implemented in order to recover from the relatively high increase in the cereal price, helped mitigate the shortages in the EU cereal market and increased supply to the market and thus reduced prices. On 16 July 2007, the European Commission announced its intention to publish a proposal to reduce the set-aside requirement to 0% in 2008, and the proposal was adopted on 26 September 2007. This was to help mitigate current shortages in the EU cereal market, increase cereal supply to the market and therefore decrease prices, following two consecutive lower EU harvests [58,59]. The European Commission agreed in November 2008 to abolish set-aside completely through the CAP Health Check [60]. In addition, farmers now receive income support, provided they look after their farmland and meet food-safety, environmental and animal welfare standards. While these reforms have led to important changes in farmers’ accountability, the CAP total budget has remained fixed over the past 15 years (around €50 billion). The coupled direct payments decreased from 77% of total CAP payments in 2004 to 15% in 2008; decoupled payments grew from 3% to 68% and rural payments from 15% to 18% [57].
The new Common Agriculture Policy of the European Union places particular importance on the green economy, environmental quality and the development of a competitive EU agriculture sector. This should be achieved through a reduction of subsidies while producing high quality products at acceptable prices [61]. Attaining sustained and reasonable farm income for the EU farmers and defining their position in the global food market is crucial. However, this has to be achieved while managing soil and water resources sustainably, improving air quality, protecting the biodiversity of the European farmlands, adjacent landscapes and supporting climate action. Achieving this will be one of the greatest challenges faced by the EU over the next decade. From 2015 onwards, CAP will introduce a new policy instrument in Pillar 1, otherwise known as the Green Direct Payment. This accounts for 30% of the national direct payment envelope and will reward farmers for respecting three obligatory agricultural practices, such as the maintenance of permanent grassland, creation of ecological focus areas and diversification of crops. As the green direct payment is compulsory, it has the advantage of introducing practices that are beneficial for the environment and climate change mitigation on most of the utilized agricultural area [61].

3. Results

3.1. Land Use Analysis

Due to year-to-year seasonality, the three LANDSAT images used may induce uncertainty in classification. To solve this issue, a preliminary classification was made, which aggregated vegetation types, forest and agricultural areas into one class as shown in Table 3.
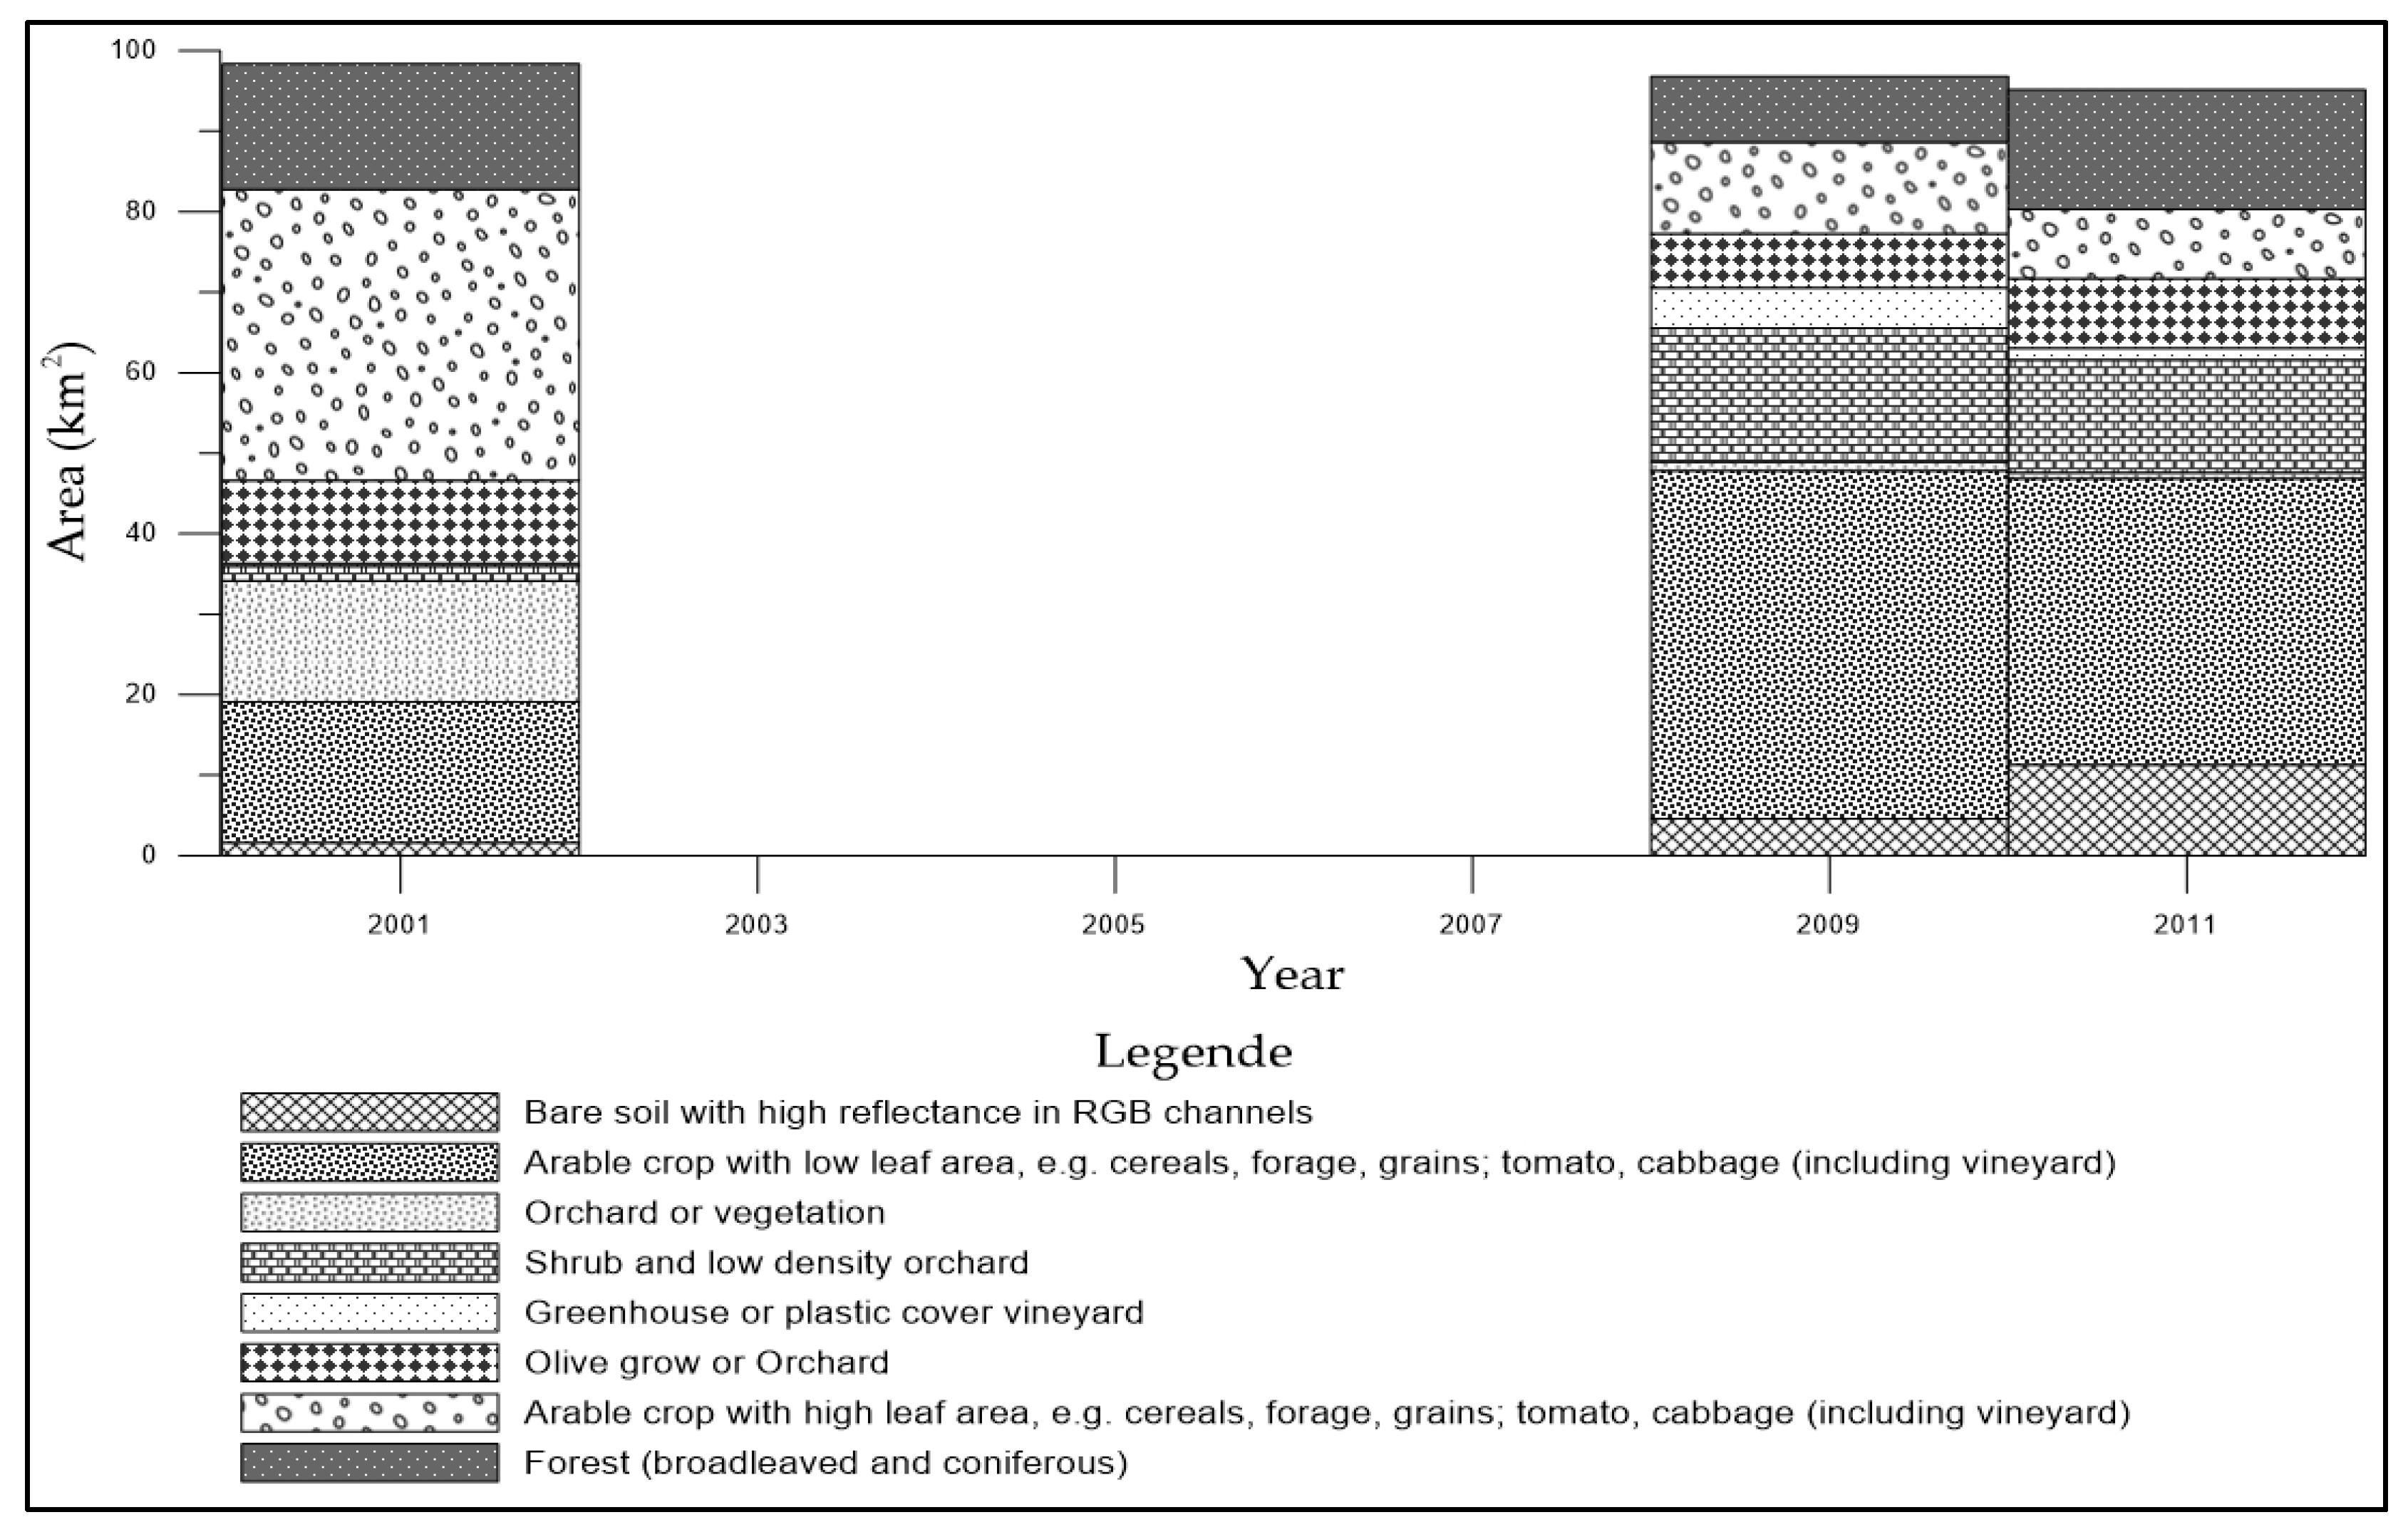
As expected, more than 90% of the area has vegetal cover, which is subjected to variability. In addition, we observe in (Table 3) a slight but significant decrease in the Agricultural and Forests area (<3%), compensated mainly by an increase of the built area. In a second step, we split the “Agricultural and forests area” class into subclasses, to focus on seasonal cover variation and agricultural land allocation. Results are shown in Table 4 and Figure 4.
The percentage of the bare soil shows a level of 12% in the last year (2011), with an overall increase of 10% compared to 2001. It cannot be determined from the images whether it is land abandoned or set-side. Nevertheless, an overall view for the two periods 2001–2009 and 2009–2011 shows inverse change of all the subsets, except for the bare soil class, which always increases and Arable crop with high LAI, which always decreases.

3.2. Economic Analysis

According to The European Commission (2014), on average, the EU farms devoted 19 ha of their total land area of 32 ha to durum wheat in 2011. This average is mainly influenced by the many Italian farms that use more than 15 ha of their total land to produce durum wheat, considering that other EU durum wheat farms are much bigger, but less specialized [62]. Table 2 reports data from the entire Italian production in the accounting years 2004–2012.
From 2004 to 2012, Italian farms’ durum wheat yield per ha increased by 15%, in opposition with the production, which showed a negative trend. Nonetheless, the production negative trend was not constant and in 2008–2009 production became almost stable in accordance with the market price. Accordingly, the area dedicated was in constant decrease, with an overall reduction of 24% between 2004 and 2012. In 2007, the price of durum wheat went up from around 150 €/t to more than 300 €/t (Table 2). In particular, prices in Italy were systematically above the EU average [62].
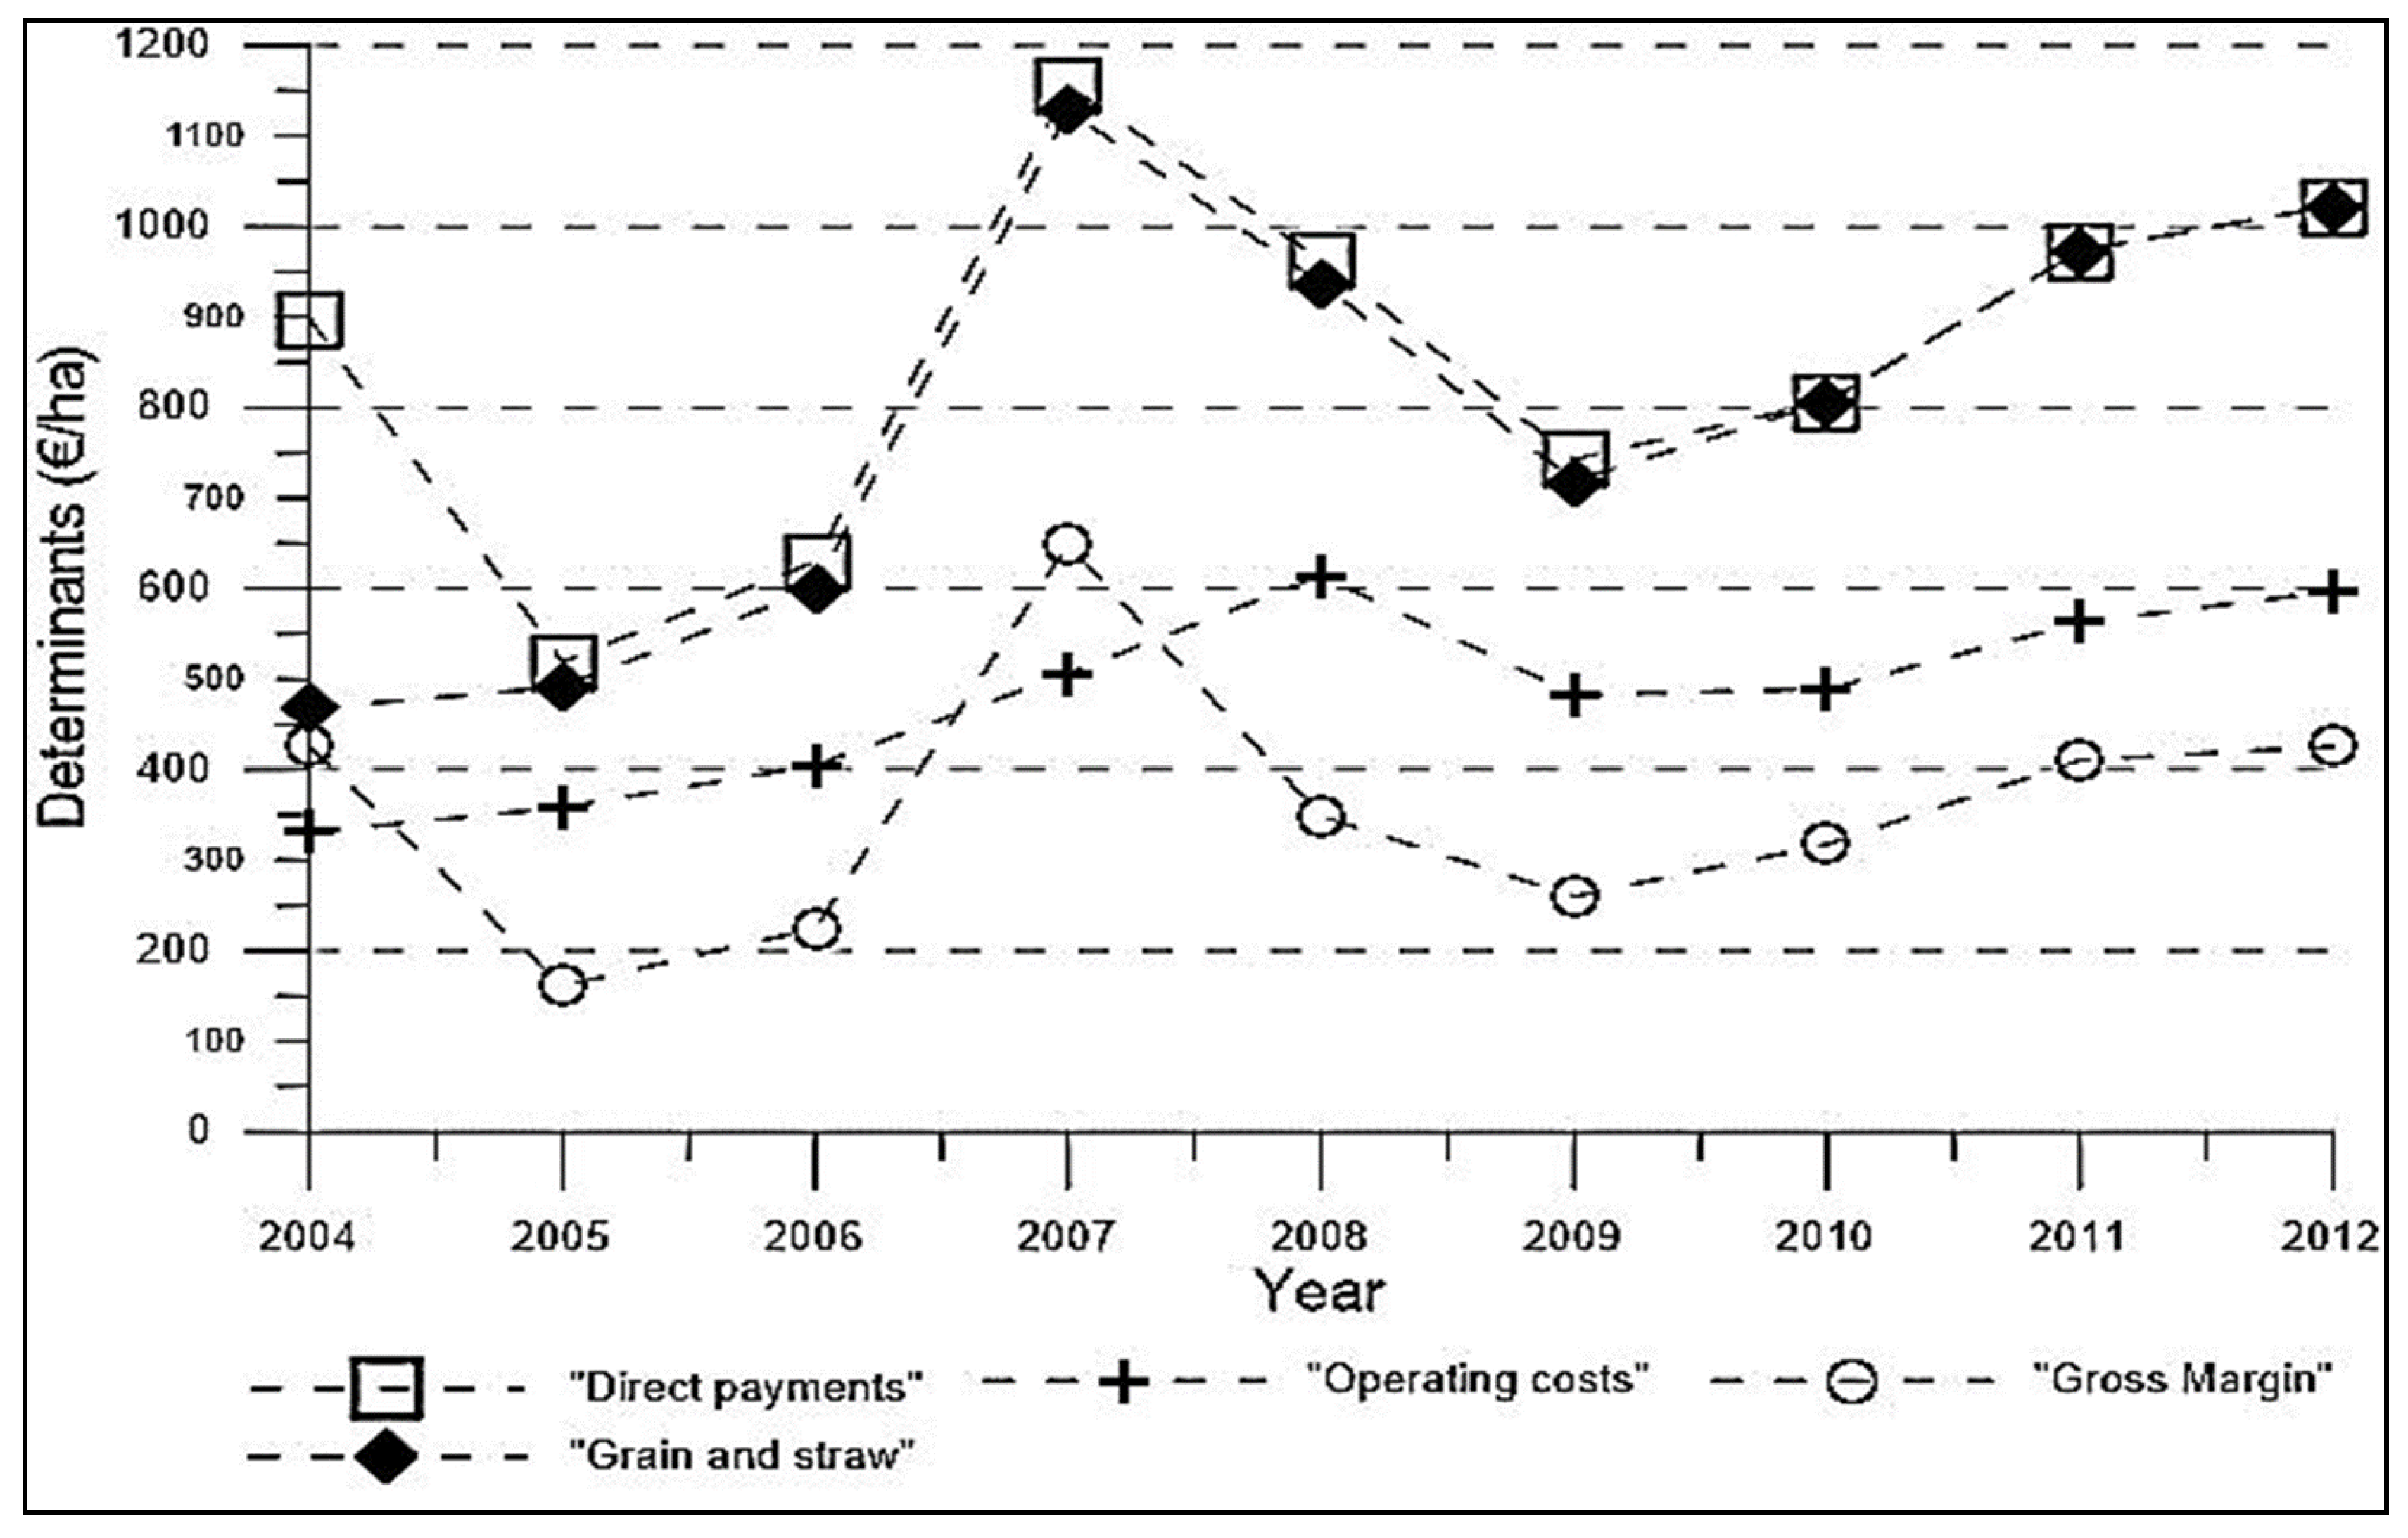
The estimated total operating costs for producing durum wheat, including the cost for seed, fertilizers, crop protection, and others, peaked in 2008 (Figure 5) when they neared 600 €/ha. This growth was significant (+74% in five years), but the relatively high prices seen in 2007–2008 balanced the increase in operating costs. The increase was mainly induced by the costs of fertilizers, fuel and energy (Table 2). In contrast, the costs of seeds and plant protection products were relatively stable. Producers also faced consistently higher costs in 2011 and 2012. Both specific and non-specific costs were above average, with higher expenditure for fuel and contract work [62].

3.3. Vegetation Cover Changes Analysis

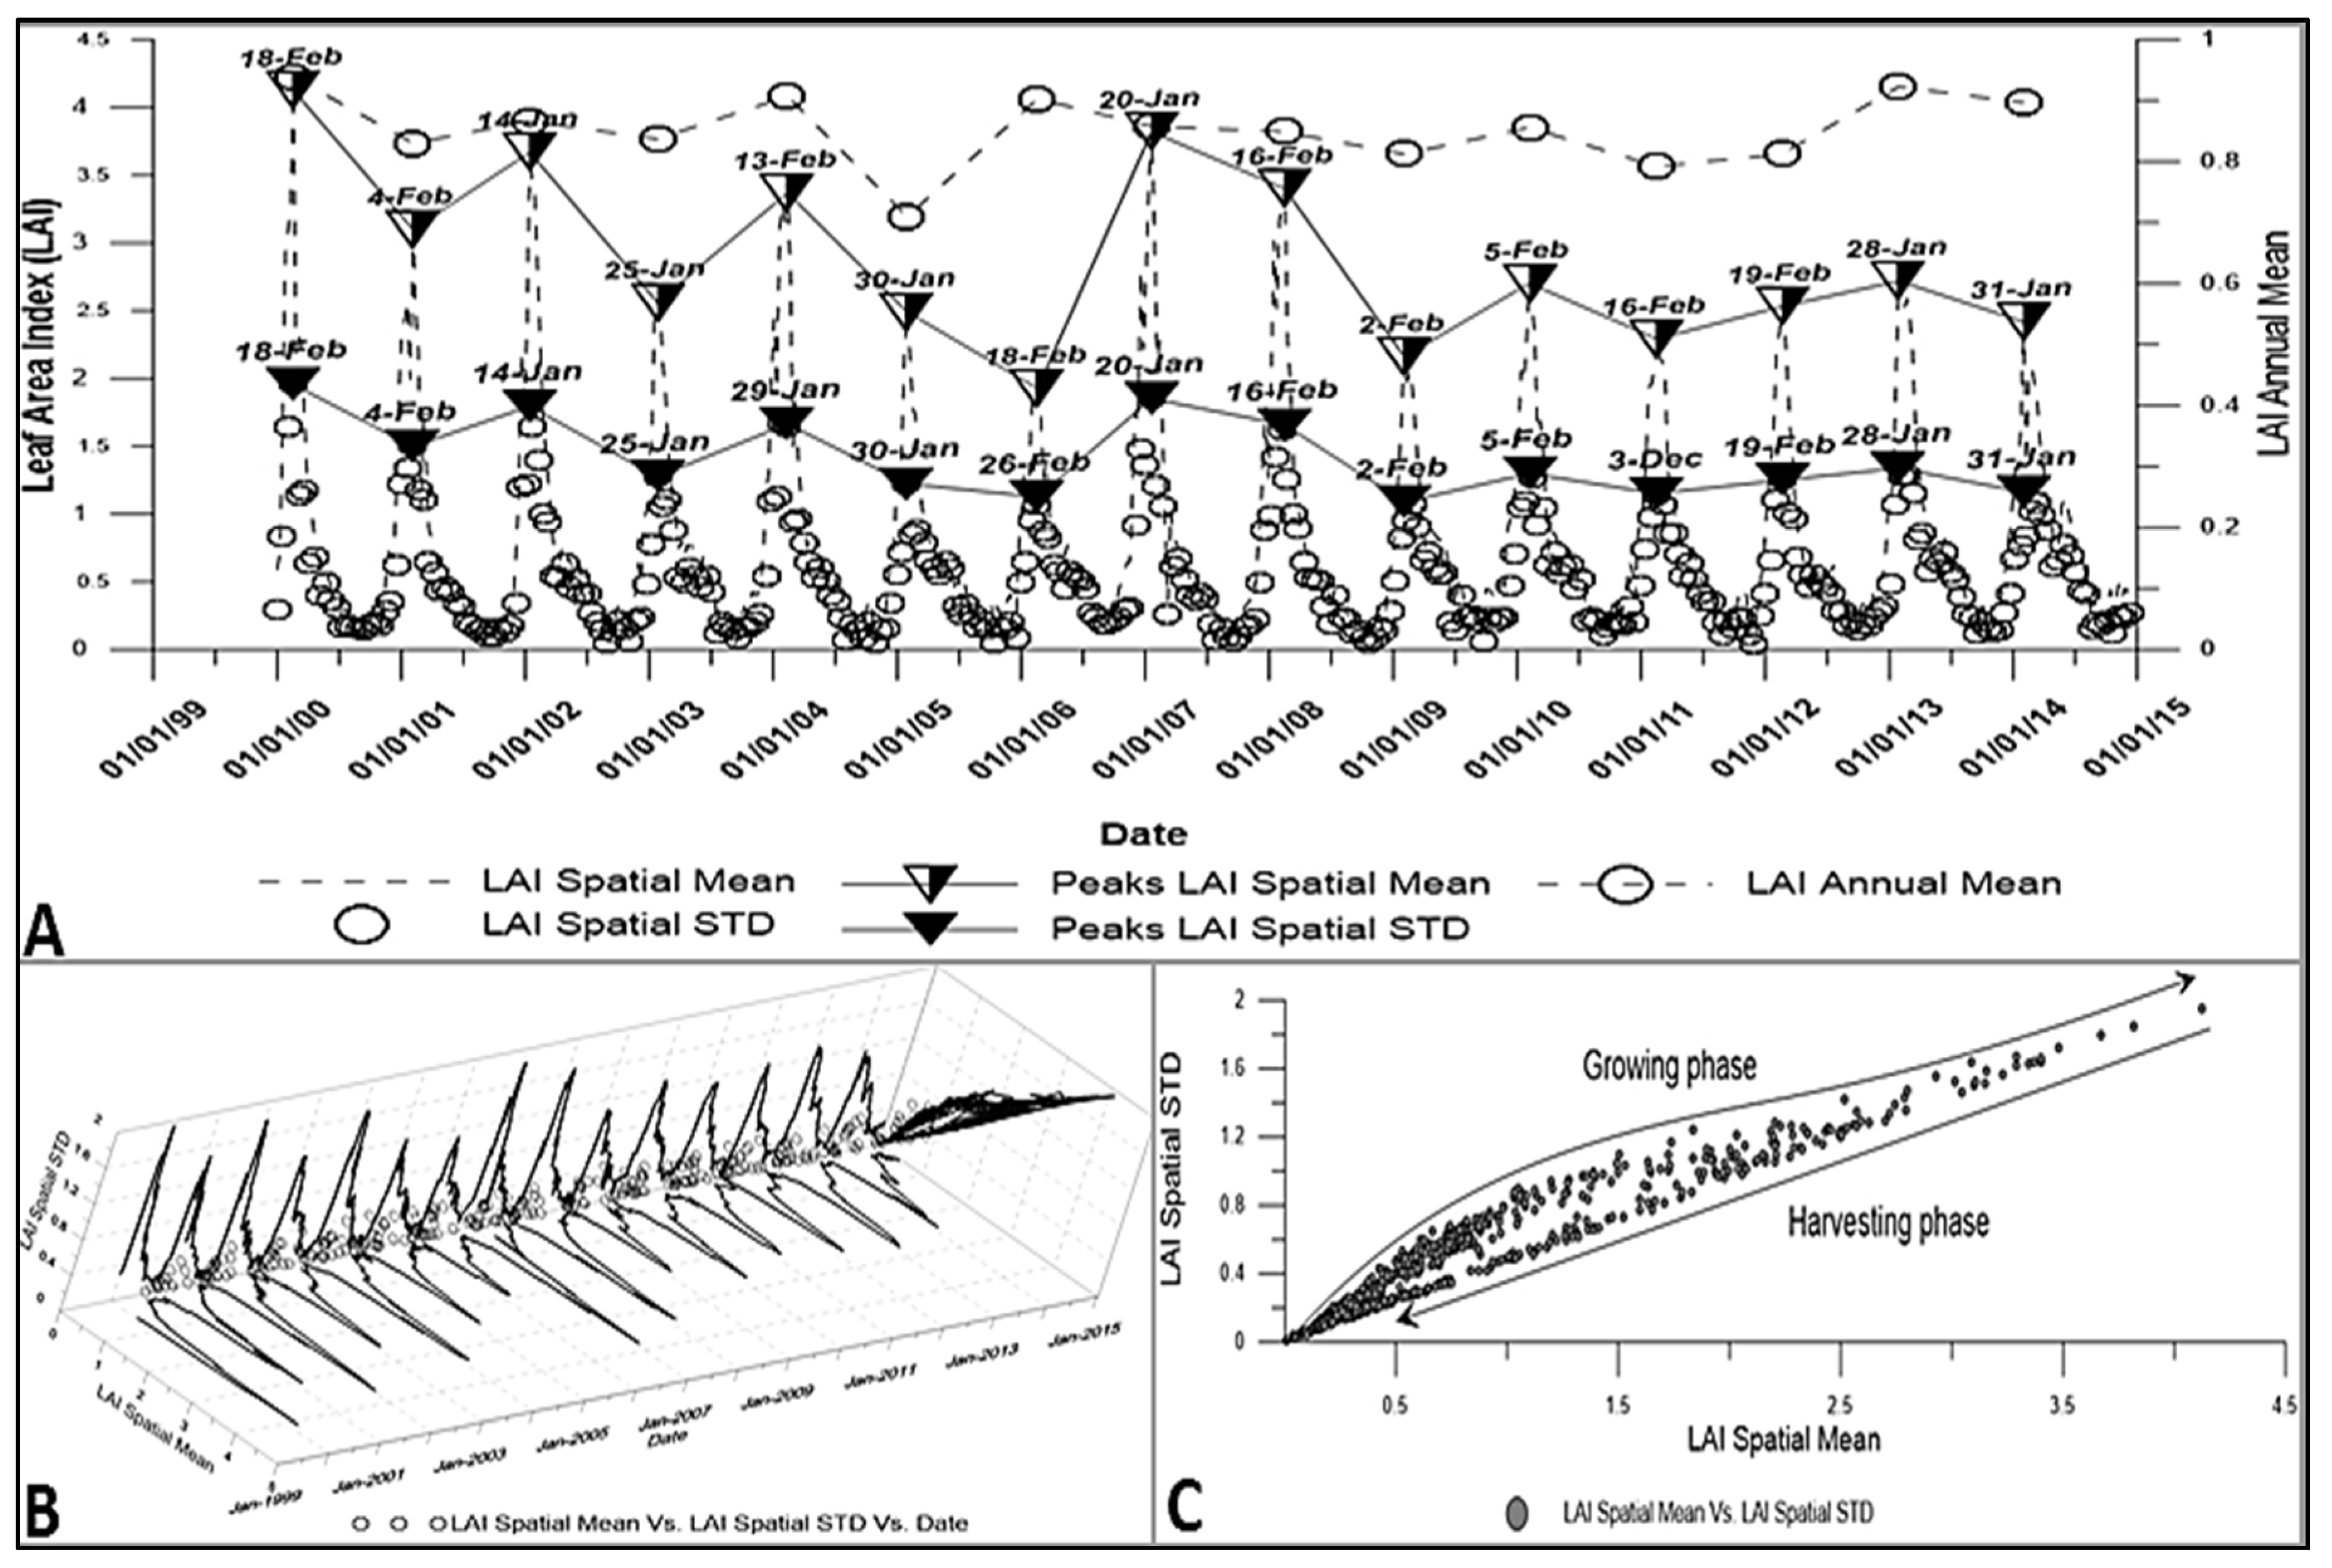
The extensive database collected allows a precise analysis of LAI variability in time and space, which can be related to durum wheat cultivation. Figure 6A,B show the spatial average of the 8-days LAI images and their standard deviation (LAI Spatial Mean and LAI Spatial STD, respectively) for the entire watershed, the annual peaks of the same quantities and the LAI annual mean values. This LAI behavior depends on climatic variables (annual and monthly rainfall amounts), land cover and geomorphology, and anthropic factors related to agronomic practices. On the other hand, the LAI annual mean shows a dropdown in 2005 but not a marked general trend (Figure 6A), denoting that at the annual scale, the heterogeneity in vegetation cover and local effects prevails in interannual climatic forcing. Consistently, it has been already observed in this region, that the LAI Spatial Mean behavior in time is affected more by mean temperature and rainfall monthly distribution than by annual rainfall amount [31]. In addition, (Figure 6C) shows a combined plot of LAI Spatial Mean and LAI Spatial STD. Analyzing the correlation with respect to time (Figure 6B), we observe two distinctive relationships. A nonlinear relationship during the growing phase characterized by a convex shape, where the main intra-annual divergence between LAI Spatial Mean and LAI Spatial STD is found in the earlier growth stage of durum wheat, i.e., in January and February, the crucial months in the vegetative period that provide the minimum annual temperature and a significant fraction of the total annual rainfall amount [31]. A linear relationship is found after the peaks i.e., in the harvesting phase.
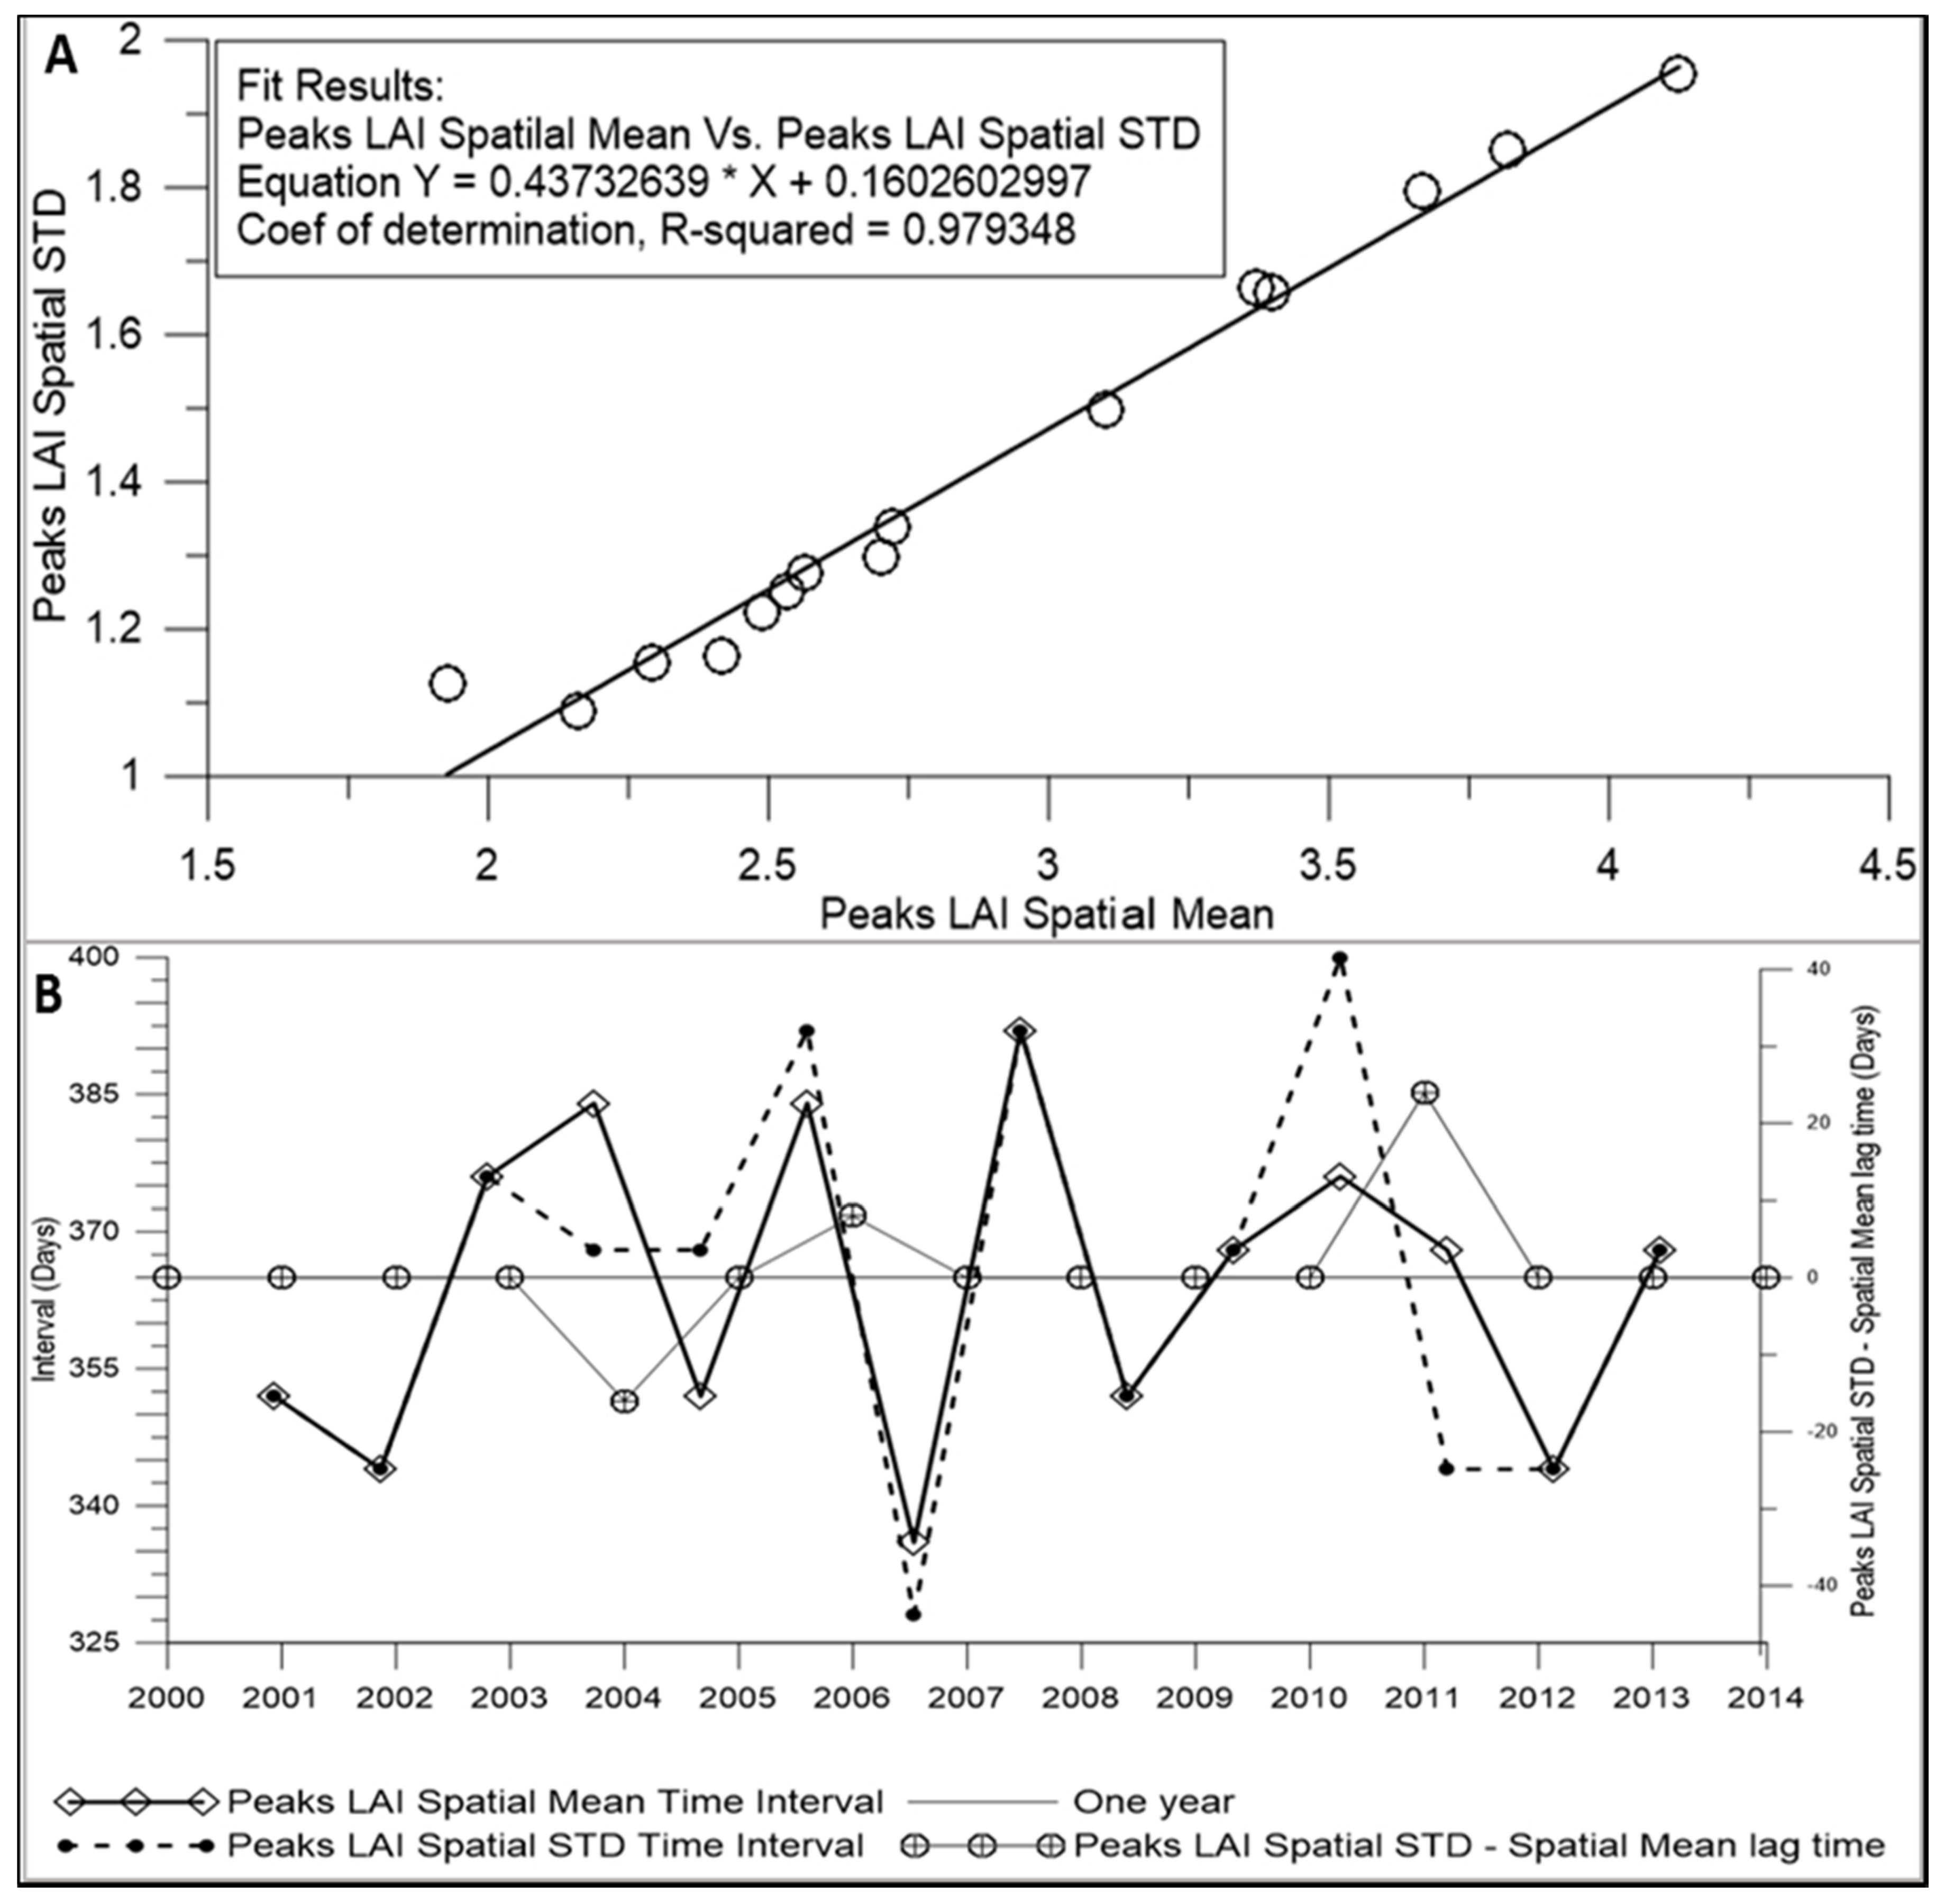
It is interesting to note that the annual peak values of LAI Spatial Mean and LAI Spatial STD are highly correlated, with a coefficient of determination R2 = 0.98 (Figure 7A). During these fifteen years, another interesting feature of the LAI Spatial Mean and LAI Spatial STD lag-time is shown in Figure 7B; we note that they are almost systematically synchronized (i.e., they occur in the same image) except for three times (2004, 2006 and 2011) with a maximum lag of 24 days observed in 2011. Negative values are relative to Peak LAI Spatial STD anticipated with respect to Peak LAI Spatial Mean and vice versa for positive lags. Mainly due to the crop acreage, the farmers kept the same practices in term of crop choice and rotation. The Peak LAI Spatial Mean and Peak LAI Spatial STD time interval plots show the number of days separating two successive peaks of both Peak LAI Spatial Mean and Peak LAI Spatial STD series, respectively. This variation is mainly due to the farmers’ decision and scheduling. Points above the 365-days threshold indicate delayed peaks with respect to the previous year, and, inversely, points below the 365-days threshold. A significant anticipation is observed in 2007, where the peak is anticipated by one month earlier with respect to the previous one.

3.4. Comparative Analysis

3.4.1. CAP’s Effect on Land Use and Production

The decoupled payments were introduced to reduce the interactions between CAP support and farmers’ production decisions, and therefore, increase the role of market forces as a driver of farmers’ decisions. The reforms have reduced trade distortions due to the strong influence of prices on profitability; the CAP’s intervention influenced the Celone farmers’ land use decision-making and production.
With an increase in productivity and a decrease in agricultural land allocated, CAP’s reforms led to an agricultural intensification phenomenon. Indeed, the decrease in total agricultural land between 2001 and 2011, the level of bare soil in 2011 and the intensification of the durum wheat cultivation are in accordance with the CAP’s preset objectives. The intensification occurred as a result of a combination between an increase in market demand for cereals and the exposure to the market by decoupling payments from the production.

3.4.2. Market State and CAP’s Reforms

As CAP subsidies play an important role in farm profitability and income [16,63], and because of the price peak in 2007 where the EU grain market experienced higher prices, the CAP has strengthened the link between the market demand and production by moving away from supporting product prices to supporting producers’ income. The CAP interventions in 2008 led to a supply response to the market demand. Despite the high operating and costs, cereal production increased significantly over this short period. What is of interest is where this supply response took place immediately after the cereal price shock. There was a very significant jump, partly due to the set-aside suspension in 2008. There is a clear upward shift in the trend rate of growth in cereal production in response to higher prices. This observation confirms the role of “Mediating variable” that the CAP plays between the market and producer.

3.4.3. LAI and Durum Wheat Price Changes Relationships

The principal insights are drawn from the comparison of the previous LAI and the durum wheat prices changes. First, due to the small size of the wheat fields (i.e., 16 ha on average), this reduction of the durum wheat area is reflected in the reduction of the peak LAI Spatial mean as measured at the 1 km pixel size. Furthermore, as argued by [64,65,66], the area allocated depends on all output and input prices related to the crop cultivated. Thus, the areal extent is a result of an optimization problem where the operating costs act as a distinctive constraint equation.
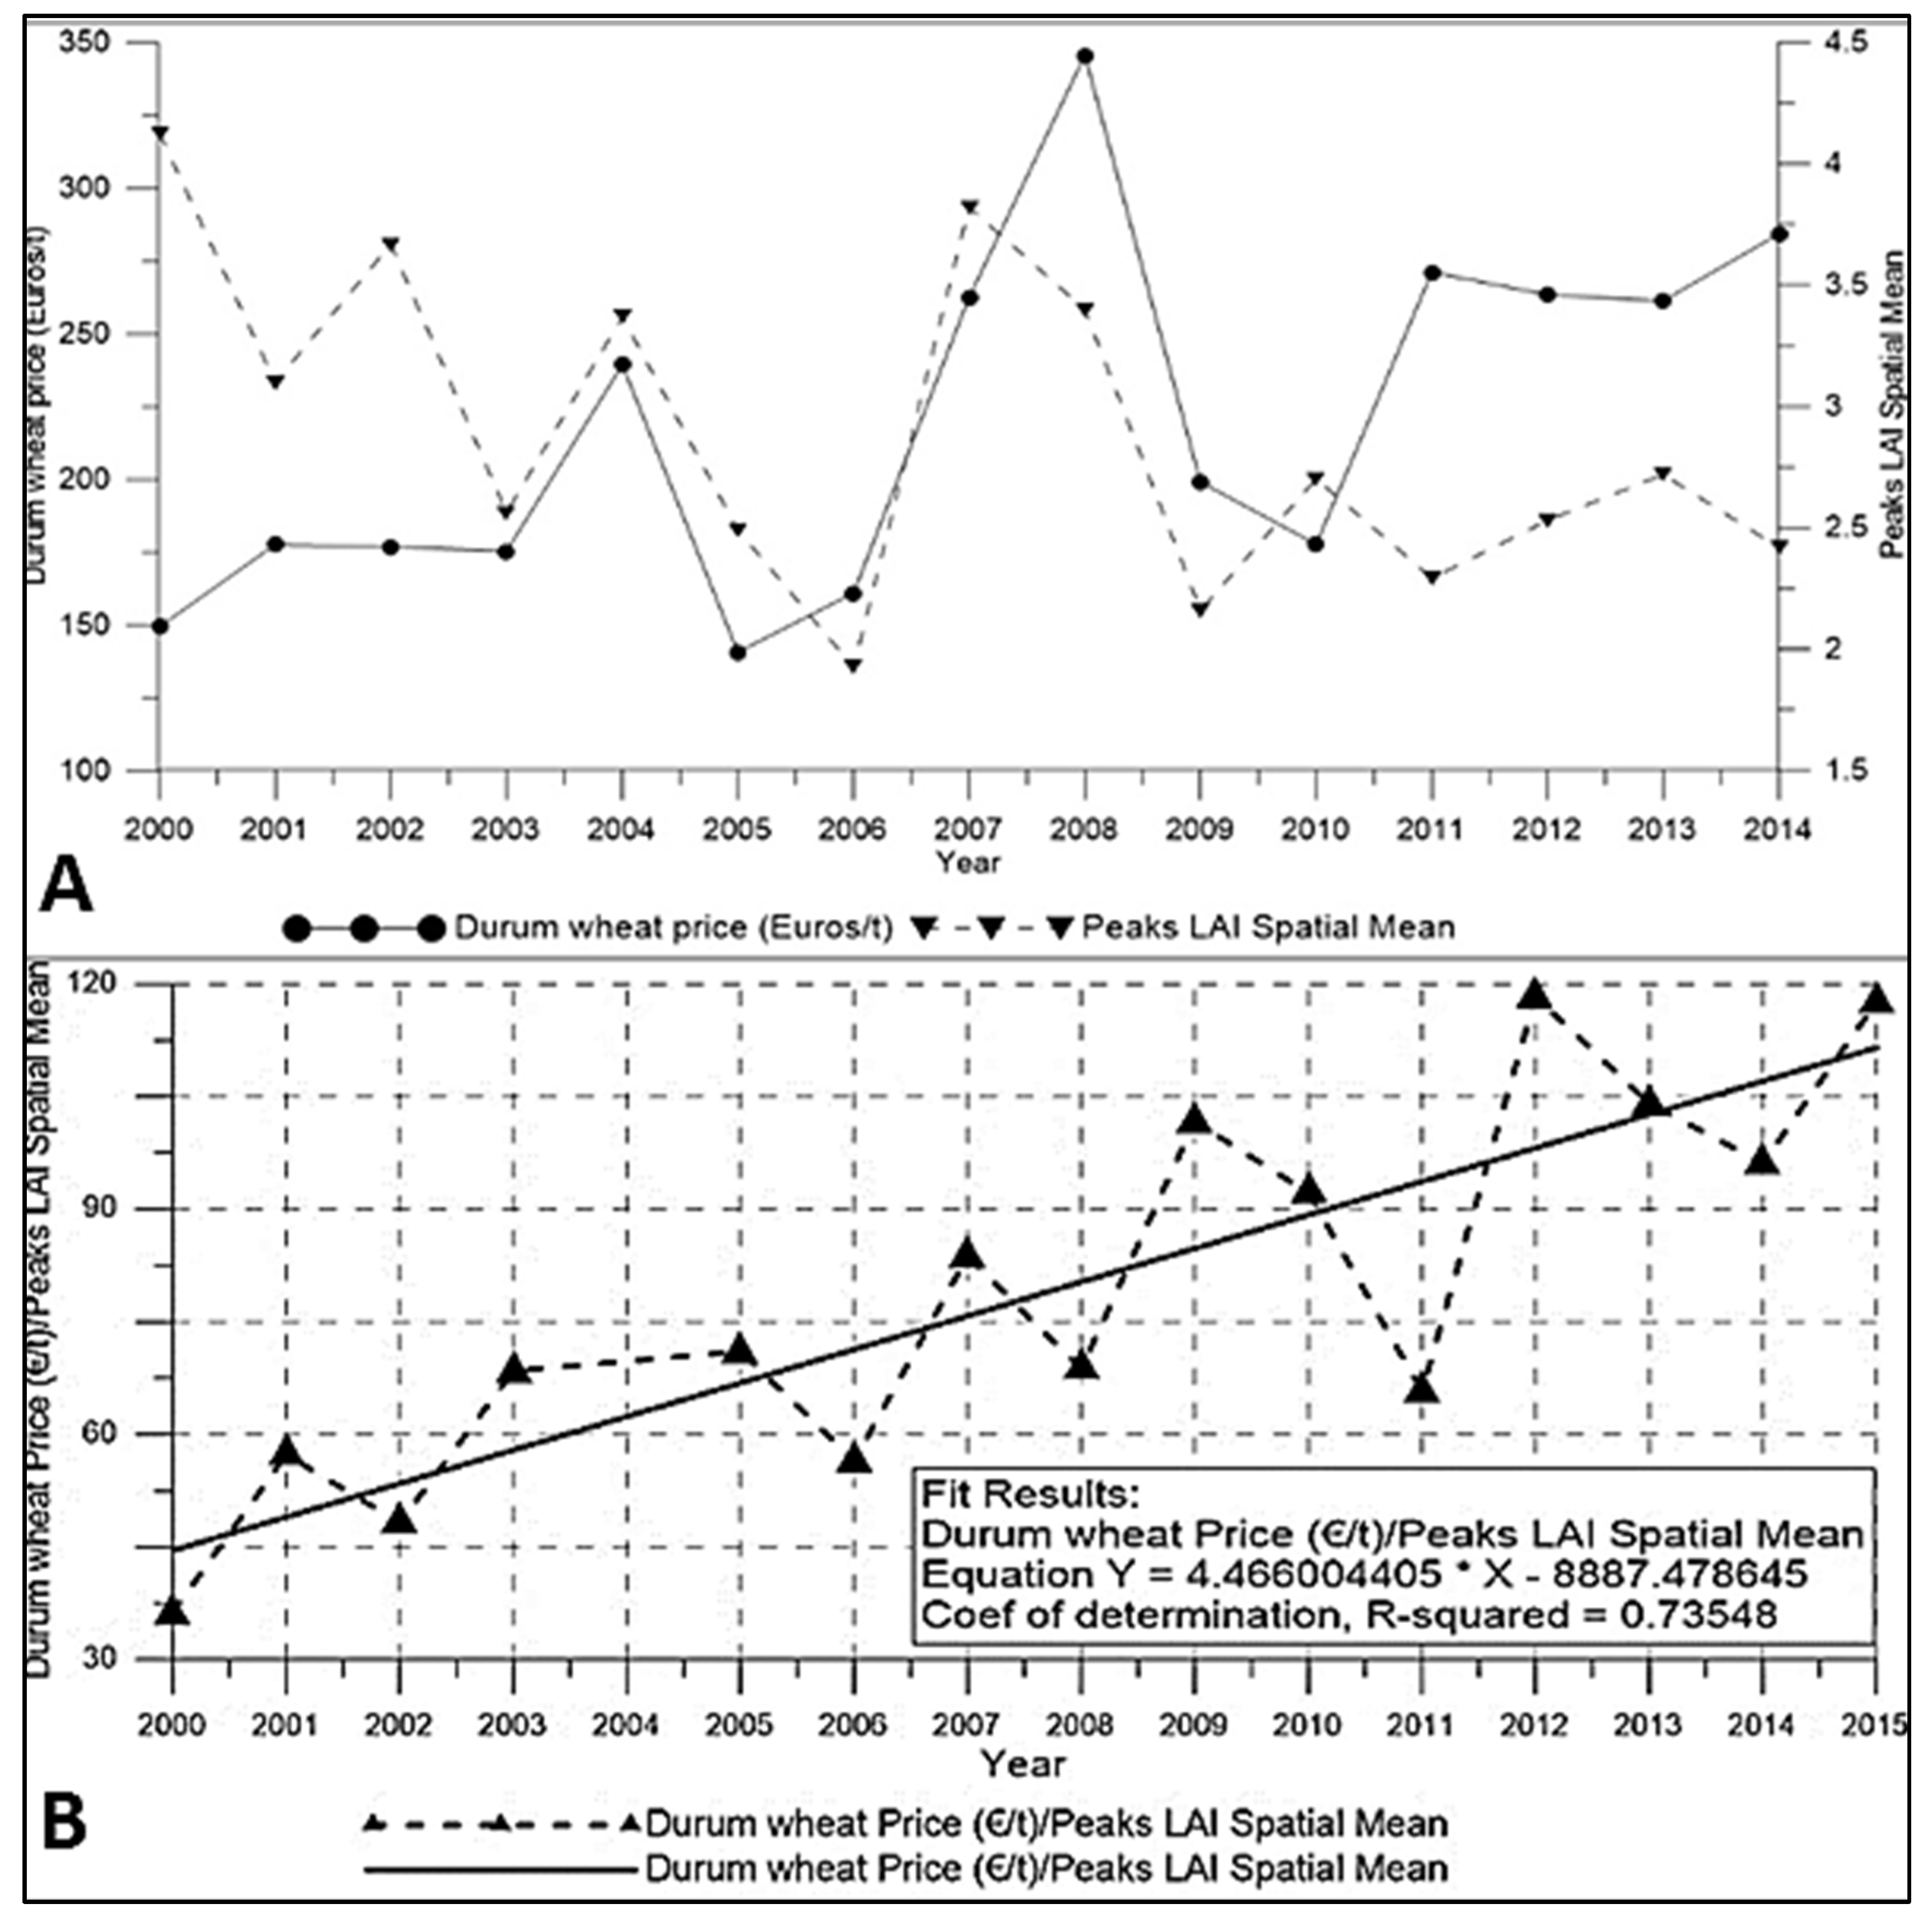
Second, an interesting correlation between the market price of durum wheat (Eurostat annual durum wheat prices) and the Peak LAI Spatial Mean (and thus the Peak LAI Spatial STD) time series is shown in Figure 8A. Figure 8B shows the ratio plot of the market price and the Peak LAI Spatial Mean, with a linear coefficient of determination R2 of 0.73. Regardless of the agronomic factors, this empirical relation underlines the strong temporal proportionality and dependence of the peak land vegetation cover variability and the durum wheat price in the Celone watershed.
Third is the overall inverse trend between price and Peak LAI Spatial mean. On economic grounds, we would not only expect a positive trend, but also the opposite. A positive trend indicates an extensive durum wheat cultivation, and it is observed in steady-state operating costs. But in our case (negative trends), the phenomenon observed is an intensification of durum wheat cultivation. Indeed, as reported in Table 2, by The European Commission report, a decrease in the durum wheat area but an increase in productivity due to an increase in operating costs which constrains area extension. Accordingly, the operating costs constrained land allocation proportionally and led to an increase in the ratio (Figure 8B).
Finally, to assess the subtle process of watershed’s cover (“Farmers”) and market price variation response, we calculated the first finite difference of the durum wheat market price with respect to the Peak LAI Spatial Mean and compared it to the Peak LAI Spatial Mean Time Interval. The results are shown in Figure 9. With:
d (Durum wheat Price): difference in durum wheat market price between two successive years.
d (Peak LAI Spatial Mean): difference in Peak LAI Spatial Mean between two successive years.
The positive values in the first finite difference indicate the same trend variation of the durum wheat price and the Peak LAI Spatial Mean, and inversely for the negative values. Through the entire period, we noticed that before 2007 and after 2012, the market price of durum wheat and Peak LAI Spatial Mean have a positive correlation but with relatively low amplitude. This means that an increase (or decrease) in market price induces the same trend in the Peak LAI Spatial Mean. Between 2007 and 2012, we observe inverse trends (negative values) with more significant amplitude; this is related to the low canopy cover characteristic of the durum wheat crop that was cultivated intensively.
Interestingly, this finite difference is highly correlated with the Peak LAI Spatial Mean Time Interval. Indeed, we observe a delay (or anticipation) of harvesting as the first difference of Peak LAI Spatial Mean relative to the market price increases (or decreases). In other words, the farmers tend to delay the durum wheat harvesting date as the market price goes up, and inversely when the market price goes down, by managing crop growth rate. Indeed, crop development can be controlled by adopting adequate management practices and inputs [2,67,68].

4. Discussion

Interesting insights were identified in order to determine the driving factors of land use and LAI variability. The change in the agricultural pattern related to durum wheat was found to have the same behavior as its market price variability. The policy changes implemented by the CAP program justify the correspondence of the trend between the market price, the durum wheat LAI, the land use and the farmers in the Celone watershed. Especially, we saw that the agricultural land cover system response bears the imprint of the CAP policy.
Mainly because of the relatively short period of the study (15 years), the results showed a prevalent impact of the human driving factors in comparison with the physical ones related previously in the literature, such as [31,33,44,69] in affecting the year-to-year changes in the vegetation cover.
The positive approach adopted in the analysis shows a temporal and causal coherence. Indeed, the reforms of the CAP, initiated in 1990, whose objective was to make production representative of the market needs, were observed for our case study. The farmers of Celone show a positive response in terms of land management and production. The land allocation and the intensification of durum wheat cultivation was found in accordance with the CAP intervention.
Due to the high-level area uptake in the Celone watershed, the year-to-year change in the LAI showed a strong correlation with the market price of the durum wheat, which is the major grown crop. Spatio-temporal behavioral correspondences were observed from the comparison of the durum wheat prices and the Peak LAI Spatial Mean. The proportional and temporal variation correspondence demonstrates explicitly the dependence relationship between the market, farmer’s behavior and the production. The strength of this relationship is determined by the CAP policy in place, using profitability as driving factor for farmer’s decision-making, aiming usually either to promote rural development, environmental conservation or the like in the exceptional intervention to cope with market crisis.
The dynamic analysis of the Peak LAI Spatial Mean and Peak LAI Spatial STD variation characterized the behavior of the farmers. Indeed, the factors would be related to the agro-climatic effect and show an interesting correspondence with the durum wheat market price. The comparative analysis of the Peak LAI Spatial Mean and the prices demonstrate a high level of control and management of the Celone’s farmers of the durum wheat cultivation cycle. A fact is highlighted by the analogy between the watershed vegetation cover response to the price and the peak lag variation (Figure 9), where the famers tend to delay (or anticipate) the harvesting date as the price increases (or decrease) targeting the maximum profitability afforded by the price.
On the other hand, the reasons behind the reforms and interventions were simply a response to the market states. Each reform to the CAP, over the study period, has attempted to adjust the ways in which the agricultural industry uses its key resource of land to respond to the market demand. The support of producer prices and their strong influence on profitability, farmer land use decision-making and production control is strongly influenced.

5. Conclusions

The method developed and applied within this investigation provides highly relevant results to evaluate the potential impacts of CAP’s measures and market on land vegetation cover changes. The method could serve as an instrument to support further evaluation of European agricultural policies. In fact, the possibility to evaluate explicitly impacts is one of the key assets of the methodology since it allows assessment of EU policy proposals from a detailed regional viewpoint. This is essential for policies such as the CAP where local characteristics (related to biophysical features and management practice) are the main elements to be considered when evaluating their impacts. Furthermore, the variability analysis of an economically driven scheme with environmental indicators allows the quantification of qualitative phenomenon, especially where the agricultural market economy relies on policy for environmental concerns. To deal with the environmental issues led by the appropriation of natural system, businesses, consumers and government regulators need to pay more attention to the environmental impacts of their economic activities and then integrate this information into the price system.
In the more specific perspective of the impact assessment procedure, the integration with crop yield or hydrologic models, which are based on a quantitative understanding of underlying processes and integrate the effects of soil, weather, crop, pests and management factors on growth and yield would allow a better understanding of the complex dynamic of the hydro-agricultural system [70,71,72,73] with its heterogeneity and interactions among the agents and their cognitive and sensing capabilities.

Acknowledgments

This paper reports partial research results of the Master program offered by the Land and Water Resources Management Department, Mediterranean Agronomic Institute of Bari (IAMB), International Centre for Advanced Agronomic Mediterranean Studies (CIHEAM), Italy. We thank the Polytechnics and IAMB research staff who provided insight, comments and expertise that greatly assisted the research.

Author Contributions

The presented research was conjointly designed and elaborated. The discussions were realized conjointly by all authors and all authors contributed equally in the writing of this paper. All authors have read and approved the final manuscript.

Conflicts of Interest

The authors declare no conflict of interest.

References

  1. Lakshminarayan, P.G.; Johnson, S.R.; Bouzaher, A. A multi-objective approach to integrating agricultural economic and environmental policies. J. Environ. Manag. 1995, 45, 365–378. [Google Scholar] [CrossRef]
  2. Hoogenboom, G. The state-of-the art in crop modeling. In Climate Prediction and Agriculture; International START Secretariat: Washington, DC, USA, 2000; pp. 69–75. [Google Scholar]
  3. Hoogenboom, G. Contribution of agrometeorology to the simulation of crop production and its applications. Agric. For. Meteorol. 2000, 103, 137–157. [Google Scholar] [CrossRef]
  4. Wiggering, H.; Steinhardt, U. A conceptual model for site-specific agricultural land-use. Ecol. Model. 2015, 295, 42–46. [Google Scholar] [CrossRef]
  5. The Government Office for Foresight; The Government Office for Science. Final Project Report; The Government Office for Science, Ed.; The Government Office for Science: London, UK, 2011.
  6. Sckokai, P.; Moro, D. Modelling the impact of the cap single farm payment on farm investment and output. Eur. Rev. Agric. Econ. 2009, 36, 395–423. [Google Scholar] [CrossRef]
  7. Wilcox, J.; Makowski, D. A meta-analysis of the predicted effects of climate change on wheat yields using simulation studies. Field Crops Res. 2014, 156, 180–190. [Google Scholar] [CrossRef]
  8. Hoogenboom, G.; Gijsman, A.J.; Thornton, P.K. Using the wise database to parameterize soil inputs for crop simulation models. Comput. Electron. Agric. 2006, 56, 85–100. [Google Scholar]
  9. Hoogenboom, G.; Jones, J.W.; Boote, K.J. Modeling growth, development, and yield of grain legumes using soygro, pnutgro, and beangro: A review. Trans. ASAE 1992, 35, 2043–2056. [Google Scholar] [CrossRef]
  10. Foley, J.A.; Defries, R.; Asner, G.P.; Barford, C.; Bonan, G.; Carpenter, S.R.; Chapin, F.S.; Coe, M.T.; Daily, G.C.; Gibbs, H.K.; et al. Global consequences of land use. Science 2005, 309, 570–574. [Google Scholar] [CrossRef] [PubMed]
  11. Lambin, E.F.; Turner, B.L.; Geist, H.J.; Agbola, S.B.; Angelsen, A.; Bruce, J.W.; Coomes, O.T.; Dirzo, R.; Fischer, G.; Folke, C. The causes of land-use and land-cover change: Moving beyond the myths. Glob. Environ. Chang. 2001, 11, 261–269. [Google Scholar] [CrossRef]
  12. Verburg, P.H.; Schulp, C.J.E.; Witte, N.; Veldkamp, A. Downscaling of land use change scenarios to assess the dynamics of european landscapes. Agric. Ecosyst. Environ. 2006, 114, 39–56. [Google Scholar] [CrossRef]
  13. Corbelle-Rico, E.; Butsic, V.; Enríquez-García, M.J.; Radeloff, V.C. Technology or policy? Drivers of land cover change in northwestern spain before and after the accession to european economic community. Land Use Policy 2015, 45, 18–25. [Google Scholar] [CrossRef]
  14. Manfreda, S.; Smettem, K.; Iacobellis, V.; Montaldo, N.; Sivapalan, M. Coupled ecological-hydrological processes. Ecohydrology 2010, 3, 131–132. [Google Scholar] [CrossRef]
  15. Barnes, A.; Sutherland, L.-A.; Toma, L.; Matthews, K.; Thomson, S. The effect of the common agricultural policy reforms on intentions towards food production: Evidence from livestock farmers. Land Use Policy 2016, 50, 548–558. [Google Scholar] [CrossRef]
  16. Viaggi, D.; Raggi, M.; Gallerani, V.; Paloma, S.G. The impact of eu common agricultural policy decoupling on farm households: Income vs. Investment effects. Intereconomics 2010, 45, 188–192. [Google Scholar] [CrossRef] [Green Version]
  17. Organisation for Economic Co-operation and Development; Freshwater, D. Farmland Conversion: The Spatial Dimension of Agricultural and Land-Use Policies; Organisation for Economic Co-operation and Development, Ed.; Policy Forum of the Committee for Agriculture Paris: Paris, France, 2009. [Google Scholar]
  18. Latruffe, L.; Dupuy, A.; Desjeux, Y. What would farmers’ strategies be in a no-cap situation? An illustration from two regions in france. J. Rural Stud. 2013, 32, 10–25. [Google Scholar] [CrossRef]
  19. Antonelli, M.; Siciliano, G.; Turvani, M.E.; Rulli, M.C. Global investments in agricultural land and the role of the EU: Drivers, scope and potential impacts. Land Use Policy 2015, 47, 98–111. [Google Scholar] [CrossRef]
  20. Van Vliet, J.; de Groot, H.L.F.; Rietveld, P.; Verburg, P.H. Manifestations and underlying drivers of agricultural land use change in Europe. Landsc. Urban Plan. 2015, 133, 24–36. [Google Scholar] [CrossRef]
  21. Daugbjerg, C. Sequencing in public policy: The evolution of the cap over a decade. J. Eur. Public Policy 2009, 16, 395–411. [Google Scholar] [CrossRef]
  22. Daugbjerg, C. Policy feedback and paradigm shift in eu agricultural policy: The effects of the macsharry reform on future reform. J. Eur. Public Policy 2003, 10, 421–437. [Google Scholar] [CrossRef]
  23. Daugbjerg, C.; Swinbank, A. Ideational change in the WTO and its impacts on EU agricultural policy institutions and the cap. J. Eur. Integr. 2009, 31, 311–327. [Google Scholar] [CrossRef]
  24. BBC News. EU Proposes Scrapping Fallow Land; BBC News: London, UK, 2007. [Google Scholar]
  25. The European Commission. EU Cereal Farms Report 2013 Based on Fadn Data; The European Commission, Ed.; European Commission: Brussels, Belgium, 2013. [Google Scholar]
  26. Forti, R.; Henrard, M. Agriculture, Forestry and Fishery Statistics; Publication Office of the European Union: Luxembourg, Belgium, 2015; p. 256. [Google Scholar]
  27. International Grains Council. Grain Market Report; Technical Report; International Grains Council: London, UK, 2015. [Google Scholar]
  28. Royo, C.; Aparicio, N.; Blanco, R.; Villegas, D. Leaf and green area development of durum wheat genotypes grown under mediterranean conditions. Eur. J. Agron. 2004, 20, 419–430. [Google Scholar] [CrossRef]
  29. Moragues, M.; Moral, L.F.G.D.; Moralejo, M.; Royo, C. Yield formation strategies of durum wheat landraces with distinct pattern of dispersal within the mediterranean basin I: Yield components. Field Crops Res. 2006, 95, 194–205. [Google Scholar] [CrossRef]
  30. Diacono, M.; Castrignan, A.; Troccoli, A.; de Benedetto, D.; Basso, B.; Rubino, P. Spatial and temporal variability of wheat grain yield and quality in a mediterranean environment: A multivariate geostatistical approach. Field Crops Res. 2012, 131, 49–62. [Google Scholar] [CrossRef]
  31. Balacco, G.; Figorito, B.; Tarantino, E.; Gioia, A.; Iacobellis, V. Space-time LAI variability in Northern Puglia (Italy) from SPOT VGT data. Environ. Monit. Assess. 2015, 187, 434. [Google Scholar] [CrossRef] [PubMed]
  32. Hoogenboom, G.; Jones, J.W.; White, J.W.; Boote, K.J. Development of a phaseolus crop simulation model. J. Am. Med. Assoc. 1987, 77, 683–685. [Google Scholar]
  33. Hoogenboom, G.; White, J.W.; Messina, C.D. From genome to crop: Integration through simulation modeling. Field Crops Res. 2004, 90, 145–163. [Google Scholar] [CrossRef]
  34. Hoogenboom, G. Plant growth modeling for resource management. Volume I, current models and methods. In Agricultural Systems; Elsevier: Amsterdam, The Netherlands, 1989; Volume 31, pp. 316–318. [Google Scholar]
  35. Iacobellis, V.; Gioia, A.; Manfreda, S.; Fiorentino, M. Flood quantiles estimation based on theoretically derived distributions: Regional analysis in southern Italy. Nat. Hazards Earth Syst. Sci. 2011, 11, 673–695. [Google Scholar] [CrossRef] [Green Version]
  36. Iacobellis, V.; Castorani, A.; Di Santo, A.R.; Gioia, A. Rationale for flood prediction in karst endorheic areas. J. Arid Environ. 2015, 112, 98–108. [Google Scholar] [CrossRef]
  37. Gioia, A.; Manfreda, S.; Iacobellis, V.; Fiorentino, M. Performance of a theoretical model for the description of water balance and runoff dynamics in southern Italy. J. Hydrol. Eng. 2014, 19, 1113–1123. [Google Scholar] [CrossRef]
  38. Balenzano, A.; Satalino, G.; Belmonte, A.; D’Urso, G.; Capodici, F.; Iacobellis, V.; Gioia, A.; Rinaldi, M.; Ruggieri, S.; Mattia, F. On the use of multi-temporal series of cosmo-skymed data for landcover classification and surface parameter retrieval over agricultural sites. IEEE Int. Geosci. Remote Sens. Symp. 2011. [Google Scholar] [CrossRef]
  39. Fiorentino, M.; Gioia, A.; Iacobellis, V.; Manfreda, S. Regional analysis of runoff thresholds behaviour in southern Italy based on theoretically derived distributions. Adv. Geosci. 2011, 26, 139–144. [Google Scholar] [CrossRef] [Green Version]
  40. Gioia, A.; Iacobellis, V.; Manfreda, S.; Fiorentino, M. Effects of runoff thresholds on flood frequency distributions. Hydrol. Earth Syst. Sci. Discuss. 2008, 5, 903–933. [Google Scholar] [CrossRef]
  41. Manfreda, S.; Samela, C.; Gioia, A.; Consoli, G.G.; Iacobellis, V.; Giuzio, L.; Cantisani, A.; Sole, A. Flood-prone areas assessment using linear binary classifiers based on flood maps obtained from 1d and 2d hydraulic models. Nat. Hazards 2015, 79, 735–754. [Google Scholar] [CrossRef]
  42. Andales, A.A.; Batchelor, W.D.; Anderson, C.E.; Farnham, D.E.; Whigham, D.K. Incorporating tillage effects into a soybean model. Agric. Syst. 2000, 66, 69–98. [Google Scholar] [CrossRef]
  43. Andarzian, B.; Hoogenboom, G.; Bannayan, M.; Shirali, M.; Andarzian, B. Determining optimum sowing date of wheat using csm-ceres-wheat model. J. Saudi Soc. Agric. Sci. 2014, 14, 189–199. [Google Scholar] [CrossRef]
  44. Gigante, V.; Iacobellis, V.; Manfreda, S.; Milella, P.; Portoghese, I. Influences of leaf area index estimations on water balance modeling in a Mediterranean semi-arid basin. Nat. Hazards Earth Syst. Sci. 2009, 9, 979–991. [Google Scholar] [CrossRef]
  45. Gioia, A.; Iacobellis, V.; Manfreda, S.; Fiorentino, M. Influence of infiltration and soil storage capacity on the skewness of the annual maximum flood peaks in a theoretically derived distribution. Hydrol. Earth Syst. Sci. 2012, 16, 937–951. [Google Scholar] [CrossRef]
  46. Apollonio, C.; Balacco, G.; Novelli, A.; Tarantino, E.; Piccinni, A. Land use change impact on flooding areas: The case study of Cervaro basin (Italy). Sustainability 2016, 8, 996. [Google Scholar] [CrossRef]
  47. Iacobellis, V.; Gioia, A.; Milella, P.; Satalino, G.; Balenzano, A.; Mattia, F. Inter-comparison of hydrological model simulations with time series of SAR-derived soil moisture maps. Eur. J. Remote Sens. 2013, 46, 739–757. [Google Scholar] [CrossRef]
  48. Tarantino, E.; Novelli, A.; Laterza, M.; Gioia, A. Testing High Spatial Resolution Worldview-2 Imagery for Retrieving the Leaf Area Index. In Proceedings of the Third International Conference on Remote Sensing and Geoinformation of the Environment, Paphos, Cyprus, 16 March 2015; p. 95351N.
  49. Mattia, F.; Satalino, G.; Balenzano, A.; D’Urso, G.; Capodici, F.; Iacobellis, V.; Milella, P.; Gioia, A.; Rinaldi, M.; Ruggieri, S.; et al. Time series of cosmo-skymed data for landcover classification and surface parameter retrieval over agricultural sites. Int. Geosci. Remote Sens. Symp. 2012. [Google Scholar] [CrossRef]
  50. Novelli, A.; Tarantino, E.; Fratino, U.; Iacobellis, V.; Romano, G.; Gentile, F. A data fusion algorithm based on the kalman filter to estimate leaf area index evolution in durum wheat by using field measurements and modis surface reflectance data. Remote Sens. Lett. 2016, 7, 476–484. [Google Scholar] [CrossRef]
  51. Hadjimitsis, D.G.; Themistocleous, K.; Michaelides, S.; Papadavid, G.; Mandanici, E.; Franci, F.; Bitelli, G.; Agapiou, A.; Alexakis, D.; Hadjimitsis, D.G. Comparison between empirical and physically based models of atmospheric correction. In Proceedings of the Third International Conference on Remote Sensing and Geoinformation of the Environment, Paphos, Cyprus, 16 March 2015; Volume 9535.
  52. Aquilino, M.; Novelli, A.; Tarantino, E.; Iacobellis, V.; Gentile, F. Evaluating the potential of GeoEye data in retrieving LAI at watershed scale. In Proceedings of the Remote Sensing for Agriculture, Ecosystems, and Hydrology XVI, Amsterdam, The Netherlands, 22 September 2014.
  53. Trombetta, A.; Iacobellis, V.; Tarantino, E.; Gentile, F. Calibration of the AquaCrop model for winter wheat using MODIS LAI images. Agric. Water Manag. 2016, 164, 304–316. [Google Scholar] [CrossRef]
  54. Myneni, T.R.; Park, Y.K. Mod15a2 MODIS/Terra+Aqua Leaf Area Index/FPAR 8-Day l4 Global 1 km Sin Grid v005; Land Process Distributed Active Archive Center, Ed.; Land Process Distributed Active Archive Center: Sioux Falls, SD, USA, 2015.
  55. USGS Earth Resources Observation and Science (EROS) Center; Land Process Distributed Active Archive Center. Modis Reprojection Tool (MRT) User’s Manual; USGS Earth Resources Observation and Science (EROS) Center: Sioux Falls, SD, USA, 2011.
  56. Eurostat (Statistical Office of the European Union). Absolute Agricultural Prices; Statistical Office of the European Union: Luxembourg, Belgium, 2015. [Google Scholar]
  57. Cantore, N.; Kennan, J.; Page, S. Cap Reform and Development: Introduction, Reform Options and Suggestions for Further Research; Overseas Development Institute: London, UK, 2011. [Google Scholar]
  58. Waterfield, B.; Charles, C. Set Aside Suspended by European Union; Telegraph Media Group Limited: Jersey, UK, 2007; Volume 2016. [Google Scholar]
  59. Kanter, J. Eu governments to overhaul farm subsidie. In The New York Times; The New York Times: New York, NY, USA, 2008; Volume 2016. [Google Scholar]
  60. European Commission. Health Check of the Common Agricultural Policy; The EU Agriculture Ministers Reached a Political; European Commission, Ed.; European Commission: Brussels, Belgium, 2012. [Google Scholar]
  61. EC DG Agriculture and Rural Development. Campaign on the New Cap “Taking Care of Our Roots”. 2014. Available online: http://ec.Europa.Eu/agriculture/cap-for-our-roots/index_en.Htm (accessed on 26 January 2015).
  62. European Commission. EU Cereal Farms Report 2013; European Commission: Brussels, Belgium, 2014. [Google Scholar]
  63. Freshwater, D. Farmland Conversion: The Spatial Dimension of Agricultural and Land-Use Policies; Organisation for Economic Co-operation and Development: Paris, France, 2009. [Google Scholar]
  64. Gouel, C.; Hertel, T.W. Introducing Forest Access Cost Functions into a General Equilibrium Model; GTAP Working Research Memorandum; Purdue University: West Lafayette, IN, USA, 2006. [Google Scholar]
  65. Meiyappan, P.; Dalton, M.; O’Neill, B.C.; Jain, A.K. Spatial modeling of agricultural land use change at global scale. Ecol. Model. 2014, 291, 152–174. [Google Scholar] [CrossRef]
  66. Lubowski, R.N.; Plantinga, A.J.; Stavins, R.N. What drives land-use change in the United States? A national analysis of landowner decisions. Land Econ. 2008, 84, 529–550. [Google Scholar] [CrossRef]
  67. Hoogenboom, G. Shoot and Root Growth of Soybean (Glycine max (L.) Merr.) under Water Stress: Experimental and Simulation Studies. Ph.D. Thesis, Auburn University, Auburn, AL, USA, 1985. [Google Scholar]
  68. Hoogenboom, G. Modeling root growth and impact on plant development. Acta Hortic. 1999, 507, 241–252. [Google Scholar] [CrossRef]
  69. Balenzano, A.; Satalino, G.; Iacobellis, V.; Gioia, A.; Manfreda, S.; Rinaldi, M.; de Vita, P.; Miglietta, F.; Toscano, P.; Annicchiarico, G.; et al. A ground network for sar-derived soil moisture product calibration, validation and exploitation in southern Italy. In Proceedings of the International Geoscience and Remote Sensing Symposium (IGARSS), Quebec City, QC, Canada, 13–18 July 2014; pp. 3382–3385.
  70. Hoogenboom, G. Agricultural dimensions of global climate change. Agric. Syst. 1996, 51, 124–125. [Google Scholar] [CrossRef]
  71. Hoogenboom, G. The Georgia automated environmental monitoring network: Experiences with the development of a state-wide automated weather station network. In Proceedings of the 13th Symposium on Meteorological Observations and Instrumentation, Dallas, TX, USA, 19–23 June 2005.
  72. Milella, P.; Bisantino, T.; Gentile, F.; Iacobellis, V.; Trisorio Liuzzi, G. Diagnostic analysis of distributed input and parameter datasets in Mediterranean basin streamflow modeling. J. Hydrol. 2012, 472–473, 262–276. [Google Scholar] [CrossRef]
  73. Fiorentino, M.; Gioia, A.; Iacobellis, V.; Manfreda, S. Analysis on flood generation processes by means of a continuous simulation model. Adv. Geosci. 2006, 7, 231–236. [Google Scholar] [CrossRef]
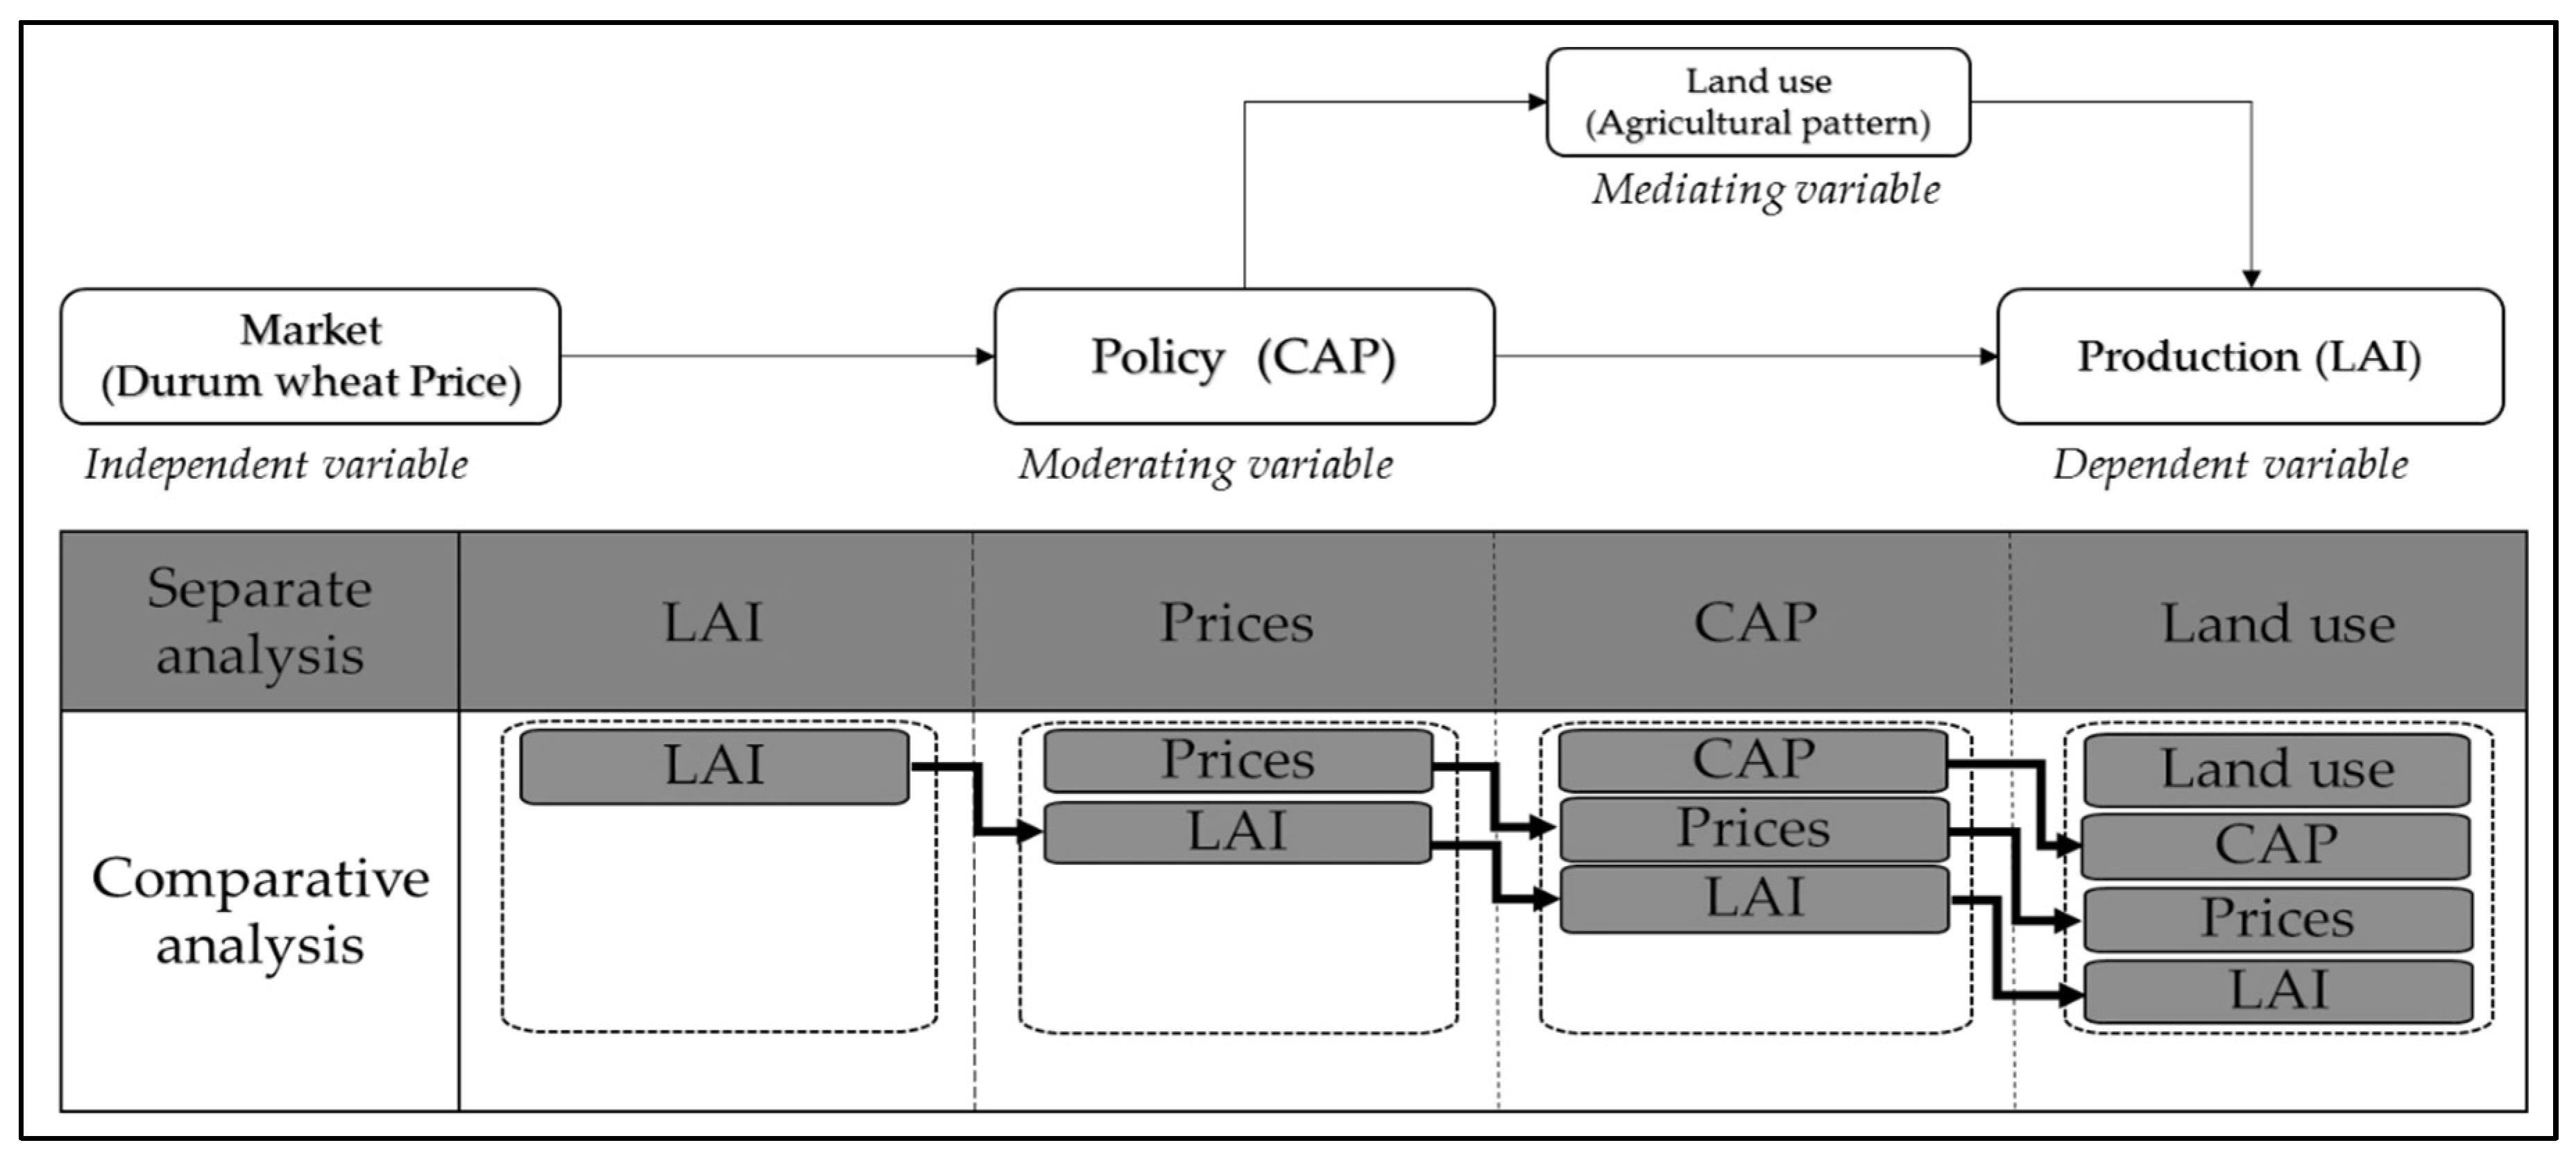
Figure 1. Methodological flowchart.
Agriculture 07 00012 g001
Figure 2. Location of the Celone at San Vincenzo watershed.
Agriculture 07 00012 g002
Figure 3. 2001 Landsat image classification (a). 2009 Landsat image classification (b). 2011 Landsat image classification (c). 2011 processed Landsat image classification.2.3.2. Land Vegetation Cover (d).
Agriculture 07 00012 g003
Figure 4. Agricultural pattern and forests area variation (2001–2011).
Agriculture 07 00012 g004
Figure 5. Farm determinants of accountancy (The European Commission, 2014).
Agriculture 07 00012 g005
Figure 6. LAI Spatial Mean, Annual Mean and Spatial STD variation for the period 2000–2014 (A). 3D LAI Spatial Mean and STD combined plot with projection (B). Projection of the LAI Spatial Mean and LAI Spatial STD combined plot (C).
Agriculture 07 00012 g006
Figure 7. Peak LAI Spatial Mean and Peak LAI Spatial STD correlation (A). Peak LAI Spatial Mean and Peak LAI Spatial STD dynamic’s (B).
Agriculture 07 00012 g007
Figure 8. Annual Eurostat’s Durum Wheat Price and Peak LAI Spatial Mean variation (A). Annual Eurostat’s Durum Wheat Price-Peak LAI Spatial Mean ratio (B).
Agriculture 07 00012 g008
Figure 9. Peak LAI Spatial Mean response to price variation.
Agriculture 07 00012 g009
Table 1. Acquisition date of the selected scenes and implemented sensor.
Date of AcquisitionWRS Path/RowSensor
22/06/2011189/031TM
16/06/2009189/031TM
22/06/2011189/031ETM+
WRS: Worldwide Reference System. TM: Thematic Mapper. ETM+: Enhanced Thematic Mapper Plus.
Table 2. Italian farms specializing in durum 249 wheat (The European Commission, 2014).
TypeUnit200420052006200720082009201020112012Average
Representativeness of the sample
Sample farmsnumber680465420515400520585540-515.6
Farms representednumber48,40039,90035,70045,70048,50050,00054,70049,000-46,487.5
Structural information (average per farm)
Total Utilized Agricultural Areaha24.125.024.322.522.123.323.523.4-23.5
Total labor inputAWU0.80.80.80.80.80.80.80.9-0.8
Durum wheat areaha19.118.417.016.616.414.814.814.514.516.5
Irrigated areaha0.30.40.30.20.50.40.30.3-0.3
Durum wheat productiont61585654575151515355.0
Durum wheat yieldt/ha3.23.23.33.33.53.53.53.53.73.4
Durum wheat price€/t138148174336263197221270270218.4
Durum wheat outputk €8.48.69.718.315.110.111.413.714.411.9
Durum wheat production operating costs (average per farm)
Specific costs€/ha164166183223303239223244258222.6
Seeds€/ha666765851118776788279.6
Fertilizers€/ha6262739113510710111912697.3
Crop protection€/ha32333841453738414238.7
Water€/ha0010-11000.5
Other specific costs€/ha44551376776.4
Non-specific costs€/ha167192222284311244267318340260.5
fuels and lubricants€/ha567578112106909212313796.7
machines & buildings upkeep€/ha26303245301628353631.1
Contract work€/ha50466068716267828565.7
Energy€/ha00001271011125.8
Other direct costs€/ha34405158937069676961.3
Total Operating costs€/ha331359405507614483489563597483.1
Operating costs per ton of grain€/t104113123155176140141161163141.8
AWU: Annual Work Unite corresponds to the work performed by one person who is occupied on an agricultural holding on a full-time basis. Full-time means the minimum hours required by the relevant national provisions governing contracts of employment. If the national provisions do not indicate the number of hours, then 1800 h are taken to be the minimum annual working hours: 225 working days of eight hours each.
Table 3. General land use classification.
Year 200120092011
Land UseArea (km2)%Area (km2)%Area (km2)%
Agricultural and forest area98.3459796.8129595.18294
River channel and wetland0.16400.31600.7031
Built-up area2.90733.38034.3224
Marsh 0.32101.14811.4731
Salt plan0.02100.10200.0020
Lake 0.00000.00000.0760
Table 4. Agricultural and forests area sub-classes.
Year 200120092011
Land UseArea (km2)%Area (km2)%Area (km2)%
Bare soil with high reflectance in RGB channels1.616204.579511.29512
Arable crops with low leaf area index17.4991843.2184535.56537
Shrub and low density orchard15.0611501.130100.7321
Orchard or vegetation01.801216.5681714.01015
Greenhouse or plastic cover vineyard 00.360005.720501.4332
Olive grow or orchard10.2801006.690708.6469
Arable crops with high leaf area index36.1363711.3661208.5889
Forests (broadleaved and coniferous)15.5921608.189814.91316