Article

Mitigating Global Warming Potential and Greenhouse Gas Intensities by Applying Composted Manure in Cornfield: A 3-Year Field Study in an Andosol Soil

Soil Science Laboratory, Hokkaido University, Kita 9 Nishi 9, Kita-ku, Sapporo, Hokkaido 060-8589, Japan
*
Author to whom correspondence should be addressed.
Agriculture 2017, 7(2), 13; https://doi.org/10.3390/agriculture7020013
Submission received: 28 November 2016 / Revised: 24 January 2017 / Accepted: 7 February 2017 / Published: 13 February 2017
(This article belongs to the Special Issue C and N Cycling and Greenhouse Gas Emissions in Agroecosystem)

Abstract

:
A 3-year study was conducted in cornfield to evaluate how composted cattle manure application affects net global warming potential (GWP; the sum of nitrous oxide (N2O) and methane (CH4) minus net ecosystem carbon balance (NECB)) and greenhouse gas intensity (GHGI; net GWP per unit of plant biomass yield). In the first experiment, conducted from 2010 to 2012, five fertilization strategies that included an unfertilized control plot, inorganic fertilizer-only plot, two plots with inorganic fertilizer plus composted cattle manure, and composted cattle manure-only plot were established. In the second experiment composted cattle manure was applied in autumn 2012 and the field was subdivided into three plots in spring 2013, with one plot receiving additional composted cattle manure, the second plot received additional inorganic fertilizer and the third plot did not receive any additional fertilization. Fluxes of N2O, CH4 and CO2 were measured using the static closed chamber method. NECB was calculated as carbon (C) inputs minus C output (where a negative value indicates net C loss). In experiment 1, manure application significantly increased NECB and reduced net GWP by more than 30% in each of the three years of the study. GHGI in the manure-amended plots was lower than in other plots, except in 2012 when the manure-only plot had higher GHGI than fertilizer-only plot. Application of inorganic fertilizer alone increased GWP by 5% and 20% in 2010 and 2011, but showed a 30% reduction in 2012 relative to the unfertilized control plot. However, due to higher net primary production (NPP), fertilizer-only plot had lower GHGI compared to the control. Application of inorganic fertilizer together with manure showed the greatest potential to reduce GWP and GHGI, while increasing NPP and NECB. In experiment 2, additional manure or inorganic fertilizer application in spring increased NPP by a similar amount, but additional manure application also increased NECB, and decreased GWP and GHGI. Manure application, as a partial substitute or supplemental fertilizer, shows potential to mitigate GWP and GHGI.

1. Introduction

Warming of the global climate is undoubtedly caused by the increase in greenhouse gas (GHG) concentrations in the atmosphere [1]. Carbon dioxide (CO2), methane (CH4) and nitrous oxide (N2O) are released from soils into the atmosphere due to microbial processes that break down organic and inorganic materials added to and existent in soils [2,3,4]. Globally CO2 has the greatest radiative forcing among the three GHGs [1]. The agriculture sector has low net CO2 emissions relative to other sectors but has one of the largest potentials for mitigation through soil carbon (C) sequestration [3]. Soil CH4 flux in aerobic upland soils is a result of the balance between methanogenesis and CH4 consumption [5]. Changes in abiotic factors and land management practices can significantly alter the balance between CH4 production and consumption in the soil [6,7]. Soil N2O is predominantly produced by nitrification and denitrification processes [8], and is influenced by the availability of soil nitrogen (N), soil C, temperature, pH and soil moisture content in the soil [9,10,11,12,13,14]. Intensification of agricultural production and the use of inorganic and organic fertilizers (such as animal manure) are the major cause of the increased GHG emissions from agriculture [1,3,15]. With the need to meet the growing demand of food due to growing global population, increase in the use of fertilizers (both organic and inorganic) is inevitable, especially in developing countries [16]. On the other hand, reducing GHG emissions is of great concern globally [1]. Management practices that mitigate GHG emissions while enhancing crop productivity are therefore essential [17,18,19].
A number of studies have been done to evaluate how management practices, such as tillage, manure and fertilizer application, affect GHG emissions [20,21,22,23,24,25,26]. Adequate fertilization and manure application have been reported to increase soil organic carbon (SOC) through increased biomass production and through direct C input from manure and residue retention in soils [27,28,29,30,31,32]. On the other hand, both manure and fertilizer application can increase N2O and CH4 emissions [33,34,35] and partly offset the benefits of increased SOC sequestration. Therefore, the overall change in GHG emissions and SOC sequestration should be evaluated when assessing the benefits of any management practice.
To easily compare the effects N2O, CH4 and CO2 emitted in the atmosphere, CO2-equivalents (the radiative forcing relative to CO2 over a 100-year period) are widely used. Net global warming potential (GWP), the sum of CO2-equivalents of N2O, CH4 and CO2, is a good measure of the overall exchange of GHGs in a system [36]. Agricultural ecosystems do not only emit CO2 but also uptake (remove) CO2 from the atmosphere through plant photosynthesis. Some of the CO2 removed through photosynthesis may end up in the soil as SOC. Some researchers have therefore used change in SOC; rather direct CO2, when calculating net GWP from agricultural ecosystems. However, direct measurement of SOC content in most cases only detects changes in SOC over 5–10 years time scales (or even longer) and is not sensitive enough to account for small seasonal and annual changes [37]. Net ecosystem C balance (NECB) has been proposed to more accurately account for changes in C accumulation in an ecosystem [37,38]. Despite having some limitations such as being influenced by annual climatic variations [38], by measuring the C input, C output and net CO2 flux from an ecosystem to the atmosphere, NECB is one of the best methods for measuring C changes in cropland over shorter periods such as annually [39]. Therefore, NECB, in addition to N2O and CH4, is used to calculate net GWP in this study.
Since the ultimate goal should be to reduce GHG emissions while being able to increase crop productivity, net GWP must be compared to the crop yield. Greenhouse gas intensity (GHGI), which is calculated by dividing GWP by the crop yield [40], can give a good idea of whether a given management practice can increase productivity without increasing GHG emissions. While many studies have reported the effect of inorganic fertilizer and manure application on CO2, CH4 and N2O emissions, very few have evaluated their effect on GWP and GHGI.
The amount as well as the timing of manure and fertilizer application influences both crop productivity and GHG emissions. The readily availability of inorganic fertilizer N makes it easy to be taken up by plants but also to be easily transformed by microbial processes into N2O and other gaseous forms. On the other hand, when composted, animal manure is a slow-release fertilizer and it is widely considered to be a good substitute for inorganic fertilizer [39]. However, low nutrient content of composted manures, compared to inorganic fertilizers, could lead to reduced crop yields. It is therefore important to evaluate the ability of manures to maintain yields if they are to be a real alternative to inorganic fertilizers.
We hypothesized that (1) manure application can increase C sequestration and offset increase in non-CO2 GHGs; (2) applying manure twice (in autumn and spring) can achieve the same amount of crop productivity compared to conventional inorganic fertilizer (in spring) without increasing N2O emissions. To test our hypotheses, we initiated a field experiment in 2010 to gain insights into the effects of manure and inorganic fertilizer on GHG emissions, GWP and GHGI in a cornfield. We also explore the major factors driving GHG fluxes in the soil.

2. Materials and Methods

2.1. Site Description

Field monitoring was done at an experimental farm of the Field Science Centre for Northern Biosphere of Hokkaido University in Shin-Hidaka city, Southern Hokkaido, Japan (42°26′ N, 142°29′ E). The site experiences cold winters and relatively cool summers with average annual air temperature and precipitation of 8.1 °C and 1252 mm, respectively. In winter, the soil is covered with snow and frozen from December to March. The soil is derived from volcanic ash and classified as a Mollic Andosol (IUSS Working Group WRB 2006).
Before initiation of this study, the field (2-ha) had been managed as a grassland for more than 30 years with reed canary grass (Phalaris arundinacea L.) as the dominant species. From 2005 half of the field had been applied with inorganic fertilizer and the other half with composted cattle manure with supplemental inorganic fertilizer. Herbicide was applied in September 2009 to kill the grass and the field was ploughed in December the same year.

2.2. Experimental Set Up

Three of the experimental plots used in this study were established in 2005 as inorganic fertilizer plus composted cattle manure (MF1), inorganic fertilizer-only (F) and unfertilized control plot (CT). In 2010 half of previous inorganic fertilizer plot was applied with composted manure, establishing a new inorganic fertilizer plot plus composted cattle manure (MF2). Part of the MF1 plot did not receive supplemental inorganic fertilizer from 2011 onwards, and hence called the composted cattle manure-only plot (M). These five plots were replicated 4 times in a complete randomized design with each plot measuring 5 m × 5 m in size and used in experiment 1. In experiment 2, small plots (described below) were set up in the fertilizer-only part of the field.

2.2.1. Experiment 1: Effect of Manure and Inorganic Fertilizer

Field measurements were conducted from October 2009 to October 2012 in CT, F, MF1, MF2 and M plots. Composted cattle manure was applied at the end of October in 2009, 2010 and 2011 and the field ploughed (30 cm depth) within two to three weeks after manure application. The average amount of manure applied in each year was 40 Mg fresh matter representing 390 kg total N and 6.8 Mg total C per hectare (Table S1). The manure was composted beef cattle manure with bedding litter (bark). In early May 2010, 2011 and 2012, the field was disc harrowed, after which maize was seeded and inorganic fertilizer (104 kg N as NH4PO3, 139 kg phosphorous (P) as P2O5 and 77 kg potassium (K) as K2O per hectare) applied on 18 May in 2010 and 2011 and on 21 May in 2012 in the respective plots. Lime was applied in all the treatment plots at the rate of 300 kg CaCO3 ha−1.

2.2.2. Experiment 2: Effect of Additional Spring Manure Application

A second experiment was conducted for one year from October 2012 to September 2013. In this experiment, three plots were set up to assess the effect of additional manure application in spring season on plant growth and net GHG emissions. The treatments were autumn composted cattle manure application (M1), autumn composted cattle manure application and additional spring inorganic fertilizer application (MF) and autumn composted cattle manure plus additional spring manure application (MM). Autumn manure application was done in November 2012 (40 Mg fresh matter: 450 kg N and 7.3 Mg C per hectare). In May 2013 (spring), additional 29 Mg fresh manure was applied in the MM plot (300 kg N and 5 Mg C per hectare), and inorganic fertilizer (104 kg N, 139 kg P and 77 kg K per hectare) was applied in the MF plot (Table S2). Lime at the rate of 300 kg CaCO3 was applied in all the plots.

2.3. Measurement of Soil and Climatic Variables

Soil samples from the top 5 cm depth were collected and sieved (2 mm mesh) on each sampling day (every 1–2 weeks) except in winter when we did not collect any soil samples due to freezing conditions. The soils were then extracted with deionized water for nitrate (NO3), pH and water extractable organic C (WEOC) measurements and with 2 M KCl solution for ammonium (NH4+) measurements. The extracts were filtered through 0.2 μm membrane filters and stored at 4 °C until analysis. Soil NO3 concentrations were analyzed by ion chromatography (Dionex QIC Analyzer; Dionex Japan, Osaka, Japan) and soil pH by using a combined electrode pH meter (F-8 pH meter; Horiba, Kyoto, Japan). Ammonium concentration was determined using the indophenol-blue method (UV mini 1240; Shimadzu, Kyoto, Japan). Total organic C (TOC) analyzer (TOC 5000A; Shimadzu, Japan) was used to measure WEOC.
We collected core samples at each soil sampling time for soil bulk density determination and soil moisture content was measured gravimetrically. Soil water-filled pore space was calculated from the measured gravimetric moisture content, bulk density and total porosity [41,42].
Daily precipitation data was obtained from the Sasayama Automated Meteorological Data Acquisition System (AMEDAS) station of the Japan Meteorological Agency, which is located within 1 km from the study site. Soil temperature (5 cm depth) was measured at 30-min intervals by using permanently installed thermocouple thermometers (TR-52, T & D, Nagano, Japan).

Total Soil N and Soil C Analysis

In 2010 and 2012, we collected soils in the F, MF1 and MF2 plots at 0–5, 5–15 and 15–30 cm soil depth to measure total soil N and SOC stored each soil layer. These samples were collected at the end of the growing season. The samples were collected every 10 m in a grid covering the entire field resulting in at least 12 points for each plot. Total N and C were analysed using a C/N analyzer (SUMIGRAPH NC-1000; Sumika Chemical Analysis Service, Ltd., Osaka, Japan). In 2004, prior to the initiation of the treatments, total soil N and SOC was measured [43] and this value was used as the reference for measuring the change in SOC. The amount of SOC stored in the soil layer was calculated based on the equation below [19,44]:
Total C storage (Mg C ha−1) = SOC × BD × H
where SOC is the organic C content (%), BD is soil bulk density (Mg·m−3) and H is the thickness of the soil layer (m).
The rate of SOC accumulation (Mg C ha−1·year−1) in the soil was calculated as the difference between the total C storage per hectare in 2010 or 2012 and the reference year (2004) as mentioned above and divided by the number of years.

2.4. Greenhouse Gas Flux Measurement

The GHGs flux measurements were conducted using the static closed chamber method at 1–2 weeks intervals from late March to late November and 3–4 weeks intervals during the winter season (December to March). Gas sampling was conducted between 8:00 a.m. and 12:00 p.m. on each measuring day to minimize the effect of diurnal temperature variation on gas fluxes.
Chambers used were made of stainless steel and were 20 cm in diameter and 25 cm in height. The cover of the chamber was made of acryl and was equipped with a sample collector and pressure-regulating bag as described by Toma and Hatano [45]. The chambers were placed onto chamber-bases, which were permanently installed into the soil to a depth of about 3 cm. For N2O and CH4 measurements chamber bases were placed in the inter-row space and the other two in intra-row spaces of the corn plants. Chambers for CO2 flux measurements were installed in root excluded plots as described by Shimizu et al. [46], therefore the reported CO2 fluxes represent soil heterotrophic respiration. Gas samples were collected manually using a 50-mL syringe at 0 and 6 min for CO2 and 0 and 20 min for N2O and CH4 after chamber closure [34]. 200-mL sample was then injected into pre-vacuumed Tedlar bags for CO2 measurement and 20-mL gas sample was injected into an evacuated vial bottle for N2O and CH4 analysis.
The CO2 gas concentrations were determined in the laboratory within 6 h after sampling using a CO2 infrared gas analyzer (ZFP9GC11, Fuji Electric, Tokyo, Japan). N2O gas concentrations were determined in the laboratory using a gas chromatograph (GC-14B; Shimadzu, Kyoto, Japan) equipped with an electron capture detector (ECD). CH4 gas concentrations were determined using a flame ionization detector equipped gas chromatograph (GC–8A; Shimadzu, Kyoto, Japan).
The following linear regression equation was used to calculate the gas flux from the soil [47]:
F (mg·m−2·h−1) = ρ × V/A × Δct × [273/(273 + T)] × α
where F is the gas flux; ρ is the density of each measured gas at standard conditions (CO2 = 1.96 × 10⁶ mg·m−3, CH4 = 7.16 × 10⁵ mg·m−3, N2O = 1.97 × 10⁶ mg·m−3, and NO = 1.34 × 10⁶ mg·m−3); V is the volume of the chamber (m3), A is the surface area of the chamber (m2); Δc/∆t (10−6 m3·m−3·h−1) is the ratio of change in gas concentration in the chamber during the sampling time; T is the air temperature inside the chamber (°C); and α is ratio of molar mass of C or N of the molecular weight of each respective gas (CO2 = 12/44, CH4 = 12/16, N2O = 28/44). Based on this equation a positive flux value indicates that gas emission from soil surface into the atmosphere occurred, while negative flux indicates gas sink from the atmosphere into the soil.
Cumulative annual emissions were calculated by linear interpolation between sampling events and numerical integration of underlying area using the trapezoid rule [48].
From the cumulative annual N2O emissions, we calculated inorganic fertilizer N N2O emission factors (EF) using the equation below:
EF = N2O-N (F plot) − N2O-N (CT plot)/N application rate in F plot
The relationship between CO2 flux and soil temperature was calculated using an exponential function (Equation (4)). We then calculated the Q10 values of soil CO2 flux using Equation (5).
CO2 flux = β0 × exp (β1 × T)
Q10 = exp (10 × β1)
where T is the soil temperature at 5 cm depth, β0 and β1 are coefficients of the CO2 flux and temperature function.

2.5. Estimation of NECB, GWP and GHGI

Net ecosystem C balance was calculated using the following equation [37,39,49]:
NECB = C input − C output
C input = manure C + NPP
C output = Harvested C + RH
where manure C is the total C in the applied manure, NPP is net primary production (measured as total C in aboveground and belowground dry plant biomass), harvested C is the total C removed through the harvested plant material and RH is heterotrophic soil respiration (measured as the soil CO2-C from the plant excluded plots). The aboveground biomass was manually harvested by cutting the plant biomass at 8 replications (1.5 m × 1 m area). The belowground biomass was measured at 8 replications (1.5 m × 1 m area) by digging out the corn roots and manually separating the roots from the soil by sieving using a 0.5 mm sieve and then by washing to completely remove the soil particles and other debris. The plant samples were oven-dried at 70 °C for more than 72 h and weighed. Each dried sample was analysed for total C and N contents with a C/N analyzer (SUMIGRAPH NC–1000, Sumika Chemical Analysis Service, Ltd., Osaka, Japan).
Global warming potential (GWP) was estimated based on the following equation adopted from Zhang et al. [17]:
GWP = [ECH4−C × 16/12 × 25 + EN2O−N × 44/28 × 298] × 12/44 − NECB
where GWP is global warming potential (kg CO2-C equivalents ha−1·year−1), ECH4-C and EN2O-N are the annual emission rates of CH4-C and N2O-N (kg·ha−1·year−1). The fractions 16/12 and 44/28 are used to convert the mass of CH4-C to CH4 and the mass of N2O-N to N2O. The constants 25 and 298 are the radiative forcing constants (CO2 equivalents) of CH4 and N2O, respectively, relative to CO2 over a 100-year time horizon [1]. The fraction 12/44 was used to convert CO2 equivalents to CO2-C equivalents for easy comparison of NECB contribution to GWP.
By using the above equation, we measured the direct CO2 equivalents from crop production and we did not consider indirect emissions such as those from fertilizer production and farm operations.
The corn from our study site was used for silage and therefore the GHGI was calculated as GWP divided by biomass yield:
GHGI = GWP/Yield

2.6. Data Analysis

Statistical analysis was done using STATA-13 (Stata Corporation, College Station, TX, USA). Two-way analysis of variance (ANOVA) was used to evaluate the treatment and annual differences in GHG fluxes, GWP and GHGI. Pearson’s correlation test was used to test the relationship between weather and soil variables with GHG fluxes and cumulative annual emissions.

3. Results

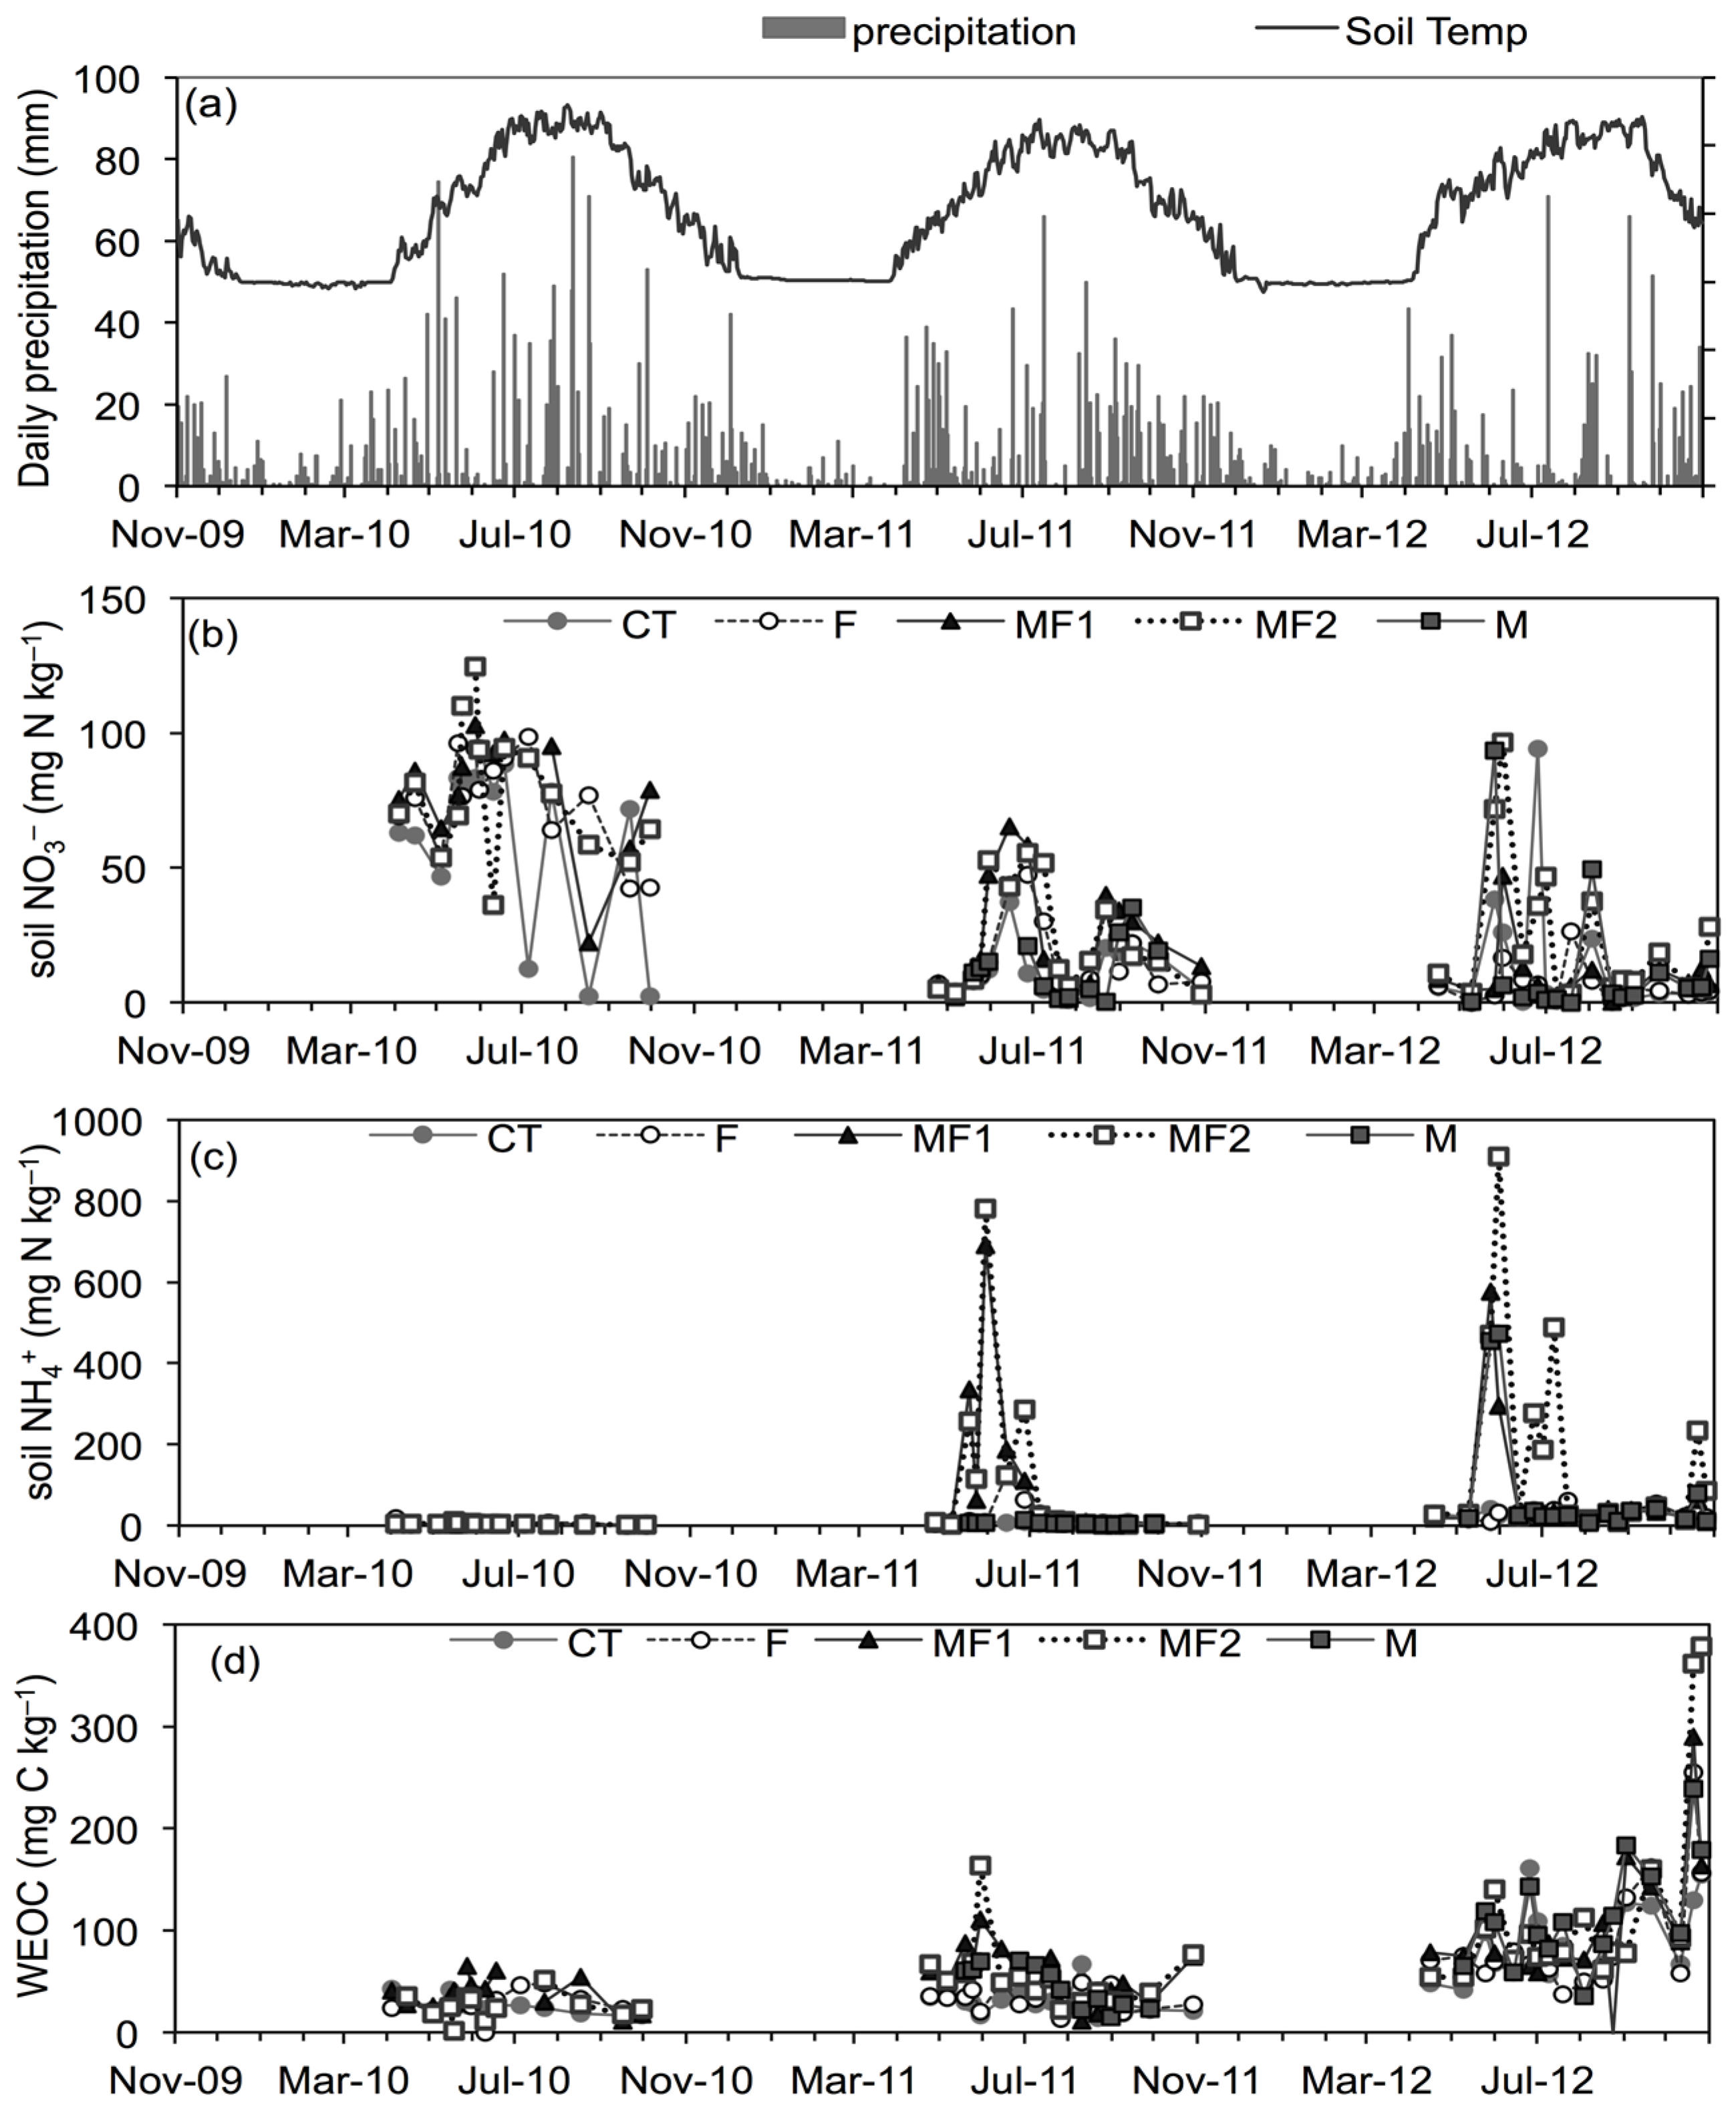
3.1. Soil and Environmental Variables

Monthly average air temperatures ranged from −10.7 °C to 30.5 °C with the lowest temperatures observed in February, while the maximum temperatures were recorded between July and September. Average air temperatures were less than 0 °C from December to March. Soil temperature followed the same trend with air temperature. The soil temperature ranged from −4.0 °C to 27 °C (Figure 1a).
Average monthly precipitation ranged from 5 to 224 mm. The driest months with lowest precipitation were from January to March and the wettest months were from July to September. Annual precipitation was 1120, 1006 and 1066 mm in 2010, 2011 and 2012 respectively.
Soil NO3 concentrations increased in May after fertilizer application and were higher in MF2, MF1 and F plots compared to CT and M plots (Figure 1b). Short-lived peaks in NO3 concentration were sometimes observed after manure application. Nitrate concentrations were higher in 2010 in all plots and lowest in 2012. In the unfertilized control plot, average NO3 concentration was 60 mg·kg−1 in 2010 but decreased to 12 mg·kg−1 in 2012. The high NO3 concentrations 2010 could have resulted from N mineralization, as this was the first year after the conversion from grassland to cornfield.
Annual and seasonal variations in soil NH4+ concentrations showed a different trend from that of soil NO3 concentrations (Figure 1c). Ammonium concentrations were highest in 2012 and very low concentrations were observed in 2010. Overall very high variations in NH4+ concentration were observed with values ranging from 0 to 900 mg·N·kg−1. Highest NH4+ concentrations were observed in spring just after soil melting and after fertilization and the peaks were more pronounced in MF2 and MF1 plots. The manure amended plots also showed the highest variations in NH4+ concentrations.
Water extractable organic C was significantly lower in 2010 and increased annually with highest concentrations found in 2012 (Figure 1d). Water extractable organic C was higher in the manure-amended plots (MF1, MF2 and M) than the plots without manure application (p < 0.01).
Soil pH varied among the different treatments and increased from 2010 to 2012 due to liming. Soil pH was generally lower in MF2 and F plots compared to CT, MF1 and M plots. The average annual soil pH ranged from 4.8–5.6, 4.7–5.5 in F and MF2 plots, and 5.2–5.7, 5.0–5.7 and 5.7–5.8 in CT, MF1 and M plots respectively.
Table S3 shows the total C and N contents measured at 0–5, 5–15 and 15–30 cm soil depth in the F, MF1 and MF2 plots. In all the plots, C and N contents were highest in the 0–5 cm soil depth and lowest in the 15–30 cm soil depth except in 2012 in F plot when the topsoil (0–5 cm depth) showed lower C content than the sub soil (15–30 cm depth). Soil C and N contents were higher in the manure-amended plots. MF1 plot which had been receiving manure for a longer period (since 2005) showed higher C and N contents than MF2 which only started receiving manure in 2009/2010 season. From the soil C content, we calculated the total C stock in the top 15 cm depth and the result clearly shows higher C stock in manure-amended plots, although the differences were statistically significant only in 2012 (Table 1).

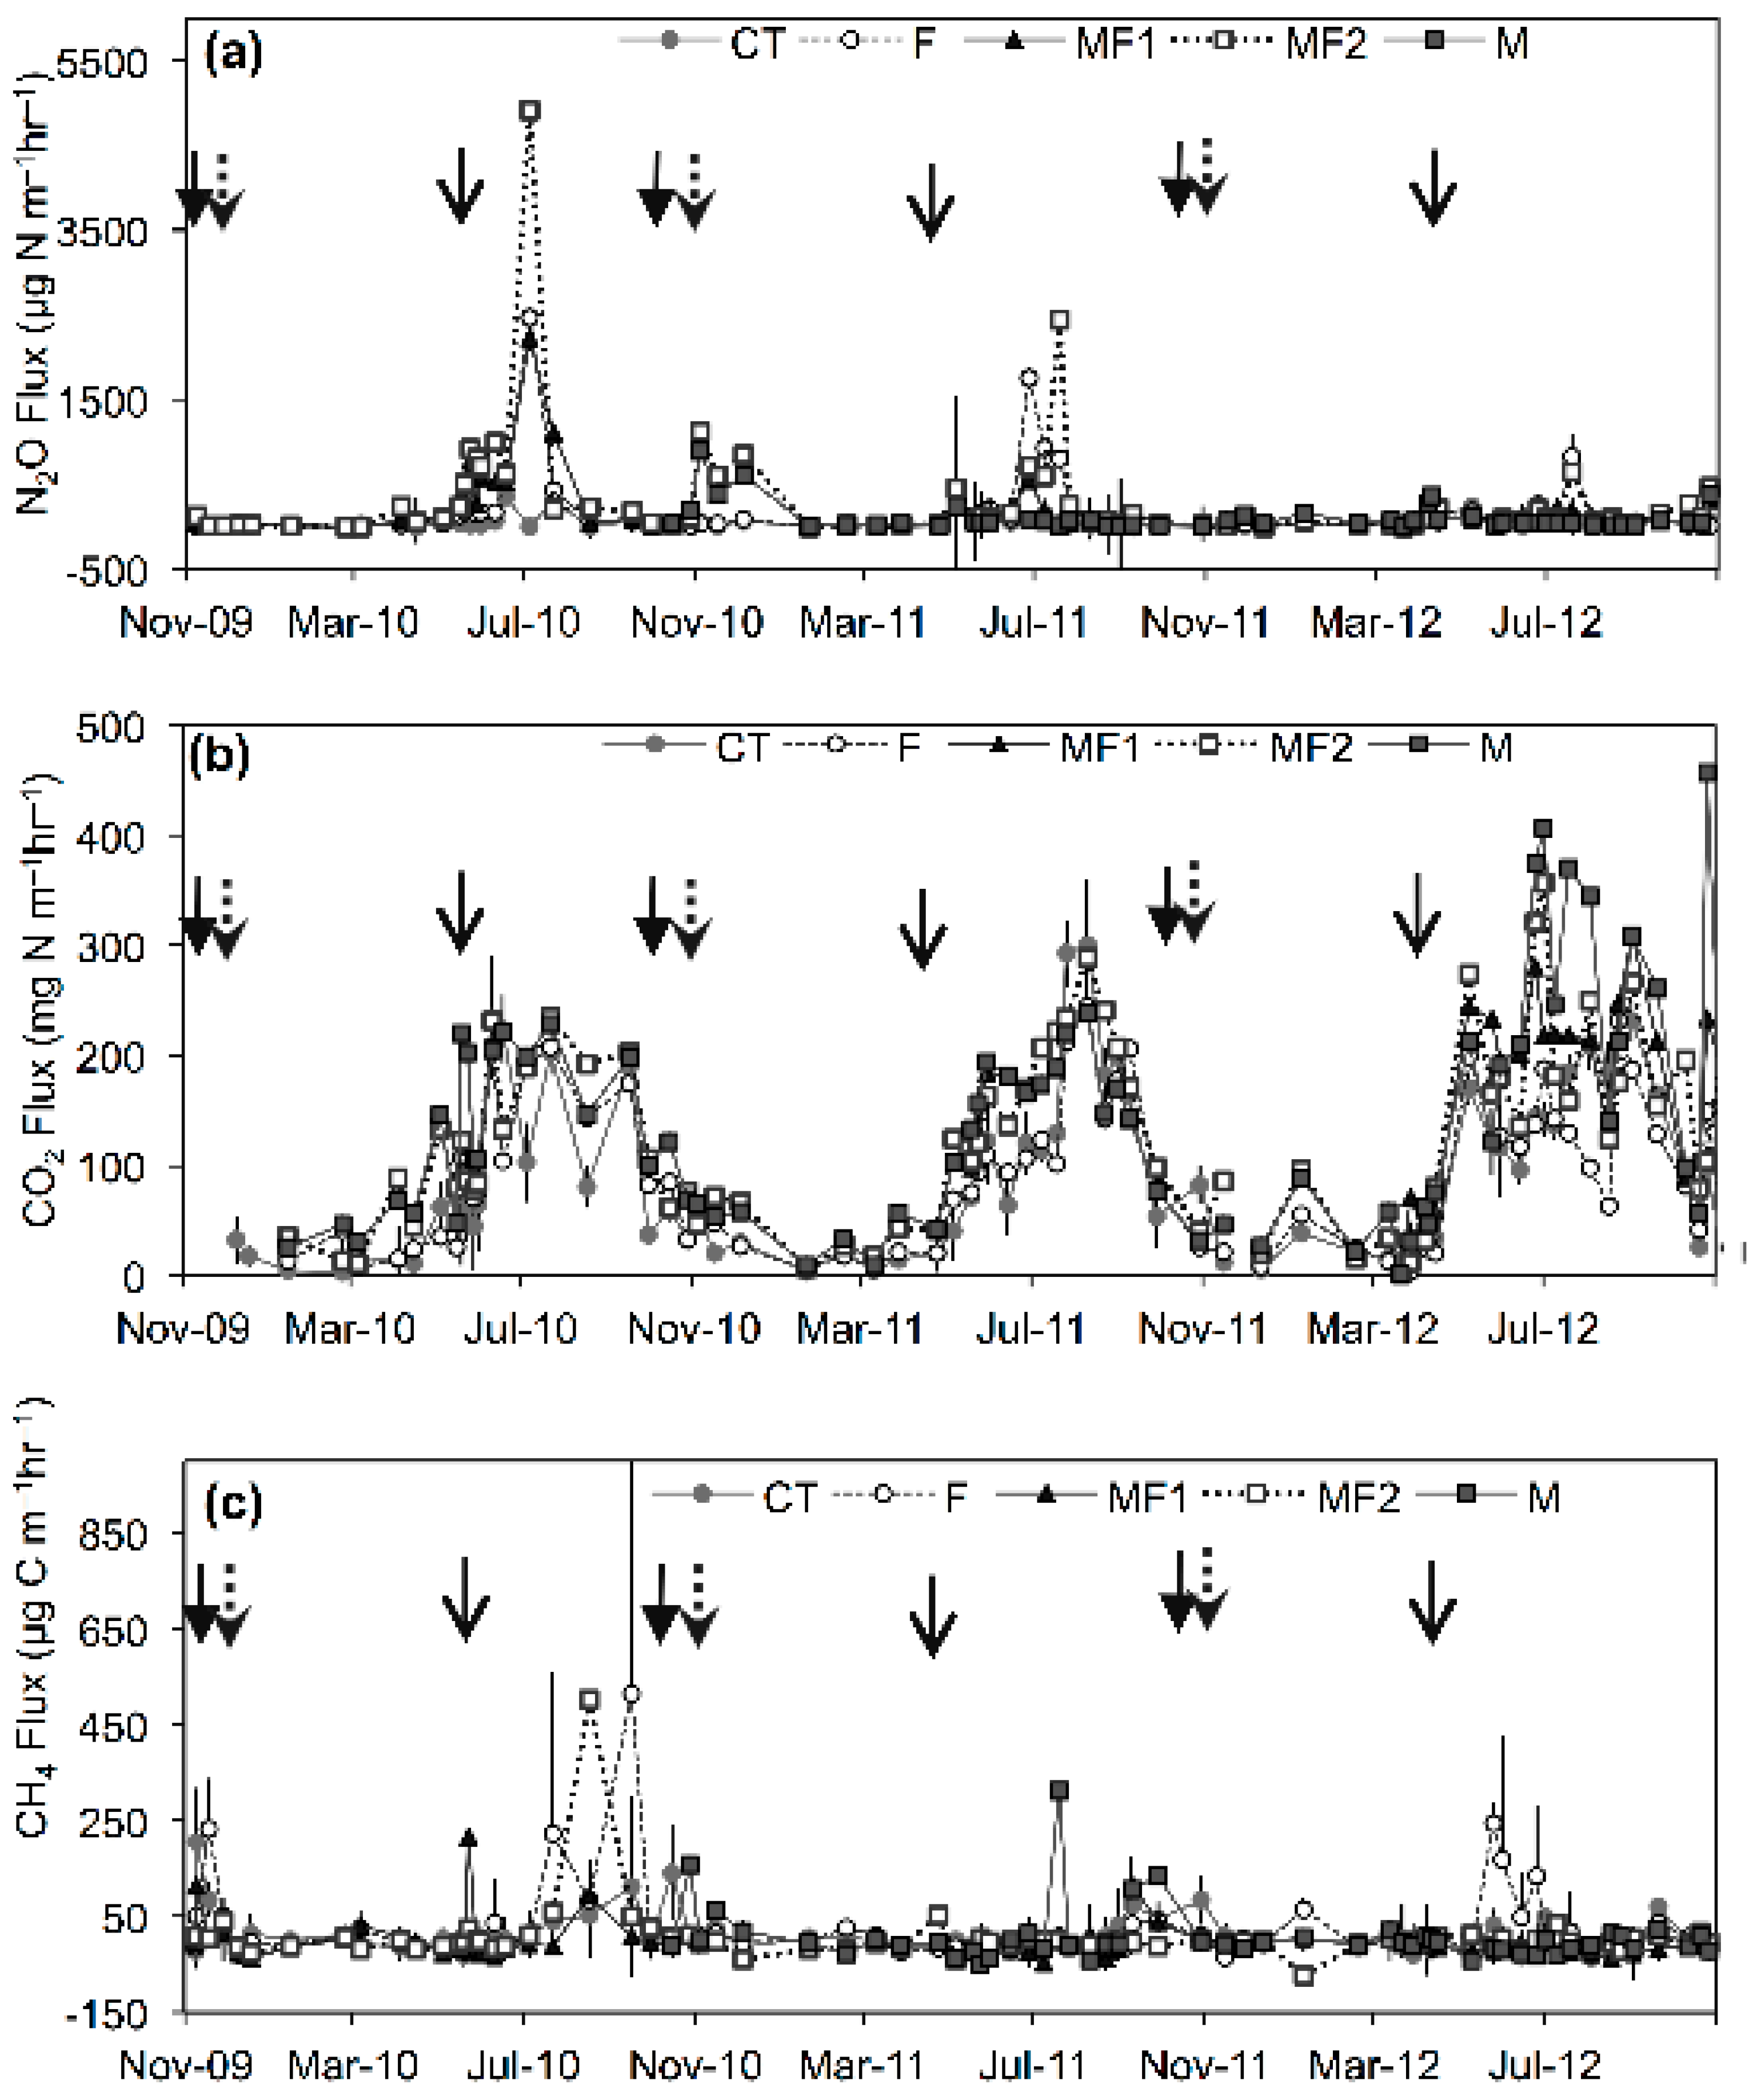
3.2. Greenhouse Gas Emissions-Experiment 1

3.2.1. Nitrous Oxide Emissions

Nitrous oxide fluxes were very episodic and highly varied within and across years (Figure 2a). Intra-annual variations were highly influenced by mean daily temperature and rainfall.
As expected, N2O emissions were stimulated by fertilization and fluxes were higher in the growing season compared to the non-growing season. However, the highest N2O fluxes were observed several weeks after fertilization and occurred following rainfall events. The highest fluxes in 2010 were found on June 18 in CT plot (352 μg N m−2·h−1) and on July 5 in F (2461 μg N m−2·h−1), MF1 (2223 μg N m−2·h−1) and MF2 (4913 μg N m−2·h−1). High rainfall was recorded on June 16 (>30 mm) and more than 60 mm from 1 to 4 July. In 2011, rainfall of more than 50 mm was recorded between 23 and 24 June, and rainfall more than 100 mm was recorded between 14 and 16 July. The highest N2O fluxes in 2011 were found on 27 June in F (1757 μg N m−2·h−1), CT (638 μg N m−2·h−1) and MF1 (553 μg N m−2·h−1) plots, and on 19 July in MF2 plot (2450 μg N m−2·h−1). The highest fluxes in all the five treatments in 2012 were found in either June or July and were all preceded by rainfall of more than 50 mm.
Nitrous oxide fluxes were highest in 2010, followed by 2011 and 2012, respectively and the fluxes were higher in plots with inorganic fertilizer application (F, MF1 and MF2) compared to CT and M plots.
Total annual N2O emissions averaged 4.4 ± 1.2, 12.7 ± 5.2, 14.9 ± 7.6, 22.4 ± 12.5 and 8.6 ± 4.3 kg N ha−1·year−1 for CT and F, MF1, MF2 and M plots, respectively (Table 2). There were significant differences in N2O emission among plots (p < 0.001) and across years (Table 2). Annual N2O emissions were highest in MF2 plot, followed by MF1 and F plots, and lowest in M and CT plots, respectively. N2O emissions in M and CT plots were not significantly different. Based on the annual emissions in Table 2, the average EFs for inorganic fertilizer were 12.9% ± 15.3%, 7.5% ± 6.8% and 3.5% ± 2.9% in 2010, 2011 and 2012 respectively.

3.2.2. Carbon Dioxide Emissions

The pattern of CO2 fluxes was similar to those of soil temperature with the highest fluxes found in summer and lowest fluxes in winter during soil freezing period (Figure 2b). The fluxes had a significant positive exponential relationship with soil temperature measured at 5 cm (Figure S1). The highest recorded CO2 fluxes in each plot occurred when soil moisture content (WFPS) was lower than 65%.
CO2 fluxes tended to be higher in manure plots (MF1, MF2 and M) ranging from 1.2 to 458 mg C m−2·h−1 compare to non-manure plots (F and CT) which ranged from 3.1 to 299 mg C m−2·h−1. The average cumulative annual CO2 emissions from 2010 to 2012 were 6.7 ± 0.2, 5.9 ± 1.0, 8.9 ± 1.2, 9.0 ± 0.7 and 9.0 ± 1.7 Mg C ha−1·year−1 (mean ± SD) in CT, F, MF1, MF2 and M plots, respectively (Table 2). The annual CO2 emissions in manure-amended plots (MF1, MF2 and M) were significantly higher than in F and CT plots (p < 0.001). There was no significant difference among MF1, MF2 and M plots in annual CO2 emission. Significant differences in annual CO2 emission among plots (p < 0.001) and across years (p < 0.01) were observed and the interaction between plots and years was significant (p < 0.05).

3.2.3. Methane Emissions

Methane fluxes were mostly negative indicating CH4 consumption in all plots in this study (Figure 2c). However, there was a very wide range of fluxes ranging from −53.6 ± 140.7, −36.2 to 515.5, −51.8 to 313.1, −74.0 to 503.0 and −50.2 ± 50.3 μg C m−2·h−1 in CT, F, MF1, MF2 and M plots, respectively. This very wide range was due to very high fluxes (>50 μg C m−2·h−1) observed following rainfall of more than 40 mm within 4 days preceding the gas sampling or when WFPS was more than 75% in all the plots. These high CH4 fluxes accounted for less 10% of the observed data, but significantly raised the average annual fluxes. The extremely high CH4 fluxes (>50 μg C m−2·h−1) increased the average annual flux (μg C m−2·h−1) from −1.8 to 7.4 in CT plot, −2.8 to 20.8 in F plot, −7.5 to 1.0 in MF1, −3.2 to 5.1 in MF2 and −6.4 to 6.2 in M plot. Methane fluxes were not significantly different among the plots, but tended to be higher in CT and F plots compared to the manure-amended plots.
Annual CH4 emissions were not different among all plots but there was a significant difference across the years, and ranged from −0.7 to 5.1 kg C ha−1·year−1 (Table 2). Methane emissions were significantly higher in 2010 than in 2011 and 2012 (p < 0.01). The average total annual CH4 emissions were 0.5 ± 0.8, 2.2 ± 2.6, 0.0 ± 0.6, 1.0 ± 0.8 and 0.3 ± 1.3 kg C ha−1·year−1 in CT, F, MF1, MF2 and M plots, respectively, over the three-year period from 2010 to 2012. Without the extreme CH4 fluxes (>50 μg C m−2·h−1 observed after high rainfall) all plots were net CH4 sinks.

3.3. Effect of Additional Spring Manure Application on Greenhouse Gas Emissions-Experiment 2

The second experiment aimed at comparing the effect of additional manure and inorganic fertilizer application in spring on GHG emissions and crop growth. From Table 3, it was clear that applying manure twice, in autumn and spring, increased the plant productivity (NPP) to the same level as the plot that received inorganic fertilizer, without a net increase in CO2, CH4 or N2O fluxes. This result means farmers in this region could potentially increase productivity by applying manure twice in autumn and spring even without using inorganic fertilizer. Most importantly, the second application of manure in spring led to significant increase in NECB and significant reduction in GWP compared to additional inorganic manure application (Table 3).

3.4. Factors Controlling GHG Emissions

Nitrous oxide fluxes had statistically significant (p < 0.01) positive linear regression relationships with soil temperature and soil NO3 concentration and a significant negative relationship with soil pH (Table 4). Cumulative annual N2O emissions showed significant positive linear relationships with N input (r = 0.62, p < 0.05) and precipitation in growing season (r = 0.56, p < 0.05), and a negative linear relationship with soil pH (r = −0.72, p < 0.01). Average annual N2O emission in MF1 plot was lower than in MF2 plot despite both plots receiving the same amount of manure and inorganic fertilizer possibly due to the lower pH in MF2. This seems to suggest that long-term manure application in MF1 buffered against lowering of pH by inorganic fertilizer application.
Methane fluxes were significantly correlated with soil temperature and moisture. Soil moisture seemed to be the most important factor driving CH4 fluxes and all the disproportionately high fluxes (>50 μg CH4-C m−2·h−1) were observed when soil WFPS was more than 70%. Soil chemical properties did not show any significant correlations with the instantaneous CH4 fluxes (Table 4). However, cumulative annual CH4 emissions had significant linear relationships with soil NO3 (r = 0.66, p < 0.01) and soil pH (r = −0.61, p < 0.05).
Soil CO2 fluxes had positive and significant linear relationships with soil pH and soil temperature and significant negative correlation with soil NO3 concentration and soil WFPS (Table 4). The CO2 flux increased exponentially with increasing soil temperature (Figure S1) and the resulting Q10 values were 3.2, 2.8, 2.3, 2.5 and 2.3 in the CT, F, MF1, MF2 and M plots, respectively. The annual CO2 emissions significantly increased with manure application (p < 0.01) and this could be largely due to the C input from manure. Multivariate regression analysis showed that soil temperature, WFPS and WEOC concentration explained 55% of the seasonal variation in CO2 fluxes (CO2 flux (mg C m−2·h−1) = −98.89 + 11.86 soil temperature − 2.57 WFPS (%) + 0.32 WEOC (mg C kg−1); R2 = 0.55; p < 0.001).

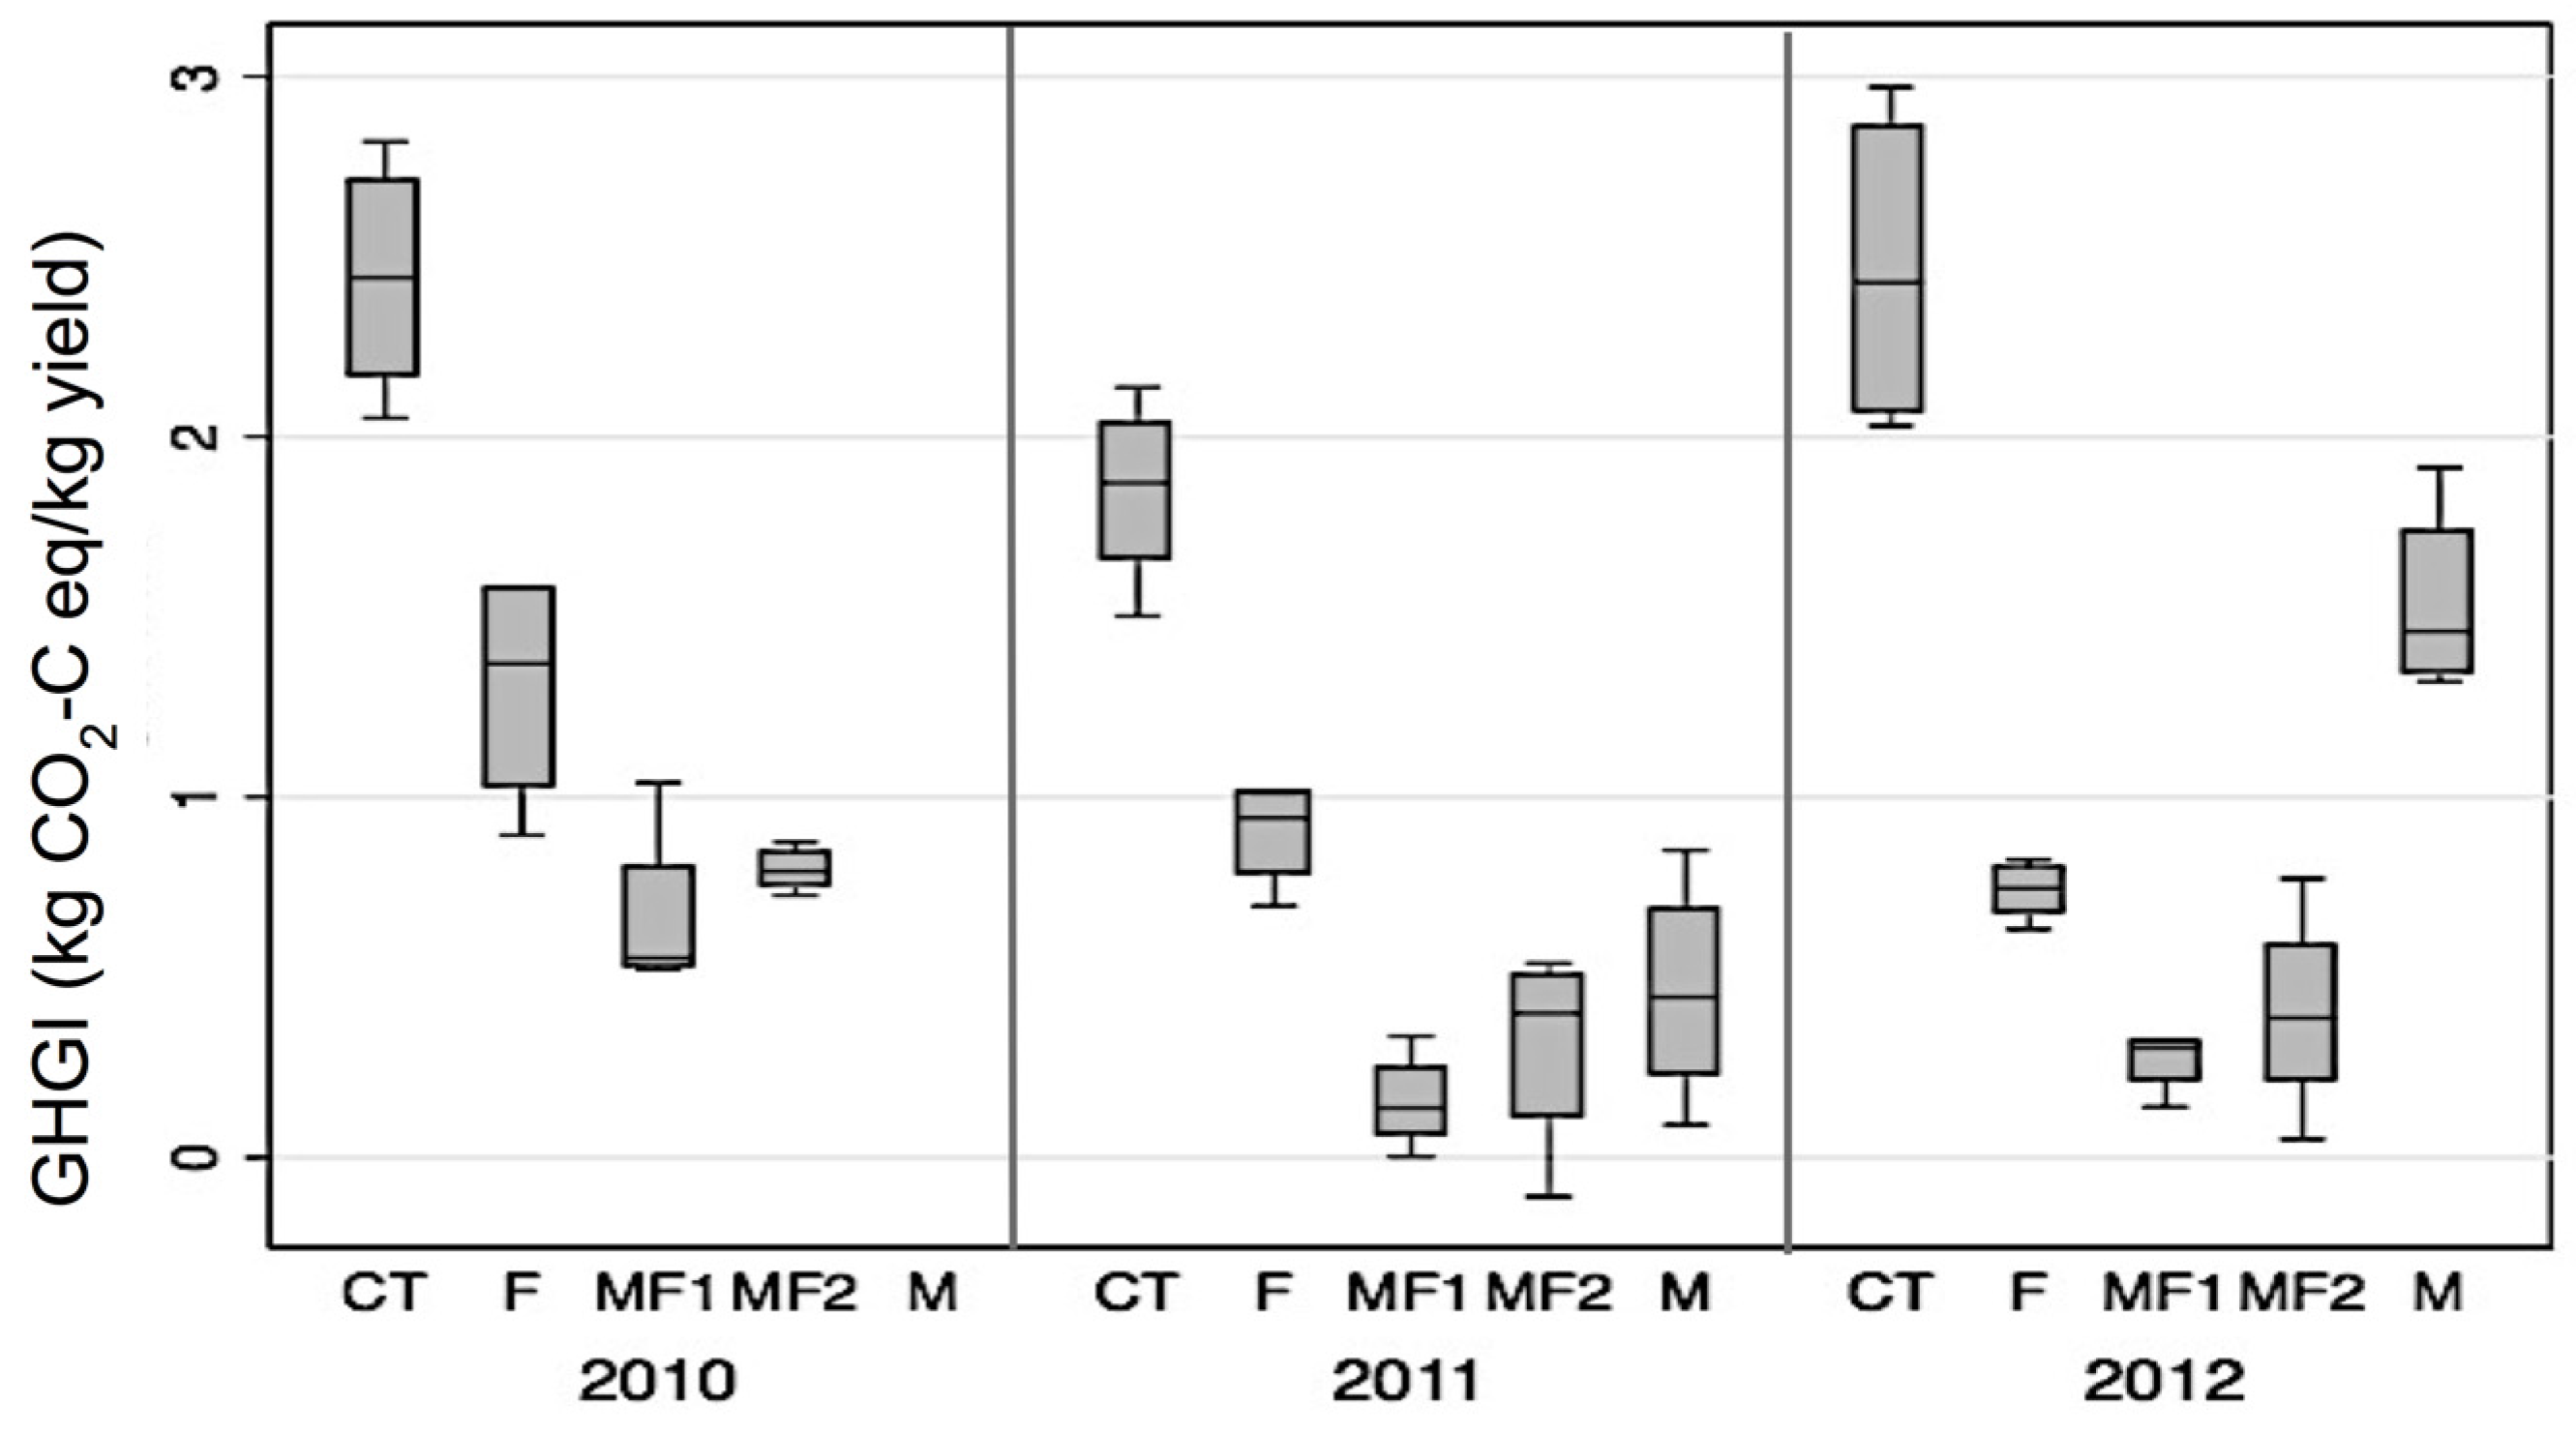
3.5. Effect of Fertilizer and Manure on NPP, NECB, GWP and GHGI

Inorganic fertilizer significantly increased the net primary production (NPP) in each of the three years in experiment one and also in 2013 in experiment two (Table 2 and Table 3). However due to C export from the field through the harvested material, inorganic fertilizer did not increase NECB. Manure application, on the other hand, had a positive but non-significant effect on NPP in experiment 1. However the second application of manure in spring in experiment 2 significantly increased NPP (Table 3), and there was no significant difference between MF and MM plots. Manure input in both experiments 1 and 2 significantly increased NECB.
Global warming potentials, in experiment 1, were lowest in MF1 and MF2 plots and highest in F and CT plots (Table 2). Global warming potential ranged from 6.4 to 7.1 Mg CO2-C eq·ha−1·year−1 in the unfertilized control. Both inorganic and manure fertilization showed potential to reduce the GWPs mainly due to C addition from the manure and also from the increased plant biomass residue left after harvest. In experiment 2, high manure input in MM plot significantly raised the NECB and as a result the GWP was negative. Net ecosystem C balance had the largest contribution to GWP and consequently, manure application seemed to significantly reduce GWP.
Greenhouse gas intensities, presented in Figure 3, were different among the plots. The control plot always had the highest GHGI followed by F plot. Combined manure and inorganic fertilizer plots (MF1 and MF2) always had the lowest GHGIs due to high C input through manure and also high crop residue addition as both had higher NPP and yield. Greenhouse gas intensity in M plot was lower than that in F plot in 2011, but the opposite in 2012.

4. Discussion

4.1. Influence of Inorganic Fertilizer and Manure Application on GHG Emissions

Application of inorganic and manure fertilizers increased N2O emissions by 2–5 times compared to the unfertilized control treatment (Table 2). Carbon dioxide fluxes only increased following manure application but not inorganic fertilizer application. Neither inorganic nor manure fertilization seemed to significantly influence CH4 fluxes.
Increased N2O emissions with increased N addition was expected as it is widely reported that the two most important N2O production pathways in the soils, nitrification and denitrification, are stimulated by high N input [13,41,50,51,52,53]. In this study, the average inorganic fertilizer N2O emission factor was 7.8% (ranging from 3.5% to 12.9%), which was significantly higher than the default IPCC value of 1% and also higher than several published values of between 0.1% to 3% [54,55,56,57]. However, our emission factors were similar to those reported by Flessa and Dorsh [58] in Germany of 5.1%–8.8% in a wheat field and by Mackenzie et al. [59] of 0%–8% in corn field. High emission factors in this study could be due to the relatively high soil NO3 concentrations especially in 2010. The reason for the high NO3 content could have been due to the stimulation of litter and organic matter decomposition and mineralization after the conversion from grassland to cornfield in November 2009. The manure N2O emission factors ranged from 0.2% to 0.9% and are similar to those reported by Collins et al. [60] (0.05%–0.1%) and Akiyama et al. [61] (0.01%–1.6%).
Despite both manure and inorganic fertilizers increasing N2O emissions, the manure-only treatments had significantly lower emissions than the inorganic fertilizer plot. In experiment 2, manure application in MM plot was done twice and at almost twice the amount of that applied in M1 plot but did not lead to increased N2O emissions (Table 3), and almost doubled the net primary production. Nitrous oxide emissions and plant productivity in MM and MF plots were similar which suggests that application of manure twice instead of once can enable organic farmers achieve similar productivity levels with conventional farmers using inorganic fertilizers.
More than 5 years of manure application (MF1 and M plots in experiment 1) had an added positive influence of maintaining higher pH values than the inorganic fertilized plot and this could have further benefits in reducing the N2O emissions given the strong negative relationship between soil pH and N2O emissions (Figure S2). Manure application increased and maintained soil pH by increasing the buffering capacity of soils due to the presence of carboxyl and phenolic hydroxyl groups in the manure [62] or due the high pH of the manure itself (manure pH was around 7). Presence of cations (like calcium, magnesium, etc.) and organic N forms in manure could have also increased the soil pH in manure-amended treatments [62].
High CH4 emission in inorganic fertilizer amended soils due to fertilizer N inhibition of CH4 oxidation has been reported in many studies [51,63]. We did not find the evidence of higher CH4 emissions in plots amended with inorganic fertilizer in this study and there was no significant difference in annual CH4 emissions among the plots. However, the highest CH4 fluxes were always found in the fertilized plots (Figure 2c) and there was a significant positive correlation between average annual CH4 flux and average annual soil mineral N concentration (R2 = 0.65, p < 0.05). This might suggest inhibition of CH4 oxidation when soil mineral N is high [5,7,64].
Carbon dioxide fluxes and cumulative annual emissions significantly increased due to manure application but not due to inorganic fertilization. Increased availability of C substrates from the manure was likely the major reason for the observed result [4,29,65,66,67].

4.2. Soil and Environmental Factors Controlling GHG Emissions

Key soil and climatic variables controlling all the three GHG emissions in this study were soil temperature, soil moisture and rainfall. Soil NO3 concentrations and soil pH were important factors for N2O and CO2 (Table 4).
While soil N2O fluxes were heavily influenced by N fertilization (both inorganic and manure), the highest fluxes were all found just after rainfall of more than 30 mm within the week preceding the flux measurement date. Ryals and Silver [68] also reported elevated N2O up to four days from the wetting of soils. Annual N2O emissions were also very high in 2010, which was the wettest year. Other studies have reported high N2O emission when rainfall and moisture are high [4,69,70,71]. The high N2O fluxes observed after high rainfall were likely due to denitrification [4,34,71] as a result of increased soil moisture.
Soil pH was a major factor controlling annual N2O emissions and this agrees with previous reports [72,73]. The N2O reductase enzyme is reported to be more active at low soil pH relative to activities of NO3 and NO2 reductase enzymes [73], which could have resulted in the reduced N2O reduction to N2 during denitrification and consequently higher fluxes at low soil pH.
The most important factors controlling CH4 emission in this study were soil moisture and temperature. Very high CH4 fluxes were observed when WFPS was 75% or higher. Less than 10% of the total CH4 flux measurements (all recorded when WFPS > 75%) accounted for 50%–150% of the cumulative average annual CH4 emissions. These high CH4 fluxes significantly reduced CH4 sink in soil and were solely responsible for the observed positive cumulative annual CH4 emissions. This indicates that while this upland cornfield was generally a sink for CH4 under usual moisture levels, increased occurrence of high rainfall and soil moisture above 75% WFPS could lead to significant CH4 emissions. Several studies have reported WFPS value of 70%–75% as the optimum for high CH4 production [10,74,75,76] and this could be due to both low production of CH4 and low air permeability at high WFPS levels [5].
Carbon dioxide flux is influenced by soil temperature, moisture content and availability of C substrates [74,75,76,77,78,79,80]. The relationship between soil temperature and CO2 flux (Figure S1) in this study was best described by an exponential curve and this agrees with several published studies [81,82,83,84]. From the exponential curves, we estimated average Q10 values and these were 3.2, 2.8, 2.3, 2.5 and 2.3 in the CT, F, MF1, MF2 and M plots, respectively. These Q10 values are in agreement with reported values from other studies [74,78,80,85]. From these values, it seems manure application led to slightly lower Q10 values despite the manure plots having higher WEOC, although we can not make definite conclusions from this study. If this was true, it would be contrary to Liu et al. [85] who reported higher Q10 values when WEOC was high. The seemingly lower Q10 values in manure-amended plots might be due to the larger influence of manure C on CO2 emissions.
Soil CO2 flux negatively correlated to soil WFPS (Table 4) with highest fluxes found when WFPS was between 40% and 60%. This WFPS range also showed the lowest CH4 fluxes. A conclusion can therefore be made that there was high C oxidation when WFPS was low and the opposite was true when WFPS was above 70% [54,86].

4.3. Effect of Fertilizer and Manure on NECB and GWP

Carbon sequestration calculations should include all C inputs and losses in an agro-ecosystem [17,38,87,88]. The calculated NECB values in this study show that manure application is important for increased C sequestration as a direct C input and it significantly mitigates the C losses from harvested C and CO2 emission (Table 2). While all plots showed negative NECB values in 2010 and 2012, the NECB in manure plots was significantly higher. Results from experiment 2 show that applying manure twice in autumn and spring significantly increased NECB through direct C input but also by increasing the net primary production and hence the C input through residue left in the field. The effect of fertilization on soil C pools is related to the amount of C applied and C produced/retained to the soil [89]. High NECB in MM plot in experiment 2 was achieved without increased emissions of CO2, CH4 or N2O compared to the plot with combined manure and fertilizer application (Table 3). Higher NECB values, indicating increased C sequestration [17], in manure amended plots have been reported previously [32,87]. Total soil C content and total C stock, measured in 2010 and 2012, were higher in manure-amended plots (Table 1 and S3) indicating higher C sequestration due to manure application. Compared to the non-manure plot, manure application increased soil C stock in the top 15 cm by 20.7 ± 11.7 Mg C ha−1 which is similar to 19 Mg C ha−1 reported by Owen et al. [64]. Pathak et al. [19] also reported higher C accumulation when farmyard manure was applied along with inorganic fertilizer.
Adequate manure application done twice in spring and autumn show a potential to increase not only the plant productivity to the same level of inorganic fertilized plot but also with the added benefit of storing more C in the soil as evidenced from results of experiment 2. Net GWP values (Table 2) and GHGIs (Figure 3) show that combined manure and inorganic fertilization had the highest potential for mitigating net GHG emissions, which we attribute to both increased NPP and also to increased direct C input into the soil. Composted manure application has been shown in other studies to reduce net GHG emissions [17,64]. Without consideration of the C input from manure, GWP values (from N2O and CH4) were significantly lower in the unfertilized control plot and highest in the inorganic fertilized treatments but there were no significant differences in the net GWPs of the manure plus inorganic fertilizer (MF) and inorganic fertilizer-only (F) plots (Table S4). However, when these GWP values were yield-scaled (GHGI) no significant differences were observed among the plots (Table S4). This clearly shows that when evaluating effects of manure and fertilizer management on net GHG emissions, the benefits obtained from increased productivity should be considered. Further research to determine the optimum application rates and ratios of the inorganic fertilizer and composted manure is recommended. N2O emissions were more stimulated by inorganic fertilizer than by composted manure and therefore reduced application of inorganic fertilizer and partial substitution with composted manure could help reduce net GHG emissions, a result which has been found in other studies [56,75,90].

5. Conclusions

In this three-year field study, we evaluated the effect of inorganic fertilizer and composted cattle manure application on GHGs, GWPs and GHGI in a cornfield. Nitrous oxide emissions increased following both inorganic and manure application although we did not find significant influence of manure and inorganic fertilizer in 2012. Methane fluxes were not influenced by the soil amendments while CO2 fluxes increased with manure application. By applying manure twice, in autumn and spring in experiment 2, high plant productivity was achieved without increased GHG emissions compared to one-time manure application. Our study found that application of manure led to significant reductions in net GWP and GHGI and this was largely due to direct C input to the soil and also through increased plant productivity.
Measured N2O fluxes were significantly elevated by rainfall of more than 30 mm within 7 days just before flux measurement. Cumulative N2O emissions were controlled by soil pH, growing season rainfall and soil mineral N concentration. Less than 10% of CH4 measurements accounted for 50%–100% of the total annual emissions and these were all observed when WFPS was more than 70%. Soil temperature influenced the seasonal change in CO2 emissions, and manure application seemed to reduce the Q10 values of heterotrophic soil respiration.

Supplementary Materials

The following are available online at www.mdpi.com/2077-0472/7/2/13/S1 as supplementary data; Figure S1: Relationship between soil temperature (5 cm) and CO2 flux in experiment 1, Figure S2: Relationship between annual N2O emission and annual average soil pH (data from experiment 1), Table S1: Rates of inorganic fertilizer nitrogen and gross manure carbon and manure nitrogen input from 2010 to 2012 (Experiment 1), Table S2: Rates of inorganic fertilizer nitrogen and gross manure carbon and manure nitrogen input in experiment 2, Table S3: Soil carbon and nitrogen content (% per kilogram of soil) in the F, MF1 and MF2 plots (in experiment 1) in each soil depth in 2010 and 2012 and Table S4: Average annual CH4 and N2O emissions (in carbon dioxide equivalents; CO2-eq), net global warming potential (GWP) and net greenhouse gas intensity (GHGI) from CH4 and N2O in experiment 1.

Acknowledgments

This study was partly supported by a research grant provided by the Project “Development of Mitigation Technologies to Climate Change in the Agriculture Sector (FY 2010–2014)” run by Ministry of Agriculture, Forestry and Fisheries of Japan. The author thanks the staff and management of the Hokkaido University’s Shizunai Livestock experimental farm for their assistance in field management activities.

Author Contributions

I.M., S.M. and R.H. conceived and designed the experiment; I.M. and S.M. performed the experiment; R.H. provided reagents/materials/analysis tools; I.M. wrote the paper.

Conflicts of Interest

The authors declare no conflict of interest.

References

  1. Innternational Panel Climate Change. Climate Change 2007: The Physical Science Basis; Contribution of Working Group I to the Fourth Assessment Report of the Intergovernmental Panel on Climate Change; Solomon, S., Qin, D., Manning, M., Chen, Z., Marquis, M., Averyt, K.B., Tignor, M., Miller, H.L., Eds.; Cambridge University Press: Cambridge, UK; New York, NY, USA, 2007. [Google Scholar]
  2. Smith, P.; Martino, D.; Cai, Z.; Gwary, D.; Janzen, H.; Kumar, P.; Mccarl, B.; Ogle, S.; Mara, F.O.; Rice, C.; et al. Greenhouse gas mitigation in agriculture. Philos. Trans. R. Soc. B 2008, 363, 789–813. [Google Scholar] [CrossRef] [PubMed]
  3. Smith, P.; Bustamante, M.; Ahammad, H.; Clark, H.; Dong, H.; Elsiddig, E.; Haberl, H.; Harper, R.; House, J.; Jafari, M.; et al. Agriculture, Forestry and Other Land Use (AFOLU). In Climate Change 2014: Mitigation of Climate Change. Contribution of Working Group III to the Fifth Assessment Report of the Intergovernmental Panel on Climate Change; Edenhofer, O., Pichs-Madruga, R., Sokona, Y., Farahani, E., Kadner, S., Seyboth, K., Adler, A., Baum, I., Brunner, S., Eickemeier, P., et al., Eds.; Cambridge University Press: Cambridge, UK; New York, NY, USA, 2014; pp. 811–922. [Google Scholar]
  4. Alluvione, F.; Bertora, C.; Zavattaro, L.; Grignani, C. Nitrous Oxide and Carbon Dioxide Emissions Following Green Manure and Compost Fertilization in Corn. Soil Sci. Soc. Am. J. 2010, 74, 384. [Google Scholar] [CrossRef]
  5. Tate, K.R. Soil methane oxidation and land-use change—From process to mitigation. Soil Biol. Biochem. 2015, 80, 260–272. [Google Scholar] [CrossRef]
  6. Bayer, C.; Gomes, J.; Vieira, F.C.B.; Zanatta, J.A.; De Cássia Piccolo, M.; Dieckow, J. Methane emission from soil under long-term no-till cropping systems. Soil Tillage Res. 2012, 124, 1–7. [Google Scholar] [CrossRef]
  7. MacDonald, J.A.; Skiba, U.; Sheppard, L.J.; Ball, B.; Roberts, J.D.; Smith, K.A.; Fowler, D. The effect of nitrogen deposition and seasonal variability on methane oxidation and nitrous oxide emission rates in an upland spruce plantation and moorland. Atmos. Environ. 1997, 31, 3693–3706. [Google Scholar] [CrossRef]
  8. Saggar, S. Estimation of nitrous oxide emission from ecosystems and its mitigation technologies. Agric. Ecosyst. Environ. 2010, 136, 189–191. [Google Scholar] [CrossRef]
  9. Dobbie, K.; Smith, K.; Management, R.; Building, D.; Road, M. Nitrous oxide emission factors for agricultural soils in Great Britain: The impact of soil water filled pore space and other controlling variables. Glob. Chang. Biol. 2003, 9, 204–218. [Google Scholar] [CrossRef]
  10. Mazzetto, A.M.; Barneze, A.S.; Feigl, B.J.; van Groenigen, J.W.; Oenema, O.; Cerri, C.C. Temperature and moisture affect methane and nitrous oxide emission from bovine manure patches in tropical conditions. Soil Biol. Biochem. 2014, 76, 242–248. [Google Scholar] [CrossRef]
  11. Allen, D.E.; Kingston, G.; Rennenberg, H.; Dalal, R.C.; Schmidt, S. Effect of nitrogen fertilizer management and waterlogging on nitrous oxide emission from subtropical sugarcane soils. Agric. Ecosyst. Environ. 2010, 136, 209–217. [Google Scholar] [CrossRef]
  12. Li, L.; Han, X.; You, M.; Horwath, W.R. Nitrous oxide emissions from Mollisols as affected by long-term applications of organic amendments and chemical fertilizers. Sci. Total Environ. 2013, 452–453, 302–308. [Google Scholar] [CrossRef] [PubMed]
  13. Shcherbak, I.; Millar, N.; Robertson, G.P. Global metaanalysis of the nonlinear response of soil nitrous oxide (N2O) emissions to fertilizer nitrogen. Proc. Natl. Acad. Sci. USA 2014, 111, 9199–9204. [Google Scholar] [CrossRef] [PubMed]
  14. Davidson, E.A.; Nepstad, D.C.; Ishida, F.Y.; Brando, P.M. Effects of an experimental drought and recovery on soil emissions of carbon dioxide, methane, nitrous oxide, and nitric oxide in a moist tropical forest. Glob. Chang. Biol. 2008, 14, 2582–2590. [Google Scholar] [CrossRef]
  15. Smith, P.; Martino, D.; Cai, Z.; Gwary, D.; Janzen, H.; Kumar, P.; McCarl, B.; Ogle, S.; O’Mara, F.; Rice, C.; et al. Agriculture; Metz, B., Davidson, O.R., Bosch, P.R., Dave, R., Meyer, L.A., Eds.; Cambridge University Press: Cambridge, UK; New York, NY, USA, 2007; Volume 9. [Google Scholar]
  16. Food and Agriculture Organization of the United Nations (FAO); International Fertilizer Industry Association (IFA). IFA Global Estimates of Gaseous Emissions of NH3, NO and N2O from Agricultural Land; FAO: Rome, Italy, 2001. [Google Scholar]
  17. Zhang, W.; Yu, Y.; Li, T.; Sun, W.; Huang, Y. Net greenhouse gas balance in China’s croplands over the last three decades and its mitigation potential. Environ. Sci. Technol. 2014, 48, 2589–2597. [Google Scholar] [CrossRef] [PubMed]
  18. Ali, M.A.; Kim, P.J.; Inubushi, K. Mitigating yield-scaled greenhouse gas emissions through combined application of soil amendments: A comparative study between temperate and subtropical rice paddy soils. Sci. Total Environ. 2015, 529, 140–148. [Google Scholar] [CrossRef] [PubMed]
  19. Pathak, H.; Byjesh, K.; Chakrabarti, B.; Aggarwal, P.K. Potential and cost of carbon sequestration in Indian agriculture: Estimates from long-term field experiments. Filed Crops Res. 2011, 120, 102–111. [Google Scholar] [CrossRef]
  20. Bayer, C.; Gomes, J.; Accordi, J.; Costa, F.; Vieira, B.; Dieckow, J. Mitigating greenhouse gas emissions from a subtropical Ultisol by using long-term no-tillage in combination with legume cover crops. Soil Tillage Res. 2016, 161, 86–94. [Google Scholar] [CrossRef]
  21. Barton, L.; Hoyle, F.C.; Stefanova, K.T.; Murphy, D.V. Incorporating organic matter alters soil greenhouse gas emissions and increases grain yield in a semi-arid climate. Agric. Ecosyst. Environ. 2016, 231, 320–330. [Google Scholar] [CrossRef]
  22. Sommer, R.; Mukalama, J.; Kihara, J.; Koala, S.; Winowiecki, L.; Bossio, D. Nitrogen dynamics and nitrous oxide emissions in a long-term trial on integrated soil fertility management in Western Kenya. Nutr. Cycl. Agroecosyst. 2016, 105, 229–248. [Google Scholar] [CrossRef]
  23. Huth, N.I.; Thorburn, P.J.; Radford, B.J.; Thornton, C.M. Impacts of fertilisers and legumes on N2O and CO2 emissions from soils in subtropical agricultural systems: A simulation study. Agric. Ecosyst. Environ. 2010, 136, 351–357. [Google Scholar] [CrossRef]
  24. Rochette, P.; Angers, D.A.; Chantigny, M.H.; Bertrand, N.; Côté, D. Carbon Dioxide and Nitrous Oxide Emissions following Fall and Spring Applications of Pig Slurry to an Agricultural Soil. Soil Sci. Soc. Am. J. 2004, 68, 1410. [Google Scholar] [CrossRef]
  25. Smith, K.A.; McTaggart, I.P.; Tsuruta, H. Emissions of N2O and NO associated with nitrogen fertilization in intensive agriculture, and the potential for mitigation. Soil Use Manag. 1997, 13, 296–304. [Google Scholar] [CrossRef]
  26. Cui, F.; Yan, G.; Zhou, Z.; Zheng, X.; Deng, J. Annual emissions of nitrous oxide and nitric oxide from a wheat–maize cropping system on a silt loam calcareous soil in the North China Plain. Soil Biol. Biochem. 2012, 48, 10–19. [Google Scholar] [CrossRef]
  27. Jarecki, M.K.; Lal, R.; James, R. Crop management effects on soil carbon sequestration on selected farmers’ fields in northeastern Ohio. Soil Tillage Res. 2005, 81, 265–276. [Google Scholar] [CrossRef]
  28. Ryals, R.; Kaiser, M.; Torn, M.S.; Berhe, A.A.; Silver, W.L. Impacts of organic matter amendments on carbon and nitrogen dynamics in grassland soils. Soil Biol. Biochem. 2014, 68, 52–61. [Google Scholar] [CrossRef]
  29. Lentz, R.D.; Lehrsch, G.A. Manure and Fertilizer Effects on Carbon Balance and Organic and Inorganic Carbon Losses for an Irrigated Corn Field. Soil Sci. Soc. Am. J. 2014, 78, 987. [Google Scholar] [CrossRef]
  30. Rees, R.M.; Bingham, I.J.; Baddeley, J.A.; Watson, C.A. The role of plants and land management in sequestering soil carbon in temperate arable and grassland ecosystems. Geoderma 2005, 128, 130–154. [Google Scholar] [CrossRef]
  31. Huang, T.; Gao, B.; Christie, P.; Ju, X. Net global warming potential and greenhouse gas intensity in a double-cropping cereal rotation as affected by nitrogen and straw management. Biogeosciences 2013, 10, 7897–7911. [Google Scholar] [CrossRef]
  32. Limin, A.; Shimizu, M.; Mano, M.; Ono, K.; Miyata, A.; Wada, H.; Nozaki, H.; Hatano, R. Manure application has an effect on the carbon budget of a managed grassland in southern Hokkaido, Japan. Soil Sci. Plant Nutr. 2015, 61, 857–872. [Google Scholar] [CrossRef]
  33. Clayton, H.; McTaggart, I.P.; Parker, J.; Swan, L.; Smith, K.A. Nitrous oxide emissions from fertilised grassland: A 2-year study of the effects of N fertiliser form and environmental conditions. Biol. Fertil. Soils 1997, 25, 252–260. [Google Scholar] [CrossRef]
  34. Shimizu, M.; Hatano, R.; Arita, T. The effect of fertilizer and manure application on CH4 and N2O emissions from managed grasslands in Japan. Soil Sci. Plant Nutr. 2013, 59, 69–86. [Google Scholar] [CrossRef]
  35. Acton, S.D.; Baggs, E.M. Interactions between N application rate, CH4 oxidation and N2O production in soil. Biogeochemistry 2011, 103, 15–26. [Google Scholar] [CrossRef]
  36. Robertson, P.G.; Grace, P.R. Greenhouse gas gluxes in tropical and temperate agriculture: The need for a full-cost accounting of global warming potentials. Environ. Dev. Sustain. 2004, 6, 51–63. [Google Scholar] [CrossRef]
  37. Zheng, X.; Xie, B.; Liu, C.; Zhou, Z.; Yao, Z.; Wang, Y.; Wang, Y.; Yang, L.; Zhu, J.; Huang, Y.; et al. Quantifying net ecosystem carbon dioxide exchange of a short-plant cropland with intermittent chamber measurements. Glob. Biogeochem. Cycles 2008, 22, 1–13. [Google Scholar] [CrossRef]
  38. Chapin, F.S.; Woodwell, G.M.; Randerson, J.T.; Rastetter, E.B.; Lovett, G.M.; Baldocchi, D.D.; Clark, D.A.; Harmon, M.E.; Schimel, D.S.; Valentini, R.; et al. Reconciling carbon-cycle concepts, terminology, and methods. Ecosystems 2006, 9, 1041–1050. [Google Scholar] [CrossRef]
  39. Yang, B.; Xiong, Z.; Wang, J.; Xu, X.; Huang, Q.; Shen, Q. Mitigating net global warming potential and greenhouse gas intensities by substituting chemical nitrogen fertilizers with organic fertilization strategies in rice–wheat annual rotation systems in China: A 3-year fi eld experiment. Ecol. Eng. 2015, 81, 289–297. [Google Scholar] [CrossRef]
  40. Mosier, A.R.; Halvorson, A.D.; Reule, C.A.; Liu, X.J. Net Global Warming Potential and Greenhouse Gas Intensity in Irrigated Cropping Systems in Northeastern Colorado. J. Environ. Qual. 2006, 35, 1584–1598. [Google Scholar] [CrossRef] [PubMed]
  41. Ni, K.; Ding, W.; Zaman, M.; Cai, Z.; Wang, Y.; Zhang, X.; Zhou, B. Nitrous oxide emissions from a rainfed-cultivated black soil in Northeast China: Effect of fertilization and maize crop. Biol. Fertil. Soils 2012, 48, 973–979. [Google Scholar] [CrossRef]
  42. Roth, B.; Jones, M.; Burke, J.; Williams, M. The Effects of Land-Use Change from Grassland to Miscanthus x giganteus on Soil N2O Emissions. Land 2013, 2, 437–451. [Google Scholar] [CrossRef]
  43. Shimizu, M.; Marutani, S.; Desyatkin, A.R.; Jin, T.; Hata, H.; Hatano, R. The effect of manure application on carbon dynamics and budgets in a managed grassland of Southern Hokkaido, Japan. Agric. Ecosyst. Environ. 2009, 130, 31–40. [Google Scholar] [CrossRef]
  44. Bhattacharyya, P.; Roy, K.S.; Neogi, S.; Adhya, T.K.; Rao, K.S.; Manna, M.C. Effects of rice straw and nitrogen fertilization on greenhouse gas emissions and carbon storage in tropical flooded soil planted with rice. Soil Tillage Res. 2012, 124, 119–130. [Google Scholar] [CrossRef]
  45. Toma, Y.; Hatano, R. Effect of crop residue C:N ratio on N2O emissions from Gray Lowland soil in Mikasa, Hokkaido, Japan: Original article. Soil Sci. Plant Nutr. 2007, 53, 198–205. [Google Scholar] [CrossRef]
  46. Shimizu, M.; Limin, A.; Desyatkin, A.R.; Jin, T.; Mano, M.; Ono, K.; Miyata, A.; Hata, H.; Hatano, R. Effect of manure application on seasonal carbon fluxes in a temperate managed grassland in Southern Hokkaido, Japan. Catena 2015, 133, 474–485. [Google Scholar] [CrossRef]
  47. Katayanagi, N.; Ryusuke, H. N2O emissions during the freezing and thawing periods from six fields in a livestock farm, southern Hokkaido, Japan. Soil Sci. Plant Nutr. 2012, 58, 261–271. [Google Scholar] [CrossRef]
  48. Ussiri, D.A.N.; Lal, R.; Jarecki, M.K. Nitrous oxide and methane emissions from long-term tillage under a continuous corn cropping system in Ohio. Soil Tillage Res. 2009, 104, 247–255. [Google Scholar] [CrossRef]
  49. Cui, F.; Zheng, X.; Liu, C.; Wang, K.; Zhou, Z.; Deng, J. Assessing biogeochemical effects and best management practice for a wheat–maize cropping system using the DNDC model. Biogeosciences 2014, 11, 91–107. [Google Scholar] [CrossRef] [Green Version]
  50. Collins, H.P.; Alva, A.K.; Streubel, J.D.; Fransen, S.F.; Frear, C.; Chen, S.; Kruger, C.; Granatstein, D. Greenhouse Gas Emissions from an Irrigated Silt Loam Soil Amended with Anaerobically Digested Dairy Manure. Soil Sci. Soc. Am. J. 2011, 75, 2206. [Google Scholar] [CrossRef]
  51. Sistani, K.R.; Jn-Baptiste, M.; Lovanh, N.; Cook, K.L. Atmospheric emissions of nitrous oxide, methane, and carbon dioxide from different nitrogen fertilizers. J. Environ. Qual. 2011, 40, 1797–1805. [Google Scholar] [CrossRef] [PubMed]
  52. Saggar, S.; Jha, N.; Deslippe, J.; Bolan, N.S.; Luo, J.; Giltrap, D.L.; Kim, D.G.; Zaman, M.; Tillman, R.W. Denitrification and N2O: N2 production in temperate grasslands: Processes, measurements, modelling and mitigating negative impacts. Sci. Total Environ. 2013, 465, 173–195. [Google Scholar] [CrossRef] [PubMed]
  53. Li, M.; Shimizu, M.; Hatano, R. Evaluation of N2O and CO2 hot moments in managed grassland and cornfield, southern Hokkaido, Japan. Catena 2015, 133, 1–13. [Google Scholar] [CrossRef]
  54. Ding, W.; Cai, Y.; Cai, Z.; Yagi, K.; Zheng, X. Nitrous oxide emissions from an intensively cultivated maize–wheat rotation soil in the North China Plain. Sci. Total Environ. 2007, 373, 501–511. [Google Scholar] [CrossRef] [PubMed]
  55. Ranucci, S.; Bertolini, T.; Vitale, L.; Tommasi, P.; Ottaiano, L.; Oliva, M.; Amato, U.; Fierro, A.; Magliulo, V. The influence of management and environmental variables on soil N2O emissions in a crop system in Southern Italy. Plant Soil 2010, 343, 83–96. [Google Scholar] [CrossRef]
  56. Cai, Y.; Ding, W.; Luo, J. Nitrous oxide emissions from Chinese maize–wheat rotation systems: A 3-year field measurement. Atmos. Environ. 2013, 65, 112–122. [Google Scholar] [CrossRef]
  57. Harty, M.A.; Forrestal, P.J.; Watson, C.J.; McGeough, K.L.; Carolan, R.; Elliot, C.; Krol, D.; Laughlin, R.J.; Richards, K.G.; Lanigan, G.J. Reducing nitrous oxide emissions by changing N fertiliser use from calcium ammonium nitrate (CAN) to urea based formulations. Sci. Total Environ. 2016, 563–564, 576–586. [Google Scholar] [CrossRef] [PubMed] [Green Version]
  58. Flessa, H. Seasonal variation of N2O and CH4 fluxes in differently managed arable soils in southern Germany. J. Geophys. Res. 1995, 100, 115–124. [Google Scholar] [CrossRef]
  59. MacKenzie, A.F.; Fan, M.X.; Cadrin, F. Nitrous oxide emission as affected by tillage, corn–soybean–alfalfa rotations and nitrogen fertilization. Can. J. Soil Sci. 1997, 77, 145–152. [Google Scholar] [CrossRef]
  60. Collins, H.P.; Streubel, J.D.; Frear, C.; Chen, S.; Granatstein, D.; Kruger, C.; Alva, A.K.; Fransen, S.F. Application of AD Dairy Manure Effluent to Fields and Associated Impacts; Center for Sustaining Agriculture and Natural Resources: Leavenworth, WA, USA, 2010; pp. 1–25. [Google Scholar]
  61. Akiyama, H.; McTaggart, I.P.; Ball, B.C.; Scott, A. N2O, NO, and NH3 emissions from soil after the application of organic fertilizers, urea and water. Water Air Soil Pollut. 2004, 156, 113–129. [Google Scholar] [CrossRef]
  62. Whalen, J.K.; Chang, C.; Clayton, G.W.; Carefoot, J.P. Cattle Manure Amendments Can Increase the pH of Acid Soils. Soil Sci. Soc. Am. J. 2000, 64, 962–966. [Google Scholar] [CrossRef]
  63. Nagano, H.; Kato, S.; Ohkubo, S.; Inubushi, K. Emmisions of carbon dioxide, methane, and nitrous oxide from short and long-term organic farming Andosols in central Japan. Jpn. Soc. Soil Sci. Plant Nutr. J. 2012, 58, 793–801. [Google Scholar] [CrossRef]
  64. Owen, J.J.; Parton, W.J.; Silver, W.L. Long-term impacts of manure amendments on carbon and greenhouse gas dynamics of rangelands. Glob. Chang. Biol. 2015, 21, 4533–4547. [Google Scholar] [CrossRef] [PubMed]
  65. Ussiri, D.A.N.; Lal, R. Long-term tillage effects on soil carbon storage and carbon dioxide emissions in continuous corn cropping system from an alfisol in Ohio. Soil Tillage Res. 2009, 104, 39–47. [Google Scholar] [CrossRef]
  66. Hu, Z.; Zhang, J.; Li, S.; Xie, H. Impact of carbon source on nitrous oxide emission from anoxic/oxic biological nitrogen removal process and identification of its emission sources. Environ. Sci. Pollut. Res. 2013, 20, 1059–1069. [Google Scholar] [CrossRef] [PubMed]
  67. Cabrera, M.L.; Chiang, S.C.; Merka, W.C.; Pancorbo, O.C.; Thompson, S.A. Nitrous oxide and carbon dioxide emissions from pelletized and nonpelletized poultry litter incorporated into soil. Plant Soil 1994, 163, 189–195. [Google Scholar] [CrossRef]
  68. Ryals, R.; Silver, W.L. Effects of organic matter amendments on net primary productivity and greenhouse gas emissions in annual grasslands. Ecol. Appl. 2012, 23, 46–59. [Google Scholar] [CrossRef]
  69. Choudhary, M.A.; Akramkhanov, A.; Saggar, S. Nitrous oxide emissions in soils cropped with maize under long-term tillage and under permanent pasture in New Zealand. Soil Tillage Res. 2001, 62, 61–71. [Google Scholar] [CrossRef]
  70. Mosier, A.; Schime, D.; Valentine, D.; Bronson, K.; Parton, W. Methane and nitrous oxide fluxes in native, fertilized and cultivated grasslands. Nature 1991, 350, 56–58. [Google Scholar] [CrossRef]
  71. Sehy, U.; Ruser, R.; Munch, J.C. Nitrous oxide fluxes from maize fields: Relationship to yield, site-specific fertilization, and soil conditions. Agric. Ecosyst. Environ. 2003, 99, 97–111. [Google Scholar] [CrossRef]
  72. Clough, T.J.; Kelliher, F.M.; Sherlock, R.R.; Ford, C.D. Lime and Soil Moisture Effects on Nitrous Oxide Emissions from a Urine Patch. Soil Sci. Soc. Am. J. 2004, 68, 1600–1609. [Google Scholar] [CrossRef]
  73. Pan, Y.; Ye, L.; Yuan, Z. Effect of H2S on N2O reduction and accumulation during denitrification by methanol utilizing denitrifiers. Environ. Sci. Technol. 2013, 47, 8408–8415. [Google Scholar] [CrossRef] [PubMed]
  74. Wu, X.; Yao, Z.; Brüggemann, N.; Shen, Z.Y.; Wolf, B.; Dannenmann, M.; Zheng, X.; Butterbach-Bahl, K. Effects of soil moisture and temperature on CO2 and CH4 soil–atmosphere exchange of various land use/cover types in a semi-arid grassland in Inner Mongolia, China. Soil Biol. Biochem. 2010, 42, 773–787. [Google Scholar] [CrossRef]
  75. Wang, Y.Y.; Hu, C.S.; Ming, H.; Zhang, Y.M.; Li, X.X.; Dong, W.X.; Oenema, O. Concentration profiles of CH4, CO2 and N2O in soils of a wheat-maize rotation ecosystem in North China Plain, measured weekly over a whole year. Agric. Ecosyst. Environ. 2013, 164, 260–272. [Google Scholar] [CrossRef]
  76. Wang, Y.; Hu, C.; Ming, H.; Oenema, O.; Schaefer, D.A.; Dong, W.; Zhang, Y.; Li, X. Methane, Carbon Dioxide and Nitrous Oxide Fluxes in Soil Profile under a Winter Wheat-Summer Maize Rotation in the North China Plain. PLoS ONE 2014, 9, e98445. [Google Scholar] [CrossRef] [PubMed]
  77. Guo, J.; Zhou, C. Greenhouse gas emissions and mitigation measures in Chinese agroecosystems. Agric. For. Meteorol. 2007, 142, 270–277. [Google Scholar] [CrossRef]
  78. Phillips, R.L.; Wick, A.F.; Liebig, M.A.; West, M.S.; Daniels, W.L. Biogenic emissions of CO2 and N2O at multiple depths increase exponentially during a simulated soil thaw for a northern prairie Mollisol. Soil Biol. Biochem. 2012, 45, 14–22. [Google Scholar] [CrossRef]
  79. Zhang, X.-B.; Wu, L.-H.; Sun, N.; Ding, X.-S.; Li, J.-W.; Wang, B.-R.; Li, D.-C. Soil CO2 and N2O Emissions in Maize Growing Season Under Different Fertilizer Regimes in an Upland Red Soil Region of South China. J. Integr. Agric. 2014, 13, 604–614. [Google Scholar] [CrossRef]
  80. Bond-lamberty, B.; Smith, A.P.; Bailey, V. Temperature and moisture effects on greenhouse gas emissions from deep active-layer boreal soils. Biogeosciences 2016, 13, 6669–6681. [Google Scholar] [CrossRef]
  81. Ding, W.; Cai, Y.; Cai, Z.; Yagi, K.; Zheng, X. Soil Respiration under Maize Crops: Effects of Water, Temperature, and Nitrogen Fertilization. Soil Sci. Soc. Am. J. 2007, 71, 944. [Google Scholar] [CrossRef]
  82. Zhou, L.; Zhou, X.; Zhang, B.; Lu, M.; Luo, Y.; Liu, L.; Li, B. Different responses of soil respiration and its components to nitrogen addition among biomes: A meta-analysis. Glob. Chang. Biol. 2014, 20, 2332–2343. [Google Scholar] [CrossRef] [PubMed]
  83. Chen, H.; Tian, H.Q. Does a general temperature-dependent Q10 model of soil respiration exist at biome and global scale? J. Integr. Plant Biol. 2005, 47, 1288–1302. [Google Scholar] [CrossRef]
  84. Peng, S.; Piao, S.; Wang, T.; Sun, J.; Shen, Z. Temperature sensitivity of soil respiration in different ecosystems in China. Soil Biol. Biochem. 2009, 41, 1008–1014. [Google Scholar] [CrossRef]
  85. Liu, H.S.; Li, L.H.; Han, X.G.; Huang, J.H.; Sun, J.X.; Wang, H.Y. Respiratory substrate availability plays a crucial role in the response of soil respiration to environmental factors. Appl. Soil Ecol. 2006, 29, 284–293. [Google Scholar] [CrossRef]
  86. Zhai, L.-M.; Liu, H.-B.; Zhang, J.-Z.; Huang, J.; Wang, B.-R. Long-Term Application of Organic Manure and Mineral Fertilizer on N2O and CO2 Emissions in a Red Soil from Cultivated Maize–Wheat Rotation in China. Agric. Sci. China 2011, 10, 1748–1757. [Google Scholar] [CrossRef]
  87. Anthoni, P.M.; Freibauer, A.; Kolle, O.; Schulze, E.D. Winter wheat carbon exchange in Thuringia, Germany. Agric. For. Meteorol. 2004, 121, 55–67. [Google Scholar] [CrossRef]
  88. West, T.O.; Marland, G. A synthesis of carbon sequestration, carbon emissions, and net carbon flux in agriculture: Comparing tillage practices in the United States. Agric. Ecosyst. Environ. 2002, 91, 217–232. [Google Scholar] [CrossRef]
  89. Lal, R. Soil carbon sequestration to mitigate climate change. Geoderma 2004, 123, 1–22. [Google Scholar] [CrossRef]
  90. Yan, G.; Zheng, X.; Cui, F.; Yao, Z.; Zhou, Z. Two-year simultaneous records of N2O and NO fluxes from a farmed cropland in the northern China plain with a reduced nitrogen addition rate by one-third. Agric. Ecosyst. Environ. 2013, 178, 39–50. [Google Scholar] [CrossRef]
Figure 1. Daily average soil temperature and precipitation (a), soil NO3 concentration (b), soil NH4+ concentration (c) and water extractable soil organic carbon (WEOC) (d) from 2010 to 2012 in experiment 1. CT is unfertilized control plot; F is inorganic fertilizer-only plot; MF1 is inorganic fertilizer plus composted cattle manure applied since 2005 plot; MF2 is inorganic fertilizer plus composted cattle manure applied since 2010 plot; M is composted cattle manure-only plot.
Agriculture 07 00013 g001
Figure 2. Seasonal variation in N2O flux (a), CO2 flux (b) and CH4 flux (c) from 2010 to 2012 in experiment 1. CT is unfertilized control plot; F is inorganic fertilizer-only plot; MF1 is inorganic fertilizer plus composted cattle manure applied since 2005 plot; MF2 is inorganic fertilizer plus composted cattle manure applied since 2010 plot; M is composted cattle manure-only plot. Full arrows with closed head indicate dates of manure application, dashed arrows indicate dates of ploughing; full arrows with open V shaped tip indicate dates of inorganic fertilizer application.
Agriculture 07 00013 g002
Figure 3. Greenhouse gas intensity (GHGI) in 2010–2012 (experiment 1). CT is unfertilized control plot; F is inorganic fertilizer-only plot; MF1 is inorganic fertilizer plus composted cattle manure applied since 2005 plot; MF2 is inorganic fertilizer plus composted cattle manure applied since 2010 plot; M is composted cattle manure-only plot.
Agriculture 07 00013 g003
Table 1. Total soil carbon stock (Mg C ha−1) in the F, MF1 and MF2 plots in 2010 and 2012 (experiment 1).
YearFMF1MF2
201084.3 ± 10.3 a110.9 ± 15.9 a,b96.6 ± 15.9 a
2012107.3 ± 16.6 a127.6 ± 16.7 c119.8 ± 15.7 b,c
F is inorganic fertilizer-only plot; MF1 is inorganic fertilizer plus composted cattle manure applied since 2005 plot; MF2 is inorganic fertilizer plus composted cattle manure applied since 2010 plot. Different letters indicate significant differences at p < 0.05.
Table 2. Annual manure C input, net primary production (NPP), CO2 emission, net ecosystem carbon balance (NECB) in Mg C ha−1·year−1, CH4 emission (kg C ha−1·year−1), N2O emission (kg N ha−1·year−1) and net global warming potential (GWP) (Mg CO2-C equivalents ha−1·year−1) in experiment 1.
YearPlotManureNPPCO2NECBCH4 kg CN2O kg NGWP Mg CO2-C eq
Mg C
2010CT02.9 ± 1.1 c6.8 ± 0.8 a,b,c−6.5 ± 0.8 c1.5 ± 1.7 a,b3.9 ± 1.2 a7.1 ± 1.0 c,d
F06.5 ± 2.2 a,d6.9 ± 1.1 a,b,c−6.2 ± 1.1 b,c5.1 ± 4.6 b17.4 ± 16.1 a,b,c,d8.5 ± 2.2 d
MF18.9 ± 0.47.0 ± 3.7 a,b,d10.2 ± 0.7 c−1.7 ± 0.7 a,d0.5 ± 1.4 a,b22.9 ± 11.3 b,c,d4.7 ± 1.7 a,b,c,d
MF28.9 ± 0.46.1 ± 2.3 a,d,e8.9 ± 0.5 b,c−0.5 ± 0.5 a3.7 ± 3.9 a,b33.5 ± 2.3 d4.9 ± 0.4 a,b,c,d
2011CT03.5 ± 1.3 c,e6.5 ± 0.9 a,b,c−5.7 ± 0.9 b,c0.3 ± 1.0 a,b5.8 ± 2.3 a,b6.4 ± 0.9 b,c,d
F07.6 ± 1.3 a,b6.1 ± 1.1 a,d−5.1 ± 1.1 b,c,e−0.2 ± 0.6 a13.6 ± 8.7 a,b,c6.8 ± 1.1 b,c,d
MF16.7 ± 0.59.9 ± 1.2 b7.8 ± 1.1 a,b,c0.3 ± 1.1 a0.4 ± 0.2 a,b14.3 ± 2.2 a,b,c1.5 ± 1.3 a
MF26.7 ± 0.59.9 ± 1.4 b8.3 ± 1.6 a,b,c0.2 ± 1.6 a−0.6 ± 0.7 a25.2 ± 11.9 c,d3.0 ± 2.8 a,b
M6.7 ± 0.54.3 ± 1.6 c,d,e7.8 ± 1.1 a,b,c−0.5 ± 1.1 a1.3 ± 2.1 a,b11.7 ± 2.3 a,b,c2.0 ± 1.4 a
2012CT02.7 ± 0.4 c6.8 ± 1.2 a,b,d−6.2 ± 1.2 b,c−0.2 ± 0.1 a3.6 ± 0.7 a6.6 ± 1.2 b,c,d
F06.3 ± 0.8 a,d,e4.9 ± 0.3 d−3.7 ± 0.3 b,d,e1.9 ± 2.8 a,b7.1 ± 3.3 a,b4.6 ± 0.5 a,b,c,d
MF16.7 ± 0.48.4 ± 1.3 a,b8.8 ± 0.6 a,b,c−1.3 ± 0.6 a,d−0.7 ± 0.2 a7.7 ± 1.2 a,b2.2 ± 0.7 a
MF26.7 ± 0.48.7 ± 1.1 a,b9.8 ± 2.2 c−2.4 ± 2.1 a,d,e0.0 ± 0.6 a,b8.8 ± 4.0 a,b,c3.5 ± 2.5 a,b,c
M6.7 ± 0.42.9 ± 0.9 c10.3 ± 0.5 c−3.7 ± 0.5 b,d,e−0.6 ± 0.3 a5.6 ± 1.7 a,b4.4 ± 0.8 a,b,c
Different letters within the same column indicate significant differences among the treatments at p < 0.05. CT is unfertilized control plot; F is inorganic fertilizer-only plot; MF1 is inorganic fertilizer plus composted cattle manure applied since 2005 plot; MF2 is inorganic fertilizer plus composted cattle manure applied since 2010 plot; M is composted cattle manure-only plot.
Table 3. Average annual manure C input, net primary production (NPP), CO2 emission, net ecosystem carbon balance (NECB) in Mg C ha−1·year−1, CH4 emission (kg C ha−1·year−1), N2O emission (kg N ha−1·year−1) and global warming potential (GWP) (Mg CO2-C equivalents ha−1·year−1) in experiment 2.
PlotManureNPPCO2NECBN2O kg NCH4 kg CGWP Mg CO2-C eq
Mg C
M17.3 ± 0.3 a3.94 ± 0.46 b8.28 ± 1.700.59 ± 1.7 b7.19 ± 1.77−0.04 ± 0.370.33 ± 1.75 a
MF7.3 ± 0.3 a6.99 ± 2.52 a8.71 ± 1.640.20 ± 1.6 b10.00 ± 1.83−0.29 ± 0.241.08 ± 1.74 a
MM12.3 ± 0.4 b7.12 ± 1.00 a8.30 ± 1.725.22 ± 1.7 a7.41 ± 1.390.18 ± 0.23−4.27 ± 1.81 b
Different letters within the same column indicate significant differences among the treatments at p < 0.05. M1 is autumn composted cattle manure application only plot; MF is autumn composted cattle manure plus spring inorganic fertilizer plot; MM is autumn composted cattle manure plus additional spring composted cattle manure plot.
Table 4. Linear regressions (Pearson’s correlation coefficients) for the relationship between greenhouse gas fluxes and environmental variables (experiments 1 and 2 combined).
VariableN2O Flux (μg N m−2·h−1)CH4 Flux (μg C m−2·h−1)CO2 Flux (mg C m−2·h−1)
Soil temperature0.174 **0.163 **0.776 **
WFPS0.0840.205 **–0.341 **
Soil pH–0.281 **–0.0600.162 *
NO30.242 **0.031–0.265 **
NH4+–0.049–0.0670.069
WEOC0.031–0.1130.105
WFPS is water filled pore space, WEOC is water extractable organic carbon. ** Significant correlation at p < 0.01, * significant correlation at p < 0.05.

