Review

Global Biofuels at the Crossroads: An Overview of Technical, Policy, and Investment Complexities in the Sustainability of Biofuel Development

1
Department of Technology and Society, Stony Brook University, Stony Brook, NY 11794, USA
2
Brookhaven National Laboratory, Upton, NY 11973, USA
3
Advanced Energy Research and Technology Center, and Materials Science and Chemical Engineering Department, Stony Brook University, Stony Brook, NY 11794, USA
4
Faculdade Anhanguera-Pitágoras, Votorantim, São Paulo 18110-008, Brasil
*
Authors to whom correspondence should be addressed.
Agriculture 2017, 7(4), 32; https://doi.org/10.3390/agriculture7040032
Submission received: 1 December 2016 / Revised: 14 March 2017 / Accepted: 15 March 2017 / Published: 29 March 2017
(This article belongs to the Special Issue Economic Sustainability of Bioenergy Systems)

Abstract

:
Biofuels have the potential to alter the transport and agricultural sectors of decarbonizing societies. Yet, the sustainability of these fuels has been questioned in recent years in connection with food versus fuel trade-offs, carbon accounting, and land use. Recognizing the complicated playing field for current decision-makers, we examine the technical attributes, policy, and global investment activity for biofuels (primarily liquids). Differences in feedstock and fuel types are considered, in addition to policy approaches of major producer countries. Issues with recent, policy-driven trade developments are highlighted to emphasize how systemic complexities associated with sustainability must also be managed. We conclude with near-term areas to watch.

1. Introduction

Biofuels have been used for years as a way to increase energy self-sufficiency, reduce import costs, and strengthen domestic agricultural development [1,2]. More recently, biomass-based transport fuels have become a strategic focus for regions wanting to minimize vehicle emissions and increase sustainability [3]. These fuels, along with electric vehicles, are seen as being instrumental in a shift to low-carbon fuels that would bring about sustainability in the transport sector [4]. This potential is shaped by the transport sector, which accounts for one-third of global energy utilization, half of oil consumption, and nearly a quarter of CO2 emissions from fossil fuel combustion [5,6,7].
Since 2000, the global biofuels supply has increased by a factor of 8% to equal 4% of the world’s transport fuels in 2015 [3,8] (Figure 1). This significant rise is attributed to policies such as blending mandates, which foster greater utilization and may partly insulate biofuels during times of oil price flux [3,9].
In industries such as aviation, marine transport, and heavy freight, biofuels are deemed to be the only practical, low-carbon alternative to fossil fuel [4]. Specific to aviation, total greenhouse gas (GHG) emissions were projected to increase by 400%–600% between 2010 and 2050, based on projected growth in travel [10]. In conjunction with such trends, the aviation industry set targets for reducing CO2, and flew their first commercial test flight with biofuels in 2008 [11]. As of mid-2015, approximately 22 airlines had completed more than 2000 passenger flights with biofuel representing up to half the jet fuel mix [3]. The recent signing of an agreement by 191 countries to curb aviation pollution underscores that there is substantial market potential for continued biofuel adoption [12].
While broad interest and opportunity for biofuels exist, near-term plant construction has slowed down. The double-digit supply growth that was evident before 2010 has now tapered off, reflecting policy uncertainty in major markets and structural challenges [3,8]. A range of pressing questions about sustainability also came to the foreground with respect to food versus fuel tradeoffs, greenhouse gas accounting, and land use. If sustainability and technical challenges are effectively worked out, these fuels have real potential to substantially alter the transport and agricultural sectors of decarbonizing regions. Recognizing this, we assess the present state and sustainability of global biofuel development, placing emphasis on the technical, policy and investment aspects.
To do so, we review the existing literature on liquid biofuels used in transport to outline the current status of development and associated policies. We classify various feedstock and fuel types, discussing the favorability of first generation and advanced biofuels in various development contexts. We then turn to policy, discussing national strategies for some of the major, regional producers, namely Brazil, China, the European Union, India, and the United States. Issues with unsustainable interactions of policy and international trade are examined subsequently in the context of national markets. Global investment developments are then explored. We conclude with areas to watch for policy and future research agendas that could impact the scale of substitution of biofuels in the global fuel markets.

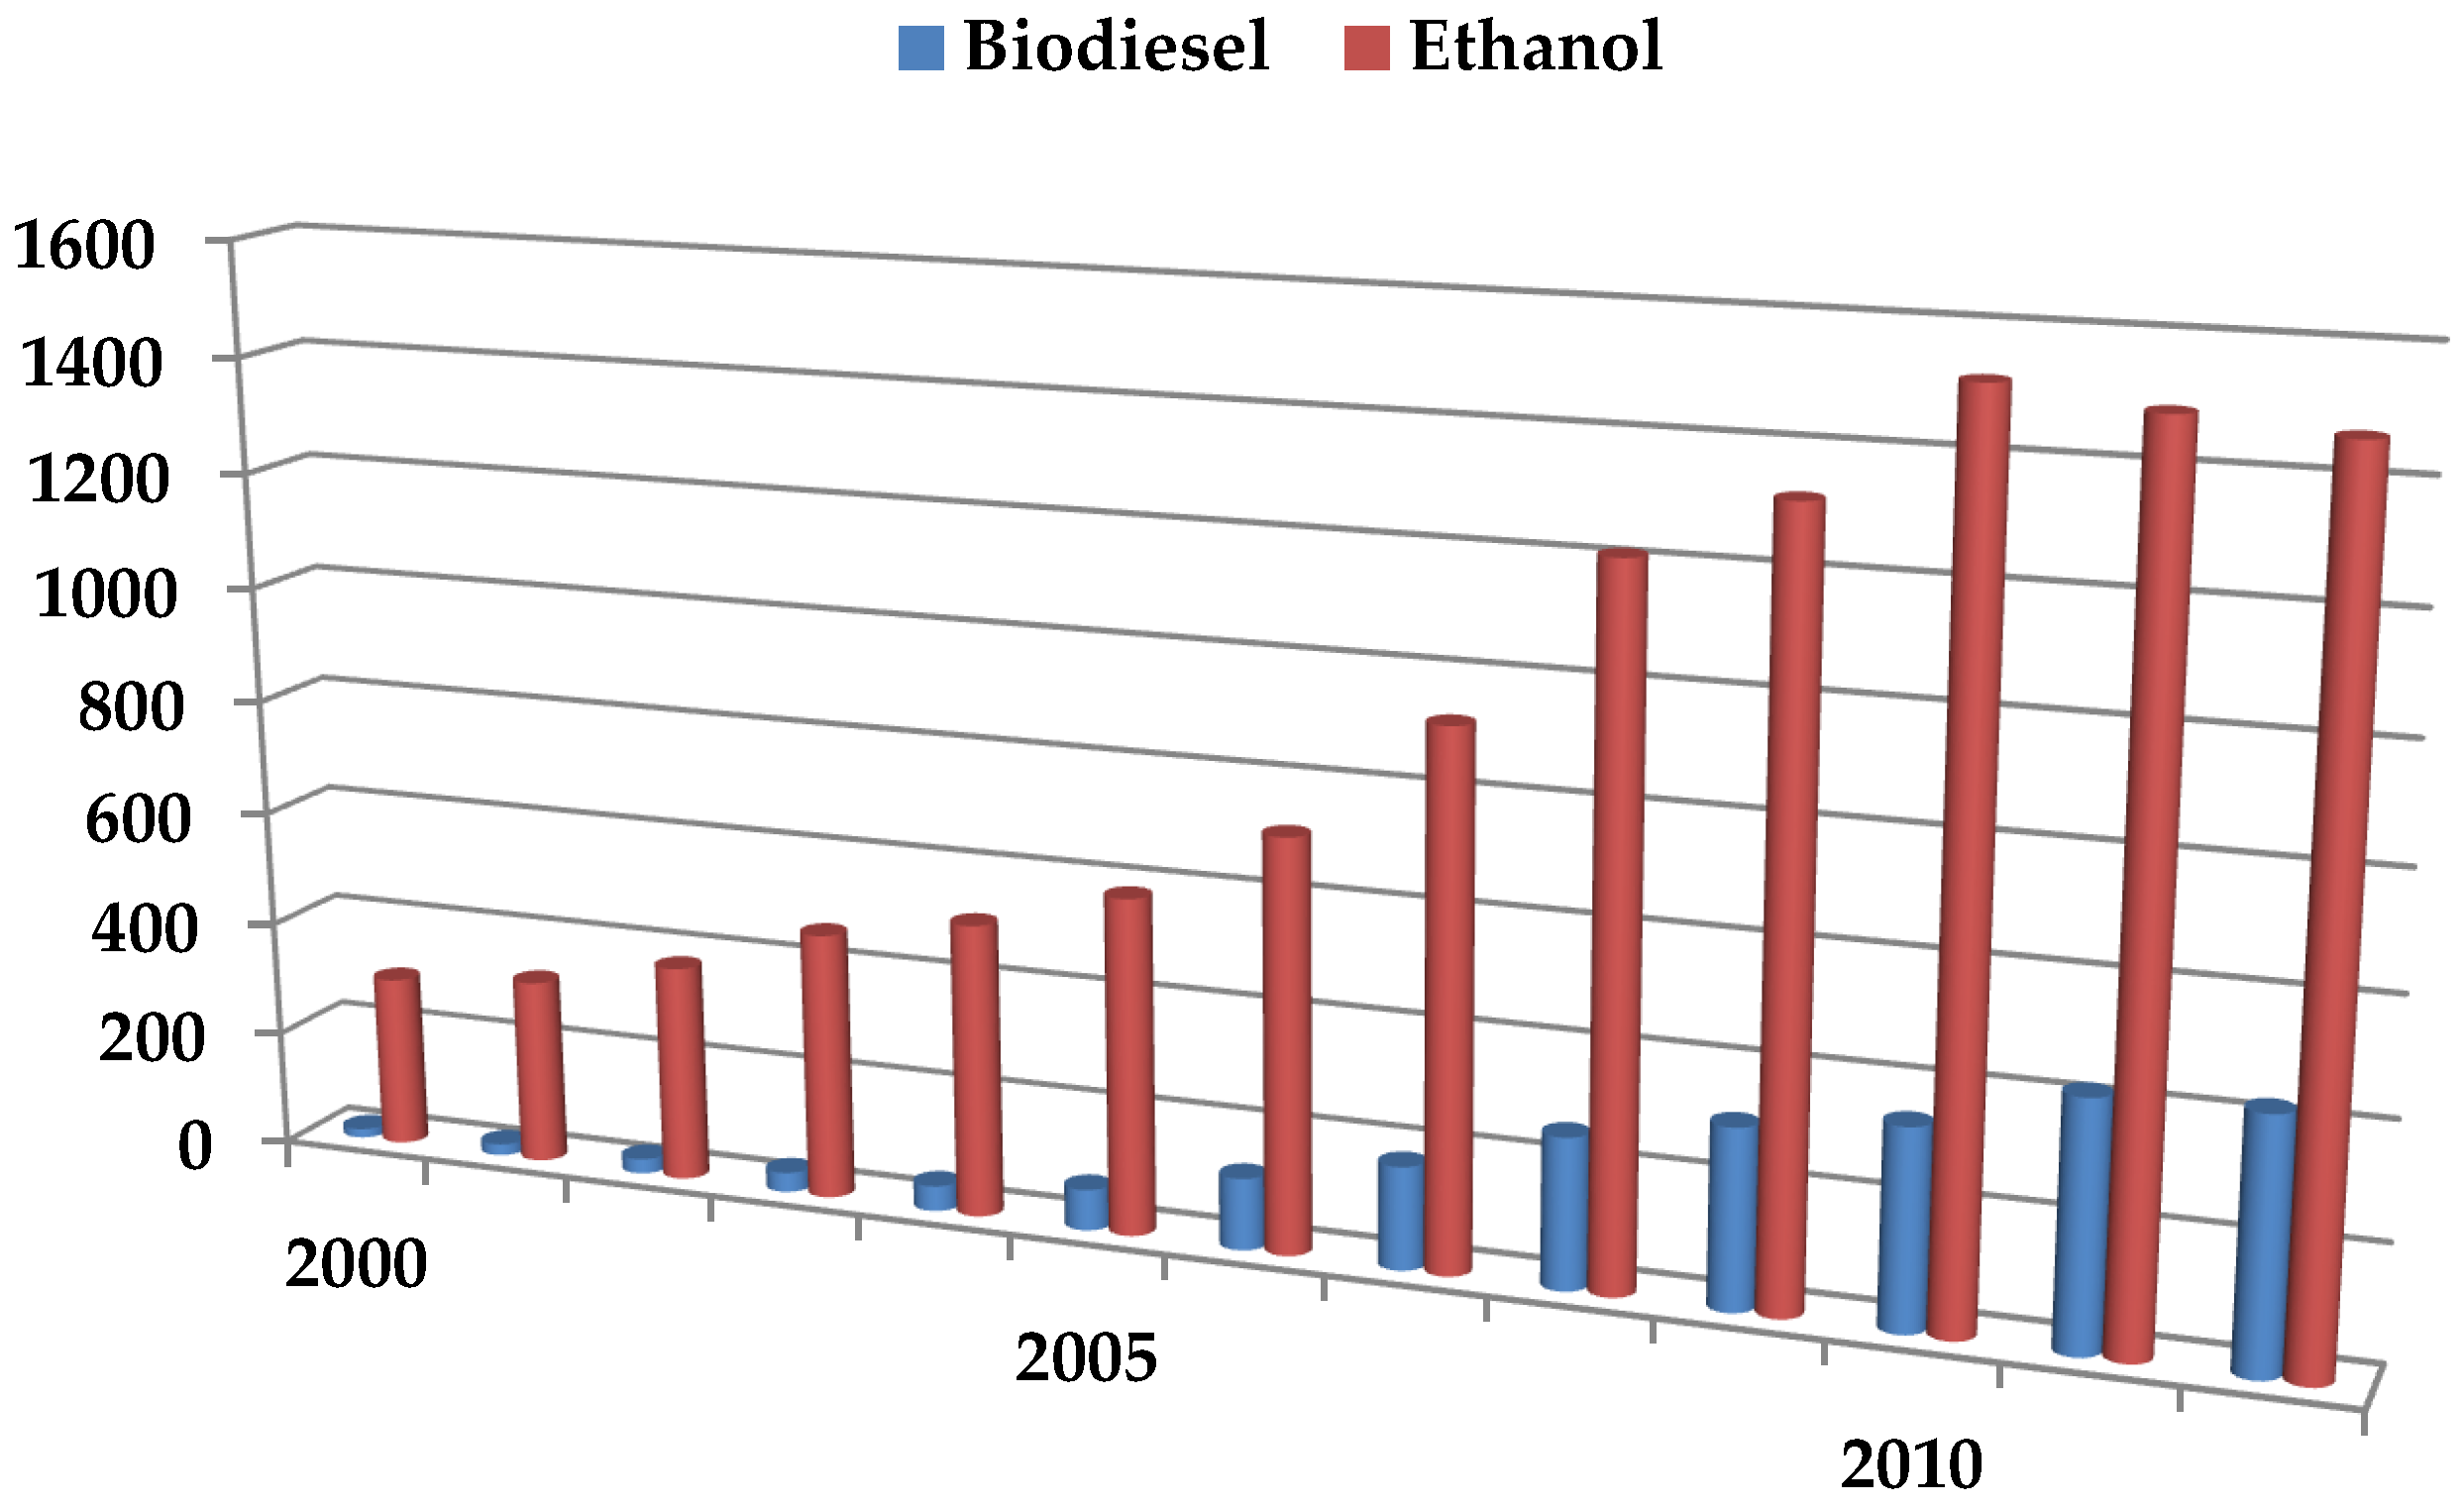
2. Biofuel Production Pathways

In 2015, historical leaders Brazil and the United States produced approximately 70% of the global biofuel supply [3], consisting primarily of sugarcane-based and corn-based ethanol, respectively. Suppliers in the European Union and Asia represent emergent markets that have developed in the last two decades (Figure 2). Among the newer producing regions, the European Union focuses on bio-diesel from waste, soy, rapeseed, and palm [13]. This compares to production in Asia, which centers on sugarcane, corn, wheat, and cassava, with investment also occurring in palm, soybean, rapeseed, and Jatropha [14]. This type of regional and feedstock-based diversification may be conducive to the formation of an international biofuel commodities market [15].
Looking at broad numbers and types, the global biofuel supply equaled approximately 35 billion gallons in 2015 (Figure 3), consisting roughly of a 3:1 breakdown of ethanol to bio-diesel [3]. Conventional biofuels (Generation 1) produced from sugar, starch, vegetable oil, or animal fat reflected the majority of the supply. In recent years, vegetable-based biodiesel nearly matched the ethanol supply produced from sugarcane [16]. Primary fuels, feedstock, and classifications are discussed next.

2.1. Primary Fuel Types

Table 1 summarizes various generations and types of biofuels.

2.1.1. Generation 1/Conventional Biofuels

Generation 1/Conventional Biofuels are produced from food or feed-based crops, typically with hydrolysis and fermentation processes or esterification or trans-esterification. Table 1 summarizes the key biofuels by feedstock, technology process, end product, and chemical composition, with process descriptions. As noted earlier, ethanol and biodiesel dominate global biofuel production, and hence are the primary focus here.
Ethanol is produced by fermentation of sugar from cane or beets, starch from corn or wheat, or root crops like cassava [17,18,19]. It has a higher-octane rating than conventional gasoline and improves combustion properties, allowing engines to operate at a higher compression ratio [20]. Ethanol also has a lower energy content per volumetric unit relative to gasoline of roughly 70% [4,5]. These features translate into less pollution and generally fewer miles per gallon compared to petroleum-derived gasoline, if produced with methods that minimize emissions. In most regions, ethanol is used as a fuel additive in gasoline at roughly 10%, rather than a total replacement [3,17,21,22,23,24,25]. Brazil is a notable exception, where the fleet of flex fuel cars operates on any blend of gasoline and ethanol or solely on ethanol [1]. Vehicle design improvements could allow for mid-level blends of 20%–40% to be used with enhanced efficiency. This is in contrast with that seen currently with the flex fuel vehicle operating on E85 (i.e., 85% ethanol blend), though at somewhat reduced efficiency [24].
Biodiesel is produced through an esterification/trans-esterification reaction of vegetable oils (soybean, palm) or animal fats with an alcohol to generate fatty acid methyl esters (FAME) and a substitute for or blend additive for diesel. Structurally, the two diesels are distinctly different: fossil fuel-based diesel is a hydrocarbon consisting of 12–20 carbon atoms, whereas biodiesel is a three-carbon ester that burns much like diesel. Biodiesel, however, is cleaner and attains a fuel economy similar to diesel [25]. Biodiesel is prevalent in regions like the EU and parts of Latin America, namely Argentina and Columbia [26].

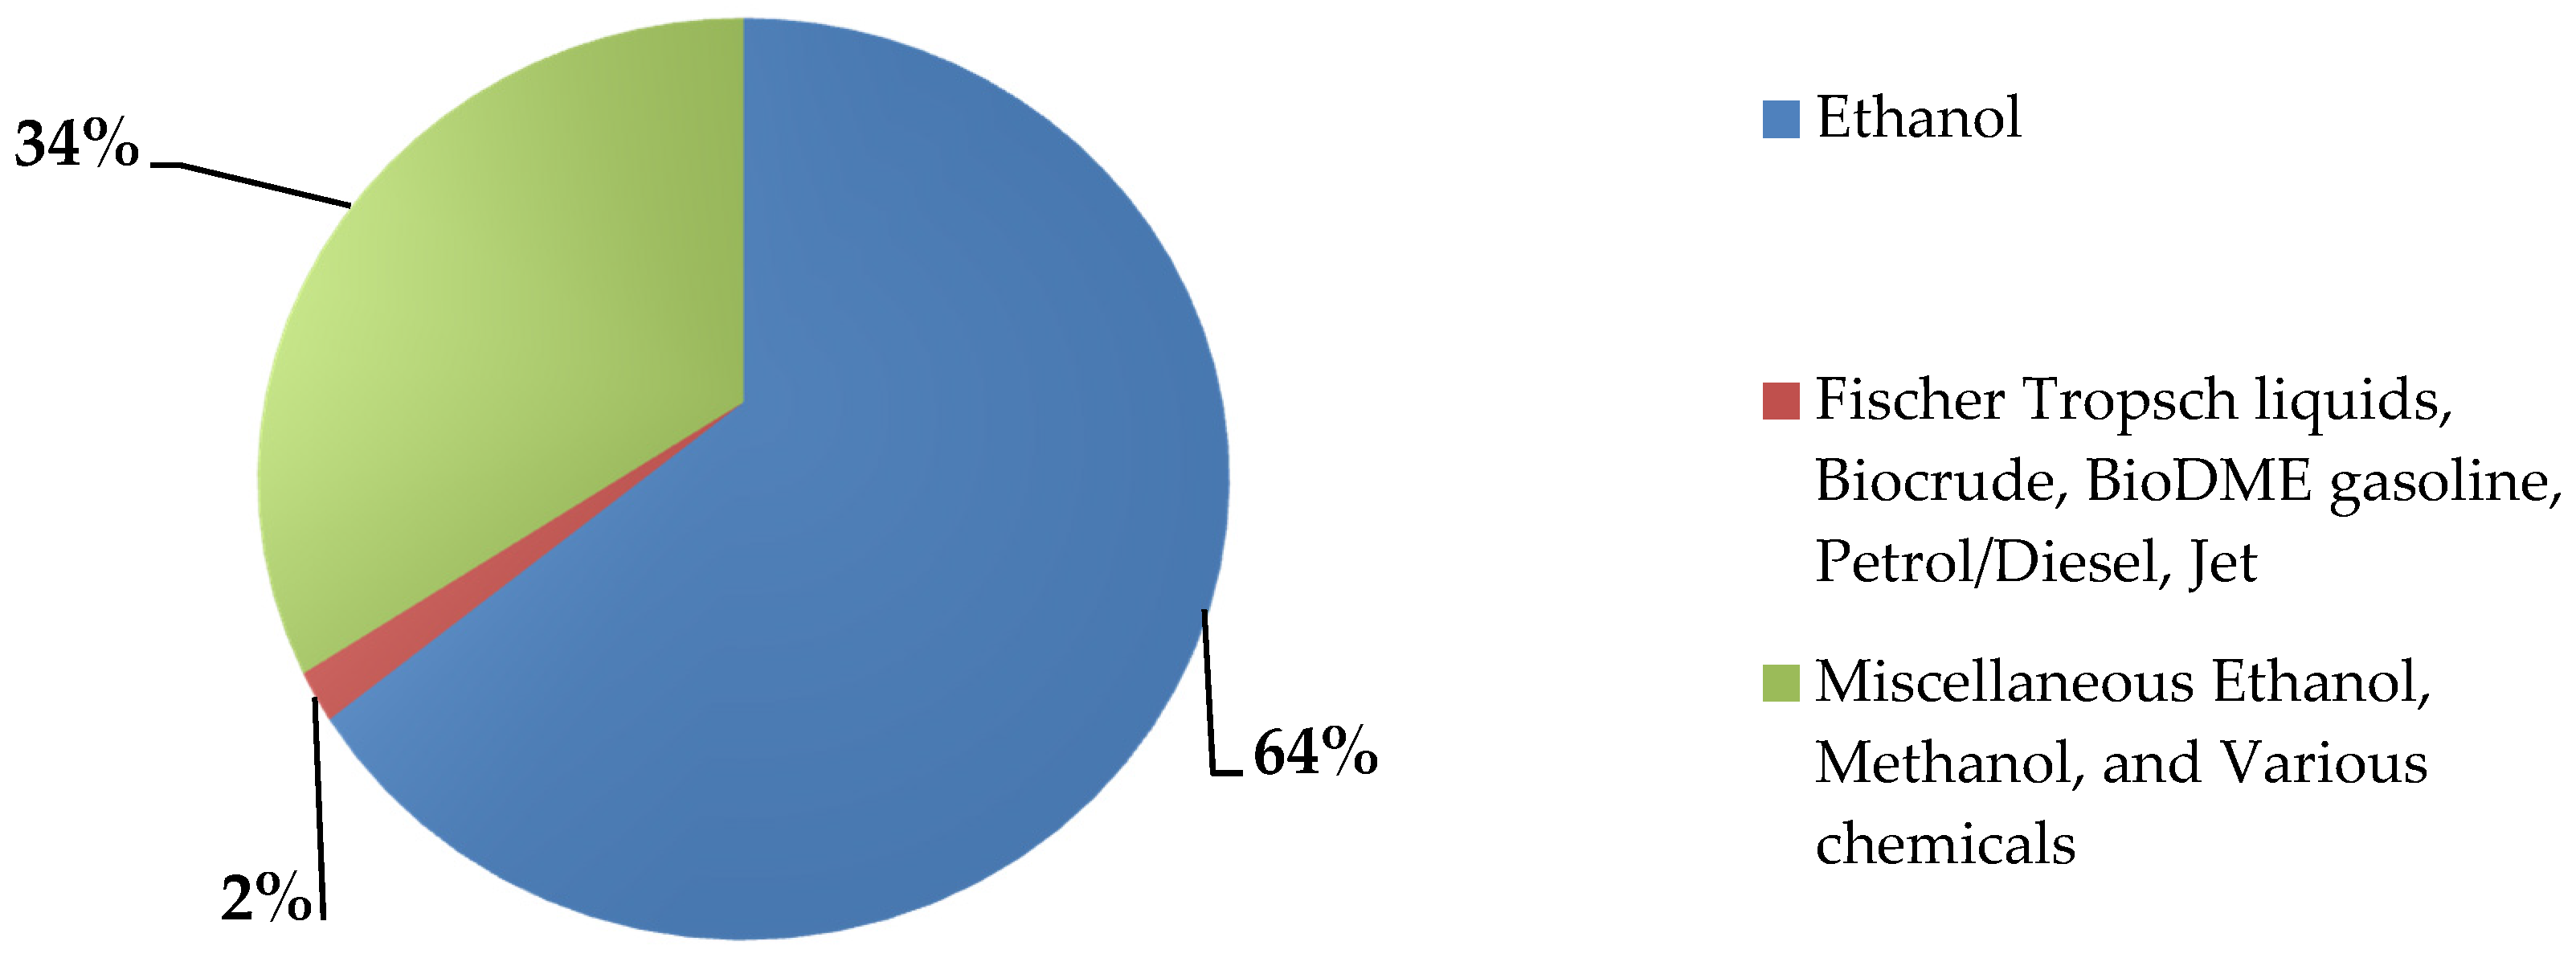
2.1.2. Generation 2/Advanced Biofuels

Generation 2/Advanced Biofuels are produced typically from non-food crops and residues or waste materials. Key conversion processes include hydrolysis and fermentation, hydrotreating, pyrolysis, and alcohol fermentation from syngas. Common forms include ‘drop-in fuels’ and biobutanol.
‘Drop-in fuels’ are renewable diesel and gasoline that are derived from lipids (i.e., vegetable oils, animal fats, greases, and algae) or cellulosic materials (i.e., crop residues, and woody biomass) that are structurally/chemically similar to traditional petroleum-based gasoline and diesel fuels. These fuels can readily displace fossil-derived fuels because, unlike other biofuels, they do not have compatibility issues with engines or infrastructure, making them easier to adopt in the supply chain. The technical ease and lower costs of integrating these fuels into markets is an advantage, since no major investment is needed for existing, petroleum-based infrastructure. Renewable diesel is produced by hydrotreating, gasification, pyrolysis, and other thermochemical and biochemical pathways [27]. Hydrotreated biodiesel produced from vegetable oils (HVO) or animal fats does not have some of the detrimental effects of ester-type biodiesel fuels, such as issues with increased NOx emissions, deposit formation, storage stability problems, more rapid aging of the engine oil and poor cold properties [28]. As straight-chain paraffinic hydrocarbons, HVOs do not produce sulfur and have high cetane numbers [28], which allow higher speed diesel engines to operate more efficiently. Renewable gasoline, like ethanol but developed through different pathways, can be produced from the fermentation of sugars. Drop-in fuels can also be produced with processes like catalytic conversion of sugars [29].
Biobutanol is a biomass-based fuel that is produced by fermenting the same feedstock as ethanol, but is mediated by different microorganisms. Its energy density is 10%–20% less than that of gasoline, which is relatively high among gasoline alternatives such as biodiesel or ethanol [27]. Byproducts include not only transport fuel, but also solvents/coatings, plastics, and fibers. Relative to ethanol, biobutanol has a lower vapor pressure that translates into lower volatility and fewer evaporative emissions [27].

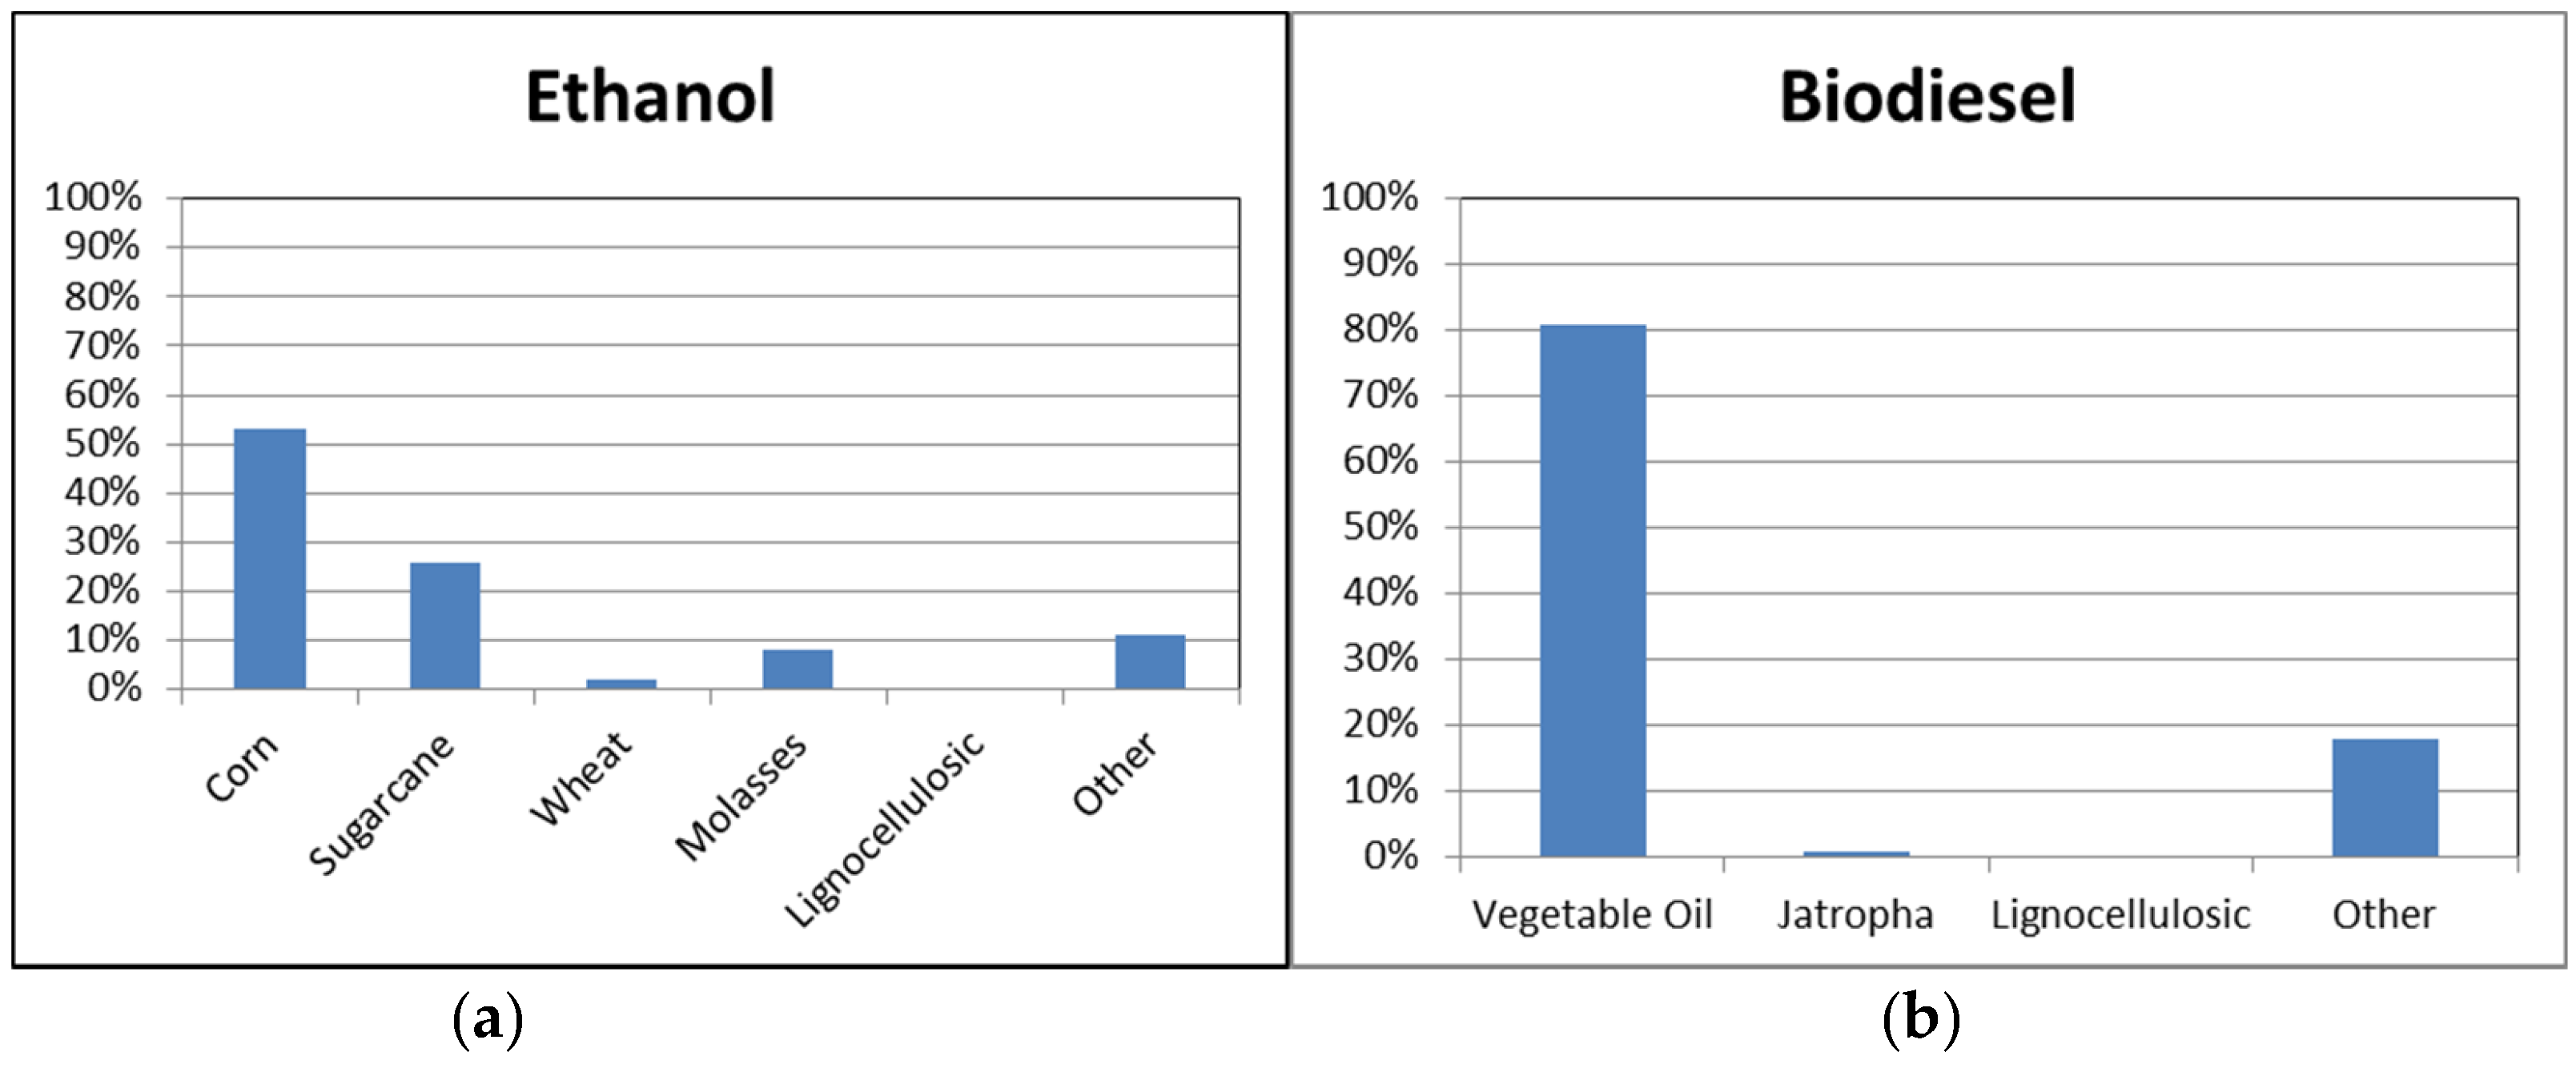
3. Key Feedstocks for Biofuel Production

The diversity of feedstock options for biofuels is fairly significant with local conditions typically framing the choice. The following section and Table 2 expand on this.

3.1. Lignocellulose

Lignocellulosic material is derived from non-edible crops that have the advantage of limiting cropland expansion and related emissions, with appropriate practices [30]. This plentiful feedstock can be obtained from many different sources, including switchgrass, trees, and agricultural crop residues, such as rice straw, wheat straw, corn stover, and sugarcane bagasse [31]. Depending on the source, there is a large amount of available land. Looking at straw for example, 2.3 billion tons of straw were available in 2011, which has the theoretical potential of making 560 million tons of ethanol [32]. Climate and water needs for lignocellulose vary depending on the source of lignocellulose that is used [33]. There is an incentive to utilize this non-food crop in lieu of traditional corn. The challenge is to produce the fuel economically as the process involves breaking down fibrous plant walls into sugars, which is an expensive step. Once sugars are formed, they can be fermented to produce cellulosic ethanol.

3.2. Algae

Algae refers to a group of photosynthetic organisms, which has promising potential for biofuels in terms of high oil content, limited waste streams and minimal land requirements (compared to biomass), depending on the production pathway [34,35]. Water is essential for algae cultivation, and can include fresh water, brackish, saline, and wastewater types. Methods of cultivation and recovery vary with implications for energy and environmental effects. Data has been limited to date, so there is a fair amount of uncertainty associated with environmental impacts of this feedstock [34,35,36]. As of 2011, current environmental impacts were deemed negligible, as scaled production had not been demonstrated [34].

3.3. Corn

Corn (maize) is a fundamental food staple that can be grown in a range of climates from tropical to temperate, and may be sensitive to frost. Fertilizer and pesticide needs are high for this crop [37,38]. For feedstock and ethanol production, water needs are relatively low on the unit basis of ethanol produced [37,39,40]. The United States leads the world in using corn to produce ethanol for fuel.

3.4. Jatropha

Jatropha is a non-food, perennial crop that can be grown on marginal land with a range of climates, soil and water conditions. It is versatile in a variety of climates, highly resistant to drought, and is able to shed its leaves to conserve water [41]. There are many countries worldwide that are beginning to invest more in Jatropha. The largest production is currently in Guatemala which has designated 25,000 acres of land for Jatropha growth. Additional countries that are investing in this crop include Mexico, the Sudan, Ethiopia, and India [42].

3.5. Palm

Palm is a prime feedstock for biodiesel, and is produced for biofuels in Indonesia, Malaysia, and other countries of Southeast Asia [43]. Its oil is a fundamental food staple. It is the largest source of vegetable oil consumed worldwide [44,45,46]. Palm trees require deep soil, a relatively stable high temperature, and continuous moisture throughout the year. This feedstock grows in rainy and tropical land.

3.6. Soybeans

Soybeans are a prime fuel and food crop, accounting for 25% and 65% of the global consumption of oil/fats as well as meal/cakes, respectively [46]. The largest producers are the USA and Brazil [55]. This crop can be grown in tropical, subtropical, and temperate climates [48].

3.7. Sugarcane

Globally, sugarcane is the second largest feedstock for ethanol production, and is a basic food crop that is grown in tropical climates. It can have multiyear harvests tied to a single planting [43]. Sugarcane is grown in deep soil using fertilizers that are high in nitrogen and potassium, and low in phosphorous [48]. Sugarcane requires a constant supply of water throughout the growing season, with varying amounts depending on the climate conditions [48]. Brazil is traditionally the most notable producer of sugarcane-derived ethanol.

3.8. Sweet Sorghum

Sweet sorghum is a multi-purpose and annual grass crop that is produced mostly by the USA, Nigeria, and India [37]. It is a variety of sorghum that has a high sugar content. It can grow in tropical, sub-tropical, and temperate regions. Relative to sugarcane, sweet sorghum is more versatile, capable of growing with limited water and in poor/shallow soil [37]. Compared to sugarcane and sugar beet alternatives, sweet sorghum is drought-resistant and has a much shorter growing cycle of four months [37]. Given its 70% water content, sorghum must be processed quickly post-harvest [37].

3.9. Notable Comparisons

Table 2 summarizes the major types of feedstock, based on growth attributes and producers. Looking across the feedstock options, Jatropha, rapeseed, soybeans, and wheat have some of the shortest growth periods at 85–130 days. Rapeseed and rye may be consistently cultivated in lower temperatures, whereas sugarcane must be cultivated in a higher temperature environment. Algae, sugarcane and palm have higher requirements for water.

4. Key Issues and Performance Considerations with Biofuel Sustainability

The following highlights a number of issues and performance considerations for biofuels in the context of sustainability. Implications for ecological systems, society, and the economy are explored.

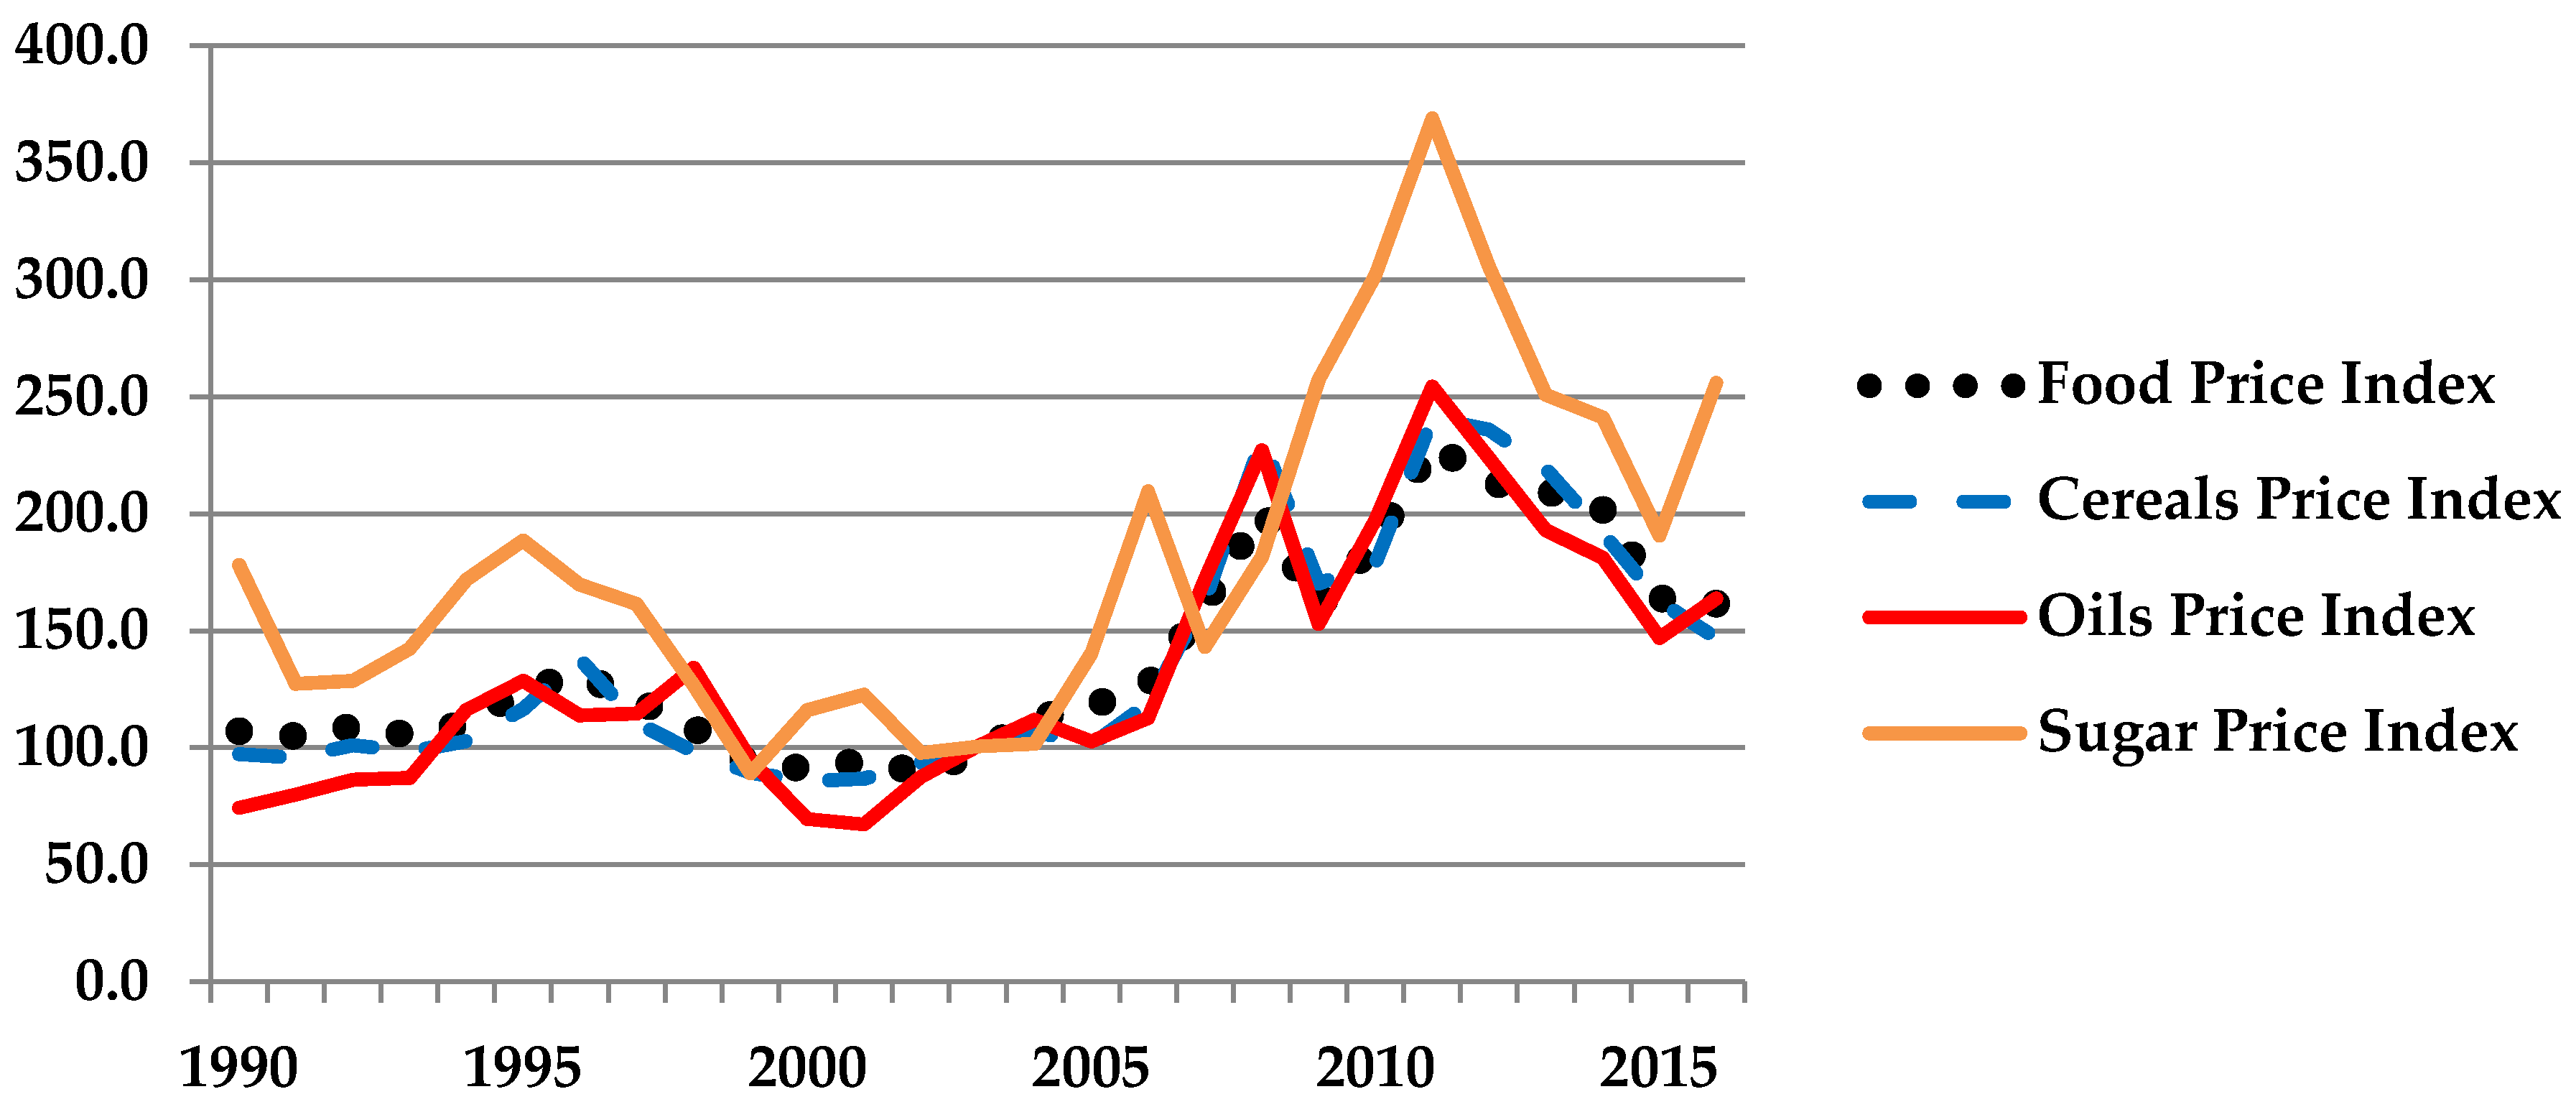
4.1. The Food-Fuel Debate

The competition for cropland between biofuels and food came to the foreground of public agendas in connection with the volatility of global agriculture prices in 2006–2008, and 2010–2011 [56,57,58,59,60] (Figure 4). From 2006 to 2008, for instance, cereal and oilseed prices doubled in close alignment with overall food index prices [47]. Peak prices for cereal and oilseed increased further in 2011–2012, with corn prices attaining even greater spikes in 2012–2013 [43]. Sugar prices tracked more erratically, increasing by more than a factor of 2.5 between 2007 and 2011.
It bears noting that price fluctuations are not uncommon, as food price crises occurred in the 1950s and 1970s. However, the degree of volatility and number of affected countries was quite high with the recent surge [57]. For the period between 2006 and 2011, there is broad agreement that the surge was higher than the previous two decades, but lower than what occurred in the 1970s [57].
During the period of food price escalation, there were also increases in biofuel production, leading to a concern about the links between food and fuel [43]. In both 2008 and 2011, G20 agendas focused on basic food commodity prices [43]. Concern centered largely on: (1) biofuels impacting food prices, which would disproportionately affect the poor; and (2) land conversion by fuel-based crops that could displace food-based crops or lead to new land appropriation in other areas [60,61,62]. No single cause was identified. Analysis indicates that a number of factors were at work, including higher oil prices, weather conditions, investor speculation, and biofuel production [43,56,57,63,64]. Some estimate that 20%–40% of the rise in food prices was attributable to global biofuel growth [26]. Others point to the complicated mix of factors impacting land use, end-use, and markets for flexible crops [60]. While social, environmental, and economic issues remain to be assessed, debates continue over how to even define and appropriately measure price volatility [43].

4.2. Emissions

Emissions from biofuels became a point of contention in recent years. This is largely explained by the complex and highly sensitive methods, assumptions, value choices, and localized data differences that were involved, as well as temporal and regional scoping that can affect results. Not surprisingly, the literature on biofuels reflects a spectrum of competing claims about sustainability. There are, for instance, claims that the net GHG emissions from biofuels can be worse than those attributed to gasoline in terms of climate effects in the lifecycle assessment scenario [62,63,64]. Alternatively, biofuels are also reported to reduce GHG emissions by 60%–94% relative to fossil fuels [65,66]. Looking at regional distinctions, biofuel development in less technologically advantaged countries is also singled out as producing higher GHGs than in more technologically advanced nations [67]. Here, one can see environmental nuances to biofuel adoption, as well as societal asymmetries, which can in turn produce mixed outcomes in sustainability terms. Biodiesel, for instance, can favorably reduce particulate matter by nearly 88% relative to petroleum-based diesel [68]. Yet this same fuel can also produce mixed results by releasing greater amounts of nitrogen oxides, thereby negatively impacting the environment.

4.3. Land

Land use is another primary focus of biofuel sustainability. As the global population continues to grow [69], the expansion of land usage can be expected from food, societal expansion, and biofuels. The United Nations’ Food Agriculture Organization estimates that cultivated areas of global land increased by a net 159 million hectares (Mha) or 12% since 1961, during which time irrigated land doubled and agricultural production grew by a factor of 2.5–3 [70]. In this period, concerns over food shortages were met partly by the intensification of fertilizers and pesticides, in addition to new uses of digital information and genetics [71]. A recent estimate indicates that less than 3% of global agricultural land is currently dedicated to cultivating biofuel crops; nonetheless, concerns over land grabbing and indirect land use change for biofuels do exist [72,73,74].
Looking ahead, a number of studies on the biomass potential of land shed light on the potential for biofuel production. One calculation found that, of the 13.4 billion hectares (Gha) of the global total land surface, 0.7 Gha is gross available land, with 0.44 Gha reflecting the technical upper limit of what could be utilized for the production of biofuels and other bioenergy by 2050. Here Gha refers to the average productivity of all biologically productive areas (in hectares) on earth in a given year [75]. Of the potential regions for expanding cultivable land, roughly 80% is expected in Africa and South and Central America—primarily in Angola, the Democratic Republic of Congo, Sudan, Argentina, Bolivia, Brazil, and Columbia [76]. In the absence of breakthroughs, such as with agricultural yields, these countries will be pivotal in terms of the environmental, economic, and societal aspects of biofuels, and larger agricultural needs.

4.4. Water

Similar to land, water raises questions about the limits associated with biofuels. To put this into context, roughly 70% of the total world’s freshwater is used for agriculture [71] and countries are already experiencing water scarcity issues. Among the nations affected are 30 developing countries [71]. By mid-century this number is projected to increase to 55 countries [71].
Biofuel development could overtax not only the available supply of water, but also the quality of the water, if produced alongside rising food production. Assuming that agriculture intensifies with more fertilizers to produce fuel crops (to feed a rising population of over 9 billion by 2050), the practice of farming for biofuel feedstock could exacerbate problems in regions that are already challenged by runoff into water aquifers and rivers that create dead zones [26,40]. Importantly, there are some approaches to biofuel production that are seen as having a benign effect on water utilization. Planting switchgrass strategically, for instance, alongside cropland and waterways could minimize nitrate contamination of groundwater [77].
At this point in time, rising energy demands combined with water resource limitations and hydrologic variability leave a fair amount to be understood in terms of spatial and temporal patterns for water requirements [78]. It is clear that this remains a key area to monitor for environmental and societal implications.

4.5. Biodiversity

Land conversion and its use for biofuels can affect biodiversity, an environmental dimension of sustainability. Clearing land and forests for cropland may eliminate or disrupt natural habitats for a wide range of species [79]. However, methods for evaluating biodiversity impacts are still nascent. For lifecycle assessments, the ‘biodiversity damage potential’ and the ‘potentially lost endemic species’ metric are rough gauges [79,80,81]. This area has clear relevance for biofuel sustainability determination and related assessments, as with ecosystems services [82,83]. To date, biodiversity has perhaps been best integrated into biofuel planning with respect to agricultural zoning [84].

4.6. Fuel Performance

If biofuels and fossil fuel counterparts are contrasted, a range of differences is evident. Favorable octane gains can be observed, for instance, with biofuels, along with less favorable energy fuel economies relative to fossil fuel substitutes. Higher octane ratings refer to the capacity to withstand compression before igniting. Specific to ethanol, the fuel economy translates into a reduction of 25%–30% in fuel miles per volumetric unit versus gasoline, whereas for biodiesel, the difference is less (relative to diesel). If mid-level blends of biofuels are used at 20%–40%, octane benefits can be derived without much energy penalty of the higher blends, though engine and vehicle design changes are required with investment in infrastructure [24].
Assessing specifically the average emissions impact of biodiesel for heavy-duty highway engines, tests indicate that biodiesel minimizes emissions; however, the decrease depends on the biodiesel source and mixture [85]. If 100% biodiesel is used, combustion produces on average nearly 70% less hydrocarbons, nearly 50% less particulates as well as carbon monoxide emissions, and 10% more NOx [85]. Furthermore, the potential for ozone formation by biodiesel is roughly half that of conventional diesel. Sulfur oxide emissions, an enabler of acid rain, are negligible relative to those from conventional diesel [79,85]. With increased biofuel use, one must also factor for a growth in acetaldehyde emissions, which can increase smog and ozone in the atmosphere [85]. (Looking somewhat differently at supply chain emissions for ethanol and biodiesel (excluding land use), ethanol has been estimated at 2–69 kg CO2-eq/GJ versus 20–49 kg CO2-eq/GJ for biodiesel [79,86,87], indicating a wider range of environmental impact of ethanol.)
Focusing narrowly on a specific fuel type such as ethanol, additional distinctions emerge depending on the feedstock generation type used. For example, ethanol produced from second-generation cellulosic feedstock requires more energy to break down lignin in cellulose. However, emissions from the combustion of conventional biofuels can still be greater than in second-generation fuels due to higher overall fuel and fertilizer inputs during production [79]. Process advances through enzyme efficiency may offer opportunities to reduce the total system-level emissions from second-generation ethanol [79].

4.7. Tradeoffs of Fuel Sustainability

With advanced biofuels, greater technical potential exists by drawing upon natural and anthropogenic waste, which could circumvent food-fuel concerns, reduce carbon emissions, and likely reduce pressure on land and water. However, substantial investment will be required, and cost reductions are still needed at the commercial scale [13]. Specific to algae production, the feedstock utilizes less land than other biofuel inputs on a land per volumetric unit of fuel basis [35]. In conjunction with this, fewer impacts can be expected in terms of land, fertilizer, and pest control [88]. In terms of water, currently algae growth has relatively high needs, so algae-based biofuel may not be suitable for water-challenged regions. Technological advances are also needed both to reduce the costs associated with the dewatering step as well as for identifying algal species that produce high yield.
If one considers land use with residue-based feedstock for advanced biofuels versus that required for grain and dedicated crops in conventional biofuels, the former is more favorable since no additional land is required. Such a scenario avoids competition for land, and, in turn, has minimal impacts on food prices as well as GHG impacts [62,86] and likely water. Crop residue removal for advanced biofuels could also have positive impacts on pest and disease control [89]. Yet residue utilization can also be disadvantageous, since crop residues also conserve soil properties, enhance soil productivity, sequester carbon in soil, and conserve water [89]. Such tradeoffs merit further investigation.
Table 3 presents data on a number of biofuels’ attributes, including water and energy. As with life cycle assessments, one must factor for variations in scoping and accounting. Looking across feedstock options, water needs are highest for algae, rapeseed, and sugarcane. The energy balance is highest for rapeseed-based fuel and cellulosic ethanol. Somewhat differently, the energy intensity reflects biodiesel at much higher values than ethanol per volumetric unit. If yields as well as fertilizer requirements are factored in, some estimates indicate that the energy return on investment for sugarcane ethanol relative to corn-based ethanol is 4–6 times larger [79].
System disturbances represent another area of consideration. Broadly speaking, accidents with biofuels may be less dangerous to the environment relative to fossil fuel substitutes, since biofuels will more readily biodegrade [79]. If indirect impacts are considered, such as those associated with the use of tallow and cooking oil in biofuels, there are benign effects in the removal of such waste products from the system that could contaminate ground water [79].

5. Policy Considerations

Policy has played a pivotal role for biofuels and will likely continue for the foreseeable future by encouraging or impeding sustainable approaches, reducing barriers, and highlighting information or funding needs. This section outlines policy approaches for key biofuel-producing regions. A critical review follows, outlining unsustainable system issues with policy-related trade activity.

5.1. Brazil

In Brazil, the blending requirement for ethanol recently has been 18%–27.5%, currently 27% [96]. Rules for the biodiesel mix designate a stepped timetable to increase the mix from 7% to 10% by 2019 [96]. A regional producer subsidy for ethanol is in place to more evenly balance costs of production between less and more developed growth regions. In conjunction with the economic downturn, no support was provided in 2015 [96]. Tax incentives exist for ethanol-conducive vehicles, which translate as a reduced tax burden for flex fuel vehicles versus that for strictly gasoline-only fueled vehicles. Specific to biodiesel, the National Biodiesel Production Program (PNPB) was launched in 2004, compelling suppliers to procure vegetable oil from small producers and family farms [1,97]. Tax exemptions and incentives are in place for biodiesel, based on feedstock, producer size, and region, in order to encourage production and social inclusion [48]. An intricate tax policy system also exists for fuels, spanning local to federal jurisdictions that are currently set to be favorable for ethanol versus gasoline [55]. However, the setting of artificially low gasoline prices to counteract inflation in recent years had a deleterious effect on biofuels [1]. Support for project financing in the form of investment credit lines is also indicated [55], yet it is unclear how readily these funds will be available given the current economic conditions [1].

5.2. China

Bioenergy is a dimension of China’s strategic energy planning. Biofuel programs have been implemented since the early 2000s, with direct subsidies for conventional grain-based biofuels now discontinued [98]. The 12th Five Year Plan that ended in 2015 included a goal of producing 4 million tons of fuel ethanol and 1 million tons of biodiesel [98]. Broadly, the country has a 15% biofuels target by 2020 and aims to move toward a 10% mandate [99]. In addition, a number of the provinces have mandates in place to blend 10% biofuels [99]. With China taking an active role in curbing CO2 emissions, more policies to encourage renewables including biofuels are anticipated.

5.3. EU

Regulations for the use of transport-based biofuels are outlined in the 2009 EU Energy and Climate Change Package (CCP) [100]. The CCP includes requirements which stipulate that 20% of the overall EU energy mix should be renewable energy in 2020. Within the CCP, the Renewable Energy Directive (RED) defines sustainability requirements for liquid biofuels, encompassing GHG reductions, land management, as well as additional environmental, social and economic criteria [21]. In 2015, the European Commission established a 7% cap (energy basis) on conventional, food-based biofuels in transportation by 2020, which limits future production of Generation 1 biofuels [21]. It resides within a larger 10% target in the RED that is obligatory for all member states. Advanced (non-food) biofuels are noted with a non-binding five percent national target. Member states have until 2017 to implement the revised rules [21,23].

5.4. India

In 2009, a national biofuels policy was instituted, encouraging the use of renewable energy in transport, with an aim to replace 20% of petroleum-based fuel with biofuels by the end of the 12th Five Year Plan in 2017 [101]. In 2014, diesel prices were deregulated, enabling more favorable conditions for biodiesel production [101]. The government announced a blending requirement of 10% ethanol in gasoline, beginning with the October 2015/2016 sugarcane season, alongside existing rules that set minimum sugarcane pricing [99]. Discussions are now focused on amending the 2009 biofuels law, including coverage of a mandatory blend for biodiesel. A recent push by India to become a “Methanol Economy” and a net zero petroleum import country is an endeavor to watch in the coming years with respect to the impact on biofuels and national policy associated with alternate fuels [102].

5.5. United States

The USA requires the use of a minimum volume of biofuel in transportation, but does not mandate its production [103,104,105]. This policy is enshrined in the Renewable Fuel Standard (RFS) that was established with the Energy Policy Act of 2005 [106] and later enlarged with the Energy Independence and Security Act of 2007 [107]. The Environmental Protection Agency oversees the RFS mandate, which essentially is designed to increase consumption volumes from 9 billion gallons of renewable fuel in 2008 to 36 billion in 2022 [103,104,105]. The RFS outlines four categories of fuels that meet the statutory requirements, with sub-mandates existing for various advanced fuels. The EPA regulates compliance with a tradeable credit system, and waiver capabilities [103,104,105]. The agency is required to announce volumetric requirements each November for the upcoming year, with the exception of biomass-based diesel, which must be announced 14 months in advance [103,104]. Tax credits for blending provide $1.00 per gallon of biodiesel, agri-biodiesel, or renewable diesel that is blended with petroleum diesel to produce a mixture that includes at least 0.1% diesel fuel [108,109]. Related tax credits exist for delivery of 100% biodiesel as an on-road fuel [110]. Feedstock incentives provide financial support to establish biomass feedstock crops for advanced biofuels facilities and produce advanced biofuels [111,112,113].

5.6. Unsustainable System Issues—Conflicts between Sustainability, Policy, and Trade

In the following we outline recent issues which emerged in connection with national biofuel-based policy and trade, fostering conditions that ran counter to the fundamental precepts of sustainability.
The U.S. biofuels policy for the blender’s tax credit on biodiesel serves as an unusual basis for unsustainable trade interactions. The $1.00 per gallon tax credit enabled U.S. refiners to import biodiesel, such as rapeseed oil, from the EU. Once in the USA, the biodiesel was mixed with 0.1% diesel, and then the refined fuel was shipped back to the EU, allowing the suppliers to collect the credit and sell the fuel in the EU at below market prices [43,114]. The EU biodiesel industry challenged this on the grounds that the inexpensive and subsidized biodiesel flooded the EU markets [43,114]. Following a review, the EU implemented anti-dumping and countervailing duties on U.S. biodiesel imports in 2009. Despite the expiration of the blenders’ credit in 2009, the credit has been extended several times. Amplifying on this, two-region dynamic, Canadian suppliers also benefitted from the above U.S. and EU conditions, with producer tax credits for domestic, Canadian producers that added to the gains [43,114].
The unusual entanglement of biofuel policy and trade activity with ‘splash and dash’ has since been somewhat stymied with the EU extending its anti-dumping measures in 2011 to biodiesel consigned from Canada [115,116,117]. Analysis suggests, however, that the EU anti-dumping and countervailing measures did not entirely alter the policy-induced conditions, since U.S. biodiesel exports could be trans-shipped through intermediary points [43,114]. (In November 2013, anti-dumping limits were also imposed on Argentinian and Indonesian biodiesel, and in September of 2016, the EU Court annulled the anti-dumping rules on Argentina and Indonesia [118]).
The broader sustainability implications of the ‘splash and dash’ example underscore real issues with unintended consequences of policy. Multiple rounds of fuel shipping to obtain economic gains resulted in additional fuel use and related GHG emissions/environmental effects, etc. In conjunction with this, short-term economic gains accrued for producers but undermined broader sustainability interests at the global systems level. The long-term durability of the system also did not reflect sound economics, as U.S. tax-payers were subsidizing inexpensive biodiesel in the EU.
Another example of unsustainable policy and market dynamics was recently evident in the ethanol swap between Brazil and the USA. In this case, U.S. policies created an unintended market dynamic by designating sugarcane-base biofuels as advanced biofuels, and corn-based ethanol as conventional biofuels. While corn and ethanol-based biofuels function similarly in technical terms, this policy classification was based on GHG savings of the production cycle. (This was done at the national level through a U.S. Environmental Protection Agency rule [33]. A similar policy dynamic appeared and persists at the state level in California with the Low Carbon Fuel Standard mandate. This rule gauges fuels based on lifecycle GHG emissions [119], and requires the substitution for fossil fuels with low carbon fuels.) In line with this, Brazilian sugarcane-based ethanol was shipped to the USA to meet higher threshold needs of advanced biofuel requirements. In doing so, shortfalls emerged in Brazil, which were met by American corn-based ethanol being exported to Brazil [120]. The interaction of the two markets for different qualifying fuels produced an international fuel swap with a highly unsustainable dynamic of increased transport fuels and emissions, in addition to unintended economics in which American biofuel subsidies were paying for Brazilian fuels. Broadly speaking, the advanced biofuel was supposed to be low-carbon and sustainable. In real, systemic terms, the fuel became more carbon-intensive and much less sustainable due to the accompanying practices.
Both examples emphasize the need for systems thinking by decision-makers and regular monitoring of policies to enable mid-course corrections.

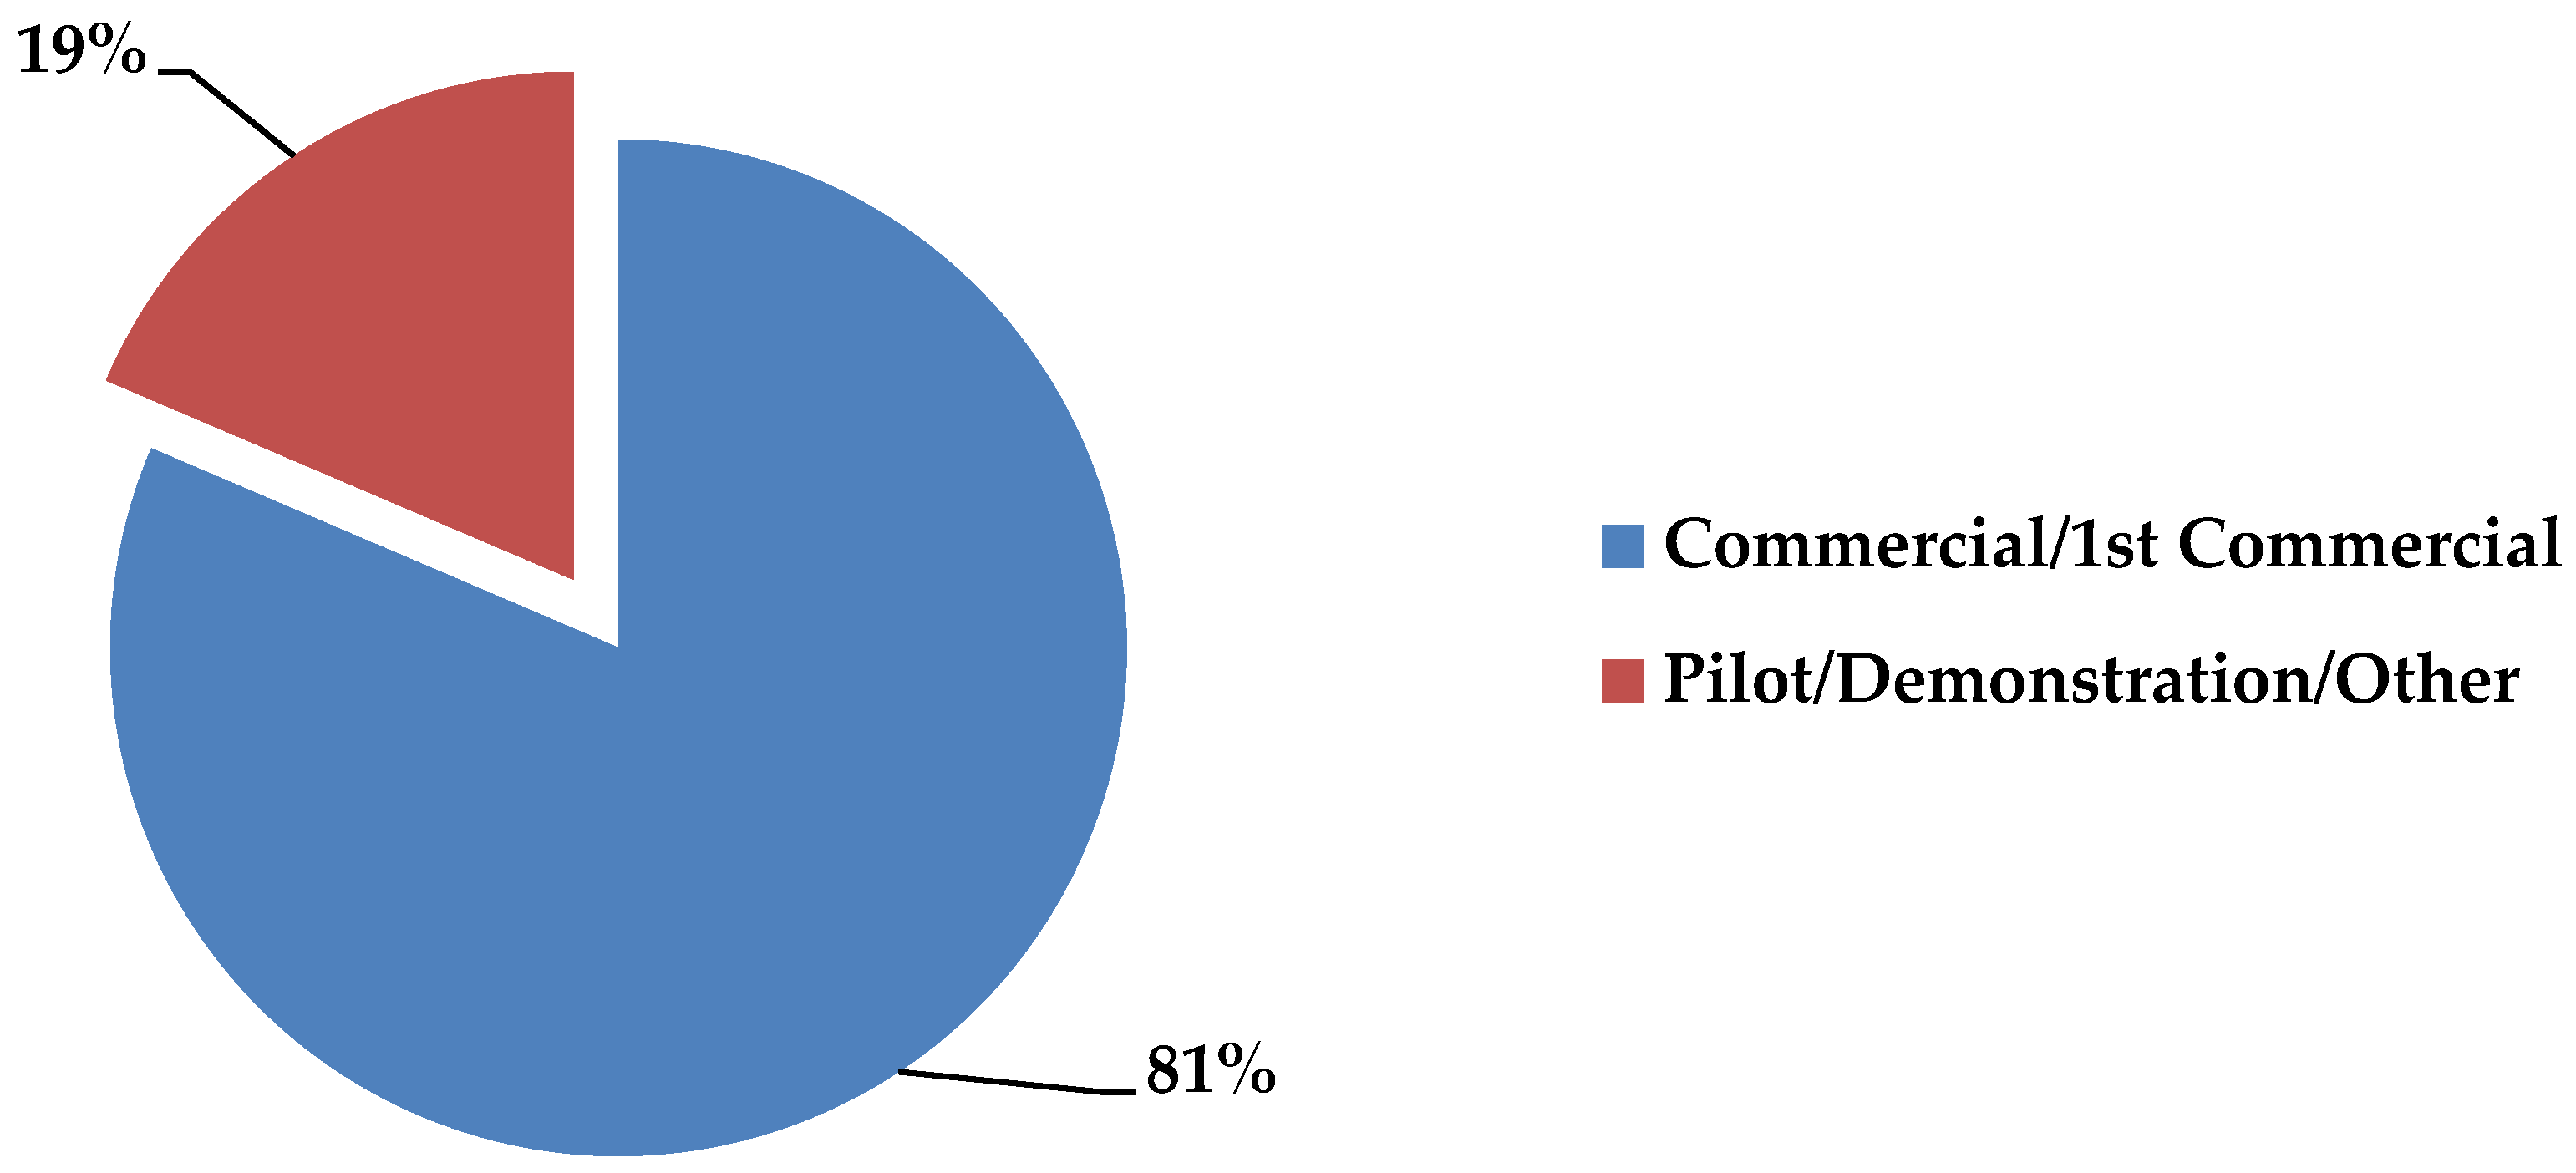
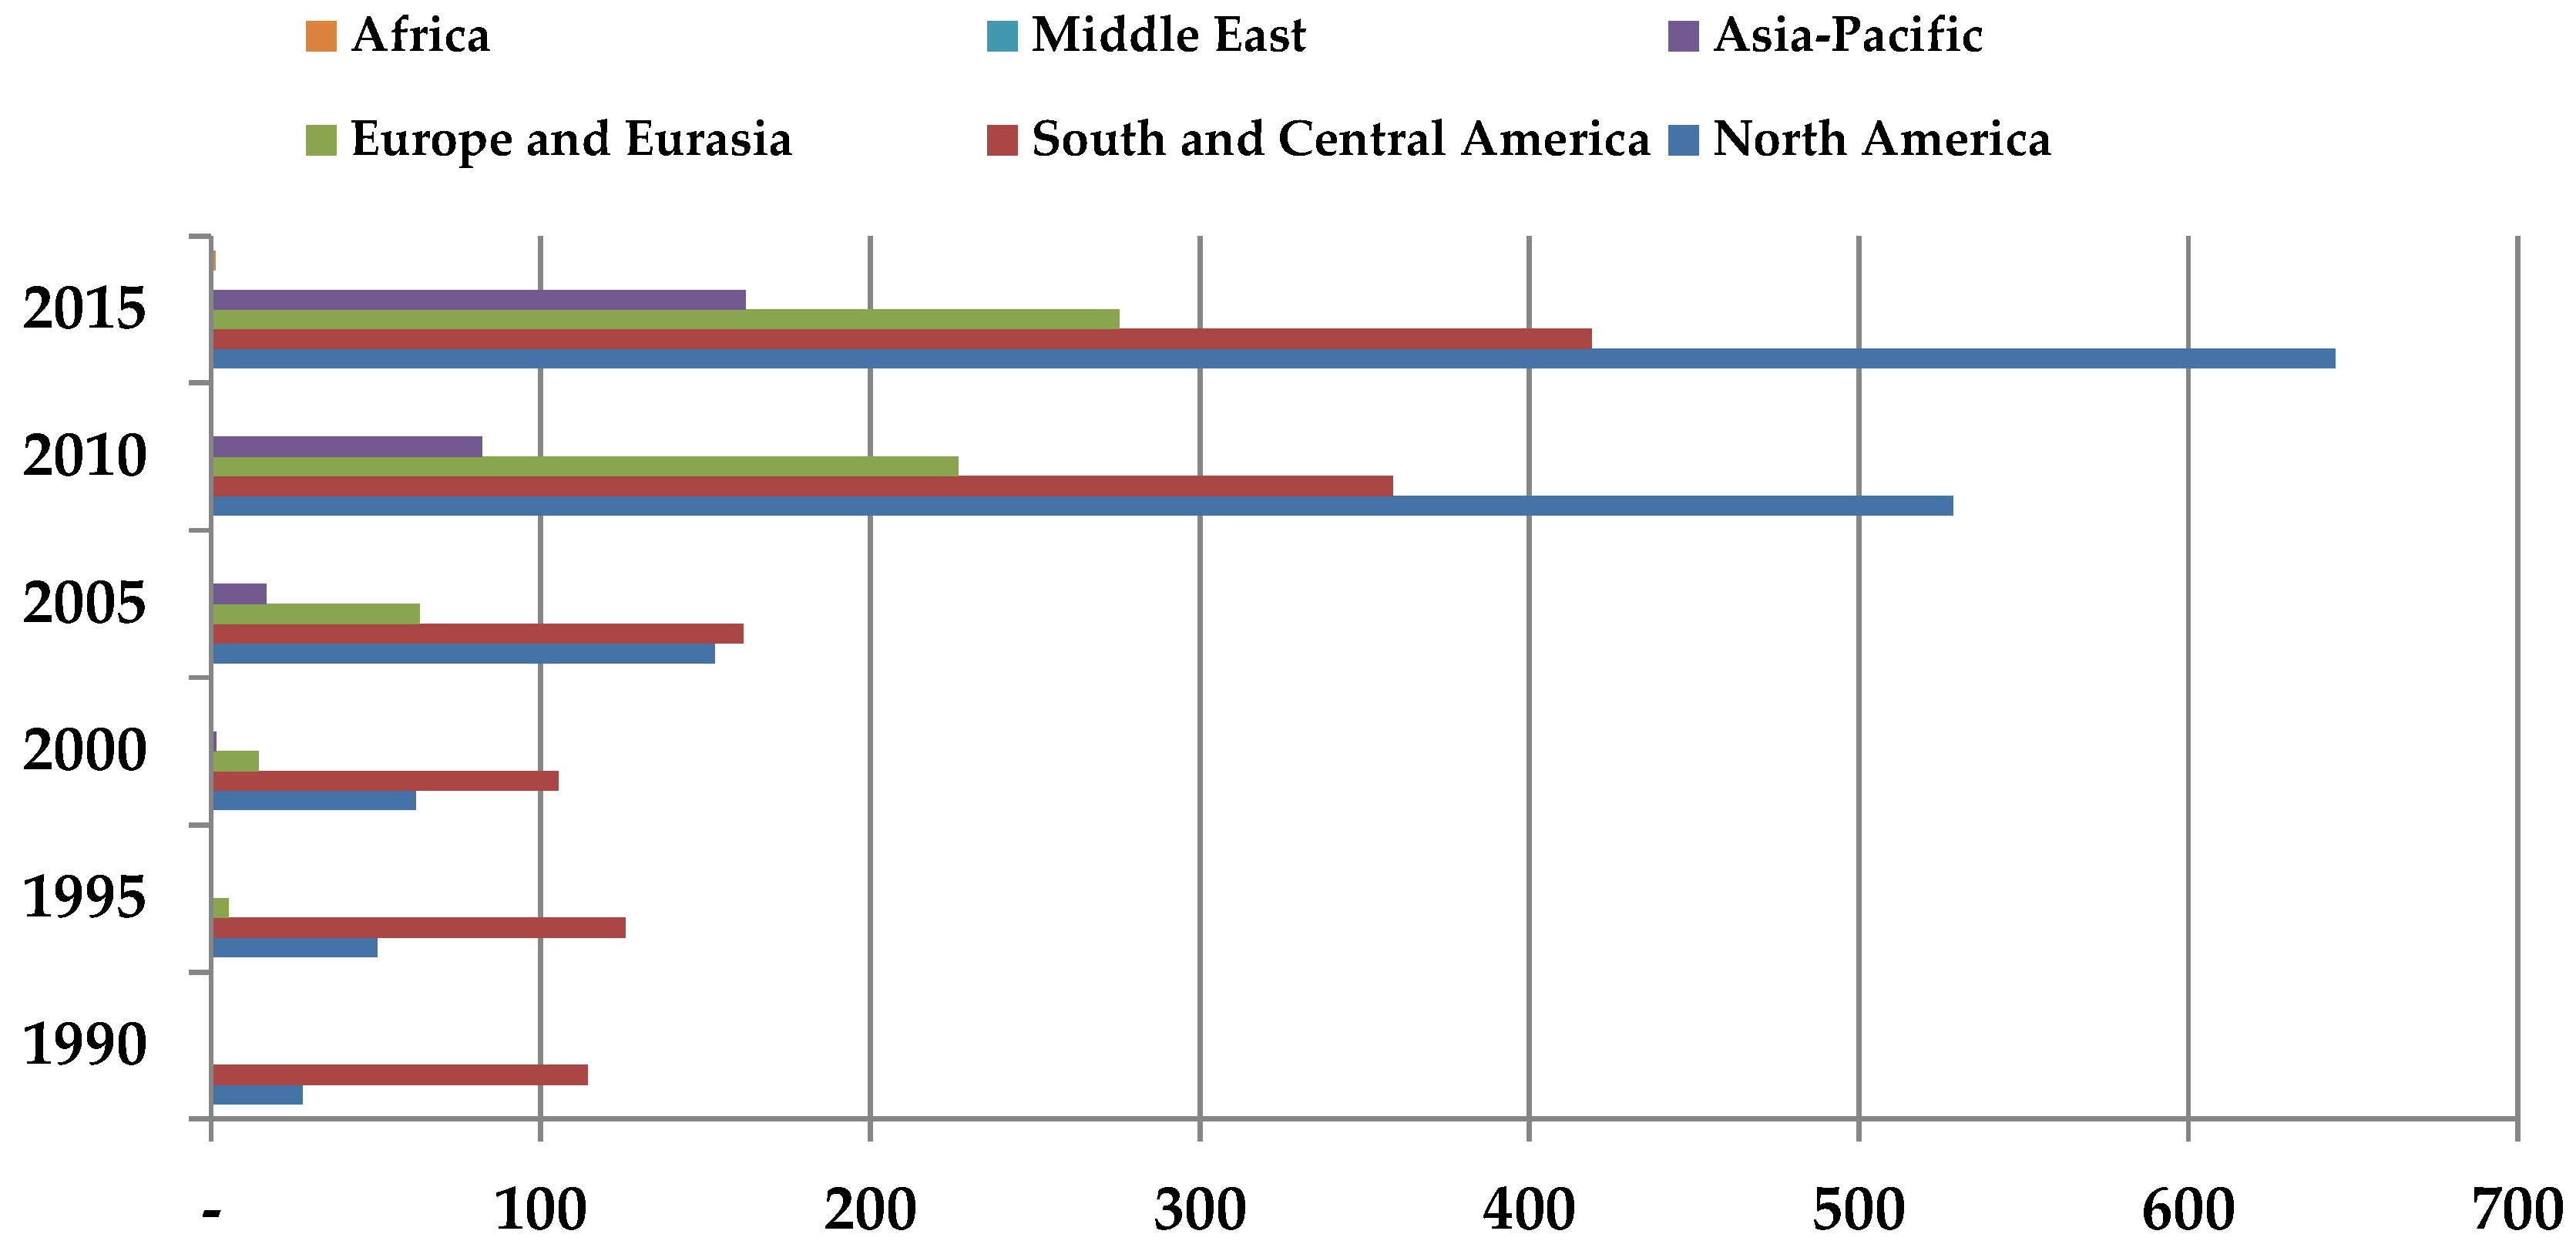
6. Investment in Biofuels

Looking beyond the technical aspects, sustainability/performance, and policy aspects of biofuels, another critical dimension of the biofuel outlook can be found in investment trends.
Global investment in biofuels was estimated to equal $3.1 billion in 2015, reflecting a decline of 35% relative to 2014 and more than 80% in nominal terms since 2008 [121,122]. At the beginning of the 21st century, billions of dollars were invested in advanced biofuel projects by international oil companies, with many of the projects later being abandoned [123].
Commercialization of advanced biofuels is more costly and protracted than originally anticipated [122]. The decline in per barrel oil prices from $115 in June 2014 to $27 in 2015 recovered somewhat to roughly $50 in most of 2016, yet the absence of a coherent biofuel policy in the United States for much of 2015, plus necessary time and financing, have combined to deter all but a small set of investors [123].
Key players that are crucial for enabling investment and other development at scale for biofuels will continue to include airlines and other, large corporations. Among airlines, United Airlines signed a $30 million deal in 2015 with Fulcrum Bioenergy to provide alternative jet fuel at prices that are competitive with conventional jet fuel [124]. JetBlue also signed a 10-year power purchase agreement with S.G. Preston for renewable jet fuel that is produced from non-food, hydro-processed esters and fatty-acid-based feedstock [125]. Outside of aviation, large companies like Dupont (known for its historical strength in chemicals and ammunition) are driving the development of cellulosic plants [126].
Global production capacity for advanced biofuels at the end of 2015 was estimated to be 225 million gallons per year [127]. Planned capacity would add another 390 million gallons per year, with initiatives underway in Brazil, China, Canada, the Netherlands, the United Kingdom, Sweden, France, and the USA [127]. Notably, the majority of the existing capacity is in ethanol (Figure 5).
When viewed from the standpoint of development stages for advanced biofuels, more than 80% of existing capacity is commercialized (Figure 6), the majority of which started in 2014 or later [127]. In 2015 and early 2016, two commercial-scale, advanced biofuel plants were commissioned (Finland and the United States), plus three pilot-scale demonstration plants [128]. The performance of these plants could be pivotal for future deployment.
Important, continuing challenges remain for advanced biofuels in ensuring sustainability and reducing production costs [129]. The most challenging aspect of algae-derived fuels, for example, is the dewatering step [130]. Specific to production costs for advanced biofuels, recent estimates are significantly higher than $3 per gallon, which substantially exceeds the untaxed price of petroleum alternatives [131]. One can look, for instance, at the Abengoa SA, owner of a cellulosic biofuel plant in Kansas, which suspended operation in late 2015 and filed for bankruptcy [132]. The plant was built with loan guarantees of $132.4 million and a $97 million grant from the U.S. Department of Energy [133]. This example underscores not only the challenges of developing economically competitive, advanced biofuels, but of managing technological progress in an emerging market.

7. Conclusions

Biofuels remain in a pivotal position today for the transport sector in sustainability terms. They are an important link for cross-cutting priorities in agriculture, energy, the environment, and socioeconomic development, having relevance for multiple industries. They also have varied favorability profiles that are linked to local conditions, practices, and cascading effects between agriculture and energy systems.
In the near term, increases in production yields will likely be the mainstay for sustainability. Specific to Generation 1 fuels, the system durability improvements may advance with strategic crop rotation, plant and system complementarities, and co-products. For Generation 2 fuels, capacity is being rolled out, but a steep technology learning curve exists. Good potential remains for feedstock, like that of Jatropha, switchgrass, and algae, which have limited (new) land footprints, but these await better economics. A number of projects have been delayed or cancelled. The key will be in getting the economics and scalability right with the next set of adopters. Until one or more critical breakthroughs occur, policies will be instrumental for the sustainability and scalability of biofuels. Policies can draw attention to more productive biofuels. Policies will also be key for ensuring that food security and the natural system are not undermined, as favorable community objectives are pursued. It bears underscoring that not all policies are sound. Lessons show that sustainability-related policies can produce unintended consequences that run counter to the basic tenets of sustainability. Here, interim systems thinking and performance checks will be critical.
Ultimately, the road ahead for biofuels remains mixed as their future is tied to uncertainties in physical limits, economic advantages, and social priorities. Some of the most exciting developments may emerge in the aviation industry. The system limits, however, will require periodic review to consider feedback effects and spillovers into other systems and industries.

Acknowledgments

The authors are grateful for editorial support from Paola Moreno and Noim Uddin with the Department of Technology and Society at Stony Brook University.

Conflicts of Interest

To our knowledge, there are no conflicts of interest with the publishing of this article.

References

  1. Araújo, K. Low Carbon Energy Transitions: Turning Points in National Policy and Innovation; Oxford University Press: New York, NY, USA, 2017. [Google Scholar]
  2. Kovarik, B. History of Biofuels. In Biofuels Crops; Singh, B.P., Ed.; Center for Bioscience International (CABI): Wellington, UK, 2013. [Google Scholar]
  3. Renewable Energy Network 21 (REN21). Global Status Report; REN21: Paris, France, 2016. [Google Scholar]
  4. International Renewable Energy Agency (IRENA). Innovation Outlook: Advanced Liquid Biofuels; International Renewable Energy Agency: Abu Dhabi, UAE, 2016. [Google Scholar]
  5. International Renewable Energy Agency (IRENA). Boosting Biofuels; International Renewable Energy Agency: Abu Dhabi, UAE, 2016. [Google Scholar]
  6. International Energy Agency (IEA). CO2 Emissions from Combustion; IEA/OECD: Paris, France, 2016. [Google Scholar]
  7. IEA. Data Subscription, 2016. IEA/OECD: Paris, France. Available online: https://www.iea.org/statistics/onlinedataservice/ (accessed on 10 December 2016).
  8. BP. Statistical Review of World Energy; BP: London, UK, 2016. [Google Scholar]
  9. Energy Information Administration (EIA). Available online: http://www.eia.gov/totalenergy/data/annual/index.php (accessed on 10 August 2016).
  10. International Civil Aviation Organization (ICAO). 2013 Environmental Report: Destination Green; International Civil Aviation Organization: Montreal, QC, Canada, 2013. [Google Scholar]
  11. International Air Transportation Association (IATA). 2015 Report on Alternative Fuels; International Air Transportation Association: Montreal, QC, Canada; Geneva, Switzerland, 2015. [Google Scholar]
  12. Milman, O. First Deal to Curb Aviation Emissions Agreed in Landmark UN Accord. The Guardian. Available online: https://www.theguardian.com/environment/2016/oct/06/aviation-emissions-agreement-united-nations (accessed on 6 October 2016).
  13. Huenteler, J.; Lee, H. The Future of Low Carbon Road Transport; Rapporteur’s Report; Belfer Center, Kennedy School of Government, Harvard University: Cambridge, MA, USA, 2015. [Google Scholar]
  14. Biofuels: The Fuel of the Future, Asia. Available online: http://www.biofuel.org.uk (accessed on 25 July 2016).
  15. German Agency for Technical Cooperation (GTZ); Worldwatch; German Federal Ministry of Food; Agriculture and Consumer Protection (BMELV). Biofuels for Transportation. 2006. Available online: http://www.worldwatch.org/system/files/EBF008_1.pdf (accessed on 10 October 2016).
  16. Organization for Economic Cooperation and Development (OECD)-UN Food and Agriculture Organization (FAO). Agricultural Outlook 2016–2025; OECD: Paris, France, 2016. [Google Scholar]
  17. International Energy Agency (IEA). Biofuels for Transport; IEA/OECD: Paris, France, 2011. [Google Scholar]
  18. Kojima, M.; Johnson, T. Potential for Biofuels in Transport in Developing Countries; ESMAP Paper, Knowledge Exchange Series No 4; World Bank: Washington, DC, USA, 2006. [Google Scholar]
  19. Seelke, C.; Yacobucci, B. Ethanol and Other Biofuels: Potential for U.S.-Brazil Cooperation; CRS Report RL34191, September 27, 2007, and Environmental Protection Agency (EPA), Renewable Fuel Standard Program. Available online: https://www.epa.gov/renewable-fuel-standard-program (accessed on 20 July 2016).
  20. Anderson, J.; DiCicco, D.; Ginder, J.; Kramer, U.; Raney-Pablo, H.; Wallington, T. High Octane Number Ethanol-Gasoline Blends. Fuel 2012, 97, 585–594. [Google Scholar] [CrossRef]
  21. U.S. Department of Agriculture (USDA). EU Biofuels Annual 2016; GAIN Report Number NL 6021; USDA: Washington, DC, USA, 2016.
  22. U.S. Department of Agriculture (USDA). EU’s General Court Rules Against Anti-Dumping Duty on US; GAIN Report GM E16025; USDA: Washington, DC, USA, 2016.
  23. U.S. Department of Agriculture (USDA). EU Biofuel Mandates by Member State; GAIN Report GM 16009; USDA: Washington, DC, USA, 2016.
  24. Theiss, T.; Alleman, T.; Brooker, A.; Elgowainy, A.; Fioroni, G.; Han, J.; Huff, S.; Johnson, C.; Kass, M.; Leiby, P.; et al. Summary of High-Octane, Mid-Level Ethanol Blends Study; ORNL/TM-2016/42; Oak Ridge National Laboratory: Oak Ridge, TN, USA, 2016.
  25. Consumer Reports. Diesel vs. Biodiesel vs. Vegetable Oil. Available online: http://www.consumerreports.org/cro/2012/05/diesel-vs-biodiesel-vs-vegetable-oil/index.htm (accessed on 20 August 2016).
  26. Solomon, B.; Bailis, R. (Eds.) Sustainable Development of Biofuels in Latin America and the Caribbean; Springer: New York, NY, USA, 2014. [Google Scholar]
  27. Department of Energy (DOE). Alternative Fuels Data Center. Available online: http://www.afdc.energy.gov/fuels/emerging.html (accessed on 28 August 2016).
  28. Aatola, H.; Larmi, M.; Sarjovaara, T.; Mikkonen, S. Hydrotreated Vegetable Oil (HVO) as a Renewable Diesel Fuel: Trade-off between NOx, Particulate Emission, and Fuel Consumption of a Heavy Duty Engine. SAE Int. J. Engines 2008, 1, 1251–1262. [Google Scholar] [CrossRef]
  29. Davis, R.; Tao, L.; Scarlata, C.; Tan, C.; Ross, J.; Lukas, J.; Sexton, D. Process Design and Economics for the Conversion of Lignocellulosic Biomass to Hydrocarbons; NREL/TP-5100-62498; National Renewable Energy Laboratory: Golden, CO, USA, 2015.
  30. Murphy, C.; Kendall, A. Lifecycle Analysis of Biochemical Cellulosic Ethanol under Multiple Scenarios. GCB Bioenergy 2015, 7, 1019–1033. [Google Scholar]
  31. Hadar, Y. Sources for Lignocellulosic Raw Materials for the Production of Ethanol. In Lignocellulose Conversion; Springer: Heidelberg, Germany, 2013. [Google Scholar]
  32. Kahr, H.; Wimberger, J.; Schürz, D.; Jäger, A. Evaluation of the Biomass Potential for the Production of Lignocellulosic Bioethanol from Various Agricultural Residues in Austria and Worldwide. Energy Proc. 2013, 40, 146–155. [Google Scholar] [CrossRef]
  33. Kumar, G.; Bakonyi, P.; Periyasamy, S.; Kim, S.H.; Nemestóthy, N.; Bélafi-Bakó, K. Lignocellulose biohydrogen: Practical challenges and recent progress. Renew. Sustain. Energy Rev. 2015, 44, 728–737. [Google Scholar] [CrossRef]
  34. U.S. Environmental Protection Agency (U.S. EPA). Biofuels and the Environment: The First Triennial Report to Congress (2011 Final Report); EPA/600/R-10/183F; U.S. Environmental Protection Agency: Washington, DC, USA, 2011.
  35. Dismukes, G.; Carrieri, D.; Bennette, N.; Ananyev, G.; Posewitz, M. Aquatic Phototrophs: Efficient Alternatives to Land-based Crops for Biofuels. Curr. Opin. Biotechnol. 2008, 19, 235–240. [Google Scholar] [CrossRef] [PubMed]
  36. Scott, S.; Davey, M.; Dennis, J.; Horst, I.; Howe, C.; Lea-Smith, D.; Smith, A. Biodiesel from Algae: Challenges and Prospects. Curr. Opin. Biotechnol. 2010, 21, 277–286. [Google Scholar] [PubMed]
  37. Elbehri, A.; Liu, A.; Segerstedt, A.; Liu, P.; Babilonia Estrada, R.; Hölldobler, B.W.; Davies, S.J.C.; Stephen Navarro, C.L.; Andrew, J.F.; Pérez, H. Biofuels and the Sustainability Challenge: A Global Assessment of Sustainability Issues, Trends and Policies for Biofuels and Related Feedstocks; FAO: Rome, Italy, 2013. [Google Scholar]
  38. European Environment Agency (EEA). How Much Bioenergy Can Europe Produce without Harming the Environment? EC: Copenhagen, Denmark, 2006. [Google Scholar]
  39. Aden, A. Water Usage for Current and Future Ethanol Production. Southwest Hydrol. 2007, 6, 22–23. [Google Scholar]
  40. National Research Council (NRC). Water Implications of Biofuels Production in the United States; NRC: Washington, DC, USA, 2008. [Google Scholar]
  41. Koundinya, V. Jatropha Profile; Agricultural Marketing Resource Center: Ames, IA, USA, 2008. [Google Scholar]
  42. Lane, J. Jatropha around the World. Biofuels Digest. Available online: http://www.biofuelsdigest.com/bdigest/2014/09/11/jatropha-around-the-world-as-sgb-raises-11m-heres-a-13-country-tour-development-activity/ (accessed on 11 September 2014).
  43. De Gorter, H.; Drabik, D.; Just, D. The Economics of Biofuel Policies; Palgrave: New York, NY, USA, 2015. [Google Scholar]
  44. Verheye, W.H. Growth and Production of Oil Palm; UNESCO-EOLSS Publishers: Belgium, Europe, 2010. [Google Scholar]
  45. Rosillo-Calle, F.; Pelkmans, L.; Walter, A. A Global Overview of Vegetable Oils, with Reference to Biodiesel, Task 40 IEA Bioenergy Report; IEA: Paris, France, 2009. [Google Scholar]
  46. Thoenes, P. Soybean International Commodity Profile, Background Paper for the Competitive Commercial Agriculture in Sub-Saharan Africa (CCAA) Study; FAO: Rome, Italy, 2006. [Google Scholar]
  47. FAO. Information. Available online: http://www.fao.org/ (accessed on 10 December 2016).
  48. FAOSTAT. Information. Available online: http://faostat3.fao.org/home/E.%2019%20Aug.%202016 (accessed on 10 December 2016).
  49. Brittaine, R.; Lutaladio, N. Jatropha: A Smallholder Bioenergy Crop. In Integrated Crop Management; FAO: Rome, Italy, 2010; Volume 8, pp. 1–95. [Google Scholar]
  50. Wahl, N.; Hildebrandt, T.; Moser, C.; Lüdeke-Freund, F.; Averdunk, K.; Bailis, R.; Barua, K.K.; Burritt, R.; Groeneveld, J.H.; Klein, A.-M.; et al. Insights into Jatropha Projects Worldwide: Key Facts & Figures from a Global Survey; Centre for Sustainability Management: Lüneburg, Germany, 2012. [Google Scholar]
  51. Sumathi, S.; Chai, S.P.; Mohamed, A.R. Utilization of Oil Palm as a Source of Renewable Energy in Malaysia. Renew. Sustain. Energy Rev. 2008, 12, 2404–2421. [Google Scholar] [CrossRef]
  52. Kandel, H.; Knodel, J.J. Canola Production Field Guide; NDSU Extension Service: Farg, ND, USA, 2011; pp. 1–122. [Google Scholar]
  53. North, S.; Eberbach, P.; Thompson, J. Wheat and Canola Water Requirements and the Effect of Spring Irrigation on Crop Yields in the Central Murray Valley. In Global Issues, Paddock Action; Verlag: Veterinärmedizin, Austria, 2008; pp. 1–5. [Google Scholar]
  54. Cereal Rye/The University of Vermont Extension Crops & Soils Team. Available online: http://northerngraingrowers.org/wp-content/uploads/RYE.pdf (accessed on 19 August 2016).
  55. USDA. Information. 2016. Available online: http://plants.usda.gov/core/profile?symbol=JACU2 (accessed on 30 June 2016).
  56. High Level Panel of Experts of Food Security and Nutrition (HLPE), UN Committee on World Food Security. Biofuels and Food Security, Report; HLPE: Rome, Italy, 2013. [Google Scholar]
  57. High Level Panel of Experts of Food Security and Nutrition (HLPE), UN Committee on World Food Security. Price Volatility and Food Security, Report; HLPE, UN Committee on World Food Security: Rome, Italy, 2011. [Google Scholar]
  58. Thompson, B.P. The Agricultural Ethics of Biofuels: The Food vs. Fuel Debate. Agriculture 2012, 2, 339–358. [Google Scholar]
  59. Oladosu, G.; Msangi, S. Biofuel-Food Market Interactions: A Review of Modeling Approaches and Findings. Agriculture 2013, 3, 53–71. [Google Scholar] [CrossRef]
  60. Tomei, J.; Helliwell, R. Food versus Fuel? Going Beyond Biofuels. Land Use Policy 2016, 56, 320–326. [Google Scholar] [CrossRef]
  61. UN Food and Agriculture Organization (FAO). Food Outlook, Biennial Report on Global Food Markets; FAO: Rome, Italy, 2016. [Google Scholar]
  62. Searchinger, T.; Heimlich, R.; Houghton, R.A.; Dong, F.; Elobeid, A.; Fabiosa, J.; Tokgoz, S.; Hayes, D.; Yu, T.-H. Use of U.S. Croplands for Biofuels Increases Greenhouse Gases through Emissions from Land-Use Change. Science 2008, 319, 1238–1240. [Google Scholar] [PubMed]
  63. Yang, Q.; Chen, G.Q. Greenhouse gas emissions of corn—Ethanol production in China. Ecol. Model. 2013, 252, 176–184. [Google Scholar] [CrossRef]
  64. Kahn Ribeiro, S.; Figueroa, M.; Creutzig, F.; Dubeux, C.; Hupe, J.; Kobayashi, S. 2012: Chapter 9—Energy End-Use: Transport. In Global Energy Assessment—Toward a Sustainable Future; Cambridge University Press: Cambridge, UK; New York, NY, USA; The International Institute for Applied Systems Analysis: Laxenburg, Austria, 2008; pp. 575–648. [Google Scholar]
  65. Holma, A.; Koponen, K.; Antikainen, R.; Lardon, L.; Leskinen, P.; Roux, P. Current Limits of Life Cycle Assessment Framework in Eevaluating Environmental Sustainability—Case of Two Evolving Biofuel Technologies. J. Clean. Prod. 2013, 54, 215–228. [Google Scholar] [CrossRef]
  66. Highina, B.; Bugaje, I.; Umar, B. A Review of Second Generation Biofuel: A Comparison of its Carbon Footprints. Eur. J. Eng. Technol. 2014, 2, 117–125. [Google Scholar]
  67. Ji, X.; Long, X. A Review of the Ecological and Socioeconomic Effects of Biofuel and Energy Policy Recommendations. Renew. Sustain. Energy Rev. 2016, 61, 41–52. [Google Scholar] [CrossRef]
  68. Xue, J.; Grift, T.; Hansen, A. Effect of Biodiesel on Engine Performance and Emissions. Renew. Sustain. Energy Rev. 2011, 15, 1098–1116. [Google Scholar] [CrossRef]
  69. UN Department of Economic and Social Affairs (UN DESA), Population Division. 2015 Revision, World Population Prospects, Report; ESA/P/WP.241; United Nations: New York, NY, USA, 2015. [Google Scholar]
  70. FAO; Earthscan/Routledge. The State of the World’s Land and Water Resources for Food and Agriculture; FAO and Earthscan/Routledge: Abingdon, UK, 2011. [Google Scholar]
  71. Fischer, G.; van Velthuizen, H.; Shah, M.; Nachtergaele, F. Global Agro-Ecological Assessment for Agriculture in the 21st Century; Report RR 02 02; IIASA; FAO: Laxenburg, Austria; Rome, Italy, 2002. [Google Scholar]
  72. Popp, J.; Lakner, Z.; Harangi-Rakos, M.; Fari, M. The Effect of Bioenergy Expansion: Food, Energy and Environment. Renew. Sustain. Energy Rev. 2014, 32, 559–578. [Google Scholar] [CrossRef]
  73. Borras, S.; Franco, J. Global Land Grabbing and Trajectories of Agrarian Change: A Preliminary Analysis. J. Agrar. Chang. 2012, 12, 34–59. [Google Scholar] [CrossRef]
  74. Edenhofer, O.; Pichs-Madruga, R.; Sokona, Y.; Seyboth, K.; Matschoss, P.; Kadner, S.; Zwickel, T.; Eickemeier, P.; Hansen, G.; Schlomer, S.; et al. Renewable Energy Sources and Climate Change Mitigation; Special Report of the IPCC; IPCC, 2011; Available online: http://www.ipcc.ch/report/srren/ (accessed on 10 August 2016).
  75. Doornbosch, R.; Steenblik, R. Biofuels: Is the Cure Worse the Curse? SG/SD/RT(2007)3/REV1; OECD, Round Table on Sustainable Development: Paris, France, 2007. [Google Scholar]
  76. Fischer, G.; van Velthuizen, H.; Nachtergaele, F. Global Agro-Ecological Zones Assessment; Report RP 06 003; IIASA: Vienna, Austria, 2006. [Google Scholar]
  77. Bransby, D.; McLaughlin, S.; Parrish, D. A Review of Carbon and Nitrogen Balances in Switchgrass Grown for Energy. Biomass Bioenergy 1998, 14, 379–384. [Google Scholar] [CrossRef]
  78. Scott, C.; Sugg, Z. Global Energy Development and Climate-Induced Water Scarcity-Physical Limits, Sectoral Constraints, and Policy Imperatives. Energies 2015, 8, 8211–8225. [Google Scholar] [CrossRef]
  79. Cowie, A.; Soimakallio, S.; Brandao, M. Environmental Risks and Opportunities of Biofuels. In The Law and Policy of Biofuels; Bouthillier, Y.L., Cowie, A., Martin, P., McLeod-Kilmurray, H., Eds.; Edward Elgar: Cheltenham, UK, 2016. [Google Scholar]
  80. De Baan, L.D.; Alkemade, R.; Koellner, T. Land Use Impacts on Biodiversity in LCA: A Global Approach. Int. J. Life Cycle Assess. 2013, 18, 1216–1230. [Google Scholar]
  81. De Baan, L.; Mutel, C.; Curran, M.; Hellweg, S.; Koellner, T. Land Use in Lifecycle Assessment. Environ. Sci. Technol. 2013, 47, 9281–9290. [Google Scholar] [CrossRef] [PubMed]
  82. Constanza, R.; d’Arge, R.; de Groot, R.; Farber, S.; Grasso, M.; Hannon, B.; Limburg, K.; Naeem, S.; O’Neill, R.V.; Paruelo, J.; et al. The Value of the World’s Ecosystem Services and Natural Capital. Nature 1997, 387, 253–260. [Google Scholar] [CrossRef]
  83. Constanza, R.; de Groot, R.; Sutton, P.; van der Ploeg, S.; Anderson, S.; Kubizewski, I.; Farber, S.; Turner, R. Changes in the Value of Global Ecosystems Services. Glob. Environ. Chang. 2014, 26, 152–158. [Google Scholar] [CrossRef]
  84. Morgera, E.; Kulovesi, K.; Gobena, A. Case Studies on Bioenergy Policy and Law: Options for Sustainability; FAO Legal Office: Rome, Italy, 2009. [Google Scholar]
  85. USEPA. A Comprehensive Analysis of Biodiesel Impacts on Exhaust Emissions; US Environmental Protection Agency (EPA): Washington, DC, USA, 2002.
  86. Grosjean, D.; Miguel, A.H.; Tavares, T.M. Urban Air Pollution in Brazil: Acetaldehyde and other Carbonyls. Atmos. Environ. Part B Urban Atmos. 1990, 24, 101–106. [Google Scholar]
  87. Liska, A.J.; Yang, H.; Milner, M.; Goddard, S.; Blanco-Canqui, H.; Pelton, M.P.; Fang, X.X.; Zhu, H.; Suyker, A.E. Biofuels from Crop Residue can Reduce Soil Carbon and Increase CO2 emissions. Nat. Clim. Chang. 2014, 4, 398–401. [Google Scholar] [CrossRef]
  88. Groom, M.; Gray, E.; Townsend, E. Biofuels and Biodiversity. Conserv. Biol. 2008, 22, 602–609. [Google Scholar] [CrossRef] [PubMed]
  89. Carriquiry, M.; Du, X.; Tomilsina, G. Second-Generation Biofuels: Economics and Policies, Policy Research Working Papers; The World Bank Development Research Group, Environment and Energy Team: Washington, DC, USA, 2010; Volume 5406, p. 57. [Google Scholar]
  90. Wang, M.; Jan, J.; Dunn, J.; Cai, H.; Elgowainy, A. Well-to-wheels Energy Use and Greenhouse Gas Emissions of Ethanol from Corn, Sugarcane, and Cellulosic Biomass for U.S. Use. Environ. Res. Lett. 2012, 7, 4. [Google Scholar]
  91. Spang, E.S.; Moomaw, W.R.; Gallagher, K.S.; Kirshen, P.H.; Marks, D.H. The Water Consumption of Energy Production: An International Comparison. Environ. Res. Lett. 2014, 9, 10. [Google Scholar] [CrossRef]
  92. Pradhan, A.; Shrestha, D.; Van Gerpen, J.; McAloon, A.; Yee, W.; Haas, M.; Duffield, J. Reassessment of Life Cycle Greenhouse Gas Emissions for Soybean Biodiesel. Trans. ASABE 2012, 55, 2257–2264. [Google Scholar] [CrossRef]
  93. Fore, S.; Porter, P.; Lazerus, W. Net Energy Balance of Small-Scale On-Farm Biodiesel Production from Canola and Soybean. Biomass Bioenergy 2011, 35, 2234–2244. [Google Scholar] [CrossRef]
  94. Buratti, C.; Moretti, E.; Fantozzi, F. Assessing the GHG Emissions of Rapeseed and Soybean Biodiesel in Compliance to the EU Renewable Energy Directive Methodology for Biofuels. In Proceedings of the 18th European Biomass Conference and Exhibition, Lyon, France, 3–7 May 2010. [Google Scholar]
  95. Harto, C.; Meyers, R.; Williams, E. Life Cycle Water Use of Low Carbon Transport Fuels. Energy Policy 2010, 38, 4933–4944. [Google Scholar] [CrossRef]
  96. U.S. Department of Agriculture (USDA). Brazil Biofuels Annual 2016; GAIN Report Number BR 16009; Brazilian Law 13.263/2016; USDA: Washington, DC, USA, 2016.
  97. Langevin, M.S. The Brazilian Biodiesel Program. Available online: http://www.ensec.org/index.php?option=com_content&view=article&id=273:brazilian-biodiesel-program&catid=112:energysecuritycontent&Itemid=367 (accessed on 14 December 2010).
  98. U.S. Department of Agriculture (USDA). China Biofuels Annual Report; GAIN Report CH 15030; USDA: Washington, DC, USA, 2015.
  99. Lane, J. Biofuels Mandates around the World: 2016. Biofuels Digest. Available online: http://www.biofuelsdigest.com/bdigest/2016/01/03/biofuels-mandates-around-the-world-2016/ (accessed on 3 January 2016).
  100. European Union, Climate and Energy Package. Available online: http://ec.europa.eu/clima/policies/strategies/2020/index_en.htm (accessed on 15 October 2016).
  101. U.S. Department of Agriculture (USDA). India Biofuels Annual 2016; GAIN Report Number IN 6088; USDA: Washington, DC, USA, 2016.
  102. PTI, India Will Soon be Zero Petroleum Import Country. India Times. 6 September 2016. Available online: http://economictimes.indiatimes.com/industry/energy/oil-gas/india-will-soon-be-zero-petroleum-import-country-nitin-gadkari/articleshow/54031397.cms (accessed on 6 September 2016).
  103. Bramcourt, K. The Renewable Fuel Standard (RFS): Waiver Authority and Modification of Volumes; Congressional Research Service: Washington, DC, USA, 2016. [Google Scholar]
  104. Bramcourt, K. The Renewable Fuel Standard (RFS). In Brief; Congressional Research Service: Washington, DC, USA, 2016; pp. 7–5700. [Google Scholar]
  105. 42 USC 7547 (o)(5). Available online: https://casetext.com/statute/42-usc-7547-nonroad-engines-and-vehicles (accessed on 10 December 2016).
  106. U.S. Public Law 109-58. Available online: https://www.gpo.gov/fdsys/pkg/PLAW-109publ58/content-detail.html (accessed on 10 December 2016).
  107. U.S. Public Law 110-140. Available online: https://www.gpo.gov/fdsys/pkg/PLAW-110publ140/content-detail.html (accessed on 10 December 2016).
  108. U.S. Public Law 114-113. Available online: https://www.gpo.gov/fdsys/pkg/PLAW-114publ113/html/PLAW-114publ113.htm (accessed on 10 December 2016).
  109. 26 U.S. Code 6426. Available online: https://www.gpo.gov/fdsys/granule/USCODE-2010-title26/USCODE-2010-title26-subtitleF-chap65-subchapB-sec6426 (accessed on 10 December 2016).
  110. U.S. Public Law 114-113 and 26 U.S. Code 40A. Available online: https://www.law.cornell.edu/uscode/text/26/40A (accessed on 10 December 2016).
  111. U.S. Public Law. 113–79. Available online: https://www.gpo.gov/fdsys/pkg/PLAW-113publ79/html/PLAW-113publ79.htm (accessed on 10 December 2016).
  112. U.S. Public Law 112–240. Available online: https://www.gpo.gov/fdsys/pkg/PLAW-112publ240/html/PLAW-112publ240.htm (accessed on 10 December 2016).
  113. 7 U.S. Code 8105. Available online: https://www.law.cornell.edu/uscode/text/7/8105 (accessed on 10 December 2016).
  114. International Institute for Sustainable Development (IISD). The U.S. Close to the Controversial Splash and Dash Biofuels Subsidy Loophole. 2016. Available online: https://www.iisd.org/gsi/news/united-states-closes-controversial-splash-and-dash-biofuels-subsidy-loophole (accessed on 10 November 2008).
  115. EU. Anti-Dumping Biodiesel. 2016. Available online: http://trade.ec.europa.eu/tdi/case_history.cfm?id=1893&init=1893 (accessed on 31 December 2016).
  116. EU. DS473: European Union—Anti-Dumping Measures on Biodiesel from Argentina. 2016. Available online: https://www.wto.org/english/tratop_e/dispu_e/cases_e/ds473_e.htm (accessed on 31 December 2016).
  117. EU. European Union—Anti-Dumping Measures on Biodiesel from Indonesia. 2015. Available online: https://www.wto.org/english/tratop_e/dispu_e/cases_e/ds480_e.htm (accessed on 31 December 2016).
  118. EU. EU No 1194/2013 of 19 November 2013; EU Court Annuls Anti-Dumping Duties Slapped on Biodiesel Exports. Buenos Aires Herald. Available online: http://www.buenosairesherald.com/article/221645/eu-court-annuls-antidumping-duties-slapped-on-biodiesel-exports (accessed on 16 September 2016).
  119. California Environmental Protection Agency. Low Carbon Fuel Standard; 2016. Available online: https://www.arb.ca.gov/fuels/lcfs/lcfs.htm (accessed on 26 November 2016).
  120. Energy Information Administration (EIA). Biofuels Issues and Trends; EIA: Washington, DC, USA, 2012. [Google Scholar]
  121. UN Environment Programme and Bloomberg New Energy Finance (UNEP-BNEF). Global Trends in Sustainable Energy Investments 2016; Frankfurt School-UNEP Centre/BNEF: Frankfurt, Germany, 2016. [Google Scholar]
  122. UN Environment Programme and Bloomberg New Energy Finance (UNEP-BNEF). Global Trends in Sustainable Energy Investments 2009; Frankfurt School-UNEP Centre/BNEF: Frankfurt, Germany, 2009. [Google Scholar]
  123. Hochman, G. Biofuels at a Crossroads. Choices 2014, 29, 1–5. [Google Scholar]
  124. Reuters, United Airlines buy $30 Million Stake Fulcrum Bioenergy. 30 June 2016. Available online: http://www.reuters.com/article/us-fulcrum-ual-idUSKCN0PA1IW20150630 (accessed on 30 June 2016).
  125. Business Wire, JetBlue Announces One of the Largest Renewable Jet Fuel Purchase Agreements in Aviation History, Business Wire. Available online: http://www.businesswire.com/news/home/20160919006273/en/JetBlue-Announces-Largest-Renewable-Jet-Fuel-Purchase (accessed on 19 September 2016).
  126. Dupont. Available online: http://www.dupont.com/ (accessed on 15 October 2016).
  127. International Renewable Energy Agency (IRENA). Project Inventory, Advanced Liquid Biofuels; IRENA: Abu Dhabi, UAE, 2016. [Google Scholar]
  128. International Energy Agency (IEA). Medium Term Renewable Energy Market Report 2016; IEA/OECD: Paris, France, 2016. [Google Scholar]
  129. International Energy Agency (IEA). World Energy Outlook 2015; IEA/OECD: Paris, France, 2015. [Google Scholar]
  130. Uduman, N.; Qi, Y.; Danquah, M.; Forde, G.; Hoadley, A. Dewatering of Microalgal cultures: A Major Bottleneck to Algae-based Fuels. J. Renew. Sustain. Energy 2010, 2, 012701. [Google Scholar] [CrossRef]
  131. International Energy Agency (IEA). World Energy Outlook 2016; IEA/OECD: Paris, France, 2013. [Google Scholar]
  132. Financier Worldwide, Abengoa Fails to Renew and Files for Bankruptcy. Financier Worldwide Magazine. February 2016. Available online: https://www.financierworldwide.com/abengoa-fails-to-renew-and-files-for-bankruptcy/#.WIO8gPkrLIU (accessed on 1 February 2016).
  133. Corrigan, T. U.S. Objects to Abengoa Bankruptcy-Exit Plan. Available online: http://www.wsj.com/articles/u-s-objects-to-abengoa-bankruptcy-exit-plan-1480630625 (accessed on 1 December 2016).
Figure 1. Global biofuel production by fuel type (thousand barrels per day). Data adapted from [9].
Agriculture 07 00032 g001
Figure 2. Global biofuel production by region (thousand barrels per day). Data adapted from [8].
Agriculture 07 00032 g002
Figure 3. Shares of global ethanol (a) and biodiesel (b) production by feedstock type for 2013–2015. The y-axis represents the % share of each feedstock used (Source: Data adapted from [16]. Note: Sugar crops include ethanol produced from sugar cane as well as sugar beets in the European Union).
Agriculture 07 00032 g003
Figure 4. Food price index and key constituents. Data adapted from FAO [47]. The Food Price Index reflects the average of five commodity group price indices (cereals, vegetable oil, sugar, meat, and dairy) weighted per the average export fractions of each of the groups for 2002–2004.
Agriculture 07 00032 g004
Figure 5. Advanced biofuels by fuel products—operational, 225.43 million gallons/year. Data adapted from [127].
Agriculture 07 00032 g005
Figure 6. Advanced biofuel capacity per year—operational, 225.43 million gallons/year. Data adapted from [127].
Agriculture 07 00032 g006
Table 1. Renewable fuel technology options.
Generation 1 EthanolGeneration 2/Cellulosic EthanolBiodiesel (FAME/RME)Drop-in Replacement Fuel: Renewable DieselDrop-in Replacement FuelBioButanolBiogas
FeedstockSugar or starch-based biomass (Corn, sugarcane, sugar beets, etc.)Cellulosic material (non-edible corn and sugarcane, etc.)Vegetable oils, animal fat (soybean, Jatropha, palm)Flexible mix of raw materials (veg, oils, waste fats)Cellulosic materials (non-edible corn and sugarcane, etc.)Cellulosic materials (straw, leaves, grass, etc.)Waste in landfills, Wastewater, Animal waste, etc.
Technology ProcessFermentation, distillation; for starch-based feedstock (corn or cassava) hydrolysis of starchHydrolysis then FermentationEsterification/Trans-EsterificationHydrotreating , gasification, pyrolysis, and other thermochemical and biochemical pathwaysFermentation/catalytic conversion, etc.FermentationNatural Action of microorganism
End productAnhydrous ethanol blended as an additive to gasoline; Hydrous ethanol (stand-alone fuel)Anhydrous ethanol blended as an additive to gasoline; Hydrous ethanol (stand-alone fuel)Ester-based conventional biodieselBio-based hydro-carbon (renewable diesel, jet fuel, bionaptha, biopropane)Bio-based hydrocarbonBioButanol additive to gasoline (mostly low mixtures such as 10%–15% butanol)Methane, up to 40% CO2, other impurities: H2S, NH3, siloxanes
Chemical compositionC2H5OHC2H5OHO‖R’-C-O-R (R, R’ = alkyl groups)CnH2n+2C6H14-C12H26C4H9OHCH4
Table 2. Feedstock and attributes.
Feedstock (Generation Type)* Growth Time [47]* Growth Temperature [47]* Water Requirements [47]* Major Growers [48]
Algae (Second)Dependent on type of algae, temperature and light conditions (authors’ assessments)16–27 °CVaries with land and sea-based production; Water intensity is generally high; temperature and pH dependent; Light intensity 1000–10,000Emergent
Corn (First)110–140 days18–20 °C500–800 mmBrazil, USA, and China
Jatropha (Second)90 days [49]16–21 °C [41]254–1016 mm [41]Myanmar, India, China, and Indonesia [50]
Lignocellulose (Second)Varies based on source. Grasses: 3–4 months, waste residue such as corn stover takes as long as the crop from which it is derived [31].Varies based on source.Usually need very little water [31]Emergent
Palm (First)5–6 months [51]27–28 °C [44]Minimum of 1800 mm [44]Nigeria, Malaysia, and Indonesia
Rapeseed or Canola (First)85–110 days [52]Soil temperatures of 3–12 °C [52]300–600 mm [53]China, India, and Canada
Rye (Second)Not available1–4 °C but below 29 °C for germination [54]Not availableGermany, Poland, and Russia
Sorghum (Second)110–140 days25–35 °C450–650 mmNigeria, India, and Sudan
Soybeans (First)100–130 days18–35 °C450–700 mmArgentina, Brazil, and USA
Sugar beets (First)140–200 days20–25 °C550–750 mmFrance, USA, and Russia
Sugarcane (First)15–16 months32–38 °C1500–2500 mmBrazil, China, and India
Wheat (First)100–130 days15–20 °C450–650 mmRussia, China, and India
* The reference within the header applies, unless otherwise noted.
Table 3. Comparison of fuel sustainability characteristics.
BiofuelGHG Emissions CO2 e/MJWater Intensity L/L ProductEnergy Intensity MJ/LNet Energy Balance MJ/L Product
Gasoline (Baseline)94 g *2.8–4.6 *35.4 [90]28.3 *
Corn Ethanol76 g: major contributors 31 g (ethanol production) and 17 g (fertilizer) [90]175.4 [91]21.3 [90]10.1 [90]
Sugarcane ethanol45 g (includes 16 g from land use change) [90]526 [91]21.3 [90]16.4 [90]
Soybean biodiesel59.19 g [92]369.2 [91]32.7 [92]
Rapeseed/canola-based biofuel (Biodiesel)59.19 g [92]645.5 [91]32.7 [92]21.6 [93]
Cellulosic ethanol43 g [94]6.5 (Switchgrass) 387 (drought conditions) [95]21.3 [90]21 (Switchgrass) 20.4 (corn stover) 21.4 (miscanthus) [90]
Algae biodiesel 44 (enclosed production) 216 (open production) [95]32.7 [92]
Note: (1) Energy intensity gauges the amount of energy released from combustion of a fuel, in this case, measured in MJ released per liter of biofuel; (2) Water intensity is the amount of water required to produce a fuel, here measured in liters of water needed per liter of fuel produced—this includes the water needed in the production of the biofuels and the water needed to grow the feedstock; (3) Energy balance is the net energy in the product after deducting the total required energy to produce the fuel. * Calculated.

