Article

The Behavioural Responses of Beef Cattle (Bos taurus) to Declining Pasture Availability and the Use of GNSS Technology to Determine Grazing Preference

1
Sydney Institute of Agriculture, School of Life and Environmental Sciences, The University of Sydney, Centre for Carbon, Water and Food, 380 Werombi Road, Camden, NSW 2570, Australia
2
Faculty of Science, School of Life and Environmental Sciences, The University of Sydney, 425 Werombi Road, Camden, NSW 2570, Australia
*
Author to whom correspondence should be addressed.
Agriculture 2017, 7(5), 45; https://doi.org/10.3390/agriculture7050045
Submission received: 4 April 2017 / Revised: 11 May 2017 / Accepted: 16 May 2017 / Published: 19 May 2017
(This article belongs to the Special Issue Monitoring Animal Behavior Using Remote Sensing and GIS Technologies)

Abstract

:
Combining technologies for monitoring spatial behaviour of livestock with technologies that monitor pasture availability, offers the opportunity to improve the management and welfare of extensively produced beef cattle. The aims of the study were to investigate changes to beef cattle behaviour as pasture availability changed, and to determine whether Global Navigation Satellite System (GNSS) technology could determine livestock grazing preference and hence improve pasture management and paddock utilisation. Data derived from GNSS collars included distance travelled and location in the paddock. The latter enabled investigation of individual animal interactions with the underlying Normalised Difference Vegetation Index (NDVI) and pasture biomass of the paddock. As expected, there was a significant temporal decrease in NDVI during the study and an increase in distance travelled by cattle (P < 0.001; r2 = 0.88). The proportion of time budget occupied in grazing behaviour also increased (P < 0.001; r2 = 0.71). Cattle showed a partial preference for areas of higher pasture biomass/NDVI, although there was a large amount of variation over the course of the study. In conclusion, cattle behaviour changed in response to declining NDVI, highlighting how technologies that monitor these two variables may be used in the future as management tools to assist producers better manage cattle, to manipulate grazing intensity and paddock utilisation.

1. Introduction

Worldwide demand for protein is on the rise, resulting in an increased need to improve the efficiency of livestock production. A better understanding of animal behaviour and environmental interactions are required to optimise the management of livestock and the environment in which they are grazed. The majority of Australian beef is raised on extensive, rangeland, or pasture-based systems, with many of these on large scale, remote properties where livestock monitoring can be low or infrequent [1]. This highlights possible management, monitoring, and welfare problems. However, the emergence of technologies that monitor pasture availability and the autonomous tracking of livestock offer potential solutions to these emerging issues confronting the extensive beef industry.

1.1. Pasture Monitoring

Regardless of the livestock production system, pasture quantity and quality may be limiting at certain times of the year, usually due to climatic influences. To maximise the efficiency of animal production in extensive grazing systems, it is important to know the availability of ground cover and whether livestock can effectively utilise and digest the available forage. Thus, knowledge and monitoring of pasture is required [2,3]. As the majority of paddocks are heterogeneous, there are spatial differences in the quality and quantity of the pasture across the landscape [2]. The use of traditional pasture monitoring tools to measure the quality and quantity of available forage can be labour exhaustive and time intensive [4,5]. Additionally, the cost [5] and delay in obtaining results [2,6] reduces the potential benefit to producers, who could use the objective information to facilitate decision-making on rotation of paddocks or sale of livestock. Thus, pasture monitoring using such tools is infrequently undertaken. The use of more modern technologies, however, allows for the autonomous collection of real-time data that have greater potential for improving the efficient management of limited pasture resources on-farm [6,7]. An example is the CropCircle system (Holland Scientific, Lincoln, NE, USA), a remote sensing technology that uses information from the near-infrared and visible bands of the light spectrum, enabling an NDVI (Normalised Difference Vegetation Index) to be calculated. NDVI can be correlated to pasture biomass and can be autonomously applied to objectively monitor vegetation. This highlights one application of remote sensing technology to provide close to real-time information and a practical means to assist producers to monitor and manage available pasture for livestock production.

1.2. Livestock Behaviour and Tracking

A comprehensive understanding of livestock behaviour, specifically grazing and foraging behaviour, is required to best manage pasture resources and feed availability [3]. The introduction of tracking receivers in 1989 [8] and the more recent addition of commercial Global Navigation Satellite System (GNSS) collars, has dramatically improved our understanding of animal behaviour, movement and environmental interactions [9,10]. This combined with vegetation information highlights an emerging opportunity to improve pasture utilisation while meeting the nutritional needs of livestock [11].

1.3. Production Implications

There are potential production, management, animal welfare, and profitability implications when information is available about pasture production. However, in order to administer appropriate management strategies such as grazing regimes [6], pasture availability must be known [5]. Pasture availability is one of the least understood variables affecting production, efficiency, and utilisation of pasture by grazing livestock. Therefore, the aims of this study were to quantify changes of behavioural time budgets in beef cattle as pasture availability declines, and discover whether GNSS technology could be used to determine spatial behaviour of livestock and thus paddock utilisation.

2. Materials and Methods

2.1. Location and Animals

The research was approved by The University of Sydney Animal Ethics Committee (Protocol number 746) and conducted under the associated Animal Ethics Guidelines. The study was conducted over 15 days during summer (30 January to 13 February 2015) at The University of Sydney John Bruce Pye Farm, Greendale NSW, Australia (33°56′19.18″ S, 150°40′33.32″ E). During the course of the study, the average daily temperature was 22.1 °C, with a maximum of 36.4 °C, minimum of 13.5 °C and 9.2 mm of rain recorded (Figure 1). Using non-toxic livestock paint (Leader products, Craigieburn, VIC, Australia), 20 Charolais cows (4.1 ± 1.1 years; 75 days pregnant (n = 17)) were randomly assigned an identification number on Day 1. They were then weighed (Tru-test, Shepparton, VIC, Australia) in a weigh box (Leicht’s Country Industries Australia, Goombungee, QLD, Australia) and placed into an 8.9 ha ungrazed paddock for 15 days. All animals were returned to the yards for re-weighing every five days. The day before cattle entered the paddock, the average green pasture biomass was 570.6 kg DM/ha (average total green plus dead forage of 969.8 kg DM/ha; see below for method of determining biomass in the paddock).

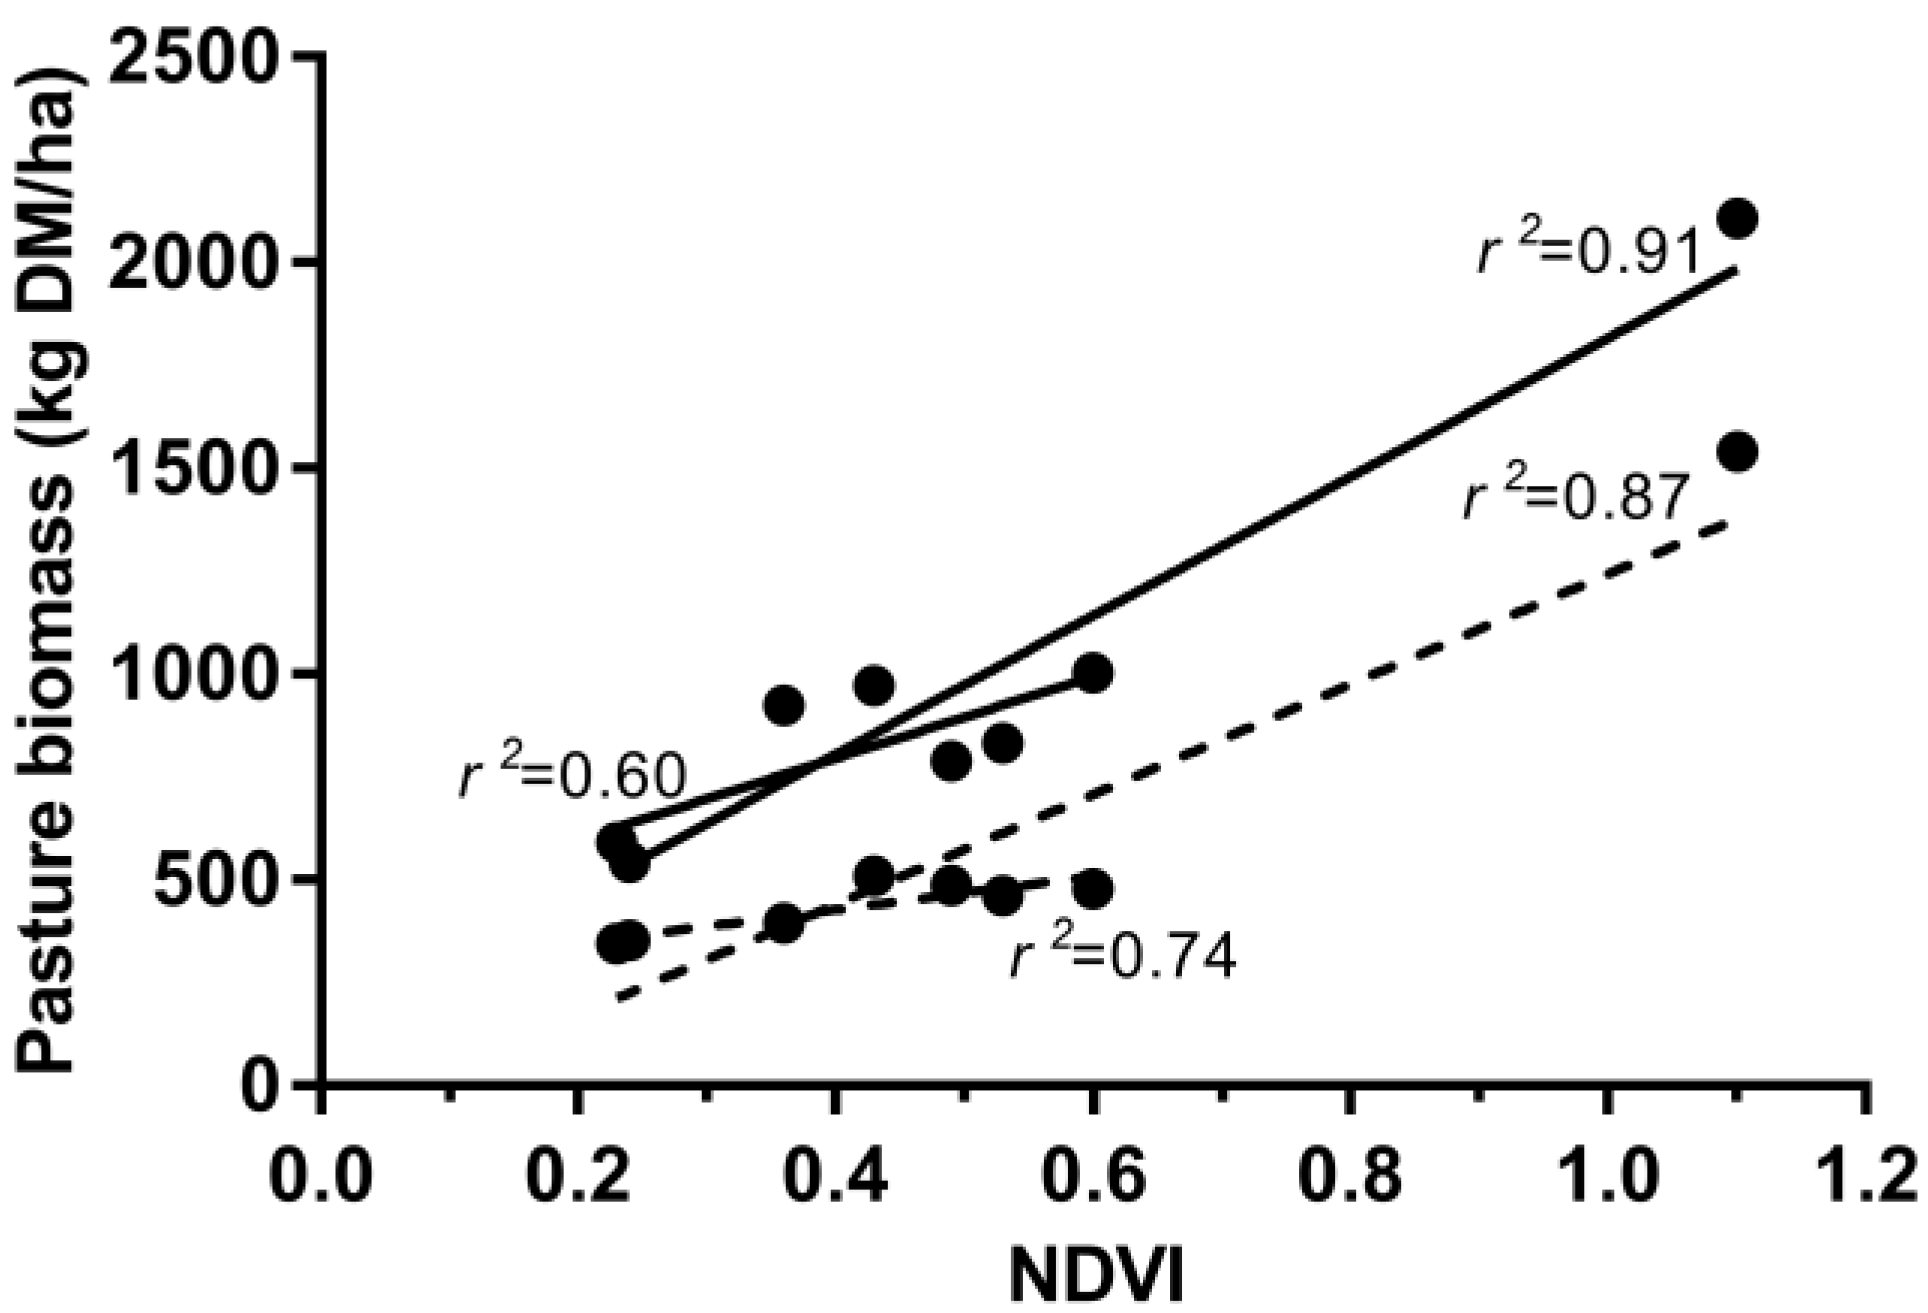
2.2. Pasture Biomass Measurement and Analyses

Normalised Difference Vegetation Index (NDVI) was estimated in the paddock prior to cattle grazing (Day 0) using a CropCircle ACS-470 system connected to a GeoSCOUT GLS-400 datalogger (Holland Scientific, Lincoln, NE, USA). Data in the red (670 nm) and near infra-red (NIR, 760 nm) band wavelengths were recorded at a rate of 20 Hz along 20 m parallel transects. This process was repeated every 5–6 days. These data were then used to calculate NDVI according to the formula: (NIR − Red)/(NIR + Red) [12]. The NDVI data were kriged using VESPER [13] and imported into ArcGIS 10.2 [14] to generate paddock rasters using a pixel size of 1 m. In addition, eight randomly selected sites were cut to ground level and pasture biomass samples were taken using a 0.21 m2 quadrat. Pasture was sorted into green and dead material. Based on the correlation between NDVI and total pasture biomass, a map of paddock biomass was determined. The predominant species present were Kangaroo grass (Themeda triandra Forsk syn australis), Paspalum (Paspalum dilatatum Poir.), Purple pigeon grass (Setaria incrassate cv. Inverell) and Setaria (Setaria sphacelata var. sericea). To determine the overall change in paddock NDVI, the mean paddock raster value was used. Temporal changes over the 15-day study period and cattle response to available pasture biomass were assessed. Regression of data by deducting the NDVI value on Day 11 (the day after the GNSS collars were removed) from Day 5 (day before GNSS collars were placed onto the animals) and dividing by the number of days (6) enabled an NDVI value to be generated on a per day basis for the GNSS collar period (refer to Section 2.4).

2.3. Behaviour Observations and Analyses

Behavioural observations were recorded for all animals using a scan sampling technique [15] at 5 min intervals during daylight hours. Refer to Table 1 in Manning et al. [16] for a list of observed behaviours and observation schedule. Peak grazing times were determined for the GNSS collar period (Days 6–10), based on the behavioural observation data when grazing was accounted for ≥50% of recorded behaviours per hour for the herd. Peak grazing times typically occurred during the morning (06:00–08:00 h Australian Eastern Daylight Savings Time) and late afternoon (18:00–20:00 h) observation periods, with the occasional midday grazing session. These peak grazing times were then used for the analysis of the GNSS collar data (see below).

2.4. GNSS Collar Deployment and Analyses

On Day 6, all cattle were brought back into the yards and half (n = 10) of the cows were fitted with an UNEtrackerII GNSS collar [17] and then returned to the same paddock. On the morning of Day 11, cattle were again brought back into the yards and the collars removed before the cows were returned to the same paddock for a further five days. No significant behavioural effects of cattle wearing a GNSS collar were found, nor was a habituation period required [16]. The GNSS collars received a positional fix every 10 s using the Navstar Global Positioning System, enabling the investigation of paddock utilisation by cattle over the five days (Days 6–10) collars were worn (GNSS collar period). The GNSS data were cleaned by removing speeds > 3.66 m/s (based on Heglund and Taylor [18]), fix interval > 10 s, and any points that fell outside the paddock boundary. Daily distance travelled was determined, and the cleaned data were imported into ArcGIS 10.2 [14]. Each GPS (Global Positioning System) point was assigned an NDVI value based upon the regressed data (refer to Section 2.2). To investigate paddock utilisation, frequency histograms were created in MS Excel. A preference index (or forage ratio) was calculated based on the proportion of the paddock divided by the number of GPS records per NDVI category [19]. A value > 1 indicates that cattle were actively selecting/had a preference for that NDVI category, whereas a value < 1 highlights areas (i.e., a NDVI category) that cattle avoided on that particular day. A value of 1 indicates that the amount of time animals are spending in a particular category area is proportional to the relative proportion that a particular NDVI category is found in the paddock.

2.5. Statistical Analyses

Restricted Maximum Likelihood (REML) modelling [20] was used in R 3.2.0 [21] to determine behavioural changes over time. A model was devised for each of the 12 individual behaviours (refer to Manning et al. [16] for studied behaviours). Fixed effects considered for inclusion were Day, Age, and Pregnancy. Terms that failed to reach significance were dropped from the model. The random effect of Cow was included for all models. Predicted means were also determined for each behaviour. For all statistical analyses, a P value of ≤0.05 was considered significant.

3. Results

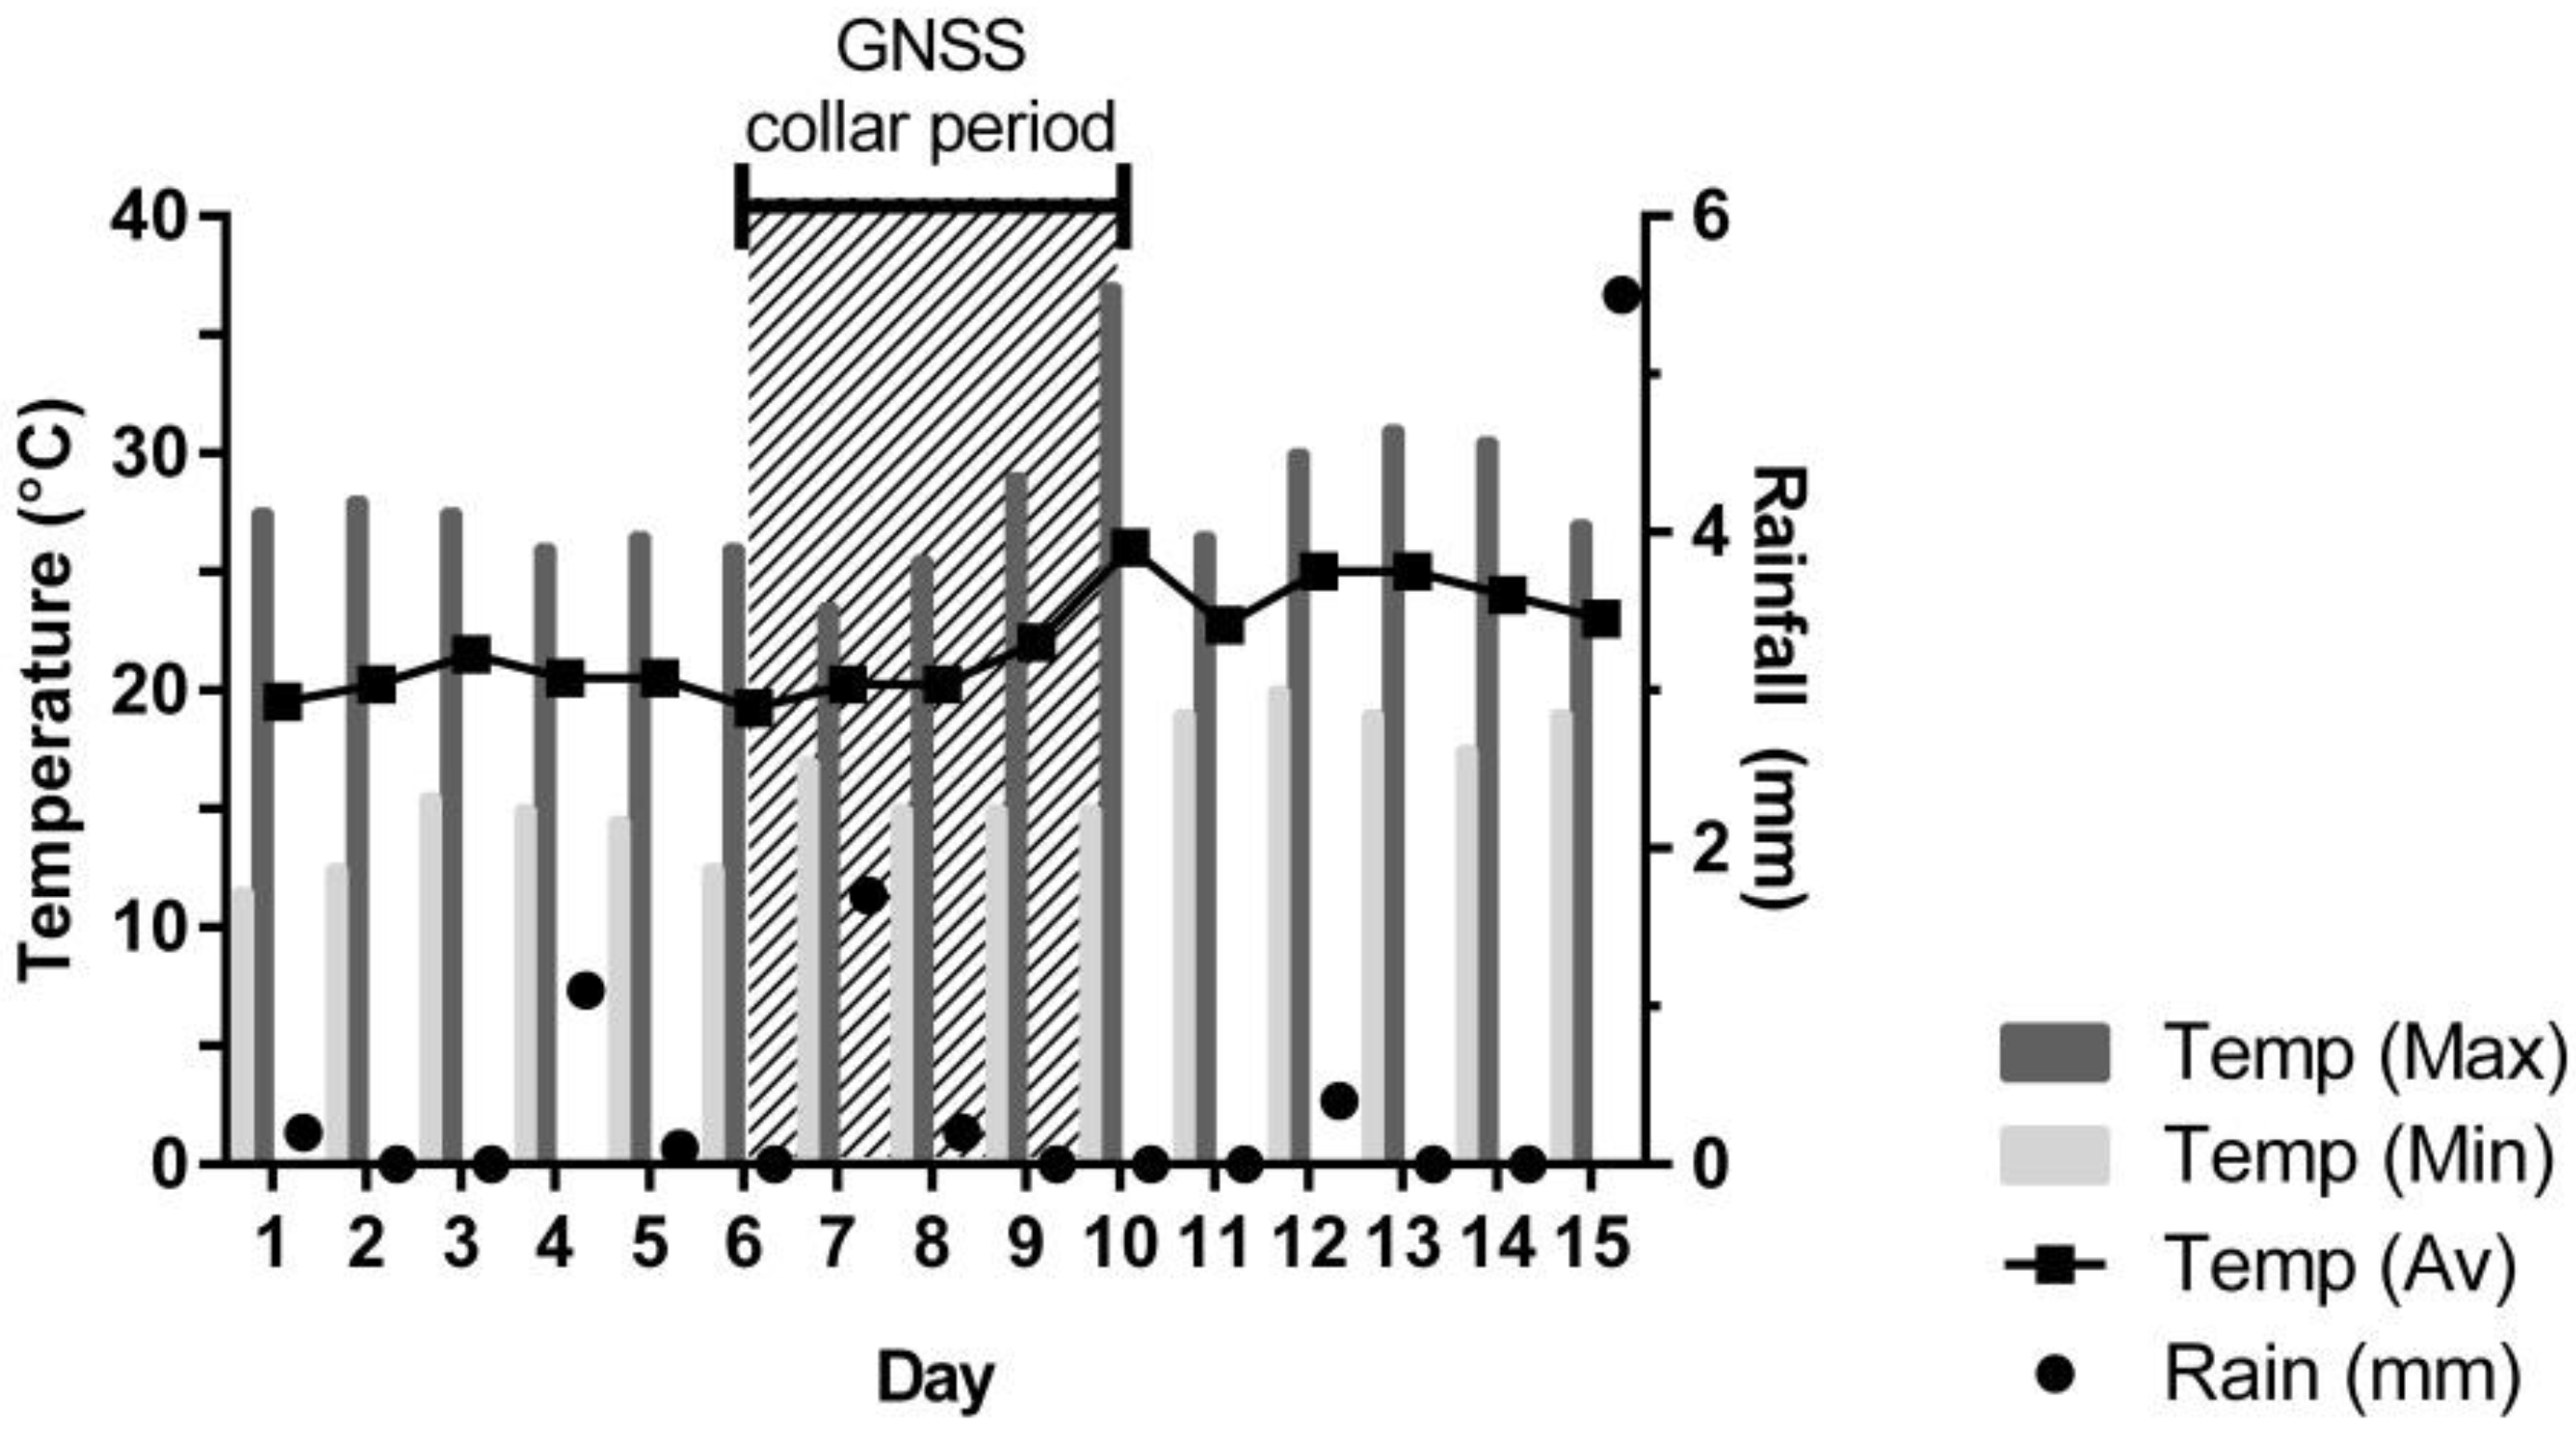
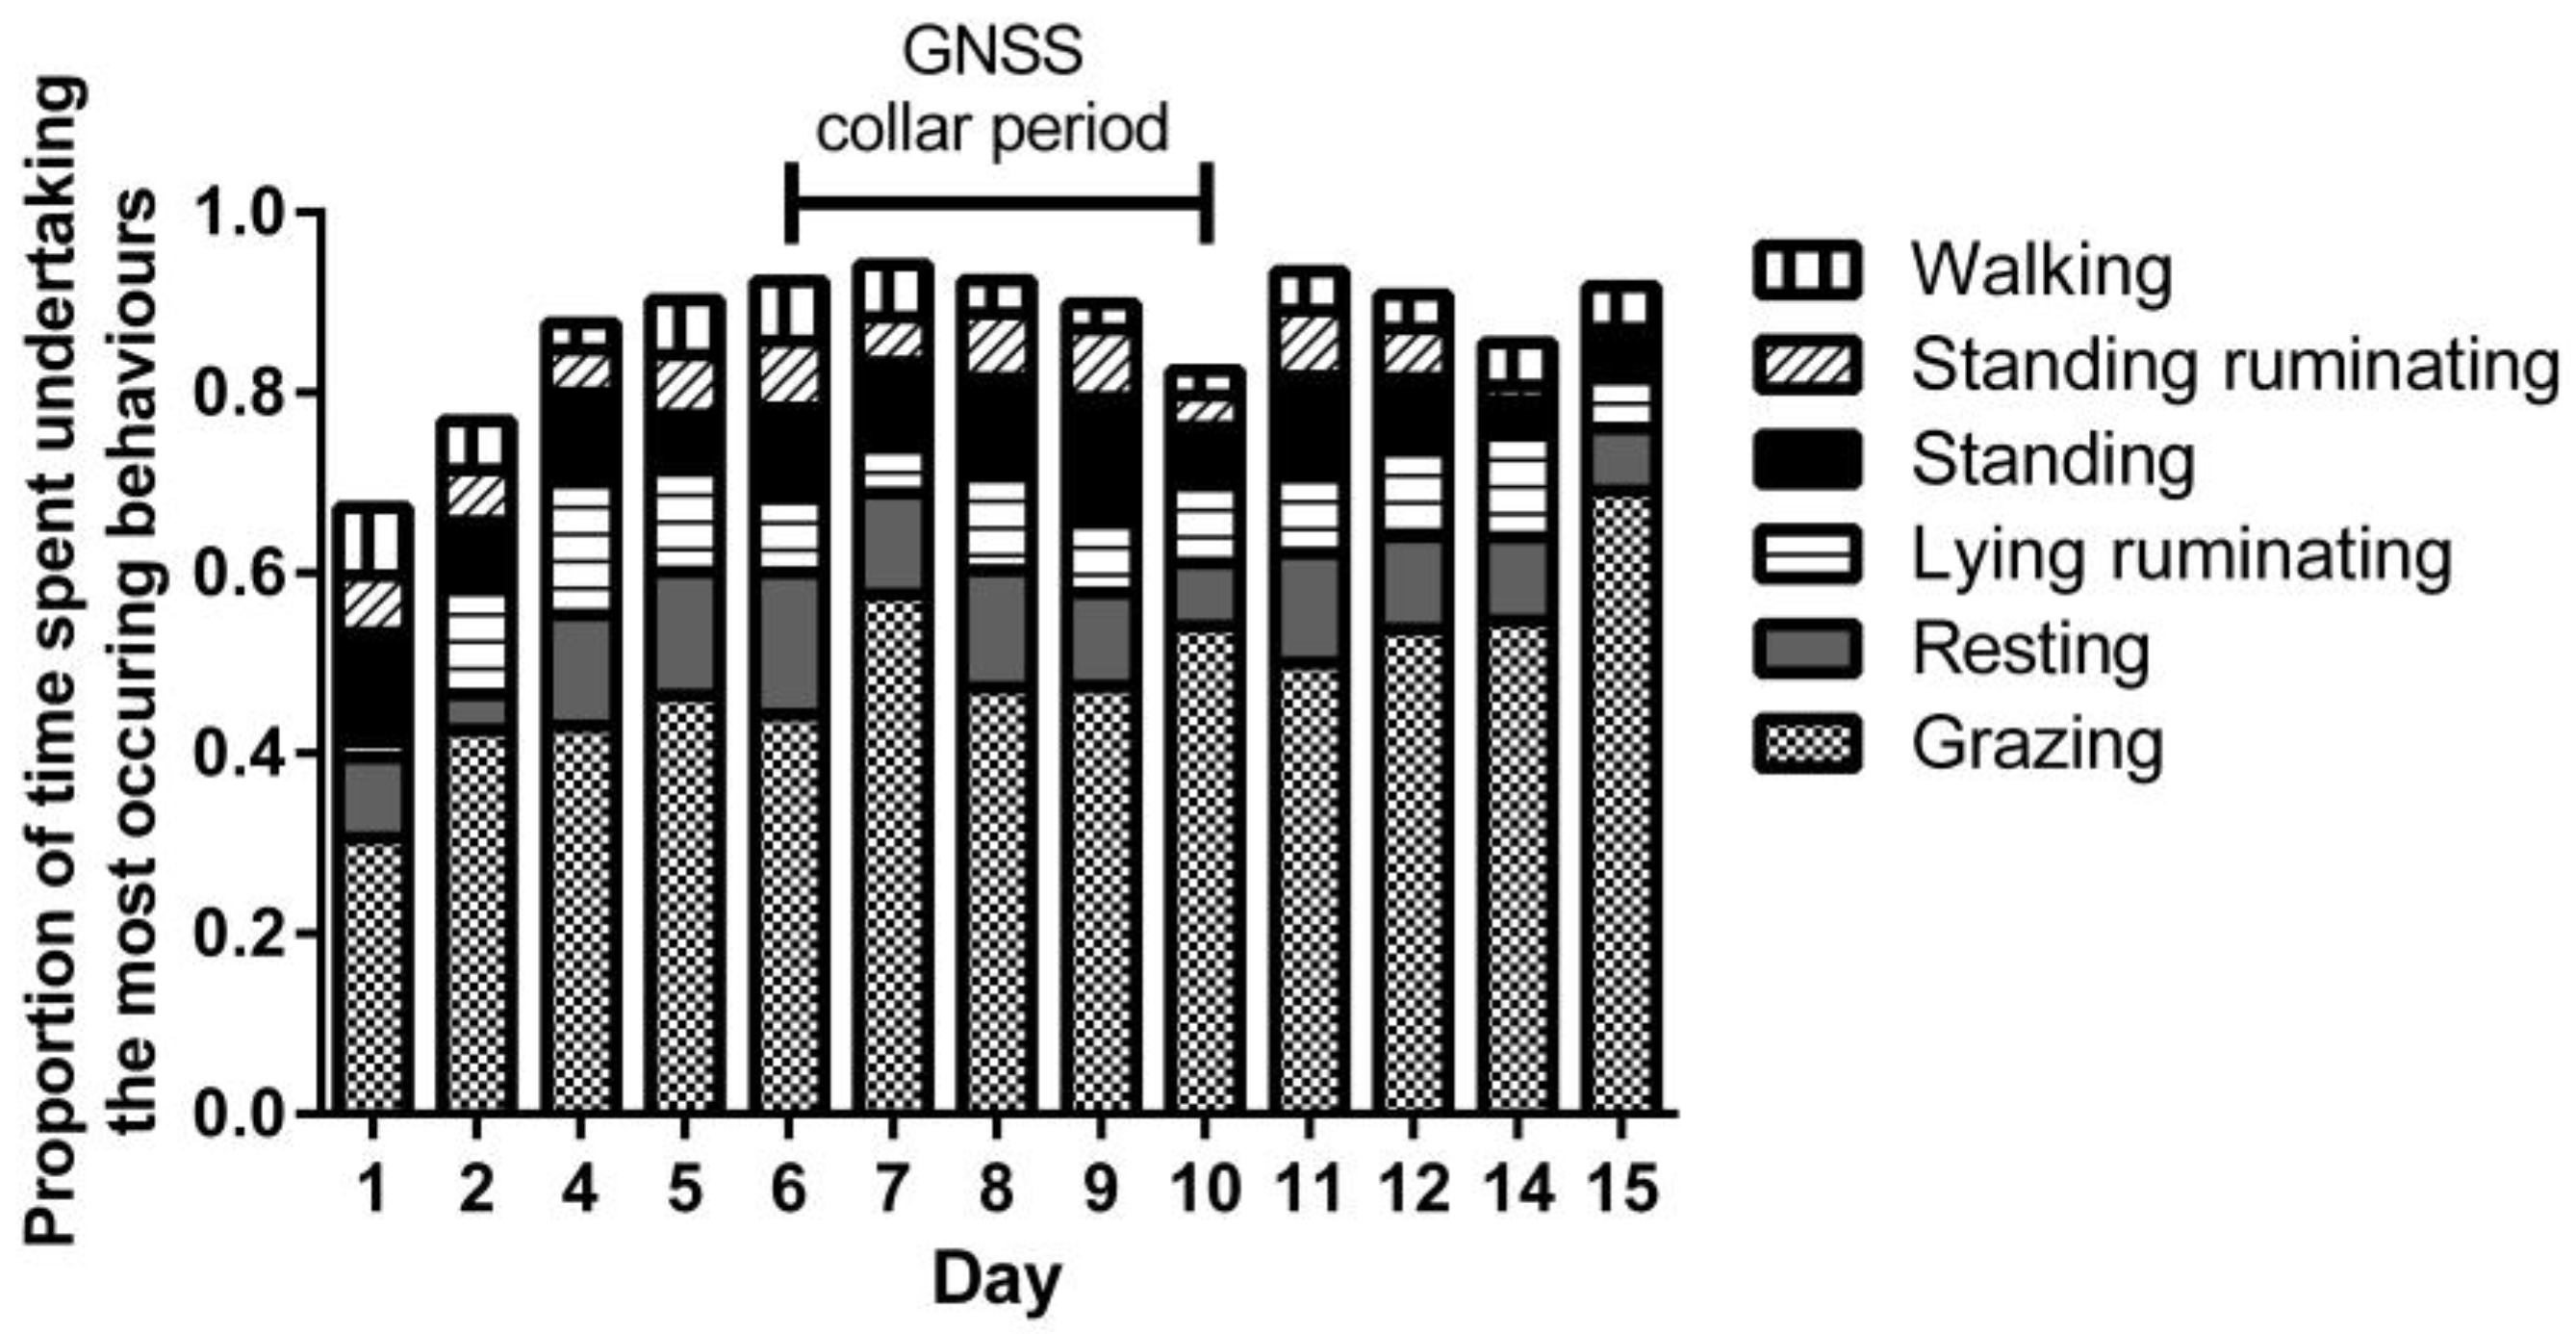
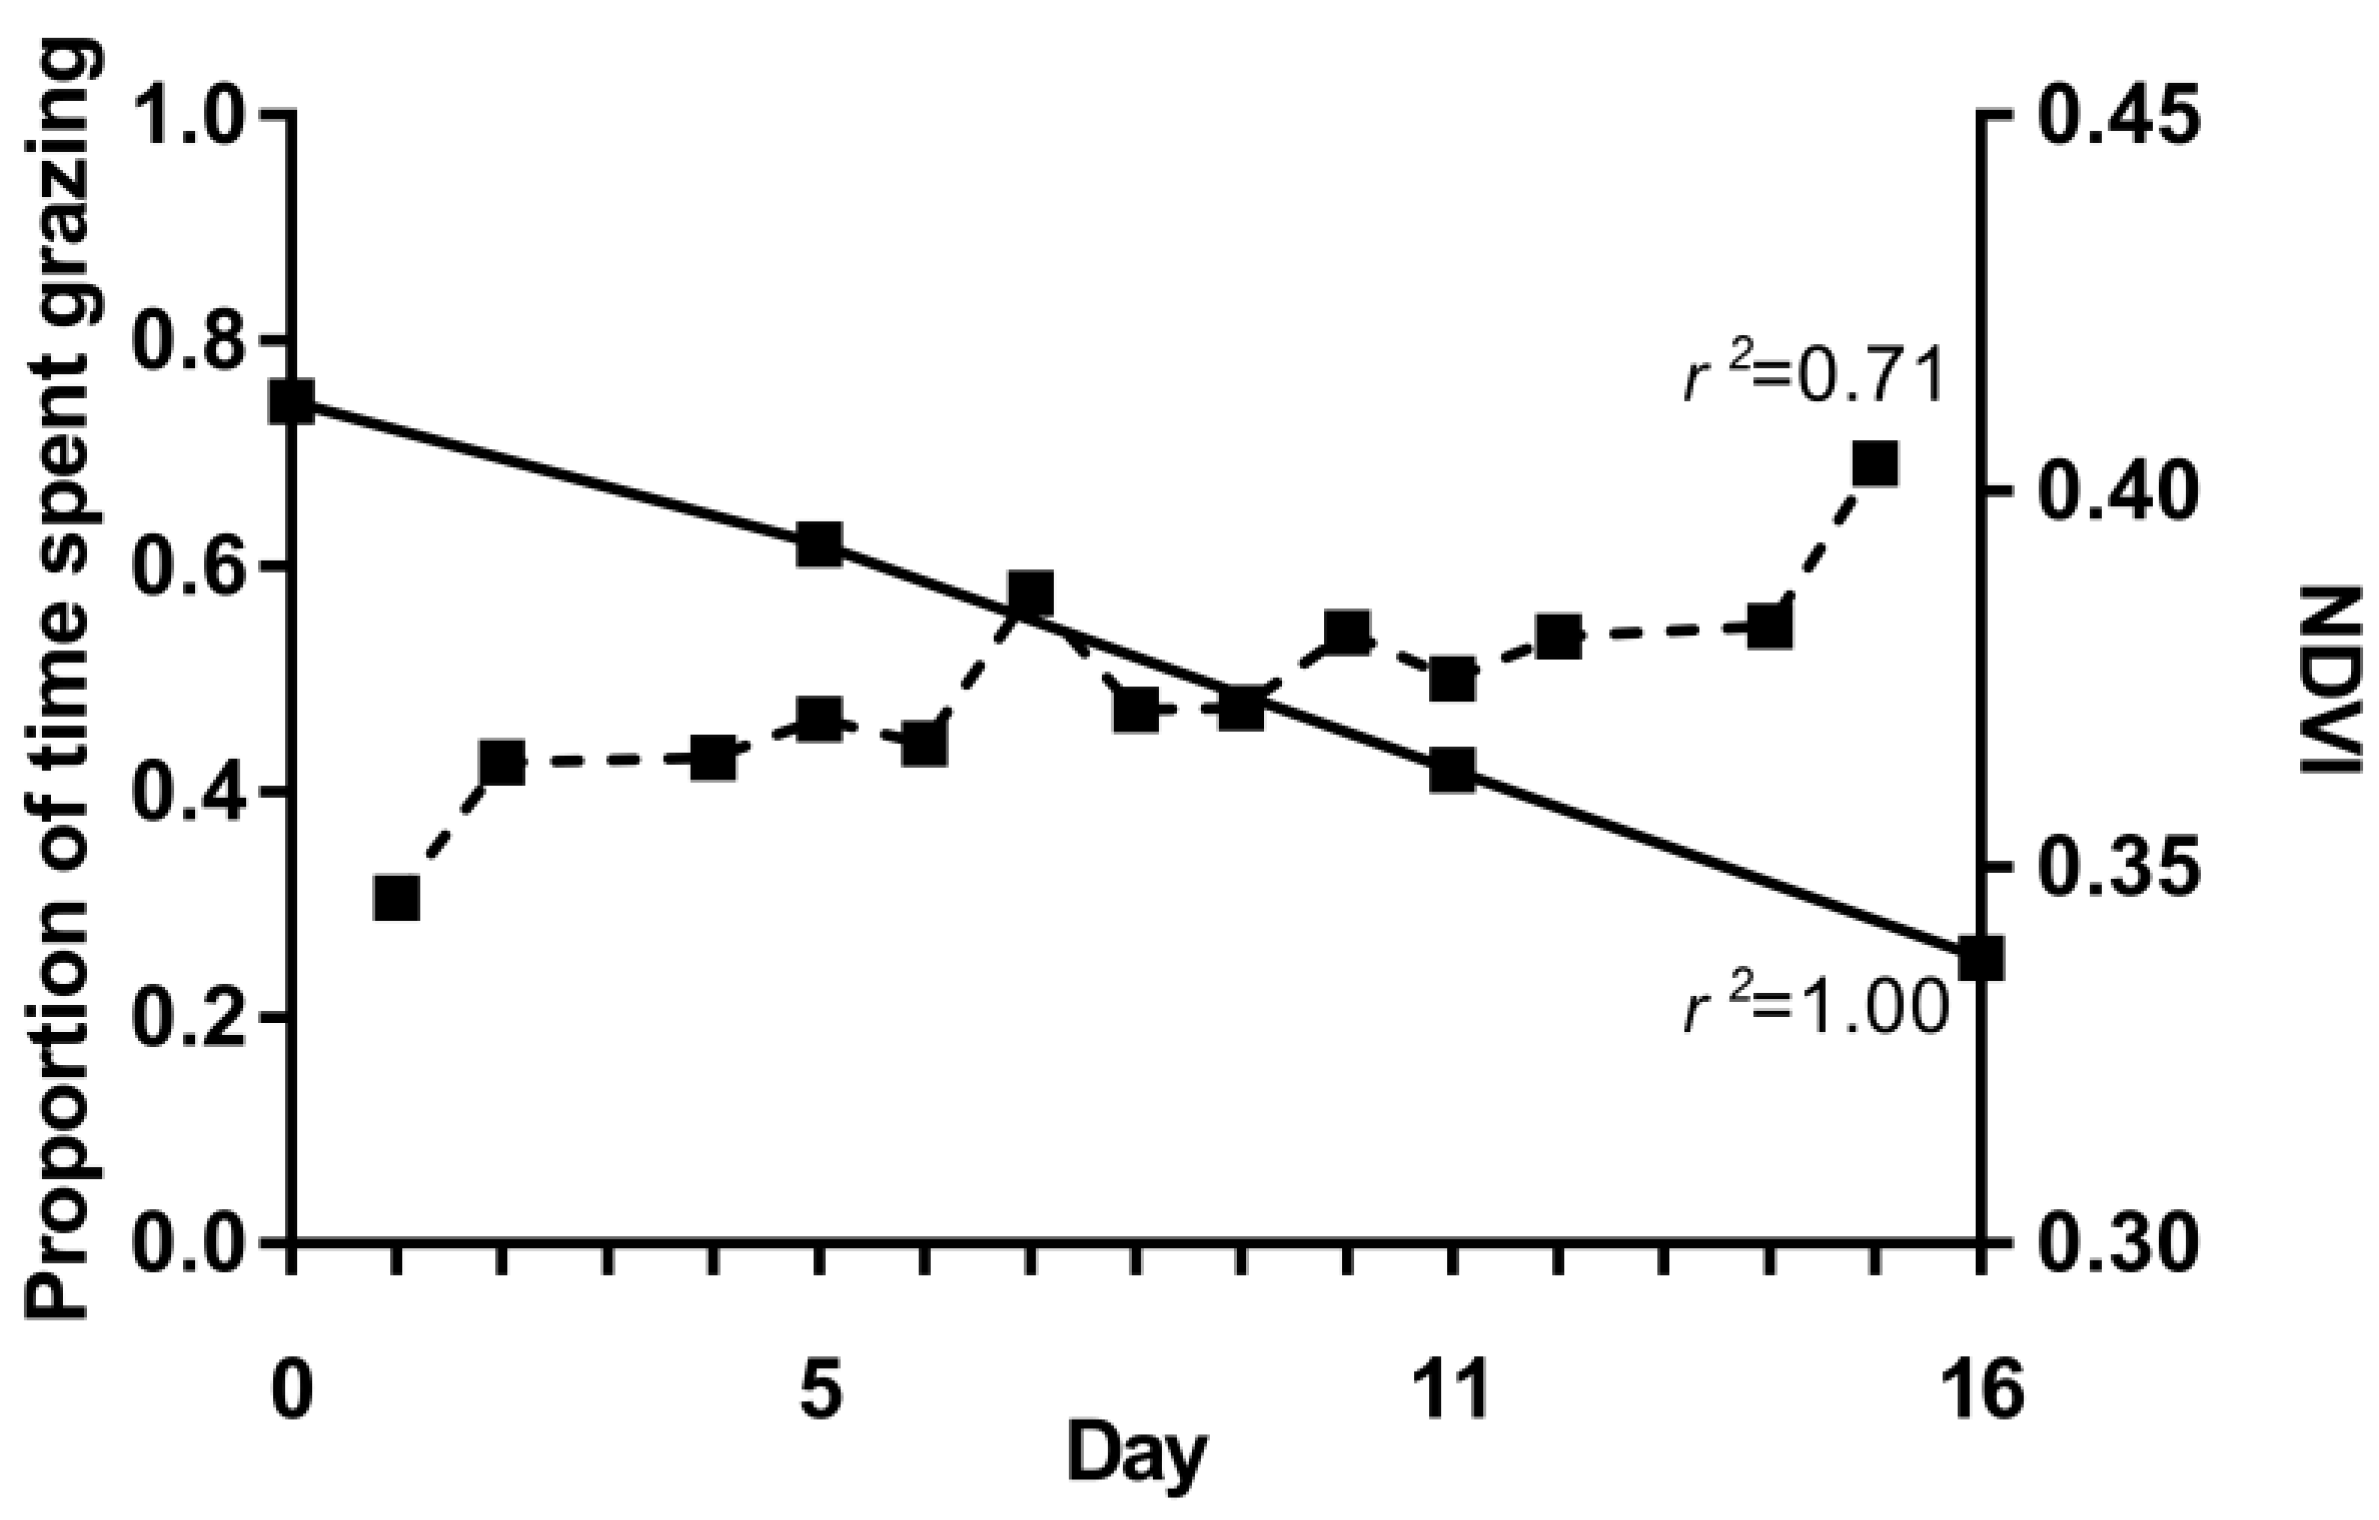
3.1. Cattle Behaviour, Production and Pasture Availability

Pasture biomass total and green were highly correlated to NDVI, (r2 0.91 and 0.87, respectively; Figure 2). Due to a high pasture biomass and NDVI reading at one sample site skewing the data, both sets of data are presented in Figure 2, with the r2 of the total (0.60) and green (0.74) biomass reducing when the high data point was excluded. Average paddock NDVI decreased linearly with time (Figure 3). All behaviours were significantly affected by pasture biomass (P ≤ 0.05). The daily proportion of time during daylight hours spent performing the six most common behaviours is presented in Figure 4. Whilst obvious differences between days can be seen, there were no clear patterns over the study for these behaviours, with the exception of grazing. The proportion of time cattle spent in grazing behaviour increased from 31 to 69% on a per day basis (r2 = 0.71; Figure 5). Additionally, as grazing behaviour increased over time, NDVI declined linearly (r2 = 1.00; Figure 5). While pasture availability declined over the study, livestock liveweight steadily and linearly increased at a daily rate of 1.9 kg/day (r2 = 0.91). The average weight of the cattle at the start and end of the study were 578 kg and 607 kg, respectively (individual data not shown).

3.2. GNSS Collar Analysis

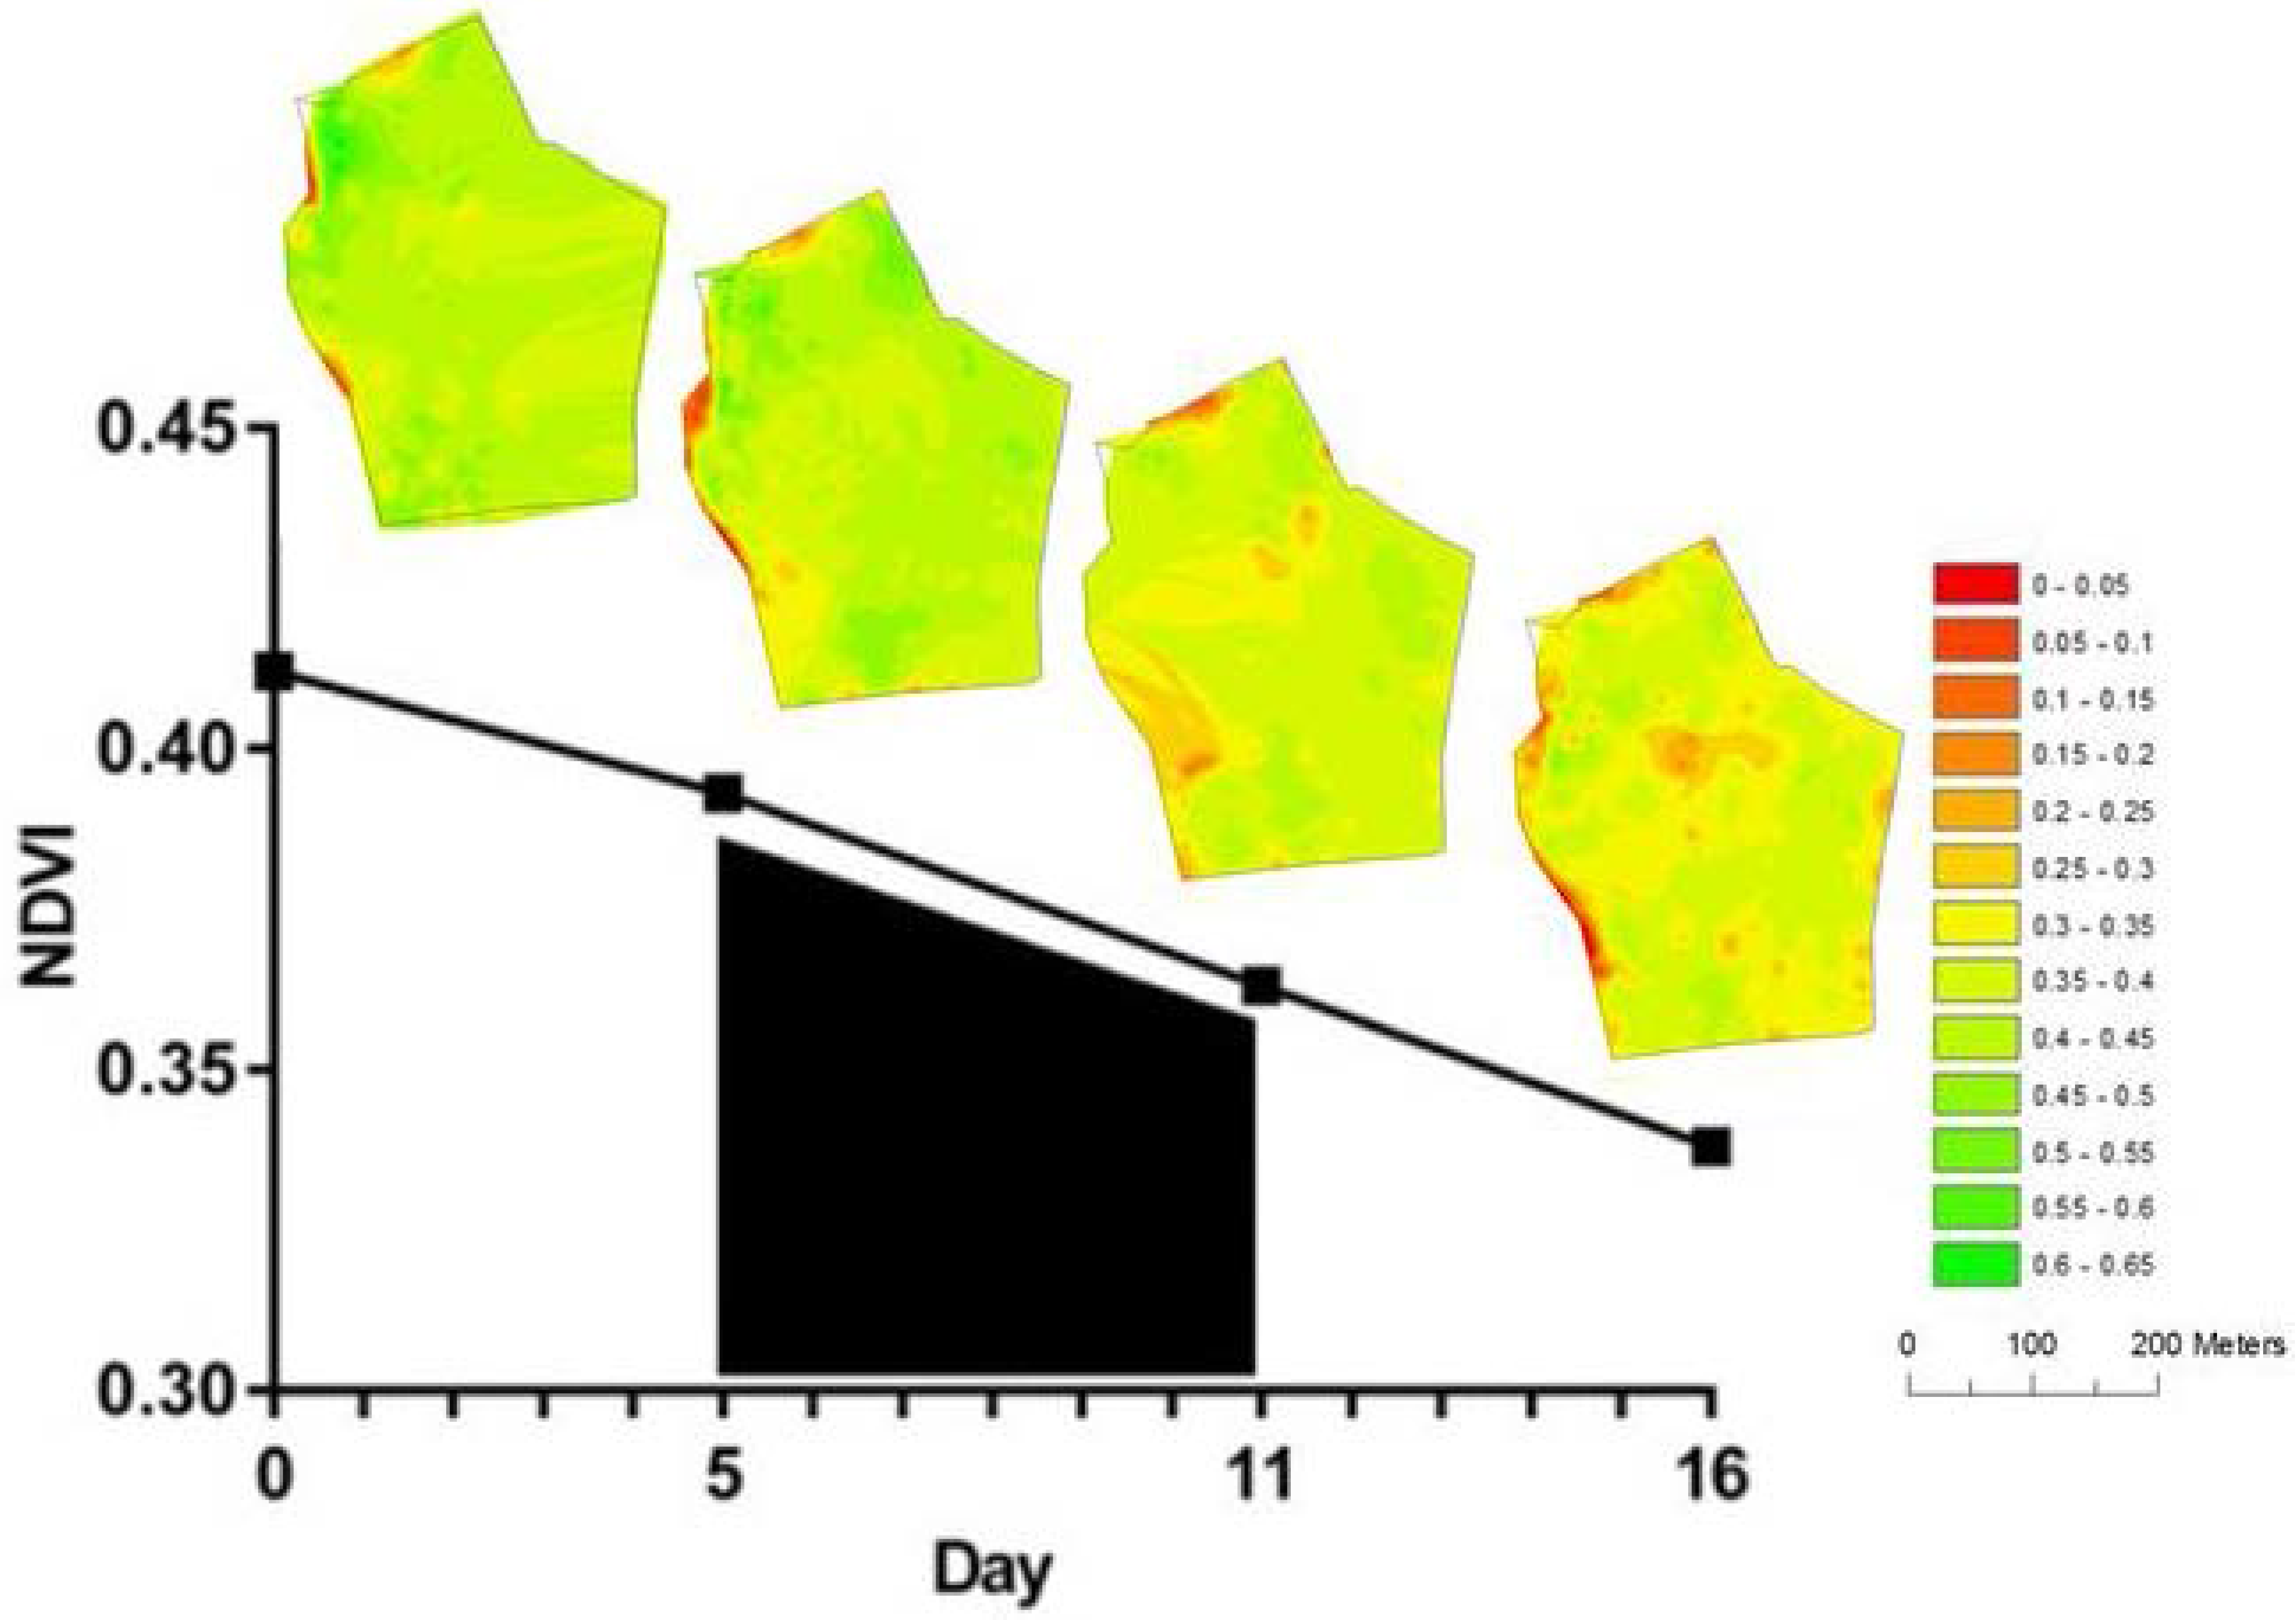
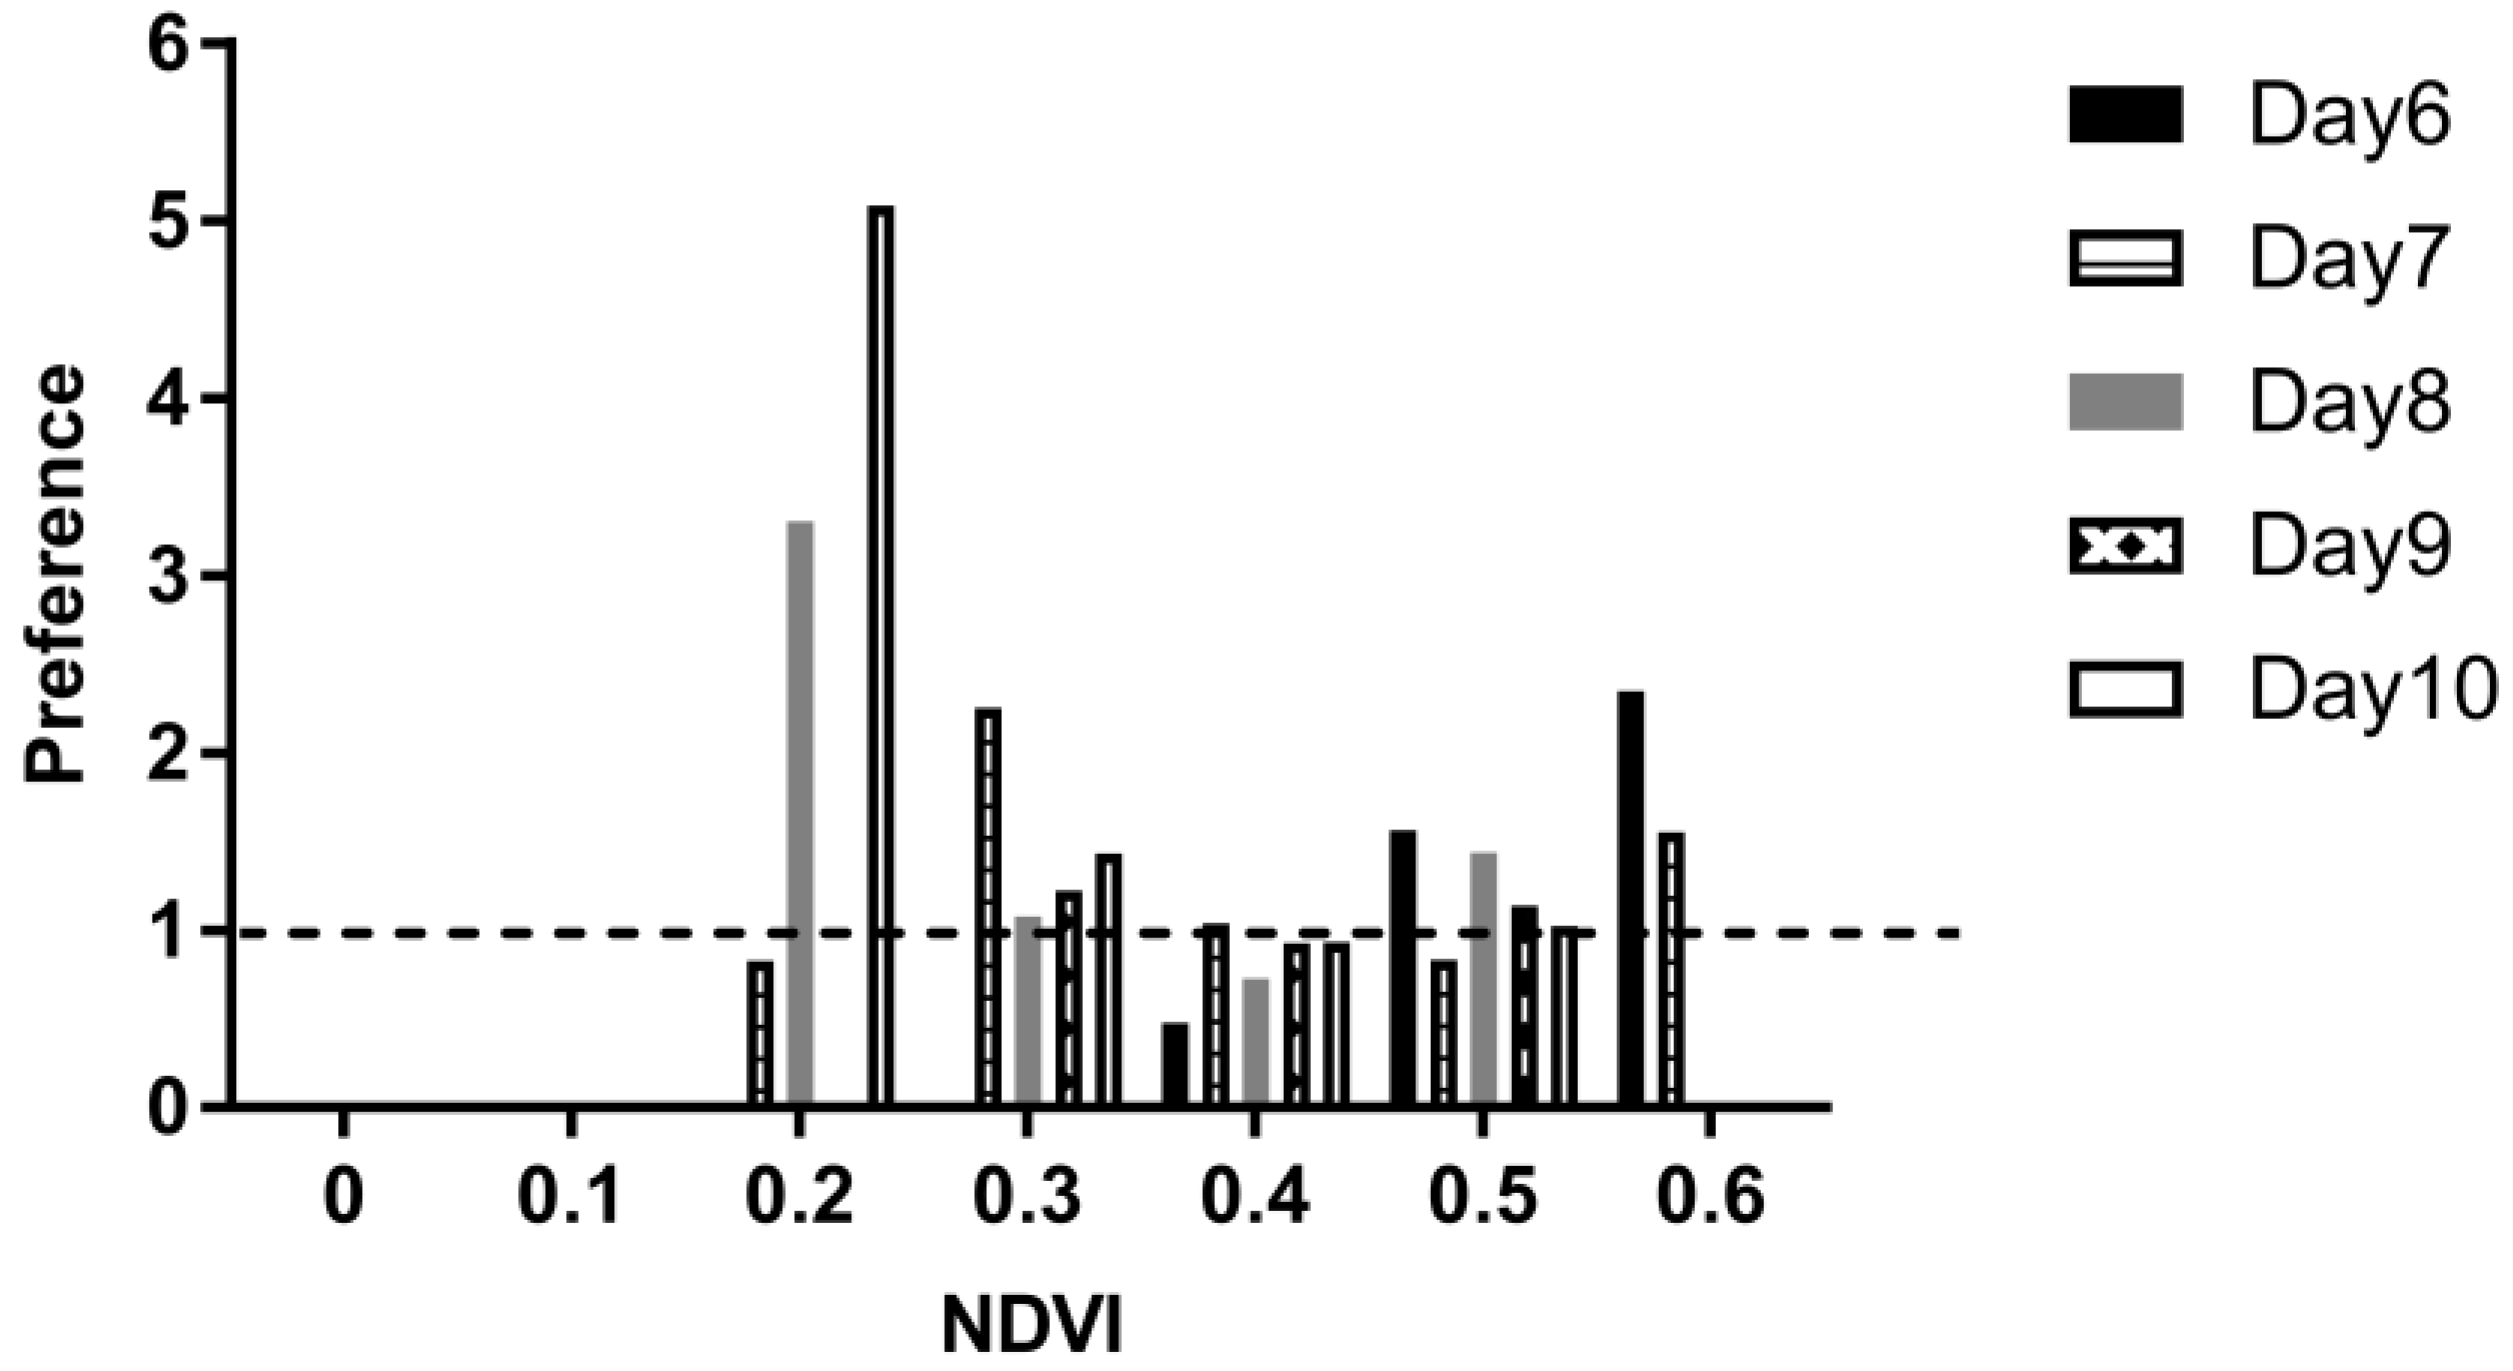
3.2.1. NDVI Preference

Cattle had a preference for areas of higher NDVI (Figure 6) during grazing hours across Days 6–10, with cattle showing a strong preference for areas with NDVI > 0.5. Slight changes were also apparent from the beginning (Day 6) to the end (Day 10) of the GNSS collar period. This was seen with cattle preferring the highest NDVI category of >0.6 only on Day 6 and Day 7. On days 8 and (particularly) 10, cattle greatly increased the amount of time they spent in areas of low NDVI (≤0.2) with cattle five times more likely to select this category area than other available category locations in the paddock. Conversely, some NDVI categories were also avoided, indicated by a preference value of ≤1.

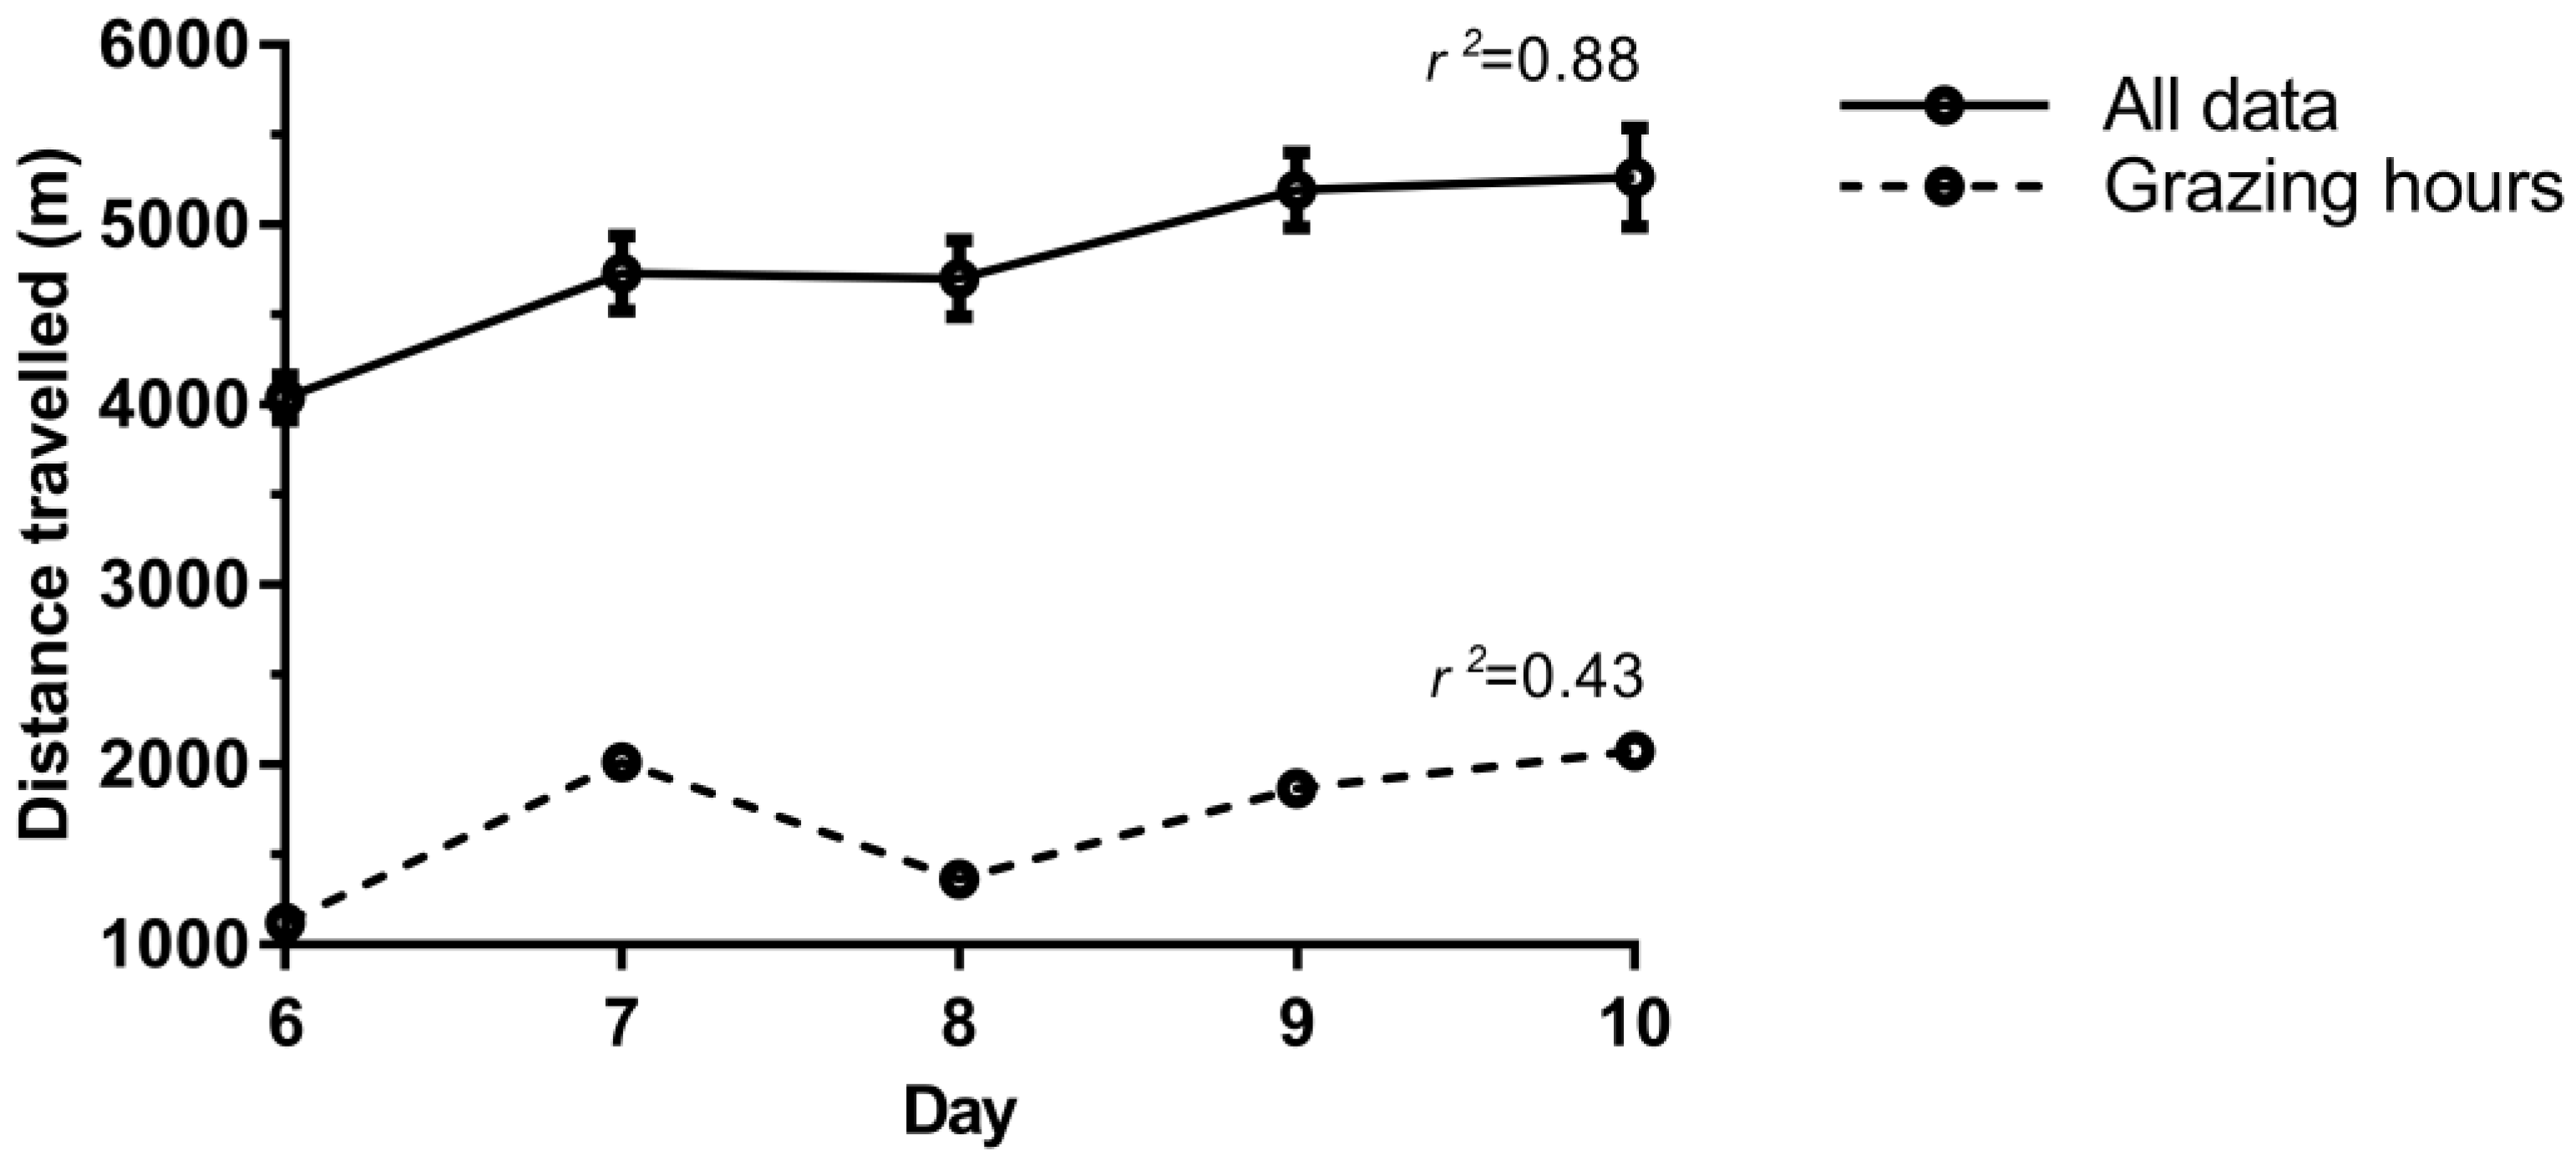
3.2.2. Distance Travelled

The daily distance travelled per animal significantly increased linearly from the beginning to the end of the GNSS collar period (P < 0.001; r2 = 0.88; Figure 7). Differences in distance travelled between animals, highlighted by error bars, emphasises normal animal variation including probable variation in motivations to travel to points of apparent interest (such as seeking out shelter or water sources). The daily distance travelled was less during grazing hours, time when direct behaviour observations were recorded (r2 = 0.43; Figure 7), but significantly increased over time (P < 0.001).

4. Discussion

4.1. Cattle Behaviour

Animals are able to adjust their behaviour and associated time budget in order to meet their demands (nutritional, social, etc.). All behaviours recorded in the present study were affected by pasture decline, reinforcing animals’ ability to alter behaviour on a daily (or even more regular) basis. Grazing was the behaviour with the clearest trend, increasing over the duration of the study. It is a key behaviour for beef cattle [22], and when cattle were faced with a nutritional challenge such as declining pasture availability, an adjustment to the amount of time spent performing this behaviour occurs [23]. However, as grazing behaviour increased, we anticipated that other behaviours would decline due to a reduction in available time. However, no clear trends were evident for the six most common behaviours recorded (see Figure 4). As liveweight of the cows increased steadily over time, it was assumed that sufficient pasture was available to meet animals’ nutritional needs. Nevertheless, the results suggest an environmental factor influenced grazing behaviour.

4.2. Factors Influencing Grazing Behaviour

The observed increase in grazing time over the duration of the present study was most probably due to the underlying decline in pasture availability. As resources (in this case pasture) become limiting, animals need to increase foraging behaviour, including travel and “exploration” of the paddock, in order to graze and meet their nutritional requirements [24]. Similar results have been documented for sheep [25] and cattle [26,27,28], with these studies reporting that grazing time increased with declining pasture availability. Conversely, as the availability of pasture increased, grazing time declined [29]. However, some studies have reported that grazing time was not affected by decreasing pasture availability [11,30]. The latter observation could be attributed to the multifactorial nature of diet selection by livestock and the speed-of-movement based technique the authors used for classifying animal movement as “grazing” (refer to [31]). Regardless, the potential exists to apply this knowledge to commercial production systems to facilitate decision-making on when to move livestock to fresh paddocks. Rotational grazing systems can improve paddock utilisation and the sustainability of swards, but these rely on the timely removal of cattle from a paddock before irreversible effects occur.
Other factors also play a role in influencing grazing behaviour such as plant height, maturity and quality [26]. NDVI indicates photosynthetic activity of forage plants, where a green, growing plant (high photosynthetic activity) will have a high value (closer to 1), whereas a low value (0) highlights a low photosynthetic, senescing plant [5]. NDVI declined over time in the present study (Figure 3). A number of common factors in grazing systems are known to influence a change in NDVI, including plant physiology, growth, and senescence. Additionally, declining NDVI is indicative of changing plant photosynthetic activity, from an actively growing to a maturing plant. The findings of the present study also highlight that cattle preferred to graze the green or high photosynthetic areas, resulting in senesced material being left (i.e., uneaten), and this change was detected by the CropCircle sensor/NDVI values (Figure 3). Plant growth is also greatly influenced by livestock grazing, particularly due to selective grazing by livestock species [23,32,33]. The rate of change in pasture availability following a grazing event can occur rapidly or slowly, for example within minutes or after months, and over a range of spatial scales [32]. Therefore, grazing events can affect both plant photosynthetic activity and NDVI. Changes in NDVI over time may also indicate the declining quality of pasture, such as fibre content. As forages mature, fibre content (Hemicellulose, Cellulose and Lignin) within the cell increases [34]. Fibre content of forage tends to restrict intake by ruminants, thus reducing grazing time as the rumen fills more quickly [35]. Hence, as pasture availability decreases and the stage of plant maturity increases, more fibre is present and grazing would have been expected to decline over time due to an increase in rumen fill and reduction in intake [36,37]. Although this dynamic relationship is highly dependent on implemented pasture management regimes. In the present study, the opposite occurred with grazing increasing over time. Stejskalová et al. [38] suggested that a low fibre content helps increase rumen action, resulting in more time spent actively searching for available forage (grazing). As pasture was not analysed for fibre content, we are unable to determine if change in fibre content was a driver of grazing behaviour over the course of the study. Future recommendations should include documenting pasture availability, quality, or average paddock NDVI before and after cattle grazing. Nonetheless, our findings reinforce how pasture availability and quality can greatly influence grazing behaviour, and the important role these play in understanding how cattle behaviour changes in response to environmental change.

4.3. GNSS Collar Analysis

4.3.1. NDVI Preference

Cattle showed a strong preference for areas in the paddock where NDVI was highest (≥0.5), highlighting the selective nature of grazing cattle in relation to pasture “quality” (assuming that a high NDVI relates to increased forage quantity and quality). Similarly, research by Handcock et al. [5] found that animals spent most of their time at areas of higher NDVI (around 0.5 NDVI), which were more mature areas, yet had a lower NDVI than the overall paddock average. Toward the end of the GNSS collar period on days 8–10, cattle were no longer actively seeking the top NDVI category of ≥0.6, suggesting that this NDVI category was grazed out. In addition, cattle were five times more likely to select NDVI category 0.2 on Day 10 compared to remaining available pasture with higher NDVI. However, on Day 10 the highest temperature was recorded during the study (36.4 °C), which could have influenced the apparent high selection for areas with an NDVI < 0.2. These low NDVI areas may include areas around trees, which are likely to have low NDVI due to either the influence of shading or tree-root competition for water on grass production, and/or their role as stock camps. In the present study, the average NDVI within 10 m of all trees was higher (0.37 ± 0.001) than the 0.2 NDVI category preference. Moreover, instead of highlighting avoidance of areas with high quality pasture, it could illustrate the preference and selectivity for areas near shelter (trees) or water sources which the cows may have selected to minimise heat load. The fact that one of the highest preferences based on time spent around trees and the dam was recorded on Day 10 supports this suggestion. Based on all GPS points, cattle spent 1.5% of their time within 10 m of trees and 0.4% within 20 m of a dam. While time spent near shelter and water on Day 10 was not the highest value recorded during the GNSS period, it was greater than the average (1.0% and 0.26%, respectively). Not surprisingly, the average NDVI of pasture within 20 m of the dam was also higher at 0.3. Additionally, micro-climates in different areas of the paddock especially on Day 10 may have also influenced the apparent preference for regions by cattle. In addition, daily distance travelled increased over time, and if the high preference for low NDVI categories was true, then the distances travelled would have declined due to an increase in time spent at these highly available sites. Regardless, this information illustrates the selective nature of grazing cattle and how producers need to understand the complex interaction between grazing behaviour and the underlying pasture in order to maximise production potential and implement management strategies.

4.3.2. Distance Travelled

A temporal increase in distance travelled per day during the GNSS collar period can be attributed to an increase in grazing behaviour as the study progressed. When more time is spent searching and travelling in order to find available or better quality forage (i.e., performing foraging behaviour), a concomitant increase in the distance travelled is expected. Animals will regularly travel over large areas, exploring their surrounding environment in order to find available and high quality forage [39,40]. Similarly, decreasing pasture availability has been correlated with an increase in the number of steps [41]. The daily distance travelled was comparable to previous studies, ranging from 1.7 [42] to 12.6 km [43]. Therefore, the number of steps taken or daily distance travelled can be indicative of the underlying pasture availability. Furthermore, this variable could also be used in future modelling (e.g., energy expenditure), or as an alert indicator of when action needs to be taken (e.g., paddock rotation or supplementary feed provided). Differences may be apparent between different environments, paddock sizes, and breed of animals, but these findings highlight how a relatively simple variable such as distance travelled could provide useful information at a paddock level.

4.4. Limitations

More knowledge is needed about the factors affecting animals’ “preferred diet” and grazing location site [23] in extensive production systems (i.e., not solely relying on feeding trials). Numerous variables are proposed to influence how cattle select areas to graze [44,45,46], but the addition of “new” information from readily available technology will help facilitate producers’ understanding of the real world drivers of forage selectivity by cattle. It is acknowledged that a limitation of our study is its focus on NDVI as a proxy for pasture biomass/availability and not on other quality parameters of pasture. Future research is required that incorporates pasture biomass, supplemented with quality attributes (fibre, protein, carbohydrate contents, etc.) of pasture, to investigate the effects on livestock behaviour, spatial distribution and preference for pasture/forage species. Additionally, the future development of models utilising data derived from technology such as GPS for the classification of livestock behaviour will enable information to be available during all hours and not just during daylight hours, like the majority of behavioural observation studies.

5. Conclusions

The addition of technology that is readily available, and quick and easy to use by farmers, highlights how potential tools can be applied to improve the way extensively produced livestock are managed. Cattle change their behaviour in response to pasture availability, hence highlighting a potential bio-indicator of pasture availability, especially in remote regions where farm sizes are large and visual monitoring can be infrequent. Additionally, distance travelled and time spent grazing by cattle may also be useful indicators to incorporate in future management tools for livestock. By improved understanding of the complex interaction between cattle selectivity and the underlying pasture, management decisions can be implemented to potentially improve profitability and sustainability of the enterprise.

Acknowledgments

The authors wish to acknowledge the support of the A W Howard Memorial Trust Incorporated for the primary author’s research fellowship. Paul and Jeanette Lipscombe, The University of Sydney’s John Bruce Pye farm staff, are gratefully acknowledged for their continued help and assistance throughout our research study.

Author Contributions

J.M., G.C., L.G., A.M., and L.I. conceived and designed the study; J.M. performed the study; J.M. and E.H. analysed the data; J.M. wrote the paper and all authors contributed to manuscript revisions.

Conflicts of Interest

The authors declare no conflict of interest.

References

  1. Morris, J.E.; Cronin, G.M.; Bush, R.D. Improving sheep production and welfare in extensive systems through precision sheep management. Anim. Prod. Sci. 2012, 52, 665–670. [Google Scholar] [CrossRef]
  2. Pullanagari, R.R.; Yule, I.; King, W.; Dalley, D.; Dynes, R. The use of optical sensors to estimate pasture quality. Int. J. Smart Sens. Intell. Syst. 2011, 4, 125–137. [Google Scholar]
  3. Meisser, M.; Deléglise, C.; Freléchoux, F.; Chassot, A.; Jeangros, B.; Mosimann, E. Foraging behaviour and occupation pattern of beef cows on a heterogeneous pasture in the swiss alps. Czech. J. Anim. Sci. 2014, 59, 84–95. [Google Scholar]
  4. Trotter, T.F.; Frazier, P.; Trotter, M.G.; Lamb, D.W. Objective biomass assessment using an active plant sensor (crop circle), preliminary experiences on a variety of agricultural landscapes. In Proceedings of the Ninth International Conference on Precision Agriculture, Denver, CO, USA, 20–23 July 2008. [Google Scholar]
  5. Handcock, R.N.; Swain, D.L.; Bishop-Hurley, G.J.; Patison, K.P.; Wark, T.; Valencia, P.; Corke, P.; O’Neill, C.J. Monitoring animal behaviour and environmental interactions using wireless sensor networks, GPS collars and satellite remote sensing. Sensors 2009, 9, 3586–3603. [Google Scholar] [CrossRef] [PubMed]
  6. Edirisinghe, A.; Hill, M.J.; Donald, G.E.; Hyder, M. Quantitative mapping of pasture biomass using satellite imagery. Int. J. Remote. Sens. 2011, 32, 2699–2724. [Google Scholar] [CrossRef]
  7. Mitchell, A.R.; Pinter, P.J.; Guerrero, J.N.; Hernandez, C.B.; Marble, V.L. Spectral reflectance measurements of alfalfa under sheep grazing. Agron. J. 1990, 82, 1098–1103. [Google Scholar] [CrossRef]
  8. Tomkiewicz, S.M.; Fuller, M.R.; Kie, J.G.; Bates, K.K. Global positioning system and associated technologies in animal behaviour and ecological research. Philos. Trans. R. Soc. B 2010, 365, 2163–2176. [Google Scholar] [CrossRef] [PubMed]
  9. Rutter, S.M. The integration of GPS, vegetation mapping and GIS in ecological and behavioural studies. Rev. Bras. Zootecn. 2007, 36, 63–70. [Google Scholar] [CrossRef]
  10. Swain, D.L.; Friend, M.A.; Bishop-Hurley, G.J.; Handcock, R.N.; Wark, T. Tracking livestock using global positioning systems are we still lost? Anim. Prod. Sci. 2011, 51, 167–175. [Google Scholar] [CrossRef]
  11. Roberts, J.; Trotter, M.G.; Lamb, D.W.; Hinch, G.; Schneider, D.A. Spatio-temporal movement of livestock in relation to decreasing pasture biomass. In Food Security from Sustainable Agriculture, Proceedings of 15th Agronomy Conference Lincoln, Canterbury, New Zealand, 15–18 November 2010; Dove, H., Culvenor, R.A., Eds.; Australian Society of Agronomy: Lincoln, New Zealand.
  12. Rouse, J.; Haas, R.; Schell, J.; Deering, D. Monitoring Vegetation Systems in the Great Plains with ERTS. Proceedings from the Third ERTS Symposium, Washington, DC, USA, 10–14 December 1974; Freden, S.C., Mercanti, E.P., Eds.; U.S. Govt. Printing Office: Washington DC, USA, 1974; Volume 351, p. 309. [Google Scholar]
  13. Minasny, B.; McBratney, A.; Whelan, B. Vesper Version 1.62. Australian Centre for Precision Agriculture: McMillan Building A05, The University of Sydney, NSW 2006. 2005. Available online: http://www.usyd.edu.au/su/agric/acpa (accessed on 20 January 2017).
  14. ESRI. Arcgis Desktop 10.2; Environmental Systems Research Institute: Redlands, CA, USA, 2013. [Google Scholar]
  15. Lehner, P.N. Handbook of Ethological Methods, 2nd ed.; Cambridge University Press: Cambridge, UK, 1998. [Google Scholar]
  16. Manning, J.K.; Cronin, G.M.; González, L.A.; Hall, E.J.S.; Merchant, A.; Ingram, L.J. The effects of global navigation satellite system (GNSS) collars on cattle (Bos taurus) behaviour. Appl. Anim. Behav. Sci. 2017, 187, 54–59. [Google Scholar] [CrossRef]
  17. Trotter, M.G.; Lamb, D.W.; Hinch, G.N.; Guppy, C.N. Global navigation satellite system livestock tracking: System development and data interpretation. Anim. Prod. Sci. 2010, 50, 616–623. [Google Scholar] [CrossRef]
  18. Heglund, N.C.; Taylor, C.R. Speed, stride frequency and energy cost per stride: How do they change with body size and gait? J. Exp. Biol. 1988, 138, 301–318. [Google Scholar] [PubMed]
  19. Jacobs, J. Quantitative measurement of food selection. Oecologia 1974, 14, 413–417. [Google Scholar] [CrossRef] [PubMed]
  20. Butler, D. Asreml: Asreml Fits the Linear Mixed Model. R Package Version 3.2.0. Available online: http://www.vsni.co.uk (accessed on 10 February 2017).
  21. R Core Team. R: A Language and Environment for Statistical Computing; R Foundation for Statistical Computing: Vienna, Austria, 2015. [Google Scholar]
  22. Kilgour, R.J. In pursuit of “normal”: A review of the behaviour of cattle at pasture. Appl. Anim. Behav. Sci. 2012, 138, 1–11. [Google Scholar] [CrossRef]
  23. Chapman, D.F.; Parsons, A.J.; Cosgrove, G.P.; Barker, D.J.; Marotti, D.M.; Venning, K.J.; Rutter, S.M.; Hill, J.; Thompson, A.N. Impacts of spatial patterns in pasture on animal grazing behavior, intake, and performance. Crop Sci. 2007, 47, 399–415. [Google Scholar] [CrossRef]
  24. Launchbaugh, K.L.; Howery, L.D. Understanding landscape use patterns of livestock as a consequence of foraging behavior. Rangel. Ecol. Manag. 2005, 58, 99–108. [Google Scholar] [CrossRef]
  25. Arnold, G. The effect of the quantity and quality of pasture available to sheep on their grazing behaviour. Crop Pasture Sci. 1960, 11, 1034–1043. [Google Scholar] [CrossRef]
  26. Scarnecchia, D.L.; Nastis, A.S.; Malechek, J.C. Effects of forage availability on grazing behavior of heifers. J. Range Manag. 1985, 38, 177–180. [Google Scholar] [CrossRef]
  27. Senft, R.L.; Rittenhouse, L.R.; Woodmansee, R.G. Factors influencing patterns of cattle grazing behavior on shortgrass steppe. J. Range Manag. 1985, 38, 82–87. [Google Scholar] [CrossRef]
  28. Hancock, J. Studies of grazing behaviour in relation to grassland management I. Variations in grazing habits of dairy cattle. J. Agric. Sci. 1954, 44, 420–433. [Google Scholar] [CrossRef]
  29. Larson-Praplan, S.; George, M.R.; Buckhouse, J.C.; Laca, E.A. Spatial and temporal domains of scale of grazing cattle. Anim. Prod. Sci. 2015, 55, 284–297. [Google Scholar] [CrossRef]
  30. Roberts, J. Potential for Remote Monitoring of Cattle Movement to Indicate Available Biomass. Ph.D. Thesis, University of New England, Armidale, NSW, Australia, September 2014. [Google Scholar]
  31. Putfarken, D.; Dengler, J.; Lehmann, S.; Härdtle, W. Site use of grazing cattle and sheep in a large-scale pasture landscape: A GPS/GIS assessment. Appl. Anim. Behav. Sci. 2008, 111, 54–67. [Google Scholar] [CrossRef]
  32. O’Reagain, P.; Schwartz, J. Dietary selection and foraging strategies of animals on rangeland. Coping with spatial and temporal variability. In Recent Developments in the Nutrition of Herbivores, Proceedings of the IVth International Symposium on the Nutrition of Herbivores, Clermont–Ferrand, ARA, France, 11–15 September 1995; Journet, M., Grenet, E., Farce, M.-H, Theriez, M., Demarquilly, C., Eds.; INRA Editions: Paris, France, 1995; pp. 407–423. [Google Scholar]
  33. Coppock, D.L.; Ellis, J.E.; Detling, J.K.; Dyer, M.I. Plant-herbivore interactions in a North American mixed-grass prairie. II. Responses of bison to modification of vegetation by prairie dogs. Oecologia 1983, 56, 10–15. [Google Scholar] [CrossRef] [PubMed]
  34. Beever, D.E.; Offer, N.; Gill, M. The feeding value of grass and grass products. In Grass: Its Production and Utilisation, 3rd ed.; Hopkins, A., Ed.; Blackwell Scientific: Oxford, UK, 1989; pp. 140–195. [Google Scholar]
  35. Rutter, S.M. Diet preference for grass and legumes in free-ranging domestic sheep and cattle: Current theory and future application. Appl. Anim. Behav. Sci. 2006, 97, 17–35. [Google Scholar] [CrossRef]
  36. McLeod, M.; Smith, B. Eating and ruminating behaviour in cattle given forages differing in fibre content. Anim. Prod. 1989, 48, 503–511. [Google Scholar] [CrossRef]
  37. Mertens, D.; Ely, L. A dynamic model of fiber digestion and passage in the ruminant for evaluating forage quality. J. Anim. Sci. 1979, 49, 1085–1095. [Google Scholar] [CrossRef]
  38. Stejskalová, M.; Hejcmanová, P.; Pavlů, V.; Hejcman, M. Grazing behavior and performance of beef cattle as a function of sward structure and herbage quality under rotational and continuous stocking on species-rich upland pasture. Anim. Sci. 2013, 84, 622–629. [Google Scholar] [CrossRef] [PubMed]
  39. Arnold, G.W.; Dudzinski, M.L. Ethology of Free-Ranging Domestic Animals; Elsevier Scientific Pub. Co.: Amsterdam, The Netherlands, 1978; Volume 2. [Google Scholar]
  40. Howery, L.D.; Provenza, F.D.; Banner, R.E.; Scott, C.B. Differences in home range and habitat use among individuals in a cattle herd. Appl. Anim. Behav. Sci. 1996, 49, 305–320. [Google Scholar] [CrossRef]
  41. Boland, H.; Scaglia, G.; Fontenot, J.; Abaye, A.; Stewart, R.; Smith, S. Grazing behavior of beef steers consuming different tall fescue types and lakota prairie grass. Prof. Anim. Sci. 2007, 23, 721–727. [Google Scholar] [CrossRef]
  42. Hughes, G.P.; Reid, D. Studies on the behaviour of cattle and sheep in relation to the utilization of grass. J. Agric. Sci. 1951, 41, 350–366. [Google Scholar] [CrossRef]
  43. Sneva, F. Behavior of yearling cattle on eastern Oregon range. J. Range Manag. 1970, 23, 155–158. [Google Scholar] [CrossRef]
  44. Ganskopp, D.C.; Bohnert, D.W. Landscape nutritional patterns and cattle distribution in rangeland pastures. Appl. Anim. Behav. Sci. 2009, 116, 110–119. [Google Scholar] [CrossRef]
  45. Bailey, D.W.; Gross, J.E.; Laca, E.A.; Rittenhouse, L.R.; Coughenour, M.B.; Swift, D.M.; Sims, P.L. Mechanisms that result in large herbivore grazing distribution patterns. J. Range Manag. 1996, 49, 386–400. [Google Scholar] [CrossRef]
  46. George, M.; Bailey, D.; Borman, M.; Ganskopp, D.; Surber, G.; Harris, N. Factors and Practices that Influence Livestock Distribution. Available online: https://www.ars.usda.gov/research/publications/publication/?seqNo115=213526 (accessed on 18 May 2017).
Figure 1. The daily recorded average (■), minimum (light grey), and maximum (dark grey) temperature (°C) and rainfall (●; mm) over the study. The shaded section highlights the GNSS collar period on days 6–10. The highest recorded temperature of 37.6 °C occurred on Day 10 of the study.
Agriculture 07 00045 g001
Figure 2. Correlation between total pasture biomass (solid lines) and green pasture biomass (dashed lines) with NDVI (Normalised Difference Vegetation Index). Please refer to Section 3.1 in the main text for explanations between the short and long regressions curves.
Agriculture 07 00045 g002
Figure 3. Normalised Difference Vegetation Index (NDVI) maps were generated every 5–6 days over the duration of the study, based on the average NDVI value of the paddock on that day. The GNSS collar period is shaded and illustrates the period of time when cattle were fitted with GNSS collars to investigate paddock utilisation.
Agriculture 07 00045 g003
Figure 4. Proportion of time spent undertaking each of the six most commonly recorded behaviours each day during daylight hours over the duration of the study. Observations were not recorded on Days 3 and 13.
Agriculture 07 00045 g004
Figure 5. Proportion of observations (predicted value) in which cattle were recorded grazing per day (dashed line) and NDVI (Normalised Difference Vegetation Index; solid line) over the duration of the study.
Agriculture 07 00045 g005
Figure 6. Preference index for grazing hours (where grazing occurred ≥50% of time during behaviour observations) during the GNSS collar period (Days 6–10). A preference value of ≥1 (above the dashed line) indicates cattle were actively selecting areas with the associated NDVI values, whereas ≤1 highlights avoidance by cattle.
Agriculture 07 00045 g006
Figure 7. Distance travelled (m/day) during the GNSS collar period (Days 6–10). The total distance travelled over 24 h (All data) and distance travelled during grazing hours (≥50% time spent grazing during behaviour observations). Standard error bars are included for all data. However, as differences between animals during grazing hours were negligible (SEM = 43.9–84.1), error bars are not included.
Agriculture 07 00045 g007

