Fluorescence and Reflectance Sensor Comparison in Winter Wheat

Institute of Crop Science, Department of Agronomy (340a), University of Hohenheim, Fruwirthstraße 23,70599 Stuttgart, Germany
*
Author to whom correspondence should be addressed.
Agriculture 2017, 7(9), 78; https://doi.org/10.3390/agriculture7090078
Submission received: 4 August 2017
/
Revised: 3 September 2017
/
Accepted: 11 September 2017
/
Published: 20 September 2017
(This article belongs to the Special Issue Remote Sensing in Agricultural System)
Abstract
:Nitrogen (N) is the most important macronutrient in plant production. For N application, legislation requirements have raised, and the purchasing costs have increased. Modern sensors can help farmers to save costs, to apply the right quantity, and to reduce their impact on the environment. Two spectrometers and one fluorescence sensor have been used on a vehicle sensor platform for N detection in wheat (Triticum aestivum L.) field trials over three years. The research fields were divided into plots, and the N input ranged from 60 to 180 kg N ha in six levels. The OSAVI (optimized soil-adjusted vegetation index) showed a similar value pattern to the NDVI (normalized difference vegetation index) and the CropSpec index for the investigated factors. The red-edge inflection point (REIP) index showed high correlations to N (indicated by r between 0.6 and 0.8), especially in June and July. The developed models from the fluorescence indices FERARI, NBI, FLAV, and the spectrometer indices CropSpec and HVI show high correlations (r = 0.5–0.8) to yield and may be used for future yield predictions. The Multiplex Research fluorescence sensor (Force-A, Orsay, France) was the most convenient sensor with a simple measurement method and a non-proprietary file output. The implementation into existing agricultural vehicle networks is still necessary, being able to use it on a farm for online N recommendations.
Keywords:
agriculture; precision farming; sensors; indices; comparison; nitrogen; yield; wheat (Triticum aestivum L.)1. Introduction
Nitrogen (N) application in agricultural crops improves the crop yield (quantity) and increases the protein content (quality). Therefore, it is used in huge quantities as fertilizer all around the world [1]. If the chemical compound N is not available to the plants (e.g., through denitrification, or if the crop cannot metabolize all the available N in the form of nitrate, NO3, or ammonium, NH4+), N leaching can cause vast environmental pollution [2].
Governmental restrictions and documentation duties, along with a stronger public awareness of environmental safety, led farmers to plan their fertilizer applications more carefully. Increasing prices for fertilizers over the last years pressured today’s farmers even more to reduce farm inputs and save costs in agricultural applications.
Sensors using the principles of reflectance or fluorescence measurements are very useful tools to provide support in this area. Sensors enable site-specific fertilizer treatments in dedicated management zones or variable N rates over a whole field. A steady crop development over the whole field and a homogeneous grain quality (protein content) are the main aims of their usage.
Sensor analysis—especially reflectance measurements with spectrometers—have been used in precision farming (PF) applications for decades [3], as more than 90% of the spectral information about the crop canopy status are contained in the red and near-infrared (NIR) spectral bands (e.g., [4,5]). A nitrogen limitation in plants results in higher reflections in the red spectral region, as a consequence of lower chlorophyll content in the plant cells [6]. Non-destructive methods have been developed to quickly determine the nutrition status in a field [7,8]. Narrow spectral bands from 1 to 10 nanometers (nm) enable the gathering of detailed information of the wavelength bands—an advantage of modern spectral sensors with high wavelength accuracy. Thomas and Gausman [9] showed that in the spectral band region from 400 to 700 nm, it is mainly chlorophyll and carotenoids that are absorbing the incident radiation. Spectral vegetation indices, calculated based on combinations of NIR and red spectral reflectance, showed good correlations with canopy parameters related to chlorophyll and biomass occurrence. The band regions of strong chlorophyll absorption (670 nm) and leaf reflection (780 nm) indicate a positive correlation to leaf area index (LAI) and chlorophyll content (e.g., [10,11]). Rasmussen et al. [12] concluded that chlorophyll is the most important independent factor affecting leaf reflectance.
A further interesting technology is the sensing of fluorescence. It allows for non-destructive measurements of chlorophyll content, N/C ratio, or leaf area index [13]. Fluorescence techniques in agricultural vehicles are still barely in use. Reasons for that are a lower surface capture and the need of a close distance to the crop canopy, accompanied by leaf excitation always with the same amount of light energy and the absence of background noise (e.g., of the soil) [14]. Other available field-based fluorescence measurements (e.g., high-resolution spectroradiometers [15] or hyperspectral line scanners [10]) do not have the requirements of being very close to the canopy or exposing the plants to active excitation (sun-induced fluorescence). Their suitability for fluorescence measurements is still in discussion, and is not a subject in this publication, which will focus on using active techniques to measure chlorophyll fluorescence.
This publication compares the data of two spectrometers and one fluorescence sensor from investigations in agricultural fields. It aims to answer the questions:
- Which sensors have been the most useful in regards to practical field handling?
- Which indices are statistically significant for assessments of the N treatments?
- Which fluorescence and spectroscopy indices can be used to estimate the wheat yield at an early development stage; i.e., what kind of index combination can derive a more exact yield prediction?
NNitrogen CCarbon PFPrecision Farming NIRNear Infrared NO3Nitrate NH4+Ammonium LAILeaf Area Index nmNanometer
2. Materials and Methods
2.1. Experimental Site
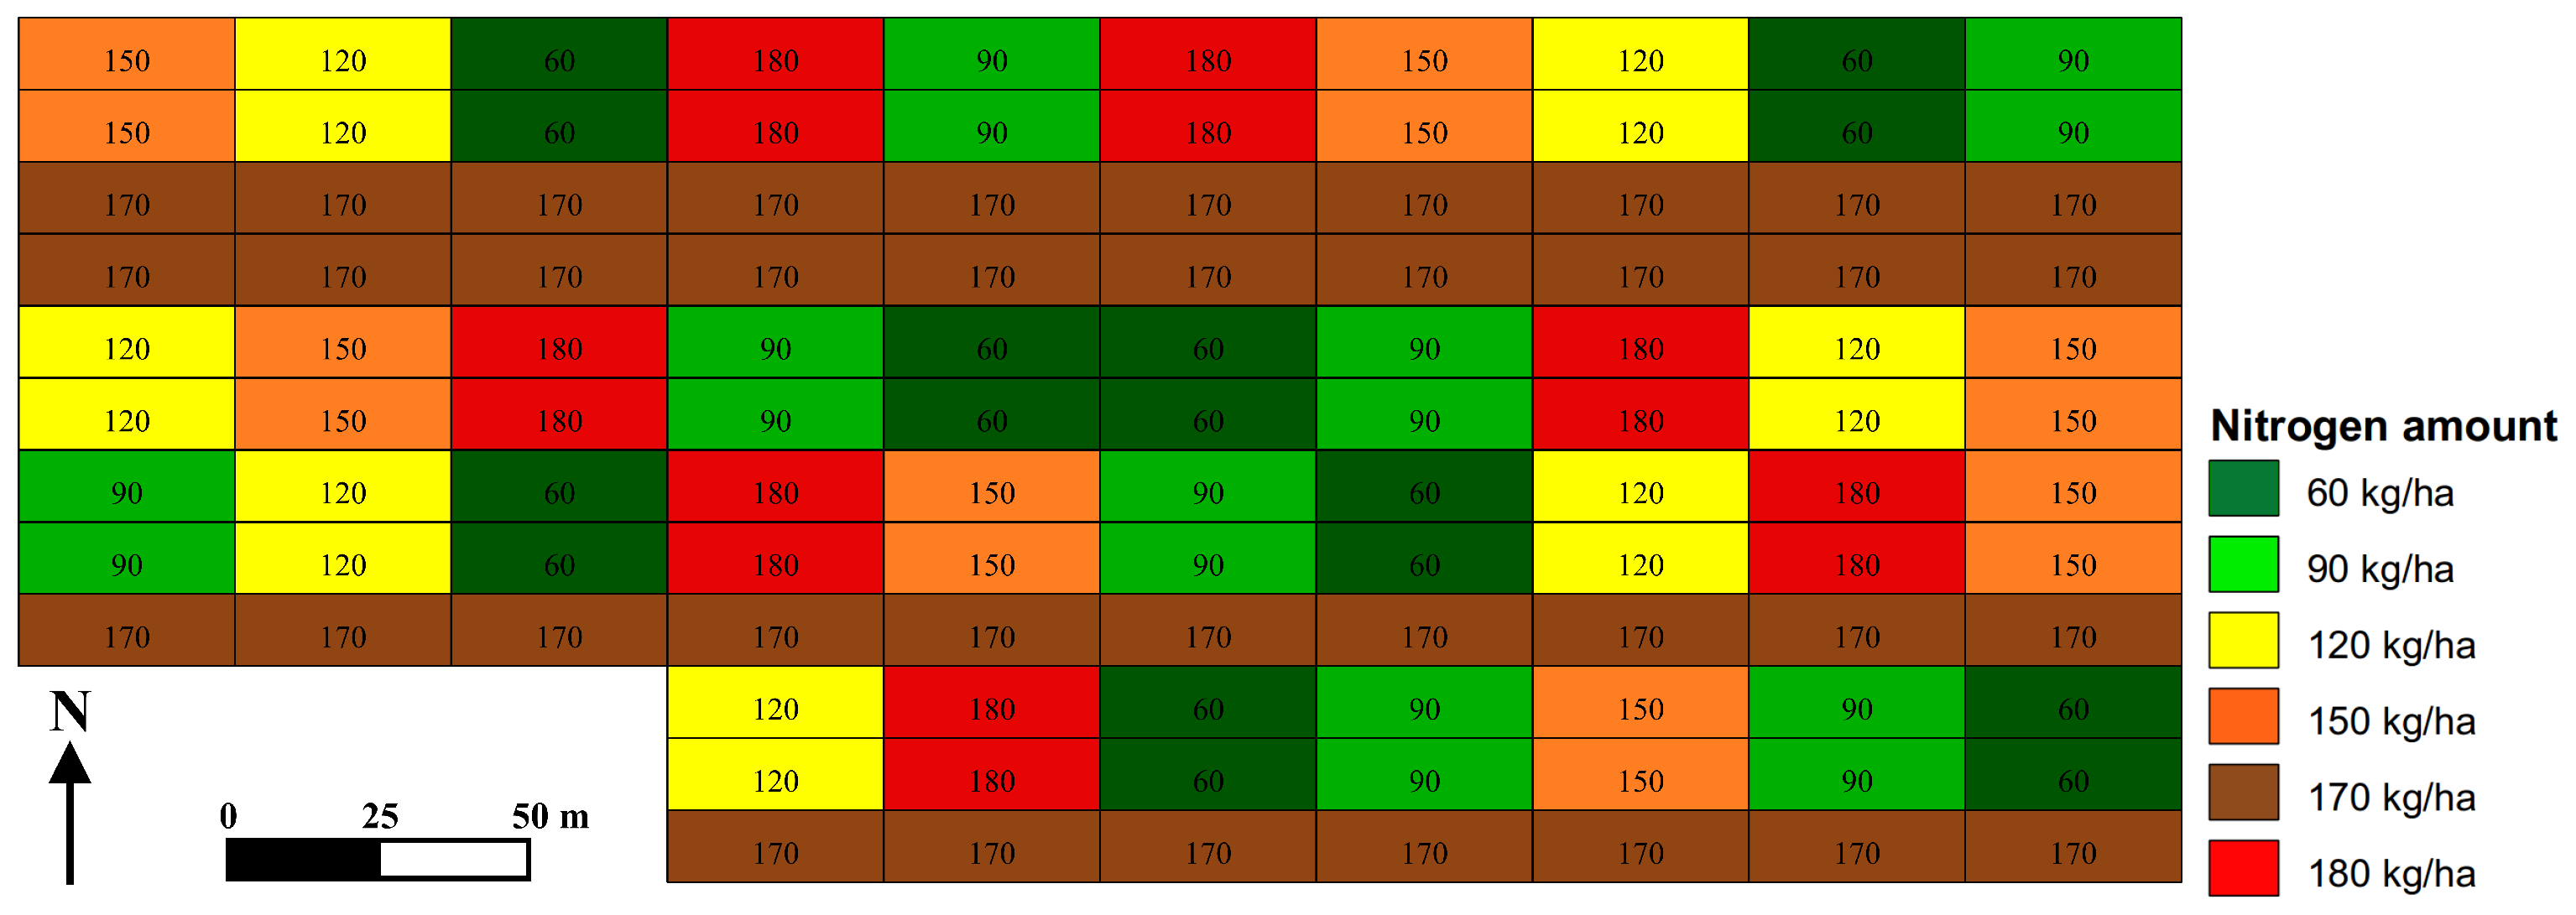
The field trials were conducted at the research station Ihinger Hof, Renningen (Germany), an institution of the University of Hohenheim, Stuttgart (Germany). The site Ihinger Hof (N 48°44’41”, E 8°55’26”) has a mean annual precipitation of 690 mm and a mean temperature of 7.9 °C. From 2010 to 2012, the measurements were carried out in winter wheat (Triticum aestivum L., cv. Toras) on the experimental fields “Inneres Taele” (IT) and “Lammwirt” (LW). Due to crop rotation aspects, the N sensing field trial was continued on field IT in the second growing season. These two fields have a high natural field variability, with soil types reaching from pure clay to silty loam. The EM38 is an instrument for near-surface soil conductivity survey measurements, and measured values of 52–86 millisiemens (mS). Figure 1 shows the experimental field design. The experimental fields were divided into several plots of 36 × 36 m, each plot separately into 36 × 12 m strips. The randomized N amounts ranged from 60 to 180 kg N ha in five levels (N1 to N5), beside an N dosage of 170 kg N ha (K). Variant K represents the N dosage that is usually applied on this farm. The total N amount was split into three applications over the early growing period. The first and second times, the fertilizer was applied in the tillering stage, and the third time took place between stem elongation and booting stages (Zadoks-scale) [16,17]. The first N dosage was applied equally over the whole field. The second and third passages were carried out as variable N applications to achieve the planned final N amounts for each plot. Each N treatment was applied with a pneumatic fertilizer spreader and a tractor with an automatic steering system and GPS-RTK precision (approx. ±2.5 cm).
Soil samples of all strips were taken in spring, before crop growth continued, and again after harvesting the research fields. The soil samples were analyzed to determine the available nitrogen in the soil (N-method) for three soil depths: (1) 0–30 cm; (2) 30–60 cm; and (3) 60–90 cm. Biomass samples over the whole field were collected at three growing stages: (1) stem elongation; (2) flowering; and (3) right before harvest. In a laboratory, these biomass samples were dried and analyzed regarding the number of grains per ear, the number of tillers, the protein content, and the biomass weight. The yield data were gathered by a standard New Holland combine with a header of 6 m cutting width.
2.2. Sensor Set-Up
The measurements have been derived with three sensors: (i) FieldSpec Handheld (Analytical Spectral Devices, Boulder, CO, USA); (ii) HandySpec Field (tec5 AG, Oberursel, Germany); and (iii) Multiplex Research (Force-A, Orsay, France) (Table 1).
2.3. Spectrometry
The FieldSpec Handheld used in this research set up has a spectral range from 325 to 1075 nm with a 1 nm wavelength accuracy and a field of view of 25°. It was mounted at a height of 200 cm above canopy, resulting in a measuring surface of 2.74 m. The reflectance was calculated based on an additional measurement of a given white standard (BaSO). The HandySpec Field has a spectral range from 360 to 1000 nm with a 10 nm accuracy and a field of view of 25°. It was mounted at a height of 80 cm above canopy with a measuring surface of 0.44 m. The integration time was set to automatic mode, and varied between 25 ms and 128 ms. Before starting each measurement series, a spectralon plate was used for white calibration purposes with both devices. A white standard is used to optimize the two spectrometers to the current illumination.
Both spectrometers are passive sensors. From the raw data of these spectrometers, several vegetation indices were calculated to be used for the crop status analysis. In the following, R denotes the reflectance, the sub-index the wavelength in nm. The simple ratio CropSpec can be used to measure the site-specific N nutrition status of crops [18,19,20]. The normalized difference vegetation index (NDVI) is an indicator of greenness and a transformation of the infrared-red indices. The higher the value of the NDVI, the greener the foliage [21,22,23]. Furthermore, the NDVI correlates mainly with absorbed photosynthetic active radiation [24]. The hyperspectral vegetation index (HVI) has been used based on a previous study with the same FieldSpec HandHeld sensor [25]. It is a modified index for analyzing satellite spectral data [26]. The optimized soil-adjusted vegetation index (OSAVI) is a derivative of the soil-adjusted vegetation index (SAVI), and minimizes soil brightness influences from spectral vegetation indices involving red and near-infrared wavelengths [27,28]. The factor L varies between 0 and 1. As foliage density increases, the selected value of L must decrease. [29,30]. The red-edge inflection point (REIP) is a strong indicator of the chlorophyll content [31,32,33]. The higher the value of the REIP, the better the chlorophyll status [34].
2.4. Fluorescence
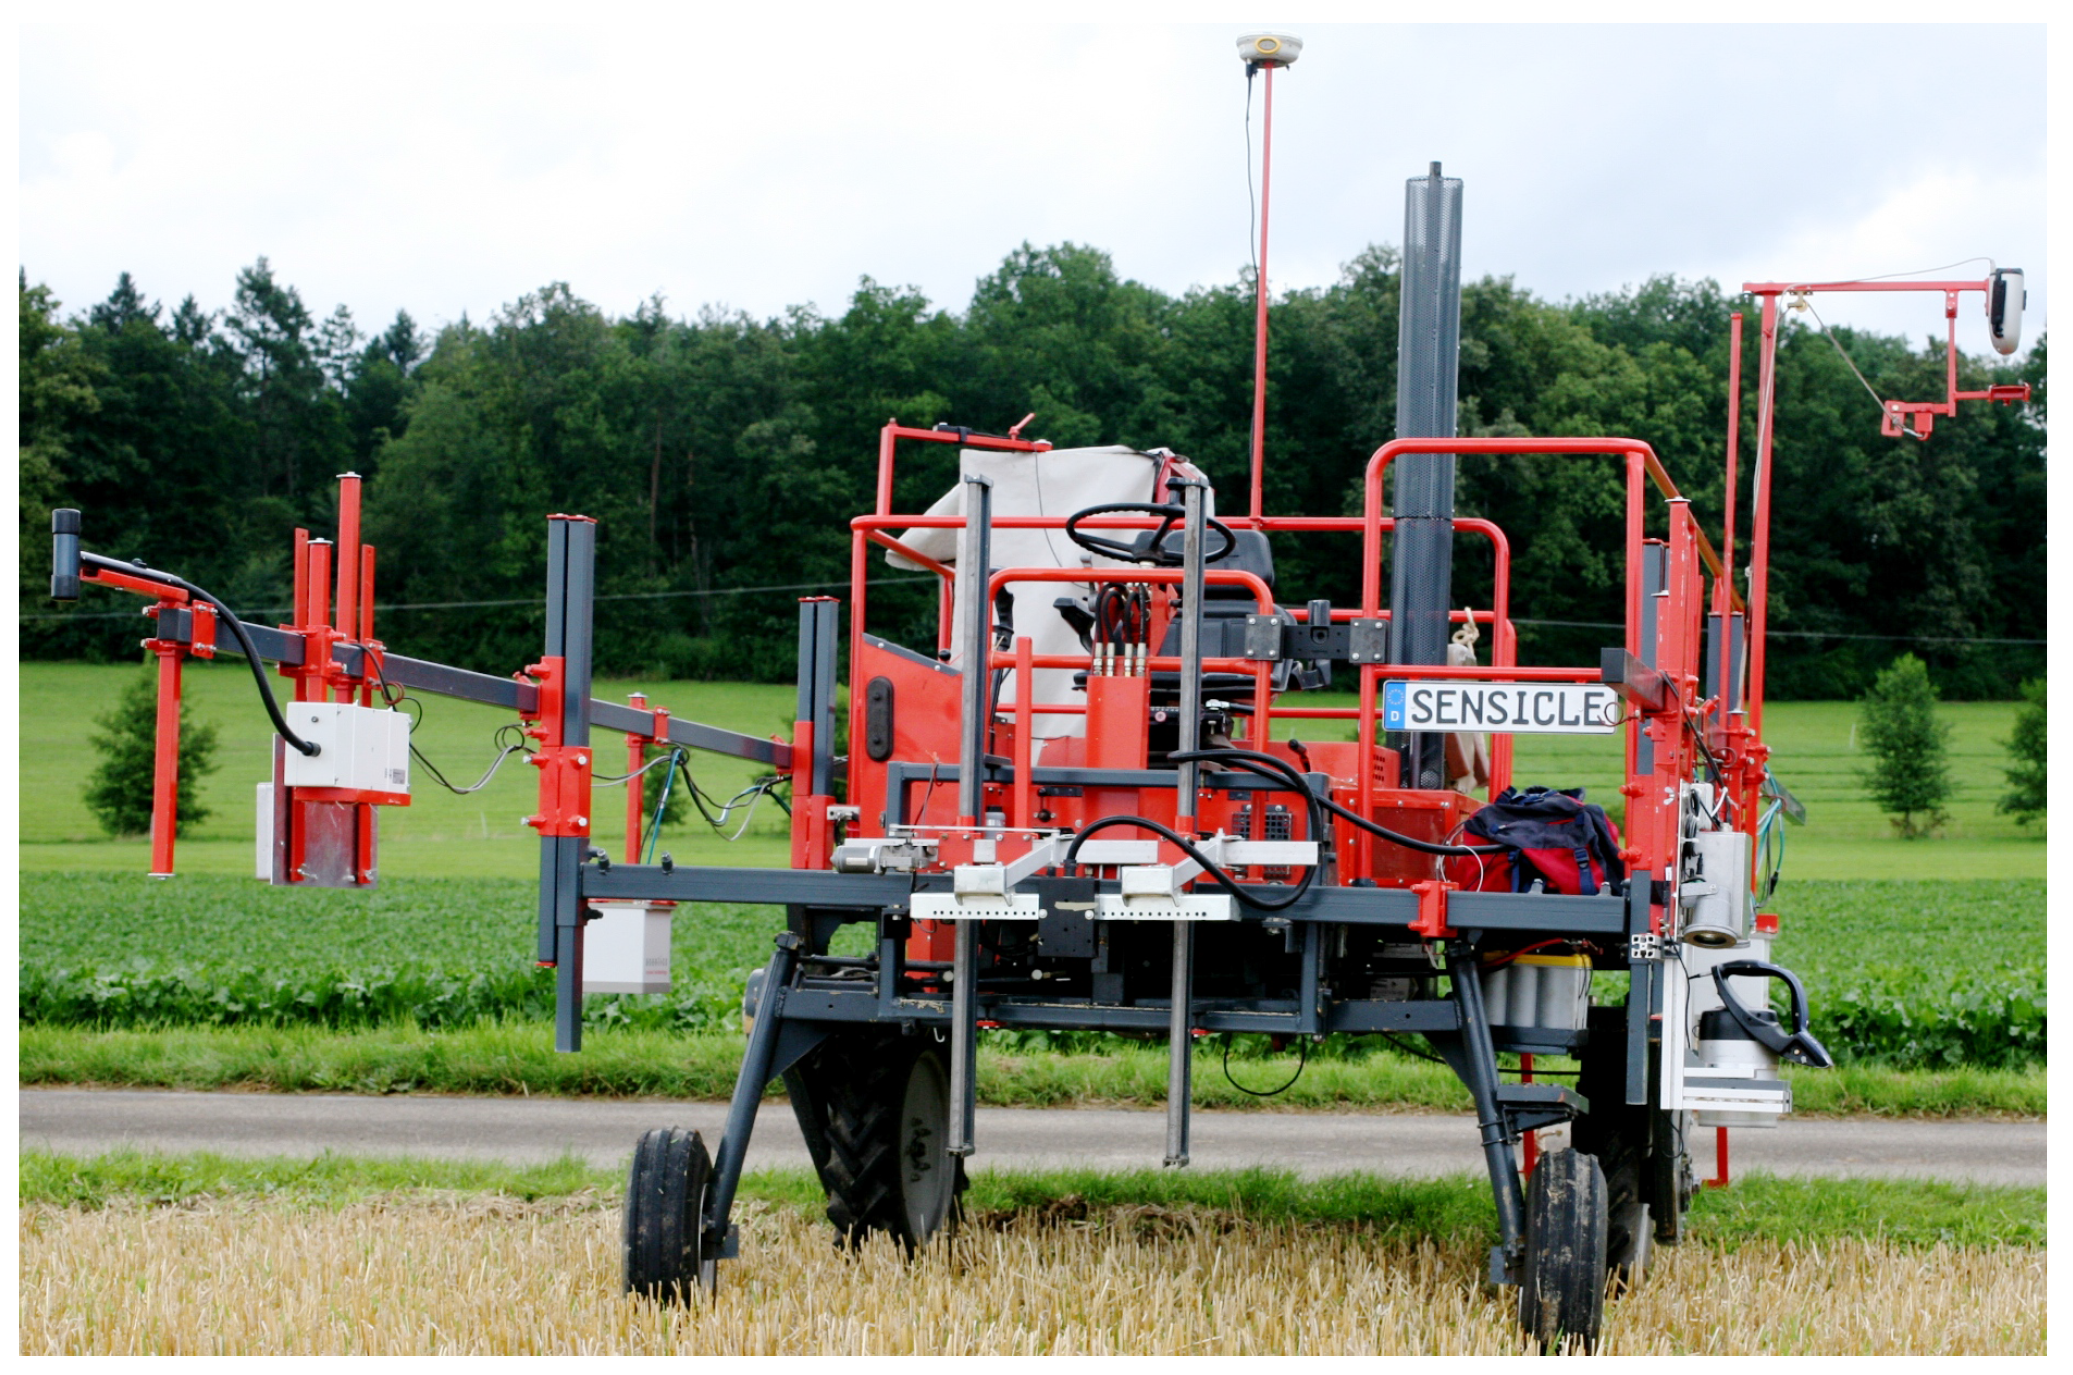
Fernandez-Jaramillo et al. [35] have reviewed chlorophyll fluorescence sensing methods, concluding in the broad application area; e.g., for the detection of environmental impacts, as well as the need for an embedded sensor system to reduce measurement efforts. The used fluorescence sensor Multiplex Research is a mobile embedded sensor. It was fixed on the “Sensicle” such that the opening was always touching the canopy surface. So, while driving, the plants passed directly within the 8 cm diameter (50 cm) opening of the sensor, in a defined distance to its detection zone. The fluorometer was set to continuous measurement mode. It records twelve fluorescence signals and calculates chosen ratios [36]. Each fluorescence signal value contained the mean of 125 single measurements. Several light-emitting diodes (LEDs) at 375 nm UV-A (UV), 530 nm green (G), and 630 nm red (R) are used as light source to excite the crops. The Multiplex sensor is insensitive to ambient light, as the LED sources are pulsed and synchronized to the detection [37]. In comparison to the calculated vegetation indices of spectrometers, the three synchronized detectors of this fluorescence sensor record the ratios based on fluorescence emission at blue-green (BGF), red (RF) and far-red (FRF). The following indices of the sensor have been used: chlorophyll fluorescence excitation ratio (FER), linked to shielding of leaves by polyphenolics and flavonols; nitrogen balance index (NBI), linked to epidermal phenolics and chlorophyll contents; simple fluorescence or chlorophyll ratio (SFR), linked to the chlorophyll content; and FERARI and flavonol index (FLAV) as logarithms of FRF and FER. The subindex denotes the wavelength excitation of the LEDs.
2.5. Data Analysis
For calculation of the indices from the raw sensor values, the R packages hyperSpec [39] and ggplot2 [40] have been used. Statistical analysis procedures of linear and polynomial regressions, as well as an analysis of variance (ANOVA) were applied to the indices of the spectrometers and the fluorometer to distinguish between the N treatments, measurement dates, yield, available N, and the N uptake of the biomass. The focus is on sensor comparison.
3. Results
The following will present the results of the field investigations carried out in the years 2010, 2011, and 2012 at the research station Ihinger Hof, Renningen (Germany).
Three sensors were used in the three seasons of field research. Each sensor had to be connected or handled in a different manner, in order to be able to gather valuable data (see Table 2).
3.1. Field Conditions
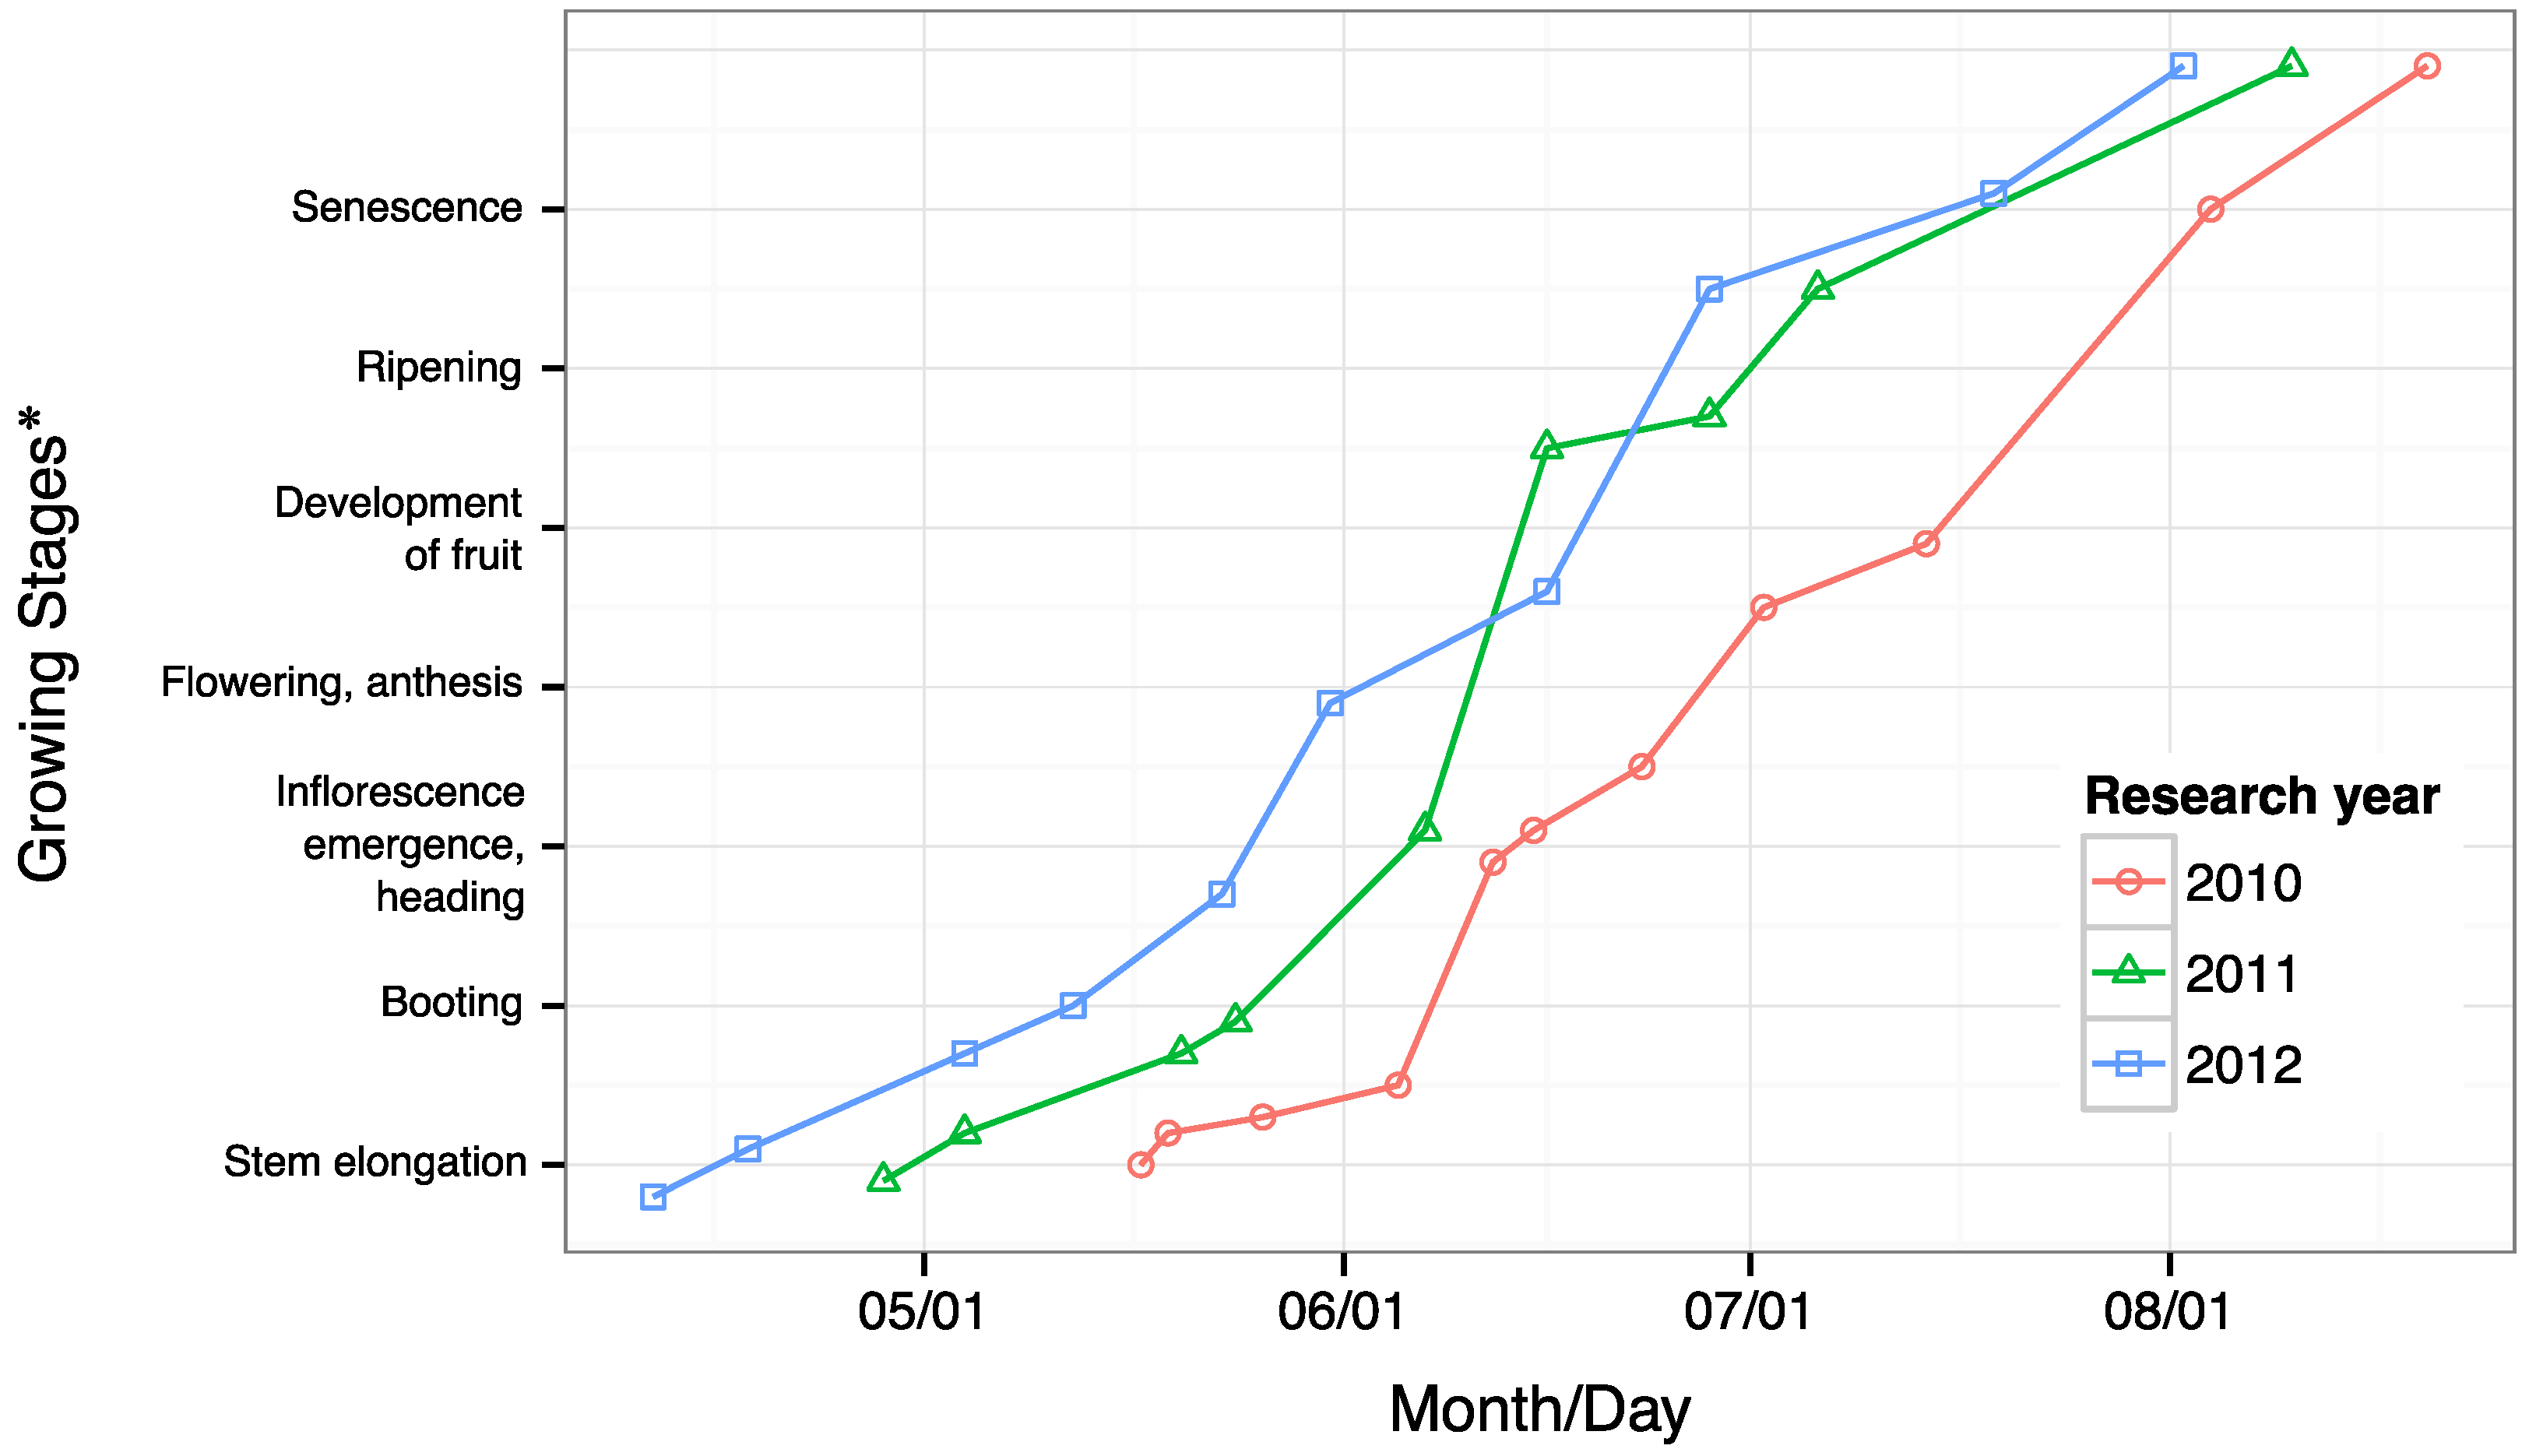
The average growth of the wheat plants over the three years of field trials can be seen below (Figure 3), represented in the international growing stages scale (Zadoks-scale) [16,17]. From a plant development perspective, each year the stem elongation started half a month earlier than the previous year. The growing conditions over the three years of field trials were very similar, with sufficient rainfall and no period of drought.
Table 3 shows the mean yield data as well as the protein content of the three experimental years. In 2010, the experimental field Inneres Taele (IT) showed a higher field variability in terms of crop density and soil type than the experimental field Lammwirt (LW) in 2010 and 2012. Furthermore, the increase in the average yield and protein content in the IT field in 2011 did not vary as much between the different N treatments as for the LW field in 2010 and 2012. This can be seen in the mean yield data of field IT in 2011, especially for the treatment area with 60 kg N ha.
For all replications, the yield had its maximum at 170 kg N ha. The protein content for the years 2010 and 2011 increased over all N replications from 60 to 180 kg N ha. Less protein was metabolized in the year 2012 in the LW field in the plots with 180 kg N ha.
The following two subsections refer specifically to the example of the data of investigation year three (2012) from the LW research field.
3.2. Regression Analysis
A data analysis with a high temporal and spectral resolution results in better insight and higher significance levels. Figure 4 represents the NDVI value in correlation to the wheat yield, split by measurement dates and nitrogen amounts.
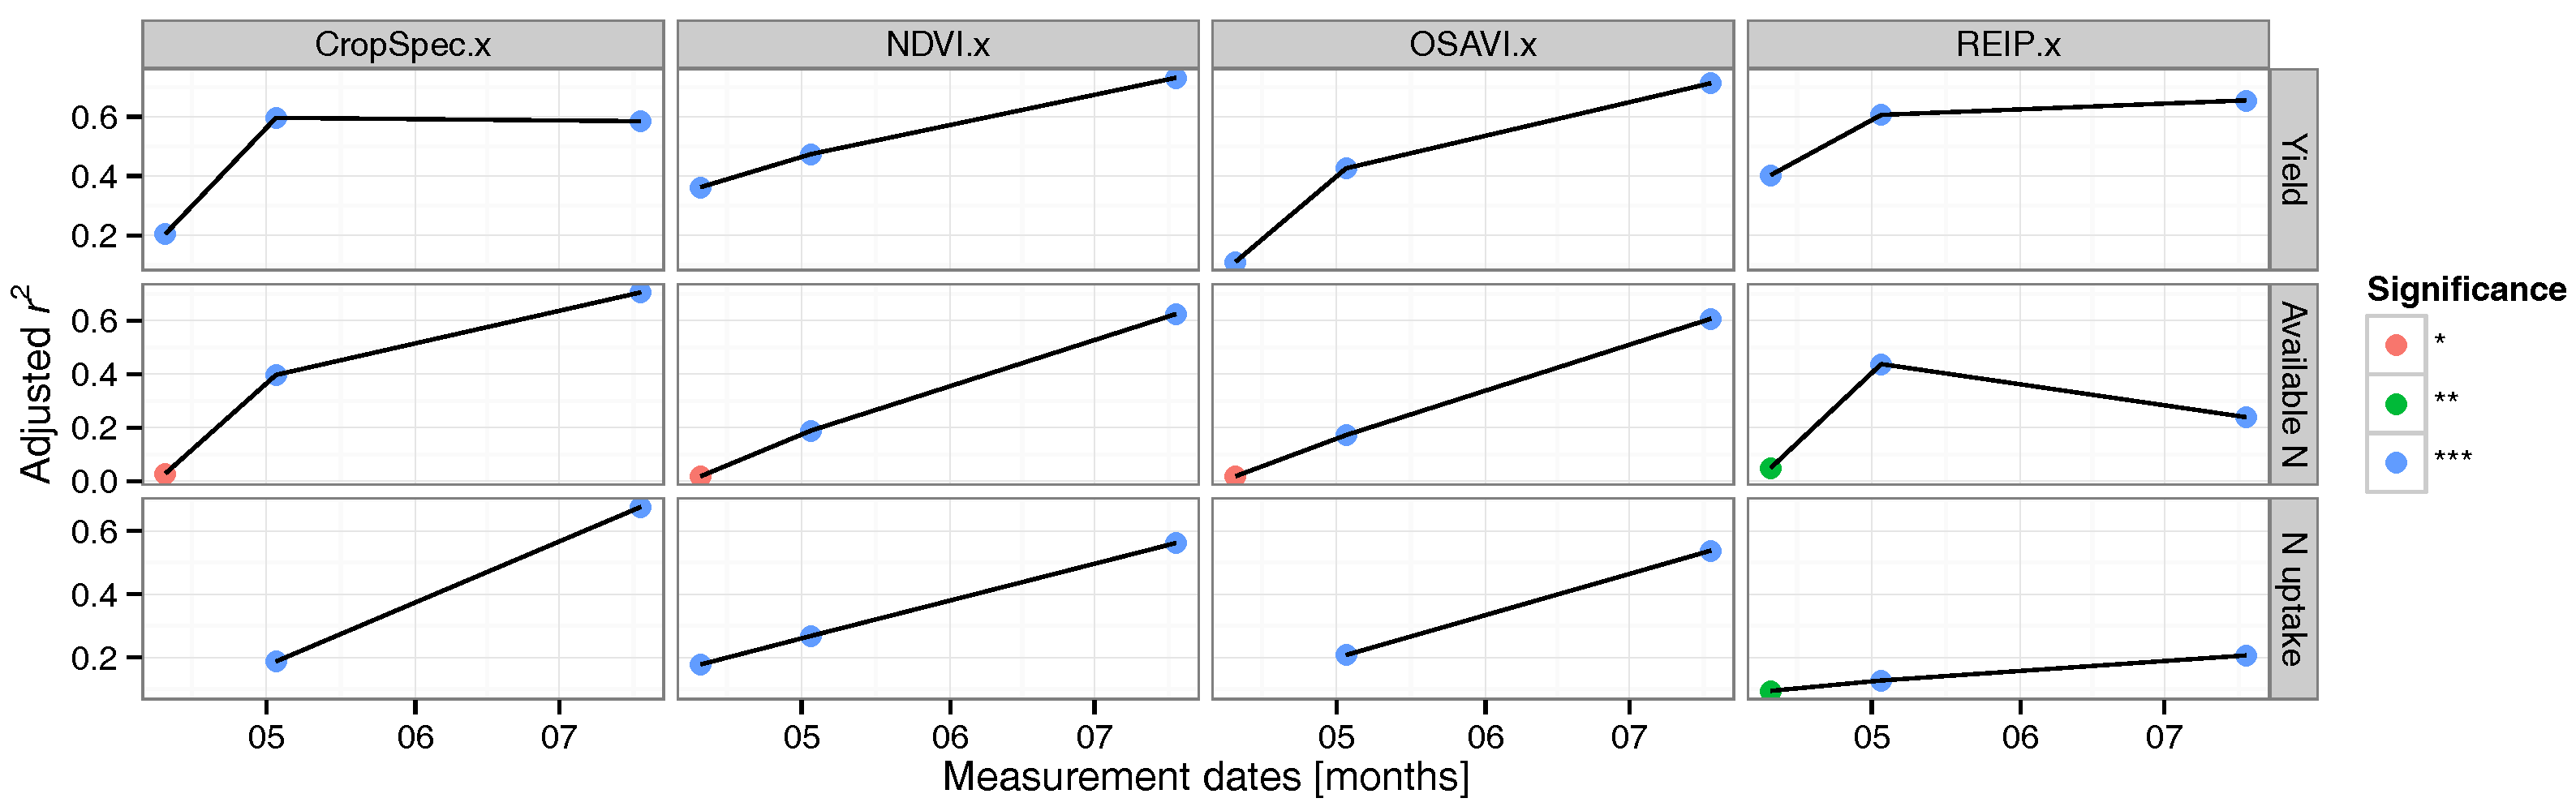
Relevant indices of the two used spectrometers are shown in Figure 5 and Figure 6, with averaged measurements over all N levels of the research field LW. The measurement dates in 2012 for the HandySpec Field (*.x) were not as frequent as for the second spectrometer, the FieldSpec HandHeld (*.y). Indices of both spectrometers did not correlate on a high level with the “N uptake”. The NDVI of the FieldSpec sensor showed an r value saturation for “Yield” and “Available N”, starting in mid-June 2012.
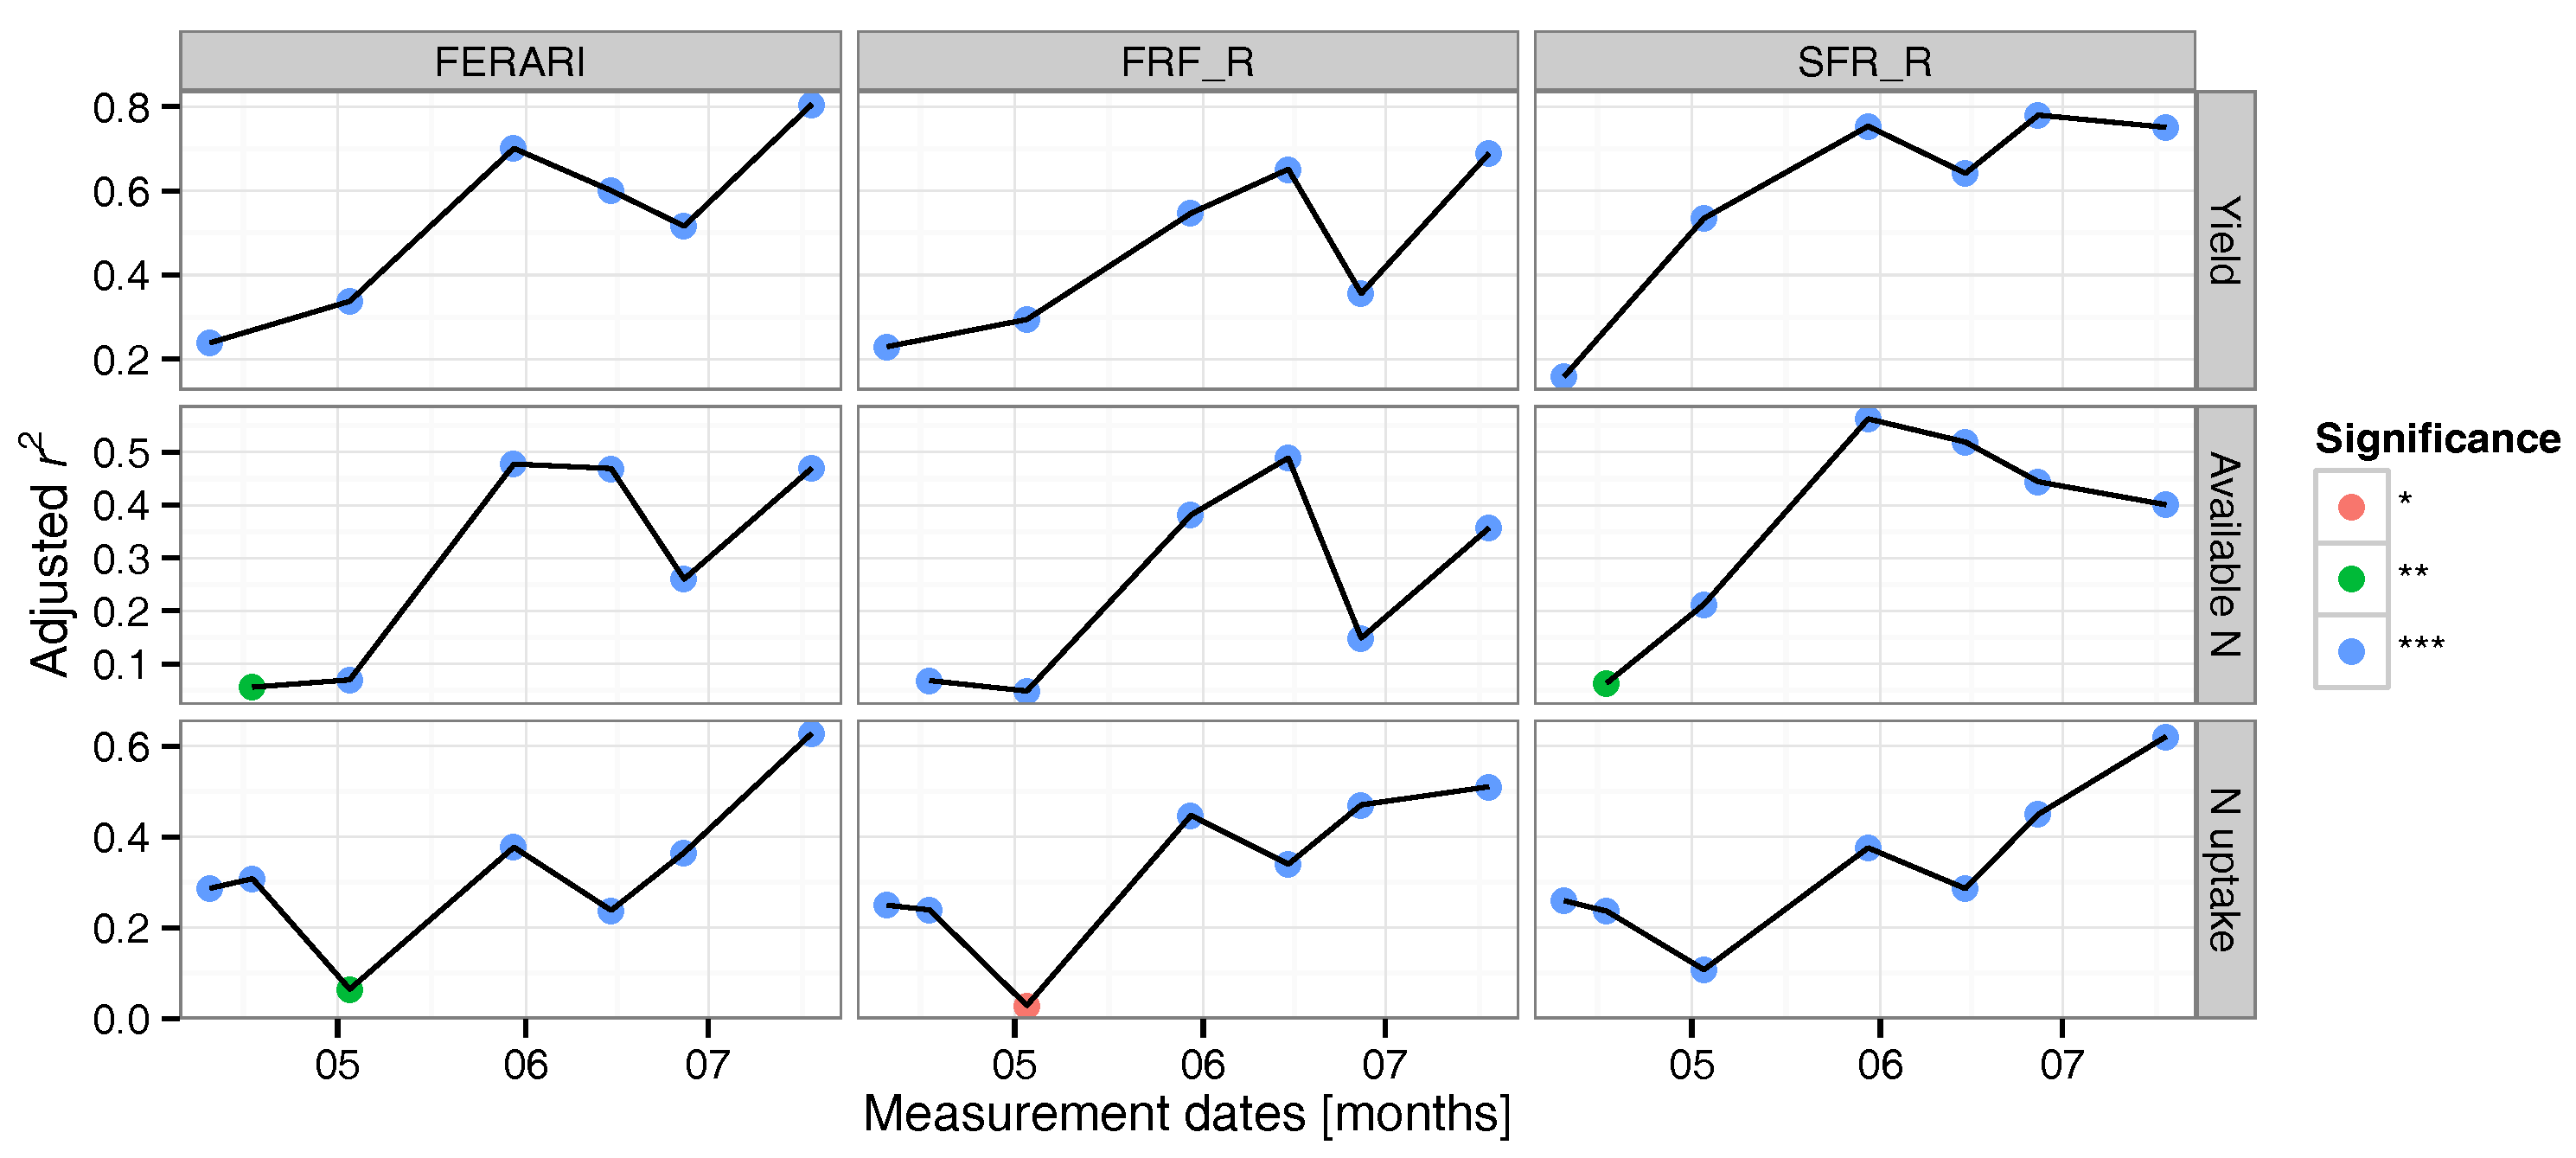
Figure 7 visualizes the important fluorescence indices in the red area of the Multiplex Research sensor during the 2012 growing season for all N levels. The further the wheat plants were developed, the more precise these indices were, and the better they could predict “Yield” or “N Uptake”; meanwhile, the prediction for “Available N” remained low.
3.3. Data Validation
The ground truth data have been added to each data set of the different measurement dates. Each data set has been intensively statistically analyzed to find the highest correlations for each field parameter. Table 4 shows the r values of three different linear regression models with one, two, and three fluorescence parameters. The fourth model takes two spectrometer indices of the FieldSpec HandHeld sensor and one fluorescence signal into account. All models are grouped by the different measurement dates in the year 2012. The parameters A, B, C, and D denominate the modeled coefficients of the linear regressions:
- Model 1:
- Model 2:
- Model 3:
- Model 4:
The models show the ability of the sensor indices to predict grain yield towards the harvested grain yield over all N levels of the research field LW.
4. Discussion
The field plots with a total applied nitrogen amount of 60 and 90 kg N ha had a similar grain yield and grain protein content (Table 3). Regarding yield, it was obvious that the additional 10 kg of N from 170 to 180 kg N ha had no effect on the grain quantity or quality. Besides the artificially-designed heterogeneity, the climatic conditions during the growing periods may have added to this effect [41].
Comparing the yield of field LW in 2010 and 2012 showed a 40% yield increase over all N varieties in 2012, hence it had a similar high yield level as field IT in 2011. The reason for the high yield in the IT research field can be explained by the previous crop in 2010, which was grain maize. Maize demands a high nitrogen supply, which may result in higher N residues in the soil at the end of the growing season. Consequently, the cultivated crop in the following year also has a higher N availability. Zhang et al. [41] investigated the important role of the crop rotation in the soil nutrient residues available to the following crop season. On both fields, maize was planted the year before. The effect of the available amount of nitrogen in the soil (N) from previous crops was not investigated further, as for example done by Sidhu and Beri [42] over the course of five years.
The sensor platform “Sensicle” (Figure 2) offers very good possibilities to take measurements with various sensors at the same time. After one season, a huge set of data was available. The correlations between all fluorescence and spectrometer indices and the ground truth data have been analyzed.
The most significant NDVI values—gathered with the mounted spectrometer FieldSpec—occurred in the stem elongation stage at the end of May (Figure 4). The lowest significance levels were in the stage of ripening, where chlorophyll is very low in the wheat plants. This identifies the NDVI once more as an index which is highly sensitive to chlorophyll (e.g., [43,44]). This high resolution in the analysis in terms of the splitting of the measurement dates and the N levels shows the highest correlations for NDVI and yield with r values of 0.63–0.95 in the N level plots between 120 and 170 kg N ha. For the plots with the lowest amount of N (60 kg N ha), except for the two measurements in June, the correlations are low with a maximum r of 0.43. In the early growing stages until mid-May, these plots showed bare patches, uneven crop development, and consequently resulted in high background noise of the soil with significantly varying reflectance data. These effects in the early growing stages are also valid for the statistical analysis of Figure 5 and Figure 6. After a closed canopy surface, the spectrometer indices (CropSpec, NDVI, OSAVI, and REIP) showed increasing values in correlation to “Yield”, “Available N”, and the “N uptake”. For 2012, the HandySpec sensor detected a continuous increasing correlation with the ground truth data “Yield” and “Available N”. Haboudane et al. [30] found that the OSAVI index is very sensitive to chlorophyll and is very resistant to LAI and illumination. In the field trials, OSAVI showed a similar pattern to NDVI and CropSpec index (Figure 5 and Figure 6). The CropSpec index—developed by Reusch et al. [18] and integrated into a commercially available sensor for agricultural usage—correlated highly at the early growing stage with “Yield” and “Available N”, and continued its performance until plant ripening started. The REIP index showed high correlations—especially in June and July, where the chlorophyll content was high. In the early crop season, the REIP index was in a similar r value range, from 0.4 to 0.5, as the NDVI. All presented indices show their saturation at full crop development at the end of June, and the REIP index for “Available N” and “N uptake” even at an earlier stage. For the “N uptake” of the plant, analyzed in the laboratory, the spectrometer indices correlated only on a low level with r between 0.1 and 0.55, having a maximum with NDVI at 0.63 in mid-May.
The strength of fluorescence measurements is their ability to sense information that cannot be sensed in other ways (e.g., how environmental stresses have damaged the photosynthetic apparatus) [45]. The analysis of the Multiplex fluorescence sensor data reveal better correlations to the ground truth data, as can be seen in Figure 7. Fluorescence techniques have been applied for nutrition detection purposes in agriculture for some years. Buschmann et al. [46] analyzed fluorescence emissions of plants by imaging blue, green, and red fluorescence. Tremblay et al. [14] provided a detailed review of the fluorescence measurement techniques, also discussing the results of the Multiplex Research fluorescence sensor. They concluded with a recommendation for this technique, as it allows for highly sensitive N information measurements, independent of background signal disturbances. Peteinatos et al. [28] investigated (amongst others) the significant signal differences between nitrogen-stressed and non-stressed plants. The FERARI index and the SFR index have a high level of correlation with the measured yield. The later the growing season, the better are the FERARI correlations for all three crop parameters. For the N uptake of the plant, all three indices—FERRARI, FRF and SFR—have a similar progression of the correlation. For the available N and the yield, all three values reach a saturation in June.
In the early developmental stages, all three sensors show low correlations with yield. The open crop canopy, with the bare soil in the background, may interfere too much. At the last measurement date, the grain was already in the senescence stage, with a lower content of chlorophyll. The indices of the FieldSpec Handheld sensor had higher correlations with “Yield” and “Available N” in the later development stages (Adj. r of 0.5–0.8) than the indices of the HandySpec Field sensor (Adj. r of 0.4–0.65). Reasons for this may be the minor quantity of measurement data, but also the lower sensor footprint area. For Model 4 (Section 3.3), only the CropSpec and HVI indices of the FieldSpec Handheld sensor could be used to get significant correlations with “Yield”. The Multiplex sensor indices correlate on a high level with “Yield” (Adj. r of 0.6–0.8).
Due to these high correlations, the authors developed equations with the NBI, FERARI, and FLAV indices of the Multiplex sensor and the CropSpec and HVI indices of the FieldSpec Handheld sensor, in order to enable a good yield prediction (Table 4). The combination of three fluorescence indices in a linear model showed the highest performance in the investigated field data set. The high correlation clearly shows the advantage of a good prediction capability for a sensor with active light emission and a close contact with the crop canopy. Combining two spectrometer indices together with a fluorescence signal also resulted in high correlations with r values of 0.5–0.8 for the main growing season. Based on the equations, two sensors—or even more units in a row could be connected to work together as a fertilizer spreading system in the field for the early and main growing season of wheat.
5. Conclusions
The results of this paper have been obtained from trials conducted in the agricultural fields of a university research station, which has been integrated into the production cycle. Therefore, the data analysis may show a higher variability than data gathered in pot experiments or defined greenhouse conditions. The aim was to gain experience for the used sensors in real-time conditions, as well as to check and verify their usability for agricultural farm vehicles later on.
Out of the three used sensors on the Sensicle vehicle platform, the FieldSpec HandHeld spectrometer was the most complex (Table 2). In the version used, the required software was only compatible with a PC with Windows NT operating system. The sensor had to be connected to a computer via a serial cable, which was not necessary for the other two sensors used. Due to the necessary white reference measurements in changing illumination conditions, continuous measurements required stops for calibration. The FieldSpec HandHeld and the HandySpec Field spectrometers in their current hardware configuration are not usable on conventional farm equipment. Furthermore, their field of view is too low, considering the working widths of modern fertilizer spreaders between 12 and 40 m. Regarding usability and mobility, the Multiplex Research fluorescence sensor is more convenient for larger field measurement areas. The fluorescence sensor required only one calibration measurement at the beginning and only had to be mounted at canopy height. Then, the measurement could be set up continuously. This will allow—with several sensors over the whole working width—a useful integration into an application system containing a tractor and an implement. Both spectrometers require a high knowledge about their usage, the data processing, and decision making. For an average farm, this may be too much time, and would require a dedicated data specialist for integration into the field applications as well as the import of the work order by the machines.
The spectrometers and fluorescence sensor gathered better data over a closed crop canopy. Regarding the fertilizer application, the early development stages are the important ones to support a good crop development and a high yield potential. An active light source enables continuous and longer measurements, especially as the illumination in field conditions often changes. The NDVI was highly correlated with the wheat yield for the N variants between 120 and 170 kg ha until end of May, where the chlorophyll content was very high. This effect is and has been used in the first sensor systems for fertilizer applications. The OSAVI and CropSpec indices have a similar result pattern to NDVI. They are used in modern agricultural sensors (e.g., with active light sources). For the fluorescence sensing, the FERARI index and the SFR index had a high correlation level with the measured yield. These two indices, as well as FRF, reached a saturation in June. In the linear model, the combination of three fluorescence indices as well as the combination of two spectrometer signals and one fluorescence signal are a promising method for wheat yield prediction. The objectives of this study were met. The sensors, ground truth data, and prediction models will be further investigated.
The necessary fast processing units for converting the algorithms into decisions—being the basis for a spreader or a sprayer—are additional efforts that must be developed in order to have these or other new sensors available for use on farms. Currently, a great deal of expertise is still necessary to use the sensors correctly. (1) Calibration measurement(s) may be required (e.g., at changing illumination); (2) Export of the data from the sensor and importing them into software; (3) Connecting the sensor to a RTK-GPS system or ground referencing the data set afterwards; (4) Analyzing the data; and (5) Deriving decisions (e.g., for the next growing season and the fertilizer applications). Further field tests and the implementation into existing board computers of agricultural vehicles (e.g., via the ISO 11783 (ISOBUS) standard) are required to make these sensors a success in farming.
Acknowledgments
The authors thank the Carl-Zeiss-Foundation (Carl-Zeiss-Stiftung, Germany) for funding this work as part of the collaborative project SenGIS at the University of Hohenheim (Stuttgart, Germany). A special thanks to the Force-A company (Orsay, France) for their technical support, as well as to all colleagues within the SenGIS team, namely to Johanna Link-Dolezal, Martin Weis, Gerassimos Peteinatos, Markus Jackenkroll, Jakob Geipel and Andrea Richter for all their support.
Author Contributions
Christoph W. Zecha gathered the field data, made the statistical analysis and wrote the manuscript. Johanna Link proposed the field trial design, supported the statistical analysis, and wrote the introduction. Wilhelm Claupein proposed the idea for this study and supported with editorial contributions.
Conflicts of Interest
The authors declare no conflict of interest.
References
- Baker, N.R.; Rosenqvist, E. Applications of chlorophyll fluorescence can improve crop production strategies: An examination of future possibilities. J. Exp. Bot. 2004, 55, 1607–1621. [Google Scholar] [CrossRef] [PubMed]
- Macdonald, A.J.; Powlson, D.S.; Poulton, P.R.; Jenkinson, D.S. Unused fertiliser nitrogen in arable soils—Its contribution to nitrate leaching. J. Sci. Food Agric. 1989, 46, 407–419. [Google Scholar] [CrossRef]
- Reusch, S. ENtwicklung eines Reflexionsoptischen Sensors zur Erfassung der Stickstoffversorgung Landwirtschaftlicher Kulturpflanzen (Development of an Optical Reflectance Sensor for Recording the Nitrogen Supply of Agricultural Crops). Ph.D. Thesis, Department of Agricultural Systems Engineering, University of Kiel, Kiel, Germany, 1997. [Google Scholar]
- Sheffield, C. Selecting band combinations from multispectral data. Photogramm. Eng. Remote Sens. 1985, 51, 681–687. [Google Scholar]
- Guyot, G.; Baret, F.; Jacquemoud, S. Imaging spectroscopy for vegatation studies. In Imaging Spectroscopy: Fundamentals and Prospective Applications; Springer: Dordrecht, The Netherlands, 1992; pp. 145–165. [Google Scholar]
- Gitelson, A.A.; Gritz, Y.; Merzlyak, M.N. Relationships between leaf chlorophyll content and spectral reflectance and algorithms for non-destructive chlorophyll assessment in higher plant leaves. J. Plant Physiol. 2003, 160, 271–282. [Google Scholar] [CrossRef] [PubMed]
- Ben Ghozlen, N.; Cerovic, Z.G.; Germain, C.; Toutain, S.; Latouche, G. Non-destructive optical monitoring of grape maturation by proximal sensing. Sensors 2010, 10, 10040–10068. [Google Scholar] [CrossRef] [PubMed]
- Bürling, K.; Cerovic, Z.G.; Cornic, G.; Ducruet, J.M.; Noga, G.; Hunsche, M. Fluorescence-based sensing of drought-induced stress in the vegetative phase of four contrasting wheat genotypes. Environ. Exp. Bot. 2013, 89, 51–59. [Google Scholar] [CrossRef]
- Thomas, J.; Gausman, H. Leaf Reflectance vs. Leaf Chlorophyll and Carotenoid Concentrations for Eight Crops. Agron. J. 1977, 69, 799–802. [Google Scholar] [CrossRef]
- Broge, N.H.; Mortensen, J.V. Deriving green crop area index and canopy chlorophyll density of winter wheat from spectral reflectance data. Remote Sens. Environ. 2002, 81, 45–57. [Google Scholar] [CrossRef]
- Yao, X.; Yao, X.; Jia, W.; Tian, Y.; Ni, J.; Cao, W.; Zhu, Y. Comparison and intercalibration of vegetation indices from different sensors for monitoring above-ground plant nitrogen uptake in winter wheat. Sensors 2013, 13, 3109–3130. [Google Scholar] [CrossRef] [PubMed]
- Rasmussen, P.E.; Ramig, R.E.; Allmaras, R.R.; Smith, C.M. Nitrogen-Sulfur Relations in Soft White Winter Wheat. II. Initial and Residual Effects of Sulfur Application on Nutrient Concentration, Uptake, and N/S Ratio. Agron. J. 1975, 67, 224–228. [Google Scholar] [CrossRef]
- Corp, L.A.; McMurtrey, J.E.; Middleton, E.M.; Mulchi, C.L.; Chappelle, E.W.; Daughtry, C.S.T. Fluorescence sensing systems: In vivo detection of biophysical variations in field corn due to nitrogen supply. Remote Sens. Environ. 2003, 86, 470–479. [Google Scholar] [CrossRef]
- Tremblay, N.; Wang, Z.; Cerovic, Z.G. Sensing crop nitrogen status with fluorescence indicators. A review. Agron. Sustain. Dev. 2011, 32, 451–464. [Google Scholar] [CrossRef]
- Christensen, L.; Bennedsen, B.; Jørgensen, R.; Nielsen, H. Modelling nitrogen and phosphorus content at early growth stages in spring barley using hyperspectral line scanning. Biosyst. Eng. 2004, 88, 19–24. [Google Scholar] [CrossRef]
- Zadoks, J.C.; Chang, T.T.; Konzak, C.F. A decimal code for the growth stages of cereals. Weed Res. 1974, 14, 415–421. [Google Scholar] [CrossRef]
- Witzenberger, A.; Hack, H.; van den Boom, T. Erläuterungen zum BBCH-Dezimal-Code für die Entwicklungsstadien des Getreides - mit Abbildungen. Gesunde Pflanzen 1989, 41, 384–388. [Google Scholar]
- Reusch, S.; Jasper, J.; Link, A. Estimating crop biomass and nitrogen uptake using Cropspec, a newly developed active crop-canopy reflectance sensor. In Proceedings of the 10th International Conference on Positron Annihilation (ICPA), Denver, CO, USA, 18–21 July 2010; p. 381. [Google Scholar]
- Sharabian, V.R.; Noguchi, N.; Han-Ya, I.; Ishi, K. Evaluation of an active remote sensor for monitoring winter wheat growth status. Eng. Agric. Environ. Food 2013, 6, 118–127. [Google Scholar] [CrossRef]
- Reckleben, Y. Sensors for nitrogen fertilization—Experiences of 12 years practical use (in German). J. Kulturpflanzen 2013, 2, 42–47. [Google Scholar]
- Rouse, J.; Haas, R.; Schell, J.; Deering, D. Monitoring vegetation systems in the Great Plains with ERTS. In Third ERTS Symposium; Freden, S.C., Becker, M.A., Eds.; National Aeronautics and Space Administration (NASA SP-351): Washington, DC, USA, 1973; Vol. 1, pp. 309–317. [Google Scholar]
- Moriondo, M.; Maselli, F.; Bindi, M. A simple model of regional wheat yield based on NDVI data. Eur. J. Agron. 2007, 26, 266–274. [Google Scholar] [CrossRef]
- Quebrajo, L.; Pérez-Ruiz, M.; Rodriguez-Lizana, A.; Agüera, J. An approach to precise nitrogen management using hand-held crop sensor measurements and winter wheat yield mapping in a mediterranean environment. Sensors 2015, 15, 5504–5517. [Google Scholar] [CrossRef] [PubMed]
- Thiessen, E. Optical sensing-techniques for site-specific application of agricultural chemicals (in German). Ph.D. thesis, Department of Agricultural Systems Engineering, University of Kiel, Kiel, Germany, 2002. [Google Scholar]
- Laudien, R.; Bareth, G.; Doluschitz, R. Comparison of remote sensing based analysis of crop diseases by using high resolution multispectral and hyperspectral data–case study: Rhizoctonia solani in sugar beet. In Proceedings of the 12th International Conference on Geoinformatics–Geospatial Information Research: Bridging the Pacific and Atlantic, Gävle, Sweden, 7–9 June 2004; pp. 670–676. [Google Scholar]
- Gitelson, A.A.; Merzlyak, M.N.; Lichtenthaler, H.K. Detection of red edge position and chlorophyll content by reflectance measurements near 700 nm. J. Plant Physiol. 1996, 148, 501–508. [Google Scholar] [CrossRef]
- Zarco-Tejada, P.; Miller, J.; Morales, A.; Berjón, A.; Agüera, J. Hyperspectral indices and model simulation for chlorophyll estimation in open-canopy tree crops. Remote Sens. Environ. 2004, 90, 463–476. [Google Scholar] [CrossRef]
- Peteinatos, G.G.; Korsaeth, A.; Berge, T.W.; Gerhards, R. Using Optical Sensors to Identify Water Deprivation, Nitrogen Shortage, Weed Presence and Fungal Infection in Wheat. Agriculture 2016, 6, 24. [Google Scholar] [CrossRef]
- Huete, A. A soil-adjusted vegetation index (SAVI). Remote Sens. Environ. 1988, 25, 295–309. [Google Scholar] [CrossRef]
- Haboudane, D.; Miller, J.R.; Tremblay, N.; Zarco-Tejada, P.J.; Dextraze, L. Integrated narrow-band vegetation indices for prediction of crop chlorophyll content for application to precision agriculture. Remote Sens. Environ. 2002, 81, 416–426. [Google Scholar] [CrossRef]
- Baret, F.; Champion, I.; Guyot, G.; Podaire, A. Monitoring wheat canopies with a high spectral resolution radiometer. Remote Sens. Environ. 1987, 22, 367–378. [Google Scholar] [CrossRef]
- Darvishzadeh, R.; Atzberger, C.; Skidmore, A.; Abkar, A. Leaf Area Index derivation from hyperspectral vegetation indices and the red edge position. Int. J. Remote Sens. 2009, 30, 6199–6218. [Google Scholar] [CrossRef]
- Herrmann, I.; Pimstein, A.; Karnieli, A.; Cohen, Y.; Alchanatis, V.; Bonfil, D. LAI assessment of wheat and potato crops by VENμS and Sentinel-2 bands. Remote Sens. Environ. 2011, 115, 2141–2151. [Google Scholar] [CrossRef]
- Horler, D.N.H.; Dockray, M.; Barber, J. The red edge of plant leaf reflectance. Int. J. Remote Sens. 1983, 4, 273–288. [Google Scholar] [CrossRef]
- Fernandez-Jaramillo, A.A.; Duarte-Galvan, C.; Contreras-Medina, L.M.; Torres-Pacheco, I.; Romero-Troncoso, R.d.J.; Guevara-Gonzalez, R.G.; Millan-Almaraz, J.R. Instrumentation in developing chlorophyll fluorescence biosensing: A review. Sensors 2012, 12, 11853–11869. [Google Scholar] [CrossRef] [PubMed]
- Martinon, V.; Fadailli, E.M.; Evain, S.; Zecha, C.W. Multiplex: An innovative optical sensor for diagnosis, mapping and management of nitrogen on wheat. In Proceedings of the 8th European Conference on Precision Agriculture (ECPA), Prague, Czech Republic, 11–14 July 2011; Stafford, J.V., Ed.; Czech Centre for Science and Society: Ampthill, UK; Prague, Czech Republic, 2011; pp. 547–561. [Google Scholar]
- Agati, G.; Foschi, L.; Grossi, N.; Guglielminetti, L.; Cerovic, Z.G.; Volterrani, M. Fluorescence-based versus reflectance proximal sensing of nitrogen content in Paspalum vaginatum and Zoysia matrella turfgrasses. Eur. J. Agron. 2013, 45, 39–51. [Google Scholar] [CrossRef]
- Cerovic, Z.G.; Moise, N.; Agati, G.; Latouche, G.; Ben Ghozlen, N.; Meyer, S. New portable optical sensors for the assessment of winegrape phenolic maturity based on berry fluorescence. J. Food Compos. Anal. 2008, 21, 650–654. [Google Scholar] [CrossRef]
- Beleites, C.; Sergo, V. hyperSpec: A Package to Handle Hyperspectral Data Sets in R.’, R Package Version 098-20150304, 2016. Available online: https://cran.r-project.org/web/packages/hyperSpec/hyperSpec.pdf (accessed on 20 September 2017).
- Wickham, H. ggplot2: Elegant Graphics for Data Analysis; Springer: New York, NY, USA, 2009. [Google Scholar]
- Zhang, X.; Wang, S.; Sun, H.; Chen, S.; Shao, L.; Liu, X. Contribution of cultivar, fertilizer and weather to yield variation of winter wheat over three decades: A case study in the North China Plain. Eur. J. Agron. 2013, 50, 52–59. [Google Scholar] [CrossRef]
- Sidhu, B.; Beri, V. Effect of crop residue management on the yields of different crops and on soil properties. Biol. Wastes 1989, 27, 15–27. [Google Scholar] [CrossRef]
- Hansen, P.; Schjoerring, J. Reflectance measurement of canopy biomass and nitrogen status in wheat crops using normalized difference vegetation indices and partial least squares regression. Remote Sens. Environ. 2003, 86, 542–553. [Google Scholar] [CrossRef]
- Ferwerda, J.G.; Skidmore, A.K.; Mutanga, O. Nitrogen detection with hyperspectral normalized ratio indices across multiple plant species. Int. J. Remote Sens. 2005, 26, 4083–4095. [Google Scholar] [CrossRef]
- Maxwell, K.; Johnson, G.N. Chlorophyll fluorescence—A practical guide. J. Exp. Bot. 2000, 51, 659–668. [Google Scholar] [CrossRef] [PubMed]
- Buschmann, C.; Langsdorf, G.; Lichtenthaler, H. Imaging of the Blue, Green, and Red Fluorescence Emission of Plants: An Overview. Photosynthetica 2000, 38, 483–491. [Google Scholar] [CrossRef]
Figure 1.
Layout of the experimental field design, here shown for the “Lammwirt” field. The numbers within the plots show the applied nitrogen dosage per year, expressed in kg ha. The total N amount has been split into three passages over the field. The varieties with 60 to 180 kg N ha (N1 to N5) have been randomly distributed besides the conventional variety with 170 kg N ha (K).

Figure 2.
The multi-sensor platform “Sensicle” with the mounted sensors.

Figure 3.
Wheat growing stages (Zadoks-scale) for the three years of field experiments. Only the main growing stages appear in the graphic. Each symbol on the graph represents the date of measurement. The last measurements were taken right before the harvest. * Germination, leaf development, and tillering stages are not shown.

Figure 4.
Adjusted r values for normalized difference vegetation index (NDVI) of measurement period 2012 in wheat (Triticum aestivum L.) field “Lammwirt”, gathered with FieldSpec HandHeld spectrometer, class-divided by measurement dates and nitrogen input. Adj. r shows the percentage of variation explained by the independent variable (NDVI) that affect the dependent variable (yield).
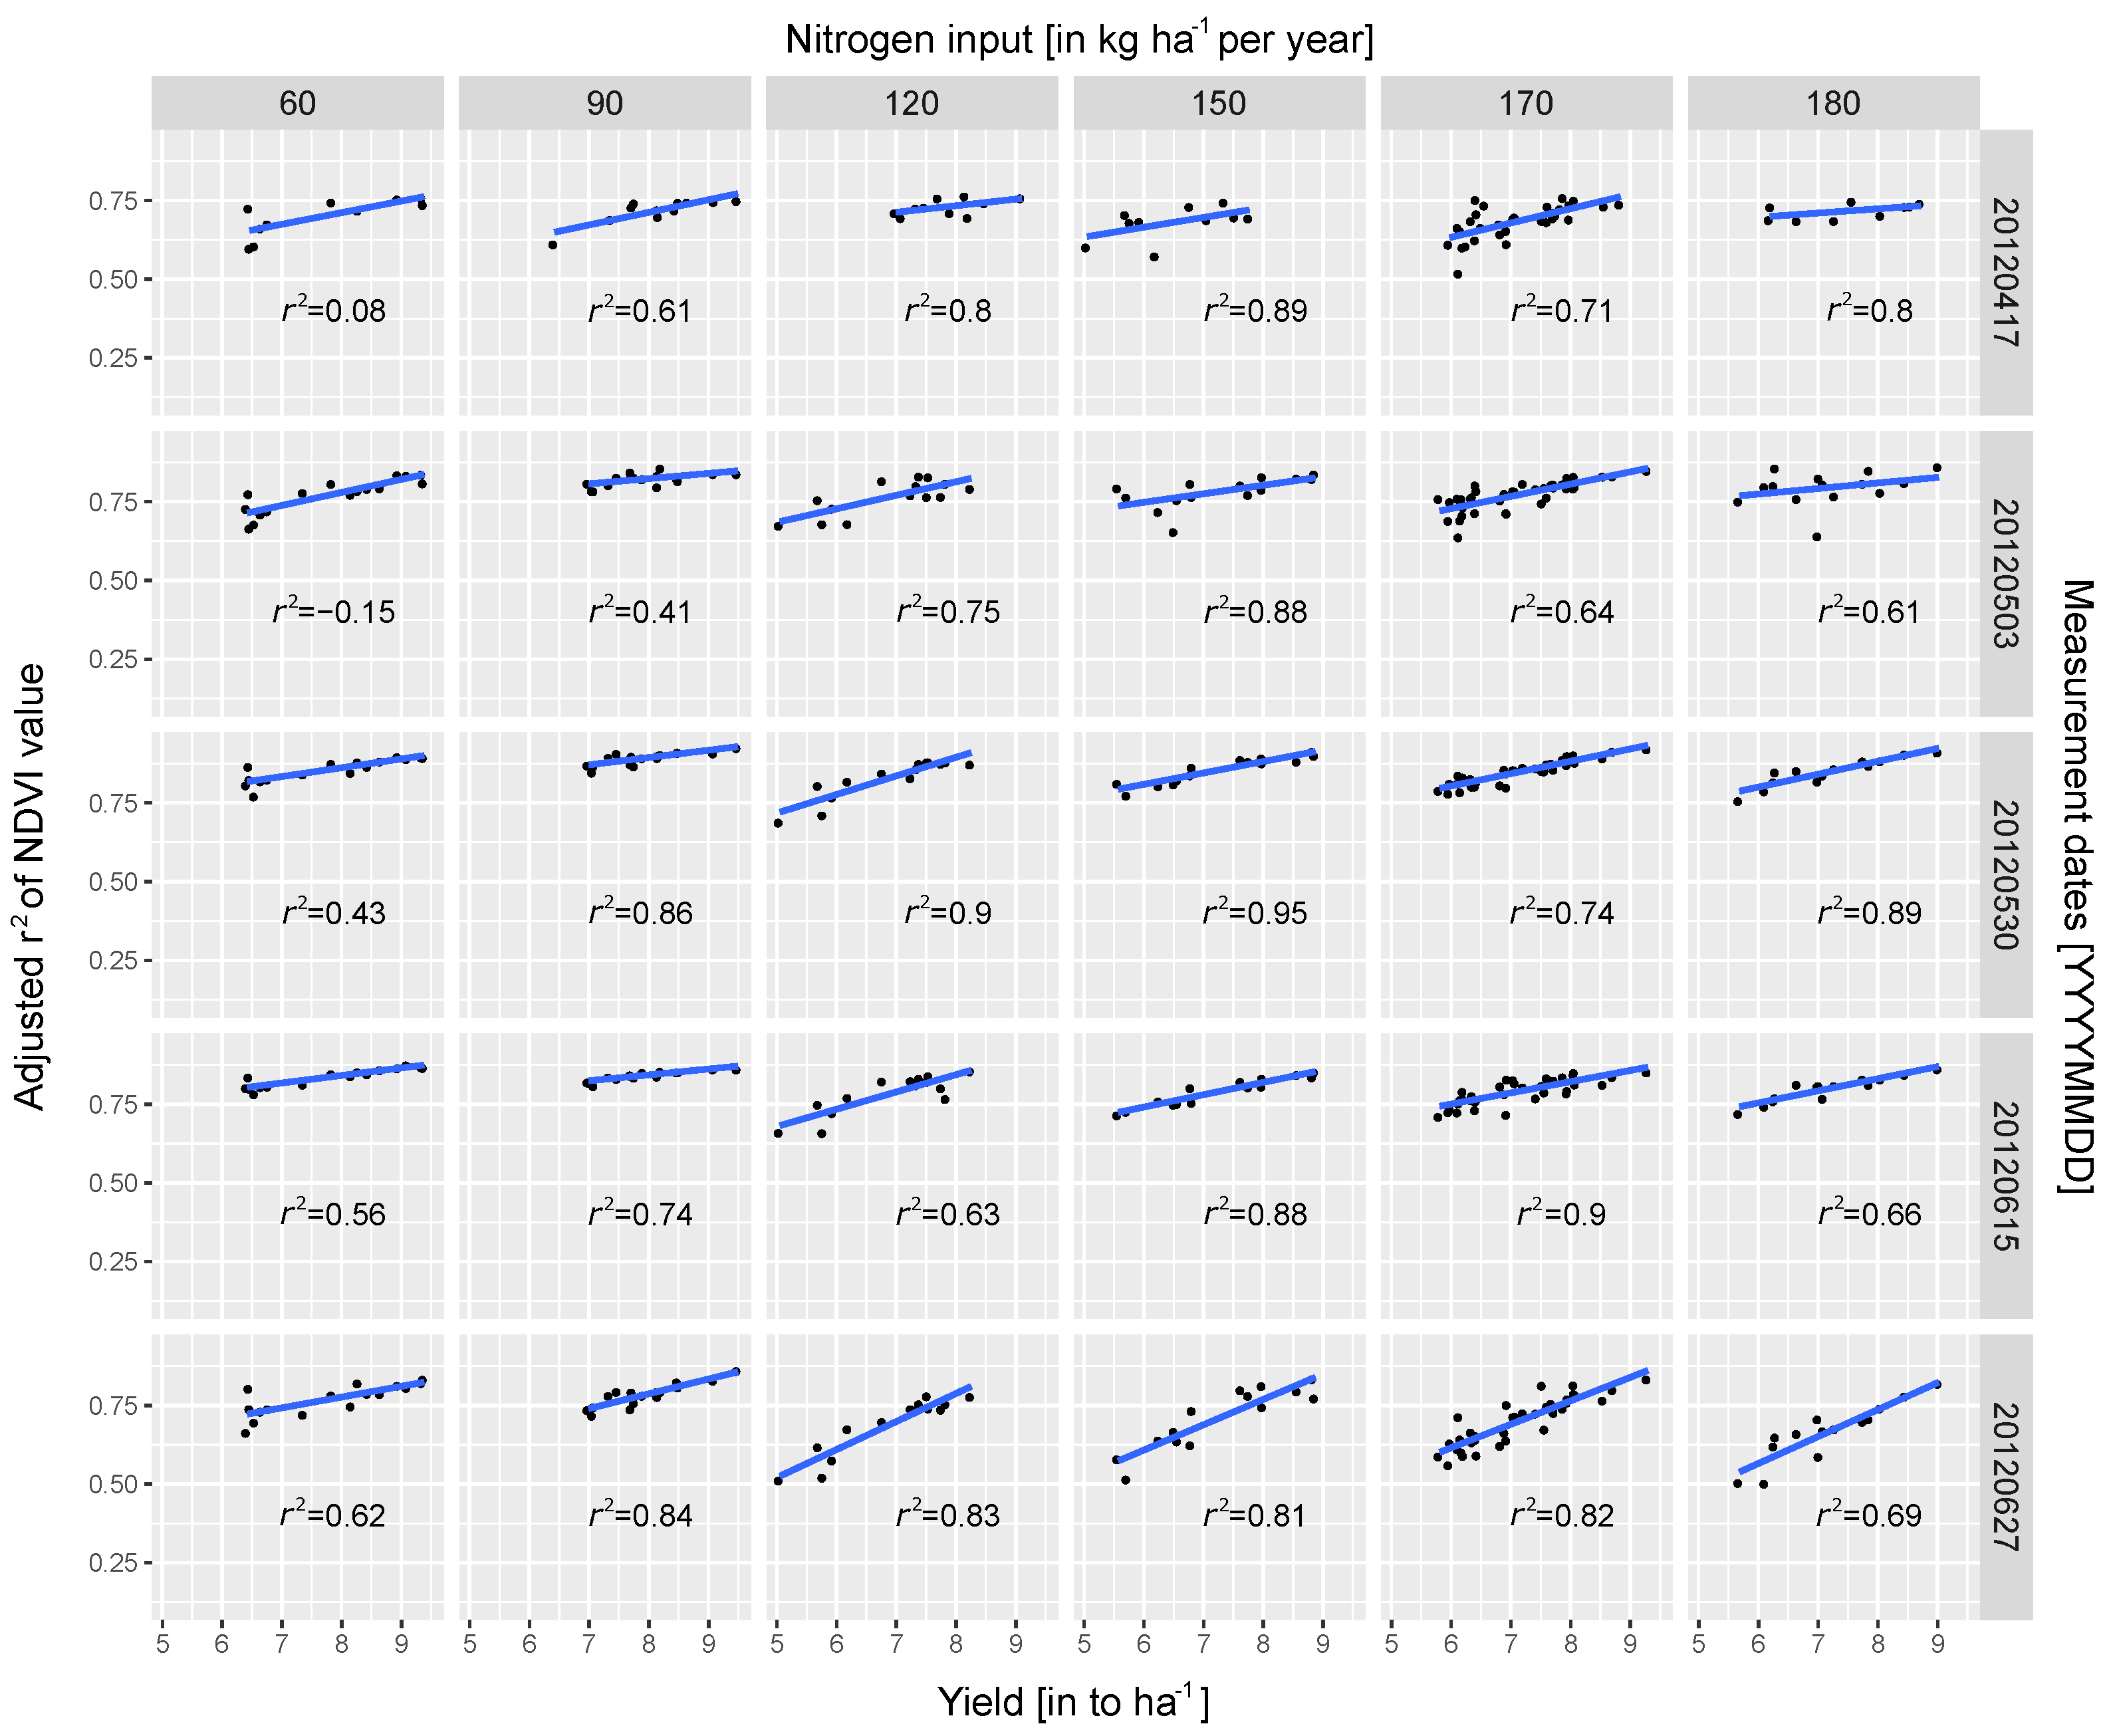
Figure 5.
Adjusted r values for indices of HandySpec Field (*.x) sensor over the 2012 measurement period. The colour expresses the different significance levels: *** p-value < 0.001; ** p-value < 0.01; * p-value < 0.05.
Figure 5.
Adjusted r values for indices of HandySpec Field (*.x) sensor over the 2012 measurement period. The colour expresses the different significance levels: *** p-value < 0.001; ** p-value < 0.01; * p-value < 0.05.

Figure 6.
Adjusted r values for indices of FieldSpec HandHeld (*.y) sensor over the 2012 measurement period. The colour expresses the different significance levels: *** p-value < 0.001; ** p-value < 0.01; * p-value < 0.05.
Figure 6.
Adjusted r values for indices of FieldSpec HandHeld (*.y) sensor over the 2012 measurement period. The colour expresses the different significance levels: *** p-value < 0.001; ** p-value < 0.01; * p-value < 0.05.
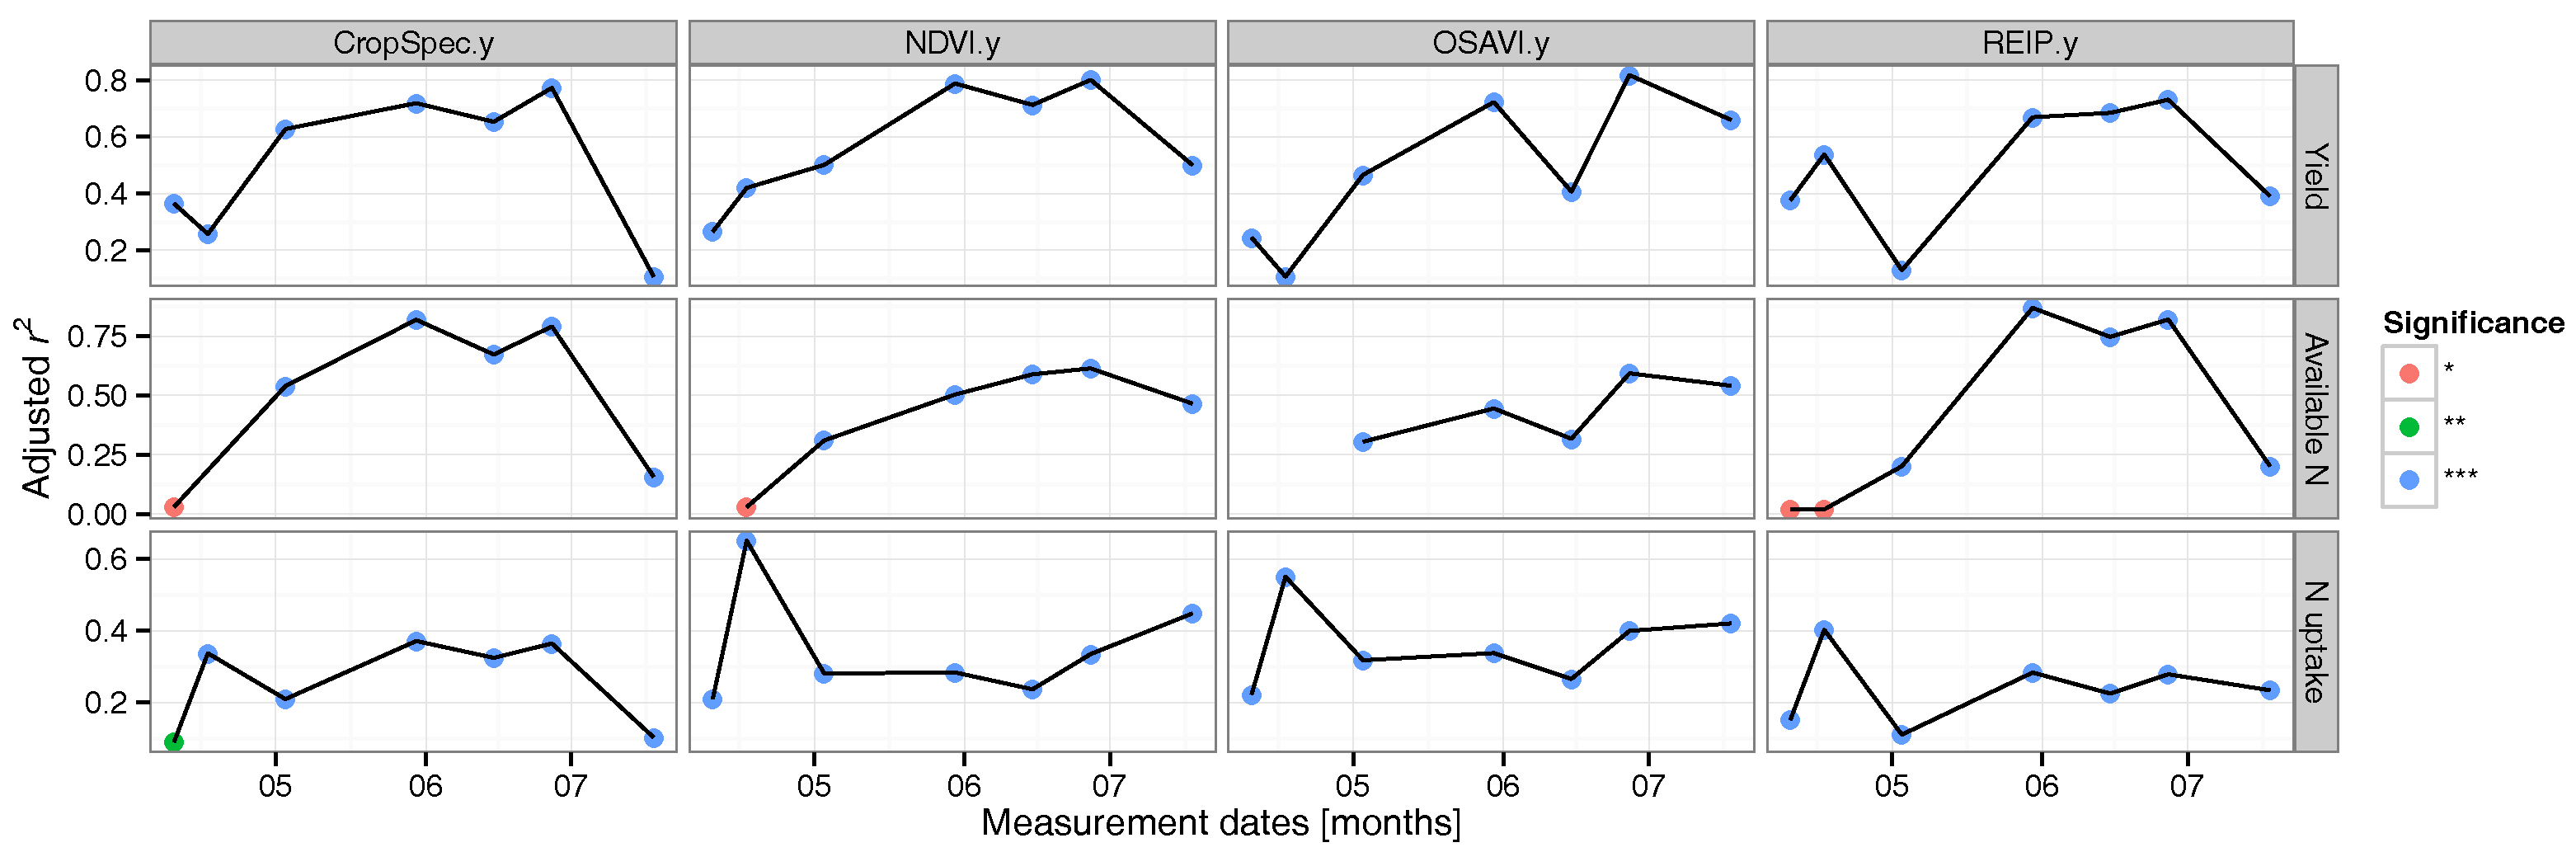
Figure 7.
Adjusted r values for indices of Multiplex Research fluorescence sensor over the 2012 measurement period. The colour expresses the different significance levels: *** p-value < 0.001; ** p-value < 0.01; * p-value < 0.05.
Figure 7.
Adjusted r values for indices of Multiplex Research fluorescence sensor over the 2012 measurement period. The colour expresses the different significance levels: *** p-value < 0.001; ** p-value < 0.01; * p-value < 0.05.


Table 1.
Used sensor devices and sensor details.
| Type | Manufacturer | Sensor Model | Wavelength Range | Wavelength Accuracy | Classification |
|---|---|---|---|---|---|
| Spectrometry | Analytical Spectral Devices | FieldSpec Handheld | 325–1075 nm | 1 nm | Passive |
| tec5 AG | HandySpec Field® | 360–1000 nm | 10 nm | Passive | |
| Fluorescence | Force-A | Multiplex Research | Blue-Green (BGF), Red (RF) and Far-Red (FRF) | – | Active |
Table 2.
Ease of use of the three used sensors and their handling capabilities.
| Sensor | Operating System | Connectivity | Ease of Use |
|---|---|---|---|
| FieldSpec HandHeld | Windows NT | Serial cable to PC | Complex (–) |
| HandySpec Field® | All | SD Card | Easy (0) |
| Multiplex Research | All | SD Card | Simple (+) |
Table 3.
Average grain yield (t ha) and grain protein content (% in dry matter) of winter wheat (Triticum aestivum L.) for six different N levels during three years of field experiment. “IT” marks the experimental field “Inneres Taele”, “LW” the experimental field “Lammwirt”. Both fields are located at Ihinger Hof, Renningen, Germany.
| Parameter | Field | Year | Annual Nitrogen Application in kg ha | |||||
|---|---|---|---|---|---|---|---|---|
| 60 | 90 | 120 | 150 | 170 | 180 | |||
| Yield | LW | 2010 | 3.6 | 3.9 | 4.4 | 4.5 | 4.9 | 4.5 |
| IT | 2011 | 7.2 | 6.7 | 6.7 | 7.1 | 7.3 | 7.3 | |
| LW | 2012 | 6.2 | 6.5 | 7.5 | 7.8 | 7.9 | 7.9 | |
| Protein | LW | 2010 | 11.2 | 11.9 | 12.3 | 14.1 | 14.8 | 15.5 |
| IT | 2011 | 13.5 | 13.5 | 14.3 | 13.9 | 14.7 | 14.7 | |
| LW | 2012 | 9.1 | 10.1 | 11.4 | 12.7 | 13.6 | 13.2 | |
Table 4.
r values of four linear regression models with fluorescence and spectrometer indices, grouped by the different measurement dates in the year 2012 on field LW. All linear models are significant with p-values < 0.05.
Table 4.
r values of four linear regression models with fluorescence and spectrometer indices, grouped by the different measurement dates in the year 2012 on field LW. All linear models are significant with p-values < 0.05.
| Date | 17 April 2012 | 3 April 2012 | 30 May 2012 | 15 June 2012 | 27 June 2012 | 18 July 2012 |
|---|---|---|---|---|---|---|
| Model 1 | 0.11 | 0.38 | 0.62 | 0.57 | 0.51 | 0.74 |
| Model 2 | 0.12 | 0.48 | 0.63 | 0.58 | 0.52 | 0.76 |
| Model 3 | 0.22 | 0.52 | 0.64 | 0.59 | 0.54 | 0.76 |
| Model 4 | 0.53 | 0.53 | 0.80 | 0.76 | 0.78 | 0.21 |
© 2017 by the authors. Licensee MDPI, Basel, Switzerland. This article is an open access article distributed under the terms and conditions of the Creative Commons Attribution (CC BY) license (http://creativecommons.org/licenses/by/4.0/).
Share and Cite
MDPI and ACS Style
Zecha, C.W.; Link, J.; Claupein, W. Fluorescence and Reflectance Sensor Comparison in Winter Wheat. Agriculture 2017, 7, 78. https://doi.org/10.3390/agriculture7090078
AMA Style
Zecha CW, Link J, Claupein W. Fluorescence and Reflectance Sensor Comparison in Winter Wheat. Agriculture. 2017; 7(9):78. https://doi.org/10.3390/agriculture7090078
Chicago/Turabian StyleZecha, Christoph W., Johanna Link, and Wilhelm Claupein. 2017. "Fluorescence and Reflectance Sensor Comparison in Winter Wheat" Agriculture 7, no. 9: 78. https://doi.org/10.3390/agriculture7090078
Note that from the first issue of 2016, this journal uses article numbers instead of page numbers. See further details here.