Bamboo Biochar Pyrolyzed at Low Temperature Improves Tomato Plant Growth and Fruit Quality

 ,
,  ,
,
Abstract
: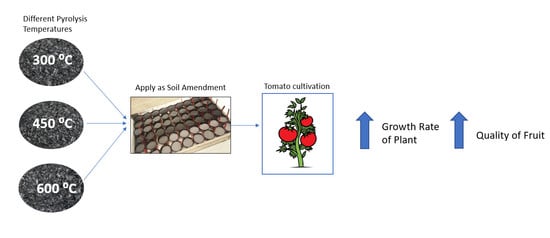
1. Introduction
2. Materials and Methods
2.1. Biochar Production and Characterization
2.2. Growth Media
2.3. Tomato Production
2.4. Fruit Quality Analysis
2.5. Statistical Analysis
3. Results & Discussion
3.1. Biochar Properties
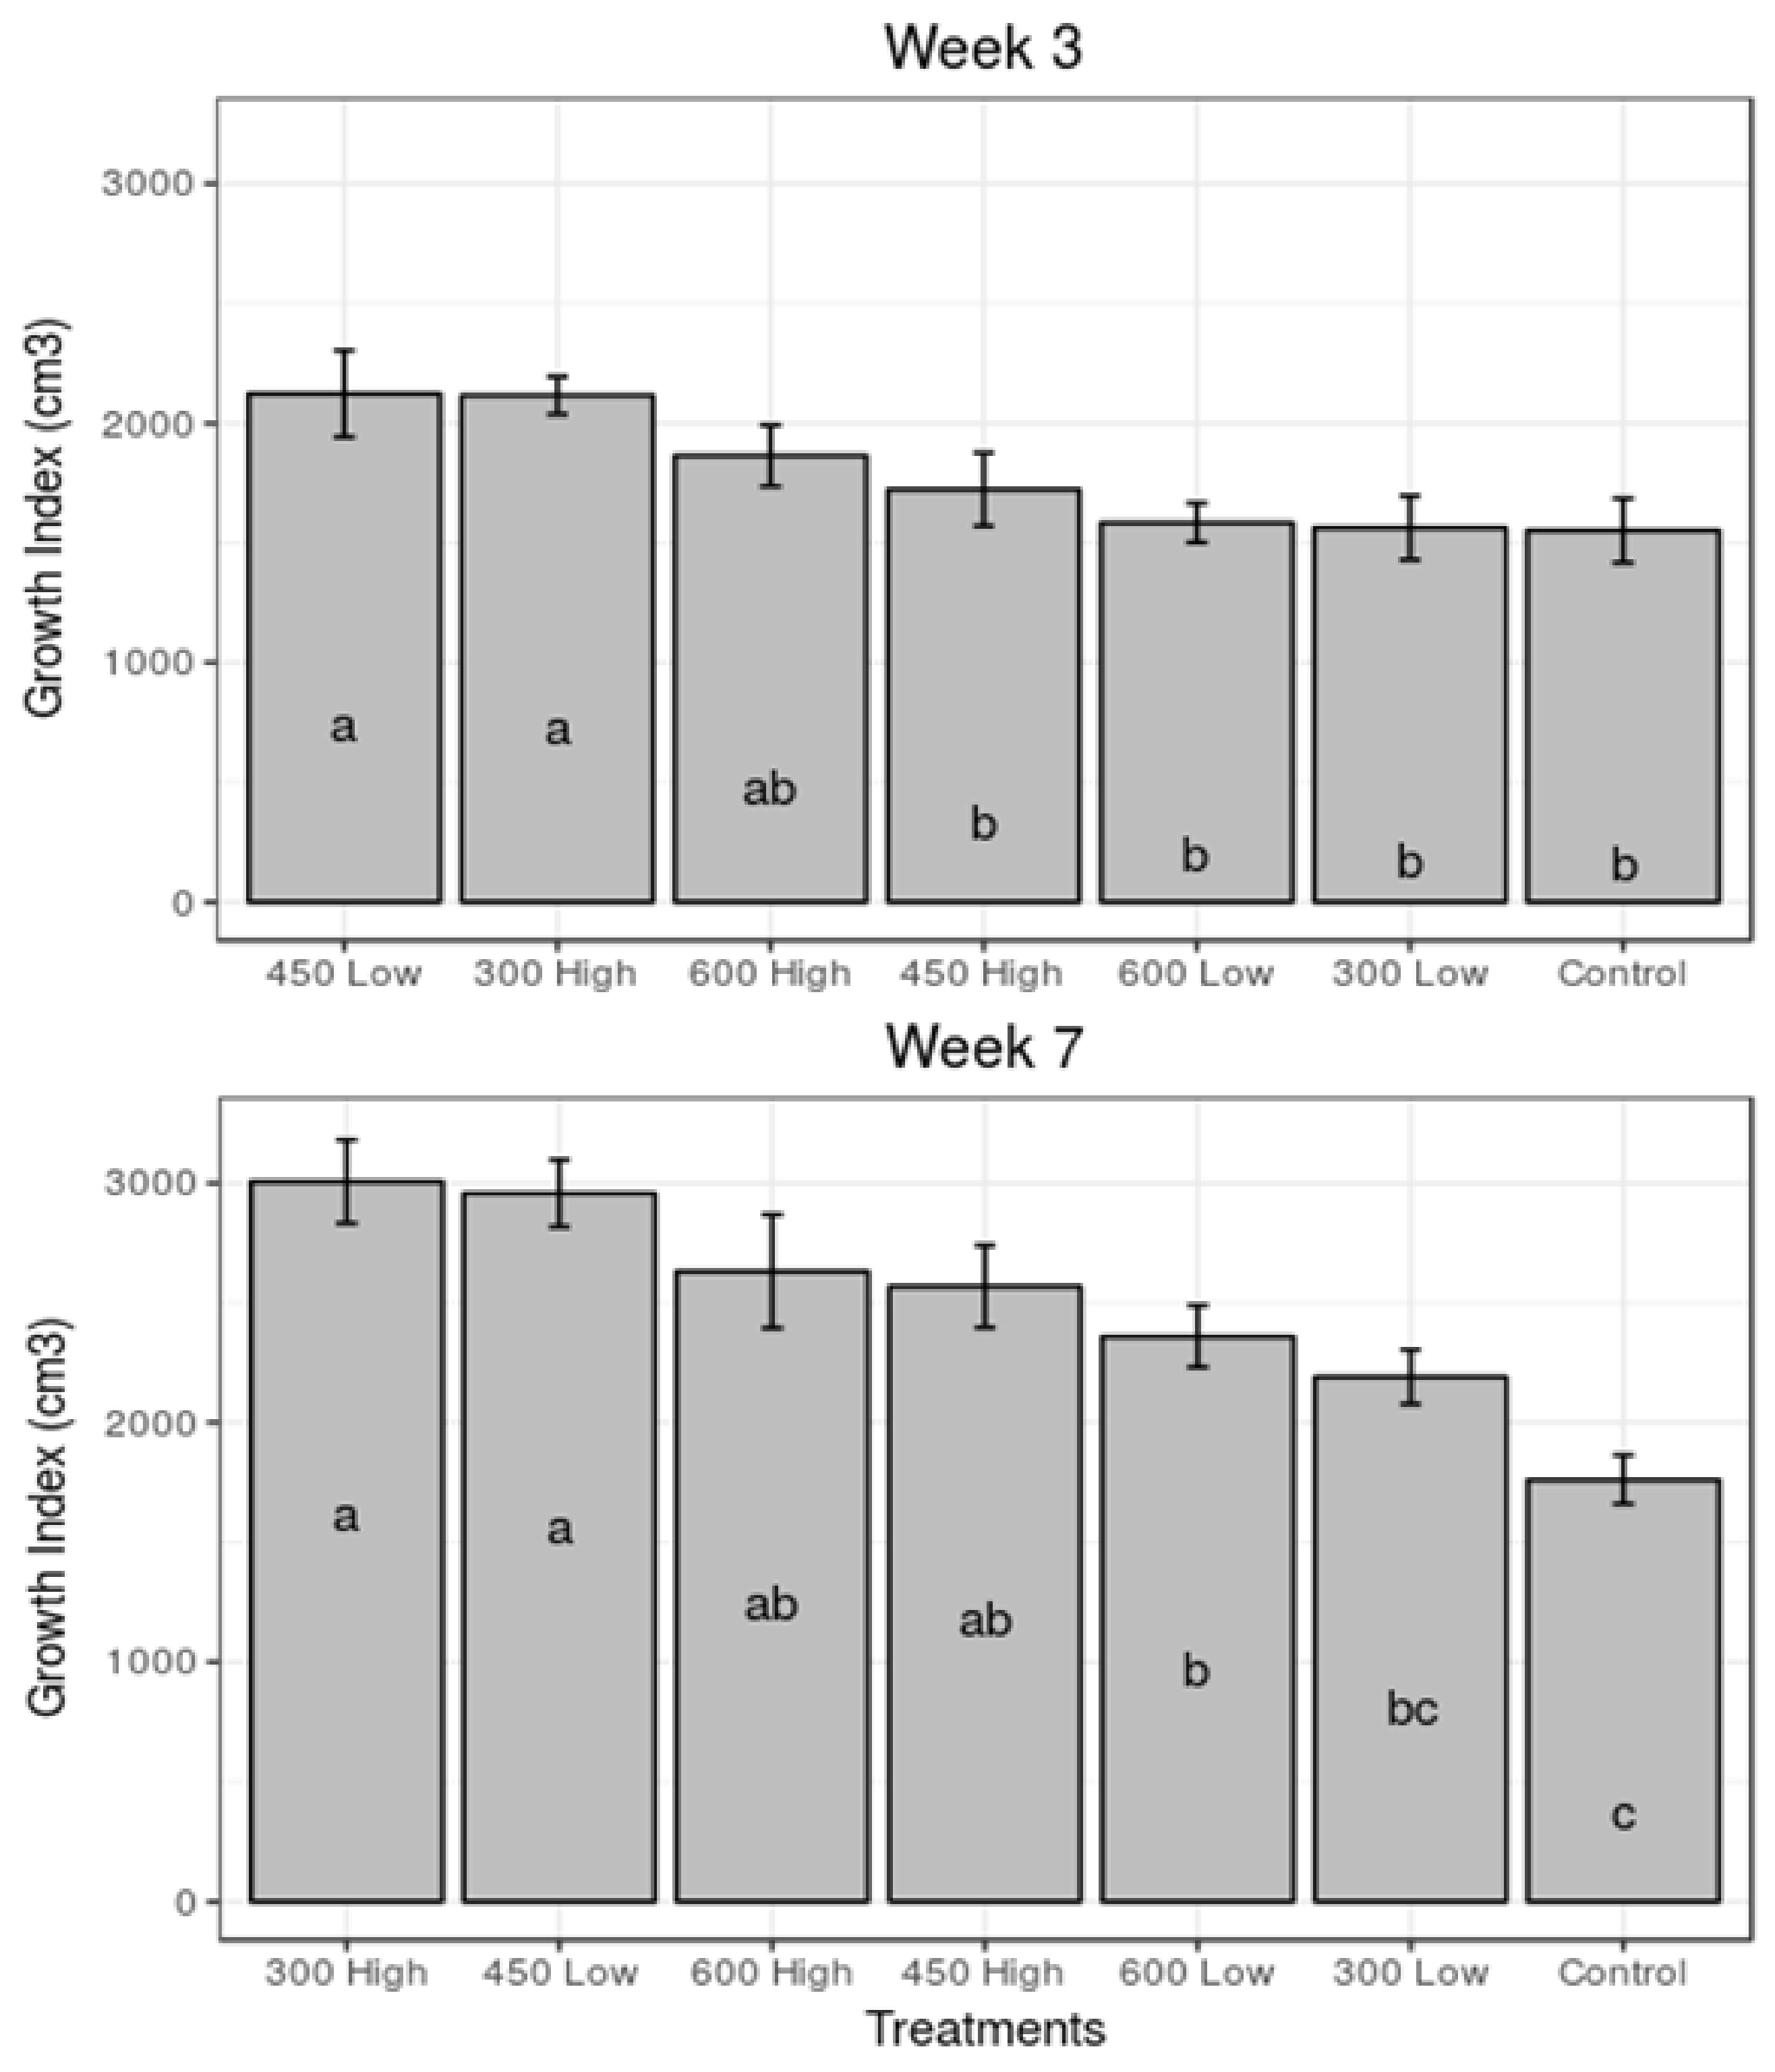
3.2. Plant Growth
3.3. Fruit Quality at Harvest
4. Conclusions
Author Contributions
Funding
Conflicts of Interest
References
- Hussain, M.; Farooq, M.; Nawaz, A.; Al-Sadi, A.M.; Solaiman, Z.M.; Alghamdi, S.S.; Ammara, U.; Ok, Y.S.; Siddique, K.H. Biochar for crop production: Potential benefits and risks. J. Soils Sediments 2017, 17, 685–716. [Google Scholar] [CrossRef]
- Lehmann, J. Bio-energy in the black. Front Ecol. Environ. 2007, 5, 381–387. [Google Scholar] [CrossRef] [Green Version]
- Sohi, S.P.; Krull, E.; Lopez-Capel, E.; Bol, R. A Review of Biochar and Its Use and Function in Soil. Adv. Agron. 2010, 105, 47–82. [Google Scholar]
- Spokas, K.A. Review of the stability of biochar in soils: Predictability of O: C molar ratios. Carbon Manage. 2010, 1, 289–303. [Google Scholar] [CrossRef]
- Lehmann, J.; Joseph, S. Biochar for Environmental Management: Science, Technology and Implementation. Routledge: New York, UK, USA, 2015. [Google Scholar]
- Downie, A.; Crosky, A.; Munroe, P. Physical Properties of Biochar. In Biochar for Environmental Management: Science and Technology; Lehmann, J., Joseph, S., Eds.; Routledge: New York, NY, USA, 2009; pp. 13–32. [Google Scholar]
- Wang, S.S.; Gao, B.; Zimmerman, A.R.; Li, Y.C.; Ma, L.N.; Harris, W.G.; Migliaccio, K.W. Physicochemical and sorptive properties of biochars derived from woody and herbaceous biomass. Chemosphere 2015, 134, 257–262. [Google Scholar] [CrossRef] [PubMed] [Green Version]
- Sun, Y.; Gao, B.; Yao, Y.; Fang, J.; Zhang, M.; Zhou, Y.; Chen, H.; Yang, L. Effects of feedstock type, production method, and pyrolysis temperature on biochar and hydrochar properties. Chem. Eng. J. 2014, 240, 574–578. [Google Scholar] [CrossRef]
- Keith, A.; Singh, B.; Singh, B.P. Interactive Priming of Biochar and Labile Organic Matter Mineralization in a Smectite-Rich Soil. Environ. Sci. Technol. 2011, 45, 9611–9618. [Google Scholar] [CrossRef] [PubMed]
- Quilliam, R.S.; Marsden, K.A.; Gertler, C.; Rousk, J.; DeLuca, T.H.; Jones, D.L. Nutrient dynamics, microbial growth and weed emergence in biochar amended soil are influenced by time since application and reapplication rate. Agr. Ecosyst. Environ. 2012, 158, 192–199. [Google Scholar] [CrossRef]
- Liu, X.; Zhang, A.; Ji, C.; Joseph, S.; Bian, R.; Li, L.; Pan, G.; Paz-Ferreiro, J. Biochar’s effect on crop productivity and the dependence on experimental conditions—a meta-analysis of literature data. Plant Soil 2013, 373, 583–594. [Google Scholar] [CrossRef]
- Olmo, M.; Alburquerque, J.A.; Barrón, V.; Del Campillo, M.C.; Gallardo, A.; Fuentes, M.; Villar, R. Wheat growth and yield responses to biochar addition under Mediterranean climate conditions. Biol. Fert. Soils 2014, 50, 1177–1187. [Google Scholar] [CrossRef]
- Olmo, M.; Villar, R.; Salazar, P.; Alburquerque, J.A. Changes in soil nutrient availability explain biochar’s impact on wheat root development. Plant Soil 2016, 399, 333–343. [Google Scholar] [CrossRef]
- Schumann, A. Opportunities for biochar production and use in Florida citrus. Citrus Ind. 2012, 4, 6–9. [Google Scholar]
- Atkinson, C.J.; Fitzgerald, J.D.; Hipps, N.A. Potential mechanisms for achieving agricultural benefits from biochar application to temperate soils: a review. Plant Soil 2010, 337, 1–18. [Google Scholar] [CrossRef]
- Major, J.; Rondon, M.; Molina, D.; Riha, S.J.; Lehmann, J. Maize yield and nutrition during 4 years after biochar application to a Colombian savanna oxisol. Plant Soil 2010, 333, 117–128. [Google Scholar] [CrossRef] [Green Version]
- Spokas, K.A.; Cantrell, K.B.; Novak, J.M.; Archer, D.W.; Ippolito, J.A.; Collins, H.P.; Boateng, A.A.; Lima, I.M.; Lamb, M.C.; McAloon, A.J. Biochar: A synthesis of its agronomic impact beyond carbon sequestration. J. Environ. Qual. 2012, 41, 973–989. [Google Scholar] [CrossRef] [PubMed]
- Biederman, L.A.; Harpole, W.S. Biochar and its effects on plant productivity and nutrient cycling: A meta-analysis. GCB Bioenergy 2013, 5, 202–214. [Google Scholar] [CrossRef]
- Petruccelli, R.; Bonetti, A.; Traversi, M.L.; Faraloni, C.; Valagussa, M.; Pozzi, A. Influence of biochar application on nutritional quality of tomato (Lycopersicon esculentum). Crop Pasture Sci. 2015, 66, 747–755. [Google Scholar] [CrossRef]
- Sun, H.-J.; Uchii, S.; Watanabe, S.; Ezura, H. A highly efficient transformation protocol for Micro-Tom, a model cultivar for tomato functional genomics. Plant Cell Physiol. 2006, 47, 426–431. [Google Scholar] [CrossRef] [PubMed]
- Gomez, P.; Ferrer, M.; Fernández-Trujillo, J.P.; Calderón, A.; Artés, F.; Egea-Cortines, M.; Weiss, J. Structural changes, chemical composition and antioxidant activity of cherry tomato fruits (cv. Micro-Tom) stored under optimal and chilling conditions. J. Sci. Food Agr. 2009, 89, 1543–1551. [Google Scholar] [CrossRef]
- Brandt, S.; Pék, Z.; Barna, É.; Lugasi, A.; Helyes, L. Lycopene content and colour of ripening tomatoes as affected by environmental conditions. J. Sci. Food Agr. 2006, 86, 568–572. [Google Scholar] [CrossRef]
- Helyes, L.; Pék, Z.; Lugasi, A. Tomato fruit quality and content depend on stage of maturity. Hort. Sci. 2006, 41, 1400–1401. [Google Scholar]
- Nunes, C. Color Atlas of Postharvest Quality of Fruits and Vegetables; Wiley-Blackwell, Blackwell Publishing: Ames, IA, USA, 2008. [Google Scholar]
- Baldwin, E.; Scott, J.; Einstein, M.; Malundo, T.; Carr, B.; Shewfelt, R.; Tandon, K. Relationship between sensory and instrumental analysis for tomato flavor. J. Am. Soc. Hortic. Sci. 1998, 123, 906–915. [Google Scholar]
- Shewfelt, R.L. Sources of variation in the nutrient content of agricultural commodities from the farm to the consumer. J. Food Qual. 1990, 13, 37–54. [Google Scholar] [CrossRef]
- Schmidt, H.-P.; Kammann, C.; Niggli, C.; Evangelou, M.W.; Mackie, K.A.; Abiven, S. Biochar and biochar-compost as soil amendments to a vineyard soil: Influences on plant growth, nutrient uptake, plant health and grape quality. Agr. Ecosyst. Environ. 2014, 191, 117–123. [Google Scholar] [CrossRef]
- Akhtar, S.S.; Li, G.; Andersen, M.N.; Liu, F. Biochar enhances yield and quality of tomato under reduced irrigation. Agr. Water Manage. 2014, 138, 37–44. [Google Scholar] [CrossRef]
- Inyang, M.; Gao, B.; Pullammanappallil, P.; Ding, W.; Zimmerman, A.R. Biochar from anaerobically digested sugarcane bagasse. Bioresour. Technol. 2010, 101, 8868–8872. [Google Scholar] [CrossRef] [PubMed]
- Chen, J.; Beeson, R.C., Jr. Actual evapotranspiration of Asplenium nidus and Chamaedorea elegans during production from liners to marketable plants. Acta Hortic. 2013, 990, 339–344. [Google Scholar] [CrossRef]
- Yeager, T.; Wright, R.; Donohue, S. Comparison of pour-through and saturated pine bark extract N, P, K, and pH [nitrogen, phosphorus, potassium and hydrogen ion concentration] levels [Soil testing, soilless media, nutrient extraction]. J. Am. Soc. Hortic. Sci. 1983, 108, 112–114. [Google Scholar]
- Nunes, M.C.d.N. Correlations between subjective quality and physicochemical attributes of fresh fruits and vegetables. Postharvest Biol. Tec. 2015, 107, 43–54. [Google Scholar] [CrossRef]
- Nunes, M.C.N.; Delgado, A. Quality of Organic Compared to Conventionally Grown Strawberries at the Retail Level. International Society for Horticultural Science (ISHS): Leuven, Belgium, 2014; pp. 723–730. [Google Scholar]
- De Mendiburu, F.; de Mendiburu, M.F. Package ‘agricolae’. Version 3.1.1. 2015. [Google Scholar]
- Yao, Y.; Gao, B.; Inyang, M.; Zimmerman, A.R.; Cao, X.; Pullammanappallil, P.; Yang, L. Biochar derived from anaerobically digested sugar beet tailings: Characterization and phosphate removal potential. Bioresour. Technol. 2011, 102, 6273–6278. [Google Scholar] [CrossRef] [PubMed]
- Lehmann, J.; Rillig, M.C.; Thies, J.; Masiello, C.A.; Hockaday, W.C.; Crowley, D. Biochar effects on soil biota—A review. Soil Biol. Biochem. 2011, 43, 1812–1836. [Google Scholar] [CrossRef]
- Yuan, J.-H.; Xu, R.-K.; Zhang, H. The forms of alkalis in the biochar produced from crop residues at different temperatures. Bioresour. Technol. 2011, 102, 3488–3497. [Google Scholar] [CrossRef] [PubMed]
- Shen, Z.; Zhang, Y.; McMillan, O.; Jin, F.; Al-Tabbaa, A.J.E.S. Characteristics and mechanisms of nickel adsorption on biochars produced from wheat straw pellets and rice husk. Environ. Sci. Pollut. Res. 2017, 24, 12809–12819. [Google Scholar] [CrossRef] [PubMed]
- Singh, B.P.; Cowie, A.L.; Smernik, R.J. Biochar Carbon Stability in a Clayey Soil As a Function of Feedstock and Pyrolysis Temperature. Environ. Sci. Technol. 2012, 46, 11770–11778. [Google Scholar] [CrossRef] [PubMed]
- Glaser, B.; Lehmann, J.; Zech, W. Ameliorating physical and chemical properties of highly weathered soils in the tropics with charcoal–a review. Biol. Fert. Soils 2002, 35, 219–230. [Google Scholar] [CrossRef]
- Lehmann, J.; da Silva, J.P., Jr.; Steiner, C.; Nehls, T.; Zech, W.; Glaser, B. Nutrient availability and leaching in an archaeological Anthrosol and a Ferralsol of the Central Amazon basin: Fertilizer, manure and charcoal amendments. Plant Soil 2003, 249, 343–357. [Google Scholar] [CrossRef]
- Graber, E.; Tsechansky, L.; Gerstl, Z.; Lew, B. High surface area biochar negatively impacts herbicide efficacy. Plant Soil 2012, 353, 95–106. [Google Scholar] [CrossRef]
- Laird, D.; Fleming, P.; Wang, B.; Horton, R.; Karlen, D. Biochar impact on nutrient leaching from a Midwestern agricultural soil. Geoderma 2010, 158, 436–442. [Google Scholar] [CrossRef] [Green Version]
- Spokas, K.A.; Baker, J.M.; Reicosky, D.C. Ethylene: Potential key for biochar amendment impacts. Plant Soil 2010, 333, 443–452. [Google Scholar] [CrossRef]
- Abeles, F.; Morgan, P.; Saltveit, M., Jr. Ethylene in Plant Biology; Elsevier Science Publishing Co Inc: San Diego, CA, USA, 1992. [Google Scholar]
- Frankenberger, W.T., Jr.; Arshad, M. Phytohormones in Soils: Microbial Production and Function; Marcel Dekker Inc.: New York, UK, USA, 1995. [Google Scholar]
- Arshad, M.; Frankenberger, W.T., Jr. Ethylene: Agricultural Sources and Applications; Springer Science & Business Media: New York, UK, USA, 2012. [Google Scholar]
- Fulton, W.; Gray, M.; Prahl, F.; Kleber, M. A simple technique to eliminate ethylene emissions from biochar amendment in agriculture. Agron. Sustain. Dev. 2013, 33, 469–474. [Google Scholar] [CrossRef]
- Vaccari, F.P.; Maienza, A.; Miglietta, F.; Baronti, S.; Di Lonardo, S.; Giagnoni, L.; Lagomarsino, A.; Pozzi, A.; Pusceddu, E.; Ranieri, R.; Valboa, G.; Genesio, L. Biochar stimulates plant growth but not fruit yield of processing tomato in a fertile soil. Agr. Ecosyst. Environ. 2015, 207, 163–170. [Google Scholar] [CrossRef]
- Resurreccion, A.; Shewfelt, R. Relationships between sensory attributes and objective measurements of postharvest quality of tomatoes. J. Food Sci. 1985, 50, 1242–1245. [Google Scholar] [CrossRef]
- Perkins-Veazie, P.; Roberts, W.; Collins, J.K. Lycopene content among organically produced tomatoes. J. Veg. Sci. 2007, 12, 93–106. [Google Scholar] [CrossRef]
- Arias, R.; Lee, T.-C.; Logendra, L.; Janes, H. Correlation of lycopene measured by HPLC with the L*, a*, b* color readings of a hydroponic tomato and the relationship of maturity with color and lycopene content. J. Agr. Food Chem. 2000, 48, 1697–1702. [Google Scholar] [CrossRef]
- Pedro, A.M.; Ferreira, M.M. Nondestructive determination of solids and carotenoids in tomato products by near-infrared spectroscopy and multivariate calibration. Anal. Chem. 2005, 77, 2505–2511. [Google Scholar] [CrossRef] [PubMed]


| Material | N2 Surface Area | CO2 Surface Area | CEC | AEC | pH | Elemental Composition (% mass based) | |||||||
|---|---|---|---|---|---|---|---|---|---|---|---|---|---|
| m2 g−1 | m2 g−1 | mmol 100g−1 | mmol 100g−1 | Ca | Fe | K | Mg | Mn | Na | P | Zn | ||
| BB 300 °C | ~0 | 178.8 | 30.3 | 1.13 | 6.7 | 0.135 | 0.033 | 0.794 | 0.131 | 0.037 | 0.248 | 0.675 | 0.026 |
| BB 450 °C | ~0 | 330.9 | 41.4 | 1.15 | 5.2 | 0.146 | 0.047 | 1.067 | 0.158 | 0.048 | 0.48 | 0.925 | 0.025 |
| BB 600 °C | 247.2 | 493.4 | 73.1 | ~0 | 7.9 | 0.158 | 0.057 | 1.022 | 0.182 | 0.047 | 0.552 | 0.948 | 0.033 |
| NO3 | P | Ca | Mg | |
|---|---|---|---|---|
| Control | 155.2 | 101.97 | 30.25 | 28.21 |
| 300 Low | 150.84 | 132.89 | 45.64 | 33.82 |
| 300 High | 176.5 | 156.03 | 60.72 | 44.8 |
| 450 Low | 165.41 | 101.21 | 38.97 | 26.5 |
| 450 High | 149.51 | 77.86 | 50.32 | 37.04 |
| 600 Low | 112.9 | 104.65 | 39.52 | 26.2 |
| 600 High | 119.3 | 116.68 | 47.1 | 32.08 |
© 2018 by the authors. Licensee MDPI, Basel, Switzerland. This article is an open access article distributed under the terms and conditions of the Creative Commons Attribution (CC BY) license (http://creativecommons.org/licenses/by/4.0/).
Share and Cite
Suthar, R.G.; Wang, C.; Nunes, M.C.N.; Chen, J.; Sargent, S.A.; Bucklin, R.A.; Gao, B. Bamboo Biochar Pyrolyzed at Low Temperature Improves Tomato Plant Growth and Fruit Quality. Agriculture 2018, 8, 153. https://doi.org/10.3390/agriculture8100153
Suthar RG, Wang C, Nunes MCN, Chen J, Sargent SA, Bucklin RA, Gao B. Bamboo Biochar Pyrolyzed at Low Temperature Improves Tomato Plant Growth and Fruit Quality. Agriculture. 2018; 8(10):153. https://doi.org/10.3390/agriculture8100153
Chicago/Turabian StyleSuthar, Ratna G., Cun Wang, M. Cecilia N. Nunes, Jianjun Chen, Steven A. Sargent, Ray A. Bucklin, and Bin Gao. 2018. "Bamboo Biochar Pyrolyzed at Low Temperature Improves Tomato Plant Growth and Fruit Quality" Agriculture 8, no. 10: 153. https://doi.org/10.3390/agriculture8100153