Turnover of Minerals and Organics in the Postharvest Herbage of Annuals and Perennials: Winter Wheat and Goldenrod

1
Institute of Earth Sciences, Friedrich-Schiller-University, Burgweg 11, D-07749 Jena, Germany
2
Food GmbH Jena, Orlaweg 2, D-07743 Jena, Germany
*
Author to whom correspondence should be addressed.
Agriculture 2018, 8(11), 170; https://doi.org/10.3390/agriculture8110170
Submission received: 26 September 2018
/
Revised: 22 October 2018
/
Accepted: 23 October 2018
/
Published: 25 October 2018
Abstract
:Crossing annual cereals, legumes, and oilseeds with wild rhizomatous relatives is used to create perennial lines that fruit over 2–3 seasons. Contrary to annual crops, the year-round vegetation cover should contribute to carbon sequestration, soil formation, and root mineral preservation. Soil erosion, nutrient leaching, and labor expenses may be reduced. While deep-rooted grasses actually inhibit nitrate leaching, advantages in nutrient storage and soil formation are not yet shown. Therefore, the turnover of organics and minerals in the perennial goldenrod was compared with that of winter wheat between blooming and resprouting (28 February) by gravimetry and ICP-MS. From blooming (23 August) to harvest (13 November), goldenrod stalks of 10,070 (given in kg ha−1) lost 23% by dry weight (DW) and released 14.9/9.6/65.7 in NPK and 2193 in water-soluble organics via leaching and root exudation. Apart from a transient rise of 28.8 in N around 13 November, the stubble/rhizome system held CaKMg(N)P stable at a level avoiding metal stress from 23 August to 28 February. Filling seeds in wheat excluded net losses of minerals and organics from anthesis to harvest (23 July). Stubbles (16 cm) and spilt grains of 2890 represented 41.8/2.91/62.5 in NPK and lost 905 in biomass with 25.4/1.8/59.8 in NPK to the soil by 28 February. In wheat-maize rotations, ploughing was avoided until early March. Weeds and seedlings emerged from spilt grains replaced losses in stubble biomass, N, and P but left 40.5 in K unused to the soil. In wheat-wheat rotations, organics and minerals lost by the down-ploughed biomass were replenished by the next-rotation seedlings that left only 18.3 in K to the soil. In summary, off-season goldenrod rhizomes did not store excess minerals. The rate of mineral preservation corresponded with the quantity of the biomass irrespective of its perennial habit. Released water-soluble organics should foster microbial carbon formation and CO2 efflux while soil improving gains in humate C should depend on the lignin content of the decaying annual or perennial biomass. Clues for NPK savings by perennials were not found.
1. Introduction
The current world production of annual cereal crops in the order of 2500 Mio Mg is bound to nitrogen (N), phosphate (P2O5), and potash (K2O) applications of around 187 Mio Mg [1] and stabilized with 2.64 Mio Mg agrochemicals such as herbicides, pesticides, fumigants, and plant growth regulators as given for 2012 [2]. This ambiguous but indispensable performance of the pervasive agricultural industrialization is a consequent response to the needs of a growing world population in staple food, energy, and industrial products. It is paid with drastic losses in the biodiversity [3,4] and leads to soil loss by wind erosion and rising salinity under the conditions of rainfed cropping [5,6]. It results in soil heavy metal (HM) contaminations by the application of sewage sludge, husbandry sludges, and AsCdU contaminated phosphate fertilizers [7,8] followed by P run-off, nitrate leaching, and groundwater pollution [9,10,11]. With an estimated annual loss of 300 Mt of soil organic carbon, the conventionally run European croplands lose with their physico-chemical and microbiological properties a major determinant of crop productivity [12] irrespective of current humus conservation practices [13].
Some of these drawbacks may be overcome with the development of cereals, legumes, and oil seeds that bear fruit over several consecutive years in a more sustainable and ecologically compatible permaculture system [14,15,16]. Perennial relatives for cross-breeding with annual accessions are known for barley, corn, pigeon pea (Cajanus cajan L.), rice, rye, sorghum (Sorghum bicolor L.), soybean, sunflower, and wheat [17,18,19,20]. Worldwide attempts to derive perennial wheat lines from annual cultivars via hybridization and selection had been prompted by the respective work of Tsitsin [21] with Agropyron and Elymus spp. in the early 1930s. In these attempts, the production of a stable germplasm base remains accidental. The genetic basis of the plants’ perennial habit is hardly to determine with the current lab tools [18]. To date, the small seeds of the recently domesticated intermediate wheatgrass (IWG), Thinopyrum intermedium (Host) Barknorth & D.R. Dewey (Kernza®) remain the only commercial perennial cultivar [22,23]. Its grain yields reach 4.5% in the first and 33% (2.5 Mg ha−1) in the second year of cultivation as compared with annual wheat lines [19,24].
Perspectives for the use of dryland and marginal areas are reported for perennial cvs. of pigeon pea, sorghum, upland rice, and wheatgrass/wheat hybrids [15,19,25,26]. The year-round vegetation cover may contribute to carbon sequestration and soil formation and reduce erosion and nutrient leaching like the expenses for labor, tilling operations, and seed but less for weed and pests control [22,27]. Actually, wheatgrass root systems reaching down to 90–240 cm prevent nitrate leaching in heavily fertilized arable [24] whereas the central feature of the postulated soil building by organic carbon (Corg) enrichment has not yet been proven [28]. Switchgrass farming over four years caused organic carbon losses of 0.04–0.47 Mg ha−1 at a depth of 5–15 cm but small gains at 90–120 cm [29]. Nevertheless, there are experiences that soil C and N levels decrease by 40%–50% and more after conversion of grassland to arable [30]. Are then perennial crops actually superior to annuals in stabilizing soil carbon and minerals?
The question was addressed with a comparison of the postharvest biomasses from the perennial Giant goldenrod (Solidago gigantea Ait.) and a common annual wheat crop. Goldenrod plants 150–220 cm tall form nearly monospecific populations of 10–11.8 Mg ha−1 by dry weight (DW) on non-mowed rangeland in Europe over decades [10] and can be used as low-mineral biomass feedstock with 5%–12% latex [31]. The stalks blooming in August turn brown, dry, and dead by early November and lose leaves and seed-bearing panicle structures, as well as soluble minerals and organics in standing position over 1–3 years. The static live rhizomes bear the major stock of postharvest minerals. The rhizomes consist of a woody appendix of the stalk equipped with poorly branched lateral roots and form 10–25-mm-long stem buds in late October, the precondition for harvesting the dead stems without impairing the next rotation regrowth. Rhizomes as potential sink tissues may be flooded with organics and minerals during the autumnal senescence of the aboveground biomass. The annual wheat crop analyzed in a case study came to an overall biomass of 15.960 Mg ha−1 DW. The postharvest biomasses as carriers of the organically bound carbon and mineral resources comprise the gradually decaying stubbles, seedlings grown up from spilt wheat grains with common weeds as a kind of an accidental catch crop, and sometimes the emerging biomass of the next-rotation crop. Their combined storage potential in carbon and minerals during the off-season, impaired by decay and leaching, has neither been quantified as such nor in comparison to a rhizomatous perennial such as goldenrod.
As recently reviewed [10], beside Ca, Mg, and the set of (essential) trace minerals, N and P > K are the main growth-limiting plant nutrients [32,33]. They are translocated from senescing sink tissues to growing plant sections, seeds, and rhizomes by phloem transport. Maillard et al. [34] recorded growth cessation in lower leaves of grain crops at around 40% of their life span and initiation of senescence, followed by a drain of nutrients, at midlife. Proteins and nucleic acids are enzymatically degraded to phloem-mobile compounds [35,36,37] to result in N relocation rates of 40%–90% in seed crops [34]. Phosphorus was relocated at a rate of 60% in leaves of Salix [38]. In tree leaves, Ca was not relocated and increased throughout the growing season [39,40].
In wintering rhizomes and live aboveground residues of herbs, the distribution of stored minerals has received less attention. In general, foliages of alfalfa and grasses showed diminishing mineral resources in later growth stages [41,42,43]. The N content of the perennial switchgrass (Panicum virgatum L.) envisaged as bioenergy crop decreased during the autumnal senescence and rose accordingly in the underground tissues of crowns and roots [44,45]. Ferchaud et al. [46] compared the percentage of 15N binding by the perennials switchgrass and Miscanthus × giganteus with sorghum and triticale as annual crops. The respective plant sets contained 13%–34% vs. 34%–39% of 15N in the herbage, and 36% (43 kg N ha−1 year−1) vs. 19% (12 kg N ha−1 year−1) in the soil-root-stubble region. Perennials stored as little as 12% of 15N (14 kg N ha−1 year−1) in rhizomes. In seagrass (Posidonia oceanica (L.) Delile), too, the storage potential of rhizomes contributed little to the seasonal N and P budget [47]. The permanent leakage of cell constituents and the discard of plant debris are therefore the major routes of mineral return to the environment.
In addition to the exudation of N and P compounds, as well as of carbohydrates, organic acids, and phenols by the root systems [48,49,50], herbages exposed to rain, dew, and mist released sugars, amino acids, organic acids, pectins, and phenolics, too, increasingly from senescing aboveground tissues [51,52,53]. Submerged wetland plants lost 13–55 g C kg−1 dry weight (DW) in 35 days [54].
The loss in minerals was greatest for monovalent cations such as K and Na, less for divalent ones, and least for organic N and P compounds [32,55]. The canopies of deciduous and evergreen trees lost approximately 15% of their annual above-ground nutrient return in N and P, and 48%–59% in K, to the soil by leaching [56].
For the comparison of a perennial and an annual crop with a comparable biomass production and a definitively dead aboveground biomass at maturity, plant samples of goldenrod from a homogeneous 30-years-old population were excavated with their root systems. The postharvest biomass of a field crop of winter wheat served as the annual counterpart. Based on the temperate climate of Central Germany, the stubble cover joined by seedlings emerging from spilt grains was left undisturbed until the restart of the next growing season (28 February) in a wheat-maize rotation model (A). In a wheat-wheat rotation model (B), the postharvest biomass was ploughed down prior to seeding. It was the goal to monitor the mineral retention by the respective biomass components during the off-season to check the prognosticated superiority of perennial crops in mineral preservation and soil organic enrichment.
2. Materials and Methods
2.1. Plant Sources
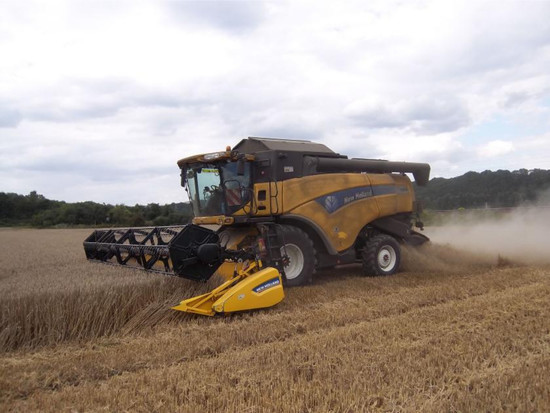
In the outskirts of Jena (Germany), an undisturbed colony of giant goldenrod had grown up along a tram line after its completion in the 1980s. In 2009, the plants had reached 2.10 m in length on the non-contaminated soils of alluvial river sediments and reduced the portion of accompanying grasses to an estimated 2%–4% of the total biomass (Figure 1). An area of 36 m2 was marked for the consecutive collection of plant and soil material starting in August 2015. Winter wheat cv. Kavalier established on a non-contaminated arable soil derived from mottled sandstone was harvested with a New Holland CX 6090 Elevation harvester (New Holland Agiculture, Torino, Italy) on 23 July 2017. The harvestable straw cut across a width of 8.50 m was discharged on strips 1.60 m wide. On 19 September, the 1.60-m discharge was marked by the dense regrowth of wheat emerging from spilt grains. The lateral strips mainly bore common weeds (Figure 2). The respective biomasses were determined and their mean was referred to 8.50 m.
2.2. Soils
The undisturbed loamy alluvial river sediment of pHaqu 7.6 and Corg 2.8% (soil A) was separated from excised root balls of goldenrod while the arable postharvest soil from the wheat crop of pHaqu 6.85 and Corg 1.55% (soil B) was taken from the 20-cm plough layer within a 40 × 40 m plot on 25 July 2017 (Table 1).
2.3. Processing Plant Samples of Goldenrod
Duplicate sets of 35–40 neighbored plants were excavated with their complete root systems in the stage of blooming (23 August 2015), senescence (13 November 2015), and decay or resprouting (28 February 2016). The soils adhering to the root balls were separated, air-dried, and sieved (0.8 mm). After intensive rinsing of the herbage, size and DW details were determined prior to, and after the dissection into rhizomes and their lateral roots, as well as into lower, medium, and upper stems, leaves and panicles. The duplicate samples milled for analyses (Pulverisette 14; Fritsch GmbH, Idar-Oberstein, Germany) were prepared from root and shoot tissues carefully washed with deionized water from at least 12 whole plants each.
2.4. Processing Plant Samples of Wheat in Two Crop Rotation Models
The wheat crop of cv. Kavalier (1000 seeds fresh weight, 38.4 ± 1.8 g) sown with a row spacing of 5 inches left 16-cm long rooted stubbles in a density of 800 m−2 (806 ± 149). Spilt grains of 132 ± 10 kg ha−1 fresh weight founded, together with some common weeds, the postharvest vegetation that contributed to the mineral preservation of the gradually decaying stubbles. For the crop rotation model wheat-maize (A), both stubbles and the undisturbed vegetative regrowth were monitored from the harvest on 23 July to 28 February with regard to biomass and mineral content per ha. The wheat-wheat rotation model (B) comprised the ploughing-down of the biomass on 28 September and seeding to cv. Bussard on 4 October in densities of 400 grains m−2 (resulting in 378 ± 50 seedlings) and a row spacing of 5 inches by avoiding fertilizer input. Samples of 20 g straw residues and green matter were enclosed in 12 nylon bags each and buried in situ. Their decay was followed to calculate the rate of mineral preservation from the buried organics and the wintering whole seedlings. Triplicate plant samples were washed with deionized water and dried for analyses. The rainfall amounted 245 mm between 28 September and 28 February.
2.5. Mineral Concentrations in Soils and Plant Tissues
Mineral concentrations were determined for duplicate aqua regia-extracted 5-g samples of soils, whereas 0.3-g samples of milled plant tissues were microwave-digested in HNO3 (4 mL) and H2O2 (1 mL) (Mars Xpress; CEM GmbH, Kamp-Lintfort, Germany) and diluted to 150 mL with bideionized water. The solutions were analyzed by Inductively Coupled Plasma Mass Spectrometry (X series ICP-MS, Thermo, Waltham, MA, USA). The resulting detection limits (in mg kg−1 DW) were as follows: 0.0005, Th; 0.002, CdCoCsU; 0.005, Cr; 0.01, AsMnPb; 0.02, CuSr; 0.03, BaNiZn; 0.04, Fe; 0.1, AlMg; 0.4, KNa; 1, P; and 3, Ca.
2.6. Nitrogen Compounds
Duplicate soil samples (2 g DW, sieve 0.8 mm) were extracted with 0.1 M KCl solution (1:10, w/v) at 20 °C for 1 h on an overhead shaker. Dried and milled plant samples (250 mg DW) were infused in 10 mL of 0.1 M KCl solution and left standing overnight. The centrifuged supernatants (14,000 g, 5 min) were used to determine the NH4+ content with Aquamerck ammonium test solution (Merck, Darmstadt, Germany). The nitrate content was spectrophotometrically quantified at 210 nm (Helios Beta; Unicam UV-Vis; Cambridge, UK) against a blank sample reduced by copper-coated zinc granules [57] with maximum deviations of ±8% for soil replicates. Organic N in 250 mg of milled plant samples (referred to as Norg) was determined with a modified Kjeldahl method by using 5 mL each of H2O2 (30%), and H2SO4 (96%) in the presence of 0.5 g Kjeldahl catalyst (Fluka, Sigma-Aldrich, Saint Louis, MO, USA). Values given in nitrogen (N) are then the sum of NO3-N and Norg, with the latter comprising NH3/NH4+ and the nitrogen of amino acids and amino sugars [58].
2.7. Weight Loss of Wheat Straw Samples by Standing Infusion in Water
The DW loss of carefully rinsed and pre-dried samples of wheat stubbles exposed to leaching and decay in the field was determined after their infusion in bideionized water at a ratio of 1:50 (w/w) at 20 °C for 48 h. The decanted supernatants were centrifuged at 14,000 g for 5 min. Their absorbance values were determined at λ = 340, 450, and 650 nm by spectrophotometry.
2.8. Statistical Treatments
SPSS 8.0 software (SPSS Inc., Chicago, IL, USA) was used to calculate the standard deviations (SD) of duplicate to quadruplicate results and linear correlations, and to perform one-way analyses of variance.
3. Results and Discussion
3.1. Turnover of Organics and Minerals in the Goldenrod Colony
With the collection of the vigorous reference material in the stage of blooming on 23 August, the stalks of goldenrod growing in densities of 76–128 m−2 (mean, 101 ± 17) had reached their maximum height of 150–160 cm with basic diameters of 4–7 mm. The whole aboveground biomass amounted 10,070 kg ha−1 DW, of which 1085 kg ha−1 would come to a potential 16-cm stubbles region. The dense and intermingled root systems remained fairly stable with 2850 kg ha−1 DW across the growing season (Table 2). Accordingly, the combined roots/stubbles section represented 30.5% of the whole biomass. It contained 19%–27.2% of the macronutrients CaKMgNP and the trace mineral Zn, with NPK coming to a total of 78.5 kg ha−1 (Figure 3).
The brown shoot samples drawn in the stage of senescence on 13 November stood with their water content of <26% near the fiber saturation point of 17%–18% by DW and had apparently terminated any exchanges of minerals and metabolites with their living perennial root systems. The aboveground biomass had dropped to 77% of the 23 August values by the preceding transport of compounds with the basipetal phloem to the roots, the leaching of organics and minerals that increased from 5%–6% in green to >28% in dried tissues, and a negligible discard of lower leaves [10]. Thereby, releases of 2.9% in Ca (3.1 kg ha−1), 36.9% in K (65.7 kg ha−1), 30.6% in Mg (5.05 kg ha−1), 12.5% in N (14.9 kg ha−1), 34% in P (9.6 kg ha−1), but no Zn by the whole plant between 23 August and 13 November in a predominantly soluble stage had mainly come from the aboveground biomass. Mineral concentrations in roots had persisted on the 23 August level, while a temporary input of N at 28.8 kg ha−1 raised the sum of NPK to 96.8 kg ha−1 (Table 2, Figure 3).
The harvest on 13 November removed with 89% of the shoot biomass 52.7, 11.9, and 74.1 kg ha−1 or 50.5%, 64%, and 66%, respectively, of the whole-plant NPK. The biomass of 34.7% left with the roots/stubbles region remained stable until 28 February and represented 27%–49.6% of the 13 November total mineral stock (Table 2). Its subsequent losses of 11.9% in Ca (3.3 kg ha−1), 30.1% in Mg (0.94 kg ha−1), 25.9% in N (13.4 kg ha−1), 19.9% in P (1.33 kg ha−1), 20.2% in Zn (0.020 kg ha−1), and a non-significant increase of 0.5% in K (0.2 kg ha−1) from 13 November to 28 February reduced the sum of NPK to 82.3 kg ha−1 (Table 2, Figure 3). Nitrate-N contributed around 2.4% in 23 August shoots, 8.9% in roots, and 0% in the senescent 13 November shoots to the sum of N reported (Table 2).
With a sum of 83% in CaKMgP and a temporary surplus of 13.7 kg ha−1 in N, the root/stubble system of 28 February remained preferentially below the common 23 August values (Table 2, Figure 3). The minerals bound by the blooming biomass of 23 August were, therefore, soil-derived and virtually not supported by resources of wintering perennial roots. Similar deficits in the contribution of rhizomes of terrestrial and maritime grasses to the plants’ N and P budget seem to be common [46,47]. Whereas in wheat crops the grains may account for up to 45% of the total biomass furnished by an unbroken allocation of soil constituents until maturity (e.g., [59]), the microscopic seeds formed by 20,000 per goldenrod plant with a 1000-seed fresh weight of 45–50 mg [60] are no notable sink of minerals and organics. The shoots’ 23% drop in DW from blooming to maturity must therefore be attributed to a drain in water-soluble organics (95.7%) and the group of CaKMgNP (4.3%, w/w) no longer in need but virtually not to the discard of solid biomass (Table 2).
The respective drainable carbohydrates, amino acids, organic acids, pectins, and phenolics may enter the soil matrix by leaching [51,52,53], basipetal phloem transport [61], and the subsequent exudation by roots [48,49,50]. In their majority, they may rapidly be metabolized and mineralized to CO2 by soil microbiota [62,63,64] rather than to contribute to a soil mineral carbon pool. The contemporary input of minerals from the whole plant (see above) could contribute as little as 0.003%, 0.87%, 0.025%, 9.1%, and 0.58%, respectively, to the soil aqua regia mineral stock (Section 2.2) in CaKMgNP if completely returned to the soil. In practice, soil mineral and humic-acid concentrations even tended to decline in regions of higher plant density and the presence of the slowly decaying two-to-four-years-old stubble debris placed on the soil surface (data not shown).
Concentrations in Ca(K)MgP of the root/stubble mineral pools from 23 August to 28 February (Figure 3) remained virtually stable. Nitrogen peaked around 13 November due to a preceding basipetal phloem transport to decline by, or even after, 28 February. If, like N, the other elements had been translocated from senescing shoots to the rhizomes, too, their exudation had been completed prior to 13 November, whereas the outflow of N occurring in the form of phloem-mobile amino acids, amides, ammonium, urea, and allantoin [35,36,37] was simply not yet terminated (Figure 3). Discussions about the mineral management in perennials place the focus on N resources. Specific vegetative storage proteins (VSPs) are deposited in late-season taproots of alfalfa (Medicago sativa L.) and white clover (Trifolium repens L.) [65,66] to support regrowth in spring. Non-VSPs N resources formed in red clover (T. pratense L.) and other perennial forage legumes are depleted prior to the next growing season [67,68].
3.2. Mineral Preservation by the Postharvest Biomass of Crop Rotation Model Wheat-Maize (Model A)
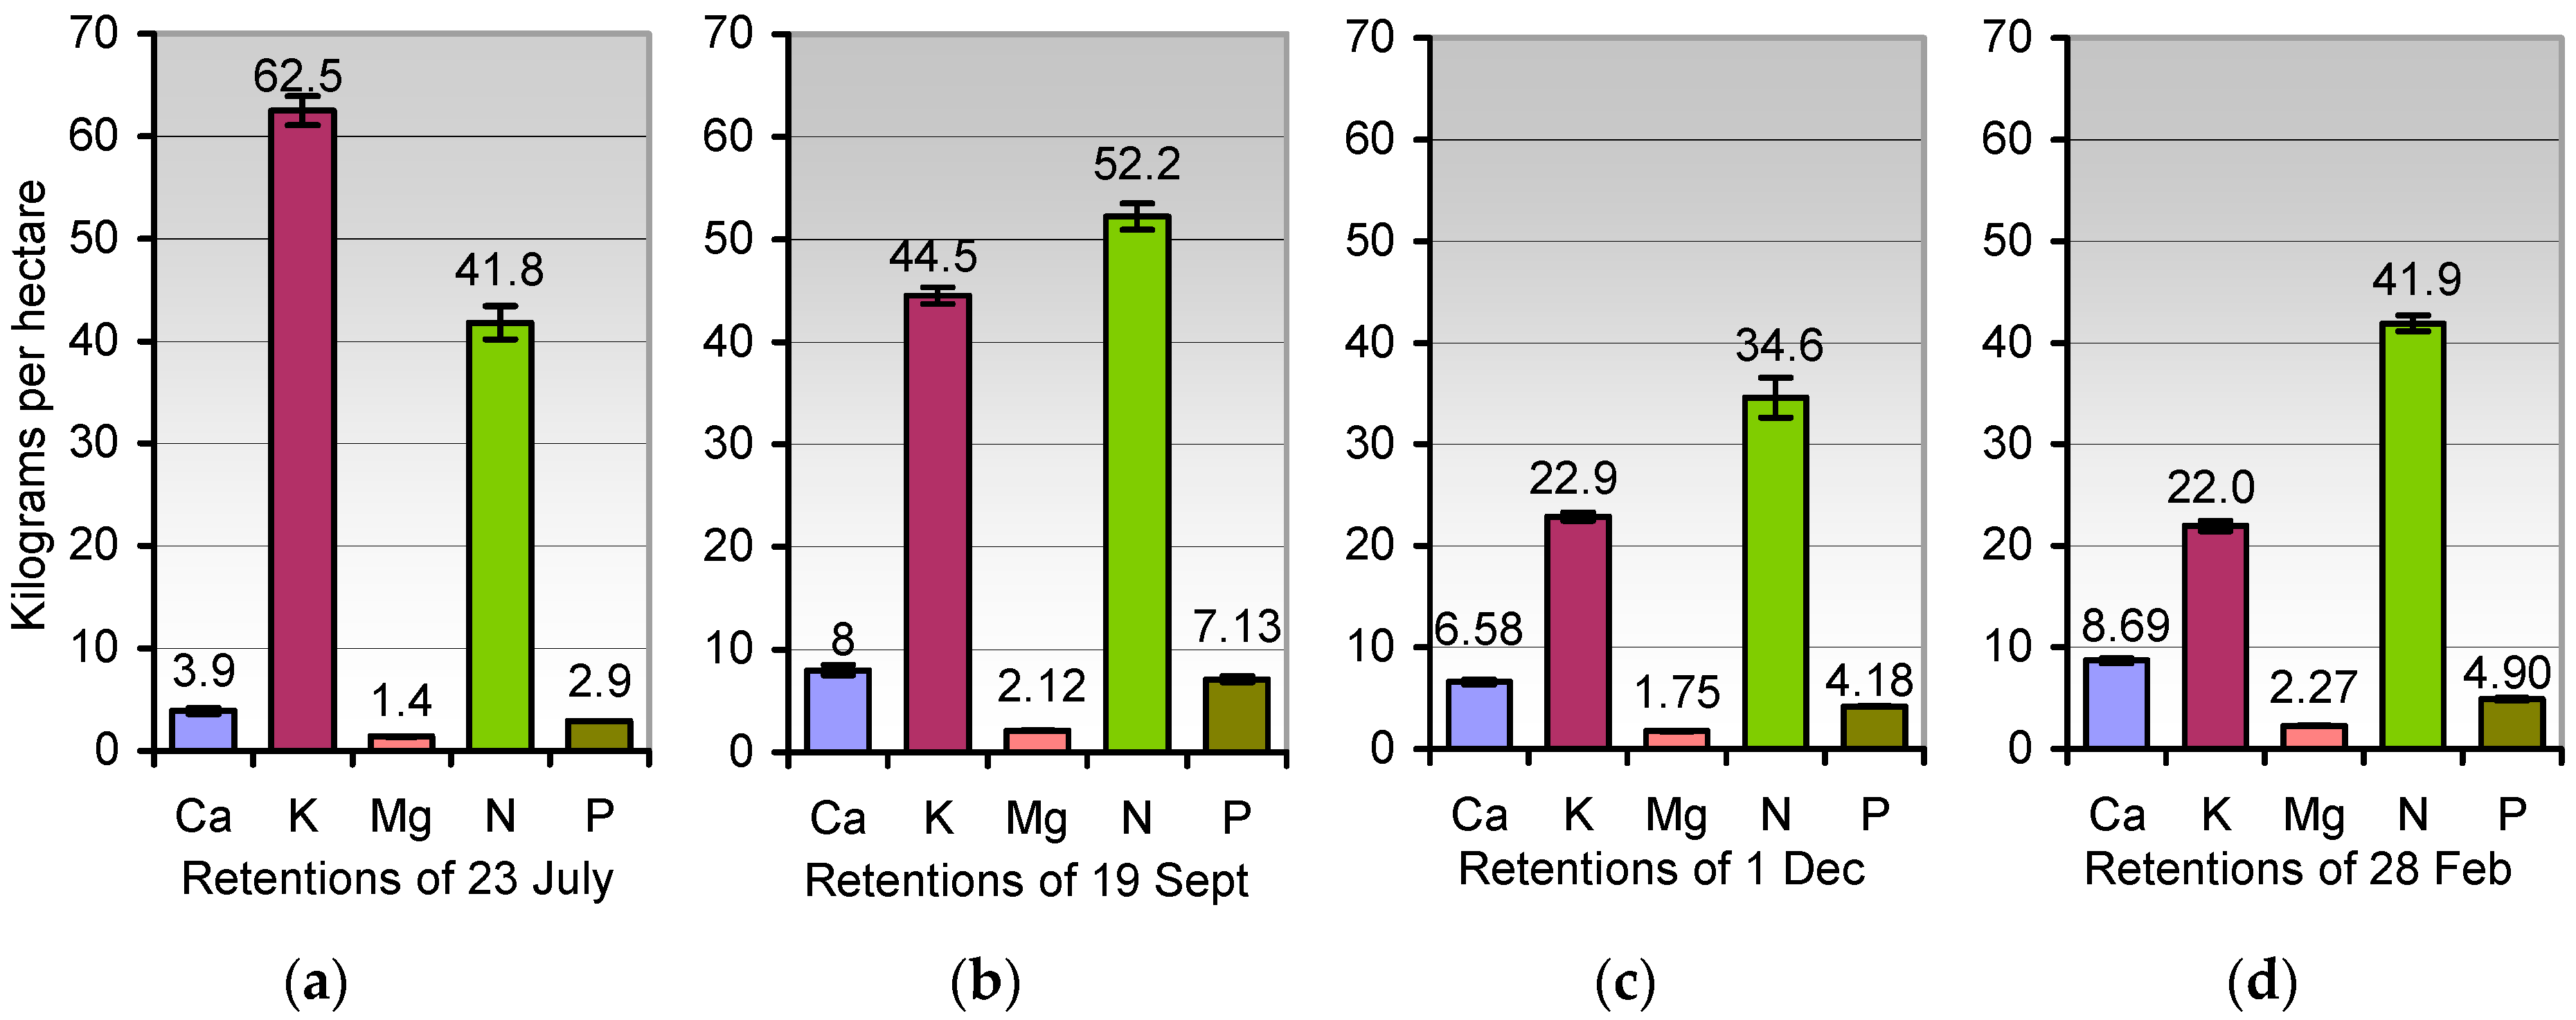
The bread wheat crop of cv. Kavalier harvested on 23 July 2017 comprised estimated 7090 kg grains and 5980 kg of harvestable straw beside 16 cm long rooted stubbles and spilt grains with a total biomass of 15,960 kg ha−1 (DW). The total takeoff included 82% of the biomass with portions of 220, 32.5, and 128.7 kg ha−1 or 84%, 91.8%, and 67.3%, respectively, of the whole-plant NPK. Biomass residues of rooted stubbles and spilt grains with 18% or 2890 kg ha−1 represented 41.8, 2.91, and 62.5 kg ha−1 in NPK (Table 3, Figure 4).
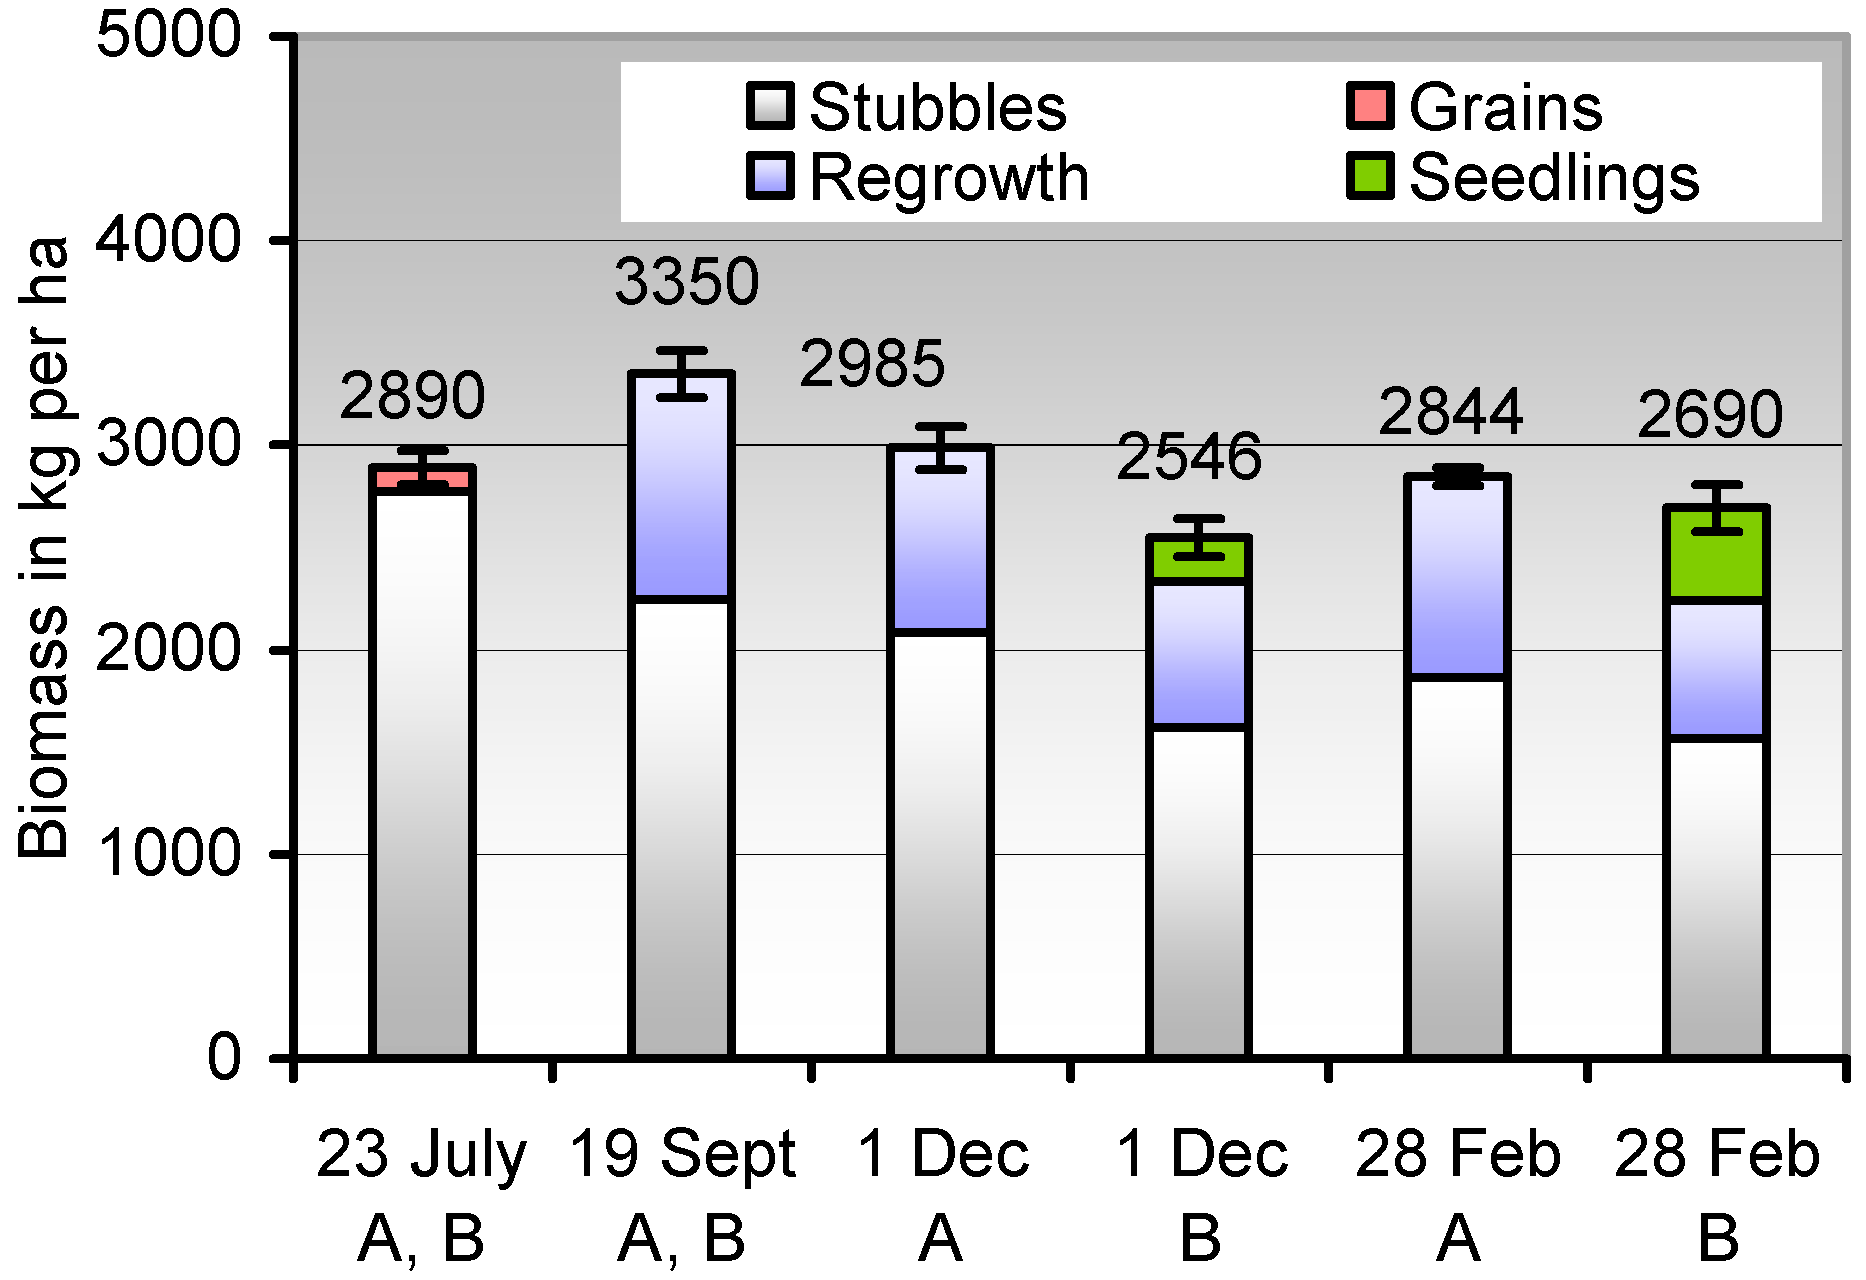
Retaining an undisturbed stubble cover and its sporadic regrowing biomass until early March is part of a mineral preservation strategy of wheat-maize rotations in temperate climates. Thereby, the drop in stubble biomass between harvest and 28 February was replenished by wheat seedlings emerging from spilt grains and by common weeds, referred to as regrowth, to a final sum of 2844 kg ha−1 (Table 3, Figure 5).
With an average carbon content of 49% in wheat straw (range 46.5%–52.6%) [69], the net input of C to a 20-cm plough layer reached with 1394 kg ha−1 3.75% of soil Corg in early March. Comparable humus conservation practices monitored on 268 arable sites in West Germany observed increases in the annual C input from 20 to 133 kg ha−1 between 2005 and 2013. The respective soil organic carbon (SOC) concentrations rose by 4.25% in topsoils but could not prevent a 15% loss of mineral-bound SOC in subsoils during the test period [70]. In general, annual wheat stubble applications of 2–3 Mg ha−1 as a recommended optimum [71] expand to 10 Mg ha−1 in Australia [72]. Cover crops/green manure cultures range 5.3–10 Mg ha−1 DW [73,74] to 21–34 Mg ha−1 fresh weight [75]. Of the respective carbon input by crop residues, e.g., in long-term wheat-maize rotations, 8.0%–13.6% from maize residues and 16.5%–28.5% from wheat residues contributed to the SOC pool in North China [76]. The ranges correspond with 11%–23% given for the content of the recalcitrant lignin in wheat residues [77].
The humid season of late 2017 promoted the drop in stubble biomass with the decay of the lateral roots by 19 September, losses of whole roots and sheet tissue by 1 December, and a progressive decay of placed stubbles by 28 February. Substantial losses of the stubble biomass by 33% (Table 3), its high accessibility to leaching from 7.4% to 3.6% from July to February, and the emerging regrowth acting as a catch crop determined the retention of organically bound minerals. The N content of stubbles descended from 39.2 kg ha−1 DW with 19.3% NO3-N to 13.8 kg ha−1 upon the loss of the highly soluble nitrate by 28 February, resulting in a total N release of 25.4 kg ha−1 to the soil. The contemporary uptake of N by the regrowth herbage at 28.1 kg ha−1 with portions of 1.2%–3.7% nitrate-N stabilized the organically bound nitrogen in the 34.6–52.2 kg ha−1 range across the test period (Table 3, Figure 4). Amounts of 1.8 kg ha−1 in P set free by stubbles did not cover the needs of 3.7 kg ha−1 taken up by the regrowth herbage until 28 February. The K stock of stubbles and spilt grains dropped by 59.8 kg ha−1 or to 4% by 28 February with a daily mean of 0.84 kg ha−1 from July to September.
K resources of the regrowth peaked in September but could not prevent that 40.5 kg ha−1 as the only net losses were released to the soil from 23 July to 28 February. Fluctuations in the stock of CaMgZn remained negligible (Table 3, Figure 4).
In the prevention of outwash and runoff, the communicating biomasses of stubbles and regrowth stabilized therefore the pools of trapped CaMgNPZn via release and uptake across the off-season, while only 65% of the K was liberated to the soil (Table 3, Figure 4). Thereby, the postharvest biomass of wheat reached with 73%–85% almost that of goldenrod (Table 2 and Table 3). Their withholding capacity in bound minerals was also of the same order (Figure 3 and Figure 4) to indicate similar concentrations of macronutrients in tissues of both plant systems.
3.3. Balancing Minerals in the Crop Rotation Model Wheat-Wheat (Model B)
On 28 September, the postharvest biomass of stubbles and regrowth in the order of 3349 kg ha−1 DW was incorporated into a 20-cm plough layer. Thereby, inputs to the arable soil with a bulk density of 1.2 kg L−1 reached with 1641 kg C 4.41% of soil Corg, and added 52.2 kg ha−1 N bound in the biomass (Figure 6) to the stock of 64.8 kg ha−1 ammonium N (Section 2.2). Biomass components of K (44.5 kg ha−1) and P (7.13 kg ha−1) met with aqua regia stocks of 4198 and 924 kg ha−1, respectively, in the soil. The mineral content of the gradually decaying surrogate biomass buried in nylon bags and of the consecutive wheat crop established on 4 October is shown in Table 4. From 28 September to 28 February, the biomass of stubbles and regrowth dropped by 30% and 39.5%, respectively, while that of the seedlings doubled. As seen in detail, DW losses reached 27.7%, 30%, and 34.3% in stubbles and 36%, 39.5%, and 53.6% in regrown plants from 28 September to 1 December, 28 February, and 30 April, respectively (Table 4, not all data shown).
The rapid DW loss of 1112 kg ha−1 of the combined biomass until 1 December indicates a preferential outwash of the water-soluble low-MW substances [51,52,53] and possibly their metabolization and mineralization by soil microbiota [62,63,64] rather than their integration into non-microbial SOC. Accordingly, peaks in CO2 evolution during the first 15 to 30 days of wheat straw decay were attributed to the mineralization of its soluble C fraction [63,78].
The 33% DW loss of the combined stubble/regrowth biomass from 19 September to 28 February was accompanied by temporary releases of 87% in K (38.5 kg ha−1), 28.2% in N (14.7 kg ha−1), and 29.7% in P (2.12 kg ha−1) to the soil but by gains of 196% in Ca, 122% in Mg, and 107% in Zn on the basis of kg ha−1 due to a net attraction of the respective soil minerals by the decaying biomass. Comparable per hectare increases to 148% in Ca, and, exclusively for stubbles, to 123% in N were also recorded for the standing and placed postharvest biomass of model A (Table 3). According to George and Smeins [79], the DW of pasture herbage incubated in litter bags dropped to 56.2% during 345 days, accompanied by 112% and 127% of relative increases in N and net gains to 201% and 251% in ash by the apparent allocation of soil minerals. Decaying wheat straw of 0.25%–1% N displayed net gains to 1.75% [80], attributed to N2 fixation by micro- and anaerobic diazotrophic bacteria [81,82].
The link of bivalent cations to decaying biomass deserves attention. Sound wheat straw [83] but also humic and fulvic acids released from senescent plants [84] and derived from decaying biomass [85,86,87] unite phenolic and flavone units with terpenoids, alkanes, sugars, aliphatic and aromatic acids, tannins, heterocyclics, alcohols, amino sugars, amino acids, peptides, and proteins. Their reactive dissociable groups are mainly carboxyl (–COOH), phenolic, enolic, and alcoholic hydroxyl (–OH), methoxyl (–OCH3), sulphydryl (–SH), amino (–NH2), and imino (=NH) type whose protons (H+) are exchangeable with metal cations.
The diminishing down-ploughed biomass was somewhat replenished by that of the second-rotation wheat seedlings to 2690 kg ha−1 or to 73% that of the postharvest residues of goldenrod (Table 2 and Table 4, Figure 5). Their uptake in N and P rebound the respective amounts released from the decaying biomass completely and withheld 20.2 of the 38.5 kg ha−1 in K set free by the latter to leave 18.3 kg ha−1 as the only net input to the soil by 28 February (Table 4). The resources of CaMgNP in the combined biomass remained therefore stable across the test period (Figure 6). Moreover, the order of the whole biomass and its capacity to preserve its mineral stock from outwash during the off-season were as high as those displayed by residues of goldenrod and model A (Figure 3, Figure 4 and Figure 6).
In dependence on precipitation, temperature, soil type, aeration, N availability, and even on the retarding presence of cover plants [88,89], wheat residues lost 27%–49% DW within 2.5–3 months [80,90,91] in accordance with the current results. Gao et al. [92] recorded losses of 36.6% and 53.7% over 4 and 12 months, respectively, in wheat straw, with the decay rate decreasing slowly to 12 months upon the enrichment of lignin [93]. The incorporation of 9000 kg ha−1 wheat straw into a 20-cm plough layer accounted for available amounts of (mg kg−1 soil) 13 in N, 11 in P, and 42 in K [94].
4. Conclusions
Goldenrod joins wheat in the production of an aboveground biomass comparable in quantity and in the metabolic passivity at harvest. With a DW loss of 23% from blooming (23 August) to harvest (23 November), water-soluble compounds not required for filling the tiny seeds were released to the soil as organics and minerals with a portion of 90.2 kg ha−1 in NPK via leaching, phloem transport, and an apparent exudation by the perennial rhizomes. Apart from a transient rise of 28.8 kg ha−1 in N around 13 November, the stubble/rhizome system held the concentrations of CaKMg(N)P stable at a level apparently matching the physiological functions from 23 August to 28 February. The rhizomes did not store excess minerals could incite metal stress effects, making re-sprouting plants immediately dependent on soil mineral uptake.
In wheat, the grains accounted for 45% of the whole biomass. The drain of compounds to developing seeds, therefore, prevented net losses of organics and minerals from anthesis to maturity (23 July). Fresh stubbles and spilt grains reached 78% of the 13 November stubble/rhizome biomass of goldenrod but 107.2 kg ha−1 (111%) in the sum of NPK. The wheat-maize rotation model delayed ploughing-down of the biomass until early March, giving rise to a DW loss of the stubble cover by 25% at 1 December and 33% at 28 February. Seedlings growing up from spilt grains and weeds as an accidental catch crop compensated the losses in stubble biomass and took up the liberated amounts of N and P completely by 28 February, but left 40.5 kg ha−1 in K unused to the soil. Thereby, the sum of NPK retained by the biomass reached with 68.8 kg ha−1 84% that bound in stubbles/rhizomes of goldenrod. In wheat-wheat rotations, organics and minerals lost by the down-ploughed biomass were completely replenished by the next-rotation seedlings. The biomass reached with 85.5 kg ha−1 of NPK 104% that held by the stubble/rhizome system of goldenrod.
It is concluded that both the bulk of soluble organics released by goldenrod and those degraded by the rapid DW loss of wheat stubbles in the first weeks of exposure furnish primarily microbial carbon formation and CO2 efflux. The production of soil forming humic substances may correspond with the content of the recalcitrant lignin in crop residues left by goldenrod and wheat in comparable quantities to give no clues for higher soil carbon allocations by perennials. Contemporarily, the mineral stocks of both postharvest biomasses were in the same order, irrespective of their perennial habit. But whereas the NPK resources of 68.8 and 85.5 kg ha−1 in the wheat residues of 28 February will gradually be released, the respective 82.3 kg ha−1 of goldenrod stubbles remain enclosed as the physiologically functional mineral equipment. A further portion of 90.2 kg ha−1 shed by goldenrod stalks from 23 August to 13 November to the soil (see above) is too small to postulate savings of NPK fertilizer by perennial crops. On the contrary, the lasting disposability of the shed minerals for plant uptake is delegated to the buffering capacity of the soil. This does not mean that further exciting attempts in breeding perennial crops are refused.
Author Contributions
Conducted the agricultural part, G.G.; performed the mineral analyses, K.-D.V. The script was elaborated in mutual consultation.
Funding
This research received no external funding.
Conflicts of Interest
The authors declare no conflicts of interest.
References
- FAO. World Fertilizer Trends and Outlook to 2018; Food and Agriculture Organization of the United Nations: Rome, Italy, 2015. [Google Scholar]
- Atwood, D.; Paisley-Jones, C. Pesticides Industry Sales and Usage: 2008–2012 Market Estimates; United States Environmental Protection Agency: Washington, DC, USA, 2017.
- Meyer, S.; Bergmeier, E.; Becker, T.; Wesche, K.; Krause, B.; Leuschner, C. Detecting long-term losses at the plant community level—Arable fields in Germany revisited. Appl. Veg. Sci. 2015, 18, 432–442. [Google Scholar] [CrossRef]
- Bringezu, S.; Schütz, H.; Pengue, W.; O′Brien, M.; Garcia, F.; Sims, R.; Howarth, R.W.; Kauppi, L.; Swilling, M.; Herrick, J. Assessing Global Land Use: Balancing Consumption with Sustainable Supply; United Nations Environment Programme: Nairobi, Kenya, 2014. [Google Scholar]
- Dubovyk, O.; Menz, G.; Conrad, C.; Lamers, J.; Lee, A.; Khamzina, A. Spatial targeting of land rehabilitation: A relational analysis of cropland productivity decline in arid Uzbekistan. Erdkunde 2013, 67, 167–181. [Google Scholar] [CrossRef]
- Houyou, Z.; Bielders, C.L.; Benhorma, H.A.; Dellal, A.; Boutemdjet, A. Evidence of strong land degradation by wind erosion as a result of rainfed cropping in the Algerian steppe: A case study at Laghouat. Land Degrad. Dev. 2016, 27, 1788–1796. [Google Scholar] [CrossRef]
- Bigalke, M.; Ulrich, A.; Rehmus, A.; Keller, A. Accumulation of cadmium and uranium in arable soils in Switzerland. Environ. Pollut. 2017, 221, 85–93. [Google Scholar] [CrossRef] [PubMed]
- Wuana, R.A.; Okieimen, F.E. Heavy metals in contaminated soils: A review of sources, chemistry, risks and best available strategies for remediation. ISRN Ecol. 2011, 402647. [Google Scholar] [CrossRef]
- Adesemoye, A.O.; Kloepper, J.W. Plant-microbes interactions in enhanced fertilizer-use efficiency. Appl. Microbiol. Biotechnol. 2009, 85, 1–12. [Google Scholar] [CrossRef] [PubMed]
- Gramss, G.; Voigt, K.-D. The mineral preservation in Giant Goldenrod (Solidago gigantea Ait.): A model for perennial seed crops? In Agricultural Research Updates; Gorawala, P., Mandhatri, S., Eds.; Nova Science Publishers: New York, NY, USA, 2018; Volume 23, pp. 101–130. [Google Scholar]
- Sharpley, A.N.; Weld, J.L.; Beegle, D.B.; Kleiman, P.J.A.; Gburek, W.J.; Moore, P.A., Jr.; Mullins, G. Development of phosphorus indices for nutrient management planning strategies in the United States. J. Soil Water Conser. 2003, 58, 137–152. [Google Scholar]
- Janssens, I.A.; Freibauer, A.; Ciais, P.; Smith, P.; Nabuurs, G.-J.; Folberth, G.; Schlamadinger, B.; Hutjes, R.W.A.; Ceulemans, R.; Schulze, E.-D.; et al. Europe′s terrestrial biosphere absorbs 7 to 12% of European anthropogenic CO2 emissions. Science 2003, 300, 1538–1542. [Google Scholar] [CrossRef] [PubMed]
- Steinmann, T.; Welp, G.; Holbeck, B.; Amelung, W. Long-term development of organic carbon contents in arable soil of North Rhine—Westphalia, Germany, 1979–2015. Eur. J. Soil Sci. 2016, 67, 616–623. [Google Scholar] [CrossRef]
- Batello, C.; Wade, L.; Cox, S.; Pogna, N.; Bozzini, A.; Choptiany, J. Perennial Crops for Food Security; FAO: Rome, Italy, 2014. [Google Scholar]
- Bell, L.W.; Byrne, F.; Ewing, M.A.; Wade, L.J. A preliminary whole-farm economic analysis of perennial wheat in an Australian dryland farming system. Agric. Syst. 2008, 96, 166–174. [Google Scholar] [CrossRef]
- Kane, D.A.; Rogé, P.; Snapp, S.S. A systematic review of perennial staple crops literature using topic modeling and bibliometric analysis. PLoS ONE 2016, 11, e0155788. [Google Scholar] [CrossRef] [PubMed]
- Cox, T.S.; Van Tassel, D.L.; Cox, C.M.; DeHaan, L.R. Progress in breeding perennial grains. Crop Pasture Sci. 2010, 61, 513–521. [Google Scholar] [CrossRef]
- Curwen-McAdams, C.; Jones, S.S. Breeding perennial grain crops based on wheat. Crop Sci. 2017, 57, 1172–1188. [Google Scholar] [CrossRef]
- Perennial Staple Crops of the World. Available online: https://permaculturenews.org/2012/02/25/perennial-staple-crops-of-the-world/ (accessed on 22 October 2018).
- Zhang, Y.; Li, Y.; Jiang, L.; Tian, C.; Lib, J.; Xiao, Z. Potential of perennial crop on environmental sustainability of agriculture. Procedia Environ. Sci. 2011, 10, 1141–1147. [Google Scholar] [CrossRef]
- Tsitsin, N.V.; Lubimova, V.F. New species and forms of cereals derived from hybridization between wheat and couch grass. Am. Nat. 1959, 93, 181–191. [Google Scholar] [CrossRef]
- Farmers Get Guidance on Growing New Perennial Grains. Available online: http://news.cornell.edu/stories/2018/03/farmers-get-guidance-growing-new-perennial-grains (accessed on 16 July 2018).
- Ryan, M.R.; Crews, T.E.; Culman, S.W.; DeHaan, L.R.; Hayes, R.C.; Jungers, J.M.; Bakker, M.G. Managing for multifunctionality in perennial grain crops. BioScience 2018, 68, 294–304. [Google Scholar] [CrossRef] [PubMed]
- Culman, S.W.; Snapp, S.S.; Ollenburger, M.; Basso, B.; DeHaan, L.R. Soil and water quality rapidly responds to the perennial grain Kernza wheatgrass. Agron. J. 2013, 105, 735–744. [Google Scholar] [CrossRef]
- Rogé, P.; Snapp, S.; Kakwera, M.N.; Mungai, L.; Jambo, I.; Peter, B. Ratooning and perennial staple crops in Malawi. A review. Agron. Sustain. Dev. 2016, 36, 50. [Google Scholar] [CrossRef]
- Zhang, S.; Wang, W.; Zhang, J.; Ting, Z.; Huang, W.; Xu, P.; Tao, D.; Fu, B.; Hu, F. The Progression of Perennial Rice Breeding and Genetics: Research in China; Perennial Crops for Food Security: Rome, Italy, 2014; pp. 27–38. [Google Scholar]
- Bell, L.W.; Wade, L.J.; Ewing, M.A. Perennial wheat: A review of environmental and agronomic prospects for development in Australia. Crop Pasture Sci. 2010, 61, 679–690. [Google Scholar] [CrossRef]
- Perennial Wheat. Available online: http://www.canr.msu.edu/foodsystems/uploads/files/E-3208.pdf (accessed on 16 July 2018).
- Toliver, D.K.; English, B.C.; Tyler, D.D.; Lee, J.; Menard, R.J.; Walton, J.C. Soil organic carbon changes for switchgrass farms in East Tennessee, USA. Soil Syst. 2018, 2, 25. [Google Scholar] [CrossRef]
- Glover, J.D.; Reganold, J.P. Perennial grains food security for the future. Issues Sci. Technol. 2010, 26, 41–47. [Google Scholar]
- Van Beilen, J.B.; Poirier, Y. Prospects for biopolymer production in plants. Adv. Biochem. Eng. Biotechnol. 2007, 107, 133–151. [Google Scholar] [PubMed]
- Aerts, R.; Chapin, F.S., III. The mineral nutrition of wild plants revisited: A re-evaluation of processes and patterns. Adv. Ecol. Res. 2000, 30, 1–67. [Google Scholar]
- Marschner, H. Mineral Nutrition of Higher Plants, 2nd ed.; Academic Press: London, UK, 1995. [Google Scholar]
- Maillard, A.; Diquélou, S.; Billard, V.; Laîné, P.; Garnica, M.; Prudent, M.; Garcia-Mina, J.-M.; Yvin, J.-C.; Ourry, A. Leaf mineral nutrient remobilization during leaf senescence and modulation by nutrient deficiency. Front. Plant Sci. 2015, 6, 317. [Google Scholar] [CrossRef] [PubMed]
- Diaz, C.; Lemaître, T.; Christ, A.; Azzopardi, M.; Kato, Y.; Sato, F.; Morot-Gaudry, J.-F.; Le Dily, F.; Masclaux-Daubresse, C. Nitrogen recycling and remobilization are differentially controlled by leaf senescence and development stage in Arabidopsis under low nitrogen nutrition. Plant Physiol. 2008, 147, 1437–1449. [Google Scholar] [CrossRef] [PubMed]
- Diaz-Mendoza, M.; Velasco-Arroyo, B.; Santamaria, M.E.; González-Melendi, P.; Martinez, M.; Diaz, I. Plant senescence and proteolysis: Two processes with one destiny. Gen. Molec. Biol. 2016, 39, 329–338. [Google Scholar] [CrossRef] [PubMed]
- Ospina, L.A.A. Autophagy, Senescence and Nitrogen Remobilization in Barley. Ph.D. Thesis, Paris-Sud University, Orsay, France, 2014. [Google Scholar]
- Von Fircks, Y.; Ericsson, T.; Sennerby-Forsse, L. Seasonal variation of macronutrients in leaves, stems and roots of Salix dasyclados Wimm. grown at two nutrient levels. Biomass Bioenergy 2001, 21, 321–334. [Google Scholar] [CrossRef]
- Epstein, E. Mineral Nutrition of Plants: Principles and Perspectives; Wiley: New York, NY, USA, 1972. [Google Scholar]
- Grigal, F.D.; Ohman, L.F.; Brander, R.B. Seasonal dynamics of tall shrubs in northeastern Minnesota: Biomass and nutrient element changes. For. Sci. 1976, 22, 195–208. [Google Scholar]
- Beale, C.V.; Long, S.P. Seasonal dynamics of nutrient accumulation and partitioning in the perennial C4-grasses Miscanthus × giganteus and Spartina cynosuroides. Biomass Bioenergy 1997, 12, 419–428. [Google Scholar] [CrossRef]
- Brink, G.E.; Sistani, K.R.; Oldham, J.L.; Pederson, G.A. Maturity effects on mineral concentration and uptake in annual ryegrass. J. Plant Nutr. 2006, 29, 1143–1155. [Google Scholar] [CrossRef]
- Wang, Z.; Lu, J.; Yang, M.; Yang, H.; Zhang, Q. Stoichiometric characteristics of carbon, nitrogen, and phosphorus in leaves of differently aged lucerne (Medicago sativa) stands. Front. Plant Sci. 2015, 6, 1062. [Google Scholar] [CrossRef] [PubMed]
- Schwartz, C.; Amasino, R. Nitrogen recycling and flowering time in perennial bioenergy crops. Front. Plant Sci. 2013, 4, 76. [Google Scholar] [CrossRef] [PubMed]
- Yang, J.; Worley, E.; Ma, Q.; Li, J.; Torres-Jerez, I.; Li, G.; Zhao, P.X.; Xu, Y.; Tang, Y.; Udvardi, M. Nitrogen remobilization and conservation, and underlying senescence-associated gene expression in the perennial switchgrass Panicum virgatum. New Phytol. 2016, 211, 75–89. [Google Scholar] [CrossRef] [PubMed]
- Ferchaud, F.; Vitte, G.; Machet, J.-M.; Beaudoin, N.; Catterou, M.; Mary, B. The fate of cumulative applications of 15N-labelled fertiliser in perennial and annual bioenergy crops. Agric. Ecosyst. Environ. 2016, 223, 76–86. [Google Scholar] [CrossRef]
- Alcoverro, T.; Manzanera, M.; Romero, J. Nutrient mass balance of the seagrass Posidonia oceanica: The importance of nutrient retranslocation. Mar. Ecol. Prog. Ser. 2000, 194, 13–21. [Google Scholar] [CrossRef]
- Bertin, C.; Yang, X.; Weston, L.A. The role of root exudates and allelochemicals in the rhizosphere. Plant Soil 2003, 256, 67–83. [Google Scholar] [CrossRef]
- Hamel, C. Impact of arbuscular mycorrhizal fungi on N and P cycling in the root zone. Canad. J. Soil Sci. 2004, 84, 383–395. [Google Scholar] [CrossRef] [Green Version]
- Neumann, G.; Bott, S.; Ohler, M.A.; Mock, H.-P.; Lippmann, R.; Grosch, R.; Smalla, K. Root exudation and root development of lettuce (Lactuca sativa L. cv. Tizian) as affected by different soils. Front. Microbiol. 2014, 5, 2. [Google Scholar] [CrossRef] [PubMed]
- Chapin, F.S., III. The mineral nutrition of wild plants. Annu. Rev. Ecol. Syst. 1980, 11, 233–260. [Google Scholar] [CrossRef]
- Tukey, H.B., Jr.; Wittwer, S.H.; Bukovac, M.J. Absorption of radionuclides by above-ground plant parts and movement within the plants. Agric. Food Chem. 1961, 9, 106–113. [Google Scholar] [CrossRef]
- Tukey, H.B., Jr. Leaching of metabolites from above-ground plant parts and its implications. Bull. Torrey Bot. Club 1966, 93, 385–401. [Google Scholar] [CrossRef]
- Maie, N.; Jaffé, R.; Miyoshi, T.; Childers, D.L. Quantitative and qualitative aspects of dissolved organic carbon leached from senescent plants in an oligotrophic wetland. Biogeochemistry 2006, 78, 285–314. [Google Scholar] [CrossRef]
- Tukey, H.B., Jr.; Tukey, H.B.; Wittwer, S.H. Loss of nutrients by foliar leaching as determined by radioisotopes. Proc. Am. Soc. Hort. Sci. 1958, 71, 496. [Google Scholar]
- Chapin, F.S., III. Effects of multiple stresses on nutrient availability and use. In Response of Plants to Multiple Stresses; Mooney, H.A., Winner, W.E., Pell, E.J., Eds.; Academic Press: San Diego, CA, USA, 1991; pp. 67–88. [Google Scholar]
- Schinner, F.; Öhlinger, R.; Kandeler, E.; Margesin, R. Bodenbiologische Arbeitsmethoden, 2nd ed.; Springer: Berlin, Germany, 1993. [Google Scholar]
- Sáez-Plaza, P.; Navas, M.J.; Wybraniec, S.; Michałowski, T.; Asuero, A.G. An overview of the Kjeldahl method of nitrogen determination. Part II. Sample preparation, working scale, instrumental finish, and quality control. Crit. Revs. Anal. Chem. 2013, 43, 224–272. [Google Scholar] [CrossRef]
- Gramss, G.; Voigt, K.-D. Gradual accumulation of heavy metals in an industrial wheat crop from uranium mine soil and the potential use of the herbage. Agriculture 2016, 6, 51. [Google Scholar] [CrossRef]
- Huang, H.; Guo, S.; Chen, G. Reproductive biology in an invasive plant Solidago canadensis. Front. Biol. China 2007, 2, 196–204. [Google Scholar] [CrossRef]
- Page, V.; Feller, U. Heavy metals in crop plants: Transport and redistribution processes on the whole plant level. Agronomy 2015, 5, 447–463. [Google Scholar] [CrossRef]
- Bastian, F.; Bouziri, L.; Nicolardot, B.; Ranjard, L. Impact of wheat straw decomposition on successional patterns of soil microbial community structure. Soil Biol. Biochem. 2009, 41, 262–275. [Google Scholar] [CrossRef]
- Cogle, A.L.; Saffigna, P.G.; Strong, W.M. Carbon transformations during wheat straw decomposition. Soil Biol. Biochem. 1989, 21, 367–372. [Google Scholar] [CrossRef]
- Sarker, J.R.; Singha, B.P.; Cowie, A.L.; Fang, Y.; Collins, D.; Dougherty, W.J.; Singh, B.K. Carbon and nutrient mineralisation dynamics in aggregate-size classes from different tillage systems after input of canola and wheat residues. Soil Biol. Biochem. 2018, 116, 22–38. [Google Scholar] [CrossRef]
- Corre, N.; Bouchart, V.; Ourry, A.; Boucaud, J. Mobilization of nitrogen reserves during regrowth of defoliated Trifolium repens L., and identification of potential vegetative storage proteins. J. Exp. Bot. 1996, 301, 1111–1118. [Google Scholar] [CrossRef]
- Cunningham, S.M.; Volenec, J.J. Purification and characterization of vegetative storage proteins from alfalfa (Medicago sativa L.) taproots. J. Plant Physiol. 1996, 147, 625–632. [Google Scholar] [CrossRef]
- Dierking, R.M.; Allen, D.J.; Cunningham, S.M.; Brouder, S.M.; Volenec, J.J. Nitrogen reserve pools in two Miscanthus × giganteus genotypes under contrasting N managements. Front. Plant Sci. 2017, 8, 1618. [Google Scholar] [CrossRef] [PubMed]
- Li, R.; Volenec, J.J.; Joern, B.C.; Cunningham, S.M. Seasonal changes in nonstructural carbohydrates, protein, and macronutrients in roots of alfalfa, red clover, sweetclover, and birdsfoot trefoil. Crop Sci. 1996, 36, 617–623. [Google Scholar] [CrossRef]
- Rice Straw and Wheat Straw—Potential Feedstocks for the Biobased Economy. Available online: https://library.wur.nl/WebQuery/wurpubs/reports/448025 (accessed on 5 December 2017).
- Steinmann, T.; Welp, G.; Wolf, A.; Holbeck, B.; Große-Rüschkamp, T.; Amelung, W. Repeated monitoring of organic carbon stocks after eight years reveals carbon losses from intensively managed agricultural soils in Western Germany. J. Plant Nutr. Soil Sci. 2016, 179, 355–366. [Google Scholar] [CrossRef]
- Early, R. Manage stubble load to save soil moisture. Farming Ahead 2004, 146, 31–32. [Google Scholar]
- Cereal Stubble Management On-Farm Demonstrations and Case Studies 2009. Available online: http://murrumbidgeelandcare.org.au/files/Stubble-Report-2009-results.pdf (accessed on 10 November 2017).
- Kanders, M.J.; Berendonk, C.; Fritz, C.; Watson, C.; Wichern, F. Catch crops store more nitrogen below-ground when considering rhizodeposits. Plant Soil 2017, 417, 287–299. [Google Scholar] [CrossRef]
- Wallace, J.M.; Williams, A.; Liebert, J.A.; Ackroyd, V.J.; Vann, R.A.; Curran, W.S.; Keene, C.L.; VanGessel, M.J.; Ryan, M.R.; Mirsky, S.B. Cover crop-based, organic rotational no-till corn and soybean production systems in the Mid-Atlantic United States. Agriculture 2017, 7, 34. [Google Scholar] [CrossRef]
- Tao, J.; Liu, X.; Liang, Y.; Niu, J.; Xiao, Y.; Gu, Y.; Ma, L.; Meng, D.; Zhang, Y.; Huang, W.; et al. Maize growth responses to soil microbes and soil properties after fertilization with different green manures. Appl. Microbiol. Biotechnol. 2017, 101, 1289–1299. [Google Scholar] [CrossRef] [PubMed]
- Wang, J.; Wang, X.; Xu, M.; Feng, G.; Zhang, W.; Yang, X.; Huang, S. Contributions of wheat and maize residues to soil organic carbon under long-term rotation in north China. Sci. Rep. 2015, 5, 11409. [Google Scholar] [CrossRef] [PubMed] [Green Version]
- Khan, T.S.; Mubeen, U. Wheat straw: A pragmatic overview. Curr. Res. J. Biol. Sci. 2012, 4, 673–675. [Google Scholar]
- Xu, K.; Liu, M.; Chen, J.-D.; Gu, H.-Y.; Dai, Q.-G.; Ma, K.-Q.; Jiang, F.; He, L. Effects of wheat straw returning into paddy soil on dissolved organic carbon contents and rice grain yield. Yingyong Shengtai Xuebao 2015, 26, 430–436. [Google Scholar] [PubMed]
- George, J.F.; Smeins, F.E. Decomposition of common curlymesquite herbage on Edwards Plateau Rangeland, Texas. J. Range Manag. 1982, 35, 104–106. [Google Scholar] [CrossRef]
- Straw Decomposition. Available online: https://eprints.nwisrl.ars.usda.gov/1147/1/93.pdf (accessed on 24 October 2018).
- Halsall, D.M.; Gibson, A.H. Comparison of two Cellulomonas strains and their interaction with Azospirillum brasilense in degradation of wheat straw and associated nitrogen fixation. Appl. Environ. Microbiol. 1986, 51, 855–861. [Google Scholar] [PubMed]
- Lynch, J.M.; Harper, S.H.T. Straw as a substrate for cooperative nitrogen fixation. J. Gen. Microbiol. 1983, 129, 251–253. [Google Scholar] [CrossRef]
- Schnitzer, M.; Monreal, C.M.; Powell, E.E. Wheat straw biomass: A resource for high-value chemicals. J. Environ. Sci. Health 2014, 49, 51–67. [Google Scholar] [CrossRef] [PubMed]
- Susic, M. Replenishing humic acids in agricultural soils. Agronomy 2016, 6, 45. [Google Scholar] [CrossRef]
- Knicker, H.; Fründ, R.; Lüdemann, H.-D. The chemical nature of nitrogen in native soil organic matter. Naturwissenschaften 1993, 80, 219–221. [Google Scholar] [CrossRef] [Green Version]
- Sonnenberg, L.B.; Johnson, J.D.; Christman, R.F. Chemical degradation of humic substances for structural characterization. In Aquatic Humic Substances: Influence on Fate and Treatment of Pollutants; American Chemical Society: Washington, DC, USA, 1989; pp. 3–23. [Google Scholar]
- Woods, G.C.; Simpson, M.J.; Koerner, P.J.; Napoli, A.; Simpson, A.J. HILIC-NMR: Toward the identification of individual molecular components in dissolved organic matter. Environ. Sci. Technol. 2011, 45, 3880–3886. [Google Scholar] [CrossRef] [PubMed]
- Li, X.G.; Jia, B.; Lv, J.; Ma, Q.; Kuzyakov, Y.; Li, F.-M. Nitrogen fertilization decreases the decomposition of soil organic matter and plant residues in planted soils. Soil Biol. Biochem. 2017, 112, 47–55. [Google Scholar] [CrossRef]
- Reid, J.B.; Goss, M.J. Suppression of decomposition of 14C-labelled plant roots in the presence of living roots of maize and perennial ryegrass. J. Soil Sci. 1982, 33, 387–395. [Google Scholar] [CrossRef]
- Cookson, W.R.; Beare, M.H.; Wilson, P.E. Effects of prior crop residue management on microbial properties and crop residue decomposition. Appl. Soil Ecol. 1998, 7, 179–188. [Google Scholar] [CrossRef]
- Rezig, F.A.M.; Elhadi, E.A.; Abdalla, M.R. Decomposition and nutrient release pattern of wheat (Triticum aestivum) residues under different treatments in desert field conditions of Sudan. Int. J. Recycl. Org. Waste Agric. 2014, 3, 69. [Google Scholar] [CrossRef]
- Gao, H.; Chen, X.; Wei, J.; Zhang, Y.; Zhang, L.; Chang, J.; Thompson, M.L. Decomposition dynamics and changes in chemical composition of wheat straw residue under anaerobic and aerobic conditions. PLoS ONE 2016, 11, e0158172. [Google Scholar] [CrossRef] [PubMed]
- Stevenson, F.J. Humus Chemistry, 2nd ed.; J. Wiley and Sons: New York, NY, USA, 1994. [Google Scholar]
- Wei, T.; Zhang, P.; Wang, K.; Ding, R.; Yang, B.; Nie, J.; Jia, Z.; Han, Q. Effects of wheat straw incorporation on the availability of soil nutrients and enzyme activities in semiarid areas. PLoS ONE 2015, 10, e0120994. [Google Scholar] [CrossRef] [PubMed]
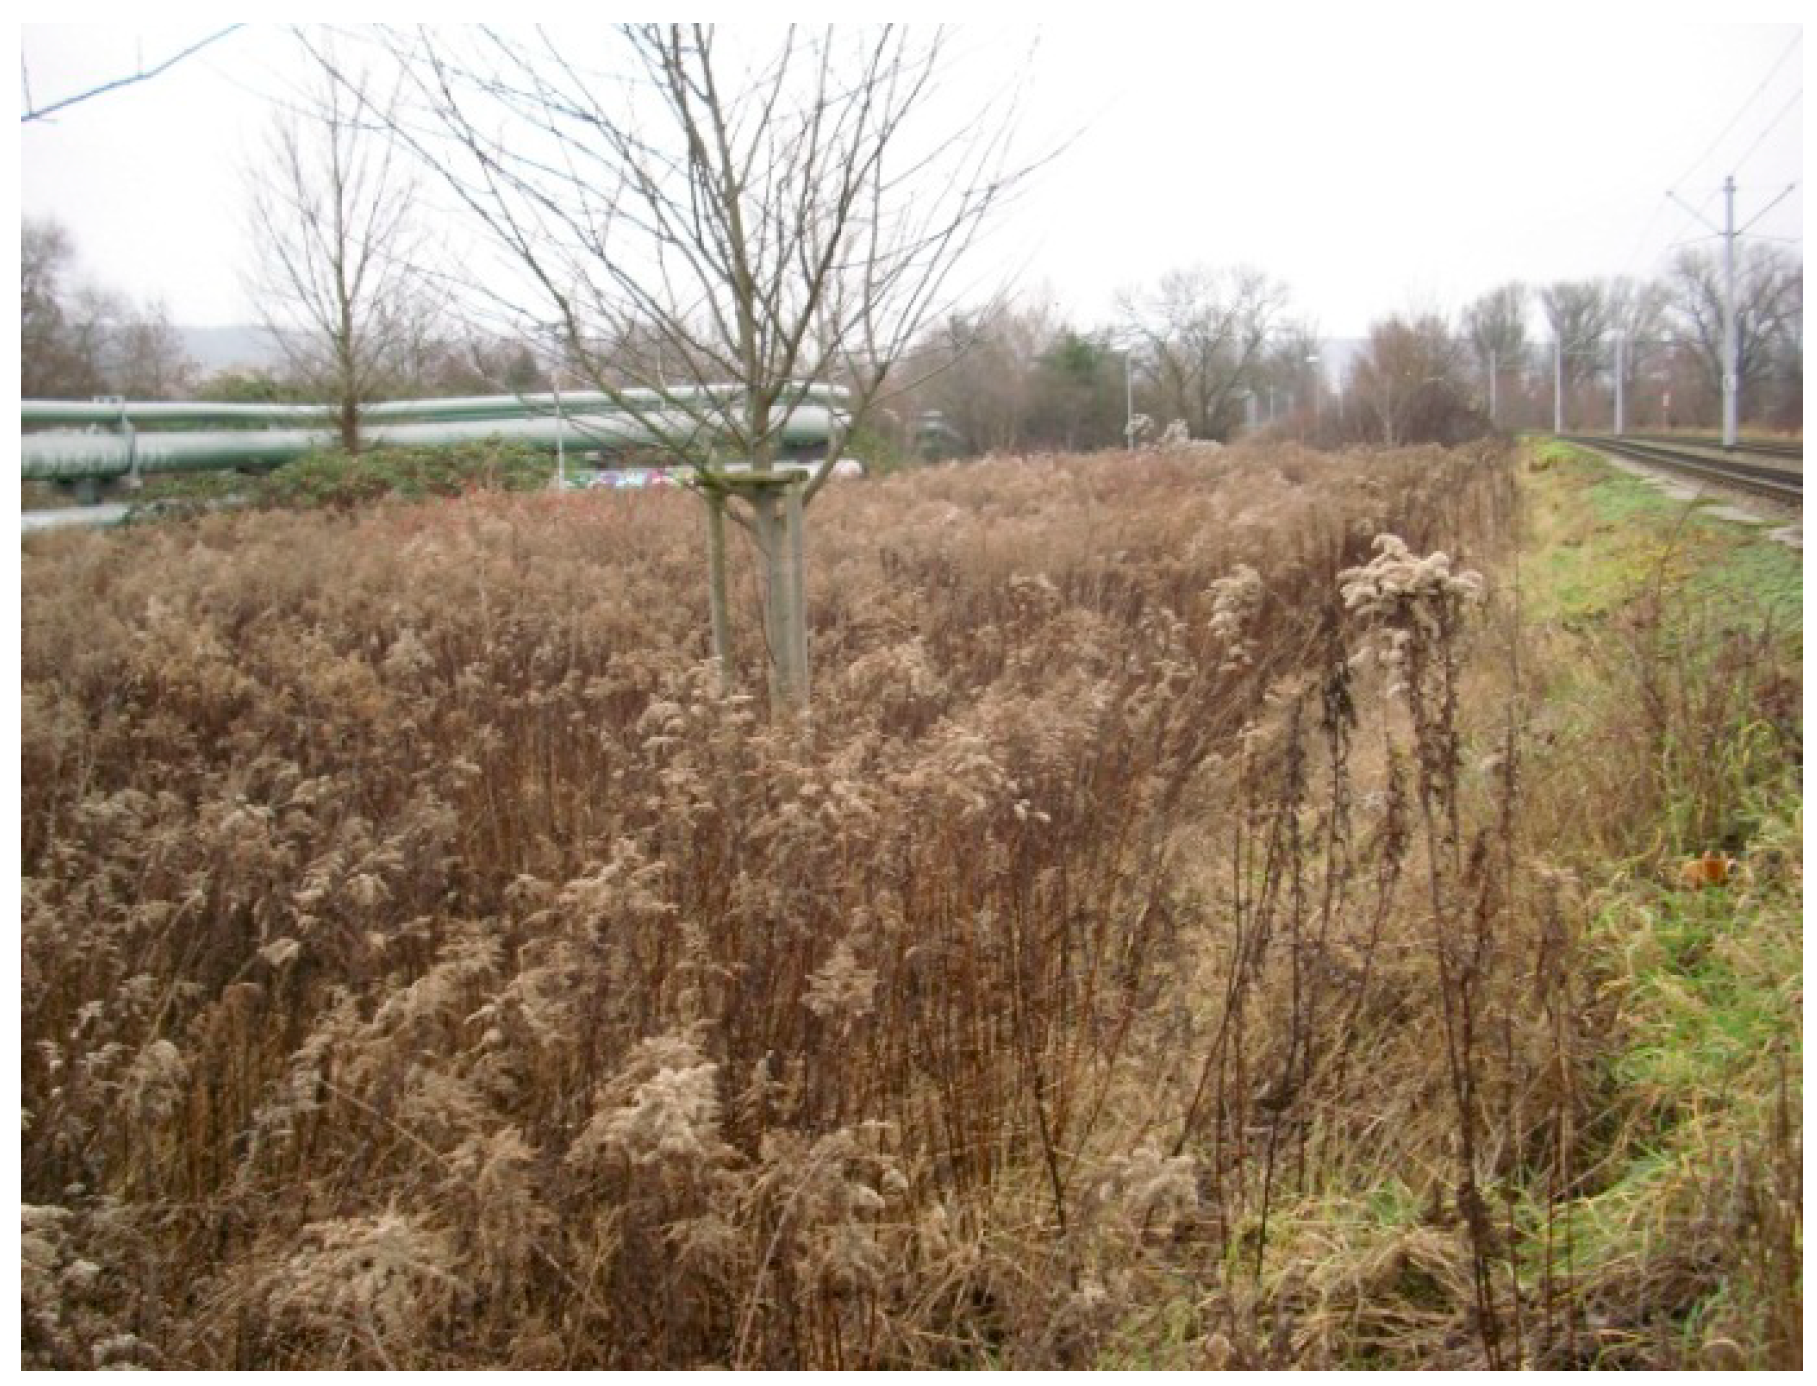
Figure 1.
The invasive Giant goldenrod stand at Jena-Burgau in November 2009.

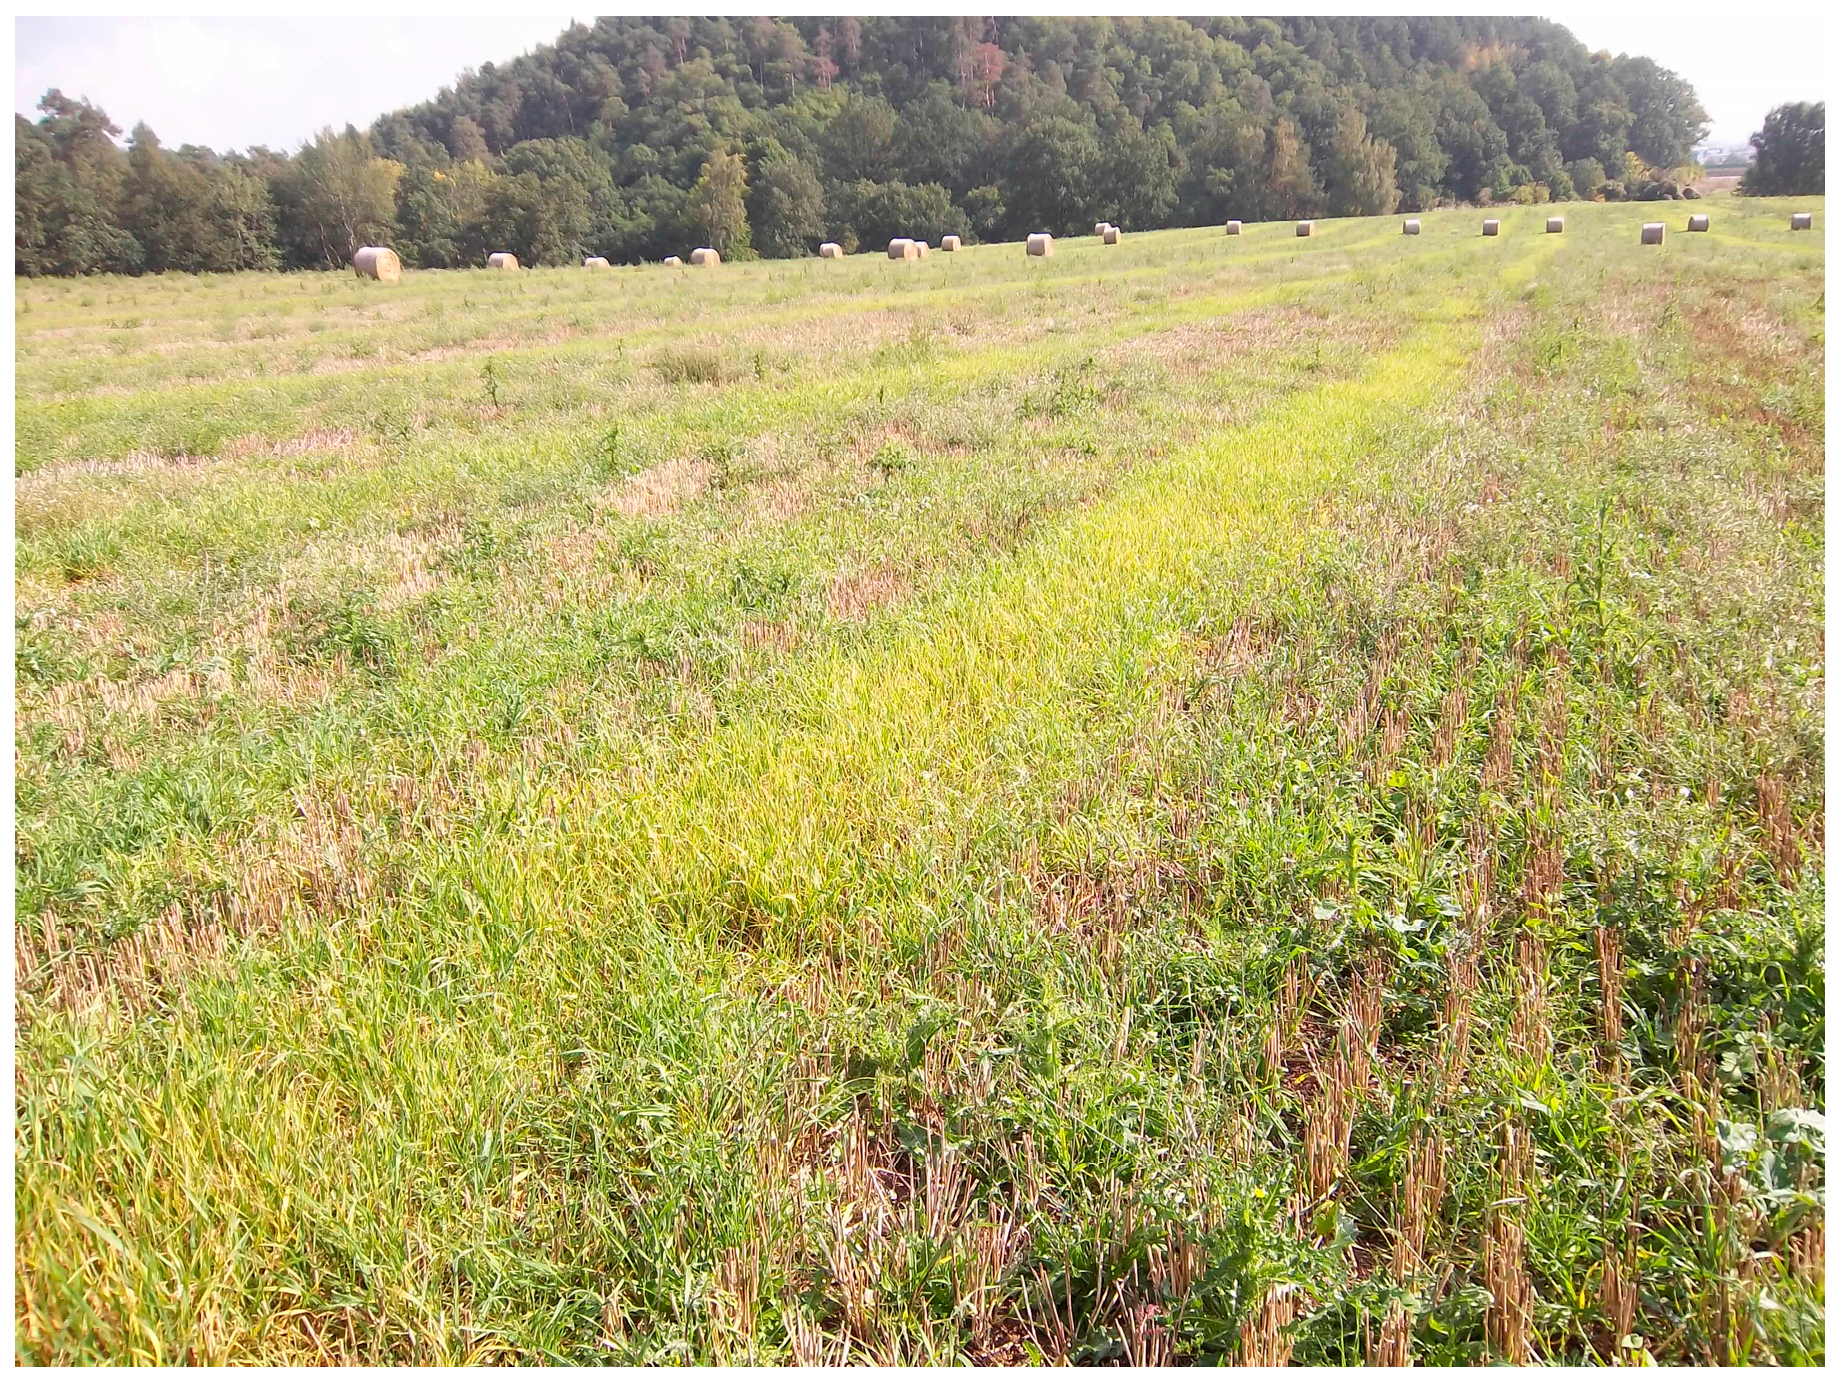
Figure 2.
Postharvest situation of the wheat crop in late September. Weeds in the 9-m cutting span of the harvester thresher accompany the dense chlorotic regrowth of spilt wheat grains within the former 1.6-m wide straw discharge.
Figure 2.
Postharvest situation of the wheat crop in late September. Weeds in the 9-m cutting span of the harvester thresher accompany the dense chlorotic regrowth of spilt wheat grains within the former 1.6-m wide straw discharge.

Figure 3.
Goldenrod: The cropland retention of the minerals (kg ha−1, figures heading the columns) both in dry 16-cm stubbles and roots during blooming (23 August, (a)), maturity (13 November, (b)), and resprouting (28 February, (c)). White column segments indicate the sums of minerals in shoots and roots prior to harvest (K, 178 kg ha−1 on 23 August). All columns refer to the zero axis. See Table 2 for details. Error bars indicate ± SD. NPK stock in stubbles/roots from 23 August to 28 February (kg ha−1): 78.5, 96.8, 82.3.
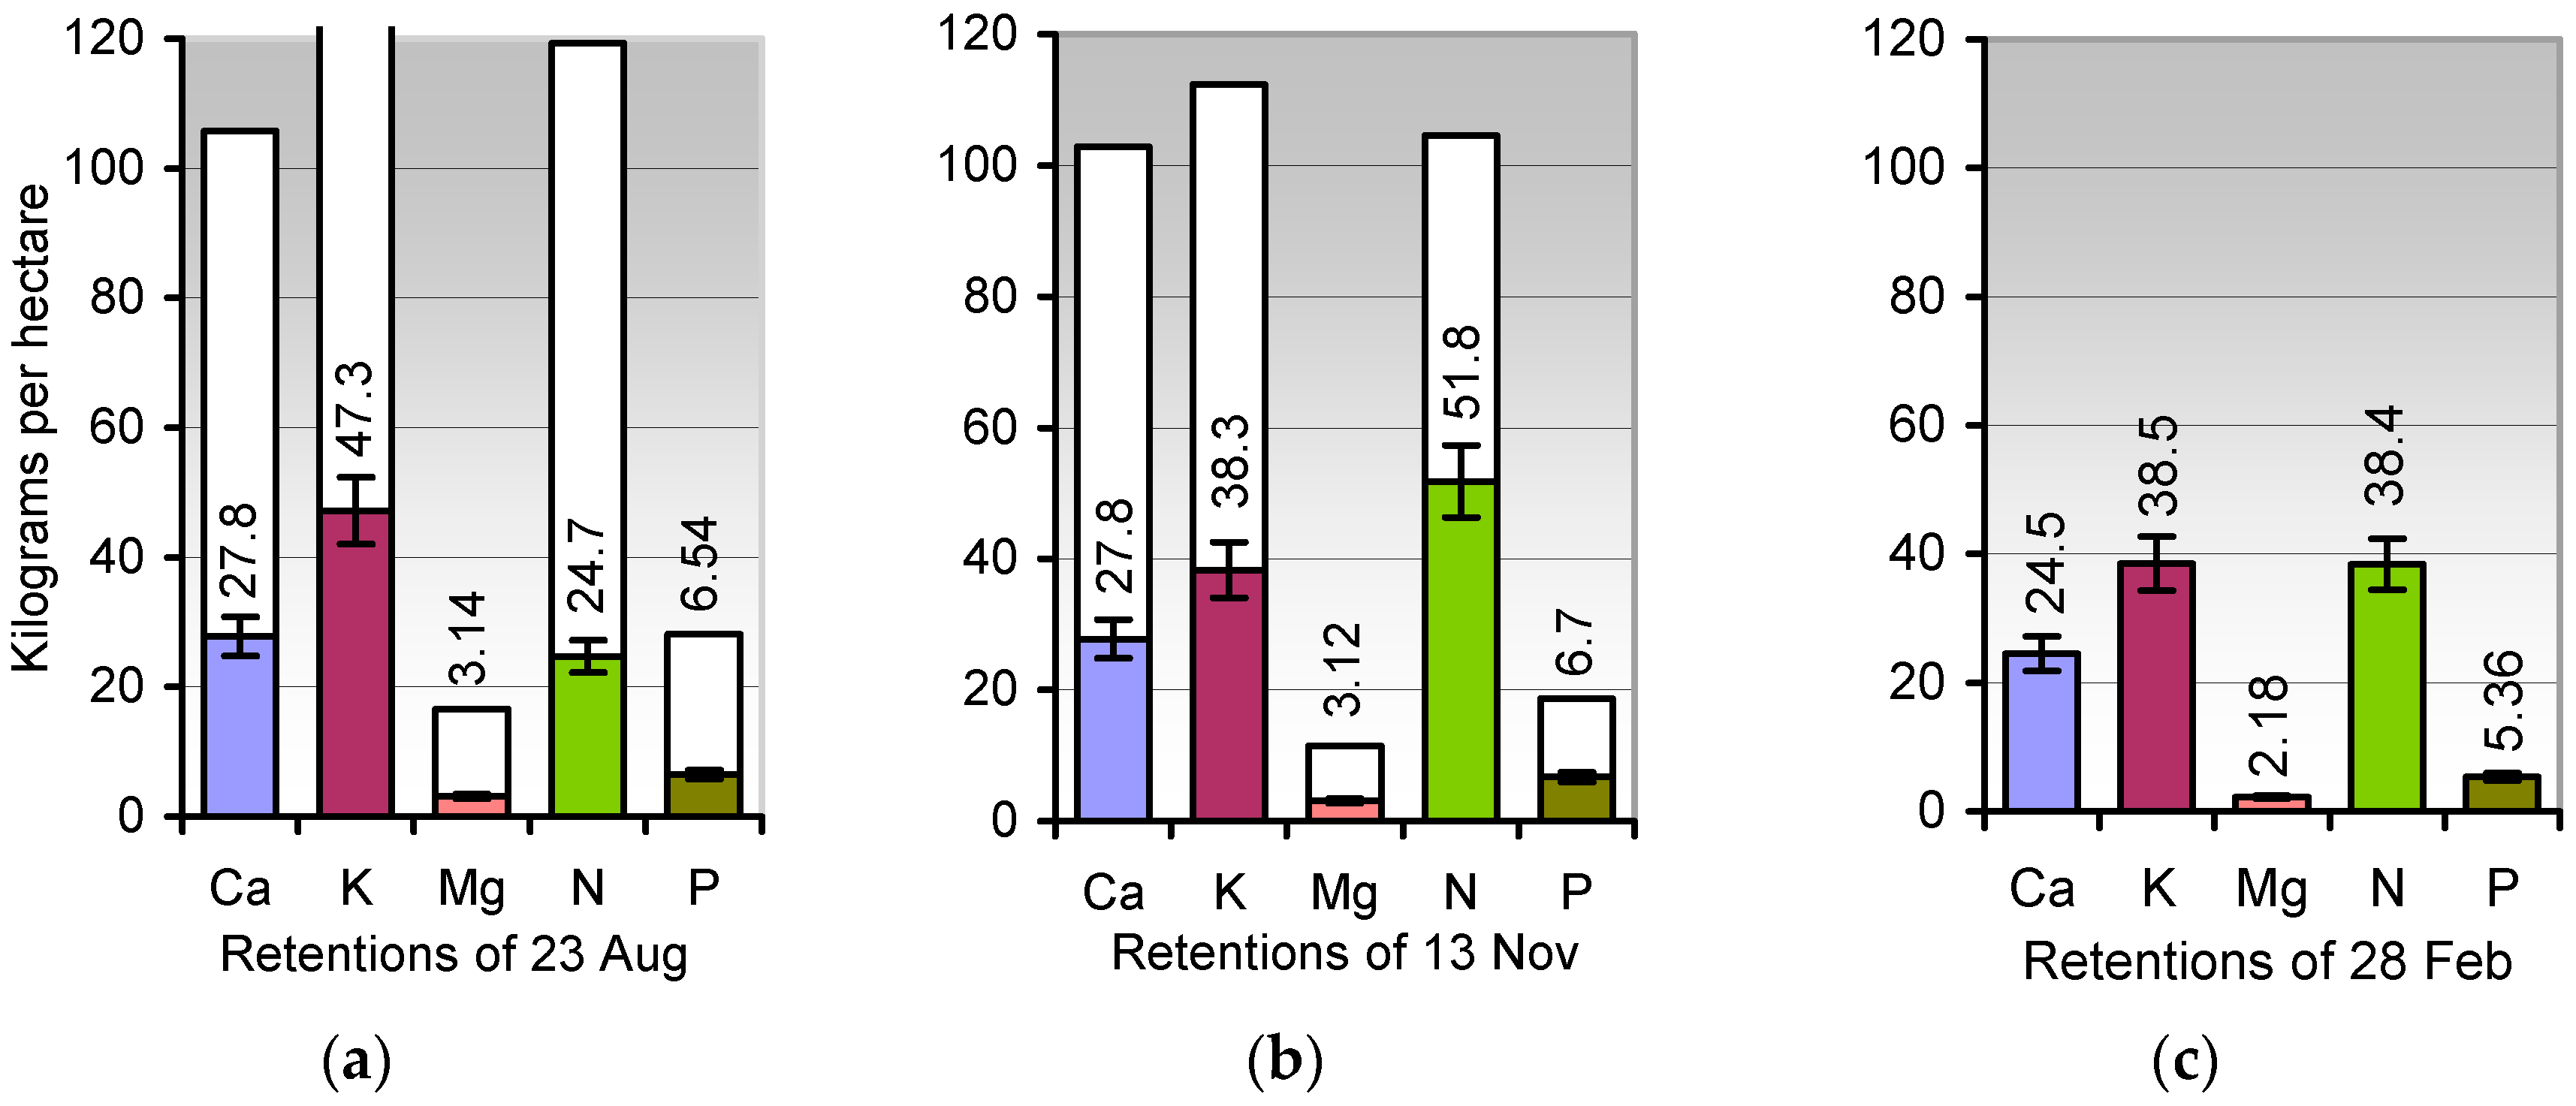
Figure 4.
Rotation wheat-maize: The cropland retention of the minerals (kg ha−1, figures heading the columns) in rooted stubbles 16 cm, in grains lost during harvest, and in the regrowth of wheat from spilt grains at 23 July (a), 19 September (b), 1 December (c), and 28 February (d). See Table 3 for details. Error bars indicate ± SD. NPK stock in stubbles/roots from 23 July to 28 February (kg ha−1): 107.2, 103.8, 61.7, 68.8.

Figure 5.
Persistence of the biomass from harvest to postwinter in the composition of decaying wheat stubbles, spilt grains, the biomass regrowing from spilt grains, and the seedlings of the subsequent crop. A, Crop rotation wheat-maize; B, rotation wheat-wheat. The upper columns do not refer to the zero axis. Error bars, ± SD for the total biomass values heading the columns.

Figure 6.
Rotation wheat-wheat: The cropland retention of the minerals (kg ha−1, figures heading the columns) in rooted stubbles 16 cm and in the regrowth of wheat from spilt grains prior to, and after ploughing-down on 28 September. See Table 4 for details. Error bars indicate ± SD. NPK stock in stubbles/roots from 19 September (a) via 1 December (b) to 28 February (kg ha−1, c): 103.8, 67.3, 85.5.


Table 1.
Mean values soil mineral concentrations (mg kg−1 by dry weight (DW)).
| Soil Type | As | Ca | Cd | Cr | Cs | Cu | Fe | K | Mg |
| A | 11.1 | 44,520 | 0.35 | 31.7 | 1.91 | 32.2 | 24,170 | 3130 | 8320 |
| B | 3.62 | 1056 | 0.105 | 12.9 | 0.990 | 8.4 | 6592 | 1749 | 1364 |
| Soil Type | Mn | Ni | NO3-N | NH4-N | P | Pb | Sr | U | Zn |
| A | 750 | 31.3 | 68 | ND | 685 | 37.7 | 150 | 1.18 | 84 |
| B | 198 | 6.49 | 0 | 27 | 385 | 9.4 | ND | 0.547 | 33.1 |
Note: ND—not determined.
Table 2.
Goldenrod: Total biomass and minerals (kg ha−1 DW) in shoots and roots at blooming (23 August), maturity (13 November), and resprouting (28 February). ( )—concentrations given in kg Mg−1 DW.
Table 2.
Goldenrod: Total biomass and minerals (kg ha−1 DW) in shoots and roots at blooming (23 August), maturity (13 November), and resprouting (28 February). ( )—concentrations given in kg Mg−1 DW.
| Biomass | Ca | K | Mg | N | P | Zn | |
|---|---|---|---|---|---|---|---|
| Biomass at Anthesis, 23 August | |||||||
| Whole shoots incl. stubbles | 10,070 | 81.9 (8.14) | 143 (14.2) | 13.8 (1.37) | 98.4 (9.77) | 22.9 (2.27) | 0.242 (0.024) |
| Whole roots | 2850 | 23.9 (8.39) | 35.1 (12.3) | 2.73 (0.957) | 20.9 (7.33) | 5.30 (1.86) | 0.070 (0.025) |
| 16-cm stubbles section | 1085 | 3.94 (3.63) | 12.2 (11.2) | 0.405 (0.373) | 3.79 (3.49) | 1.24 (1.15) | 0.015 (0.014) |
| Roots/stubbles vs. 23 August a | 3935 (30.5%) | 27.8 (26.3%) | 47.3 (26.6%) | 3.14 (19.0%) | 24.7 (20.7%) | 6.54 (23.2%) | 0.085 (27.2%) |
| Shoot Biomass at Maturity, 13 November, and Total Offtake by Harvest | |||||||
| Whole shoots incl. stubbles | 7778 | 79.0 (10.2) | 77.5 (9.97) | 8.73 (1.12) | 54.7 (7.03) | 12.2 (1.57) | 0.271 (0.035) |
| Total offtake c | 6940 | 74.9 | 74.1 | 8.36 | 52.7 | 11.9 | 0.255 |
| Remaining Postharvest Biomass, 13 November | |||||||
| Stubbles 16 cm | 838 | 4.10 (4.90) | 3.42 (4.08) | 0.368 (0.439) | 2.01 (2.40) | 0.287 (0.343) | 0.016 (0.019) |
| Whole roots | 2850 | 23.7 (8.32) | 34.9 (12.2) | 2.75 (0.964) | 49.7 (17.5) | 6.40 (2.25) | 0.083 (0.029) |
| Roots/stubbles vs. 13 November b | 3688 (34.7%) | 27.8 (27%) | 38.3 (34.1%) | 3.12 (27.2%) | 51.8 (49.6%) | 6.69 (36%) | 0.099 (28%) |
| Postharvest Biomass at Resprouting, 28 February | |||||||
| Stubbles 16 cm | 838 | 4.49 (5.36) | 1.77 (2.11) | 0.360 (0.430) | 2.10 (2.50) | 0.234 (0.279) | 0.014 (0.017) |
| Whole roots | 2850 | 20.0 (7.03) | 36.7 (12.9) | 1.82 (0.637) | 36.3 (12.8) | 5.13 (1.80) | 0.065 (0.023) |
| Roots/stubbles | 3688 | 24.5 | 38.5 | 2.18 | 38.4 | 5.36 | 0.079 |
Note: Total retention by the cropland of biomass and minerals comprises stubbles as part of the whole shoot, and roots. The respective amounts (%) in biomass and minerals then refer to the sums of total values in whole shoots and roots at 23 August a or 13 November b. c Total values of whole shoots without stubbles, denoting the harvested biomass. Standard deviations in the concentration of minerals range ±0.6%–3.4 (−10)%, and those of total values depending on the per hectare biomass reach ±11% of value.
Table 3.
Rotation wheat-maize: Total biomass and minerals (kg ha−1 DW) of the harvestable wheat crop, of 16-cm stubbles (800 m−2), and the regrowth of wheat cv. Kavalier emerging from spilt grains between harvest and postwinter. ( ) concentrations given in kg Mg−1 DW.
Table 3.
Rotation wheat-maize: Total biomass and minerals (kg ha−1 DW) of the harvestable wheat crop, of 16-cm stubbles (800 m−2), and the regrowth of wheat cv. Kavalier emerging from spilt grains between harvest and postwinter. ( ) concentrations given in kg Mg−1 DW.
| Biomass | Ca | K | Mg | Norg | NO3-N | P | Zn | |
|---|---|---|---|---|---|---|---|---|
| Biomass at Harvest, 23 July | ||||||||
| Straw without stubbles | 5980 ± 550 | 13.7 (2.29) | 99.3 (16.6) | 4.81 (0.805) | 53.2 (8.9) | 7.00 (1.17) | 6.82 (1.14) | 0.060 (0.010) |
| Grains | 7090 ± 670 | 3.20 (0.452) | 29.4 (4.15) | 9.14 (1.29) | 160 (22.6) | 0 (0) | 25.7 (3.62) | 0.220 (0.031) |
| Stubbles | 2772 ± 84 | 3.82 (1.38) | 62.0 (22.4) | 1.19 (0.431) | 31.6 (11.4) | 7.57 (2.73) | 2.49 (0.900) | 0.022 (0.008) |
| Spilt grains | 116 ± 9 | 0.052 (0.452) | 0.482 (4.15) | 0.149 (1.29) | 2.62 (22.6) | 0 (0) | 0.420 (3.62) | 0.004 (0.031) |
| Stubbles plus spilt grains a | 2888 ± 85 (18%) | 3.87 (18.6%) | 62.5 (32.7%) | 1.34 (8.8%) | 41.8 (16%) | 2.91 (8.2%) | 0.026 (8.5%) | |
| Biomass after Emergence of Wheat Regrowth, 19 September | ||||||||
| Stubbles | 2243 ± 115 | 4.27 (1.90) | 13.0 (5.81) | 1.13 (0.503) | 26.0 (11.6) | 0.323 (0.144) | 3.01 (1.34) | 0.028 (0.013) |
| Regrowth | 1106 ± 7 | 3.72 (3.36) | 31.5 (28.5) | 0.991 (0.896) | 24.9 (22.5) | 0.954 (0.863) | 4.12 (3.73) | 0.028 (0.025) |
| Biomass at the Outset of Winter, 1 December | ||||||||
| Stubbles | 2088 ± 107 | 4.00 (1.91) | 4.59 (2.20) | 0.992 (0.475) | 11.3 (5.4) | 0.223 (0.107) | 0.983 (0.471) | 0.018 (0.009) |
| Regrowth | 897 ± 7 | 2.58 (2.87) | 18.3 (20.4) | 0.761 (0.848) | 22.2 (24.8) | 0.850 (0.946) | 3.20 (3.57) | 0.029 (0.032) |
| Biomass at the End of Winter, 28 February | ||||||||
| Stubbles | 1867 ± 44 | 5.66 (3.03) | 2.67 (1.43) | 1.21 (0.650) | 13.8 (7.4) | 0 (0) | 1.18 (0.633) | 0.022 (0.012) |
| Regrowth | 977 ± 7 | 3.03 (3.10) | 19.3 (19.7) | 1.06 (1.08) | 27.8 (28.4) | 0.340 (0.348) | 3.72 (3.81) | 0.039 (0.040) |
a Percentages in biomass and minerals refer to whole-plant values of 23 August. Standard deviations in the concentration of minerals range ±0.6%–3.1 (–4.5)%, and those of total values depending on the per hectare biomass reach 5%–7% of value.
Table 4.
Rotation wheat-wheat: Total biomass and minerals (kg ha−1 DW) of rooted 16-cm stubbles (800 m−2), the regrowth of wheat emerging from spilt grains (both ploughed down on 28 September), and the consecutive wheat crop cv. Bussard sown on 4 October. ( )—concentrations given in kg Mg−1 DW.
Table 4.
Rotation wheat-wheat: Total biomass and minerals (kg ha−1 DW) of rooted 16-cm stubbles (800 m−2), the regrowth of wheat emerging from spilt grains (both ploughed down on 28 September), and the consecutive wheat crop cv. Bussard sown on 4 October. ( )—concentrations given in kg Mg−1 DW.
| Biomass | Ca | K | Mg | Norg | NO3-N | P | Zn | |
|---|---|---|---|---|---|---|---|---|
| Biomass Monitored on 19 September Ploughed down on 28 September | ||||||||
| Stubbles | 2243 ± 115 | 4.27 (1.90) | 13.0 (5.81) | 1.13 (0.503) | 26.0 (11.6) | 0.323 (0.144) | 3.01 (1.34) | 0.028 (0.013) |
| Regrowth | 1106 ± 7 | 3.72 (3.36) | 31.5 (28.5) | 0.991 (0.896) | 24.9 (22.5) | 0.954 (0.863) | 4.12 (3.73) | 0.028 (0.025) |
| Biomass at the Outset of Winter, 1 December | ||||||||
| Stubbles | 1622 ± 86 | 7.59 (4.68) | 3.52 (2.17) | 1.18 (0.726) | 20.9 (12.9) | 0 (0) | 1.82 (1.12) | 0.022 (0.013) |
| Regrowth | 709 ± 26 | 5.18 (7.31) | 2.73 (3.85) | 1.00 (1.41) | 14.4 (20.3) | 0.013 (0.019) | 2.18 (3.07) | 0.026 (0.036) |
| Seedlings | 215 ± 28 | 0.817 (3.80) | 10.7 (49.7) | 0.376 (1.75) | 8.2 (38.0) | 1.73 (8.04) | 1.12 (5.21) | 0.009 (0.040) |
| Biomass at the End of Winter, 28 February | ||||||||
| Stubbles | 1568 ± 84 | 8.73 (5.57) | 3.45 (2.20) | 1.41 (0.900) | 23.0 (14.7) | 0 (0) | 2.05 (1.31) | 0.28 (0.18) |
| Regrowth | 669 ± 52 | 6.96 (10.4) | 2.52 (3.77) | 1.18 (1.76) | 14.4 (21.5) | 0.064 (0.096) | 2.96 (4.43) | 0.032 (0.048) |
| Seedlings | 454 ± 59 | 2.00 (4.41) | 20.2 (44.4) | 0.808 (1.78) | 14.3 (31.5) | 0.825 (1.82) | 1.78 (3.91) | 0.014 (0.030) |
Note: Total minerals introduced with seeds (153.6 kg ha−1 for 400 kernels m−2) in the order of (kg ha−1) 0.076 (Ca), 1.0 (K), 0.23 (Mg), 3.89 (N), 0.73 (P), and 0.004 (Zn) have not been subtracted from those of the seedlings. Standard deviations in the concentration of minerals range ±0.6%–3.1 (–4.5)%, and those of total values depending on the per hectare biomass reach 5%–7% of value.
© 2018 by the authors. Licensee MDPI, Basel, Switzerland. This article is an open access article distributed under the terms and conditions of the Creative Commons Attribution (CC BY) license (http://creativecommons.org/licenses/by/4.0/).
Share and Cite
MDPI and ACS Style
Gramss, G.; Voigt, K.-D. Turnover of Minerals and Organics in the Postharvest Herbage of Annuals and Perennials: Winter Wheat and Goldenrod. Agriculture 2018, 8, 170. https://doi.org/10.3390/agriculture8110170
AMA Style
Gramss G, Voigt K-D. Turnover of Minerals and Organics in the Postharvest Herbage of Annuals and Perennials: Winter Wheat and Goldenrod. Agriculture. 2018; 8(11):170. https://doi.org/10.3390/agriculture8110170
Chicago/Turabian StyleGramss, Gerhard, and Klaus-Dieter Voigt. 2018. "Turnover of Minerals and Organics in the Postharvest Herbage of Annuals and Perennials: Winter Wheat and Goldenrod" Agriculture 8, no. 11: 170. https://doi.org/10.3390/agriculture8110170
Note that from the first issue of 2016, this journal uses article numbers instead of page numbers. See further details here.