Biomass and Biogas Yield of Maize (Zea mays L.) Grown under Artificial Shading

 , ,
, ,
Abstract
:1. Introduction
2. Materials and Methods
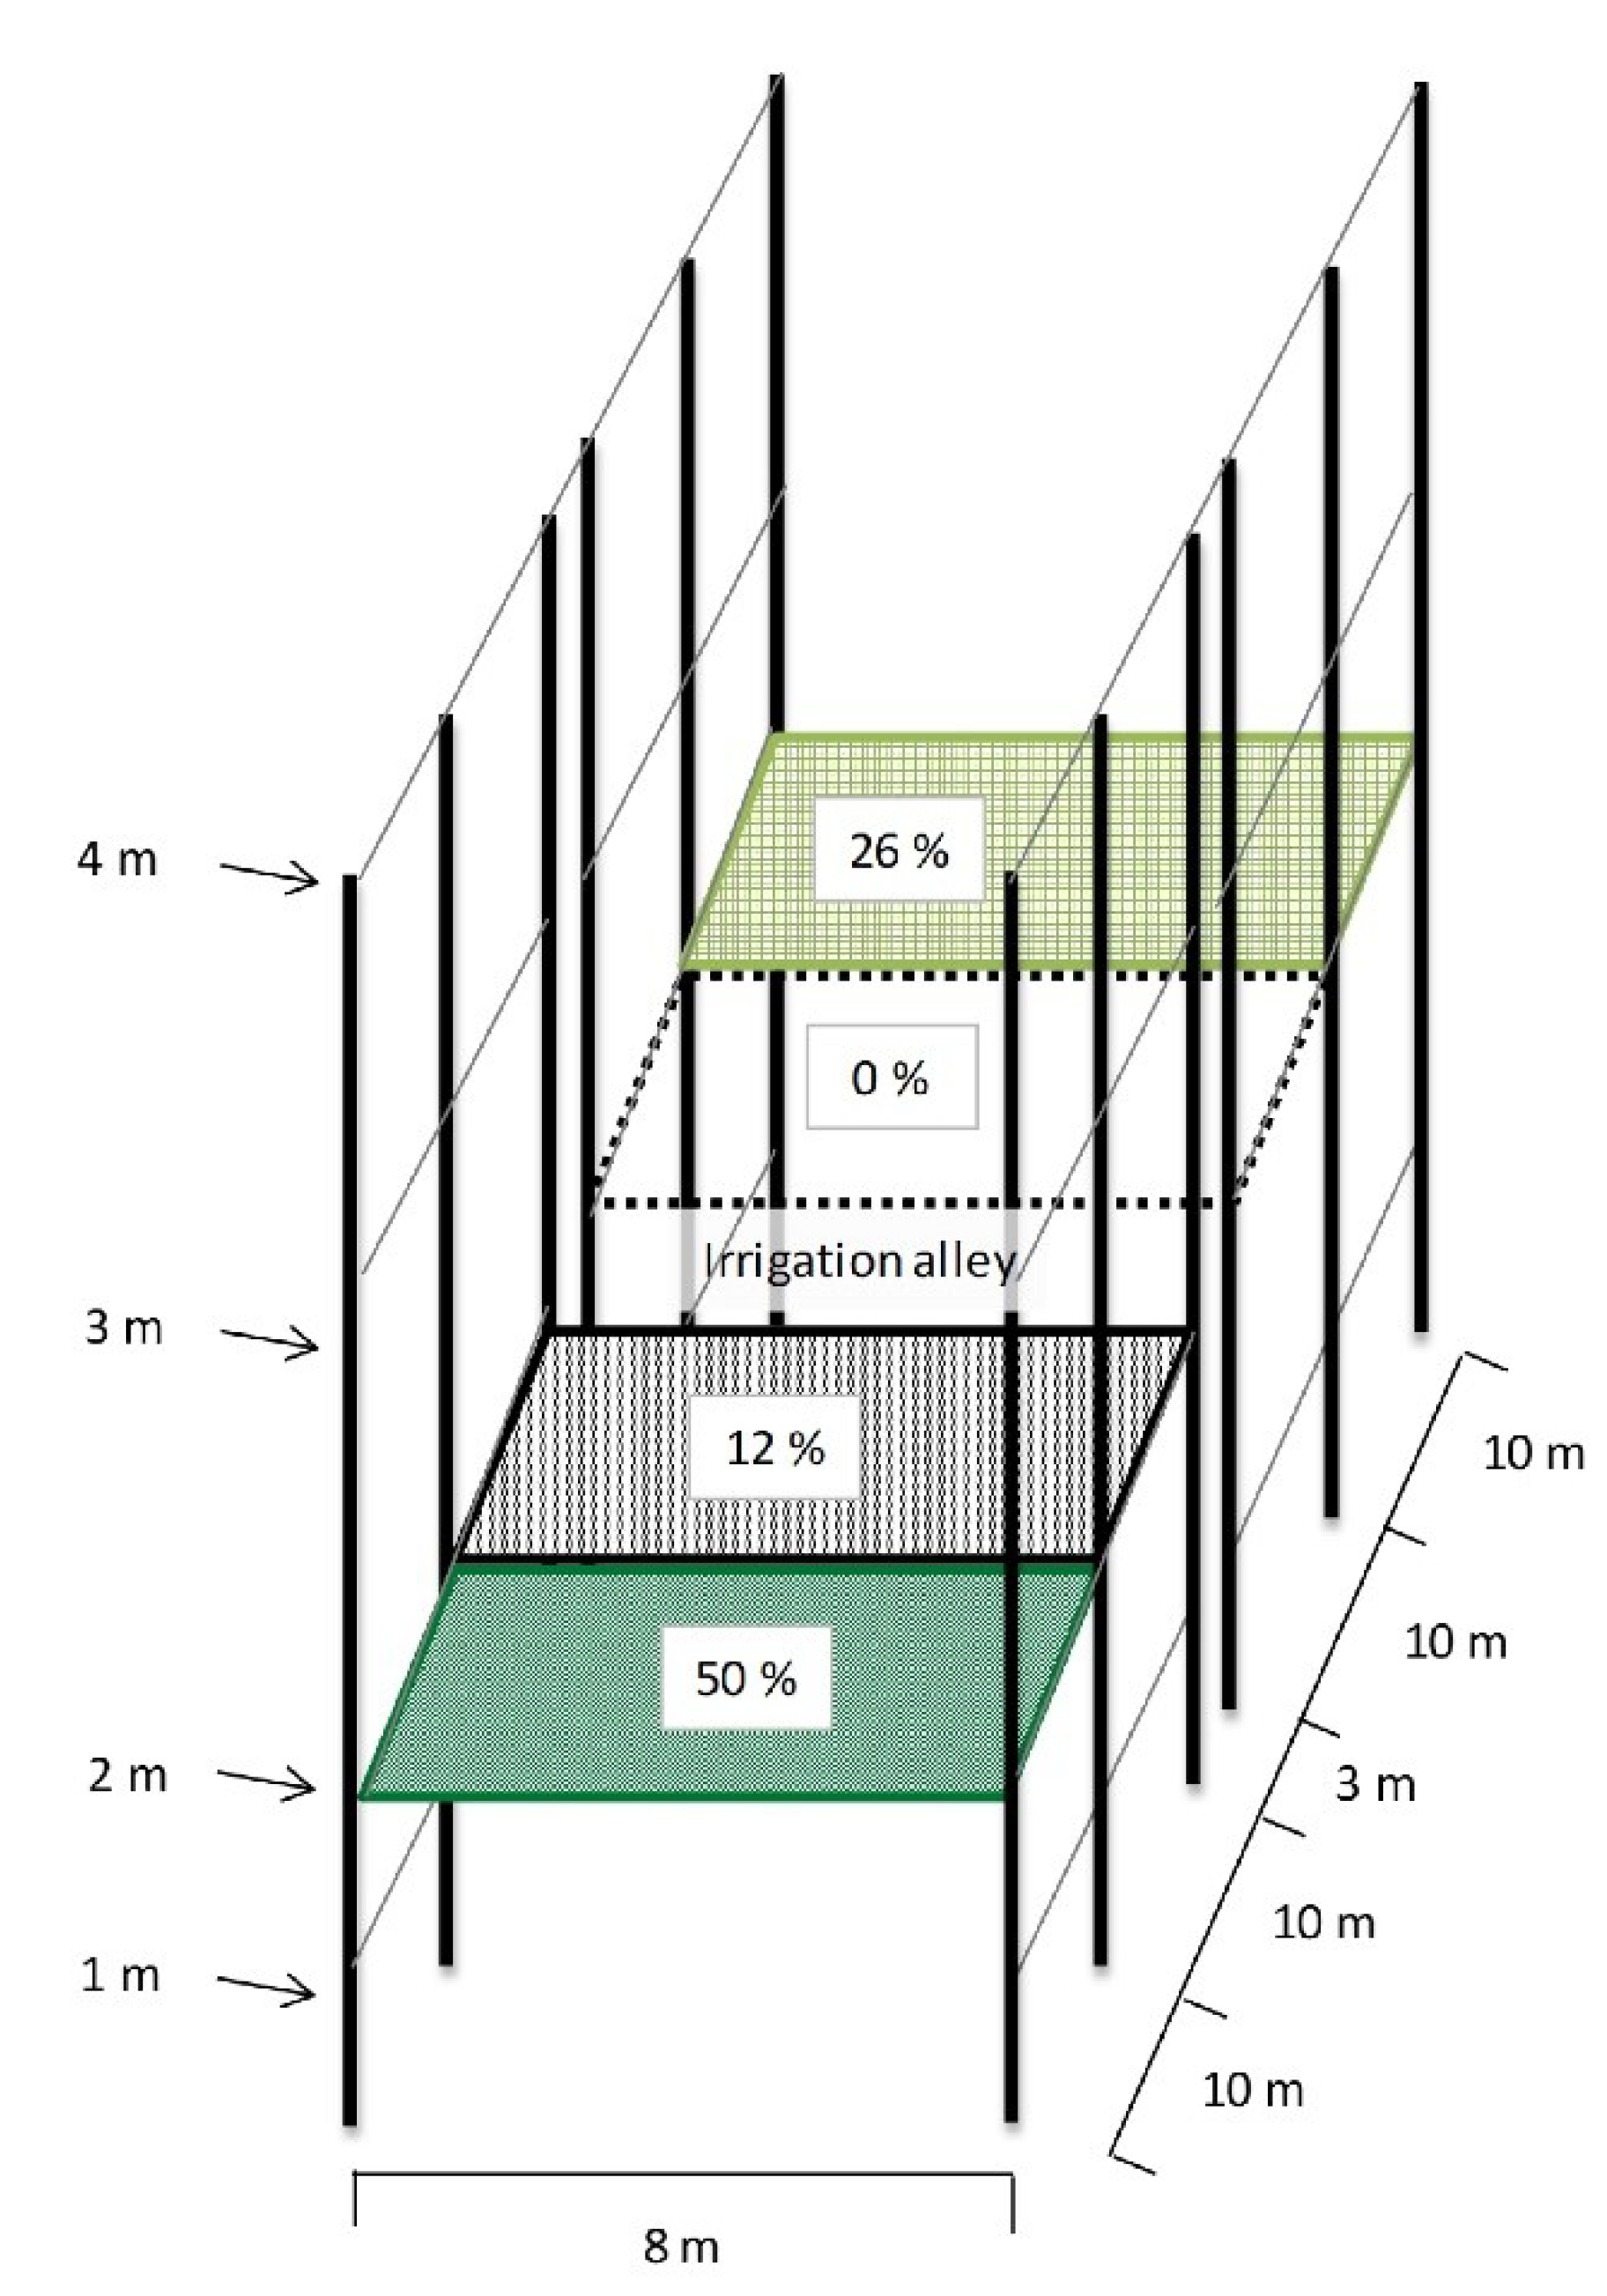
2.1. Study Site and Experimental Design
2.2. Shade Levels
2.3. Data Collection
2.3.1. Plant Growth
2.3.2. Yield
2.3.3. Chemical Analysis and Calculation of Biogas and Methane Yield
2.4. Data Analysis
3. Results
3.1. Growth Stages
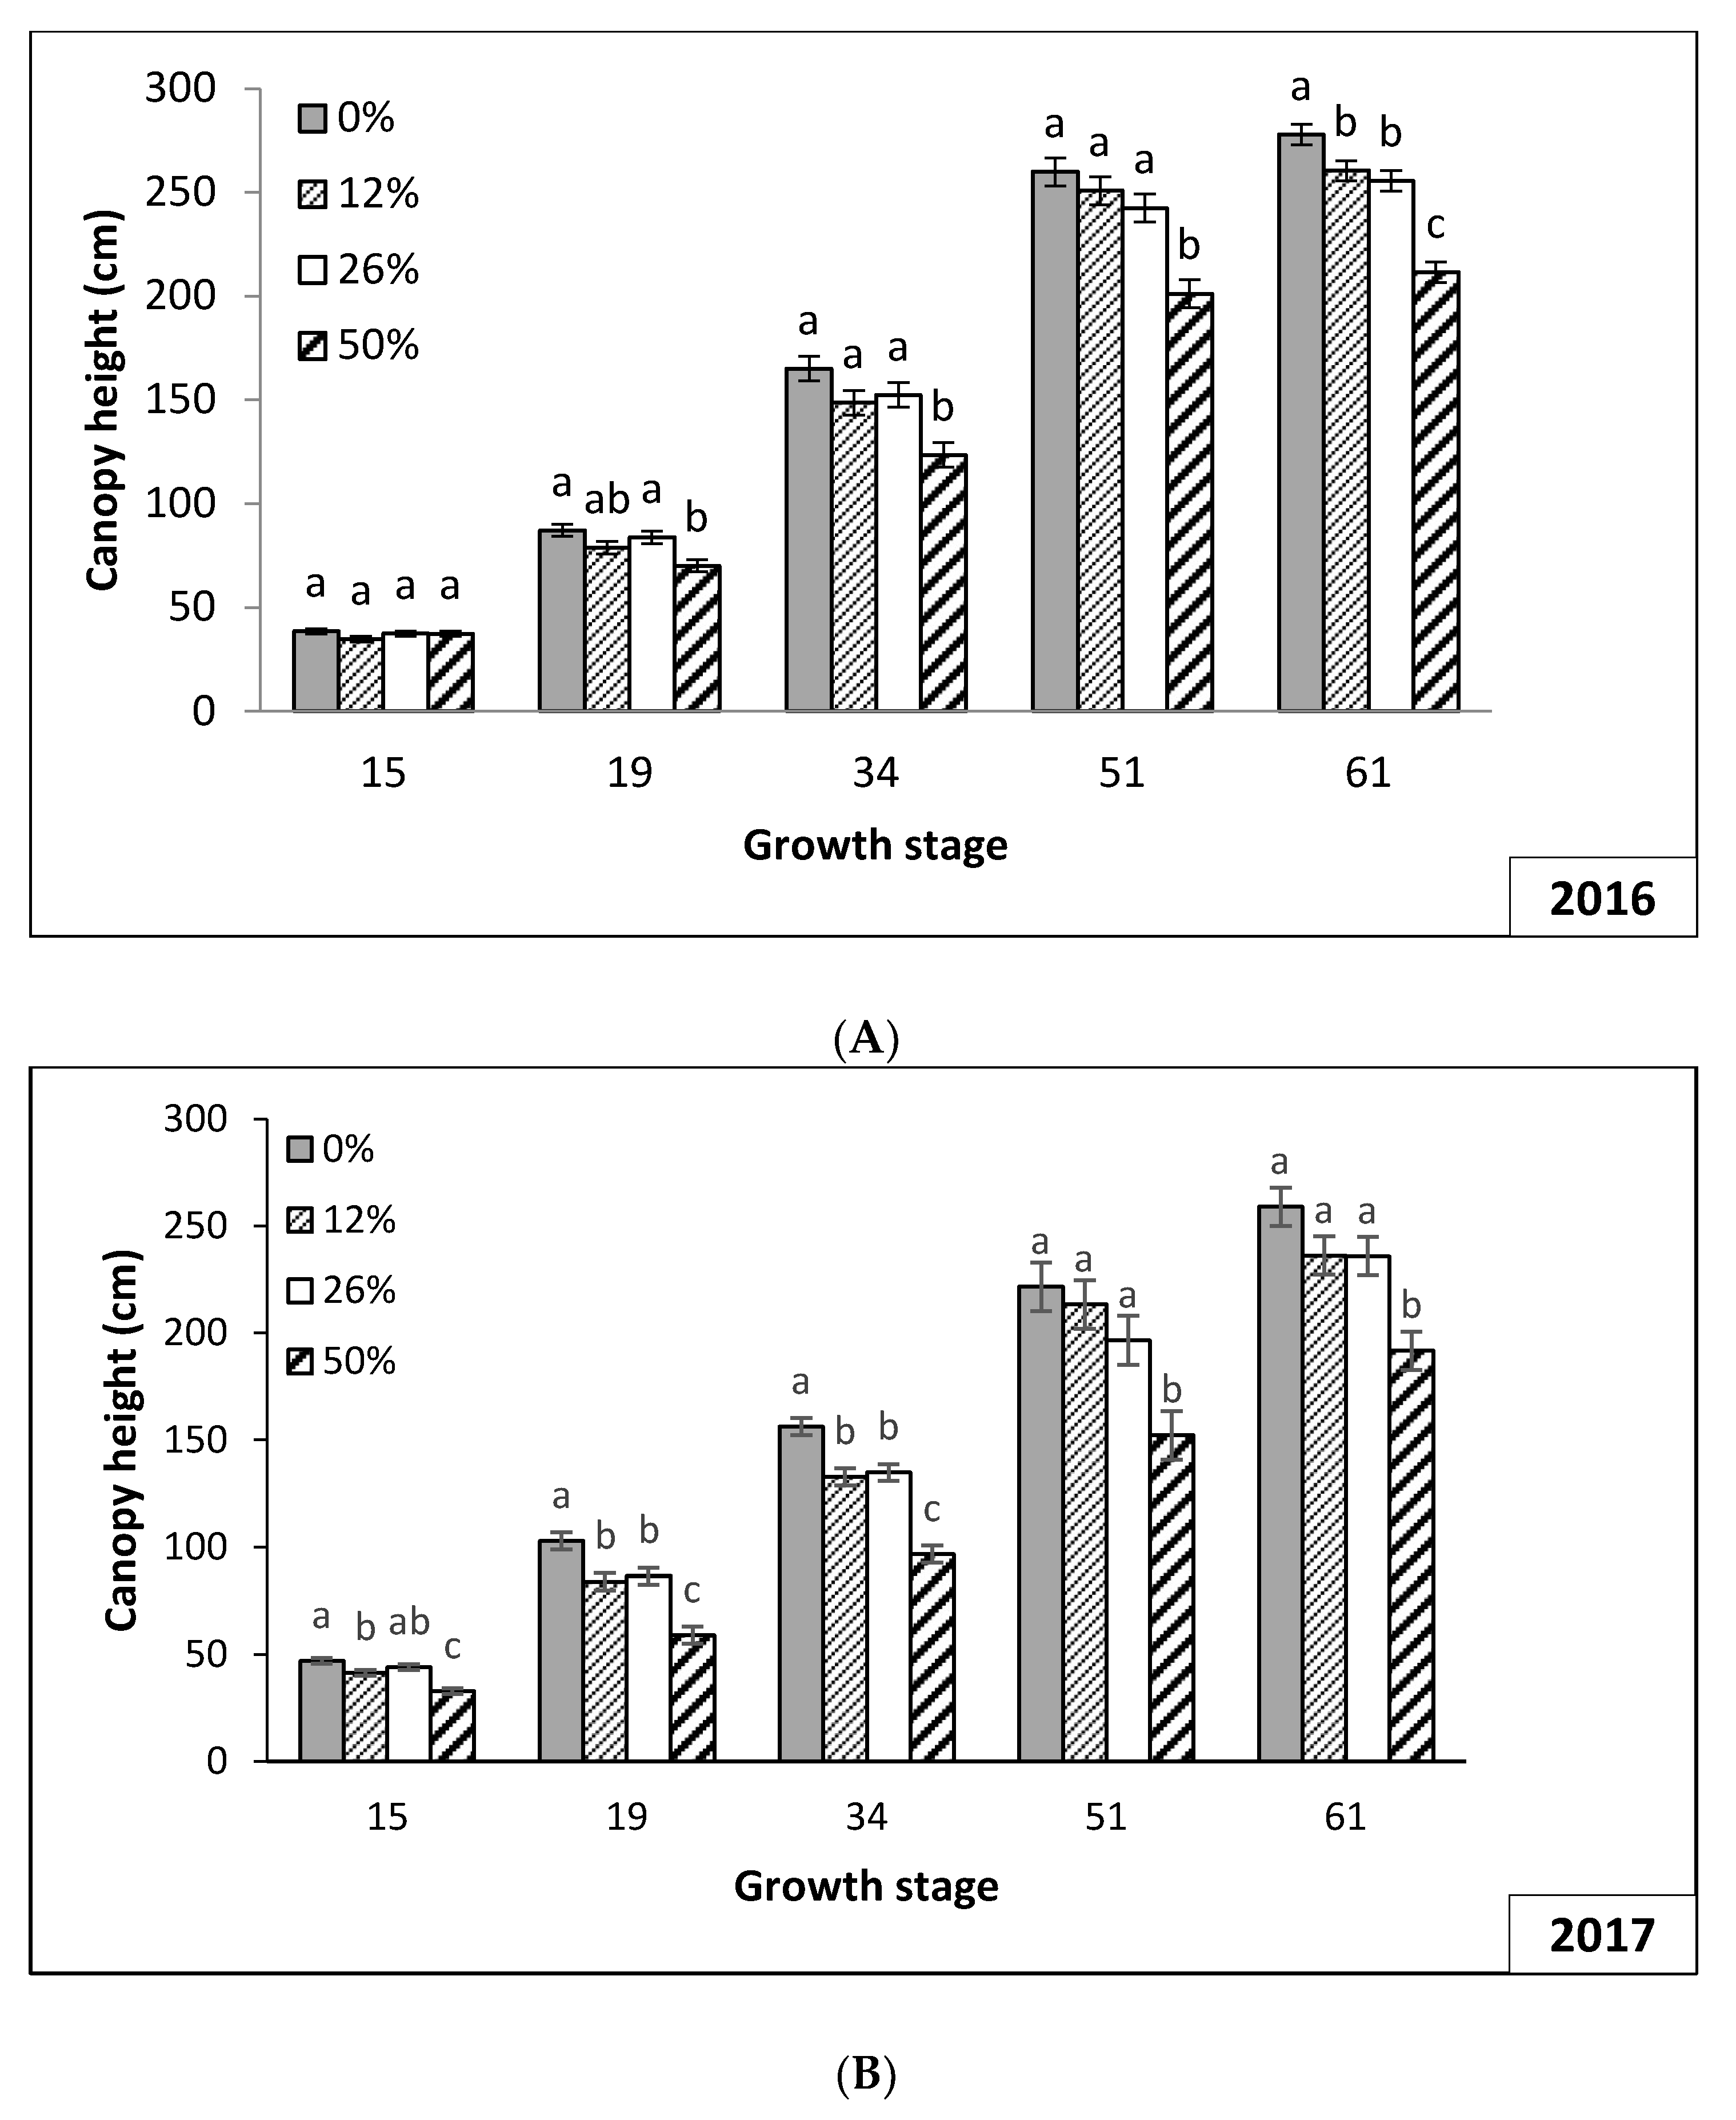
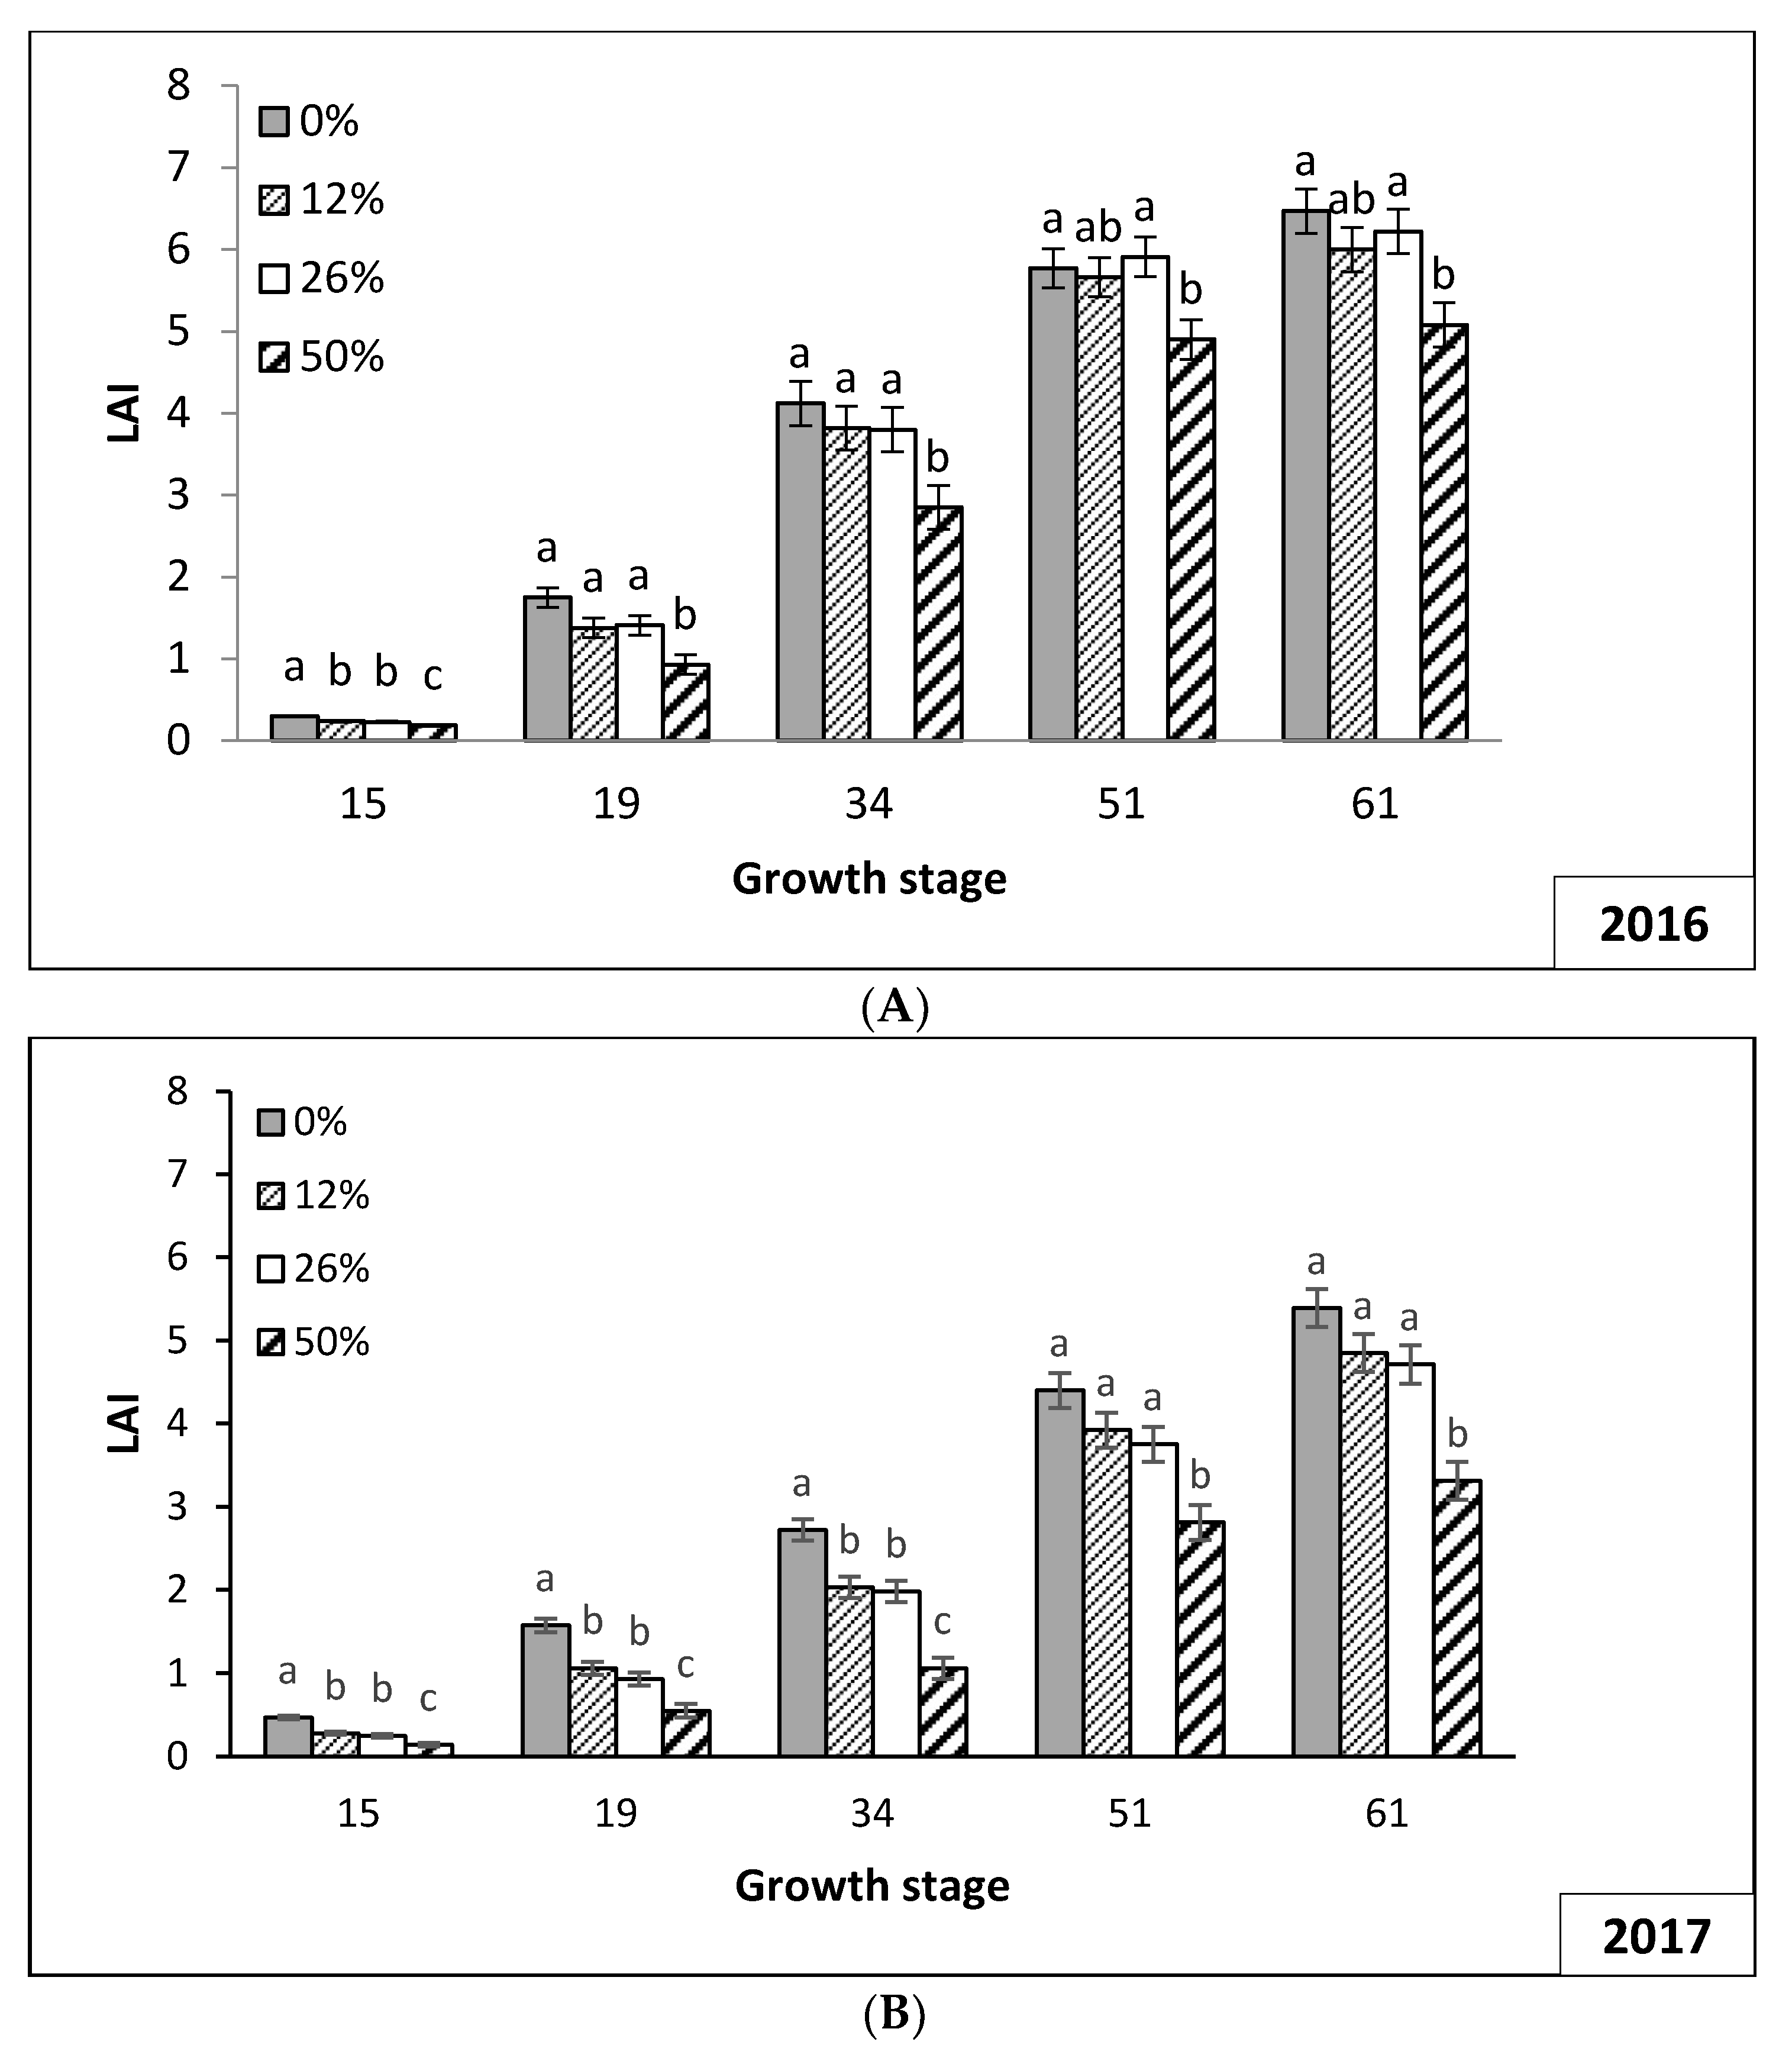
3.2. Plant Growth
3.3. Yield and Quality
3.4. Macronutrients
4. Discussion
5. Conclusions
Author Contributions
Funding
Acknowledgments
Conflicts of Interest
References
- Anonymous 2020 Climate & Energy Package. Available online: https://ec.europa.eu/clima/policies/strategies/2020_en (accessed on 28 October 2017).
- Fachagentur Nachwachsende Rohstoffe e.V. Basisdaten Nachwachsende Rohstoffe. Available online: https://basisdaten.fnr.de/ (accessed on 28 October 2017).
- Amon, T.; Amon, B.; Kryvoruchko, V.; Machmüller, A.; Hopfner-Sixt, K.; Bodiroza, V.; Hrbek, R.; Friedel, J.; Pötsch, E.; Wagentristl, H. Others Methane production through anaerobic digestion of various energy crops grown in sustainable crop rotations. Bioresour. Technol. 2007, 98, 3204–3212. [Google Scholar] [CrossRef] [PubMed]
- Varah, A.; Jones, H.; Smith, J.; Potts, S.G. Enhanced biodiversity and pollination in UK agroforestry systems. J. Sci. Food Agric. 2013, 93, 2073–2075. [Google Scholar] [CrossRef] [PubMed]
- Vandermeer, J.H. The Ecology of Intercropping; Cambridge University Press: New York, NY, USA, 1992. [Google Scholar]
- Montagnini, F.; Nair, P.K.R. Carbon sequestration: An underexploited environmental benefit of agroforestry systems. Agrofor. Syst. 2004, 61, 281–295. [Google Scholar] [CrossRef]
- Rigueiro-Rodríguez, A.; Fernández-Núñez, E.; González-Hernández, P.; McAdam, J.H.; Mosquera-Losada, M.R. Agroforestry Systems in Europe: Productive, Ecological and Social Perspectives. In Agroforestry in Europe; Springer: Dodrecht, The Netherlands, 2009; pp. 43–65. [Google Scholar]
- Quinkenstein, A.; Böhm, C.; Freese, D.; Wöllecke, J.; Grünewald, H.; Schneider, B.U.; Hüttl, R.F.; GeoForschungsZentrum, H.-Z.P.D. Alley-Cropping-Ein klima-adaptierbares landnutzungssystem zur nachhaltigen Biomasseproduktion. Forum Forsch. 2008, 21, 131–138. [Google Scholar]
- Nii-Annang, S.; Grünewald, H.; Freese, D.; Hüttl, R.F.; Dilly, O. Microbial activity, organic C accumulation and 13C abundance in soils under alley cropping systems after 9 years of recultivation of quaternary deposits. Biol. Fertil. Soils 2009, 45, 531–538. [Google Scholar] [CrossRef]
- Rivest, D.; Cogliastro, A.; Bradley, R.L.; Olivier, A. Intercropping hybrid poplar with soybean increases soil microbial biomass, mineral N supply and tree growth. Agrofor. Syst. 2010, 80, 33–40. [Google Scholar] [CrossRef]
- Chauhan, S.K.; Sharma, R.; Sharma, S.C.; Gupta, N. Evaluation of poplar (Populus deltoides Bartr. Ex Marsh.) boundary plantation based agri-silvicultural system for wheat-paddy yield and carbon storage. Int. J. Agric. For. 2012, 2, 239–246. [Google Scholar]
- Lamerre, J.; Schwarz, K.-U.; Langhof, M.; von Wühlisch, G.; Greef, J.-M. Productivity of poplar short rotation coppice in an alley-cropping agroforestry system. Agrofor. Syst. 2015, 89, 933–942. [Google Scholar] [CrossRef]
- Dupraz, C. Prospects for easing land tenure conflicts with agroforestry in Mediterranean France: A research approach for intercropped timber orchards. Agrofor. Syst. 1994, 25, 181–192. [Google Scholar] [CrossRef]
- Nissen, T.M.; Midmore, D.J. Stand basal area as an index of tree competitiveness in timber intercropping. Agrofor. Syst. 2002, 54, 51–60. [Google Scholar] [CrossRef]
- Peichl, M.; Thevathasan, N.V.; Gordon, A.M.; Huss, J.; Abohassan, R.A. Carbon sequestration potentials in temperate tree-based intercropping systems, southern Ontario, Canada. Agrofor. Syst. 2006, 66, 243–257. [Google Scholar] [CrossRef]
- Reynolds, P.E.; Simpson, J.A.; Thevathasan, N.V.; Gordon, A.M. Effects of tree competition on corn and soybean photosynthesis, growth, and yield in a temperate tree-based agroforestry intercropping system in southern Ontario, Canada. Ecol. Eng. 2007, 29, 362–371. [Google Scholar] [CrossRef]
- Bertomeu, M. Growth and yield of maize and timber trees in smallholder agroforestry systems in Claveria, Northern Mindanao, Philippines. Agrofor. Syst. 2012, 84, 73–87. [Google Scholar] [CrossRef]
- Ong, C.K.; Corlett, J.E.; Singh, R.P.; Black, C.R. Above and below ground interactions in agroforestry systems. For. Ecol. Manag. 1991, 45, 45–57. [Google Scholar] [CrossRef]
- Smith, J.; Pearce, B.D.; Wolfe, M.S. Reconciling productivity with protection of the environment: Is temperate agroforestry the answer? Renew. Agric. Food Syst. 2013, 28, 80–92. [Google Scholar] [CrossRef]
- Chen, T.; Song, Z.; Zhang, M.; Yan, X.; Zhu, P.; Ren, Y.; Deng, A.; Zhang, W. Effects of shading and planting density on ear development and plant productivity of spring maize in Northeast China. Chin. J. Appl. Ecol. 2016, 27, 3237–3246. [Google Scholar]
- Early, E.B.; McIlrath, W.O.; Seif, R.D.; Hageman, R.H. Effects of Shade Applied at Different Stages of Plant Development on Corn (Zea mays L.) Production 1. Crop. Sci. 1967, 7, 151–156. [Google Scholar] [CrossRef]
- Syafrullah; Marlina, N.; Rahim, S.E.; Aminah, R.I.S.; Midranisiah; Rosmiah; Sakalena, F. Growth and Production of Some Variety Corn (Zea mays L.). Planted under the Canopy of Palm Oil 12 Years Old in Swamp Land. In IOP Conference Series: Materials Science and Engineering; IOP Publishing: Iasi, Romania, 2017; Volume 209, p. 012109. [Google Scholar]
- Maddonni, G.A.; Otegui, M.E.; Cirilo, A.G. Plant population density, row spacing and hybrid effects on maize canopy architecture and light attenuation. Field Crops Res. 2001, 71, 183–193. [Google Scholar] [CrossRef]
- Tiwari, T.P.; Brook, R.M.; Wagstaff, P.; Sinclair, F.L. Effects of light environment on maize in hillside agroforestry systems of Nepal. Food Secur. 2012, 4, 103–114. [Google Scholar] [CrossRef]
- Singh, S. Physiological response of different crop species to low light stress. Indian J. Plant Physiol. 1994, 37, 147–151. [Google Scholar]
- Peng, X.; Zhang, Y.; Cai, J.; Jiang, Z.; Zhang, S. Photosynthesis, growth and yield of soybean and maize in a tree-based agroforestry intercropping system on the Loess Plateau. Agrofor. Syst. 2009, 76, 569–577. [Google Scholar] [CrossRef]
- Baserga, U. Landwirtschaftliche Co-Vergärungs-Biogasanlagen: Biogas aus organishcen Reststoffen und Energiegras; FAT-Berichte: Tänikon, Switzerland, 1998. [Google Scholar]
- Jia, S.-F.; Li, C.-F.; Dong, S.-T.; Zhang, J.-W. Effects of shading at different stages after anthesis on maize grain weight and quality at cytology level. Agric. Sci. China 2011, 10, 58–69. [Google Scholar] [CrossRef]
- Amon, T.; Amon, B.; Kryvoruchko, V.; Zollitsch, W.; Mayer, K.; Gruber, L. Biogas production from maize and dairy cattle manure—Influence of biomass composition on the methane yield. Agric. Ecosyst. Environ. 2007, 118, 173–182. [Google Scholar] [CrossRef]
- Earley, E.B.; Miller, R.J.; Reichert, G.L.; Hageman, R.H.; Seif, R.D. Effect of shade on maize production under field conditions. Crop. Sci. 1966, 6, 1–7. [Google Scholar] [CrossRef]
- Proulx, R.A.; Naeve, S.L. Pod removal, shade, and defoliation effects on soybean yield, protein, and oil. Agron. J. 2009, 101, 971–978. [Google Scholar] [CrossRef]
- Kryvoruchko, V.; Machmüller, A.; Bodiroza, V.; Amon, B.; Amon, T. Anaerobic digestion of by-products of sugar beet and starch potato processing. Biomass Bioenergy 2009, 33, 620–627. [Google Scholar] [CrossRef]
- McEwen, L.C.; Dietz, D.R. Shade effects on chemical composition of herbage in the Black Hills. J. Range Manag. 1965, 184–190. [Google Scholar] [CrossRef]
- Steffen, F.; Requejo, A.; Ewald, C.; Janzon, R.; Saake, B. Anaerobic digestion of fines from recovered paper processing–Influence of fiber source, lignin and ash content on biogas potential. Bioresour. Technol. 2016, 200, 506–513. [Google Scholar] [CrossRef] [PubMed]
- Zhao, D.; Oosterhuis, D.M. Influence of shade on mineral nutrient status of field-grown cotton. J. Plant Nutr. 1998, 21, 1681–1695. [Google Scholar] [CrossRef]
- Mayland, H.F.; Grunes, D.L. Shade-induced grass-tetany-prone chemical changes in Agropyron desertorum and Elymus cinereus. J. Range Manag. 1974, 198–201. [Google Scholar] [CrossRef]
- Fang, C.; Boe, K.; Angelidaki, I. Anaerobic co-digestion of desugared molasses with cow manure; focusing on sodium and potassium inhibition. Bioresour. Technol. 2011, 102, 1005–1011. [Google Scholar] [CrossRef] [PubMed]
- Ahn, J.-H.; Do, T.H.; Kim, S.D.; Hwang, S. The effect of calcium on the anaerobic digestion treating swine wastewater. Biochem. Eng. J. 2006, 30, 33–38. [Google Scholar] [CrossRef]
- Appari, S.; Janardhanan, V.M.; Bauri, R.; Jayanti, S.; Deutschmann, O. A detailed kinetic model for biogas steam reforming on Ni and catalyst deactivation due to sulfur poisoning. Appl. Catal. Gen. 2014, 471, 118–125. [Google Scholar] [CrossRef] [Green Version]
- Bożym, M.; Florczak, I.; Zdanowska, P.; Wojdalski, J.; Klimkiewicz, M. An analysis of metal concentrations in food wastes for biogas production. Renew. Energy 2015, 77, 467–472. [Google Scholar] [CrossRef]
- Janssen, W. Online Irrigation Service for Fruit and Vegetable Crops at Farmers Site. In Proceedings of the 9th EMS Annual Meeting & 9th European Conference on Applications of Meteorology (ECAM), Toulouse, France, 28 September–2 October 2009; European Meteorological Society: Toulouse, France, 2009. [Google Scholar]
- Bender, B. Moderne Agroforstsysteme mit Werthölzern: Leitfaden für die Praxis; Bundesministerium für Bildung und Forschung: Reute, Germany, 2009. [Google Scholar]
- Hack, H.; Gall, H.; Klemke, T.H.; Klose, R.; Meier, U.; Stauss, R.; Witzenberger, A. The BBCH scale for phenological growth stages of potato (Solanum tuberosum L.). In Proceedings of the 12th Annual Congress of the European Association for Potato Research; Federal Biological Research Centre for Agriculture and Forestry: Quedlinburg, Germany, 1993; pp. 153–154. [Google Scholar]
- Mokhtarpour, H.; Teh, C.B.; Saleh, G.; Selamat, A.B.; Asadi, M.E.; Kamkar, B. Non-destructive estimation of maize leaf area, fresh weight, and dry weight using leaf length and leaf width. Commun. Biometry Crop. Sci. 2010, 5, 19–26. [Google Scholar]
- Bassler, R. VDLUFA-Methodenbuch, Band III. Die Chemische Untersuchung von Futtermitteln. 3. Aufl., 2. Ergänzungslieferung 1988 und 3. Ergänzungslieferung 1993; VDLUFA-Verl: Darmstadt, Germany, 1988. [Google Scholar]
- Hoffmann, G. VDLUFA-Methodenbuch Band I: Die Untersuchung von Boeden. Darmstadt, VDLUFA-Verlag, Loseblattsammlung; Ī. Neumann-Verl. Radebeul u. Berlin 3: Darmstadt, Germany, 1991; ISBN 3-922712-42-8. [Google Scholar]
- Janßen, E. VDLUFA-Methodenbuch, Band VII. Umweltanalytik, 3rd ed.; VDLUFA: Darmstadt, Germany, 2003. [Google Scholar]
- Amtsblatt der Europäischen Union. Verordnung (EG) Nr. 152/2009 der Kommission vom 27.01. 2009 zur Festlegung der Probenahmeverfahren und Analysemethoden für die Amtliche Untersuchung von Futtermitteln. 2009. Available online: https://eur-lex.europa.eu/LexUriServ/LexUriServ.do?uri=OJ:L:2009:054:0001:0130:DE:PDF (accessed on 20 August 2018).
- Deutsche Landwirtschafts-Gesellschaft. DLG-Futterwerttabellen-Wiederkäuer; DLG-Verlag: Frankfurt am Main, Germany, 1997. [Google Scholar]
- Schattauer, A.; Weiland, P. Grundlagen der Anaeroben Fermentation. In Handreichung Biogasgewinnung und–nutzung; Herausgeber: Fachagentur Nachwachsende Rohst. e.V.: Gülzow, Germany, 2004; pp. 25–35. [Google Scholar]
- Piepho, H.-P. An algorithm for a letter-based representation of all-pairwise comparisons. J. Comput. Graph. Stat. 2004, 13, 456–466. [Google Scholar] [CrossRef]
- Piepho, H.-P. A SAS macro for generating letter displays of pairwise mean comparisons. Commun. Biometry Crop. Sci. 2012, 7, 4–13. [Google Scholar]
- Möhring, J.; Williams, E.; Piepho, H.-P. Inter-block information: To recover or not to recover it? Theor. Appl. Genet. 2015, 8, 1541–1554. [Google Scholar] [CrossRef] [PubMed]
- Zhu, J.; Vos, J.; van der Werf, W.; van der Putten, P.E.; Evers, J.B. Early competition shapes maize whole-plant development in mixed stands. J. Exp. Bot. 2013, 65, 641–653. [Google Scholar] [CrossRef] [PubMed] [Green Version]
- Xu, C.; Tao, H.; Pu, W.; Wang, Z. Slight shading after anthesis increases photosynthetic productivity and grain yield of winter wheat (Triticum aestivum L.) due to the delaying of leaf senescence. J. Integr. Agric. 2016, 15, 63–75. [Google Scholar] [CrossRef]
- Gitelson, A.A.; Viña, A.; Arkebauer, T.J.; Rundquist, D.C.; Keydan, G.; Leavitt, B. Remote estimation of leaf area index and green leaf biomass in maize canopies. Geophys. Res. Lett. 2003, 30, 1248. [Google Scholar] [CrossRef]
- Law-Ogbomo, K.E.; Remison, S.U. Growth and Yield of Maize as Influenced by Sowing Date and Poultry Manure Application. Not. Bot. Horti Agrobot. Cluj-Napoca 2009, 37, 199–203. [Google Scholar]
- Gao, S.; Niu, Z.; Huang, N.; Hou, X. Estimating the Leaf Area Index, height and biomass of maize using HJ-1 and RADARSAT-2. Int. J. Appl. Earth Obs. Geoinf. 2013, 24, 1–8. [Google Scholar] [CrossRef]
- Li, W.; Niu, Z.; Chen, H.; Li, D.; Wu, M.; Zhao, W. Remote estimation of canopy height and aboveground biomass of maize using high-resolution stereo images from a low-cost unmanned aerial vehicle system. Ecol. Indic. 2016, 67, 637–648. [Google Scholar] [CrossRef]
- Wiersma, D.W.; Carter, P.R.; Albrecht, K.A.; Coors, J.G. Kernel milkline stage and corn forage yield, quality, and dry matter content. J. Prod. Agric. 1993, 6, 94–99. [Google Scholar] [CrossRef]
- Allison, J.C.S.; Daynard, T.B. Effect of change in time of flowering, induced by altering photoperiod or temperature, on attributes related to yield in maize. Crop. Sci. 1979, 19, 1–4. [Google Scholar] [CrossRef]
- Dadashi, F.; Zaefarian, F.; Abbasi, R.; Bahmanyar, M.A.; Rezvani, M. Response of leaf area and dry matter of crop, weeds and cover crops to competition and fertilizer resources. Acta Agric. Slov. 2015, 103, 27–36. [Google Scholar] [CrossRef]
- Sinclair, T.R.; Horie, T. Leaf nitrogen, photosynthesis, and crop radiation use efficiency: A review. Crop. Sci. 1989, 29, 90–98. [Google Scholar] [CrossRef]
- Amon, T.; Amon, B.; Kryvoruchko, V.; Bodiroza, V.; Pötsch, E.; Zollitsch, W. Optimising methane yield from anaerobic digestion of manure: Effects of dairy systems and of glycerine supplementation. In International Congress Series; Elsevier: Zurich, Switzerland, 2006; Volume 1293, pp. 217–220. [Google Scholar]
- Oslaj, M.; Mursec, B.; Vindis, P. Biogas production from maize hybrids. Biomass Bioenergy 2010, 34, 1538–1545. [Google Scholar] [CrossRef]
- Lin, C.H.; McGraw, M.L.; George, M.F.; Garrett, H.E. Nutritive quality and morphological development under partial shade of some forage species with agroforestry potential. Agrofor. Syst. 2001, 53, 269–281. [Google Scholar] [CrossRef]
- Burner, D.M.; Brauer, D.K. Herbage response to spacing of loblolly pine trees in a minimal management silvopasture in southeastern USA. Agrofor. Syst. 2003, 57, 69–77. [Google Scholar] [CrossRef]
- Alatürk, F. Gübrelemenin Çanakkale ili meralarında verim ve otun kimyasal bileşimine etkileri. Üksek Lisans Tezi, Onsekiz Mart Üniversitesi Fen Bilim, Enstitüsü Basılmamış Çanakkale, Ankara, Turkey, 2012. [Google Scholar]
- Gökkuş, A.; Kahriman, F.; Alatürk, F.; Ali, B. Variation of Nutritional Values in Leaves and Stalks of Different Maize Genotypes Having High Protein and High Oil during Vegetation. Agric. Agric. Sci. Procedia 2016, 10, 18–25. [Google Scholar] [CrossRef]
- Wilkie, A.; Goto, M.; Bordeaux, F.M.; Smith, P.H. Enhancement of anaerobic methanogenesis from napiergrass by addition of micronutrients. Biomass 1986, 11, 135–146. [Google Scholar] [CrossRef]
- Weiland, P. Biogas production: Current state and perspectives. Appl. Microbiol. Biotechnol. 2010, 85, 849–860. [Google Scholar] [CrossRef] [PubMed]


| Humus Content (%) | 1.4 |
| Soil Nt (%) | 0.064 |
| pH (CaCl2) | 5.8 |
| Available Total P (mg 100 g−1) 1 | 18 |
| Available Total K (mg 100 g−1) 1 | 22 |
| Available Total Mg (mg 100 g−1) 2 | 8 |
| Light Reduction (%) | |||
|---|---|---|---|
| 12 | 26 | 50 | |
| Manufacturer | AGROFLOR Kunststoff GmbH, Wolfurt, Austria | ||
| Color | black | green | green |
| Material | polyethylene | polyethylene | polyethylene |
| Mesh Size (mm) | 3 × 8 | 12 × 12 | 3 × 3 |
| Original Use | hail protection net | anti-bird net | shade sheet |
| Year | Shade | Emergence † | Tassel Initiation | Silking | End of Flowering † | Dough Stage | |||||
|---|---|---|---|---|---|---|---|---|---|---|---|
| 2016 | 0% | 18 | (±0.00) | 74 a | (±0.33) | 81 a | (±0.71) | 97 a | (±0.22) | 126 ab | (±1.67) |
| 12% | 18 | (±0.00) | 74 a | (±0.33) | 84 ab | (±0.71) | 97 a | (±0.22) | 123 a | (±1.67) | |
| 26% | 18 | (±0.00) | 80 b | (±0.33) | 85 b | (±0.71) | 98 a | (±0.22) | 133 b | (±1.67) | |
| 50% | 18 | (±0.00) | 81 b | (±0.33) | 90 c | (±0.71) | 99 b | (±0.22) | 133 b | (±1.67) | |
| 2017 | 0% | 23 | (±0.00) | 67 a | (±0.33) | 71 a | (±0.40) | 87 a | (±0.00) | 110 a | (±2.05) |
| 12% | 23 | (±0.00) | 68 a | (±0.33) | 73 b | (±0.40) | 87 a | (±0.00) | 112 a | (±2.05) | |
| 26% | 23 | (±0.00) | 73 b | (±0.33) | 77 c | (±0.40) | 87 a | (±0.00) | 117 ab | (±2.05) | |
| 50% | 23 | (±0.00) | 76 c | (±0.33) | 82 d | (±0.40) | 91 b | (±0.00) | 126 b | (±2.05) | |
| Constituent | Shade Level | p-Value | LSD | |||||||
|---|---|---|---|---|---|---|---|---|---|---|
| 0% | 12% | 26% | 50% | |||||||
| DMY | 21.05 a | (±0.53) | 17.24 b | (±0.53) | 17.08 b | (±0.53) | 11.73 c | (±0.53) | <0.001 | 1.54 |
| DS | 39.48 a | (±0.71) | 36.39 b | (±0.71) | 35.98 b | (±0.71) | 32.23 c | (±0.71) | <0.001 | 2.07 |
| XP | 6.04 a | (±0.20) | 6.42 ab | (±0.20) | 6.63 bc | (±0.20) | 7.16 c | (±0.20) | 0.008 | 0.58 |
| XF | 19.50 | (±0.87) | 19.52 | (±0.87) | 19.09 | (±0.87) | 19.12 | (±0.87) | 0.973 | 3.01 |
| EE | 2.84 | (±0.19) | 2.76 | (±0.19) | 2.99 | (±0.19) | 3.02 | (±0.19) | 0.721 | 0.65 |
| XA | 3.01 a | (±0.09) | 3.32 ab | (±0.09) | 3.45 b | (±0.09) | 3.98 c | (±0.09) | 0.002 | 0.31 |
| NfE | 68.72 | (±1.05) | 68.01 | (±1.05) | 67.87 | (±1.05) | 66.55 | (±1.05) | 0.565 | 3.64 |
| Cbiogas | 54.41 | (±0.17) | 54.12 | (±0.17) | 54.10 | (±0.17) | 53.65 | (±0.17) | 0.096 | 0.59 |
| Cmethane | 29.39 | (±0.09) | 29.25 | (±0.09) | 29.29 | (±0.09) | 29.12 | (±0.09) | 0.267 | 0.30 |
| Biogas | 11,455 a | (±280) | 9315 b | (±280) | 9241 b | (±280) | 6321 c | (±280) | <0.001 | 819 |
| Methane | 6188 a | (±150) | 5038 b | (±150) | 4999 b | (±150) | 3437 c | (±150) | <0.001 | 436 |
| Constituent | Shade Level | p-Value | LSD | |||||||
|---|---|---|---|---|---|---|---|---|---|---|
| 0% | 12% | 26% | 50% | |||||||
| P | 0.11 a | (±0.01) | 0.13 ab | (±0.01) | 0.13 b | (±0.01) | 0.15 c | (±0.01) | 0.003 | 0.03 |
| K | 0.98 a | (±0.04) | 0.98 a | (±0.04) | 1.12 a | (±0.04) | 1.34 b | (±0.04) | 0.003 | 0.15 |
| Ca | 0.09 | (±0.01) | 0.09 | (±0.01) | 0.10 | (±0.01) | 0.11 | (±0.01) | 0.348 | 0.03 |
| Mg | 0.08 | (±0.00) | 0.09 | (±0.00) | 0.09 | (±0.00) | 0.10 | (±0.00) | 0.105 | 0.01 |
| S | 0.10 | (±0.00) | 0.10 | (±0.00) | 0.10 | (±0.00) | 0.11 | (±0.00) | 0.349 | 0.01 |
© 2018 by the authors. Licensee MDPI, Basel, Switzerland. This article is an open access article distributed under the terms and conditions of the Creative Commons Attribution (CC BY) license (http://creativecommons.org/licenses/by/4.0/).
Share and Cite
Schulz, V.S.; Munz, S.; Stolzenburg, K.; Hartung, J.; Weisenburger, S.; Mastel, K.; Möller, K.; Claupein, W.; Graeff-Hönninger, S. Biomass and Biogas Yield of Maize (Zea mays L.) Grown under Artificial Shading. Agriculture 2018, 8, 178. https://doi.org/10.3390/agriculture8110178
Schulz VS, Munz S, Stolzenburg K, Hartung J, Weisenburger S, Mastel K, Möller K, Claupein W, Graeff-Hönninger S. Biomass and Biogas Yield of Maize (Zea mays L.) Grown under Artificial Shading. Agriculture. 2018; 8(11):178. https://doi.org/10.3390/agriculture8110178
Chicago/Turabian StyleSchulz, Vanessa S., Sebastian Munz, Kerstin Stolzenburg, Jens Hartung, Sebastian Weisenburger, Klaus Mastel, Kurt Möller, Wilhelm Claupein, and Simone Graeff-Hönninger. 2018. "Biomass and Biogas Yield of Maize (Zea mays L.) Grown under Artificial Shading" Agriculture 8, no. 11: 178. https://doi.org/10.3390/agriculture8110178