Article

Enhanced Dispersion and Removal of Ammonia Emitted from a Poultry House with a Vegetative Environmental Buffer

1
ARS Coastal Plains Soil, Water & Plant Research Center, USDA, Florence, SC 29501, USA
2
Department of Animal and Food Sciences, University of Delaware, Newark, DE 19716, USA
3
ARS Hydrology and Remote Sensing Laboratory, USDA, Beltsville, MD 20705, USA
4
Trace-Gas Emissions, Harper Consulting Company, P.O. Box 772, Watkinsville, GA 30677, USA
5
Department of Earth and Atmospheric Science, University of Alberta, Edmonton, AB T6G 2R3, Canada
6
Department of Civil and Environmental Engineering, University of Maryland, College Park, MD 20742, USA
*
Author to whom correspondence should be addressed.
Agriculture 2018, 8(4), 46; https://doi.org/10.3390/agriculture8040046
Submission received: 14 February 2018 / Revised: 16 March 2018 / Accepted: 19 March 2018 / Published: 22 March 2018

Abstract

:
Vegetative environmental buffers (VEBs), which are composed of tolerant trees, shrubs, and tall grasses, can be used to control and reduce the transport of ammonia (NH3) emissions from animal feeding operations (AFOs). However, the effectiveness of VEBs has not been quantitated. In this study, we measure the dispersion and removal of NH3 in simulated emissions from a small broiler house that was equipped with a VEB. The dispersion enhancement due to the VEB was estimated by comparing the measured downwind concentration of the co-released tracer gas, methane (CH4), to the theoretical CH4 concentrations at the same distance downwind without the VEB. The accuracy of the theoretical downwind concentrations calculated using the forward Lagrangian stochastic (fLS) technique was 95%, which was validated by comparing the measured and calculated CH4 concentrations in a separate experiment without the VEB. The VEB enhanced the dispersion of CH4 and reduced the downwind concentration to 63% of the theoretical concentration. In addition to dispersion, the VEB removed another 22% of the NH3, resulting in a net 51% decrease of the theoretical downwind concentration. These results clearly demonstrated that the VEB was effective both in dispersing and removing NH3 emitted from the broiler house.

Graphical Abstract

1. Introduction

Animal Feeding Operations (AFOs) generate and emit a variety of airborne pollutants. These include the fugitive gases, such as ammonia (NH3), hydrogen sulfide (H2S), and particulate matter (PM), which can create chronic health concerns for workers and animals [1,2,3,4,5]. Furthermore, volatile organic carbon (VOC) emissions from livestock can be a public odor nuisance and have been identified as one of the most significant animal emissions at the local level [6]. Regulations in California have also been promulgated to reduce volatile organic compound (VOC) emissions from agriculture to decrease ozone concentrations [7,8]. The development of cost-effective air emission mitigation technologies for AFOs and an assessment of the effectiveness of these technologies are urgently needed to improve our environmental performance and to help producers address Federal and state regulatory pressures.
A current management strategy that is used to control and reduce transport of AFO emissions is vegetative environmental buffers (VEBs). Vegetative environmental buffers consist of trees, shrubs, and/or tall grasses around the exhaust fans of poultry houses to reduce PM, VOC, and NH3 emissions. Recently, Natural Resources Conservation Service (NRCS) National Plant Materials Center (PMC) determined which plant species are most viable under the harsh atmospheric conditions [9,10] of high pollutant concentrations that are emitted from the AFOs. Because AFO facilities are behind trees and shrubs, VEBs also enhance the aesthetics of the facilities and the landscape. Consequently, VEBs have led to increased public positive perception of AFOs and demonstrated producer environmental stewardship.
Tyndall and Colletti [11] reviewed various mechanisms how VEBs can be effective in mitigating livestock odor: (1) physical interception and capture of dust, aerosols, and gases by trees and shrubs; (2) dilution and dispersion of downwind odor compounds; (3) land deposition, dust, and other aerosols due to reduced wind speeds; and, (4) a biological sink for intercepted odorous chemicals. Parker et al. [12] reported that a VEB reduced odor concentrations 15 m from the VEB; however, they also pointed out that gas concentrations at 150 and 300 m downwind of swine barns were not significantly different from control barns without a VEB. Therefore, it appears that the effectiveness of a VEB in reducing odor concentration depends on the location of the sensors downwind of the VEB.
Reduction in NH3 concentrations across VEBs have been reported in the literature [4,11,13,14,15]. Malone [14] and Malone et al. [13] reported that emitted NH3 concentrations were reduced by 30–67% by a VEB consisting of three rows of trees. However, it was not clear as to what extent the reduction in concentrations were due to simple dispersion (i.e., dilution) or to actual removal by plant biomass (i.e., absorption, synthesis, adsorption, plant uptake, deposition, etc.). Similarly, Adrizal et al. [4] measured NH3 concentrations at five poultry farms that were equipped with VEBs where they observed that NH3 concentrations decreased by an average of 78% across the VEBs. They also reported evidence for foliar N entrapment and NH3 incorporation by the VEB. However, meteorological data were not collected, so the influence of change in wind direction and turbulence on NH3 removal efficiency by the VEB itself could not be evaluated.
The objective of this study was to evaluate quantitatively the effectiveness of a VEB in removing and dispersing NH3 emissions from a broiler house by comparing the released NH3 downwind concentrations to a co-released inert tracer gas, methane (CH4). The assumption was that CH4 is effectively inert relative to the reactive and much more readily sorbed NH3. The tracer gas also served as a reference to evaluate the effects of dispersion as a function of distance from the emission source. We examined the relationship between the broiler house gas emission rates (Q) and the corresponding concentrations (C) of these gases downwind of the broiler house with or without VEBs.
The hypothesis was that a VEB would alter the ratios of C/Q when compared to not having a VEB and that the reduction in C/Q would result in a mitigation effect of the VEB. Because no two broiler house emission systems are the same, evaluating houses without (control) versus with (variable) a VEB is difficult as well as isolating the effect of VEB type, barn configuration, local topography, surrounding vegetation, and meteorological conditions on C/Q. Thus, the first approach employed in this study uses a well-developed atmospheric dispersion model to calculate the theoretical C/Q values that would exist if there was no VEB. The second approach compares the C/Q of NH3 and CH4 at a broiler house with a VEB.

2. Materials and Methods

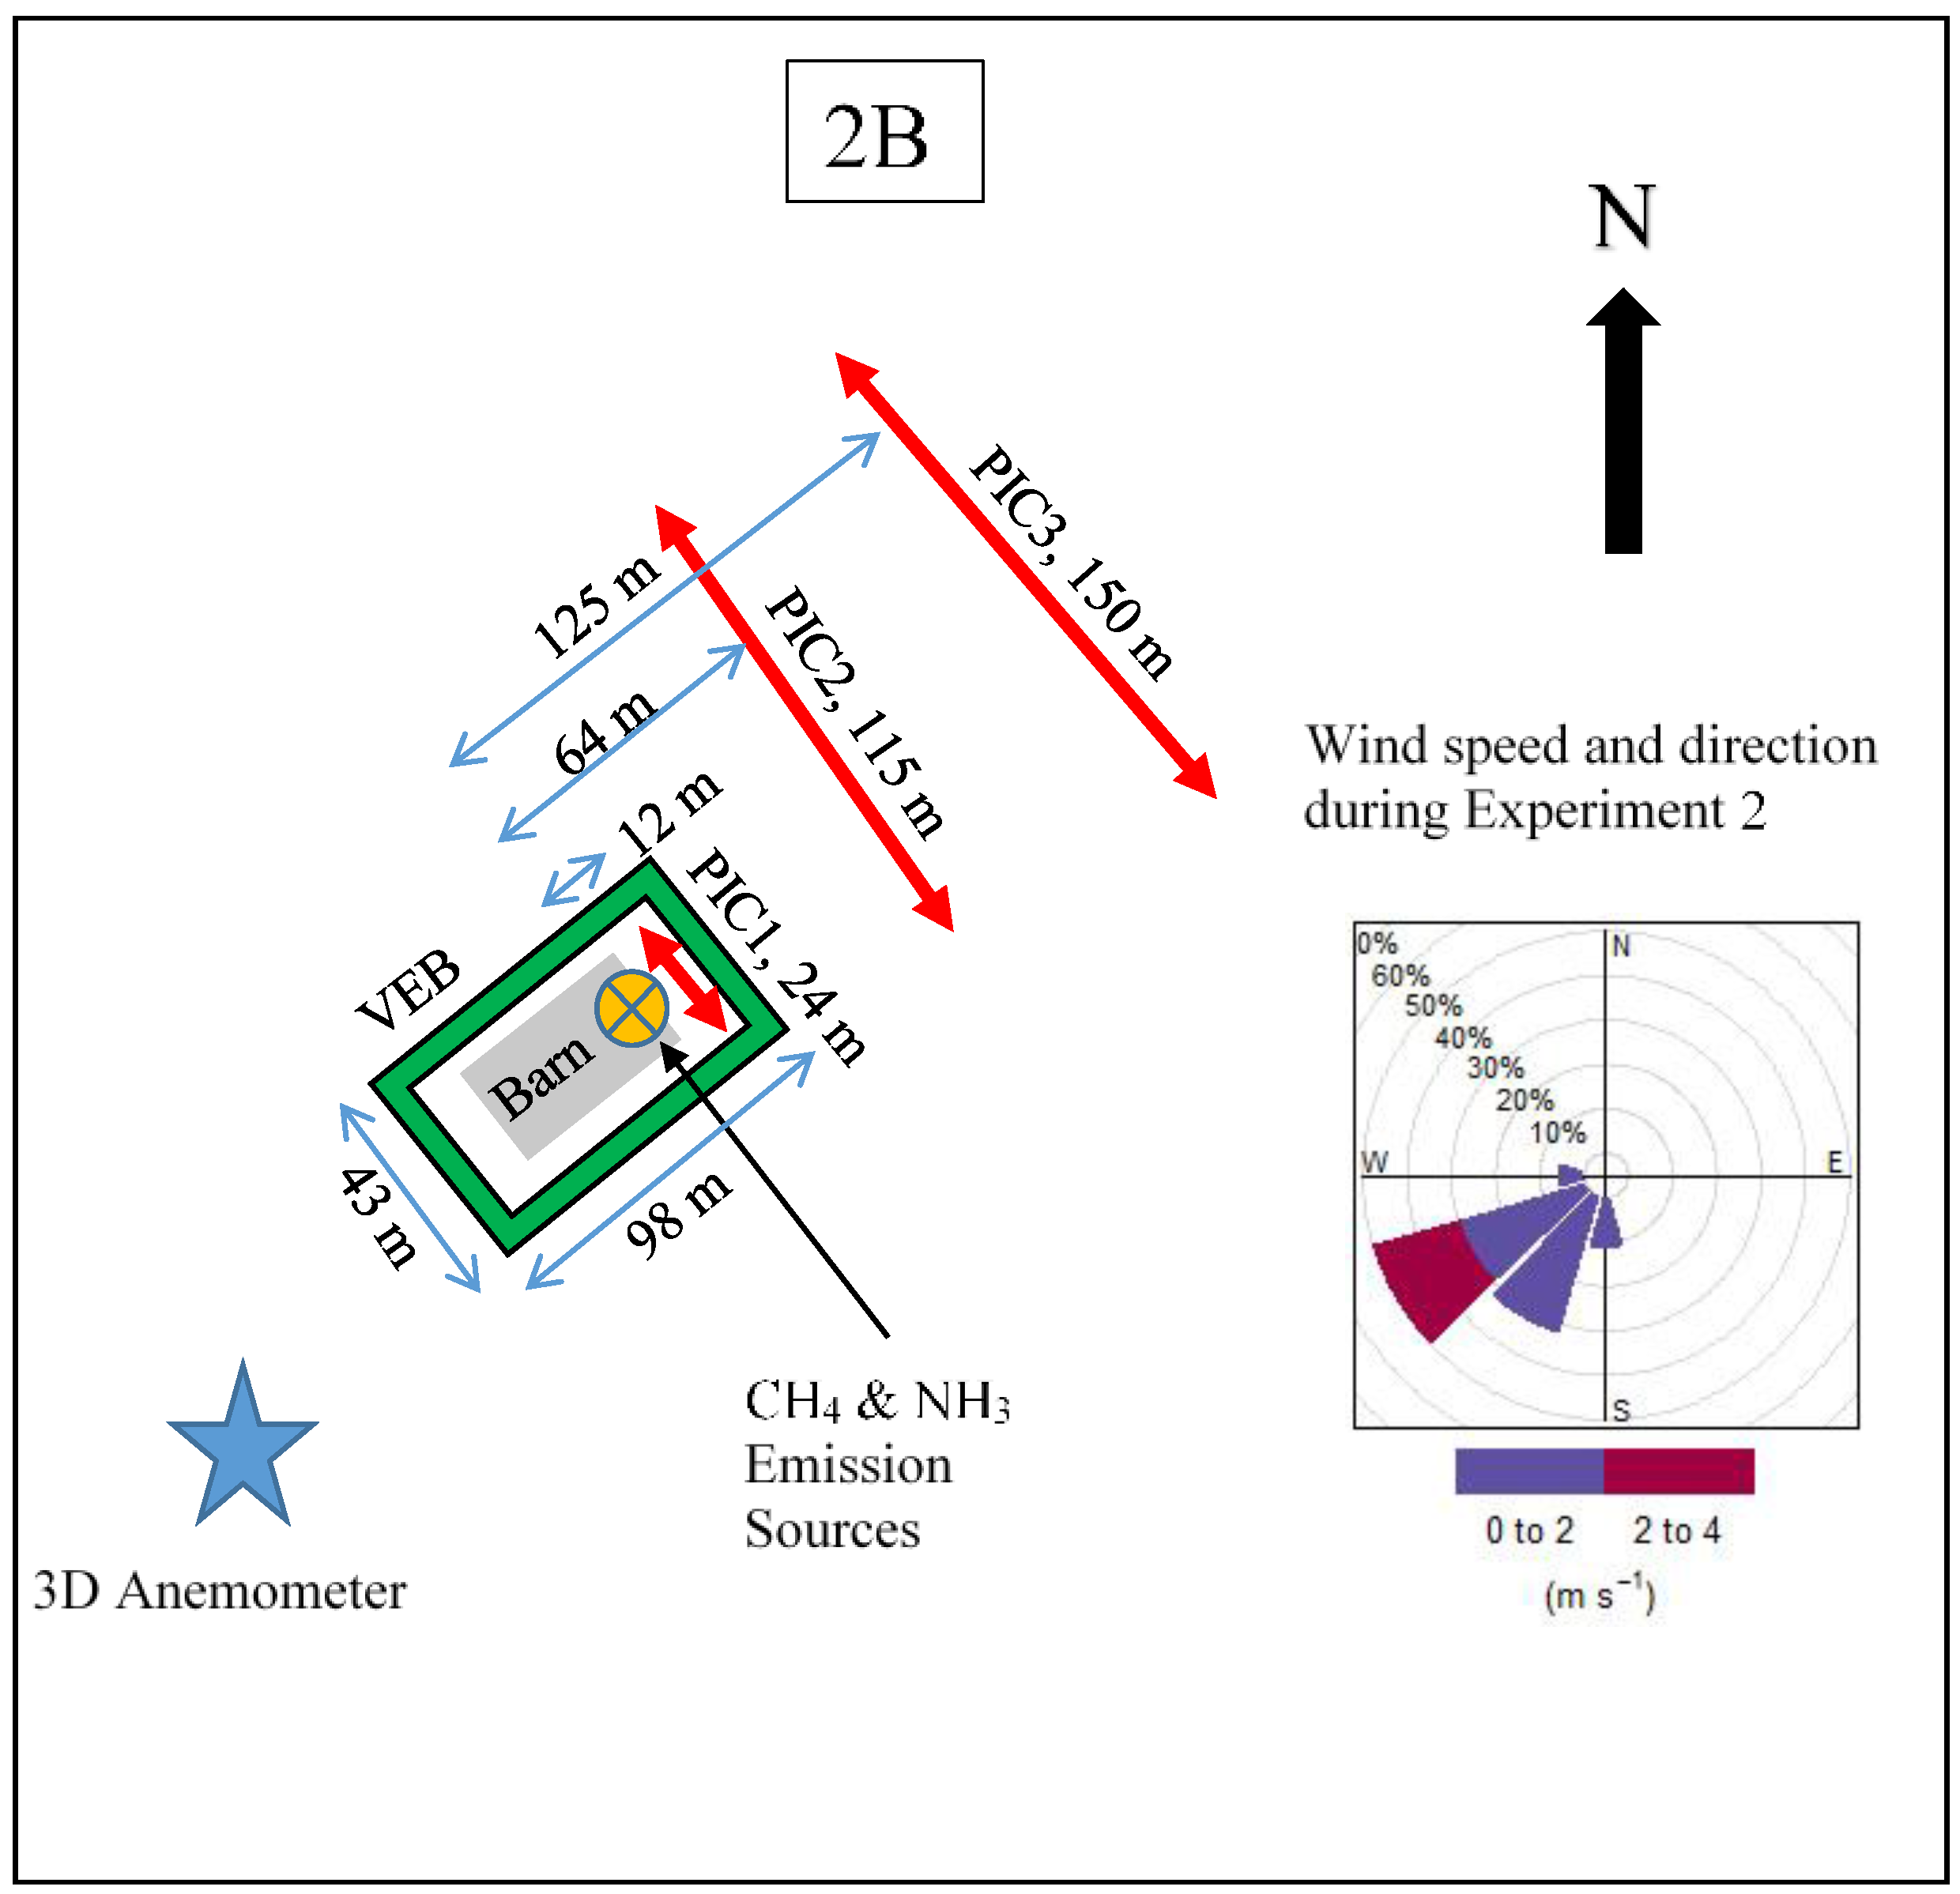
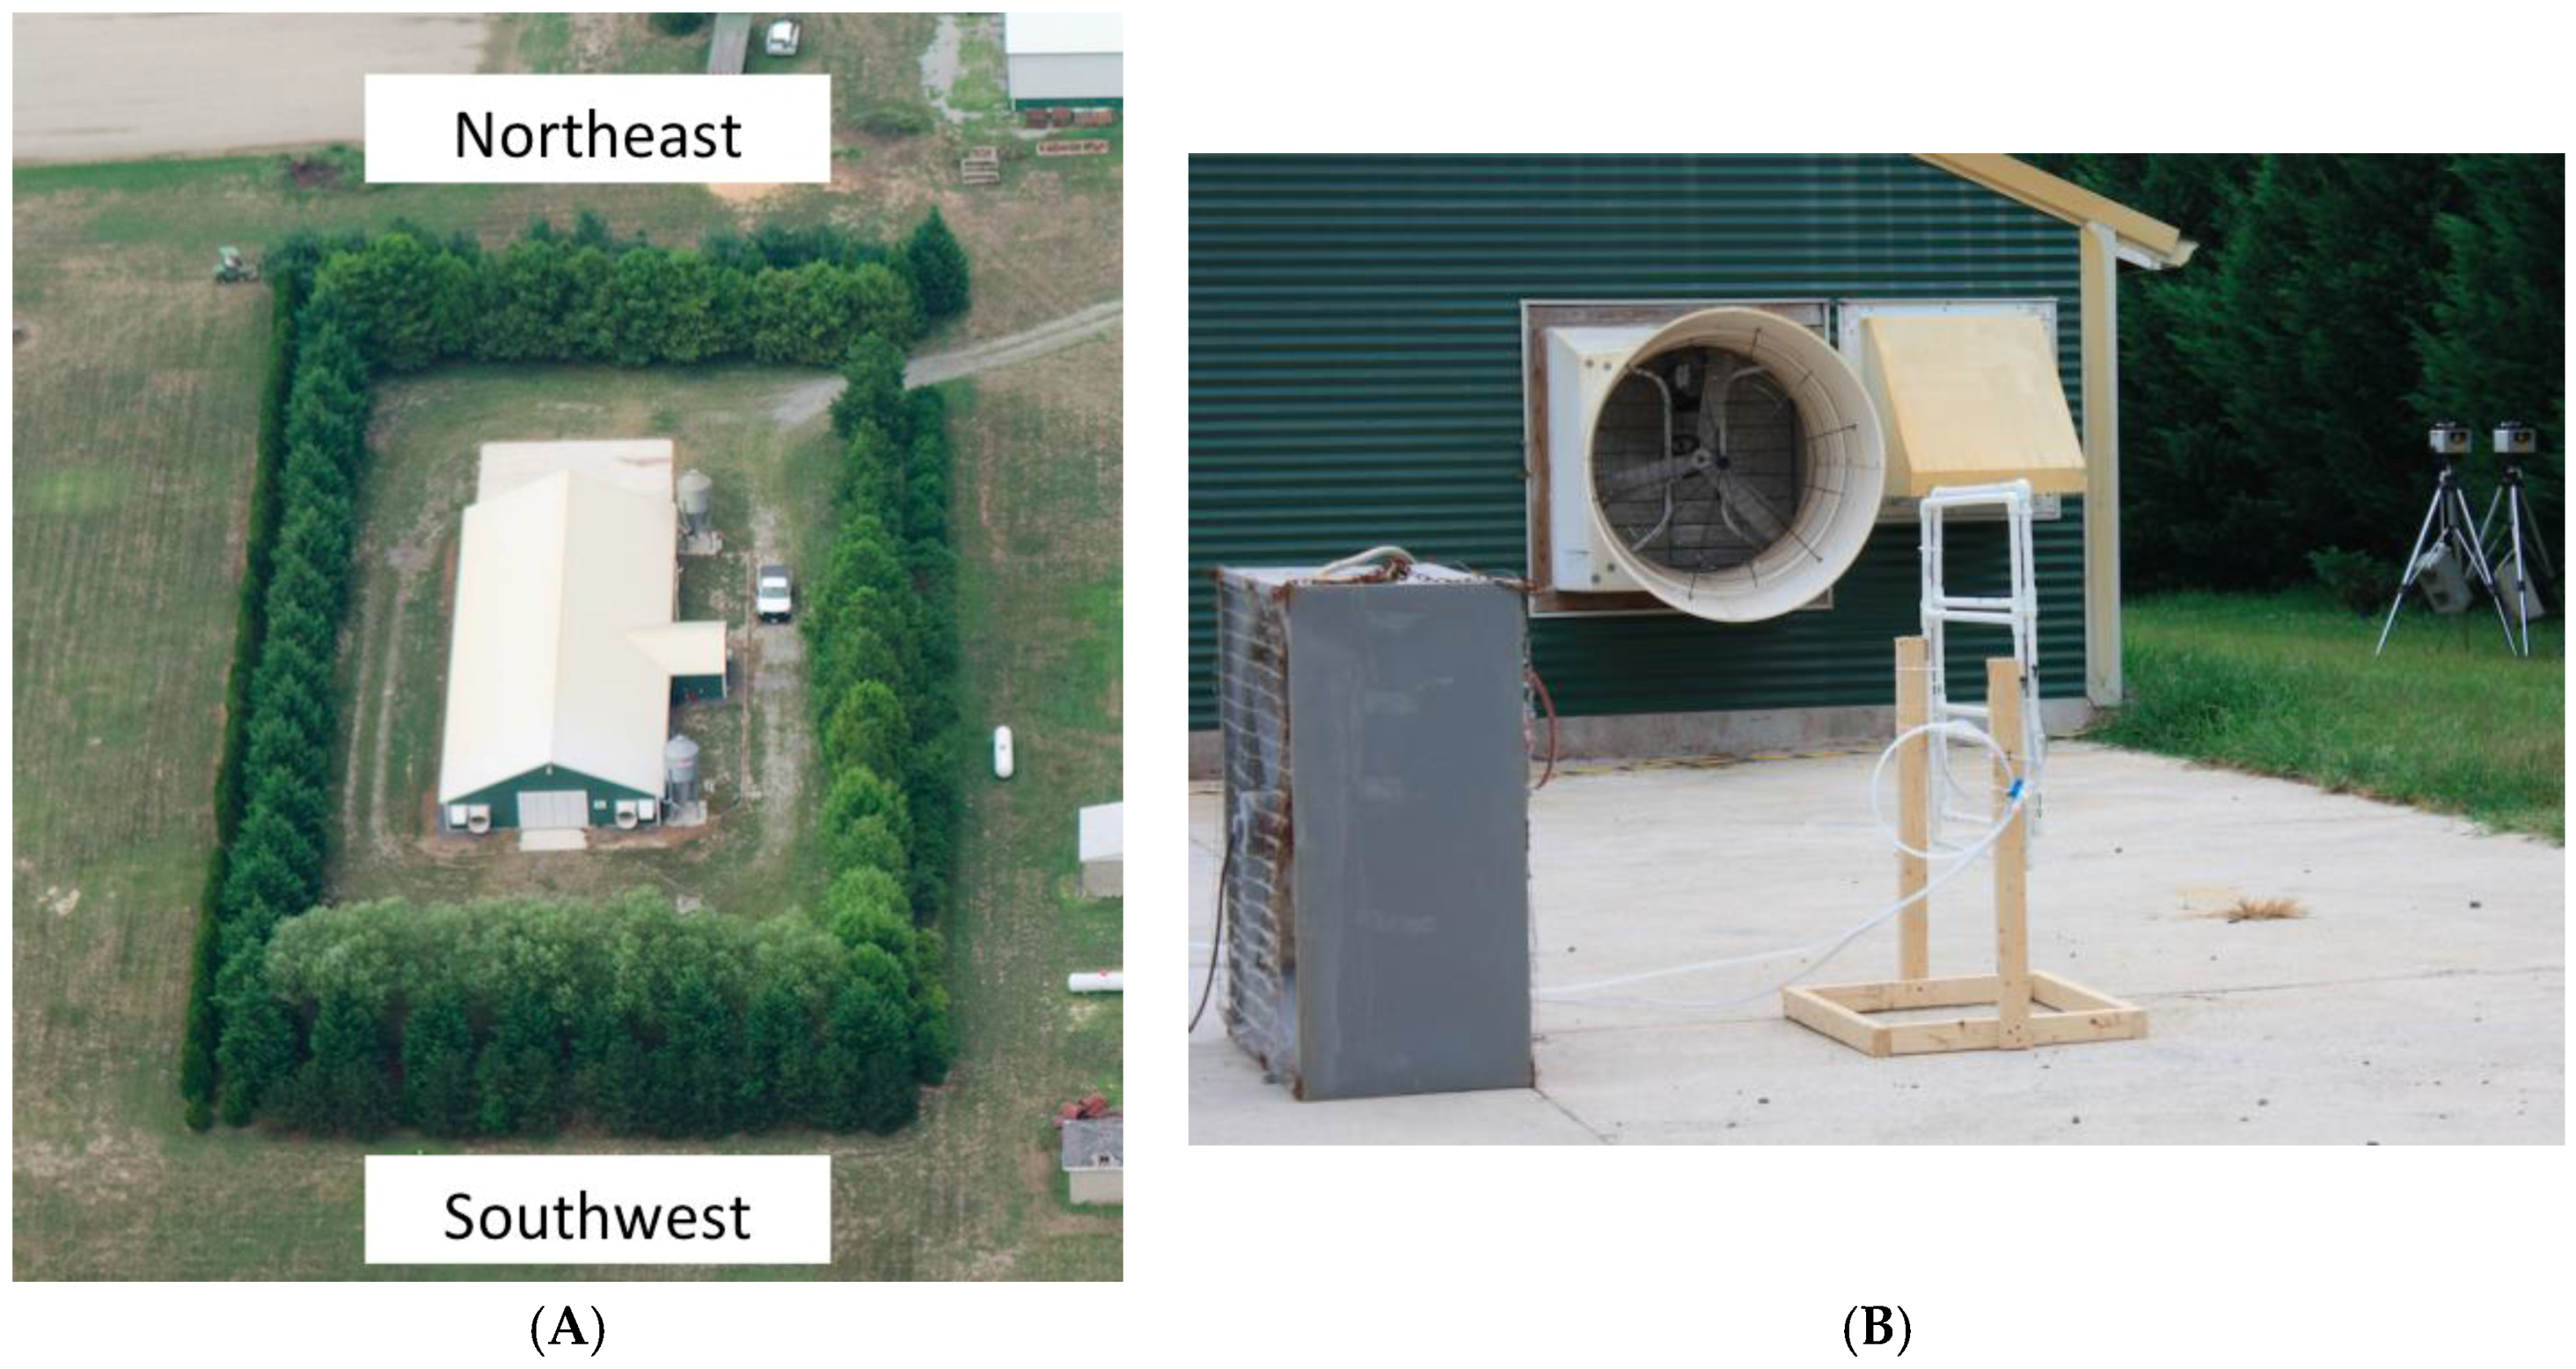
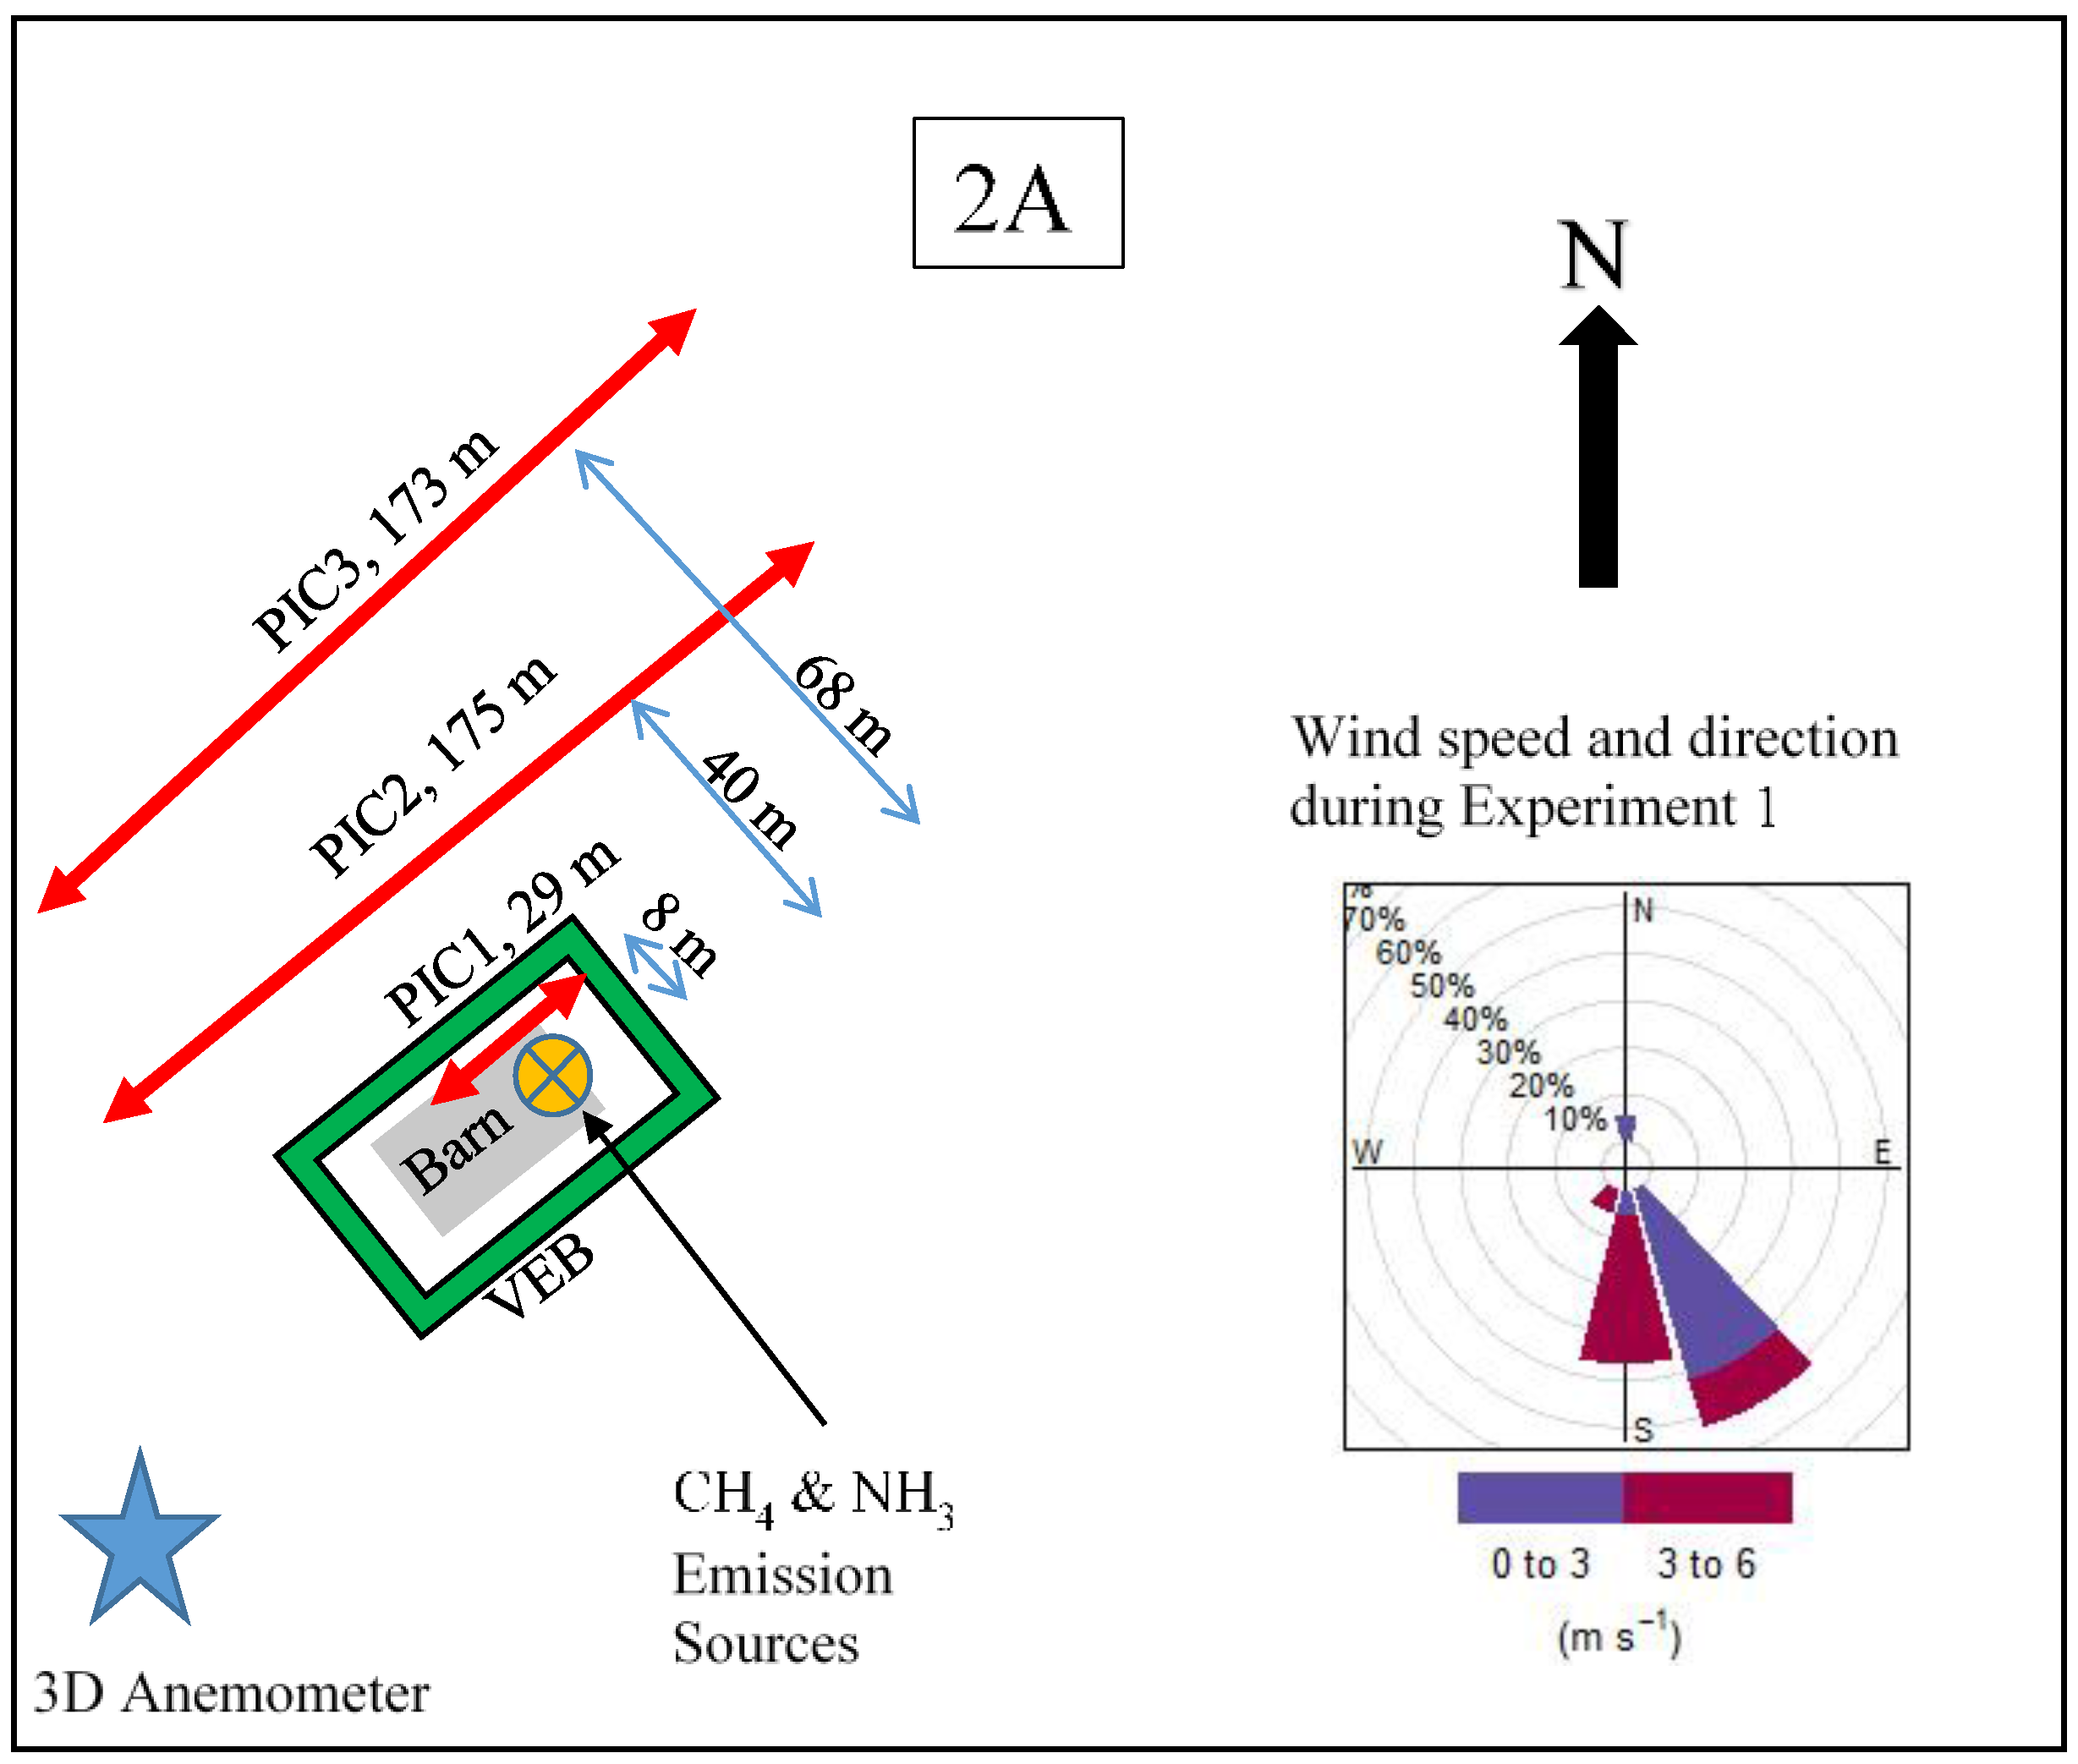
2.1. Experimental Site

The experimental site was located in Georgetown, DE, and consisted of a research broiler house with a surrounding multi-layer VEB (Figure 1A). The environmentally-controlled experimental house (34.7 m length × 12.1 m width), was oriented southwest to northeast and was divided into two partitions, (17.3 m × 12.1 m each). The two partitions (capacity = 2400 birds/partition) were identical and shared the same center wall and control room. There were four endwall fans (two 0.6-m and two 0.9-m diameter fans) for each partition. The VEB (43 m × 98 m) consisted primarily of green giant arborvitae (Thuja standishii × plicata), Leyland cypress (Cupressus × leylandii), and Austree willow (Salix matsudana × alba) was installed in the spring of 2003. The spacing between the layers and between the trees in each layer was 3 m. No bird production was on-going during the experimental periods, and the house fans were not operating.

2.2. Simulated Emissions

Pure CH4 and NH3 gases (Air Products and Chemicals, Allentown, PA, USA) in compressed gas cylinders were simultaneously released using mass flow controllers (GFC57S-VDL4, Aalborg, Orangeburg, New York, NY, USA) at a measured rate of 30 g/min through a 0.9 × 0.9 m PVC apparatus (Figure 1B) that was placed in front of a 0.9-m box fan outside of the northeast end of the house. Data were collected during three experimental periods from 30 July 2013 to 3 August 2013, however, only two experimental periods were considered here (see below). Gases were released for 60 min with a 30-min downtime between releases. The release point was 9 and 21 m in front of the VEB for Experiment 1 and 2, respectively. Because CH4 is essentially inert and has about the same density, the concentration ratio of these two gases will not change with distance unless NH3 is removed. If NH3 is removed, the ratio will be less than one. Thus, simultaneous measurements of downwind CH4 and NH3 concentrations allowed for the calculation of the extent of NH3 sorption by the VEB biomass and other processes. Furthermore, the ratio of the measured downwind CH4 concentration to the theoretical downwind CH4 concentration without a VEB with the same emission rate allowed for the calculation of the extent of gas dispersion due to the VEB.

2.3. Sensors

An open-path tunable diode laser absorption spectrometers (TDLs, GasFinder2.0 for CH4, Boreal Laser Inc., Edmonton, AB, Canada) with retroreflectors were used to measure path-integrated concentrations (PICs). The TDLs were designed for a sampling rate of about 1 Hz and had continuous internal calibration updates every 40 samples using an internal reference cell. Each of the TDLs were calibrated on-site for the determination of a correction factor for each gas. Two CH4 TDLs were factory-calibrated just before the experiments, while the third TDL was calibrated by comparing measured ambient CH4 concentrations (115.3 m path length) to that measured by the other TDLs. Three NH3 TDLs were calibrated through 1.5-m calibration tubes containing 52.5 ppm of NH3. The TDLs were further adjusted for temperature and pressure corrections for the field study site.
The PIC data and the three-dimensional wind speeds were averaged for 15-min intervals. The resolutions of the TDLs were estimated by determining the root mean squares of differences in consecutive 15-min average PICs (13 to 16 datasets for each TDLs), while measuring gases with the same concentrations. The average PIC resolutions of the CH4 and NH3 TDLs were 5.15 and 4.62 ppm·m, respectively. The concentration measurements were started before the gas release and persisted afterwards to estimate the time-varying ambient background concentrations. This background measurement was used to calculate the change in concentration, i.e., ΔC = CobservedCbackground. A three-dimensional sonic anemometer (CSAT3, Campbell Scientific, Inc., Logan, UT, USA) was used to measure wind speeds at 20 Hz. The three-dimensional (3-D) sonic anemometer provided the wind information needed for calculations of friction velocity (u*), Obukhov stability length (L), surface roughness length (zo), and wind direction. To avoid error-prone periods, the following post data-filtering criteria were used [16]:
  • Obukhov stability length scale, |L| ≥ 5 m (i.e., avoid highly stable/unstable atmospheric stratification);
  • friction velocity u* ≥ 0.1 m/s; and,
  • net changes in PICs due to release of tracer gases > resolutions of each TDLs.
Three experimental runs were conducted with the TDLs strategically located to measure downwind PICs from the emission source with anticipated dominant wind directions. During the period of 30 July 2013 to 31 July 2013, the dominant wind direction was not favorable for obtaining reliable downwind PICs. Furthermore, low wind speeds with u* less than 0.1 m/s were observed. Therefore, the datasets obtained during this period were excluded from further analysis. The subsequent experimental setups and wind conditions during Experiment 1 (31 July 2013 to 1 August 2013) and Experiment 2 (2 August 2013 to 3 August 2013) are shown in Figure 2.

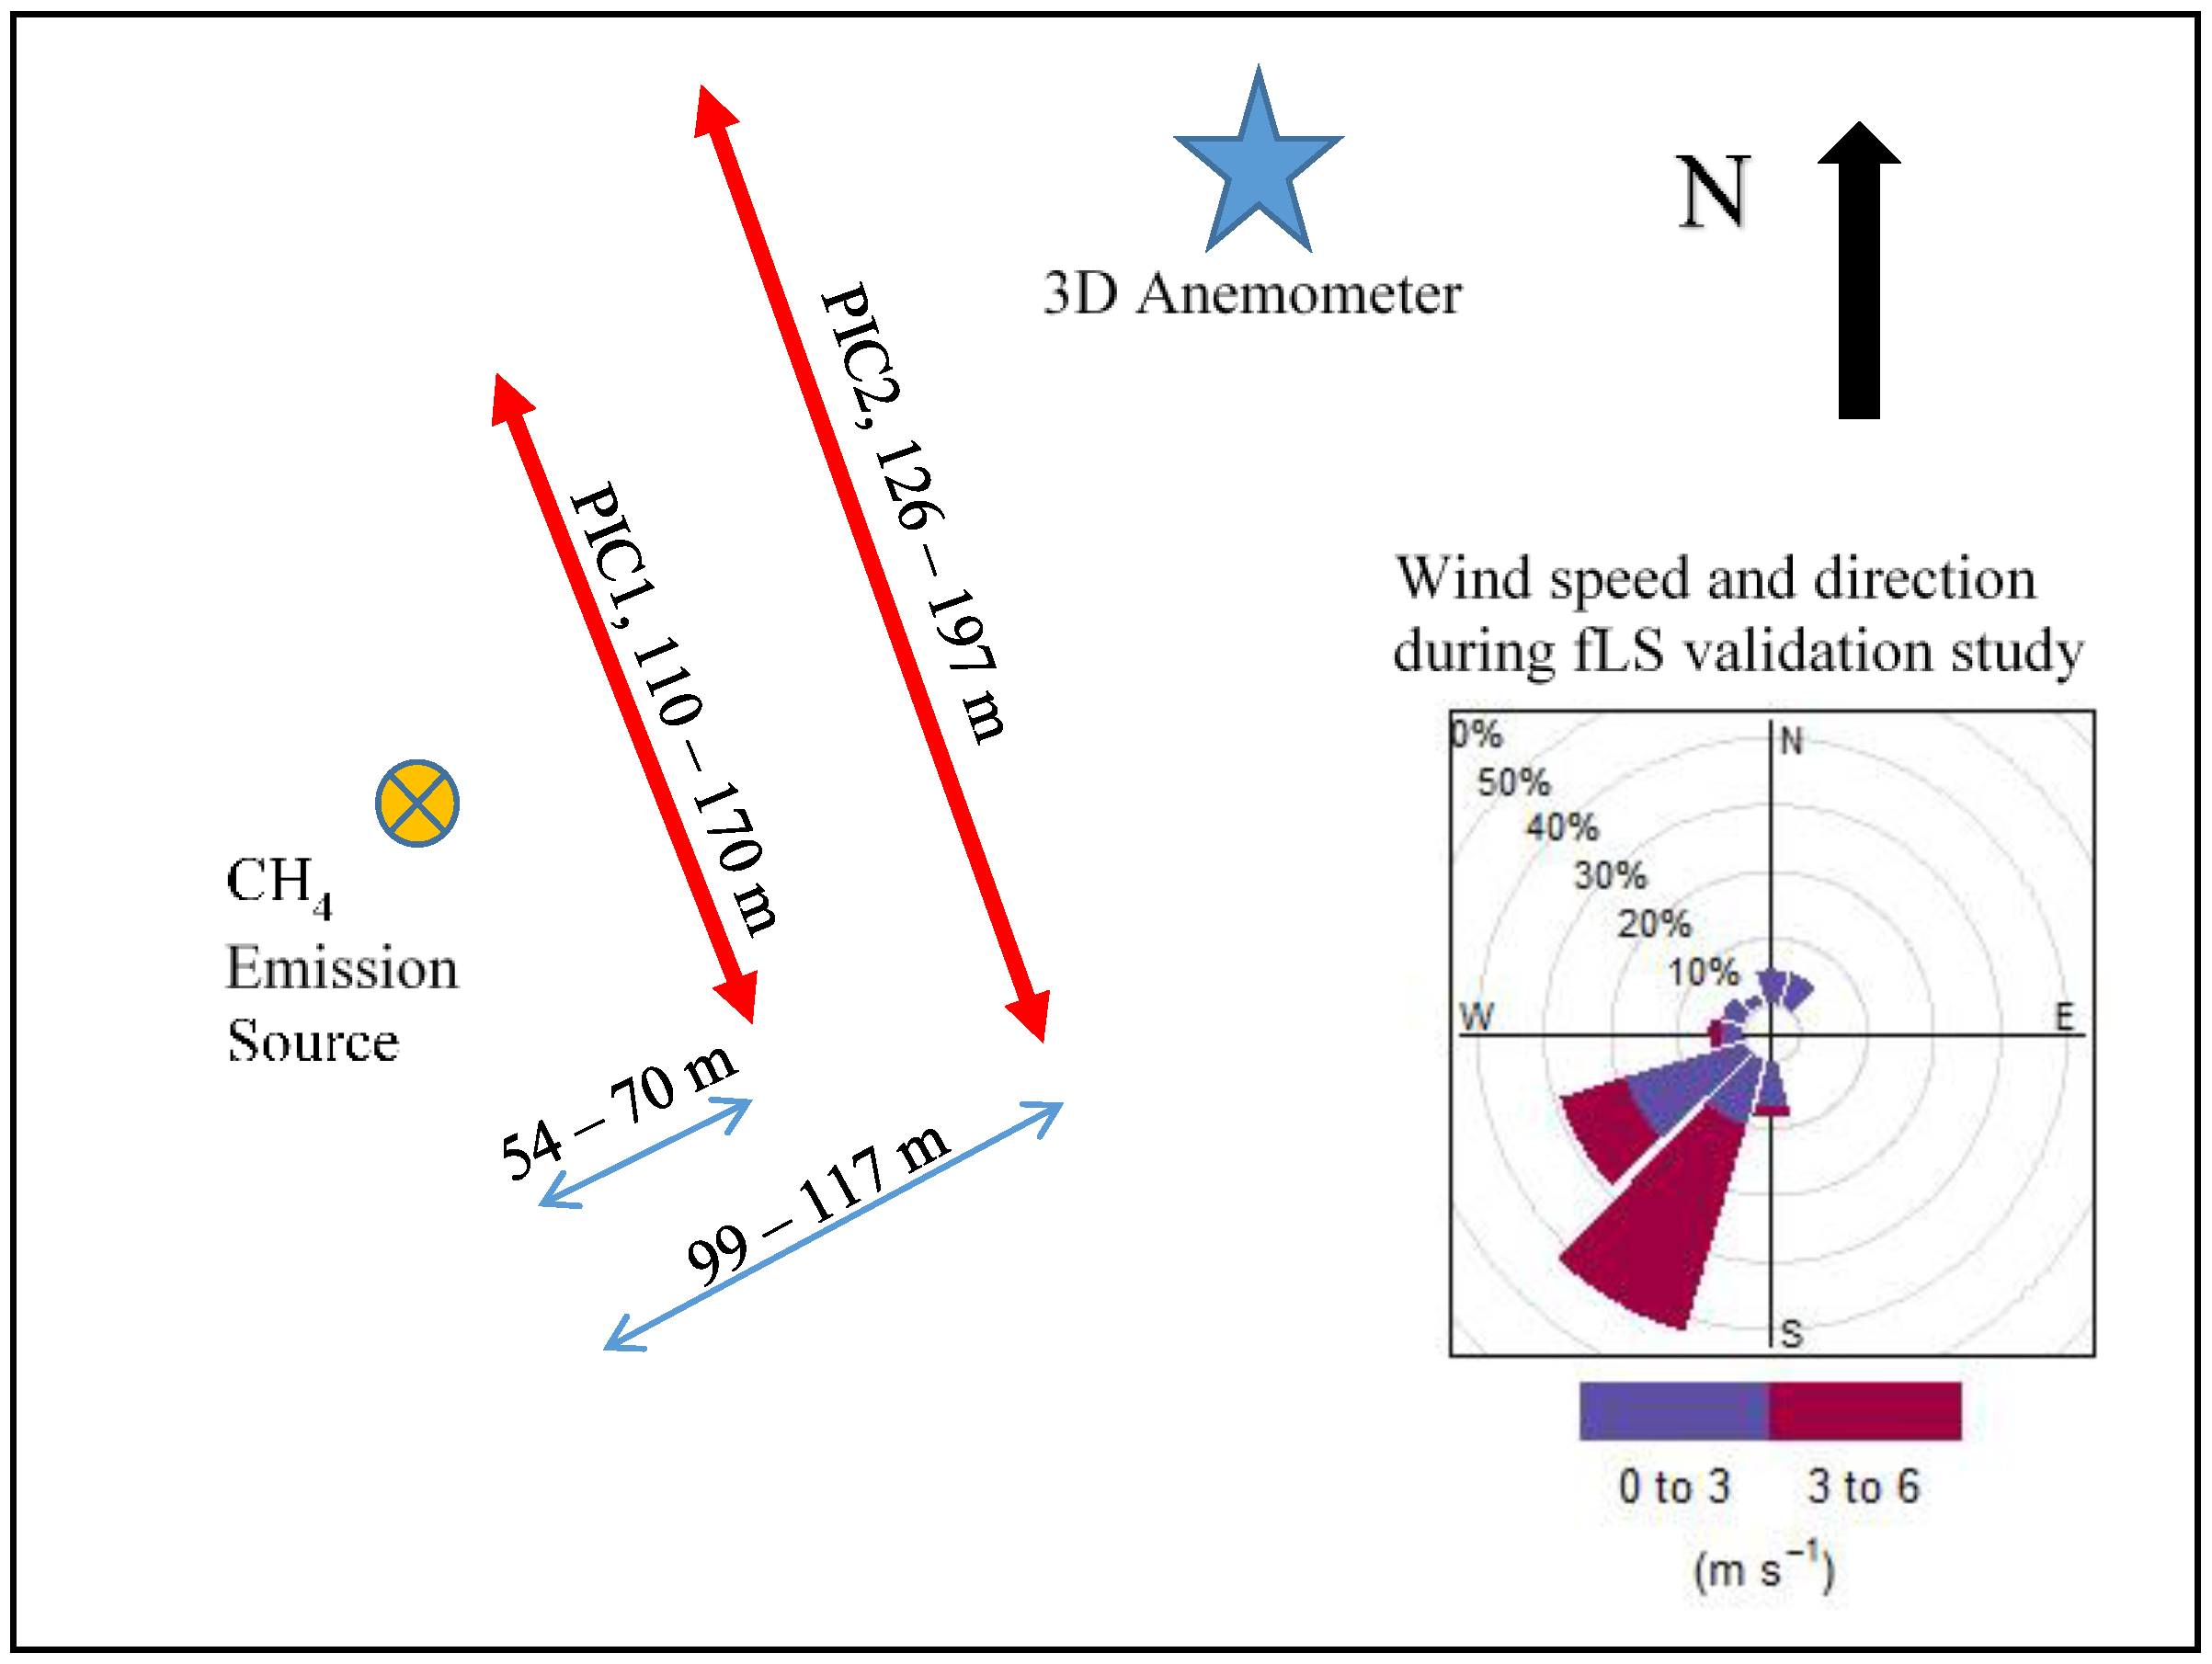
2.4. Forward Lagrangian Stochastic (fLS) Technique Validation Study

The theoretical downwind CH4 and NH3 concentrations without a VEB were calculated using a Lagrangian stochastic (LS) dispersion model (WindTrax, http://www.thunderbeachscientific.com/) with known emission rates. Accuracies of the LS model for estimating the emission rates from concentration measurements made downwind of emission sources (hereafter called backward Lagrangian stochastic (bLS) technique) has been documented in the literature [17,18,19,20,21,22,23,24,25]. Relative errors that are associated with the bLS are suggested to be 10% to 15% for short-range cases (where concentration is taken within 1 to 2 km of the source). WindTrax can also be used to estimate the downwind concentration accurately from an emission source without a VEB if the emission rate is known (hereafter called forward Lagrangian stochastic (fLS) technique). It logically follows that the downwind concentration can be calculated using the fLS technique with a similar level of accuracy with a known emission rate.
To confirm the accuracy of the fLS technique, independent trace gas release experiments were conducted on a grass field at the USDA-ARS Coastal Plains Soil, Water and Plant Research Center in Florence, SC, USA, during March and April 2014. Methane was used as a tracer. The positions of point emission source and PICs were similar to that of the Delaware field Experiment 2 (Figure 3). During the study period, the site was covered with short Bermuda grass less than 0.1 m tall. The accuracy of the fLS technique was calculated as:
Accuracy = Cmeasured/CfLC
where Cmeasured = measured CH4 concentration (ppm) and CfLC = calculated CH4 concentration using the fLS technique (ppm).
The central tendency and precision of measurements were presented with arithmetic averages and standard deviations (given as ± values). All of the statistical parameters and tests (i.e., mean, standard deviation, t-tests, and analyses of variance (ANOVA)) were obtained/performed using GraphPad Prism 7.03 (GraphPad Software, Inc., La Jolla, CA, USA).

3. Results and Discussion

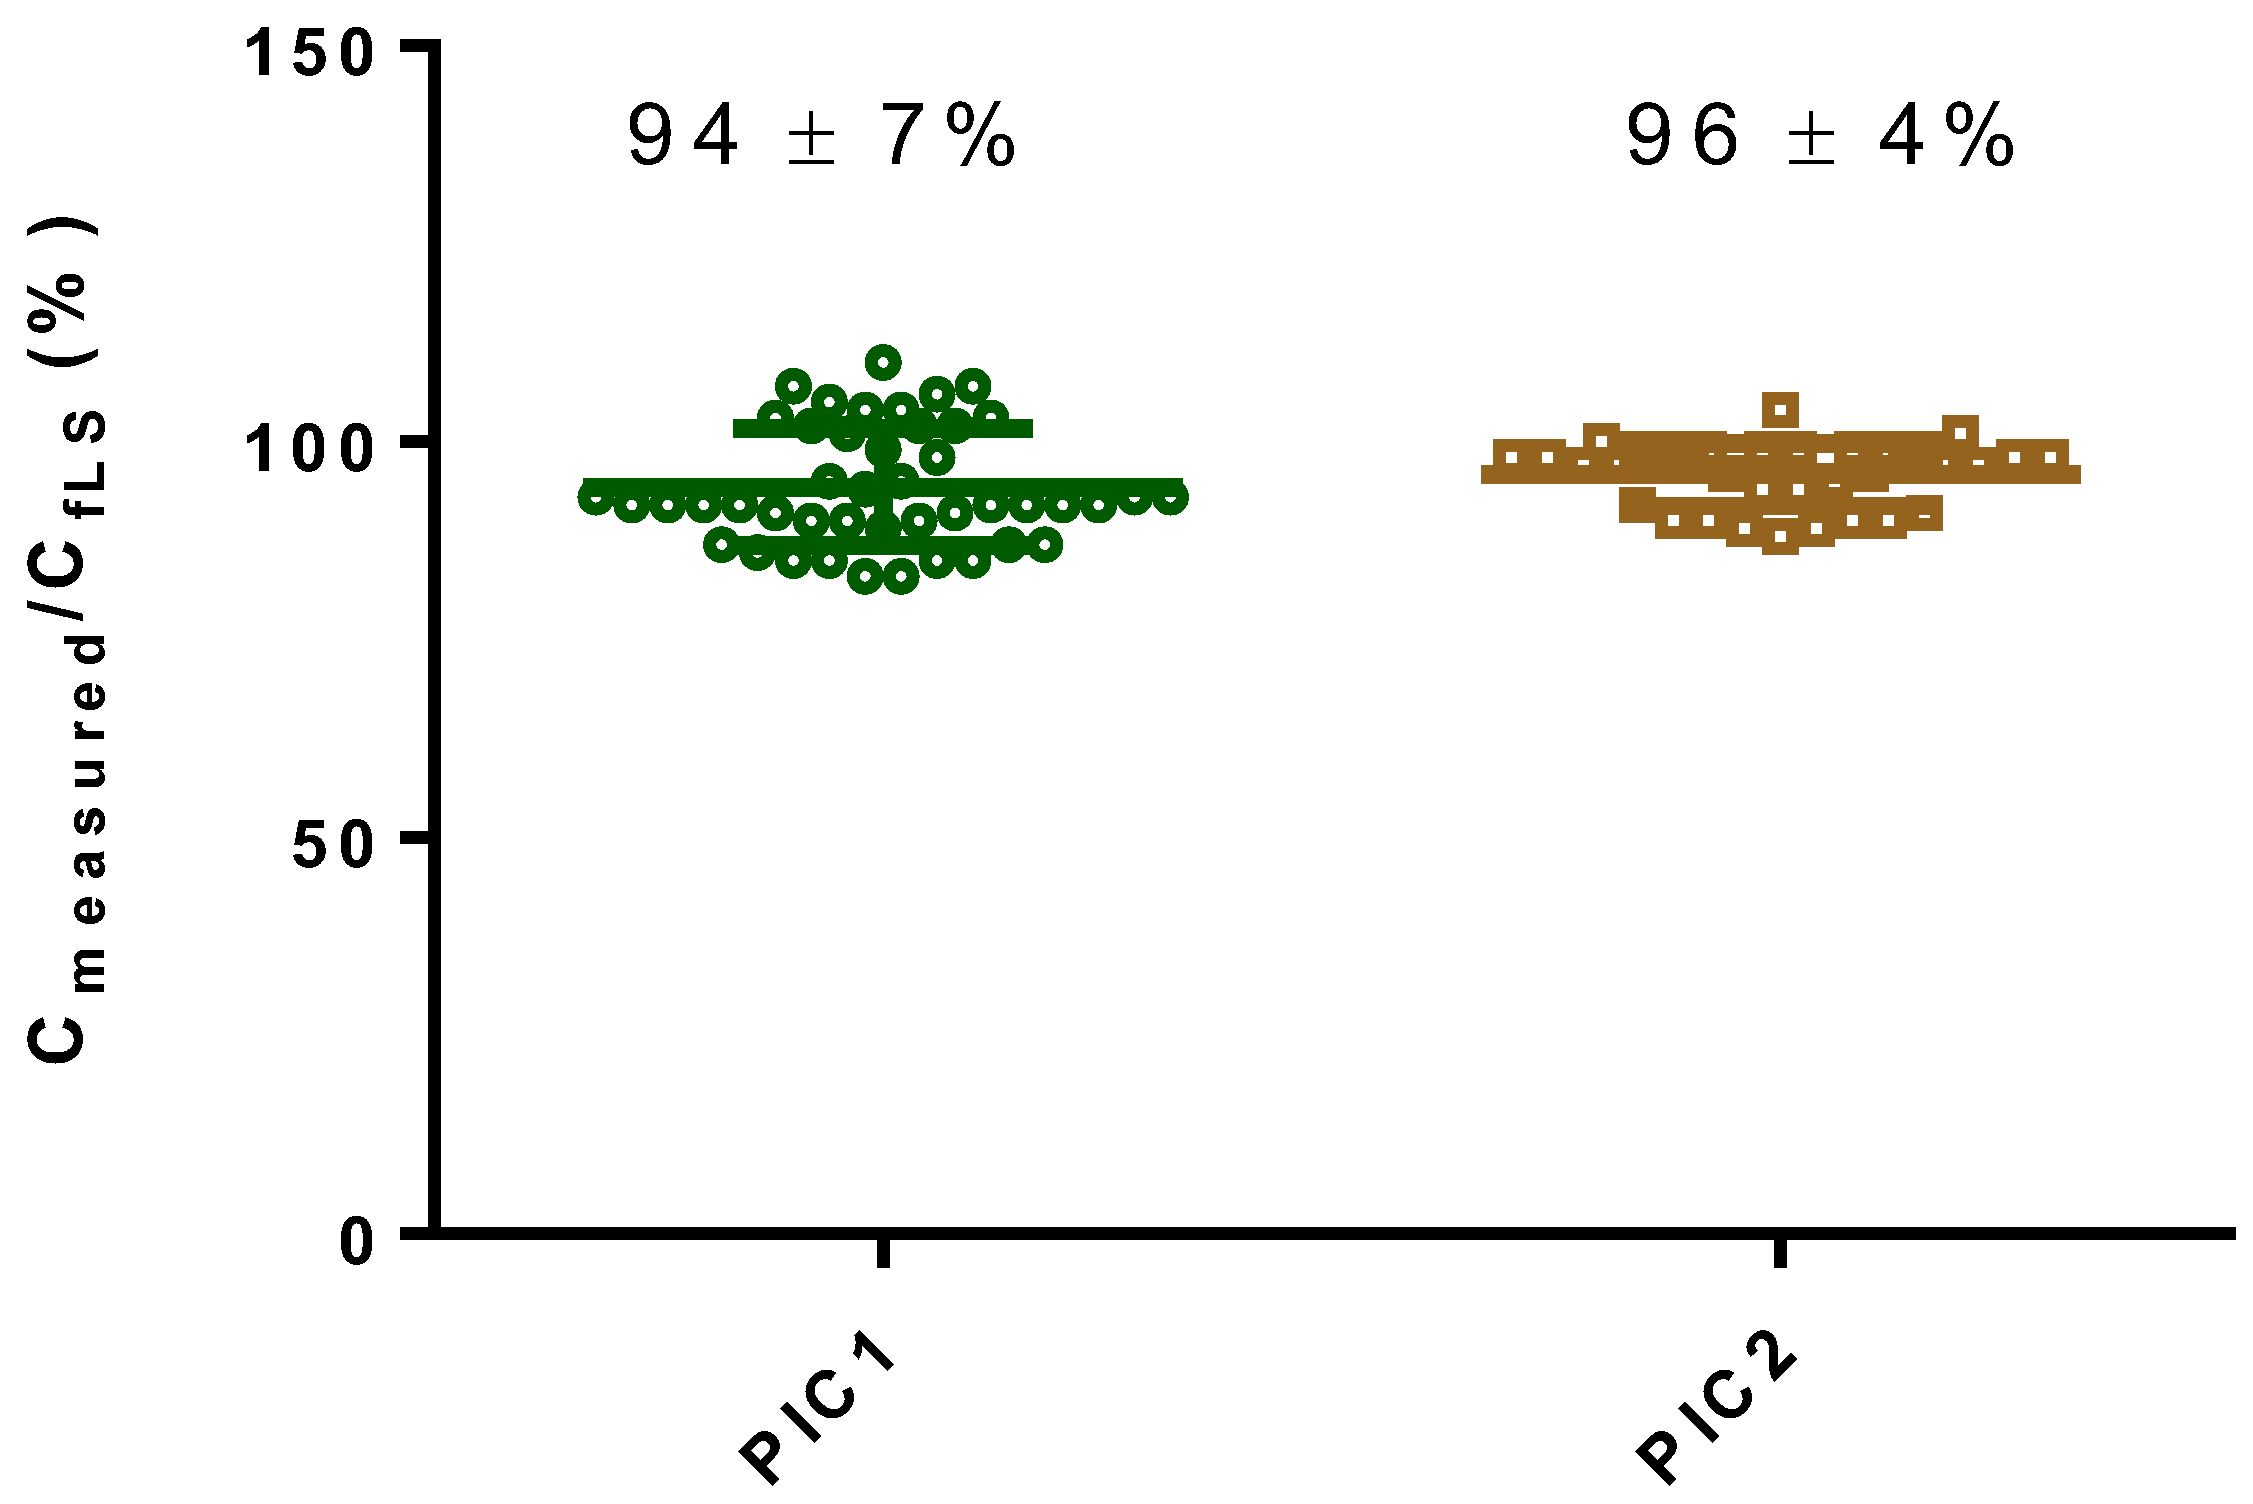
3.1. Accuracy of the fLS Technique

The accuracy of the fLS technique (Cmeasured/CfLC) was determined by comparing the theoretical CH4 downwind concentrations that were calculated using the fLS technique to the measured CH4 downwind concentrations (Table 1 and Figure 4). However, many of the 15-min datasets collected on 20 March 2014 and several on 1 April 2014 were excluded because the dominant wind paths were outside the two PICs; therefore, fewer datasets were analyzed during these periods. The average percent accuracy of the fLS technique for PIC1 and PIC2 for each day ranged from 89% to 105% and 90% to 99%, respectively. The average accuracy ratios of all the runs for PIC1 (94% ± 7%) and PIC2 (96% ± 4%) were not statistically different (p < 0.05, unpaired t-test with Welch’s correction). The combined overall average percent accuracy of both PICs was 95% ± 6%. The results of this experiment provide strong evidence that the fLS is a reliable technique to predict the theoretical downwind concentration without any barriers, such as a VEB.

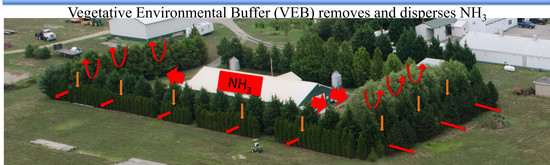
3.2. Enhanced Dispersion by a VEB

The effectiveness of a VEB in dispersing emitted gases was evaluated by comparing the measured downwind CH4 concentrations to theoretical concentrations that would exist if there was no VEB. The theoretical downwind concentrations were calculated using the fLS technique. If the VEB did not affect the dispersion, the ratio of the two measured downwind concentrations (Cmeasured,PIC2 and Cmeasured,PIC3) outside the VEB to the two theoretical concentrations (CfLS,PIC2 and CfLS,PIC3) would be unity because CH4 is essentially inert. The average ratios of CH4 concentration (Cmeasured/CfLS) in Experiment 1 were 0.94 ± 0.06 and 0.93 ± 0.07 for PIC2 and PIC3, respectively (Table 2 and Figure 5). For Experiment 2, the average ratios were slightly lower than that of Experiment 1, with 0.91 ± 0.12 and 0.93 ± 0.06 for PIC2 and PIC3, respectively. For each experiment, the CH4 ratio, Cmeasured/CfLS, for PIC2 and PIC3 were not significantly different (p < 0.05, ANOVA, Table 2), so a combined average for each experiment was calculated, 0.93 ± 0.06 and 0.92 ± 0.10 for Experiments 1 and 2, respectively. This initial assessment suggests that little dispersion was caused by the VEB, however, these calculations did not exclude the background concentration. To quantify the extent to which the VEB decreased downwind concentrations by dispersion (also considering background gas concentrations), the changes in the measured CH4 concentration (ΔCmeasured) were compared to that of theoretical changes in concentration based on the released concentration without the VEB (ΔCfLS). Again, in the absence of dispersion, this ratio, ΔCmeasuredCfLS, should be unity for PIC2 and PIC3. Values for ΔCmeasuredCfLS were 0.71 and 0.55 were observed compared to the theoretical changes without the VEB for PIC2 and PIC3, respectively, in Experiment 1. In Experiment 2, the values were 0.78 and 0.56 for PIC2 and PIC3, respectively (Table 2). However, these reductions that were observed at PIC2 and PIC3 locations within each experiment were not statistically different from each other either within the experiment or between experiments. The overall average of downwind concentration ratios for PIC2 and PIC3 in both Experiments 1 and 2 was 0.63 ± 0.34, i.e., dispersion by the VEB decreased the concentration to 63%.

3.3. Removal of NH3 by the VEB

Because the molecular weights of CH4 and NH3 are similar, these gases should disperse similarly. However, the CH4 background concentrations (ca. 1.9 ppm) were larger than the NH3 background (ca. 0.4 ppm), so a simple comparison of the observed apparent concentrations resulting from the co-release of these gases would not yield accurate values of the percent NH3 removal. Instead, the net changes in gas concentration beyond the background concentration (ΔC) were used to compare the C/Q of the two gases (Table 3). If NH3 behaves like a near-inert gas, CH4, the values of (ΔCmeasured/Q)NH3/(ΔCmeasured/Q)CH4 will be unity. However, if other processes beyond dispersion remove NH3, then the measured values of (ΔC/Q)NH3/(ΔC/Q)CH4 will be less than unity.
Greater reductions in NH3 concentration were observed in Experiment 1 (0.64 and 0.68 for PIC2 and PIC3, respectively) than in Experiment 2 (0.94 and 0.90 for PIC2 and PIC3, respectively; Table 3). However, these differences in NH3 reduction between the two experiments were not statistically significant (p < 0.05). The overall average change in NH3 concentration was 0.78 ± 0.50 for both PIC2 and PIC3 for all of the runs in Experiments 1 and 2. This represents an additional 22% (100% − 78% = 22%) reduction of NH3 that was removed by the VEB beyond dispersion. From the previous calculations, the downwind concentrations were reduced to 63% due to dispersion. Thus, the additional 22% removal would result in a total decrease in NH3 concentration to 49% (i.e., 78% × 63% = 49%) of the theoretical downwind NH3 concentration observed at PIC2 and PIC3 if a VEB was not present.
The percent decrease in NH3 downwind concentration can also be estimated by directly comparing the change in measured NH3 concentration to that of the theoretical concentration that would exist without the VEB. Table 4 shows the ratios of ΔCmeasuredCfLS for NH3, i.e., the changes in measured and theoretical concentrations as was done for the dispersion study with CH4. The overall average change in NH3 downwind concentration from this method was 0.51 of the theoretical NH3 concentration without the VEB. This translates to a 49% reduction in the emitted concentration that is similar to the result that was determined by comparing the measured concentrations of CH4 and NH3. It also further validates our approach in assessing the impact of VEB on dispersion and removal of NH3.

3.4. Increase in Gas Concentrations within the VEB

The ratios of the change in measured concentration to the theoretical concentration without the VEB for CH4 in front of the VEB (i.e., PIC1) during Experiment 1 and 2 were 2.21 ± 0.87 and 1.83 ± 0.70, respectively (Table 2). Similarly, higher ratios were observed for NH3; 2.31 ± 1.00 and 1.90 ± 0.61 for Experiment 1 and 2, respectively (Table 4). These higher-than-unity ratios suggested that the concentrations inside the VEB were higher than those without the VEB. These higher concentrations indicated that the emitted gases accumulated within the VEB, which may be due to restriction in wind flow and eddy formation within the VEB. Interestingly, almost no NH3 removal was observed within the VEB at PIC1, as suggested by the measured values of the ratio (ΔC/Q)NH3/(ΔC/Q)CH4, which were near unity (overall average of 0.99 ± 0.11 for all of the runs in both Experiments 1 and 2). Both CH4 and NH3 increased within the VEB, but no significant NH3 removal was observed because little vegetative biomass was available onto which NH3 could be removed via adsorption/absorption inside the VEB area (Figure 1). The higher concentrations of emitted gas inside the VEB area calls for careful monitoring of the health-affecting gases, such as H2S and NH3, to ensure the safety of farm workers.

4. Conclusions

The effectiveness of VEBs in removing and dispersing NH3 emission from poultry houses was investigated by conducting a series of simulated gas-release experiments from a poultry house equipped with a well-established VEB. Known rates of CH4 and NH3 were released just outside of the house. The measured downwind concentrations were compared with the theoretical downwind concentrations that would exist without the VEB. The theoretical concentrations without the VEB were calculated using the fLS technique. From independent tracer gas release experiments, we found that the overall percent accuracy of the fLS technique was 95% ± 6%, indicating that the fLS technique is a reliable way of predicting theoretical downwind concentrations without a VEB.
Using CH4 as an inert gas, we found that a VEB-enhanced dispersion resulted in concentrations that were 63% of the emitted gas when compared with the theoretical concentrations for a system without the VEB. Emitted gas concentrations inside the VEB area were about twice as large as the theoretical concentrations that would exist without the VEB. The ratios of the measured concentrations of NH3 and CH4 showed that an additional 22% of the NH3 was removed beyond the reduction in downwind from dispersion. The resulting downwind NH3 concentration after the dispersion and removal by the VEB was 49% of the theoretical concentration that would exist without the VEB.

Acknowledgments

The authors would like to acknowledge the technical support provided by Melvin Johnson and Jerry H. Martin II of the USDA-ARS Coastal Plains Soil, Water & Plant Research Center, Florence, SC, and Chongyang Lin of the University of Delaware. This research was supported by the USDA-ARS National Programs 212, Soil and Air, and 214, Agricultural and Industrial Byproduct Utilization and the USDA NRCS Conservation Innovation Grant Program (Awards NRCS 69-3A75-12-244 and 69-3A75-7-91).

Author Contributions

K.S.R. carried out the studies, collected and post processed data, and wrote the draft. All authors participated in designing experiments and/or collecting data, and all participated in the writing of the manuscript.

Conflicts of Interest

The authors declare no conflict of interest.

Disclaimer

Mention of trade names or commercial products in this publication is solely for the purpose of providing specific information and does not imply recommendation or endorsement by the U.S. Department of Agriculture (USDA), University of Delaware (UDel), or University of Maryland (UMD). USDA, UDel, and UMD, are equal opportunity providers and employers.

References

  1. Ro, K.S.; McConnell, L.L.; Melvin, J.H.; Hunt, P.G.; Parker, D. Livestock air treatment using PVA-coated powdered activated carbon biofilter. Appl. Eng. Agric. 2008, 24, 791–798. [Google Scholar]
  2. Ro, K.S.; Lima, I.M.; Reddy, G.B.; Jackson, M.A.; Gao, B. Removing gaseous NH3 using biochar as an adsorbent. Agriculture 2015, 5, 991–1002. [Google Scholar] [CrossRef]
  3. Jones, W.; Morning, K.; Olenchock, S.A.; Williams, T.; Hickey, J. Environmental study of poultry confnement building. Am. Ind. Hyg. Assoc. J. 1984, 45, 760–766. [Google Scholar] [CrossRef] [PubMed]
  4. Adrizal, A.; Patterson, P.H.; Hulet, R.M.; Bates, R.M.; Myers, C.A.B.; Martin, G.P.; Shockey, R.L.; Van der Grinten, M.; Anderson, D.A.; Thompson, J.R. Vegetative buffers for fan emissions from poultry farms: 2. ammonia, dust and foliar nitrogen. J. Environ. Sci. Health Part B 2008, 43, 96–103. [Google Scholar] [CrossRef] [PubMed]
  5. Donham, K.J.; Cumro, D.; Reynolds, S. Synergistic effects of dust and ammonia on the occupantional health effects of poultry production workers. J. Agromed. 2002, 2, 57–76. [Google Scholar] [CrossRef] [PubMed]
  6. National Research Council. Air Emissions from Animal Feeding Operations: Current Knowledge, Future Needs; NRC: Washington, DC, USA, 2003. [Google Scholar]
  7. SJVAPCD 1-Hour Extreme Ozone Attainment. Available online: http://www.valleyair.org/Air_Quality_Plans/AQ_plans_Ozone_Final.htm (accessed on 9 February 2018).
  8. SJVAPCD 8-Hour Ozone Plan. Available online: http://www.valleyair.org/Air_Quality_Plans/AQ_Final_Adopted_Ozone2007.htm (accessed on 9 February 2018).
  9. Belt, S.V.; VanDerGrinten, M.; Malone, G.; Patterson, P.H.; Shockey, R.L. Windbreak Plant Species for Odor Management around Poulty Production Facilities; National Plant Materials Center: Beltsville, MD, USA, 2007.
  10. Belt, S.V. Utilizing Warm-Season Grasses to Mitigate Poultry Tunnel Fan Emissions on the Delmarva Peninsula; National Plant Materials Center: Beltsville, MD, USA, 2010.
  11. Tyndall, J.; Colletti, J. Mitigating swine odor with strategically designed shelterbelt systems: A review. Agrofor. Syst. 2007, 69, 45–65. [Google Scholar] [CrossRef]
  12. Parker, D.B.; Malone, G.W.; Walter, W.D. Vegetative environmental buffers and exhaust fan deflectors for reducing downwind odor and VOCs from tunnel-ventilated swine barns. Trans. ASABE 2012, 55, 227–240. [Google Scholar] [CrossRef]
  13. Malone, G.; Van Wicklen, G.; Collier, S.; Hansen, D. Efficacy of Vegetative Environmental Buffers to Capture Emissions from Tunnel Ventilated Poulty Houses; Raleigh: Potomac, MD, USA, 2006; pp. 875–878. [Google Scholar]
  14. Malone, B. Using trees to reduce dust and odour emissions from poultry farms. In Proceedings of the Poutry Information Exchange, Surfers Paradise, Queensland, Australia, 14 April 2004; pp. 33–38. [Google Scholar]
  15. Patterson, P.H.; Adriazal, A. Management strategies to reduce air emissions: Emphasis—Dust and ammonia. J. Appl. Poult. Res. 2005, 14, 638–650. [Google Scholar] [CrossRef]
  16. Ro, K.S.; Moore, P.A.; Szogi, A.A.; Millner, P.D. Ammonia and nitrous oxide emissions from broiler houses with downtime windrowed litter. J. Environ. Qual. 2017, 46, 498–504. [Google Scholar] [CrossRef] [PubMed]
  17. Flesch, T.K.; Wilson, J.D.; Harper, L.A.; Brian, P.C. Estimating gas emissions from a farm with an inverse-despersion technique. Atmos. Environ. 2005, 39, 4863–4874. [Google Scholar] [CrossRef]
  18. Flesch, T.K.; Wilson, J.D.; Harper, L.A.; Todd, R.W.; Cole, N.A. Determining ammonia emissions from a cattle feedlot with an inverse dispersion technique. Agric. For. Meteorol. 2007, 144, 139–155. [Google Scholar] [CrossRef]
  19. Harper, L.A.; Flesch, T.K.; Powell, J.M.; Coblentz, W.K.; Jokela, W.E.; Martin, N.P. Ammonia emissions from dairy production in Wisconsin. J. Dairy Sci. 2009, 92, 2326–2337. [Google Scholar] [CrossRef] [PubMed]
  20. Harper, L.A.; Flesch, T.K.; Wilson, J.D. Ammonia emissions from broiler production in the San Joaquin Valley. Poult. Sci. 2010, 89, 1802–1814. [Google Scholar] [CrossRef] [PubMed]
  21. Ro, K.S.; Johnson, M.H.; Hunt, P.G.; Flesch, T.K. Measuring trace gas emission from multi-distributed sources using vertical radial plume mapping (VRPM) and backward Lagrangian stochastic (bLS) techniques. Atmosphere 2011, 2, 553–566. [Google Scholar] [CrossRef]
  22. Ro, K.S.; Johnson, M.H.; Stone, K.C.; Hunt, P.G.; Flesch, T.K.; Todd, R.W. Measuring gas emissions from animal waste lagoons with an inverse-dispersion technique. Atmos. Environ. 2013, 66, 101–106. [Google Scholar] [CrossRef]
  23. Ro, K.S.; Stone, K.C.; Johnson, M.H.; Hunt, P.G.; Flesch, T.K.; Todd, R.W. Optimal Sensor Locations for the Backward Lagrangian Stochastic Technique in Measuring Lagoon Gas Emission. J. Environ. Qual. 2014, 43, 1111–1118. [Google Scholar] [CrossRef] [PubMed]
  24. Harper, L.A.; Flesch, T.K.; Weaver, K.H.; Wilson, J.D. The effect of biofuel production on swine farm ammonia and methane emissions. J. Environ. Qual. 2010, 39, 1984–1992. [Google Scholar] [CrossRef] [PubMed]
  25. Harper, L.A.; Denmead, O.T.; Flesch, T.K. Micrometeorological techniques for measurement of greenhouse gas emissions from ruminant animal production. Anim. Feed Sci. Technol. 2011, 166–167, 227–239. [Google Scholar] [CrossRef]
Figure 1. The experimental site and setup (A): broiler house with vegetative environmental buffers (VEB) and (B): Polyvinyl chloride (PVC) gas release apparatus in front of a 0.9-m freestanding, box fan).
Agriculture 08 00046 g001
Figure 2. Field experimental seups and wind conditions during (A) Experiment 1 and (B) Experiment 2.
Agriculture 08 00046 g002aAgriculture 08 00046 g002b
Figure 3. Forward Lagrangian stochastic method (fLS) validation experiment setup and wind conditions during experiments.
Agriculture 08 00046 g003
Figure 4. Percent accuracy of the fLS technique.
Agriculture 08 00046 g004
Figure 5. The CH4 ratios of the change in measured CH4 concentration with a VEB to that for theoretical CH4 concentration without a VEB during Experiments 1 and 2.
Agriculture 08 00046 g005
Table 1. Average percent accuracy of methane (CH4) using the fLS technique with wind speed and friction velocity (u*) (values ± standard deviation).
DateWind Speed (m/s)Friction Velocity u* (m/s)Percent Accuracy for PIC1 (%) Cmeasured/CfLSPercent Accuracy for PIC2 (%) Cmeasured/CfLSNumber of Runs per Day
14 March 20143.4 ± 0.50.33 ± 0.07105 ± 390 ± 121
20 March 20141.7 ± 0.70.22 ± 0.0696 ± 496 ± 27
1 April 20142.8 ± 0.40.25 ± 0.0492 ± 499 ± 316
10 April 20143.2 ± 0.40.33 ± 0.0689 ± 498 ± 137
All Runs2.8 ± 0.80.29 ± 0.0794 ± 796 ± 486
Table 2. Comparisons of measured and theoretical downwind concentration ratios of CH4.
PICsExperiment 1Experiment 2
Cmeasured/CfLSΔCmeasuredCfLS Cmeasured/CfLSΔCmeasuredCfLS
Average of PIC11.67 ± 0.54 a (14)2.21 ± 0.87 c (14)1.49 ± 0.36 a (14)1.83 ± 0.70 c (14)
Averageof PIC20.94 ± 0.06 b (13)0.71 ± 0.22 d (13)0.91 ± 0.15 b (5)0.78 ± 0.72 d (6)
Averageof PIC30.93 ± 0.07 b (13)0.55 ± 0.23 d (13)0.93 ± 0.06 b (10)0.56 ± 0.27 d (10)
Average of PIC2 and PIC30.93 ± 0.060.63 ± 0.230.92 ± 0.100.63 ± 0.34
Values followed by the same letter within the Cmeasured/CfLS category were not significantly different (p < 0.05, ANOVA). ΔCmeasuredCfLS = (ΔCmeasured − ΔCbackground)/(ΔCfLS − ΔCbackground). Values followed by the same letter within the ΔCmeasuredCfLS category were not significantly different (p < 0.05, ANOVA).
Table 3. Net changes in measured gas concentration per emission rate {(ΔC/Q)NH3/(ΔC/Q)CH4}.
Location of PICsExperiment 1Experiment 2
PIC10.97 ± 0.13 a,† (14)1.00 ± 0.08 a (14)
Overall average for PIC1 in Experiments 1 and 20.99 ± 0.11
PIC20.64 ± 0.39 a (8)0.94 ± 0.60 a (5)
PIC30.68 ± 0.30 a (6)0.90 ± 0.68 a (8)
Average of PIC2 and PIC30.66 ± 0.340.92 ± 0.62
Overall average of PIC2 and PIC3 in Experiments 1 and 20.78 ± 0.50
Values followed by the same letter were not significantly different (p < 0.05, ANOVA).
Table 4. Comparisons of the changes in measured and theoretical downwind NH3 concentrations (ΔCmeasuredCfLS) .
Location of PICsExperiment 1Experiment 2
PIC12.31 ± 1.00 a (14)1.90 ± 0.61 a (14)
Average of PIC1 for Experiments 1 and 22.10 ± 0.84
PIC20.55 ± 0.35 b (8)0.38 ± 0.17 b (13)
PIC30.46 ± 0.13 b (6)0.65 ± 0.27 b (10)
Average of PIC2 and PIC30.51 ± 0.270.50 ± 0.27
Overall average of PIC2 & PIC3 for Experiments 1 and 20.51 ± 0.26
Values followed by the same letter were not significantly different (p < 0.05, ANOVA).

