Article

Relationship of Date Palm Tree Density to Dubas Bug Ommatissus lybicus Infestation in Omani Orchards

by
Rashid H. Al Shidi
1,2,*,
Lalit Kumar
1,
Salim A. H. Al-Khatri
2,
Malik M. Albahri
2 and
Mohammed S. Alaufi
2
1
Ecosystem Management, School of Environmental and Rural Science, University of New England, Armidale, NSW 2351, Australia
2
Directorate General of Agriculture and Livestock Research, Ministry of Agriculture and Fisheries, PO Box 50, PC 121 Seeb, Oman
*
Author to whom correspondence should be addressed.
Agriculture 2018, 8(5), 64; https://doi.org/10.3390/agriculture8050064
Submission received: 12 February 2018 / Revised: 21 April 2018 / Accepted: 24 April 2018 / Published: 29 April 2018
(This article belongs to the Special Issue Remote Sensing in Agricultural System)

Abstract

:
Date palm trees, Phoenix dactylifera, are the primary crop in Oman. Most date palm cultivation is under the traditional agricultural system. The plants are usually under dense planting, which makes them prone to pest infestation. The main pest attacking date palm crops in Oman is the Dubas bug Ommatissus lybicus. This study integrated modern technology, remote sensing and geographic information systems to determine the number of date palm trees in traditional agriculture locations to find the relationship between date palm tree density and O. lybicus infestation. A local maxima method for tree identification was used to determine the number of date palm trees from high spatial resolution satellite imagery captured by WorldView-3 satellite. Window scale sizes of 3, 5 and 7 m were tested and the results showed that the best window size for date palm trees number detection was 7 m, with an overall estimation accuracy 88.2%. Global regression ordinary least square (OLS) and local geographic weighted regression (GWR) were used to test the relationship between infestation intensity and tree density. The GWR model showed a good positive significant relationship between infestation and tree density in the spring season with R2 = 0.59 and medium positive significant relationship in the autumn season with R2 = 0.30. In contrast, the OLS model results showed a weak positive significant relationship in the spring season with R2 = 0.02, p < 0.05 and insignificant relationship in the autumn season with R2 = 0.01, p > 0.05. The results indicated that there was a geographic effect on the infestation of O. lybicus, which had a greater impact on infestation severity, and that the impact of tree density was higher in the spring season than in autumn season.

1. Introduction

Date palm trees Phoenix dactylifera Linnaeus are the primary crop in Oman [1]. These plants occupy about 35% of Oman’s cultivated land and 78% of the total fruit trees [2]. The main pest attacking date palm crop in Oman is the Dubas bug Ommatissus lybicus de Bergevin [3,4]. Despite efforts to control this pest, those efforts have not been successful. The main control program is chemical spraying during active periods of the insect, the spring and autumn seasons. During this active period, O. lybicus nymphs hatch and feed on the nutrient sap of the trees [5]. While feeding, honeydew expels from the leaflets and accumulates on the different parts of the trees, especially on the leaves’ surfaces. With dust accumulation, sooty mold grows on the leaves and restricts the photosynthesis process.
O. lybicus flourishes in old traditional plantations with dense tree spacing, which are rarely found in systemic planting locations. Ferguson et al. [6] stated that 21–31% of the variation in insect population is due to crop density. Talhouk [7] reported that O. lybicus flourishes in places with dense cropping patterns due to low adverse abiotic stressors like temperature, wind and sunlight. In addition, high-density crops provided high humidity microclimates favorable for insects. An earlier investigation about the relationship between O. lybicus infestation and tree spacing was conducted by Al-Kindi et al. [8]. This investigation studied the relationship between the spacing and density of date palm trees in different villages and their infestation levels in a wide geographic area. However, this study ignored the variation in tree spacing and density at each location, which are common characteristics in traditional plantations in Oman. This makes date palm tree density different within each plantation location, and could yield a difference in microclimates and affect the severity of pest populations.
To study the relationship between infestation and tree density, we need to count the number of trees in each area. Tree counting used to be done manually, but that required significant efforts and costs [9,10,11], and was susceptible to errors, especially in non-systemic fields where rows overlap and trees are of different sizes and ages [12,13]. Researchers have innovated many automatic and semi-automatic approaches for detecting single trees from high spatial resolution images of different types of sensors [14]. However, only a few studies have counted date palm trees P. dactylifera [15]. Indeed, several studies have counted oil palm Elaeis guineensis Jacquin trees [13,16,17,18,19,20] and coconut palm trees Cocos nucifera Linnaeus [21,22]. In addition, other studies counted and classified different fruittrees, such as different citrus tree varieties [23,24], olive trees Olea europaea Linnaeus [25], walnut Juglans sp. Linnaeus, mango Mangifera indica Linnaeus, orange Citrus sp. Linnaeus, and apple Malus sp. Miller [26]. Moreover, this technology has been adapted to count and classify different forest trees, such as Cupressus sempervirence var. horzontalis Miller [9], pine forest tree ponderosa pine Pinus ponderosa Douglas ex Lawson [27].
Ke and Quackenbush [28] reviewed the historical development of using remote sensing techniques for tree crown detection and delineation. In general, researchers commonly categorize the tree counting in two broad categories, tree detection and tree delineation. The tree detection approach includes local maxima filter, image binarization, and template matching, while the tree delineation approach includes valley following method, region growing method and watershed segmentation. The commonality between these methods is their dependence on the reflectance of the crown center being greater than the edges’ [10,28].
The use of remote sensing to detect individual trees is a multifarious process due to the variance in tree environments [26]. There are many limitations in tree detection, such as the presence of small ground vegetation since it is difficult to segregate spectrally [11], difference in tree intensity [29], tree crown size [30] and tree canopy overlap [31]. Traditional date palm agriculture locations, where the O. lybicus infestation is prevalent, is characterized by dense plant spacing. Farmers grow different crops and fruit trees under date palm trees due to a shortage of land and water resources. Moreover, there are substantial environmental and topographic variations. These characteristics create challenges in detecting date palm trees. Our objective was to study the efficiency of the local maxima method in detecting and counting the number of date palm trees from the high spatial resolution multispectral satellite imagery in the traditional orchards in Oman. The density of the trees was then used to study the relationship between date palm density and O. lybicus infestation within traditional date palm orchards. If a positive correlation is detected, then this factor could be taken into consideration for the control of pests.

2. Materials and Methods
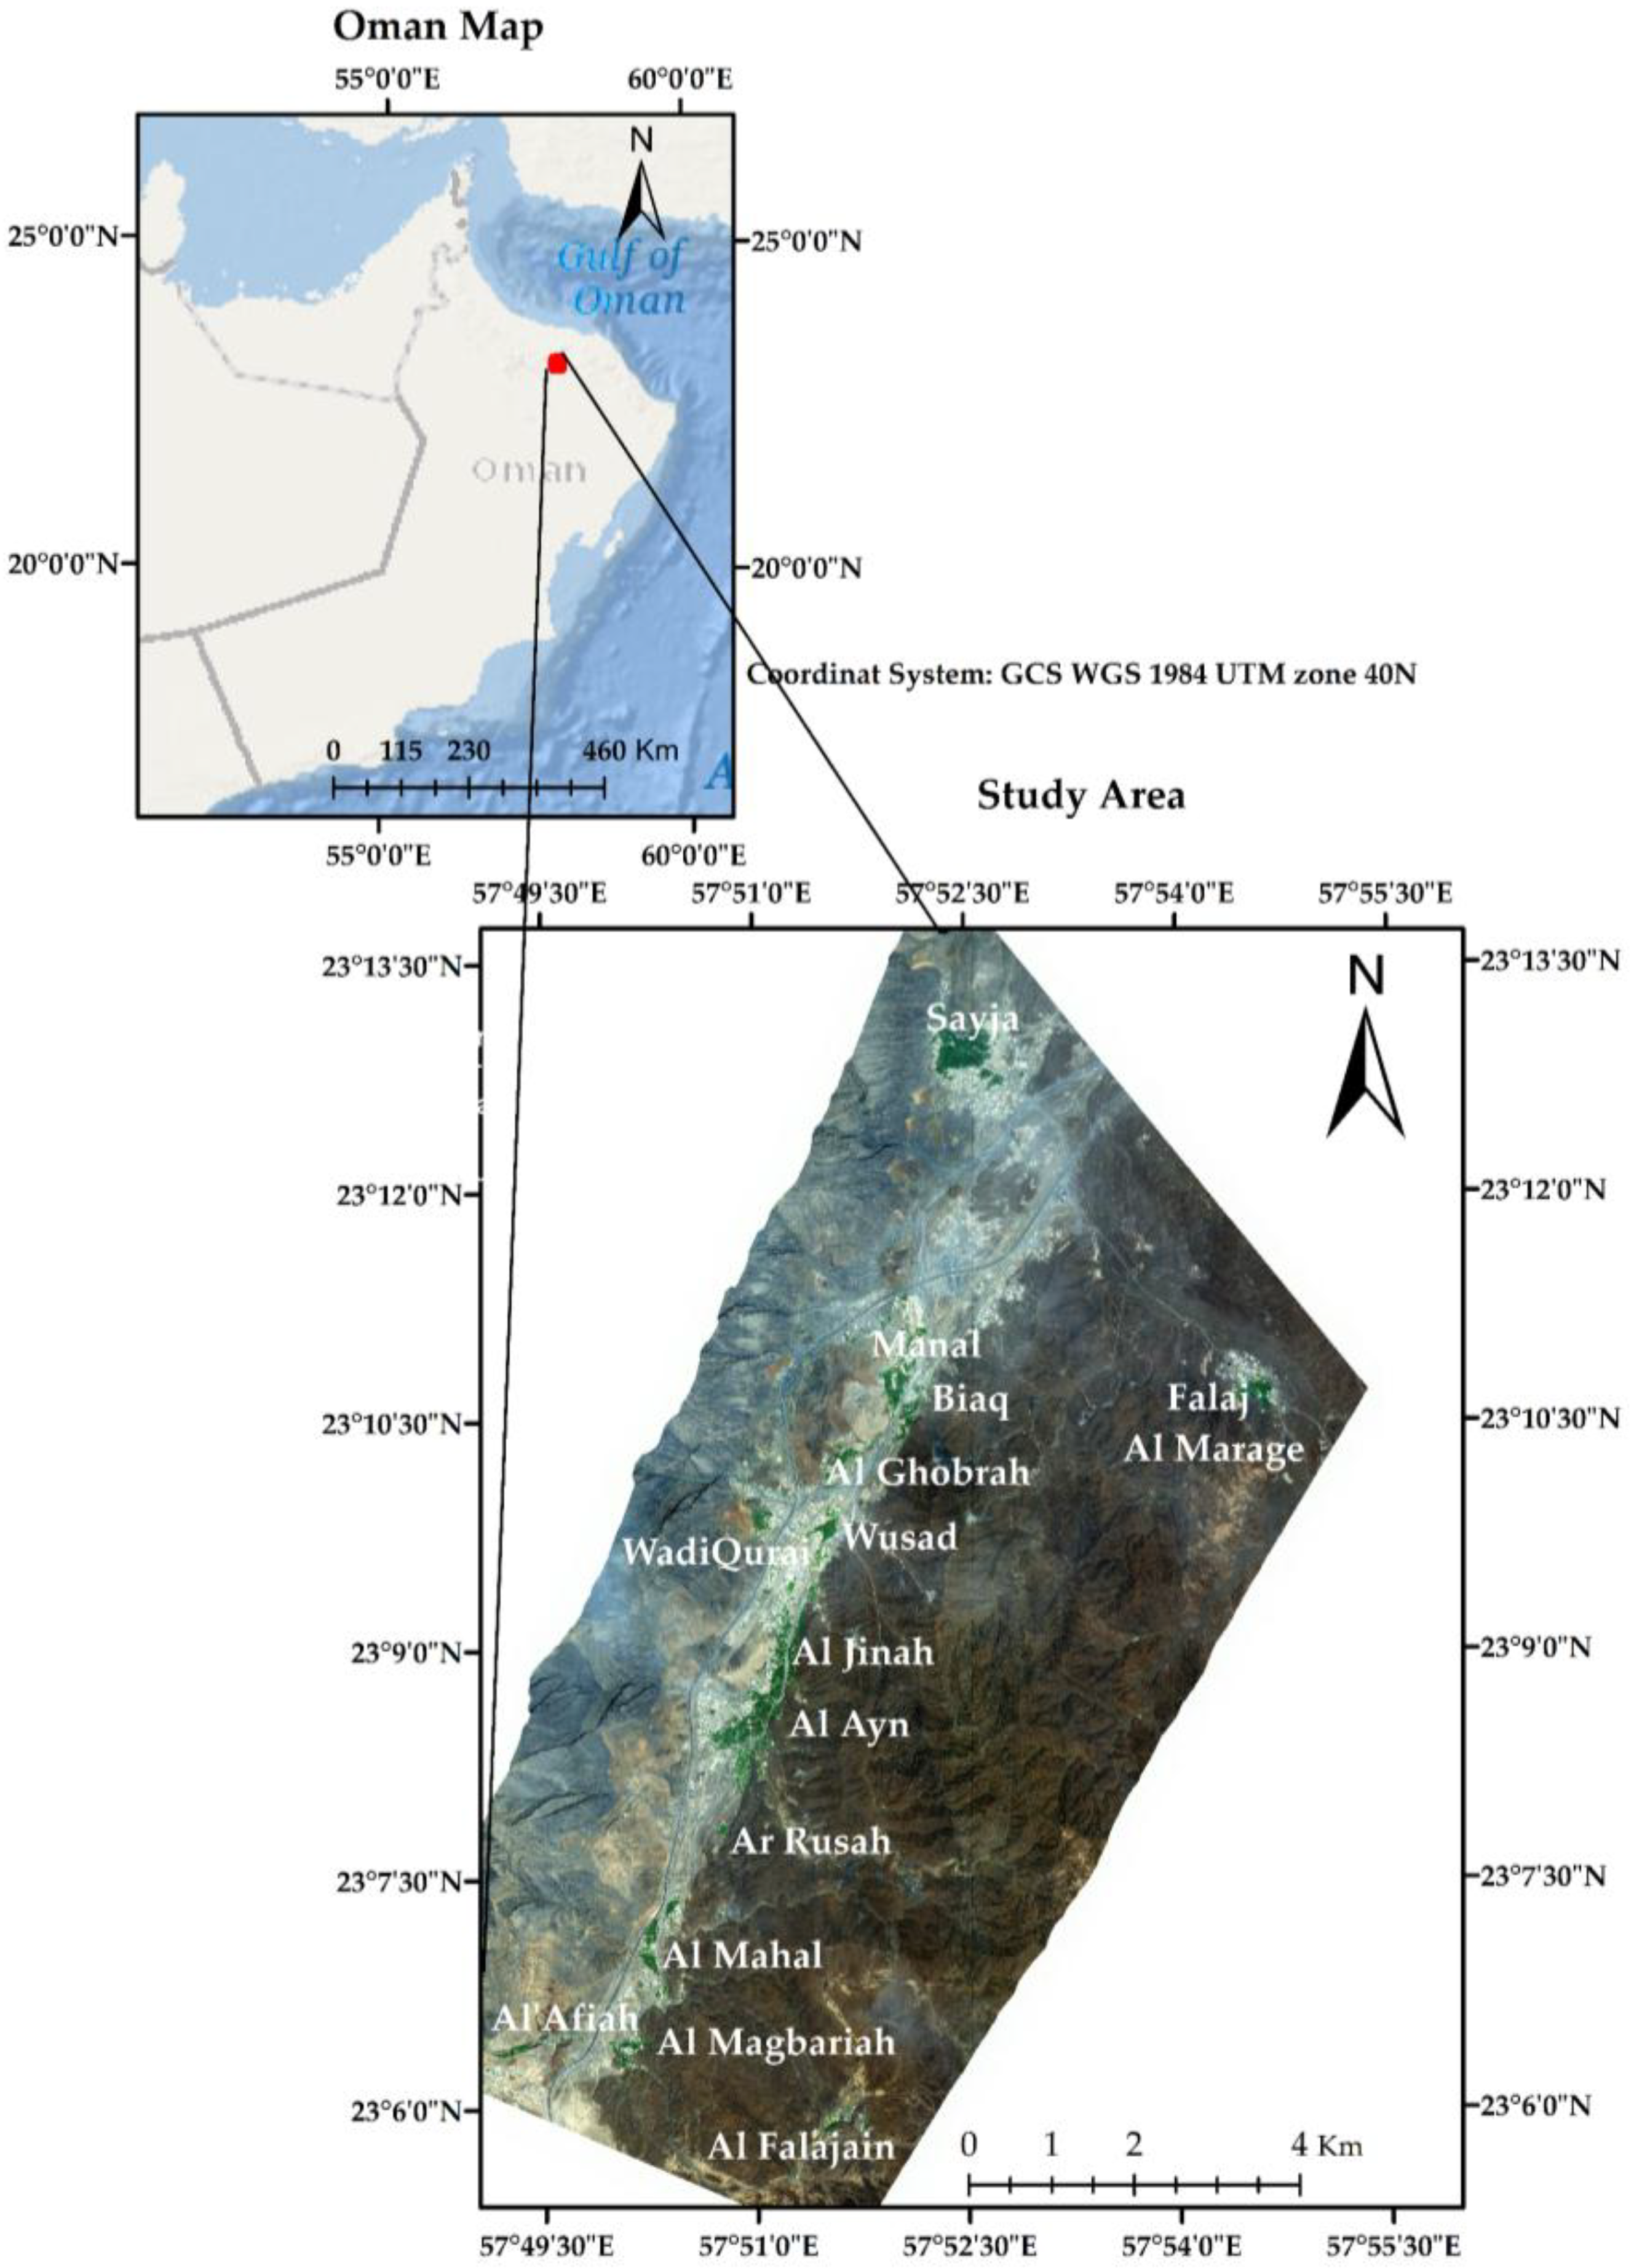
2.1. Study Area

The study area of this research was in the north of Oman, Ad’Dakhiliyah Governorate, in Wilayat Samail (23°14′–23°05′ N, 57°52′–57°51′ E) (Figure 1). The altitude increases from the northern Saygja Village (430 m) to the southern Al Falajain Village (675 m). In 2017, the annual minimum temperature ranged between 14 °C in January and 29 °C in June, with a maximum between 24 °C and 40 °C, respectively. The annual relative humidity ranged from 0% in January to 75% in August. The rainfall ranged from 3 mm in October to 15 mm in February. Daytime sunshine varied from 10 h and 42 min in December to 13 h and 34 min in June [32].
The total number of date palm trees in Samail was about 262,028 trees grown in 867.72 hectares [33]. Date palm trees are considered the primary crop in the study area, although other fruit trees like citrus, mango, banana and papaya trees were also present. Moreover, there were many other field crops, especially alfalfa, corn, sorghum, wheat, barley, elephant grass, pearl millet and vegetable crops such as legume, onion, tomato, and sweet potato during the winter period.

2.2. Field Data Collection

Date palm trees were counted in 3–6 randomly-selected plots from each village. We used stratified random sampling so that palms from the edge, as well as the center of fields, could be incorporated. The coordinate points of each plot corners were recorded. In addition, the O. lybicus infestation data of spring and autumn seasons of the year 2017 were collected by the Ministry of Agriculture and Fisheries (Oman). The infestation was evaluated in 20–60 trees in each village, and the longitude and latitude were recorded for each tree. Half of the trees were evaluated by manual insect counting of 40 leaflets from two fronds from each selected tree, and the other half were estimated by honeydew droplets method that was developed by AI-Mjeni and Mokhtar [4]. They reported a high correlation between the two methods. The infestation was reported as the average number of insects per leaflet and the average number of droplets per cm2.

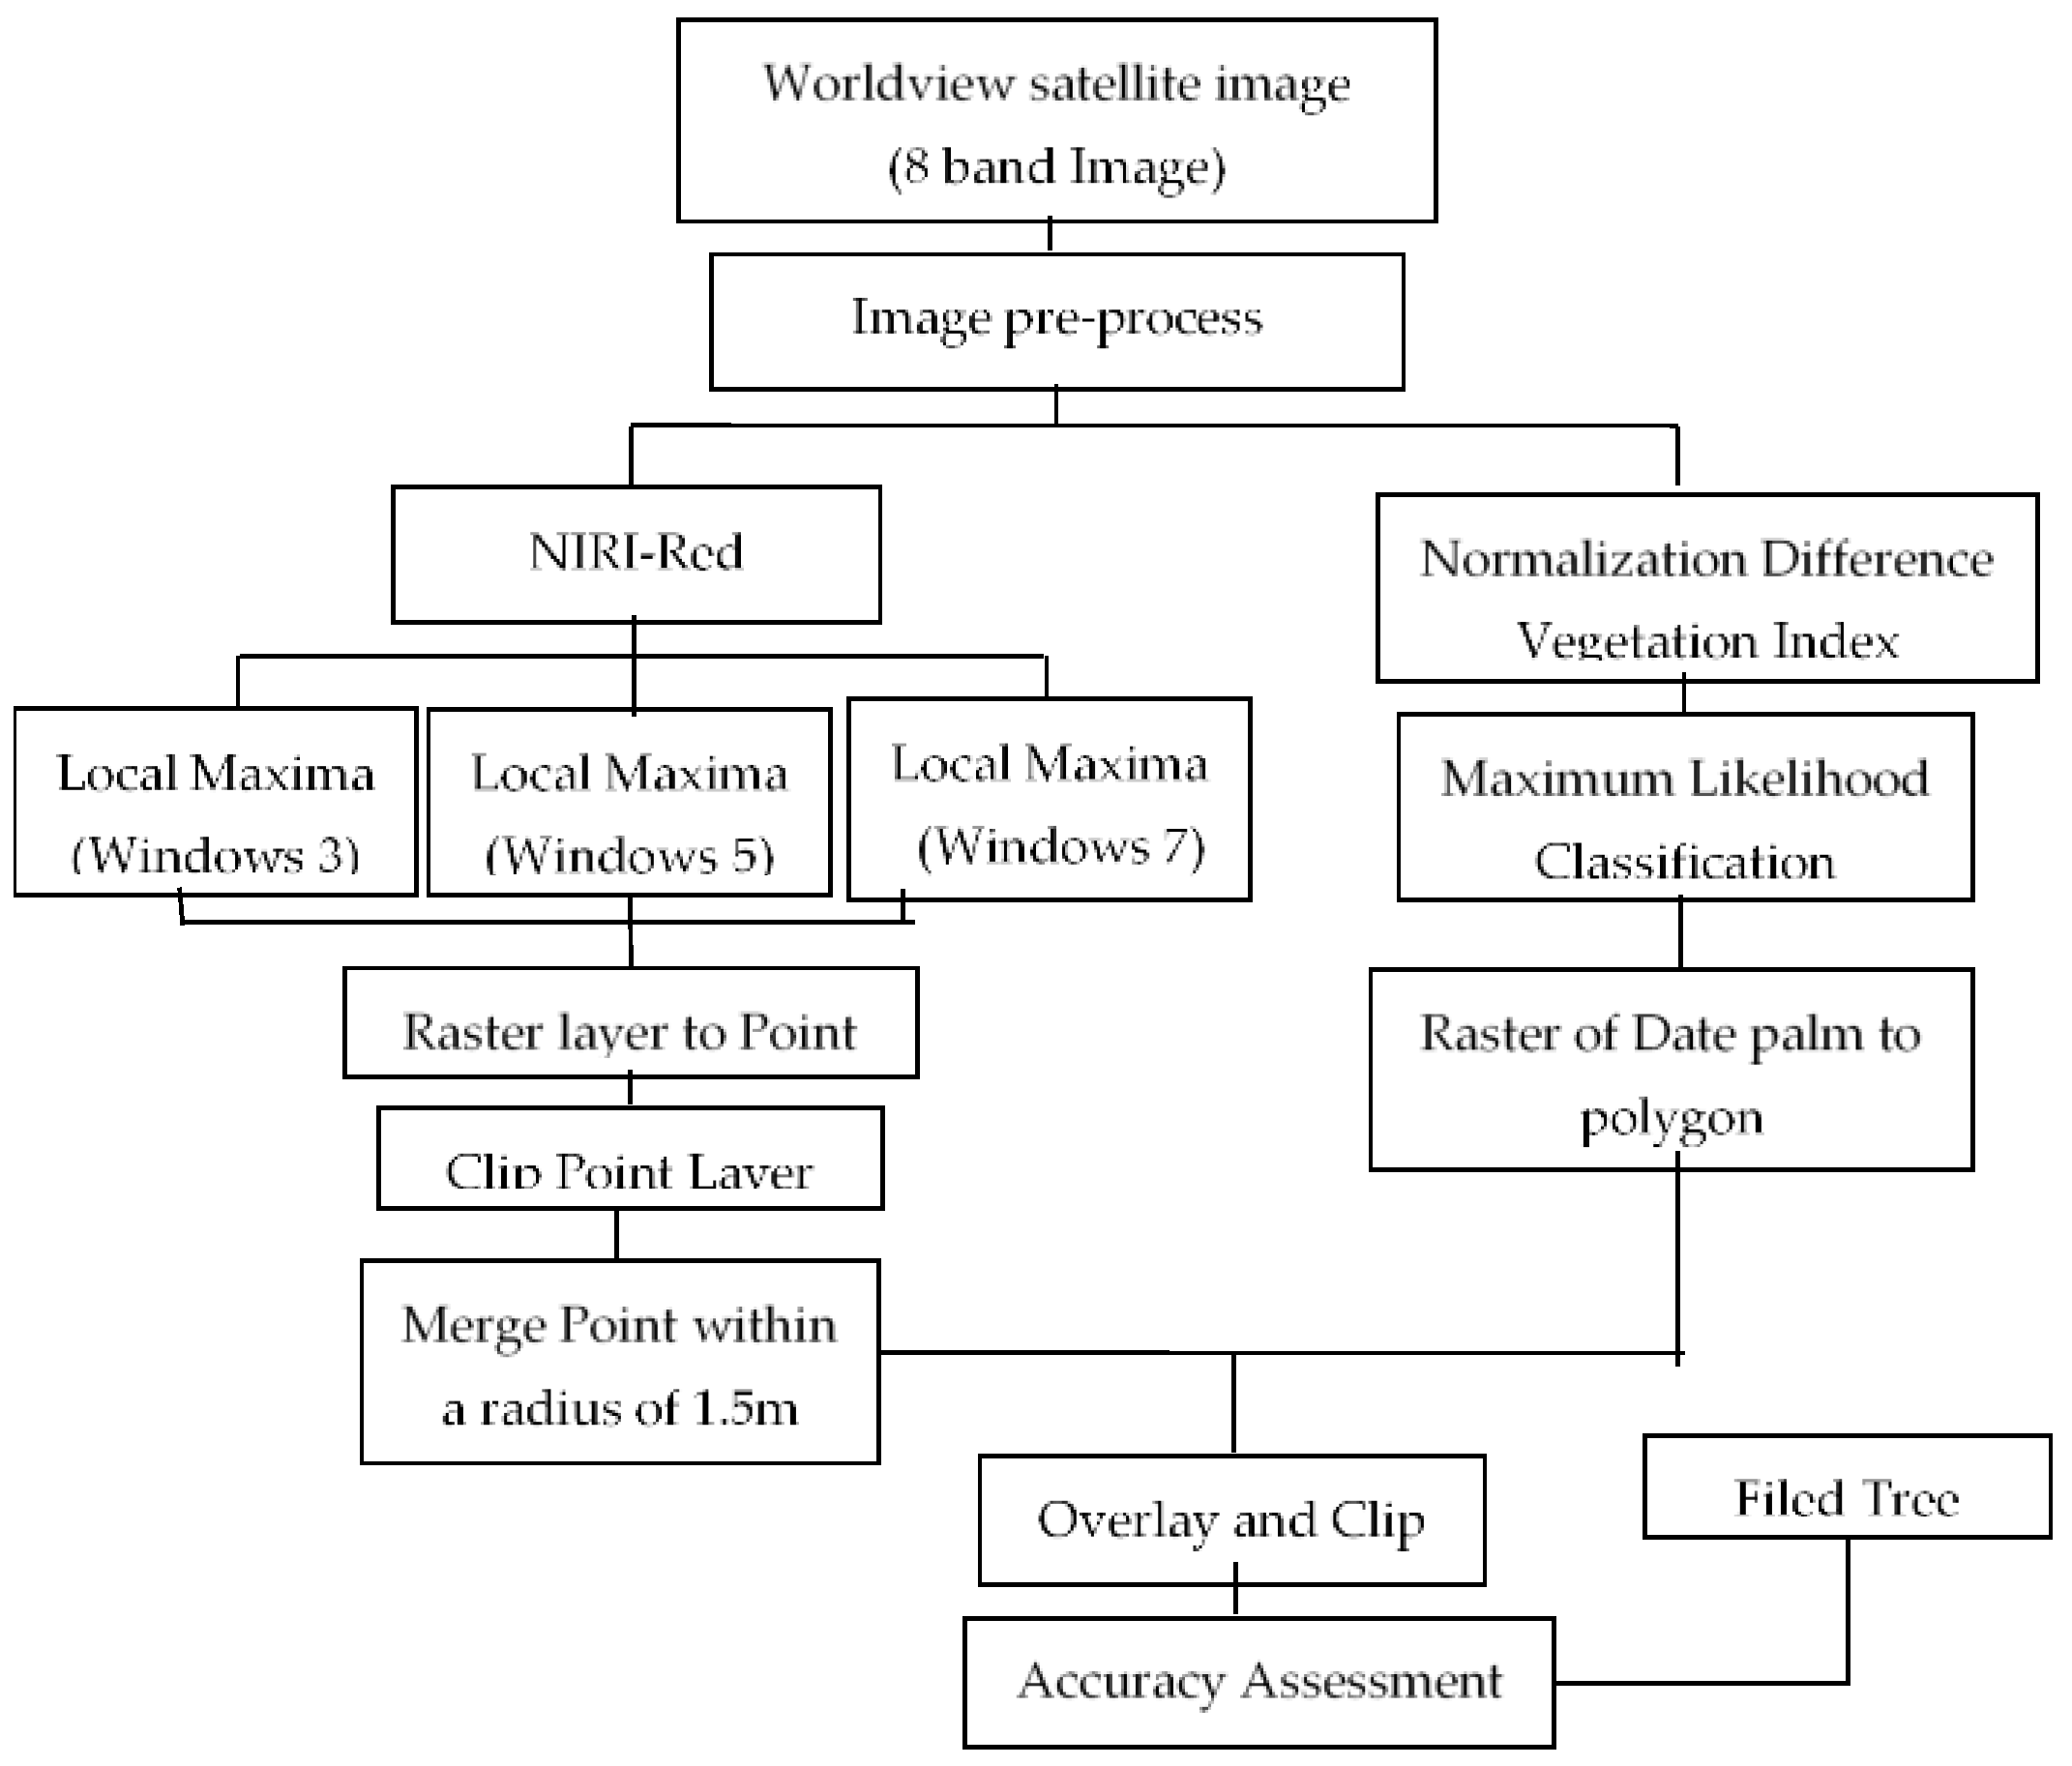
2.3. Image Data and Processing

Figure 2 illustrates the process and the methodology of image analysis to identify the local maxima, the count of the number of the trees and accuracy assessment.
High spatial resolution satellite image data was captured on 29 March 2017 covering about 100 km2. The images captured by the WorldView-3 sensor consisted of 9 bands: a panchromatic image with spatial resolution at 0.5 m, visible bands (coastal, blue, green, red, red edge), and near-infrared bands (NIR1 and NIR2) with spatial resolution at 2 m. The image was received from the Geoimage Pty Ltd. as Ortho-Ready Standard 2A product, geometrically corrected to UTM WGS 84 Zone 40 North, radiometrically corrected, and pan-sharpened. The top of atmospheric correction was applied to the image using FLAASH tool in ENVI. The correction processes were undertaken to guarantee high quality data from the satellite image [34]. The FLAASH tool in the ENVI removes the influence of the atmosphere such as water vapor and/or aerosols which interfere with light reflectance from the object to satellite/sensor. The FLAASH model permits the user to define all factors that affect atmospheric absorption and scattering by modeling the actual solar location, atmospheric, aerosol, and scattering models, visibility parameters and more to get actual true object reflectance wavelengths/data.
Local maxima methods depend on locating the pixel of highest brightness inside a certain exploration window to identify the trees in the image [11,28,35]. In the scouting window, the pixel with the highest reflectance compared to the other pixels in the same window is determined and recognized as a potential tree location. This method is appropriate for trees that have the highest reflectance at the top and in the middle, which are surrounded by lower reflectance intensities [35]. This is especially appropriate for date palm trees since new leaves have a dark green color and lose their greenness the further the leaf is from the center and as they age [36] (Figure 3a).
The vegetation had its maximum reflectance in the near inferred (NIR) band and its lowest reflection in the red band. Therefore, to get maximum reflection difference, the NIR band was subtracted from the red band to improve the local maximum (treetop) reflectance (Figure 3b) [11,18,37]. Later, the local maxima was calculated using the focal statistic tool with circle neighborhood searching windows to calculate the maximum value of the neighborhood cells (Figure 3c,d). Three window scales were tested to find the suitable windows; 3 m (6 × 6 pixels), 5 m (10 × 10 pixels) and 7 m (14 × 14 pixels). Deng et al. [38] used three window scales to study the number of trees in a Chinese forest from the WorldView-2 sensor, and Li et al. [18] tested 10 window sizes for local maxima filter to find the suitable windows to identify the palm from Quickbird images. The raster layer that resulted was transformed to a point layer (Figure 3e).
Normalized Difference Vegetation Index (NDVI) was calculated from the image to isolate non-vegetation from the image. Later, the Maximum Likelihood classification algorithm was used to separate other vegetation from the date palm trees. The raster layer was transformed to a vector layer and all polygons of non-date palm trees were removed. The remaining polygons were used to clip the point layer to remove the points not on date palm trees (Figure 4a). However, NDVI and the classification could not separate every instance of intercropping (Figure 4b). Therefore, the points which remained on intercrops were removed manually using an editing tool. Some trees had two or more points, identifying more than one local maxima within one tree radius (Figure 4d). They were merged when they occurred within a radius of 1.5 m. This was done using a buffer of 1.5 m around each point. Then the buffers that overlapped were merged and the centroid of each new polygon was calculated. This produced a new layer of points, and any points within a distance of 1.5 m were merged. Li et al. [18] faced the same issue when they tried to detect oil palm trees using a convolutional neural network (CNN) from QuickBird images, where points were merged when located within eight pixels of each other.

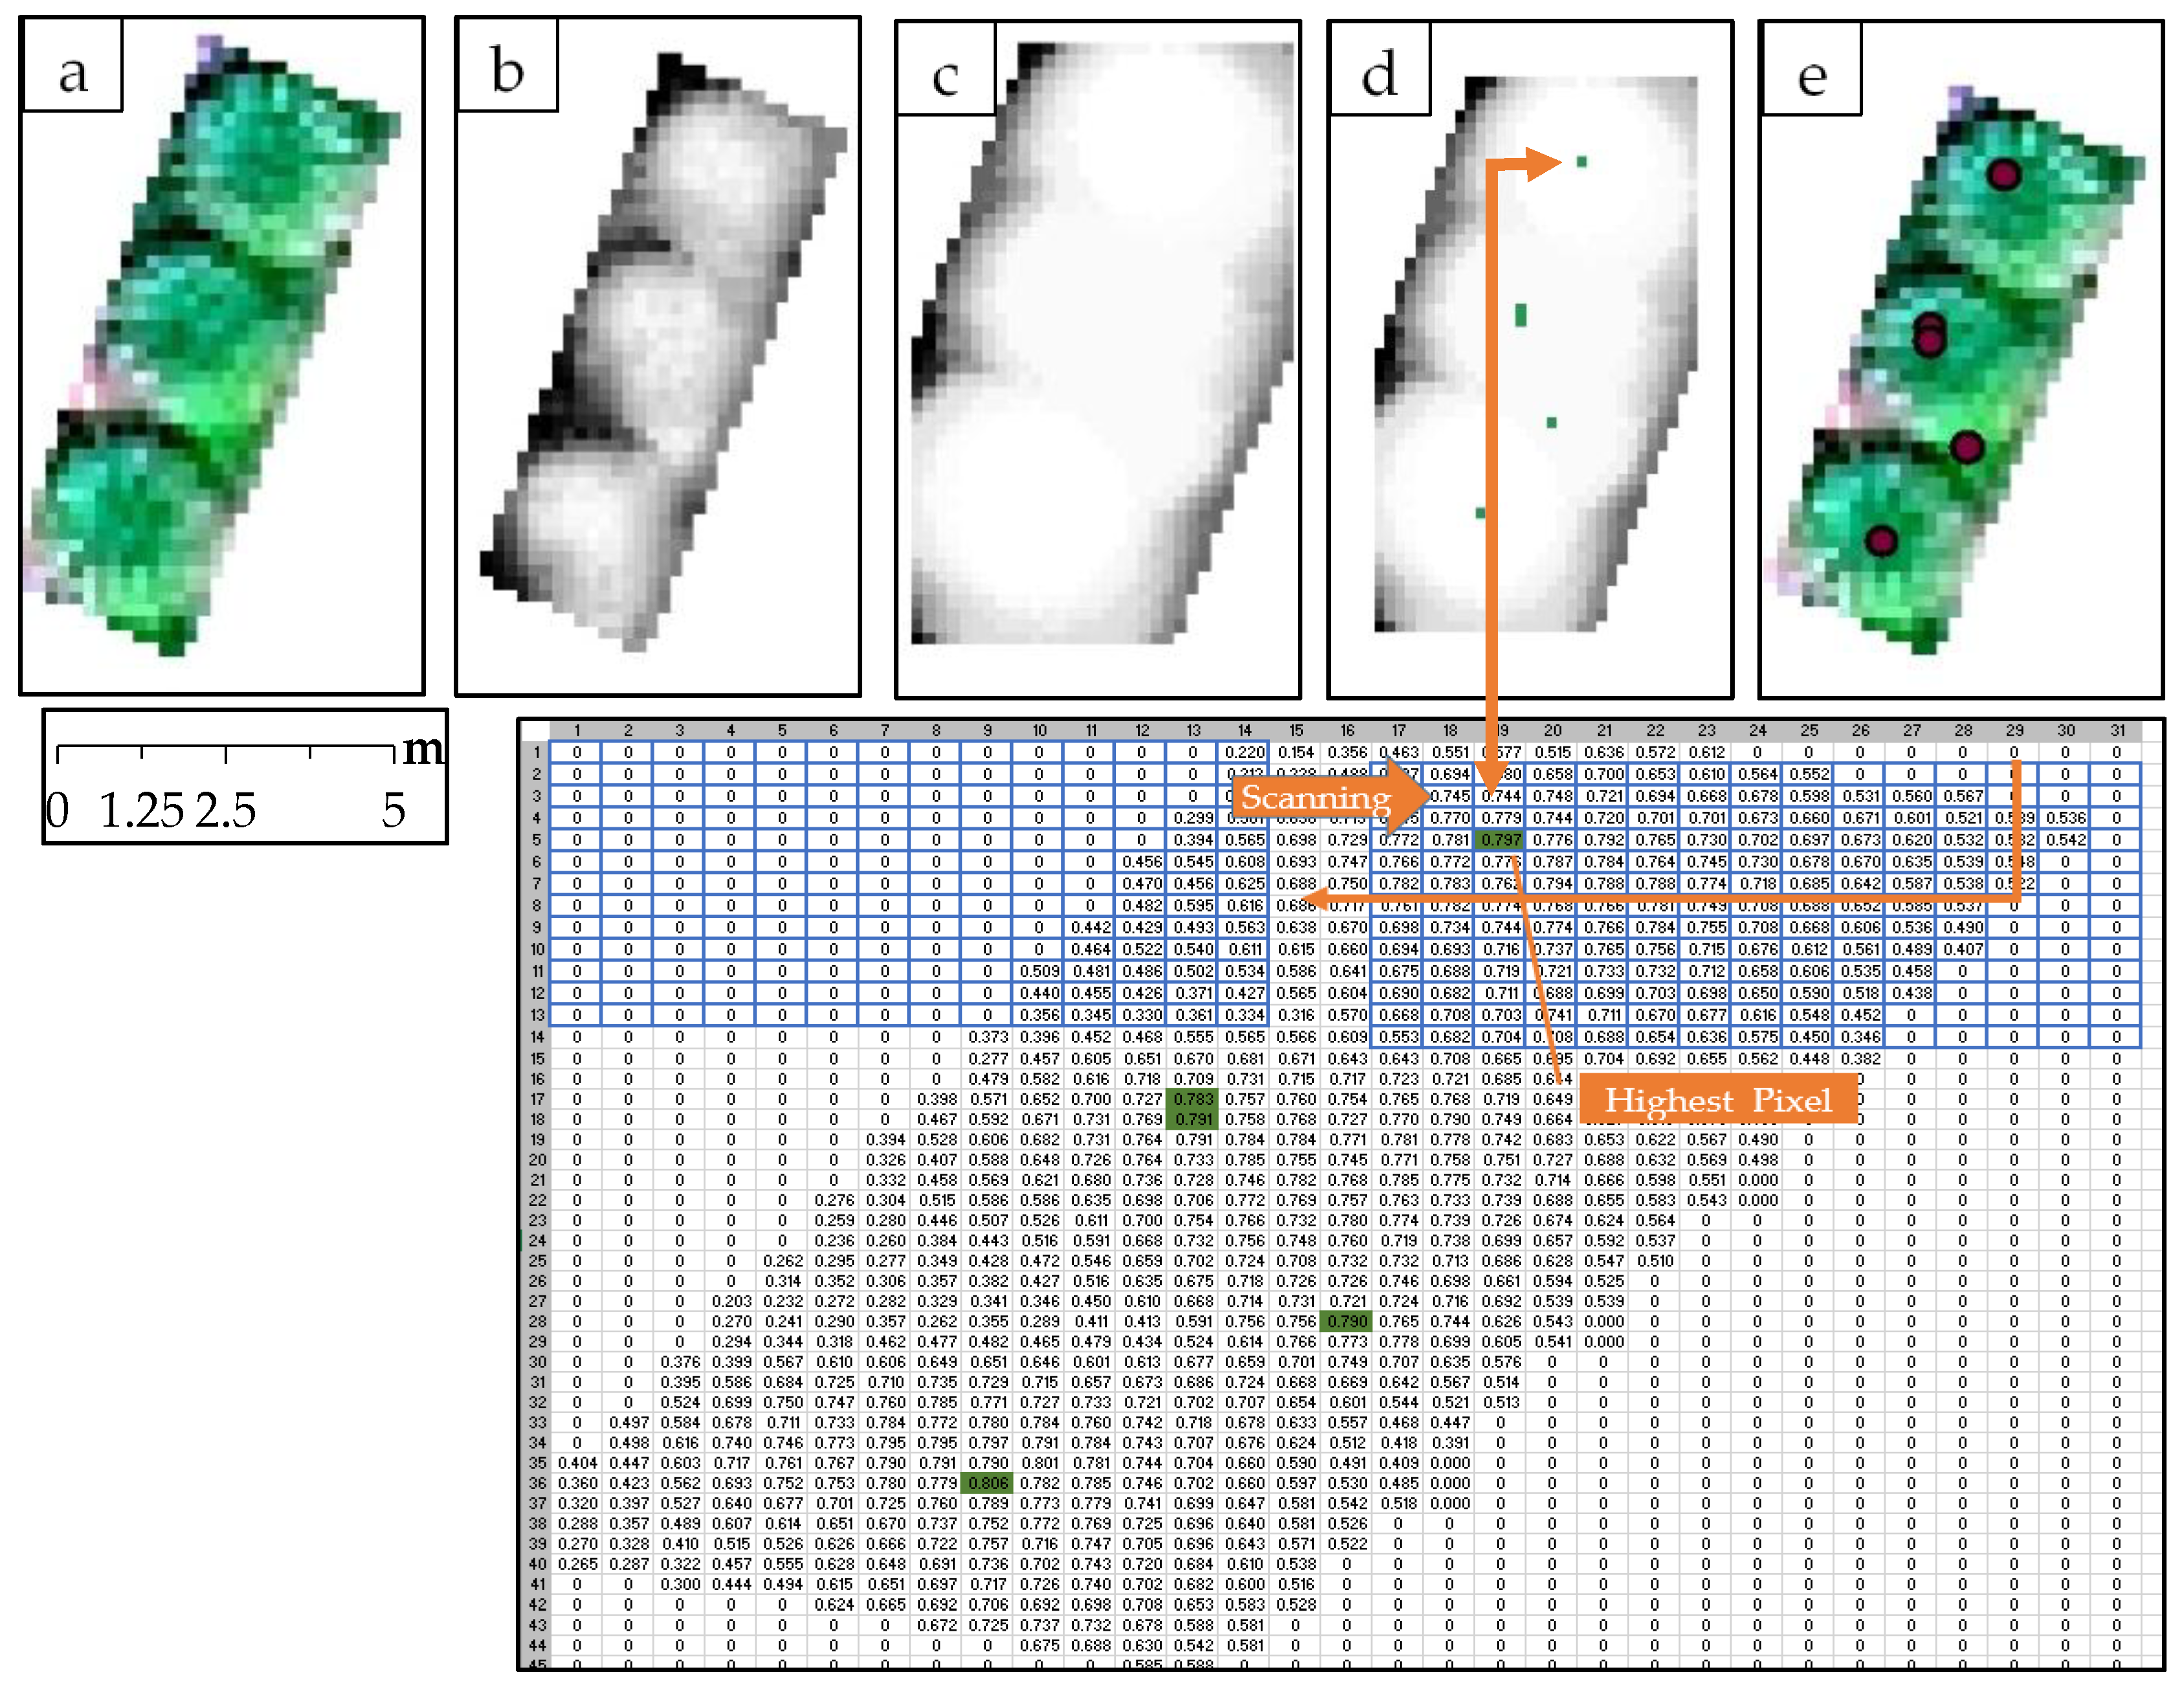
2.4. Tree Counting Assessment

The polygons, which represent the field data counting plots, were used to assess the number of trees that were analyzed by local maxima method. The number of trees in each polygon was counted and compared with field counting data. This was repeated for each tested window scale. The error of tree detection was assessed through the equation:
Error % = ((number of detected trees − field trees counting number)/field trees counting number) × 100
This equation was used by Katoh and Gougeon [12] to evaluate the accuracy of coniferous tree counting from high spatial resolution optical sensor.

2.5. Correlation between Infestation with Tree Density

The infestation data was prepared in an Excel spreadsheet, including the tree coordinate location and infestation levels of each tree, and saved as a comma delimited (CSV) file and imported into ArcMap as a point layer. Polygons of different buffer sizes (10, 15, 20, 25, 30 and 35 m radius) were drawn around each tree with field infestation data. The numbers of trees were counted in each buffer, and the numbers of the trees in the polygons were transferred to the number of trees to the hectare units. The average numbers of trees increased to a maximum at a 15-m buffer size, and then decreased (Figure 5). This can be attributed to the intercropping and topographical characteristics of the agricultural land. Thereafter, the tree counting of this buffer was used for the correlation tests.

2.6. Data Analysis

The ordinary least square (OLS) regression was used to test the global correlation and Geographic Weight Regression (GWR) was used to find the local spatial relationship. GWR is a powerful regression method that can be used to find the spatial relationship between the variables. It is useful for the study of the relationship for area with high heterogeneous non-stationary data compared to OLS test [39,40]. GWR gave better estimations and more precise results than other spatial exploration procedures with different sampling densities. In addition, GWR is more robust for local spatial correlations [41,42]. The infestation (dependent variable) was correlated with tree density (number of trees within a circle of 15 m radius, independent variable).

3. Results

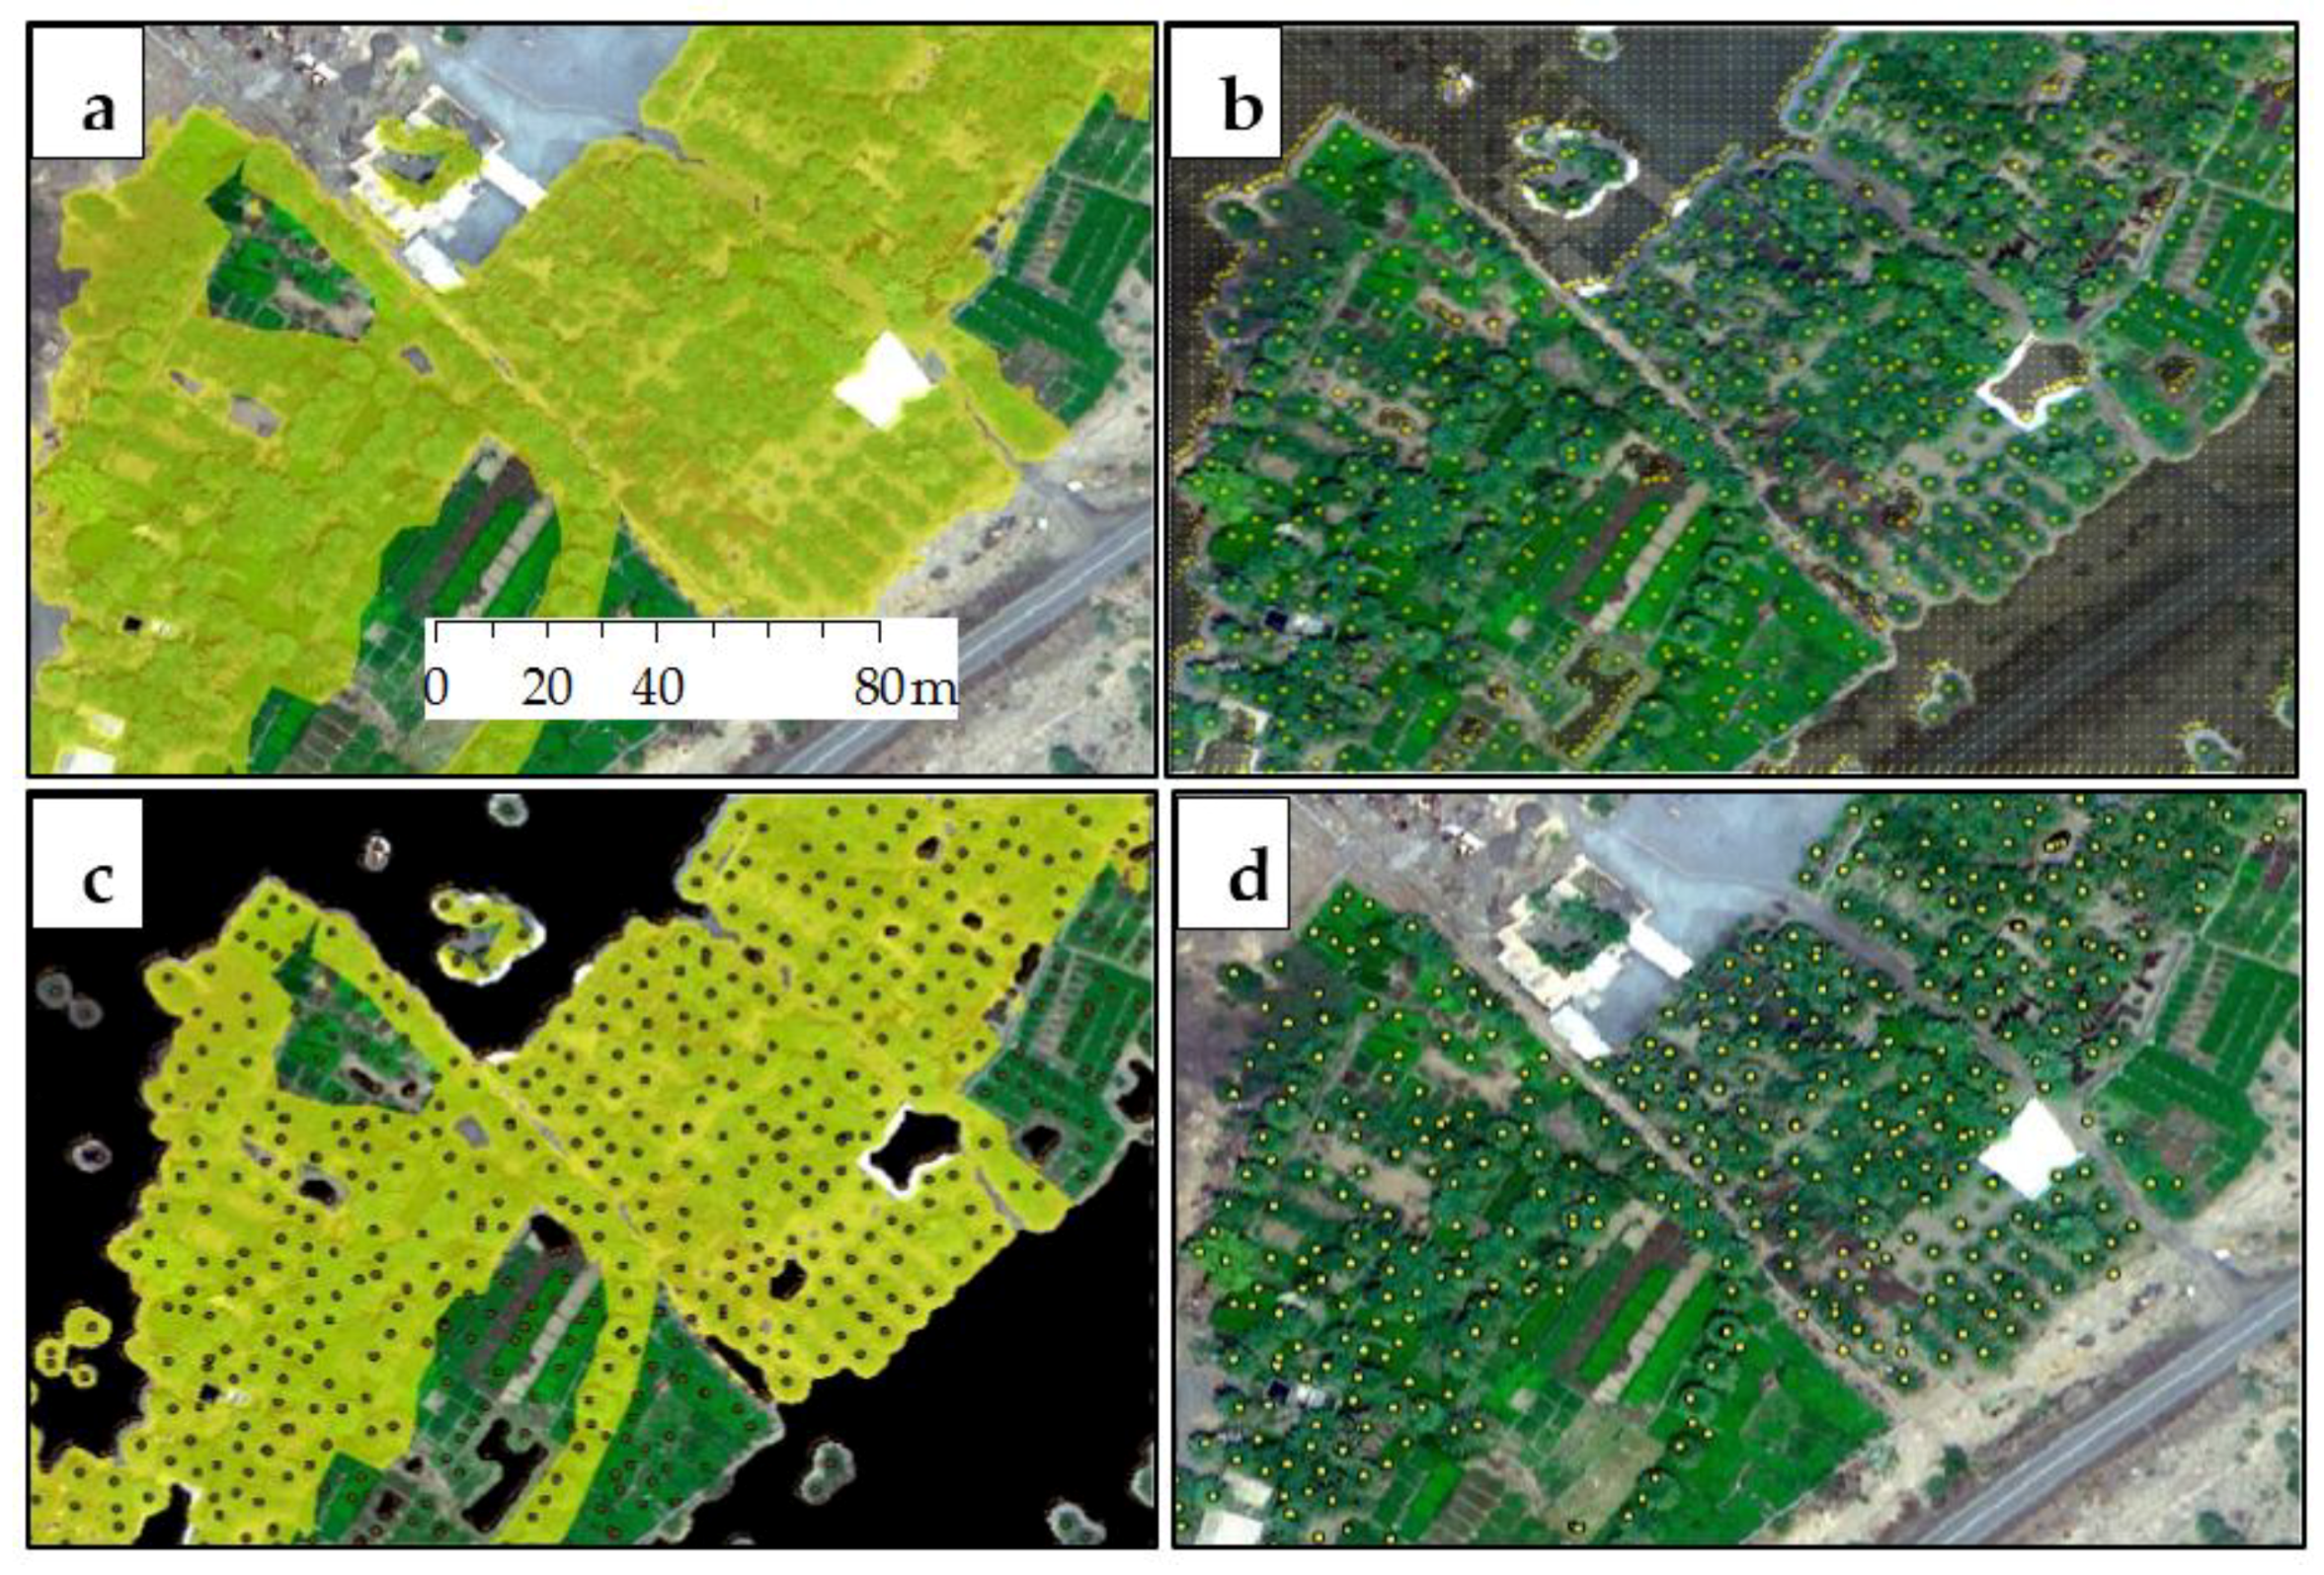
3.1. Counting Date Palm Trees by Local Maxima Accuracy

The tree counting results from different windows by local maxima is presented in Table 1. There was an overestimation of the tree numbers in both windows of 3 and 5 m radius. The overall estimation error was 79.6 and 28.5%, respectively. The 7 m radius window was the most suitable window with an overall estimation error of 11.8%. These estimation errors varied by plantation, with the lowest estimation error in Al Ghobrah (0.6%) followed by Biaq (−2.9%), and the highest in Manal (28.5%) (Table 1).

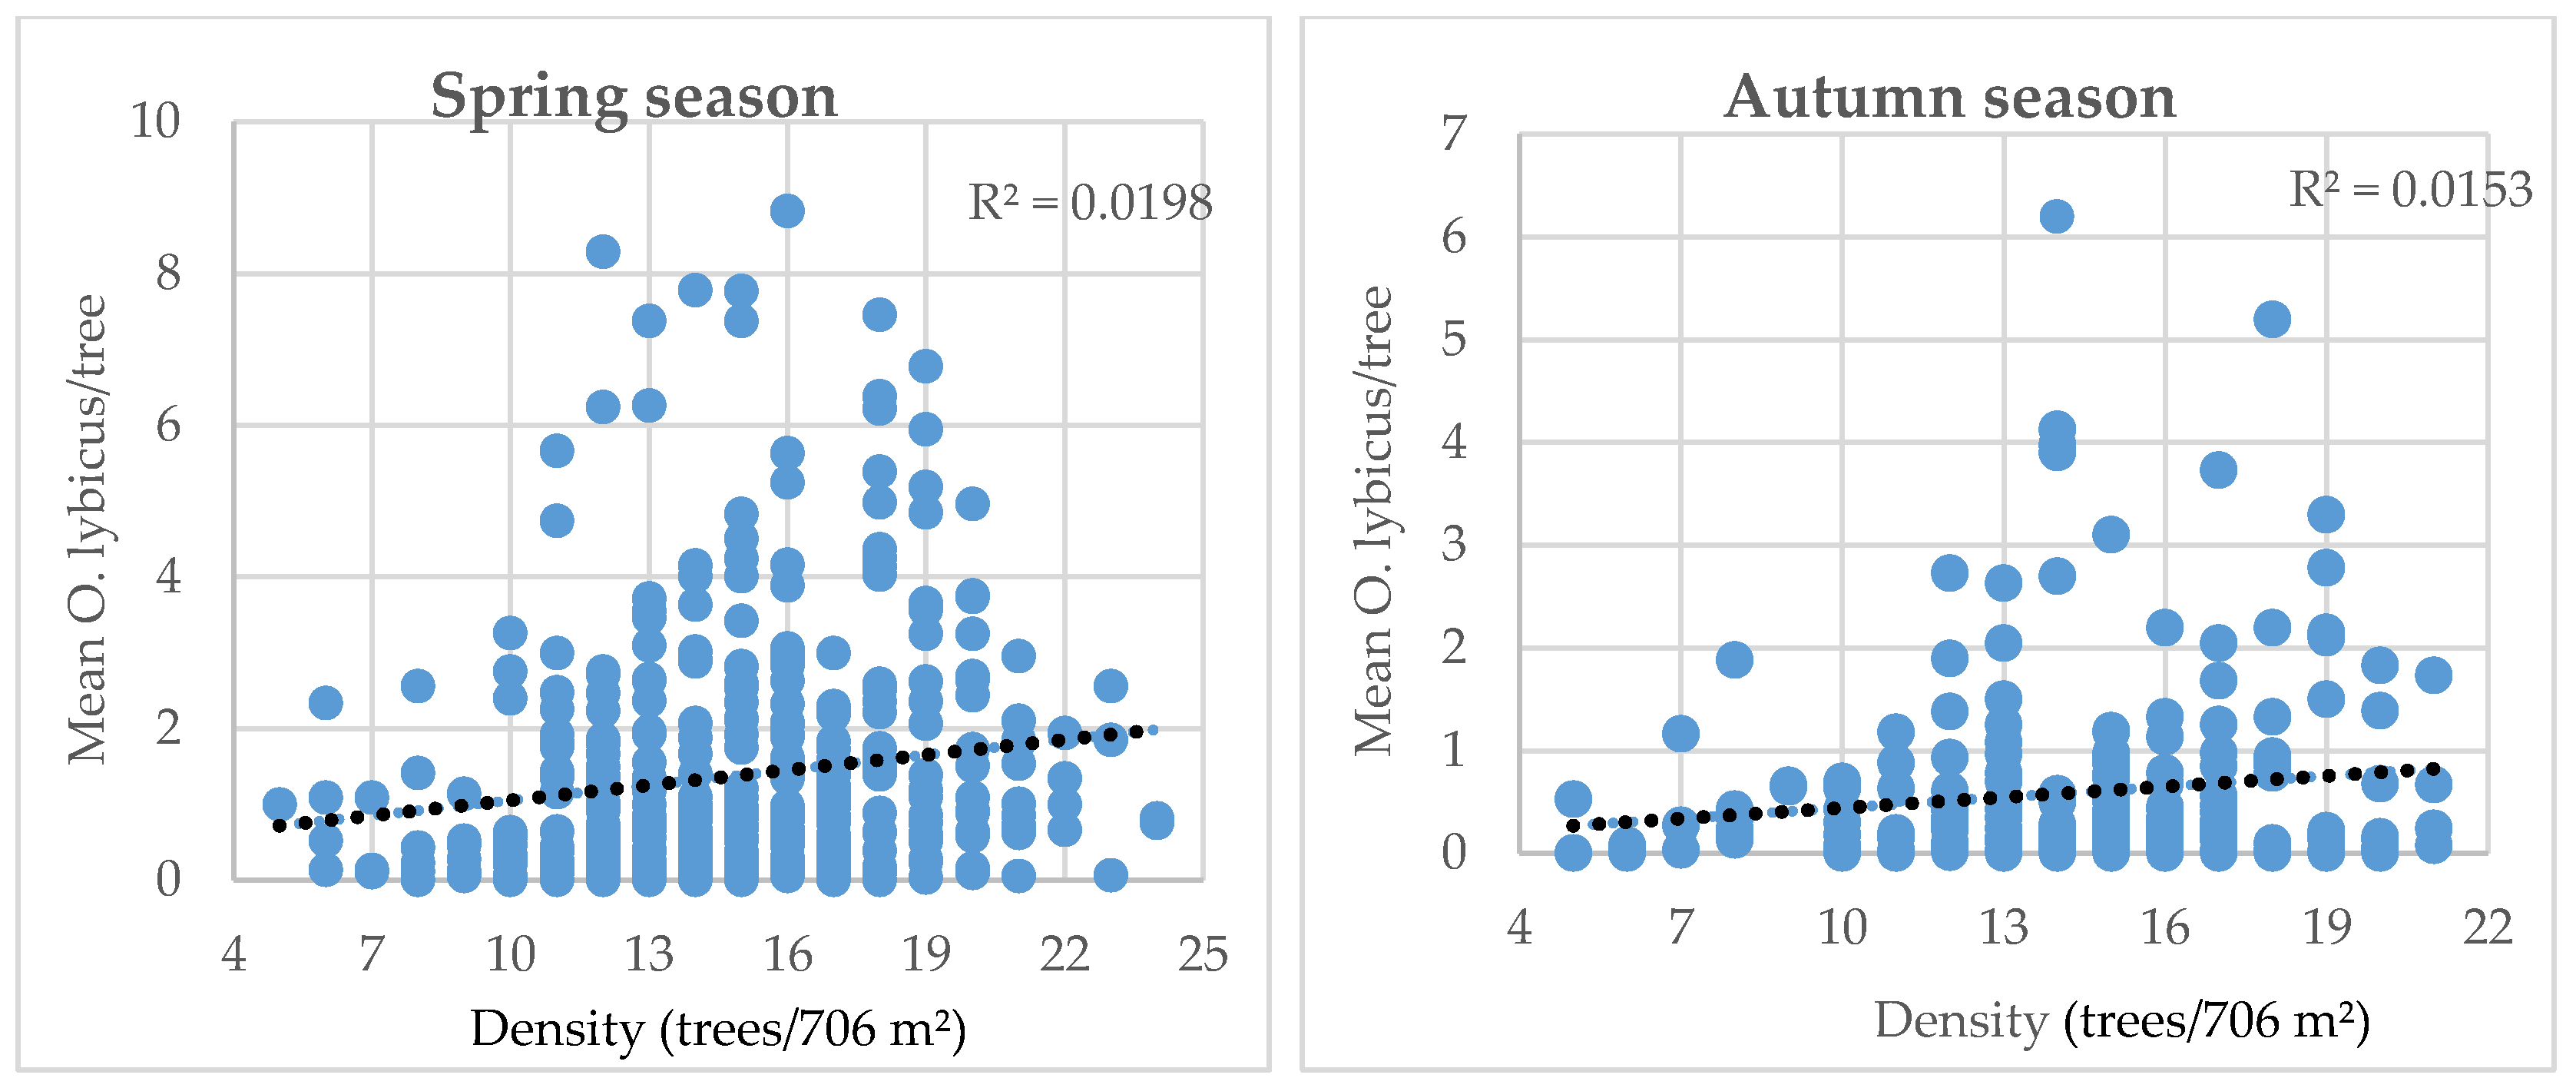
3.2. Result of OLS Regression

The global OLS regression of the relationship between infestation per tree and the density of trees (in 15 m radius around each tree with infestation reading data) showed a weak significant relationship for the spring season (R2 = 0.02, p < 0.05) and insignificant relationship for autumn season (R2 = 0.01, p > 0.05) (Table 2 and Figure 6). The Jarque-Bera Statistic showed a significant result (p < 0.01) for both seasons, indicating the model was biased from the normal distribution.

3.3. Result of GWR Regression

The GWR results for tree infestation and tree density in a 15-m radius were R2 = 0.59 and R2 = 0.30 for the spring and autumn seasons, respectively (Table 3). The AIC value was lower in the GWR model (1362 and 590 respectively for both seasons) than the OLS test (1676.4 and 638.6 respectively for both seasons); indicating that GWR model was much better than OLS model in predicting the relation between the infestation and density. The number of neighbors that were used by the model to estimate the local correlation was 41 points in spring and 60 points in autumn. The variance of the fitting of the coefficient for spring season was higher than autumn season which indicates that GWR for spring season was closer to global OLS regression than autumn season. The Sigma parameter is the estimation of standard deviation for the residuals and to calculate the AIC that is used to measure the model performance. Autumn season GWR model showed a better performance than spring season where it had lower sigma and AIC values (Table 3).

4. Discussion

4.1. Detection Accuracy

Our results suggested the 7-m radius window was the most suitable window to detect the date palm trees with an overall accuracy 88.2%. The highest accuracy was found in Al Gubrah Village (99.4%) where most of the trees were planted in a regular pattern. The next highest accuracy was in Biaq Village (97.1%). Both villages had the lowest average tree numbers (127 trees/hectare). In contrast, the lowest accuracy was found in Manal (71.5%), where trees were planted in a non-regular pattern. The lowest detection accuracy was in Sayja, Al Magbariah and Wadi Qurai villages (Table 1), where those villages had the highest tree density among all other villages in the study area (Table 4).
The accuracy of detecting trees varied from 83 to 99% in agriculture lands with systematic planting patterns to 50–70% in natural forest areas. The accuracy of tree detection in the forest could increase with an increase in spatial resolution [43] or when the spatial patterns are consistent [11]. For instance, Malek et al. [15] reported a higher accuracy (ranging from 89.4 and 96.4%) of detecting date palm trees in systematic planting orchard in Saudi Arabia, from an image of 3.5 cm spatial resolution captured by unmanned aerial vehicles (UAVs). Moreover, the detection algorithms used may have provided varied results as well. For instance, Li et al. [18] reported that the overall accuracy of detection of oil palm trees ranged between 84.2 and 95.3% using the local maxima filter, however, these improved with an artificial neural network (ANN) and convolutional neural network (CNN) approach to 94.0–98.2% and 96.1–98.8%, respectively. Korom et al. [17] found a lower detection accuracy of oil palm trees of 77% post-watershed segmentation and masking non-oil palm trees using WorldView-2 satellite image. In addition, Santoso et al. [13] used different pan-sharpening methods on QuickBird image to detect oil palm trees. They found that the accuracy of detection was 100% with the modified intensity-hue-saturation (IHS) pan-sharpening, 99.5% with normalized color (Brovey) pan-sharpening, 99.8% subtractive resolution merge pan-sharpening and 99.3% principal components (PC) spectral sharpening. Different window sizes of local maxima produced more accurate results than fixed window sizes in detecting forest trees in KwaZulu-Natal, South Africa (85 and 80% respectively) [29].

4.2. Date Palm Density and O. lybicus Infestation

The density of the trees in most of the villages was higher than the recommended planting number (120–125 trees/hectare) [44], except in Al Ghubra and Biaq (127 trees/hectare). The highest rate (196 trees/hectare) was found in Wadi Qurai Village, followed by Sayja (188 trees/hectare) and Ar Rusah (183 trees/hectare) (Table 4).
The infestation data showed higher infestation levels in the spring season than in the autumn season. In spring, the highest infestation average was recorded in Sayja, followed by Al Falajain (4.19 and 2.08 insects/tree, respectively), and in fall, in Ar Rusah, followed by Al Falajain and Wadi Qurai (2.58, 2.36 and 1.9 insects/tree, respectively). The tree density of those villages was equal or greater than 170 trees/hectare, almost 50 trees more than the recommended planting rate per hectare (Table 4).
The results of GWR regression showed significant positive results with a medium coefficient of determination (R2 = 0.60) for the spring season and weak correlation coefficient for the autumn season. The AIC values were lower in the GWR model than the OLS model for both seasons, suggesting GWR performed better than OLS. In contrast, the OLS regression showed significant positive results with a low correlation coefficient for the spring season (R2 = 0.02, p = 0.004). However, the results of this test showed a significant value for the Jarque-Bera test (p = 0.000), which indicated that the model residual was biased at a normal distribution. The highest infestation was recorded in the second highest density plantation.
The results showed a positive correlation between infestation and tree density, which suggests the infestation severity increased as the density of date palm trees is increased. The correlation result showed that the density alone was responsible for about 60% of the increase in the infestation. Al-Kindi et al. [8] reported a positive correlation coefficient between the density and row spacing and the infestation O. lybicus in an autocorrelation model, and included a few other cultural practices. The date palm planting distances less than 5 m is more susceptible to severe insect infestations and diseases, such as spider mites, termites, horn beetles, long antennal beetles, scales, Khamedje and leaf spot pests, with the highest correlation coefficient R2 = 0.79 with Khamedje diseases and lowest R2 = 0.3 with long antennal beetle insects [45].
A positive relationship between insect infestation and crop density was reported by Carnot et al. [46], with black nightshades Solanum nigrum Linnaeus experiencing infestations of aphids Aphis fabae Scopoli, black ants Carebara vidua Smith and whiteflies Bemisia tabaci Gennadius. In contrast, Chaudhary and Kashyap [47] reported a negative correlation between the infestation of jassid Amrasca biquttula biquttula Ishida and the density of eggplant Solanum melongena Linnaeus, and a positive relationship between the same crop and the shoot and fruit borer Leucinodes orbonalis Guenee. Ihejirika et al. [48] reported a significant relationship between groundnut Arachis hypogene Linnaeus density and insect attack severity. A significant relation was reported between honeylocust Gleditsia triacanthos Linnaeus tree density and spider mites Platytetranychus multidigituli Ewing infestation with R2 = 0.22 with a 100-m radius [49]. However, they found a negative relationship between mimosa webworms Homaduala anisocentra Meyrick and honeylocust tree density with a 10-m radius.
In another study a negative relationship was reported by Mohamed [50] between the cucumber spacing and the whitefly B. tabaci. However, this study reported that one of the varieties had a positive relationship in late season planting. In a study on the effect of different cultural and control practices on the infestation of different insect pests on cabbage, a higher density had lower infestation [51]. Fall armyworms Spodoptera frugiperda Smith, and the lesser cornstalk borer Elasmopalpus lignosellus Zeller showed no correlation with the density of sweet sorghum Sorghum bicolor Moench [52].
Our study showed different infestation patterns among the two seasons despite consistent densities. This indicates other factors interfere with O. lybicus infestation in the date palm orchards and require further investigation in the future. For instance, Haynes et al. [53] reported that the GWR provided better AIC value (∆AIC = 158.45) of the infestation gypsy moths Lymantria dispar Linnaeus, in relation to elevation and host density together than for each one individually (elevation ∆AIC = 559.36 or host density ∆AIC = 917.48). The lower infestation levels during the autumn season could be the reason for the insignificant correlation between tree density since another factor may have interfered with infestation levels.
The current study would help the policy makers to target the management resources to areas where there is high density of date palm crops. Initial surveys need to be done to locate the high-density date palm orchards. This can be done through remote sensing technology, as in the current study. In addition, solid results can be obtained for the extension department to advice the farmers about the importance of cultural practices in pest management in general and specifically for O. lybicus.

5. Conclusions

The local maxima approach was appropriate for date palm identification and counting. The overall estimation accuracy was 88.2%. However, the error increased with very dense and unsystematic planting patterns. The current study indicates that density is one factor that contributes to severity of the O. lybicus infestation. The correlation coefficient for GWR model was R2 = 0.60 and R2 = 0.30 for spring and autumn seasons respectively. The global correlation test using OLS model gave positive significant results with a weak R2 of 0.02 for spring season and insignificant results for autumn season. Further investigation is required to study the factors, which may influence the infestation severity, in combination with tree density.

Author Contributions

R.H.A.S. and L.K. devised the experiment; R.H.A.S. performed the experiment and analysis under the guidance of L.K.; S.A.H.A.-K., M.M.A. and M.S.A. helped with fieldwork and data collection.

Acknowledgments

Thanks to The Research Council, Oman, for funding this research work and Directorate General of Agriculture and Livestock Research, Ministry of Agriculture and Fisheries, Oman, for facilitating the field work. Many thanks for all staff and technicians of Plant Protection Research Centre, Directorate General of Agriculture and Livestock Research, who helped in field data collection.

Conflicts of Interest

The authors declare no conflict of interest

References

  1. Al-Yahyai, R.; Khan, M.M. Date palm status and perspective in Oman. In Date Palm Genetic Resources and Utilization; Springer: Dordrecht, The Netherlands, 2015; pp. 207–240. [Google Scholar]
  2. Ishag, K.H.M. Dates Palm Farming Systems Sustainability and Risk Efficiency in Oman. Sustain. Agric. Res. 2016, 6, 39. [Google Scholar] [CrossRef]
  3. Al-Khatri, S.A.H. Biological, Ecological and Phylogenic Studies of Pseudoligosita Babylonica Viggiani, a Native Egg Parasitoid of Dubas Bug Ommatissus lybicus de Bergevin, the Major Pest of Date Palm in the Sultanate of Oman. Ph.D. Thesis, University of Reading, Reading, UK, 2011. [Google Scholar]
  4. AI-Mjeni, A.; Mokhtar, A. A Novel Approach to Determine the Efficacy of Control Measures Against Dubas Bug, Ommatissus lybicus de Berg, on Date Palms. J. Agric. Mar. Sci. 1999, 4, 1–4. [Google Scholar] [CrossRef]
  5. Kinaway, M.; Al-Siyabi, A. Major arthropod pests of date palm in Arab countries. In First Regional Conference about Management of Date Palm Pests; Al-Ain, UAE, 2012; pp. 23–25. [Google Scholar]
  6. Ferguson, A.W.; Klukowski, Z.; Walczak, B.; Clark, S.J.; Mugglestone, M.A.; Perry, J.N.; Williams, I.H. Spatial distribution of pest insects in oilseed rape: Implications for integrated pest management. Agric. Ecosyst. Environ. 2003, 95, 509–521. [Google Scholar] [CrossRef]
  7. Talhouk, A. On the management of the date palm and its arthropod enemies in the Arabian Peninsula. J. Appl. Entomol. 1991, 111, 514–520. [Google Scholar] [CrossRef]
  8. Al-Kindi, K.M.; Kwan, P.; Andrew, N.R.; Welch, M. Impacts of human-related practices on Ommatissus lybicus infestations of date palm in Oman. PLoS ONE 2017, 12, e0171103. [Google Scholar] [CrossRef] [PubMed]
  9. Fadaei, H.; Sakai, T.; Yoshimura, T.; Kazuyuki, M. Estimation of Tree Density with High-Resolution Imagery in the Zarbin Forest of North Iran (Cupressus Sempervirence Var. Horzontalis). Int. Arch. Photogramm. Remote Sens. Spat. Inf. Sci. 2010, 38, 679–684. [Google Scholar]
  10. Karlson, M.; Reese, H.; Ostwald, M. Tree crown mapping in managed woodlands (parklands) of semi-arid West Africa using WorldView-2 imagery and geographic object based image analysis. Sensors 2014, 14, 22643–22669. [Google Scholar] [CrossRef] [PubMed]
  11. Pouliot, D.; King, D.; Bell, F.; Pitt, D. Automated tree crown detection and delineation in high-resolution digital camera imagery of coniferous forest regeneration. Remote Sens. Environ. 2002, 82, 322–334. [Google Scholar] [CrossRef]
  12. Katoh, M.; Gougeon, F.A. Improving the precision of tree counting by combining tree detection with crown delineation and classification on homogeneity guided smoothed high resolution (50 cm) multispectral airborne digital data. Remote Sens. 2012, 4, 1411–1424. [Google Scholar] [CrossRef]
  13. Santoso, H.; Tani, H.; Wang, X. A simple method for detection and counting of oil palm trees using high-resolution multispectral satellite imagery. Int. J. Remote Sens. 2016, 37, 5122–5134. [Google Scholar] [CrossRef]
  14. Larsen, M.; Eriksson, M.; Descombes, X.; Perrin, G.; Brandtberg, T.; Gougeon, F.A. Comparison of six individual tree crown detection algorithms evaluated under varying forest conditions. Int. J. Remote Sens. 2011, 32, 5827–5852. [Google Scholar] [CrossRef]
  15. Malek, S.; Bazi, Y.; Alajlan, N.; AlHichri, H.; Melgani, F. Efficient framework for palm tree detection in UAV images. IEEE J. Sel. Top. Appl. Earth Obs. Remote Sens. 2014, 7, 4692–4703. [Google Scholar] [CrossRef]
  16. Agustin, S.; Devi, P.A.R.; Sutaji, D.; Fahriani, N. Oil Palm Age Classification on Satellite Imagery Using Fractal-Based Combination. J. Theor. Appl. Inf. Technol. 2016, 89, 18. [Google Scholar]
  17. Korom, A.; Phua, M.; Hirata, Y.; Matsuura, T. Extracting oil palm crown from WorldView-2 satellite image. In IOP Conference Series: Earth and Environmental Science; IOP Publishing: Bristol, UK, 2014; p. 012188. [Google Scholar]
  18. Li, W.; Fu, H.; Yu, L.; Cracknell, A. Deep Learning Based Oil Palm Tree Detection and Counting for High-Resolution Remote Sensing Images. Remote Sens. 2016, 9, 22. [Google Scholar] [CrossRef]
  19. Arasato, L.S.; Amaral, S.; Rennó, C.D. Detecting individual palm trees (Arecaceae family) in the Amazon rainforest using high resolution image classification. In Anais XV Simpósio Brasileiro de Sensoriamento Remoto; SBSR: Curitiba, PR, Brazil, 2011; pp. 7628–7635. [Google Scholar]
  20. Shafri, H.Z.; Hamdan, N.; Saripan, M.I. Semi-automatic detection and counting of oil palm trees from high spatial resolution airborne imagery. Int. J. Remote Sens. 2011, 32, 2095–2115. [Google Scholar] [CrossRef]
  21. Komba Mayossa, P.; Coppens D’Eeckenbrugge, G.; Borne, F.; Gadal, S.; Viennois, G. Developing a method to map coconut agrosystems from high-resolution satellite images. In Proceedings of the 27th International Cartographic Conference 16th General Assembly, Rio de Janeiro, Brazil, 23–28 August 2015. [Google Scholar]
  22. Kattenborn, T.; Sperlich, M.; Bataua, K.; Koch, B. Automatic single tree detection in plantations using UAV-based photogrammetric point clouds. Int. Arch. Photogramm. Remote Sens. Spat. Inf. Sci. 2014, 40, 139. [Google Scholar] [CrossRef]
  23. Ozdarici-Ok, A. Automatic detection and delineation of citrus trees from VHR satellite imagery. Int. J. Remote Sens. 2015, 36, 4275–4296. [Google Scholar] [CrossRef]
  24. Malik, Z.; Ziauddin, S.; Shahid, A.R.; Safi, A. Detection and Counting of On-Tree Citrus Fruit for Crop Yield Estimation. IJACSA Int. J. Adv. Comput. Sci. Appl. 2016, 7. [Google Scholar] [CrossRef]
  25. Bazi, Y.; Al-Sharari, H.; Melgani, F. An automatic method for counting olive trees in very high spatial remote sensing images. In Proceedings of the 2009 IEEE International Geoscience and Remote Sensing Symposium, Cape Town, South Africa, 12–17 July 2009; pp. 125–128. [Google Scholar]
  26. Maillard, P.; Gomes, M.F. Detection and Counting of Orchard Trees From thr Images Using a Geometrical-Optical Model and Marked Template Matching. ISPRS Ann. Photogramm. Remote Sens. Spat. Inf. Sci. 2016, 3, 75. [Google Scholar] [CrossRef]
  27. Wang, L. A multi-scale approach for delineating individual tree crowns with very high resolution imagery. Photogramm. Eng. Remote Sens. 2010, 76, 371–378. [Google Scholar] [CrossRef]
  28. Ke, Y.; Quackenbush, L.J. A review of methods for automatic individual tree-crown detection and delineation from passive remote sensing. Int. J. Remote Sens. 2011, 32, 4725–4747. [Google Scholar] [CrossRef]
  29. Gebreslasie, M.; Ahmed, F.; Van Aardt, J.A.; Blakeway, F. Individual tree detection based on variable and fixed window size local maxima filtering applied to IKONOS imagery for even-aged Eucalyptus plantation forests. Int. J. Remote Sens. 2011, 32, 4141–4154. [Google Scholar] [CrossRef]
  30. Jing, L.; Hu, B.; Noland, T.; Li, J. An individual tree crown delineation method based on multi-scale segmentation of imagery. ISPRS J. Photogramm. Remote Sens. 2012, 70, 88–98. [Google Scholar] [CrossRef]
  31. Garrity, S.R.; Vierling, L.A.; Smith, A.M.; Falkowski, M.J.; Hann, D.B. Automatic detection of shrub location, crown area, and cover using spatial wavelet analysis and aerial photography. Can. J. Remote Sens. 2008, 34, S376–S384. [Google Scholar] [CrossRef]
  32. Weatherspark Average Weather in Sufālat Samā’il Oman. Available online: https://weatherspark.com/y/105796/Average-Weather-in-Suf%C4%81lat-Sam%C4%81%E2%80%99il-Oman-Year-Round#Sections-Summary (accessed on 24 November 2017).
  33. MAF, Agriculture Census Results 2012/2013: Ad’Dakhiliyah Governorate. Minitery of Agriculture and Fisheries Oman 2013. Available online: http://maf.gov.om/Pages/PageCreator.aspx?lang=AR&I=0&DId=0&CId=0&CMSId=800708 (accessed on 1 December 2017).
  34. Hadjimitsis, D.G.; Papadavid, G.; Agapiou, A.; Themistocleous, K.; Hadjimitsis, M.; Retalis, A.; Michaelides, S.; Chrysoulakis, N.; Toulios, L.; Clayton, C. Atmospheric correction for satellite remotely sensed data intended for agricultural applications: Impact on vegetation indices. Nat. Hazards Earth Syst. Sci. 2010, 10, 89–95. [Google Scholar] [CrossRef]
  35. Gomes, M.F.; Maillard, P. Detection of tree crowns in very high spatial resolution images. In Environmental Applications of Remote Sensing; IntechOpen: Rijeka, Croatia, 2016. [Google Scholar]
  36. Zaid, A.; De Wet, P. Chapter I Botanical and Systematic Description of Date Palm; FAO: Rome, Italy, 1999; pp. 1–28. [Google Scholar]
  37. Bunting, P.; Lucas, R. The delineation of tree crowns in Australian mixed species forests using hyperspectral Compact Airborne Spectrographic Imager (CASI) data. Remote Sens. Environ. 2006, 101, 230–248. [Google Scholar] [CrossRef]
  38. Deng, S.; Katoh, M.; Guan, Q.; Yin, N.; Li, M. Interpretation of forest resources at the individual tree level at Purple Mountain, Nanjing City, China, using WorldView-2 imagery by combining GPS, RS and GIS technologies. Remote Sens. 2013, 6, 87–110. [Google Scholar] [CrossRef]
  39. Zhao, Z.; Gao, J.; Wang, Y.; Liu, J.; Li, S. Exploring spatially variable relationships between NDVI and climatic factors in a transition zone using geographically weighted regression. Theor. Appl. Climatol. 2015, 120, 507–519. [Google Scholar] [CrossRef]
  40. Shrestha, P.M. Comparison of Ordinary Least Square Regression, Spatial Autoregression, and Geographically Weighted Regression for Modeling Forest Structural Attributes Using A Geographical Information System (GIS)/Remote Sensing (RS) Approach. Ph.D. Thesis, University of Calgary, Calgary, AB, Canada, 2006. [Google Scholar]
  41. Fotheringham, A.S.; Brunsdon, C.; Charlton, M. Geographically Weighted Regression: The Analysis of Spatially Varying Relationships; John Wiley & Sons: Hoboken, NJ, USA, 2003. [Google Scholar]
  42. Chen, G.; Zhao, K.; McDermid, G.J.; Hay, G.J. The influence of sampling density on geographically weighted regression: A case study using forest canopy height and optical data. Int. J. Remote Sens. 2012, 33, 2909–2924. [Google Scholar] [CrossRef]
  43. Skurikhin, A.N.; Garrity, S.R.; McDowell, N.G.; Cai, D.M. Automated tree crown detection and size estimation using multi-scale analysis of high-resolution satellite imagery. Remote Sens. Lett. 2013, 4, 465–474. [Google Scholar] [CrossRef]
  44. Morton, J.F. Fruits of Warm Climates; Creative Resource Systems, Inc.: Miami, FL, USA, 1987; pp. 5–11. [Google Scholar]
  45. Latifian, M.; Rahnama, A.A.; Sharifnezhad, H. Effects of planting pattern on major date palm pests and diseases injury severity. Int. J. Agric. Crop Sci. 2012, 4, 1443–1451. [Google Scholar]
  46. Carnot, A.C.; Alvarest, T.T.E.; Justin, O.; Zachée, A.; Fabrice, M.T. Effect of Culture Density of Black Nightshade (Solanum nigrum) on the Insect Infestation. Plant 2017, 5, 19–26. [Google Scholar] [CrossRef]
  47. Chaudhary, O.; Kashyap, R. Effect of some management practices on the incidence of insect pests and yield of egg plant (Solanum melongena L.) in India. Int. J. Pest Manag. 1992, 38, 416–419. [Google Scholar] [CrossRef]
  48. Ihejirika, G.; Ibeawuchi, I.; Ogbedeh, K. Assessment of planting technique and planting density on insect’s damage, defoliation and pod-rot of groundnut. Life Sci. J. 2008, 52, 58–62. [Google Scholar]
  49. Sperry, C.E.; Chaney, W.R.; Shao, G.; Sadof, C. Effects of Tree Density, Tree Species Diversity and Percentage of Hardscape on Three Insect Pests of Honeylocust. J. Arboric. 2001, 27, 263–271. [Google Scholar]
  50. Mohamed, M. Impact of planting dates, spaces and varieties on infestation of cucumber plants with whitefly, Bemisia tabaci (Genn.). J. Basic Appl. Zool. 2012, 65, 17–20. [Google Scholar] [CrossRef]
  51. Kenny, G.; Chapman, R. Effects of an intercrop on the insect pests, yield, and quality of cabbage. N. Z. J. Exp. Agric. 1988, 16, 67–72. [Google Scholar] [CrossRef]
  52. Cherry, R.; Wang, Y.; Nuessly, G.; Raid, R. Effect of Planting Date and Density on Insect Pests of Sweet Sorghum Grown for Biofuel in Southern Florida. J. Entomol. Sci. 2013, 48, 52–60. [Google Scholar] [CrossRef]
  53. Haynes, K.J.; Liebhold, A.M.; Johnson, D.M. Elevational gradient in the cyclicity of a forest-defoliating insect. Popul. Ecol. 2012, 54, 239–250. [Google Scholar] [CrossRef]
Figure 1. Study area location in the north of Oman.
Agriculture 08 00064 g001
Figure 2. The image processing steps to figure the suitable window to count the date palm trees.
Agriculture 08 00064 g002
Figure 3. Local Maxima illustration process figure of windows 7. (a) date palm trees canopy with dark center on the true color image, (b) NIR1 band subtracted from Red band, (c,d) local maxima identification, (e) local maxima (raster layer) transferred to point layer and overlaid on top of RGB image. The table shows pixel value of the date palm trees. The blue border shows an example of search windows 14 pixels; moving from left to right and in the end of the latest column moving down and start to scan image again from right to left and so on. The green rectangle is the highest pixel value identified in the searching windows.
Agriculture 08 00064 g003
Figure 4. The clipping process (a) the yellow polygon represents date palm identified post NDVI and classification, (b) point layer transformed from local maxima identification, (c) point layer overlayed on date palm polygon and on other crops and outside vegetation, (d) point on the top of date palm trees only after date palm polygon to clip point layer.
Agriculture 08 00064 g004
Figure 5. The average tree numbers with different buffer size around the trees with field infestation data.
Agriculture 08 00064 g005
Figure 6. Scatterplot of the number of trees in 15 m radius around each tree shows the infestation reading data and the mean O. lybicus infestation of the corresponding trees for spring and autumn season.
Agriculture 08 00064 g006
Table 1. A comparison of the counted number of trees from the field and local maxima predictions and the percentages of estimation errors per village and window scales.
VillageField CountLocal Maxima PredictionEstimation Error
Window 3Window 5Window 7Window 3Window 5Window 7
Al’Afiah28252937124487.6%31.6%−13.5%
Al Ayn29848438032362.4%27.5%8.4%
Al Falajain30240040026832.5%32.5%−11.3%
Al Ghobrah179984553180449.7%208.9%0.6%
Al Jinah27145734724068.6%28.0%−11.4%
Al Mahal55085266749354.9%21.3%−10.4%
Al Magbariah38263442029566.0%9.9%−22.8%
Falaj Al Maraga33857839727571.0%17.5%−18.6%
Biaq376786567365109.0%50.8%−2.9%
Manal24934224817837.3%−0.4%−28.5%
Sayja35459137027366.9%4.5%−22.9%
WadiQurai58276059145830.6%1.5%−21.3%
Wusad47484257745077.6%21.7%−5.1%
Total4637832759574091%79.6%28.5%−11.8%
Table 2. The results of the ordinary least square (OLS ) tests for each season for tree infestation value with the number of trees in 15 m radius.
SeasonsVariableCoefficientStandard Errort-Valuep-Value
Spring in 15 m radiusIntercept0.2430.3290.7400.460
Density0.072 *0.0223.3290.001
Autumn in 15 m radiusIntercept0.2720.2191.2440.215
Density0.0230.0151.5270.128
* Significant relationship.
Table 3. Geographic Weight Regression (GWR) results for the correlation between infestation and tree density in a 15-m radius.
VariablesSpring SeasonAutumn Season
Neighbours4160
Residual Squares459.34140.15
Effective Number40.6719.30
Sigma1.0620.80
AIC1362.615590.54
R20.590.30
R2 Adjusted0.550.24
Degree of Freedom (df)447239
Table 4. The total area and number of date palm trees estimated for each village from local maxima, and the average infestation in each village in both seasons.
VillageArea (m2)Local Maxima EstimationTotal Date Palm in the Village Tree/HectareAverage Number of Droplets per cm2
SpringAutumn
Sayja290,73454571884.190.02
Falaj Al Marage103,41515081460.350.07
Manal148,10623881610.670.02
Biaq62,7587951270.280.23
Al Ghobrah38,2404871270.80.64
Wusad65,0999921521.09No Reading
Wadi Qurai48,0459401960.951.90
Al Jinah355,45858051630.630.57
Al Ayn355,45858051630.690.35
Ar Rusah18,2583351831.62.58
Al Mahal34,6035371550.730.84
Al Magbariah47,5808331750.590.44
Al Falajain13,4762291702.082.36
Al’Afiah630886136No Reading0.50

