Article

Changes in the Concentration of Leaf Nitrogen over the Season Affect the Diagnosis of Deficiency or Sufficiency in Strawberries in the Subtropics

by
Christopher M. Menzel
Department of Agriculture, PO Box 5083, SCMC, Nambour, Queensland 4560, Australia
Agriculture 2018, 8(8), 126; https://doi.org/10.3390/agriculture8080126
Submission received: 16 April 2018 / Revised: 31 July 2018 / Accepted: 7 August 2018 / Published: 10 August 2018
(This article belongs to the Special Issue Recent Advances in Horticultural Practices for Berry Crops)

Abstract

:
Optimum leaf nitrogen (N) concentrations have been identified for strawberry (Fragaria ×ananassa Duch.) in temperate and Mediterranean areas, but whether these values are appropriate for the subtropics is unclear. Two experiments were conducted for 2 years to determine if the seasonal changes in the concentration of leaf N affect the diagnosis of deficiency or sufficiency of strawberry plants in Queensland, Australia. In 2014, ‘Festival’, ‘Fortuna’, and ‘Winter Dawn’ were planted in early April and grown with and without N for the entire season. Then, ‘Festival’ was planted the following year in mid- or late April and, again, was grown with and without N. Yield was slightly lower with N in 2014, but higher with it the following year, particularly in the early planting. The concentration of total N in young, fully expanded leaves decreased from 3.0% to 2.0% as leaf, crown, and root dry weight increased, while the concentration of nitrate-N (NO3-N) decreased from 1200–3200 to 50–500 mg/kg. These changes in leaf N were large enough to affect the diagnosis of N deficiency or sufficiency. The concentration of leaf N was less variable than the concentration of leaf NO3-N and, therefore, better for estimating the nutrient status of strawberry plants in the subtropics.

1. Introduction

Annual strawberry production across the globe has reached about 8 million tonnes [1]. Most of the production is found in temperate areas such as northern Europe, northern United States, Canada, Chile, and China, and in Mediterranean areas such as Spain, California, and Mexico [2]. Production in these regions occurs during the warm part of the year. However, there are a few areas such as Queensland and Florida that produce berries during winter in a subtropical climate [3,4,5]. Typically, the strawberry season is shorter, and growth and yield are lower, in subtropical areas than in Mediterranean areas. Therefore, cultivars and plant agronomy developed in temperate or Mediterranean areas may not always be appropriate for subtropical areas.
Nitrogen (N) is the main nutrient affecting the productivity of strawberry fields. Research in Florida showed that N can affect growth, yield, and fruit quality, although only a few reports provide data on leaf nutrient concentrations [6,7,8,9]. Growth and yield usually increase up to an optimum rate of N and then decline, with pale, soft, and bland fruit sometimes produced with as much as 300–600 kg N per ha. Maximum yields are usually achieved with about 160 kg N per ha [10,11]. Excessive N can be transported off site or leached past the roots of the plants, degrading surface waters and groundwater [12]. In Florida, Albregts et al. [6] found that fruit yield was correlated with leaf N in February or March in ‘79–1126’ and ‘Pajaro’ strawberry, respectively. Hochmuth et al. [13] suggested optimum N rates for strawberry during the early, middle, and later parts of the season in Florida, but the relationship between yield and leaf N was not indicated. There has been no research published on the effect of N on strawberries in Queensland.
There is no consensus of the best time to measure plant N status in strawberries, particularly in the subtropics. Information from areas with a Mediterranean climate indicate that the concentration of total N in the leaves can vary over the season. In an early study in California, N decreased from 2.3% to 1.9% from mid-June to early September in one cultivar but was relatively stable, varying from 1.8% to 2.1% in a second cultivar [14]. In a later study in California, N decreased from early flowering to the main harvest and then was stable [15]. Maximum values were about 3.3%, and minimum values were about 2.8%. In Spain, maximum values of N occurred in December and January (3.3%) and minimum values occurred in May (2.9%) [16]. Locascio and Martin [17] showed that total N decreased from 4.7% to 3.1% from November to April in Florida, but they did not determine if these changes would affect the diagnosis of deficiency or sufficiency. Some authors have suggested optimum values of leaf N for high-yielding strawberry fields in California, North Carolina, northeastern United States, and Ontario, Canada [18,19,20,21,22]. Optimum concentrations of leaf N ranged from 2.0% to 4.0%, with samples collected mostly from the leaf blade. The leaves were collected at flowering or fruiting, and in fall or summer. It is not known if these ranges apply to fields in Queensland or other subtropical areas with different growth and production cycles.
This paper reports on the seasonal variation in leaf N in strawberry plants growing in Queensland, Australia. The main objective of the study was to determine if the changes were large enough to influence the diagnosis of deficiency or sufficiency in the plants. The relationship between the concentration of N in the leaves and dry weight of the leaves, crowns, and roots was also examined. The study was conducted in the field rather than in solution culture to reflect commercial production in Queensland.

2. Materials and Methods
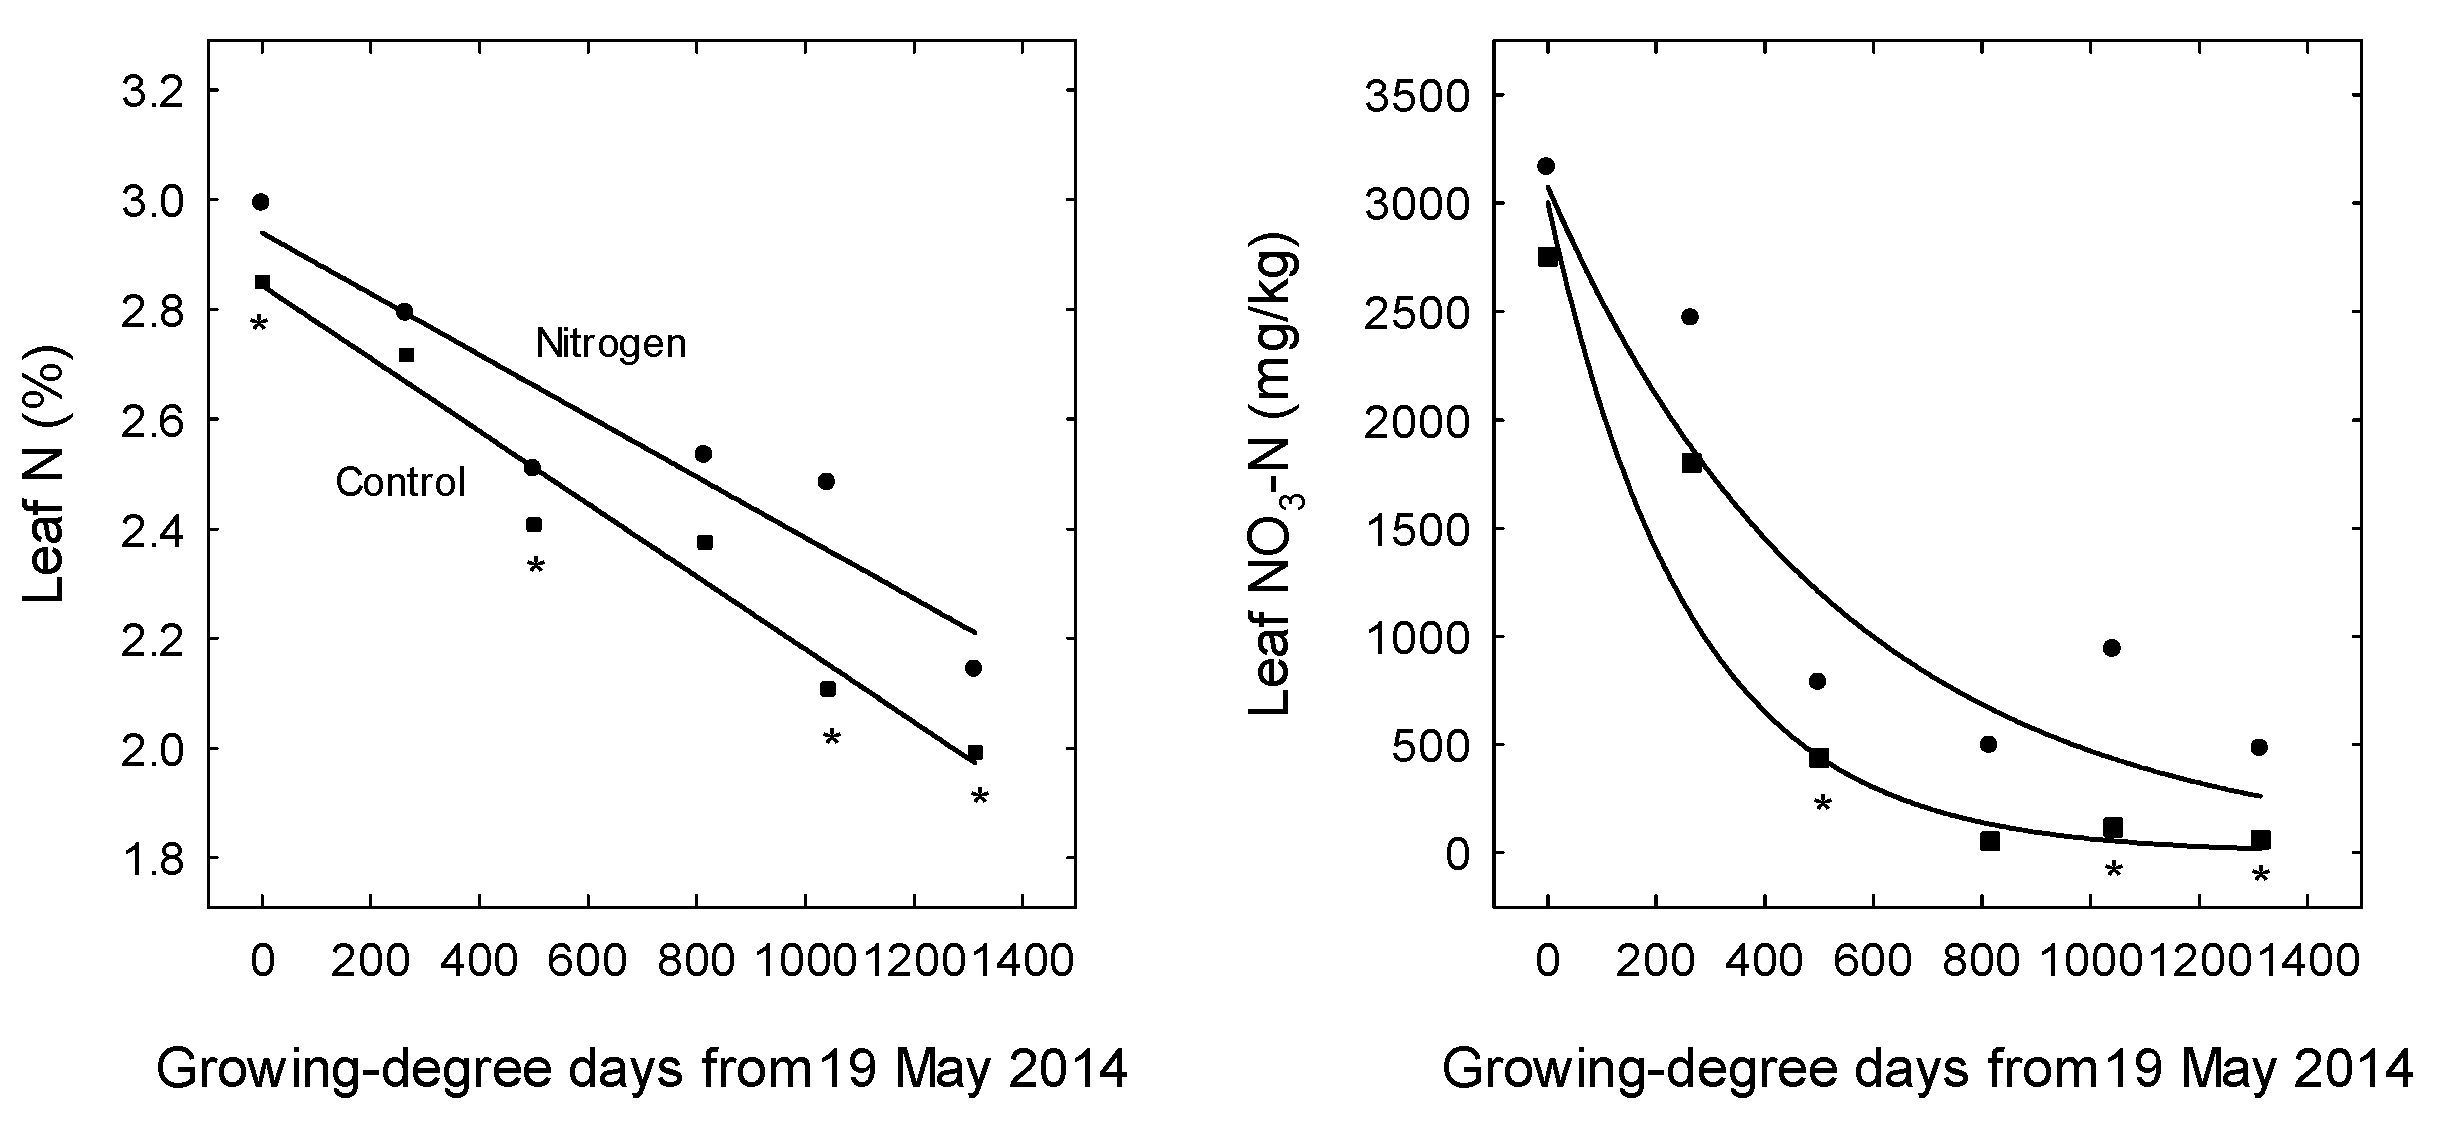
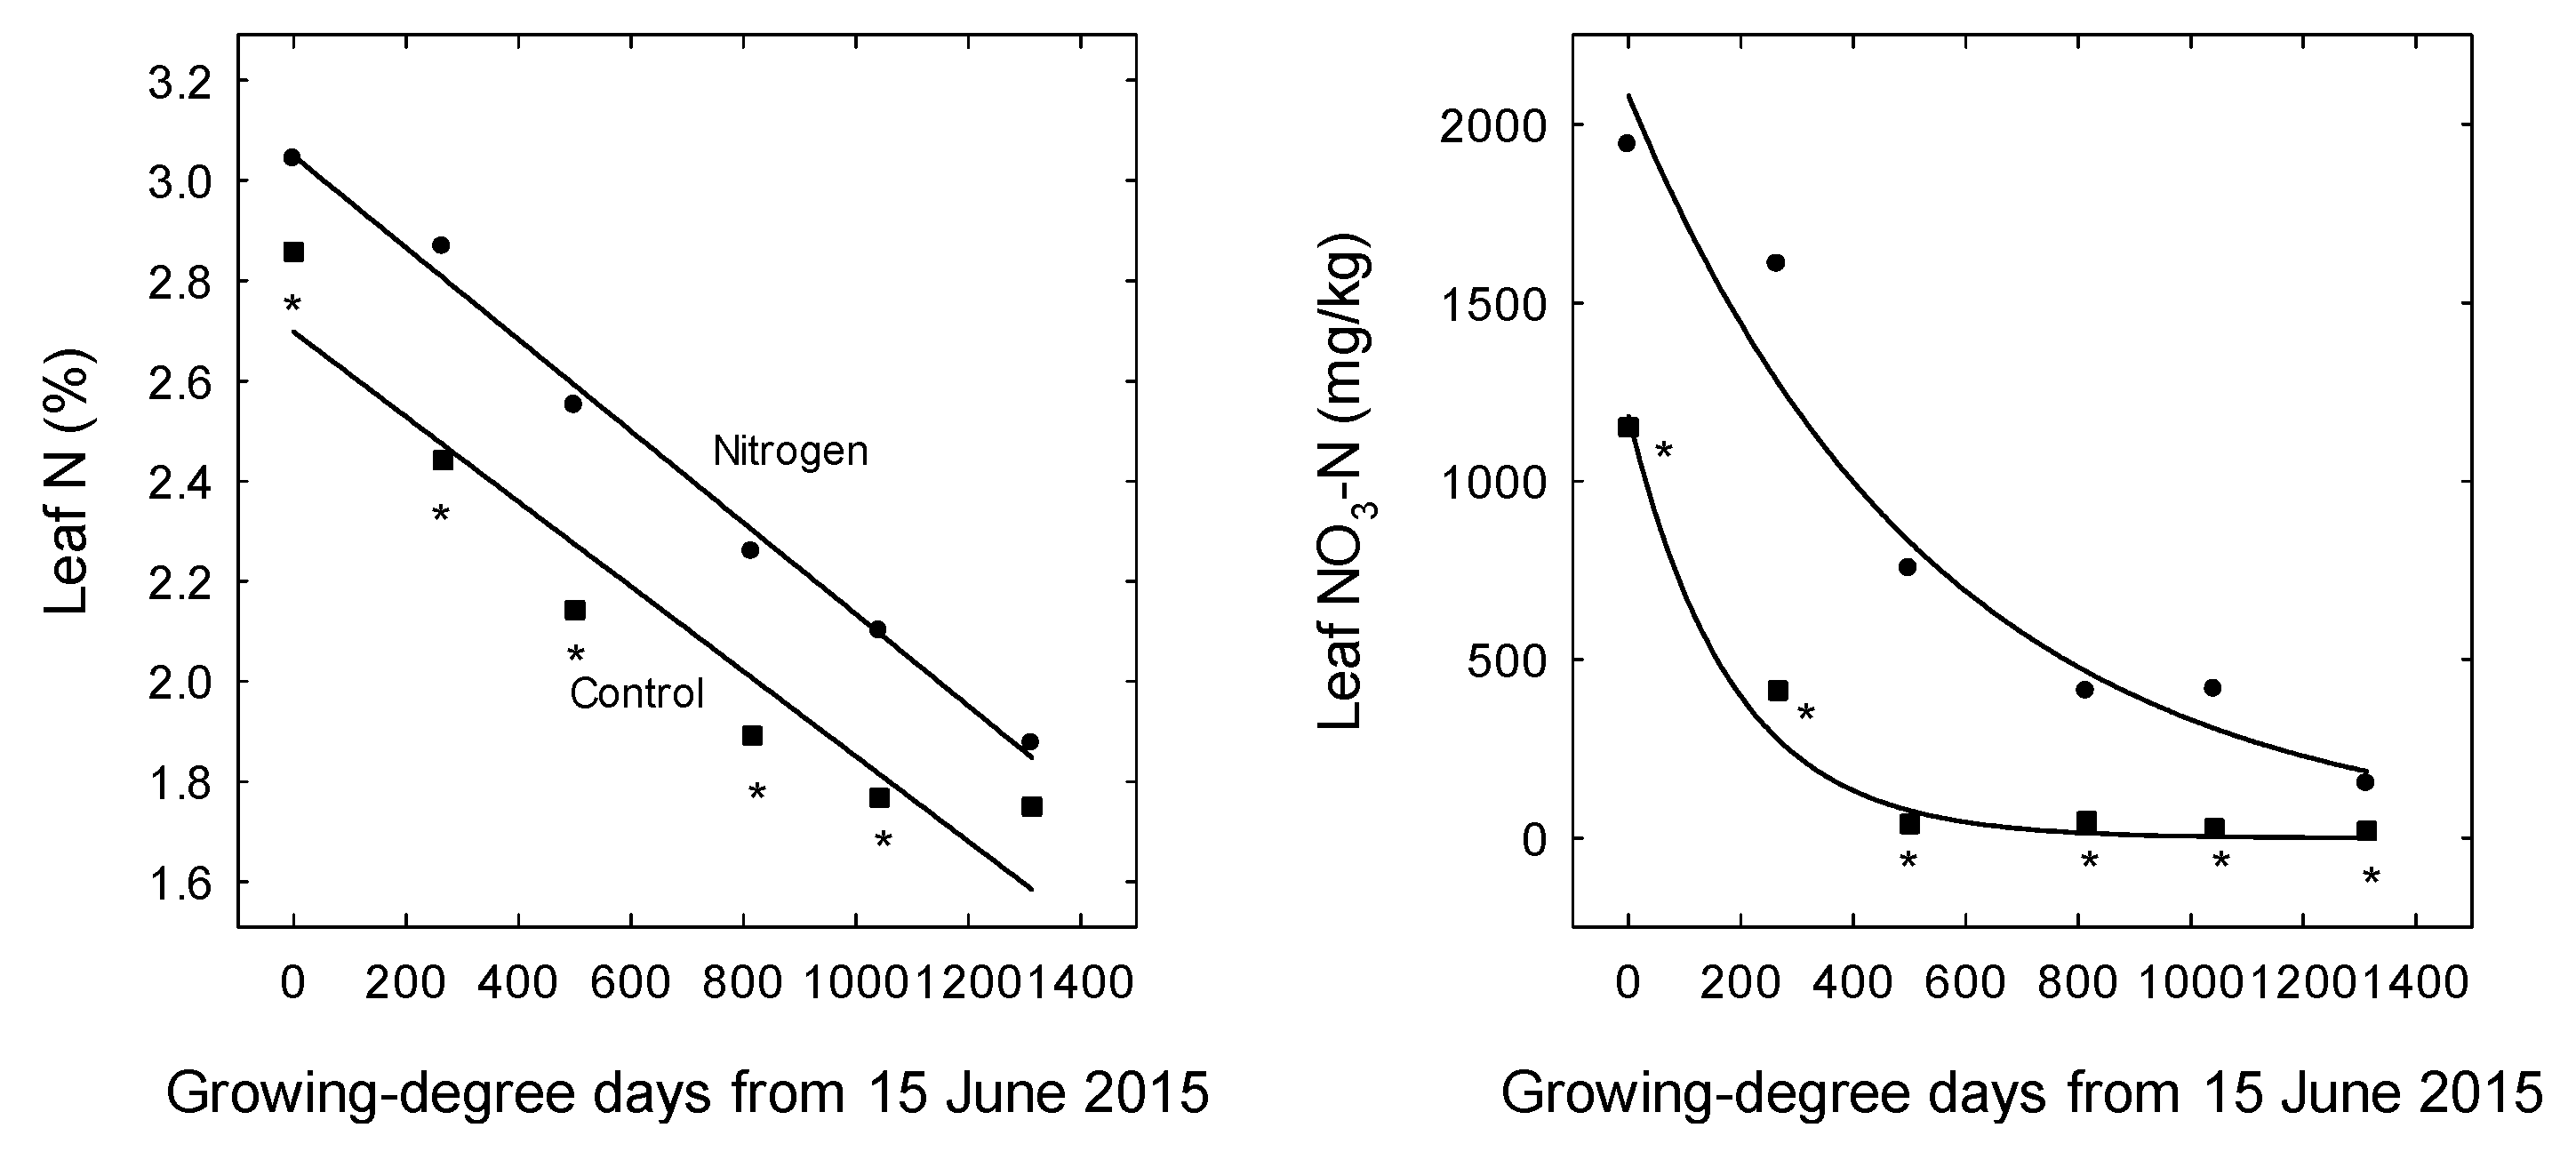
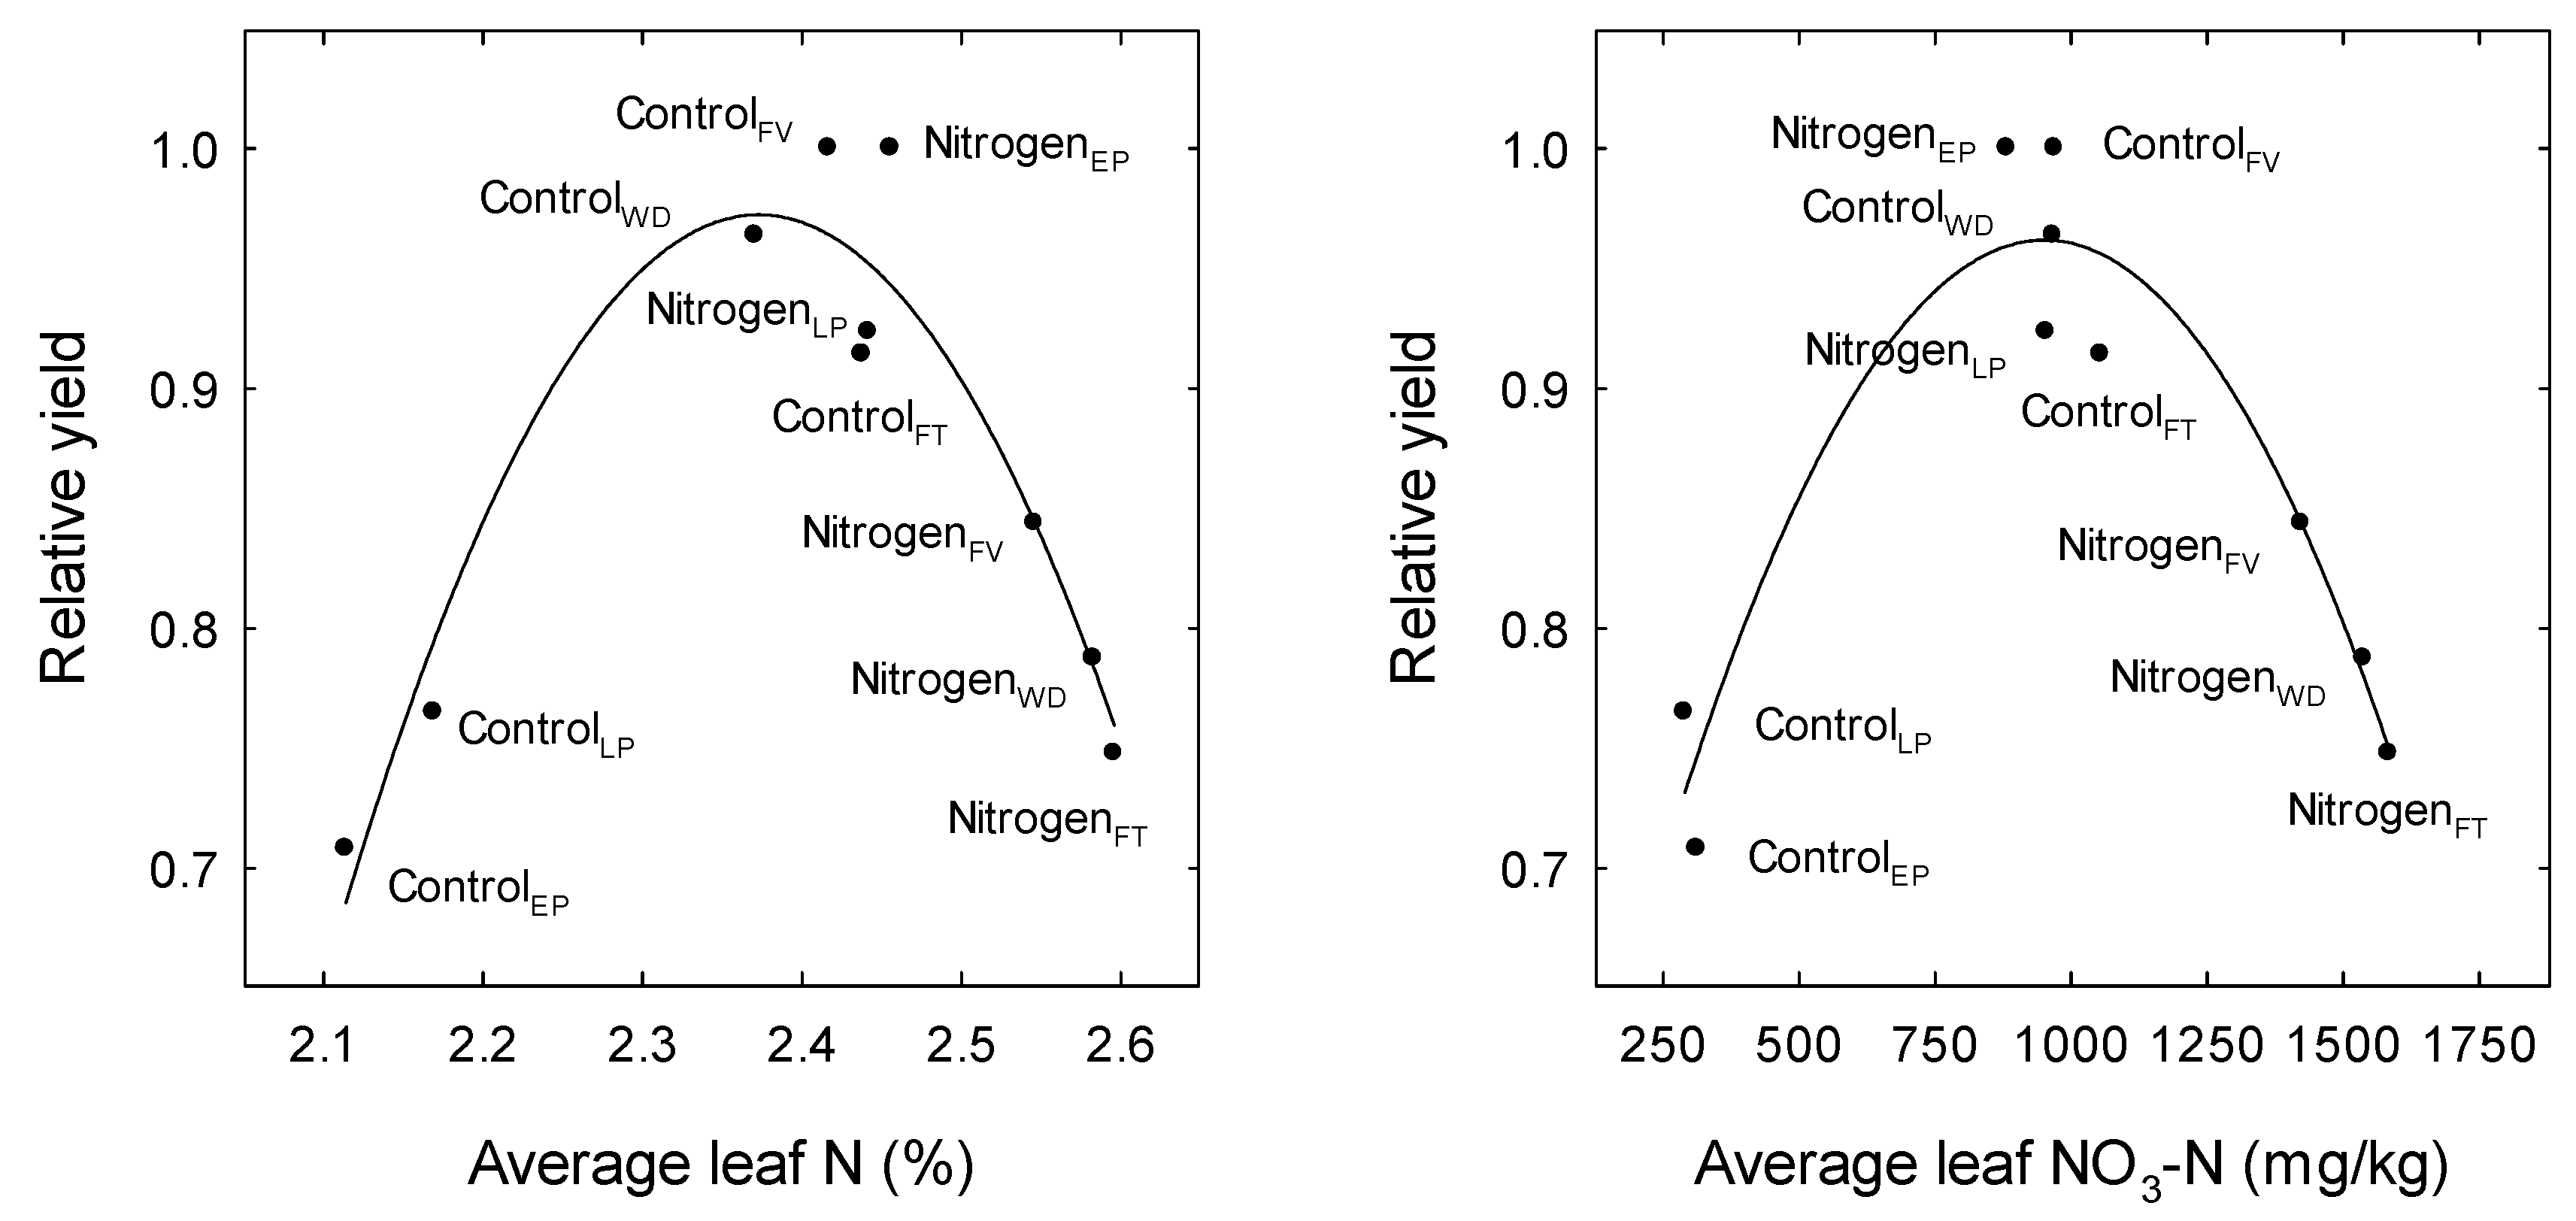
Three cultivars, including ‘Festival’, ‘Fortuna’, and ‘Winter Dawn’ were planted on 10 April 2014, and a single cultivar, ‘Festival’, was planted on 20 or 29 April 2015 in Nambour, Queensland, Australia (lat. 26.6° S, long. 152.9° E, elevation 29 m). The plants were grown with and without N each year and were primarily managed using standard agronomy practices for strawberry in Queensland [4]. The only exception to this protocol was that no cover crop or pre-plant fertilisers were used before planting.
The new plants were planted through plastic in double-row beds (70 cm wide and 130 cm apart from the centres) at an inter- and intra-row spacing of 30 cm (equivalent to 51,000 plants/ha). Irrigation was applied through a single line of drip tape installed under the plastic and was scheduled when soil water potential in the root zone was < −10 kPa. Nitrogen and other nutrients were applied by fertigation. Based on soil analysis, the plants received a total of 117 and 145 kg/ha of N (N treatments only), 24 and 19 kg/ha of P, 204 and 165 kg/ha of K, 8 and 7 kg/ha of Ca, 16 and 13 kg/ha of Mg, 1.4 and 1.8 kg/ha of B, 0.18 and 0.14 kg/ha of Cu, 0.35 and 0.28 kg/ha of Fe, 0.18 and 0.14 kg/ha of Mn, and 0.06 and 0.05 kg/ha of Zn in 2014 and 2015, respectively. The fertilisers used each year included urea (46–0–0; Incitec Pivot Fertilisers, Melbourne, Australia), mono-potassium phosphate (0–22.7–28.7; Farmcraft, Brisbane, Australia), potassium sulphate (0–0–41.5; Incitec Pivot Fertilisers, Melbourne, Australia), calcium chelate (13.4% Ca and 0.43% B; Nutri-Tech Solutions, Pty. Ltd., Yandina, Australia), magnesium sulphate (15.1% Mg; Impact Fertilizers, Pinkenba, Australia), solubor (20.5% B; Incitec Pivot Fertilisers, Melbourne, Australia), and Librel BMX (0.875% B, 1.70% Cu, 3.335% Fe, 1.70% Mn, and 0.60% Zn; BASF, Noble Park, Australia).
The experiments were laid out in a split-plot design, with the two N treatments as main plots and cultivar (2014) or time of planting (2015) as subplots. There were four replicate blocks in 2014 and six replicate blocks in 2015. The control and N treatments were arranged in adjacent rows in each main plot and fertilised independently.
The concentration of N in the soil (0–15 cm depth) was measured before planting and at the end of each experiment. Soil samples were collected from each block and pooled across all treatments for the initial test and across cultivars or planting time for the final test. Nitrogen was determined in samples by catalysed, high-temperature combustion (Dumas) using Method 7A5, as described by Bellomonte et al. [23].
Plant dry weight (leaves, crowns, roots, flowers, and immature fruit) was measured on two randomly selected plants in each plot every 3 weeks from May or June to October each year. Ripe fruit was also harvested weekly each year for an assessment of yield (fresh weight) on 20 plants/plot. Fruits were classified as ripe when they had at least 75% red colour. Any fruit with visual symptoms of damage or disease were rejected as non-marketable.
Ten young, fully expanded leaves (index leaves) were collected from the plants every 3 weeks for analysis of total N and nitrate-N (NO3-N). Leaves, crown, roots, flowers, immature fruit (all fruit from two plants/block), and harvested mature fruit (six fruit/block) were also weighed and analysed for N in 2015. Uptake of N in each plant part was calculated by multiplying the dry weight of the tissue by the concentration of N in the sample. Nitrogen removed during harvest was calculated by multiplying the fresh weight of the mature fruit by the average seasonal concentration of N in the fruit. Total N was measured using a combustion analyser (Leco Corp., St. Joseph, MI, USA), following the method of the Association of Official Analytical Chemists [24], and NO3-N was measured by colorimetric analysis using a continuous flow auto-analyser (Lachat Instruments, Milwaukee, WI, USA), following the technique of Ott-Borrelli et al. [25].
Data were analysed by split-plot analysis of variance (ANOVA; 2 N treatments × 3 cultivars or 2 planting dates) using GenStat (Version 15; VSN International, Hemel Hempstead, UK). Nitrate-N was transformed to arcsine square root prior to analysis and back-transformed for presentation. Means were separated at the 0.05 level using Fisher least significant difference (LSD) test. Growth and leaf N were plotted against thermal time over the season and fitted using the Marquart-Levenberg algorithm (SigmaPlot ver. 12.5; Systat, Chicago, IL, USA). The calculation of growing-degree days (GDDs) was based on a base temperature of 7 °C for growth. The daily mean temperature was calculated from the average of the product of the maximum and minimum temperature [26]. During the experiment, the daily mean temperature was always above 7 °C. Maximum and minimum temperatures were given similar weight in the calculation and there was no attempt to include an upper limit to growth [27] or to take into account minimums below 7 °C [28]. Relative yield was calculated as the actual yield of each treatment divided by the maximum yield of any treatment in a given year.

3. Results

Total N in the soil was similar prior to planting in 2014 and 2015 (1075 ± 25 and 992 ± 24 mg/kg, respectively) and, by the end of each season, was unaffected by addition of N fertiliser (1550 ± 48 and 1475 ± 157 mg/kg in the control and N treatment, respectively, in 2014, and 985 ± 43 and 998 ± 27 mg/kg in the control and N treatment, respectively, in 2015). Based on these readings, soil at the site would be rated low in terms of total N in Queensland [29]. More than 90% of the N was in the organic form, and plant available N (i.e., NH4+ and NO3) was similar between the two N treatments (data not shown).
In 2014, yield was significantly affected by N (p ≤ 0.05) but was unaffected by cultivar or an interaction between N and cultivar. Surprisingly, plants fertilised with N that year produced an average of 151 g less fruit than those grown without N (Table 1). However, this was not the case the following year. In 2015, yield was affected by N (p ≤ 0.05), as well as an interaction between N and planting date (p ≤ 0.05) and, as expected, was greater with N, particularly when the field was planted earlier in April that year (Table 2). Again, only ‘Festival’ strawberry was planted in 2015.
Most measured components of plant growth were unaffected by N, cultivar, or the interaction between them in 2014 (data not shown). The only exception to this occurred at the first harvest, where there were slightly more leaves on plants in the control than in the N treatment (7.8 and 7.5 leaves/plant, respectively). The following year, addition of N resulted in greater dry weight in the leaves, flowers and immature fruit, and the crown (Figure 1A–C). Root growth was variable, however, and was generally unaffected by N (Figure 1D). In each case, there was no effect of time of planting or its interactions with N, and therefore, the data were pooled across the two planting dates.
The concentration of N in the leaves declined over time in 2014 and was often higher in the N treatment than in the control (Figure 2). However, neither total N nor NO3-N were affected by cultivar or an interaction between N and cultivar on any date. Leaf N also declined over time the following year and was higher with N throughout the season (Figure 3). In this case, total N was also slightly higher in the late planting (2.4%) than in the early planting (2.3%), and the difference in NO3-N concentration between the control and N treatment was greater, on average, in the late planting (338 and 1750 mg/kg in the control and N treatment, respectively) than in the early planting (501 and 1476 mg/kg in the control and N treatment, respectively). Overall, leaf N concentrations were lower in the second year than in the first, averaging 2.4% and 2.6% in the control and N treatment, respectively, in 2014, and 2.1% and 2.4%, respectively, in 2015.
Analysis of pooled data from both seasons revealed that relative yield peaked at mean seasonal leaf N of 2.25% to 2.50% and mean NO3-N of 625 to 1320 mg/kg (Figure 4). Therefore, plants given N in the first year had leaf N levels above the optimum (excessive), while plants given N in the second year had optimum leaf N levels and those not given N were deficient in leaf N.
In 2015, the total amount of N removed by the harvested crop was higher in the N treatment (69 kg/ha) than in the control (42 kg/ha) (p < 0.05). Total N in vegetative tissues of the plants (leaves, crown, and roots) was also greater in the N treatment (30 kg/ha) than in the control (19 kg/ha) (p < 0.05). None of the plants were measured for the uptake of N in 2014.

4. Discussion

Overall, plants grown without N in this study had higher yields than those grown with N in the first year, but had lower yields in the second year. Higher yields were associated with seasonal average leaf N concentration of 2.25% to 2.50% and an average leaf NO3-N concentration of 625 to 1320 mg/kg. Not surprisingly, the concentration of N in the leaves changed considerably as the season progressed, declining linearly from 3.0% to 2.0% N and exponentially from 1200–3200 to 50–500 mg/kg NO3-N. These declines in N occurred whether or not the plants were given N weekly. Other workers have also reported linear declines in leaf N concentration in strawberry and other crops, as well as linear or exponential declines in NO3-N, depending on the type of leaf sampled [30,31,32,33]. For example, in strawberry, NO3-N decreased from about 400 to 50 mg/L in the sap of the young leaves (FW) from mid-May to early July, and from about 130 to 20 ppm in the sap of the youngest fully expanded leaves [30]. Changes in leaf NO3-N reflect changes in the uptake and use of N by the plant and the activity of nitrate reductase [34,35,36]. Further experiments are required to determine the biochemistry of N transformations in the leaves of strawberry plants.
The changes in N over the season were large enough to affect the diagnosis of plant nutrient status. In Florida, Hochmuth et al. [13] suggested that leaf N concentrations for strawberry should be 3.0% to 4.0% early in the season, 2.8% to 3.0% in the middle of the season, and 2.5% to 3.0% late in the season. Based on this recommendation, the plants fertilised with N in the current study would be rated as sufficient initially (i.e., leaf N was equal to 3.0%) and deficient later (leaf N was equal to 2.0%). Nutrient monitoring needs to take into account changes in leaf N over the season, which varies in different growing environments (e.g., subtropical versus temperate or Mediterranean areas). The response of plants to N may also vary across years. For example, Hochmuth et al. [8] found that higher rates of N increased yield during the first year of an experiment in Florida but had no effect on yield in the second year. In the first year of that study, higher yields were associated with leaf N of 3.6% to 3.9% in November and 2.7% to 2.8% in March, and lower yields were associated with 3.5% and 2.4% in November and March, respectively. In other parts of the United States and Canada, values of leaf N above 2.8% were considered sufficient, while values below 2.0% were considered deficient [18,19,20,21,22]. In the current study, leaf N in the plants given N was close to this upper value at the start of the season (sufficient), and close to the lower value at the end of the season (deficient).
Nitrate-N accounted for about 2.9% to 4.8% of the total N measured in the young, fully expanded leaves in the study, but readings were more variable, with concentrations decreasing to almost zero in the controls by the end of the season. Therefore, total N was more reliable for measuring plant N status. Bottoms et al. [15] also found that NO3-N in the petiole was highly variable and did not reliably indicate the N status of the plants in high-yielding strawberry fields in California.
The maximum uptake of N by the leaves, crown, and roots was 30 kg N per ha. The berries accounted for an additional 69 kg of N, giving a total uptake of 99 kg per ha. The calculated uptake of N by the plant and crop was close to the amount of fertiliser that was applied in 2015 (117 kg N/ha), suggesting that the crop was not over-fertilised. This value is much lower than that found in strawberry fields in California (225 kg N per ha), where yields are higher and the production season is longer than in Queensland [37]. However, the analysis in the present study did not take into account reallocation of N from the leaves, crown, and roots to the fruit or the N that accumulated in the flowers.
There were only small differences in soil N between the two N treatments from the beginning to the end of each experiment. Concentrations of soil N fluctuate widely depending on environmental conditions and are not used routinely to estimate the N requirements or potential yield of crops in Australia [29,38,39]. Niskanen and Dris [40] showed that there was a poor correlation between leaf and soil N concentrations in strawberry, and Bould [41] indicated that soil analysis was not satisfactory for predicting the response of crops such as strawberry to N.

5. Conclusions

The concentration of total N in the leaves decreased during the season from 3.0% to 2.0%, while the concentration of NO3-N decreased from 1200–3200 to 50–500 mg/kg. These changes were large enough to affect the diagnosis of deficiency or sufficiency in the plants. Yield peaked at a seasonal average of 2.25% to 2.50% N and 625 to 1320 mg/kg NO3-N. The concentration of total N was less variable than NO3-N and, therefore, better for measuring plant nutrient status. Nutrient monitoring needs to take into account the changes in leaf N over the season, which varies in different growing environments.

Acknowledgments

The Queensland government funded the research through the Department of Agriculture and Fisheries. Many thanks to the farm staff at Nambour for help with growing the strawberry plants.

Conflicts of Interest

The author declares no conflict of interest.

References

  1. Husaini, A.M.; Zaki, F.A. Strawberries: A general account. In Strawberry: Growth, Development and Diseases; Husaini, A.M., Neri, D., Eds.; CABI: Wallingford, UK, 2016; pp. 1–9. [Google Scholar]
  2. Hancock, J.F. Fragaria × ananassa. In The Encyclopedia of Fruit & Nuts; Janick, J., Paull, R.E., Eds.; CABI: Cambridge, MA, USA, 2008; pp. 651–661. [Google Scholar]
  3. Whitaker, V.M.; Price, J.F.; Peres, N.A.; Folta, K.M.; Noling, J.W. Current strawberry research at the University of Florida. Acta Hortic. 2014, 1049, 161–166. [Google Scholar] [CrossRef]
  4. Menzel, C.M.; Gomez, A.; Smith, L.A. Control of grey mould and stem-end rot in strawberry plants in a subtropical environment. Australas. Plant Pathol. 2016, 45, 489–498. [Google Scholar] [CrossRef]
  5. Whitaker, V.M.; Osorio, L.F.; Peres, N.A.; Fan, Z.; Herrington, M.; Nunes, M.C.N.; Plotto, A.; Sims, C.A. ‘Florida Beauty’ strawberry. HortScience 2017, 52, 1443–1447. [Google Scholar] [CrossRef]
  6. Albregts, E.E.; Howard, C.M.; Chandler, C.K. Effect of high N rates on fruiting strawberry. Soil Crop Sci. Soc. Fla. Proc. 1991, 50, 134–136. [Google Scholar]
  7. Albregts, E.E.; Howard, C.M.; Chandler, C.K.; Martin, F.G. Fruiting response of strawberry as affected by rates and sources of controlled release N fertilizer, and irrigation method. Soil Crop Sci. Soc. Fla. Proc. 1990, 49, 46–49. [Google Scholar]
  8. Hochmuth, G.J.; Albregts, E.E.; Chandler, C.K.; Cornell, J.; Harrison, J. Nitrogen fertigation requirements of drip-irrigated strawberries. J. Am. Soc. Hortic. Sci. 1996, 121, 660–665. [Google Scholar]
  9. Santos, B.M.; Chandler, C.K. Influence of nitrogen fertilization rates on the performance of strawberry cultivars. Int. J. Fruit Sci. 2009, 9, 126–135. [Google Scholar] [CrossRef]
  10. Miner, G.S.; Poling, E.B.; Carroll, D.E.; Nelson, L.A.; Campbell, C.R. Influence of fall nitrogen and spring nitrogen-potassium applications on yield and fruit quality of ‘Chandler’ strawberry. J. Am. Soc. Hortic. Sci. 1997, 122, 290–295. [Google Scholar]
  11. Kirschbaum, D.S.; Borquez, A.M.; Quipildor, S.L.; Correa, M.; Magen, H.; Imas, P. Nitrogen requirements of drip irrigated strawberries grown in subtropical environments. Acta Hortic. 2006, 567, 93–96. [Google Scholar] [CrossRef]
  12. Simonne, E.; Studstill, D.; Hochmuth, R.C. Understanding water movement in mulched beds on sandy soils: An approach to ecologically sound fertigation in vegetable production. Acta Hortic. 2006, 700, 173–178. [Google Scholar] [CrossRef]
  13. Hochmuth, G.; Maynard, D.; Vavrina, C.; Hanlon, E.; Simonne, E. Plant Tissue Analysis and Interpretation for Vegetable Crops in Florida; HS964; Institute of Food Agricultural Sciences, University of Florida Publishing: Gainesville, FL, USA, 1991; p. 48. [Google Scholar]
  14. Kwong, S.S.; Boynton, D. Time of sampling, leaf age and leaf fraction as factors influencing the concentrations of nutrient elements in strawberry leaves. Proc. Am. Soc. Hortic. Sci. 1959, 73, 168–173. [Google Scholar]
  15. Bottoms, T.G.; Bolda, M.P.; Gaskell, M.L.; Hartz, T.K. Determination of strawberry optimum ranges through diagnosis and recommendation integrated system analysis. HortTechnology 2013, 23, 312–318. [Google Scholar]
  16. Domínquez, A.; Martínez, E.; Trigo, A.; Alonso, D.; García, R. Seasonal changes in leaf mineral content may affect foliar diagnostic in strawberry. Acta Hortic. 2009, 842, 147–150. [Google Scholar]
  17. Locascio, S.J.; Martin, F.G. Nitrogen source and application timing for trickle irrigated strawberries. J. Am. Soc. Hortic. Sci. 1985, 110, 820–823. [Google Scholar]
  18. Jones, J.B., Jr.; Wolf, B.; Mill, H.A. Plant Analysis Handbook; Micro-Macro Publishing: Athens, OH, USA, 1991; p. 164. [Google Scholar]
  19. Ulrich, A.; Mostafa, M.A.E.; Allen, W.W. Strawberry Deficiency Symptoms. A Visual and Plant Analysis Guide to Fertilization; Agriculture Experiment Station University California Bulletin No. 1917; University of California, Division of Agricultural Sciences: Oakland, CA, USA, 1992; p. 42. [Google Scholar]
  20. Campbell, C.R.; Miner, G.S. Strawberry—Annual hill culture. In Reference Sufficiency Ranges for Plant Analysis in the Southern Region of the United States; Campbell, C.R., Ed.; North Carolina Department Agriculture Consumer Services South Co-operative Services Bulletin No. 394; N.C. Department of Agriculture and Consumer Services: Raleigh, NC, USA, 2000; pp. 111–112. [Google Scholar]
  21. Dale, A.; Walker, G.; Fisher, P. Growing Strawberries in Ontario; Ministry of Agriculture, Food and Rural Affairs: Toronto, ON, Canada, 2000; p. 17.
  22. Carroll, J.; Pritts, M.; Heidenreich, C. Production Guide for Organic Strawberries; No. 226; Co-operative Extension Cornell University New York State Integrated Pest Management Publishing: Geneva, NY, USA, 2010; p. 9. [Google Scholar]
  23. Bellomonte, G.; Costantini, A.; Giammarioli, S. Comparison of modified automatic Dumas method and the traditional Kjeldahl method for nitrogen determination in infant food. J. Assoc. Off. Anal. Chem. 1987, 70, 227–229. [Google Scholar] [PubMed]
  24. Sweeney, R.A.; Rexroad, P.R. Comparison of LECO FP-228 “nitrogen determinator” with AOAC copper catalyst Kjeldahl method for crude protein. J. Assoc. Off. Anal. Chem. 1987, 70, 1028–1030. [Google Scholar] [PubMed]
  25. Ott-Borrelli, K.A.; Koenig, R.T.; Miles, C.A. A comparison of rapid potentiometric and colormetric methods for measuring tissue nitrate concentrations in leafy green vegetables. HortTechnology 2009, 19, 439–444. [Google Scholar]
  26. Diel, M.I.; Pinheiro, M.V.M.; Cocco, C.; Fontana, D.C.; Caron, B.O.; de Paula, G.M.; Pretto, M.M.; Thiesen, L.A.; Schmidt, D. Phyllochron and phenology of strawberry cultivars from different origins cultivated in organic substrates. Sci. Hortic. 2017, 220, 226–232. [Google Scholar] [CrossRef]
  27. Gu, S. Growing degree hours—A simple, accurate, and precise protocol to approximate growing heat summation for grapevines. Int. J. Biometerol. 2016, 60, 1123–1134. [Google Scholar] [CrossRef] [PubMed]
  28. McMaster, G.S.; Wilhelm, W.W. Growing degree-days: One equation, two interpretations. Agric. For. Meteorol. 1997, 87, 291–300. [Google Scholar] [CrossRef]
  29. Rayment, G.E.; Lyons, D.J. Soil Chemical Methods—Australasia; CSIRO Publishing: Collingwood, Australia, 2011; pp. 93–144. [Google Scholar]
  30. MacKenzie, A.J.; Spencer, W.F.; Stockinger, K.R.; Krantz, B.A. Seasonal nitrate-nitrogen content of cotton petioles as affected by nitrogen application and its relationship to yield. Agron. J. 1963, 55, 55–59. [Google Scholar] [CrossRef]
  31. Christensen, P. Seasonal changes and distribution of nutritional elements in Thompson Seedless grapevines. Am. J. Vitic. 1969, 20, 176–190. [Google Scholar]
  32. Vos, J.; Bom, M. Hand-held chlorophyll meter: A promising tool to assess the nitrogen status of potato foliage. Potato Res. 1993, 36, 301–308. [Google Scholar] [CrossRef]
  33. Opstad, N. Mineral concentrations in leaf dry matter and leaf and petiole sap in strawberry depend on leaf age and plant development stage. Acta Hortic. 2010, 868, 143–148. [Google Scholar] [CrossRef]
  34. Campbell, W.H. Nitrate reductase and its role in nitrate assimilation in plants. Physiol. Plant. 1988, 74, 214–219. [Google Scholar] [CrossRef]
  35. Oosterhuis, D.M.; Bate, G.C. Nitrogen uptake of field-grown cotton. II. Nitrate reductase activity and petiole nitrate concentration as indicators of plant nitrogen status. Exp. Agric. 1983, 19, 103–109. [Google Scholar] [CrossRef]
  36. Taghavi, T.; Folta, K.M. A comparison of wild and cultivated strawberries for nitrogen uptake and reduction. Hortic. Environ. Biotechnol. 2014, 55, 196–206. [Google Scholar] [CrossRef]
  37. Bottoms, T.G.; Hartz, T.K.; Cahn, M.D.; Farrara, B.F. Crop and soil nitrogen dynamics in annual strawberry production in California. HortScience 2013, 48, 1034–1039. [Google Scholar]
  38. Strong, W.M.; Mason, M.G. Nitrogen. In Soil Analysis—An Interpretation Manual; Peverill, K.I., Sparrow, L.A., Reuter, D.J., Eds.; CSIRO: Collingwood, Australia, 1999; pp. 171–185. [Google Scholar]
  39. Glendinning, J.S. Australian Soil Fertility Manual; CSIRO Publishing: Collingwood, Australia, 1999; pp. 19–28. [Google Scholar]
  40. Niskanen, R.; Dris, R. Nutritional status of strawberry fields. Acta Hortic. 2002, 567, 439–442. [Google Scholar] [CrossRef]
  41. Bould, C. Soil and leaf analysis in relation to fruit nutrition. J. Sci. Food Agric. 1963, 14, 710–718. [Google Scholar] [CrossRef]
Figure 1. Effect of nitrogen on the accumulation of dry weight in the (A) leaves, (B) flowers and immature fruit, (C) crown, and (D) roots of ‘Festival’ strawberry plants grown in Queensland, Australia in 2015. Data are the means over two planting dates (mid- and late-April). Each symbol represents the mean of 12 replicates, and vertical bars represent ±1 SE. Paired means with an asterisk are significantly different at p = 0.05. Calculation of growing-degree days (GDDs) was based on a base temperature of 7 °C.
Agriculture 08 00126 g001
Figure 2. Effect of nitrogen (N) on changes in the concentration of total N and nitrate-N (NO3-N) in young, fully expanded leaves of strawberry plants grown in Queensland, Australia in 2014. Data are pooled over three cultivars (‘Festival’, ‘Fortuna’, and ‘Winter Dawn’). Each symbol represents the mean of 12 replicates. Paired means with an asterisk are significantly different at p = 0.05. Control: leaf N = 2.84 − 0.0007 × GDD (R2 = 0.95) and leaf NO3-N = 3003 × exp. (−0.0038 × GDD) (R2 = 0.87). Nitrogen treatment: leaf N = 2.94 − 0.0006 × GDD (R2 = 0.86) and leaf NO3-N = 3075 × exp. (−0.0019 × GDD) (R2 = 0.70). Calculation of growing-degree days (GDDs) was based on a base temperature of 7 °C.
Agriculture 08 00126 g002
Figure 3. Effect of nitrogen (N) on the changes in the concentration of total N and nitrate-N (NO3-N) in young, fully expanded leaves of ‘Festival’ strawberry plants grown in Queensland, Australia in 2015. Data are pooled over two planting dates (mid- and late-April). Each symbol represents the mean of 12 replicates. Paired means with an asterisk are significantly different at p = 0.05. Control: leaf N = 2.70 − 0.0008 × GDD (R2 = 0.89) and leaf NO3-N = 1181 × exp. (−0.0055 × GDD) (R2 = 0.88). Nitrogen treatment: leaf N = 3.05 − 0.0009 × GDD (R2 = 0.99) and leaf NO3-N = 2079 × exp. (−0.0018 × GDD) (R2 = 0.94). Calculation of growing-degree days (GDDs) was based on a base temperature of 7 °C.
Agriculture 08 00126 g003
Figure 4. Relationship between relative yield and the average seasonal concentration of total nitrogen (N) and nitrate-N (NO3-N) in young, fully expanded leaves of strawberry plants grown in Queensland, Australia in 2014 and 2015. Each symbol represents the mean of four or six replicates per treatment. Control = no nitrogen; Nitrogen = fertilised with nitrogen; FV = Festival; FT = Fortuna; WD = Winter Dawn; EP = early planting; and LP = late planting. Leaf N: relative yield = 23.12 + 20.3 × leaf N − 4.27 × (leaf N)2 (R2 = 0.90). Leaf NO3-N: relative yield = 0.4852 + 0.0010 × leaf NO3-N − 0.0000005 × (leaf NO3-N)2 (R2 = 0.89).
Agriculture 08 00126 g004
Table 1. Effects of nitrogen fertiliser on the yield of three strawberry cultivars grown in Queensland, Australia in 2014.
Yield (g Fresh wt per Plant)
CultivarNitrogenControlAvg
Festival766908837
Fortuna679830754
Winter Dawn715875795
Avg720871
SignificanceNitrogen *Cultivar nsN × cultivar ns
ns,* Non-significant and significant at p ≤ 0.05, respectively.
Table 2. Effects of nitrogen fertiliser and planting date on the yield of ‘Festival’ strawberry grown in Queensland, Australia in 2015.
Yield (g Fresh wt per Plant)
Planting DateNitrogenControlDifference
Mid-April1123795328 *
Late-April1037859221 *
Difference86 *−64 ns
SignificanceNitrogen *Planting date nsN × date *
ns,* Non-significant and significant at p ≤ 0.05, respectively.

