Review

SOC Stock Changes and Greenhouse Gas Emissions Following Tropical Land Use Conversions to Plantation Crops on Mineral Soils, with a Special Focus on Oil Palm and Rubber Plantations

1
School of Agriculture and Food Sciences, The University of Queensland, St Lucia, QLD 4072, Australia
2
Institute of Botany and Landscape Ecology, University of Greifswald, partner in the Greifswald Mire Centre, 17487 Greifswald, Germany
3
The Mullion Group, Canberra, ACT 2607, Australia
4
Advanced Agriecological Research Sdn. Bhd., 47810 Petaling Jaya, Selangor Darul Ehsan, Malaysia
*
Author to whom correspondence should be addressed.
Agriculture 2018, 8(9), 133; https://doi.org/10.3390/agriculture8090133
Submission received: 15 July 2018 / Revised: 17 August 2018 / Accepted: 29 August 2018 / Published: 1 September 2018
(This article belongs to the Special Issue Soil Organic Carbon)

Abstract

:
The increasing global demand for vegetable oils has resulted in a significant increase in the area under oil palm in the tropics during the last couple of decades, and this is projected to increase further. The Roundtable on Sustainable Palm Oil discourages the conversion of peatlands to oil palm and rubber plantations. However, our understanding of the effects on soil organic carbon (SOC) stocks and associated greenhouse gas (GHG) emissions of land use conversion is incomplete, especially for mineral soils under primary forests, secondary forests, rubber and other perennial plantations in the tropics. In this review we synthesised information on SOC stocks and GHG emissions from tropical mineral soils under forest, oil palm and rubber plantations and other agroecosystems across the tropical regions. We found that the largest SOC losses occurred after land use conversion from primary forest to oil palm and rubber plantations. Secondary forest and pasture lands showed lower SOC losses as well as total GHG (CO2, N2O and CH4) emissions when converted to oil palm and rubber plantations. However, due to the limited data available on all three GHG emissions, there remains high uncertainty in GHG emissions estimates, and regional GHG accounting is more reliable. We recommend long-term monitoring of oil palm and other perennial plantations established on tropical mineral soils on different soil types and regions on SOC stock changes and total GHG emissions and evaluate appropriate management practices to optimise production and sustainable economic returns, and minimise environmental impact.

1. Introduction

The increasing global demand for vegetable oils has resulted in a significant increase in the area under oil palm during the last decade, and this is projected to increase further [1]. Its expansion in the major producer and exporter countries, for example, Indonesia and Malaysia in Southeast Asia, involves significant conversion of tropical forest lands and creates environmental and social concerns, which are not limited to climate change effects [2,3,4,5,6,7,8,9].
Our understanding of the effects on soil carbon stocks of conversion of various land use types including tropical forests is still incomplete or even contradictory, especially for mineral soils [10,11] (more studies are available for peat soils [12,13,14]). Because of the very high emissions of major greenhouse gases (carbon dioxide CO2, nitrous oxide N2O and methane CH4) associated with the conversion of peatlands to oil palm and rubber plantations [12], conversion will increasingly focus on mineral soils [8]. For the purpose of this review, mineral soils contain ≤20% organic carbon (C) by weight, and ≤12% organic C if the mineral fraction contains no clay, and for each 1% increase in clay, organic C increases by 0.1% for up to 60% clay (18% organic C), and have more than 20% by volume mineral soil materials in the 0–50 cm depth or to a densic, lithic or paralithic contact, whichever is shallowest [15].
Relevant ecosystems include primary forests, secondary forests, rubber and other plantations, shrub lands, savannah, grasslands and croplands; all of these ecosystems carry different aboveground and belowground carbon stocks, including soil organic carbon (SOC) stocks [16]. Change in land use from these ecosystems may result in a change in SOC stock. The amount and time course of such SOC stock changes and associated greenhouse gas (GHG) emissions are poorly known for most land use systems on tropical mineral soils. In this review we synthesise information on soil carbon stocks and GHG emissions from tropical mineral soils under forest, oil palm and rubber plantations and other agroecosystems of land uses across the tropical regions (details available in the tables in the Supplementary Materials for subtropical and tropical (30° N–30° S) regions).
SOC stocks and GHG emissions differ substantially between the original forests on mineral soils and the subsequent agroecosystems, following land use change [9,16,17]. We reviewed the changes in SOC stocks (0–30 cm) and soil GHG emissions following tropical forest conversion on mineral soil. A comprehensive literature search was performed covering (i) SOC stocks and (ii) GHG emissions under variety of ecosystems and adjacent relatively undisturbed lands, and other land uses on tropical mineral soils, including oil palm and rubber plantations. These data originated from either standard soil sampling methodologies using up-to-date analytical procedures to measure SOC concentration, measured or default bulk density values to estimate SOC stocks from SOC concentration, or from directly measured GHG emissions.

2. Materials and Methods

We compiled 273 studies from 87 publications, mostly from peer-reviewed journals on SOC stocks (SOC concentrations × bulk density × depth, usually 0–30 cm depth) and fewer dataset on greenhouse gas emissions (N2O and CH4) from the tropical mineral soils undergoing land use change, especially for oil palm and rubber plantations (See Tables S1–S10; [9]). Wherever SOC stocks were not available, these were calculated from the SOC concentrations, soil depth and estimated bulk density using pedo-transfer functions (see Supplementary Materials). When the bulk density values differ between the previous land use and the current land use or through time, the SOC stocks were calculated on equivalent soil mass basis [18]. The change in CO2 emissions due to land use change was calculated from the change in SOC stocks from previous land use change (mostly from the adjacent relatively undisturbed land) and that under plantations (a paired-site approach) or from different periods the land has been under similarly-managed plantation (chronosequence approach). The limitations of both paired-site and chronosequence approaches in relation to SOC stocks and greenhouse gas emissions dataset are discussed in detail in the Supplementary Materials.
We collated different datasets on SOC stocks (measured or calculated) and statistically analysed them to report the mean and standard error of the mean values (Tables S1–S10). If the data were not normally distributed, log transformation was used before statistical analysis, especially for the N2O and CH4 emissions dataset, and back-transformed values were reported.
The limitations of the dataset and assumptions made in paired-site sampled data are fully discussed in the Supplementary Materials. The paired-site approach is less rigorous when unpredictable changes occur in soil as a consequence of development and management for plantations following land use change such as extensive soil erosion. This is further discussed in the review. In the chronosequence approach we assumed that similar management practices were employed for either oil palm plantations or rubber plantations. We separated the previous land use into two categories, primary forest and secondary forest before conversion to plantations. Since SOC stock losses from the primary forest were much higher than that from the secondary forest we used the relative SOC stock change with time under the plantations. The relative SOC stock change percentage was calculated using a difference between SOC stocks of the two land uses (converted land use minus previous land use), divided by SOC stock of the previous land use and was multiplied by 100.

3. Effects of Land Use Change on SOC Stocks

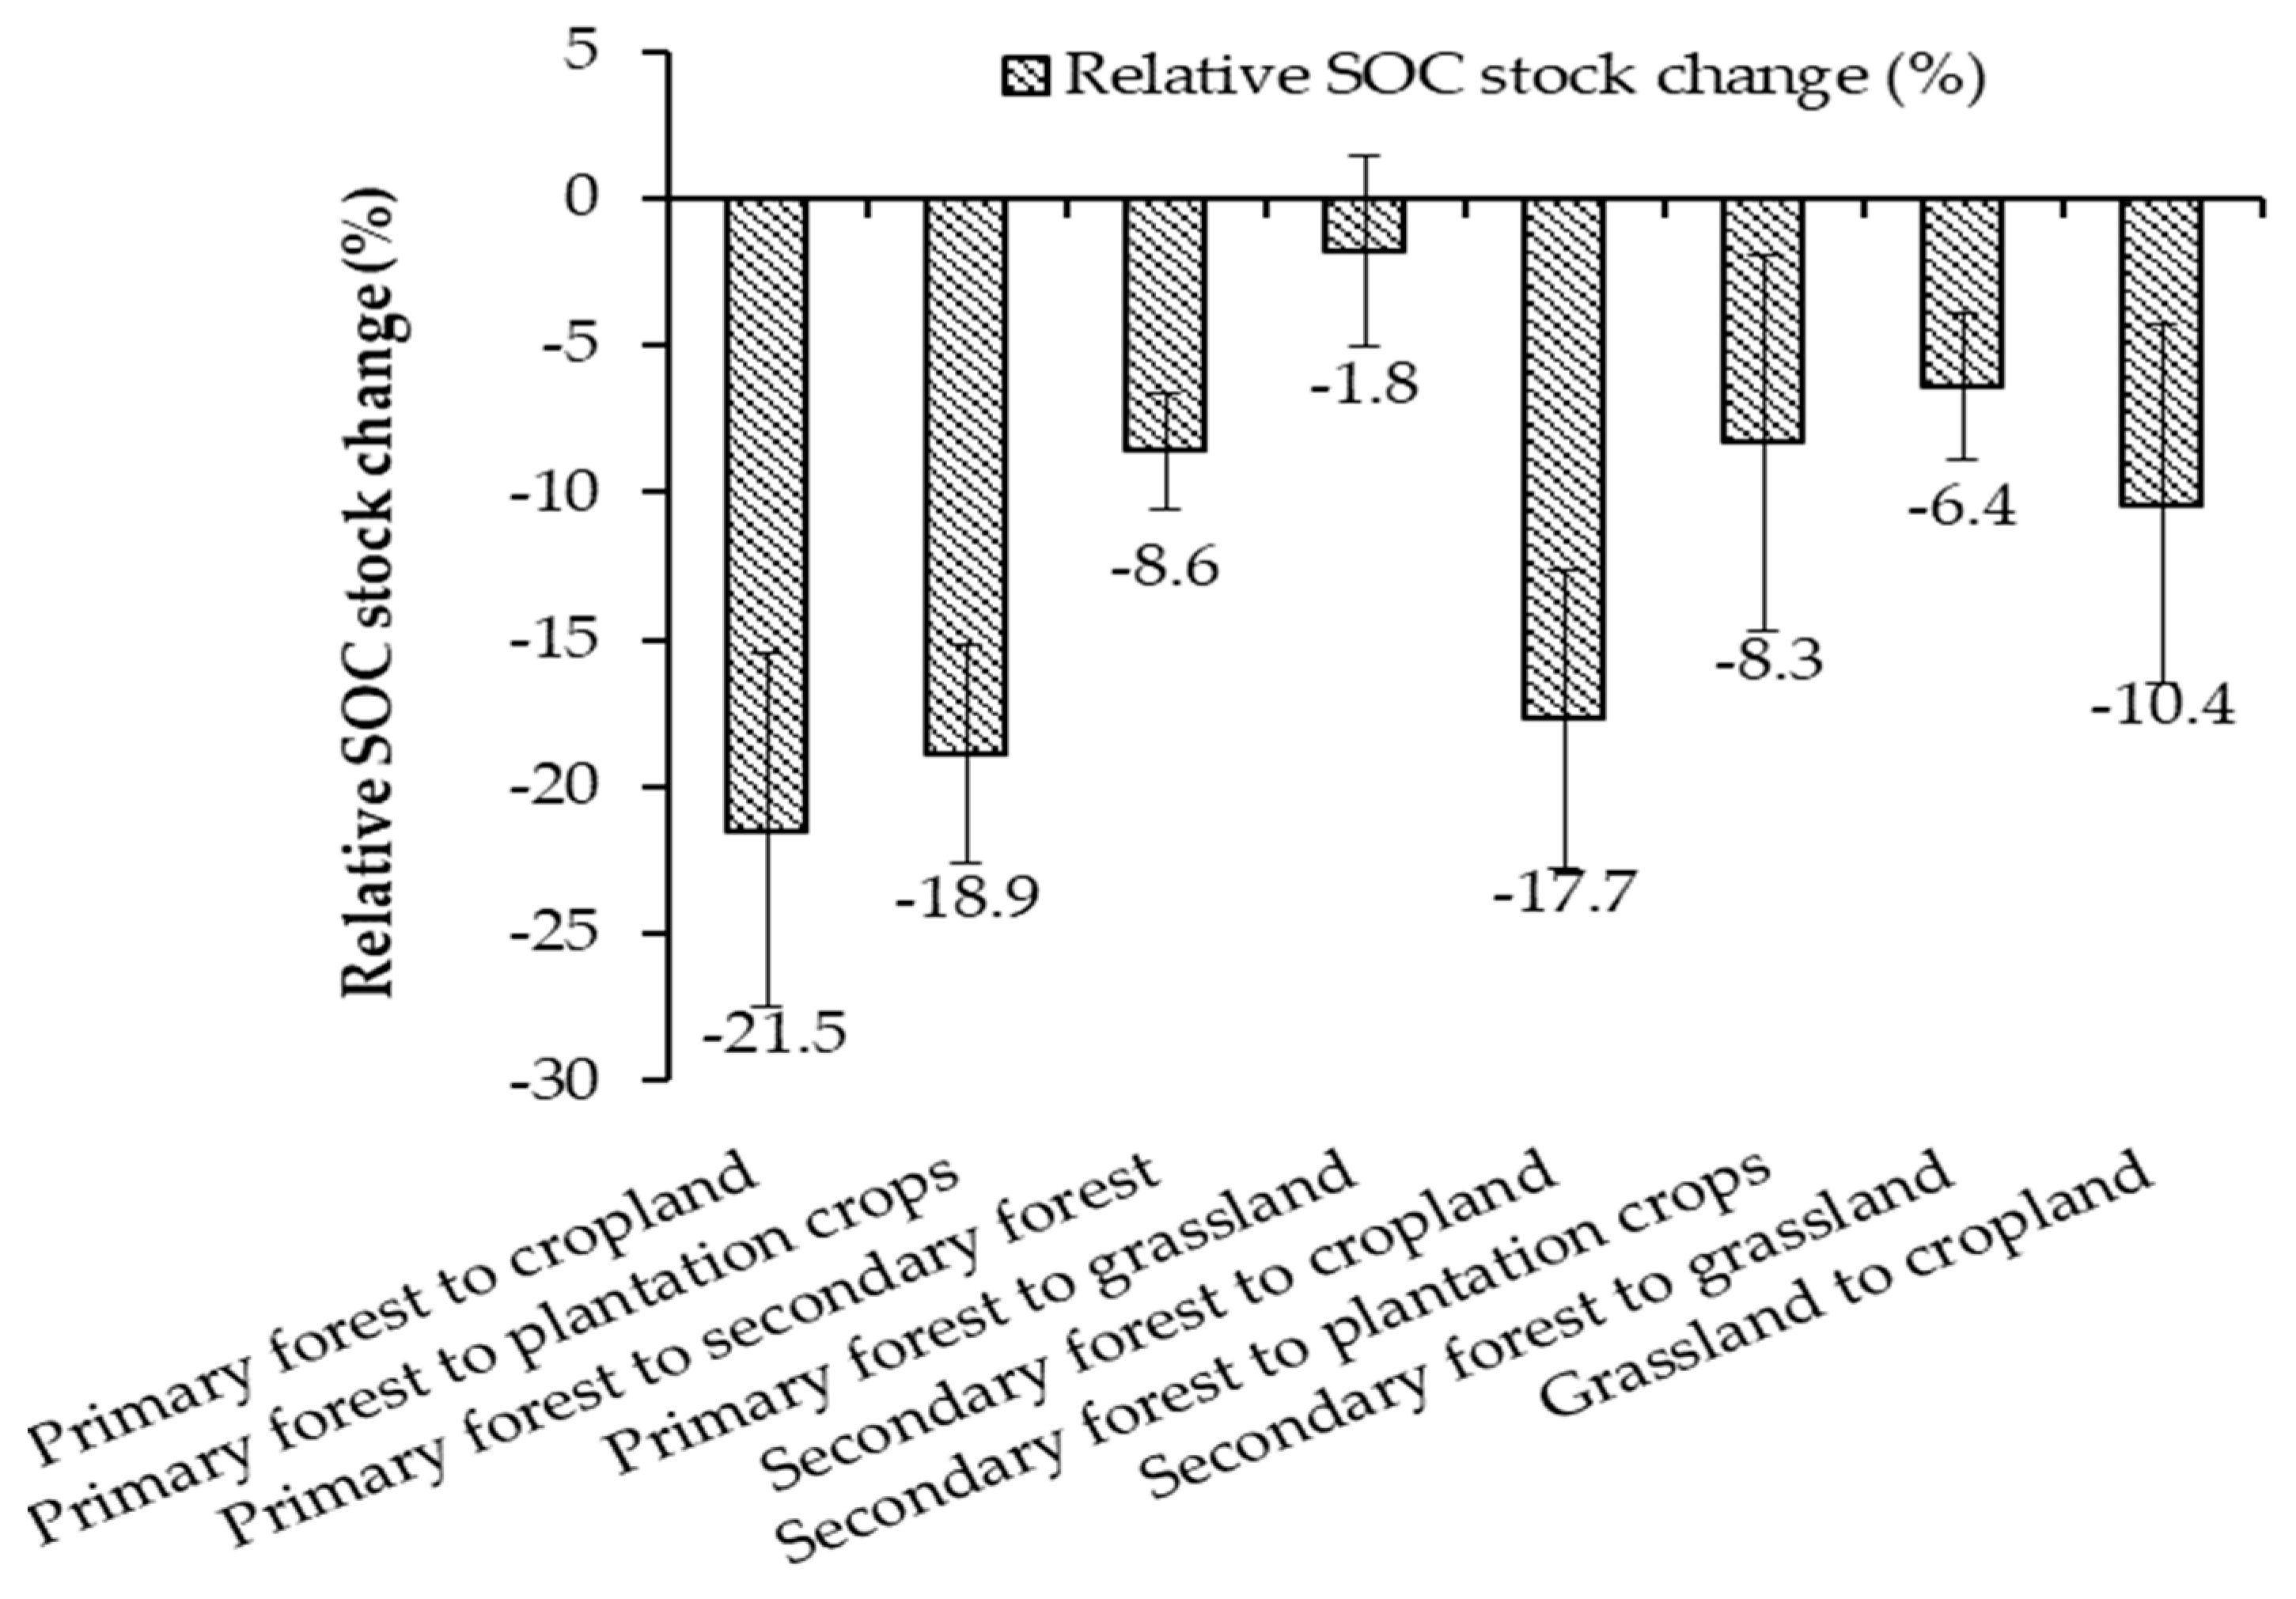
3.1. SOC Stocks under Different Ecosystems and Land Use Conversions

SOC stocks are influenced by vegetation characteristics, such as root distribution with depth and root biomass as well as litter quality (chemical composition) and quantity. Both below-ground and above-ground C stocks vary widely between ecosystems and types of land use. Aboveground C is usually the highest (>200 t C/ha) in tropical forests and lowest (<5 t C/ha) in grasslands; yet, SOC stocks in the latter are still considerable and exceed 100 t C/ha (0–1.0 m depth) [19].
Forests play an important role in supplying large amounts of organic matter (e.g., forest surface litter and root biomass) to the terrestrial soil C pool. Tropical forests typically store similar amounts of carbon in their soil as in their vegetation. It is estimated that approximately 12% of all native vegetation on the earth surface (15.12 × 10⁹ ha) are tropical forests (1.76 × 10⁹ ha; [20]). Globally, tropical forests store nearly 212 Gt C in their biomass and a similar amount belowground as SOC (216 Gt C), making a total C of 428 Gt C [19,20]. Tropical rainforests have an average SOC stock of 243 t C/ha at 0–1.0 m soil depth [19]. Mature forests still accumulate 0.37 t C/ha/year, possibly due to CO2 fertilisation and atmospheric N deposition, and therefore, tropical forests act as the largest terrestrial C sink [19].
In undisturbed ecosystems, addition of aboveground and belowground biomass either maintains or increases the SOC stock depending on the prevailing climate, temperature, soil and vegetation, and most importantly the time since the most recent disturbance. C inputs change considerably when natural ecosystems are converted to agricultural land use.
The SOC changes following land use change vary widely, but seem to be consistent within a given soil type and region [17,21,22]. A detailed analysis of the effect of major land use change on the SOC stock (0–30 cm) in tropical mineral soils showed that the highest losses occurred when primary forests were converted into cropland (−32 t C/ha) or perennial and plantation crops (−21 t C/ha), decreasing by −21.5% ± 6% and −18.9% ± 4%, respectively (Figure 1). Low SOC stock losses were observed when primary forests were converted into grassland (−9 t C/ha or −1.8% ± 3%) or secondary forests (−8 t C/ha or −8.6% ± 2%). When secondary forests were converted into cropland, the SOC losses were −17.7% ± 5%, while conversion into grassland or perennial and plantation crops SOC losses were −6.4% ± 3% to −8.3% ± 6% only. Land use change from grassland to cropland resulted in SOC losses of about −7 t C/ha or −10.4% ± 6% (Figure 1). The observed SOC losses were primarily due to reduced C inputs to the soil besides accelerated decomposition after disturbance, although SOC removal by erosion cannot be ruled out [23], especially when primary forests are converted into lands used for annual cropping [17,21,22].
If land use change results in increased C inputs compared with the previous land use and losses remain similar, then the SOC stock increases. Such increase was observed when cropland was converted into grassland, bush fallow or secondary forest, showing SOC stock increase of 16, 14 and 35 t C/ha, or 26% ± 11%, 32% ± 16% and 50% ± 12%, respectively [17]. Smaller SOC increase occurred when grassland was converted into secondary forest (10 t C/ha or 17%) [17].
The magnitude and rate of SOC losses depend on the time since conversion since most of the losses occurred in the initial years (following an exponential decay rate, Equation S1). As a result, the actual loss strongly depends on the initial stock, which may vary within land cover classes [17]. For example, Bahr et al. [24], using a chronosequence approach in the Southern Ecuadorian Andes, found higher SOC stocks in 5–10 years old new perennial croplands and pasture lands than in a reference forest land. However, the actual forest conversion by slash-and-burn had resulted in a 14–19% decrease of SOC stocks (0–30 cm depth) in the first five years, irrespective of the established land use (annual: maize, tapioca; perennial: banana, coffee, cacao, pasture). Also, when using the repeated sampling method the initial period of the land use change must be included and ideally be sampled at higher frequency due to inherent spatial heterogeneity [25].
Conversion of a primary forest to an oil palm plantation results in a decrease of the SOC stock of 23% ± 21%. However, SOC loss is generally negligible when a secondary forest is converted to an oil palm plantation, with a decrease of only 1% ± 26% but with very high variability (Table 1). However, the SOC losses after conversion from primary and secondary forest to rubber plantations were 14% ± 37% and 16% ± 9%, respectively (Table 1). SOC losses were smaller (7 t C/ha or 12% ± 27%) when oil palm plantation was established on degraded pasture/grasslands. However, larger SOC losses (up to 18 t C/ha or 31% ± 20%) occurred when oil palm replaced traditional slash-and-burn cropping/ swidden agriculture systems (Table 1). Moreover, land use change to oil palm plantation may result in SOC losses in association with heavily mechanized land preparation [26]. Van Straaten et al. [22] analysed data collected from the deforested, tropical mineral soil regions of Indonesia, Cameroon and Peru and cautioned that the converted plantation tree crops (oil palm, rubber and cacao) could have up to 50% loss of SOC stocks from the original land use; the study predicted that higher the initial SOC stock, higher the loss on conversion and hence suggested using a revised (IPCC 2006 tier 1 method [27]) SOC change factor of 0.6 ± 0.1 (40% SOC loss) for oil palm and 0.8 ± 0.3 (20% SOC loss) for rubber plantations.
Soil fertility of the converted land can be recovered over time if sufficient fertilizer and organic inputs are supplied in addition to appropriate intercropping [28,29] until a larger oil palm canopy cover is established.

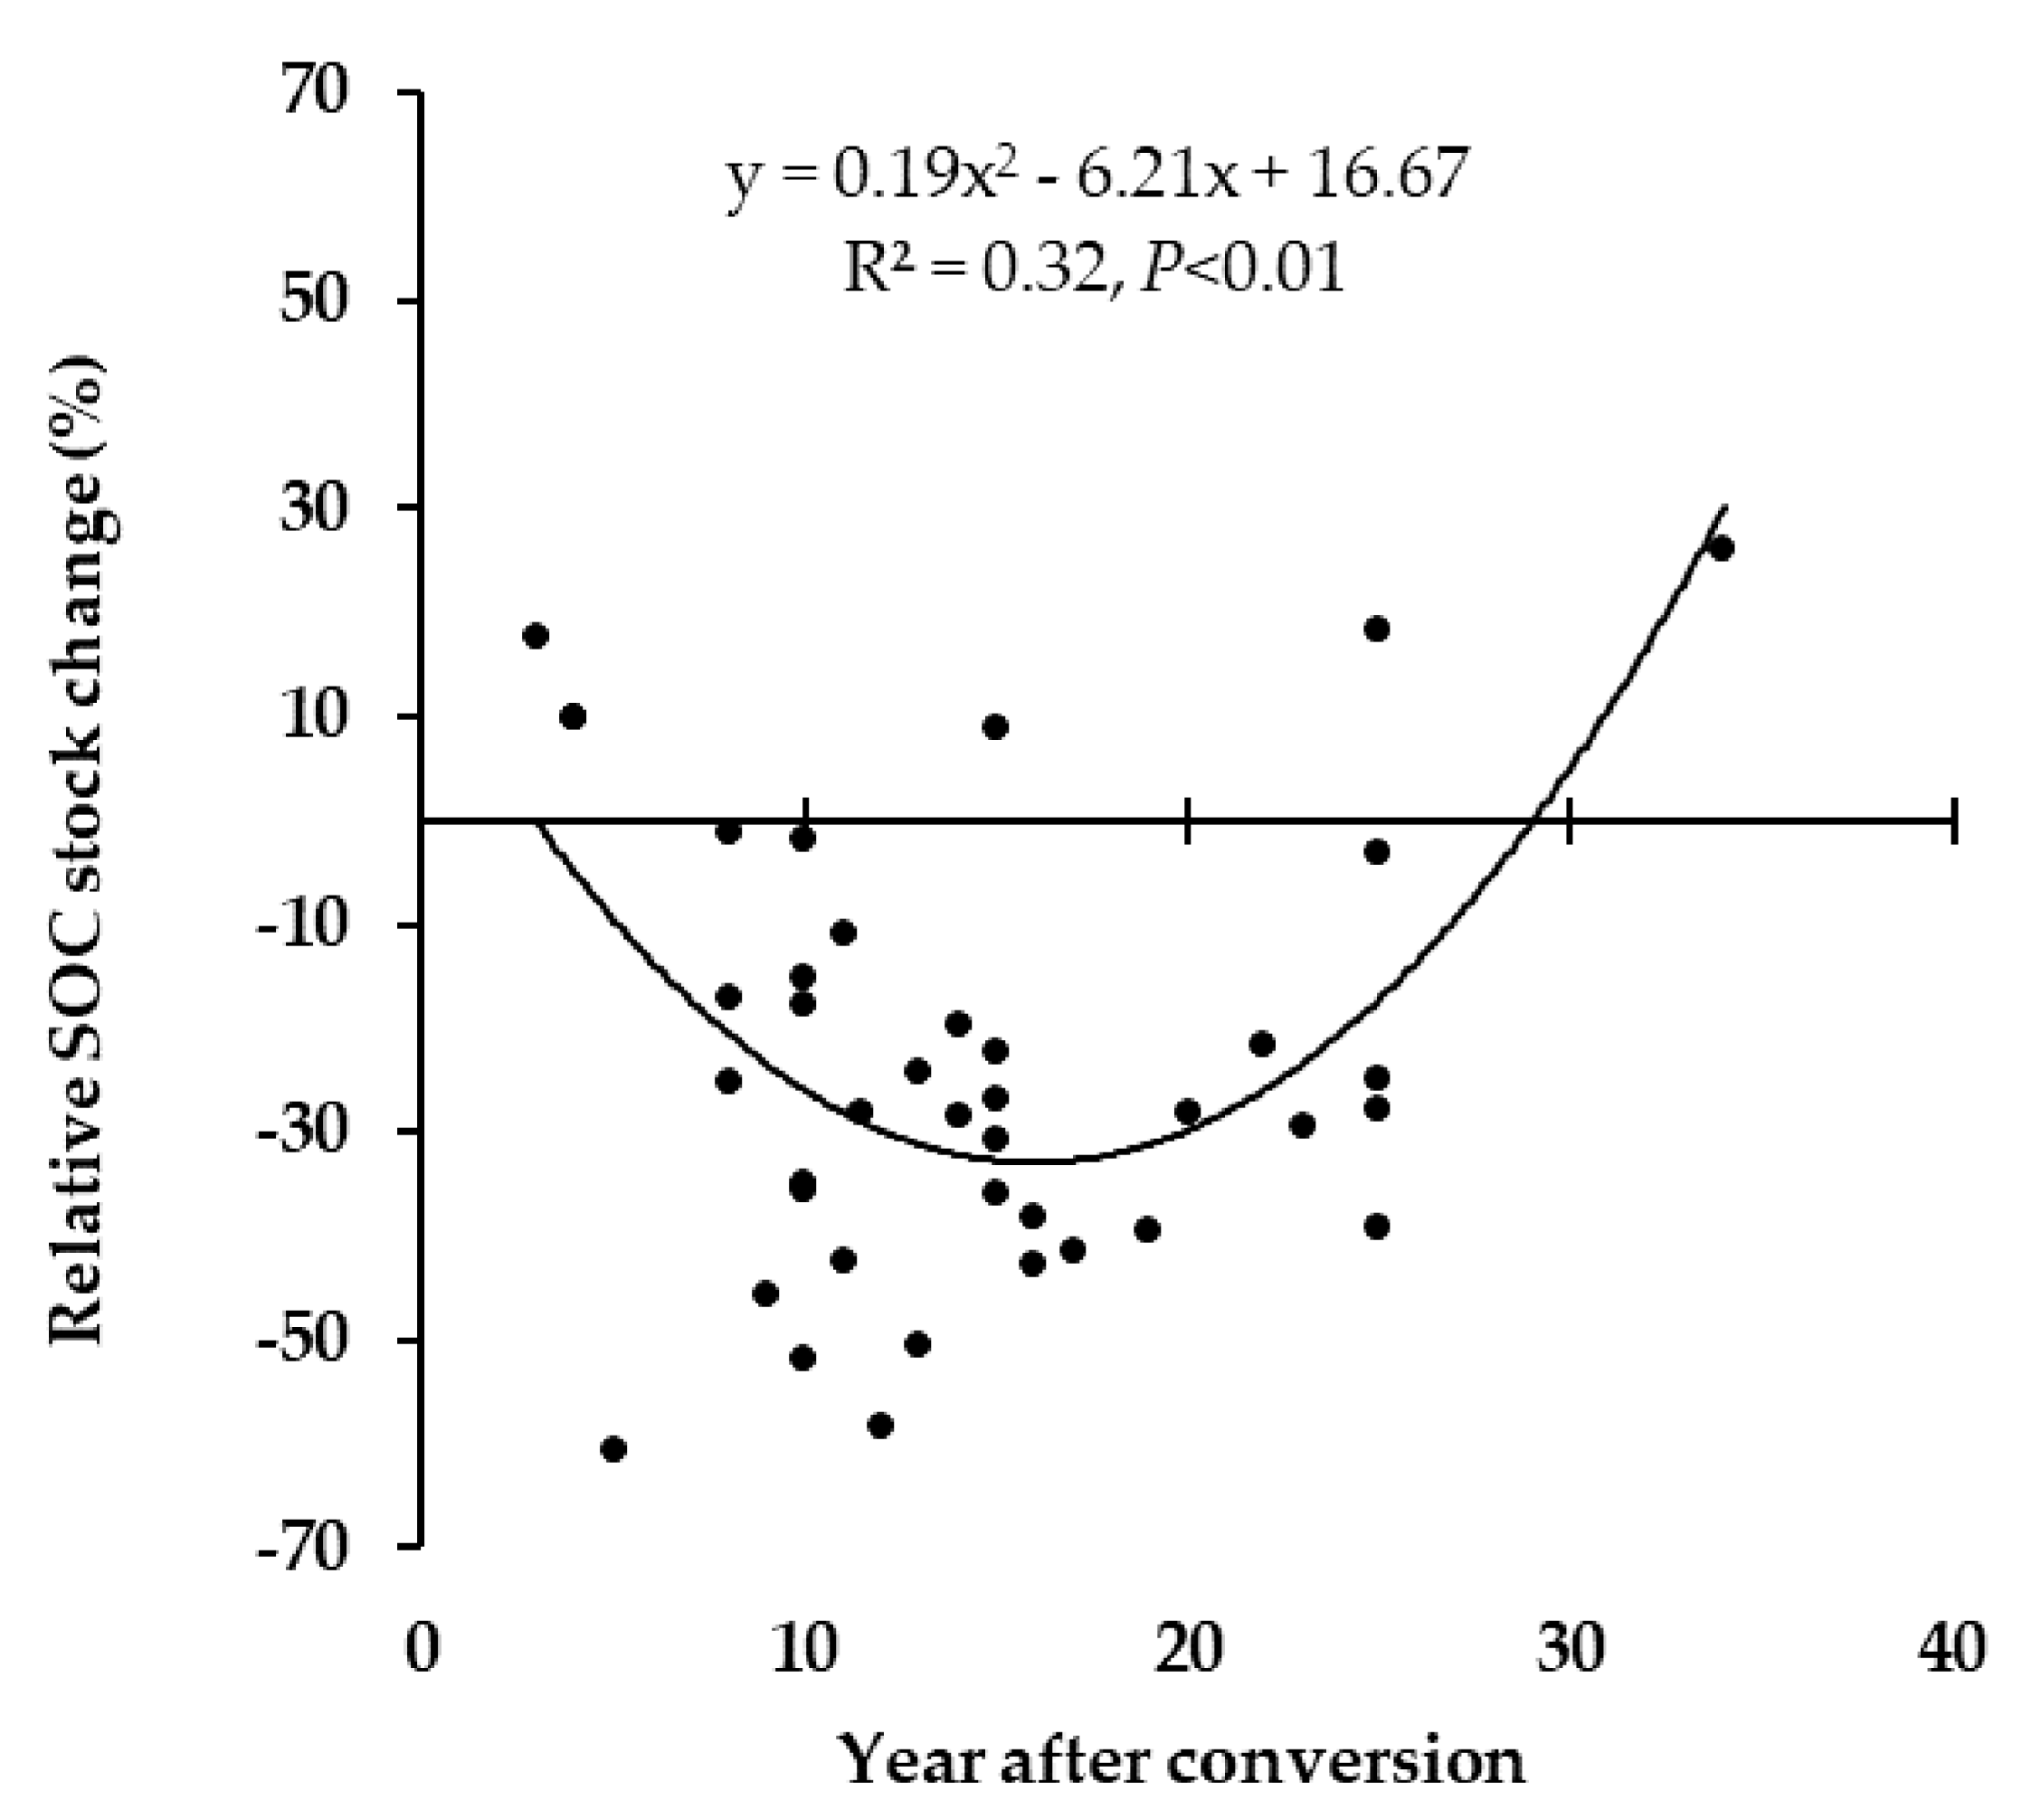
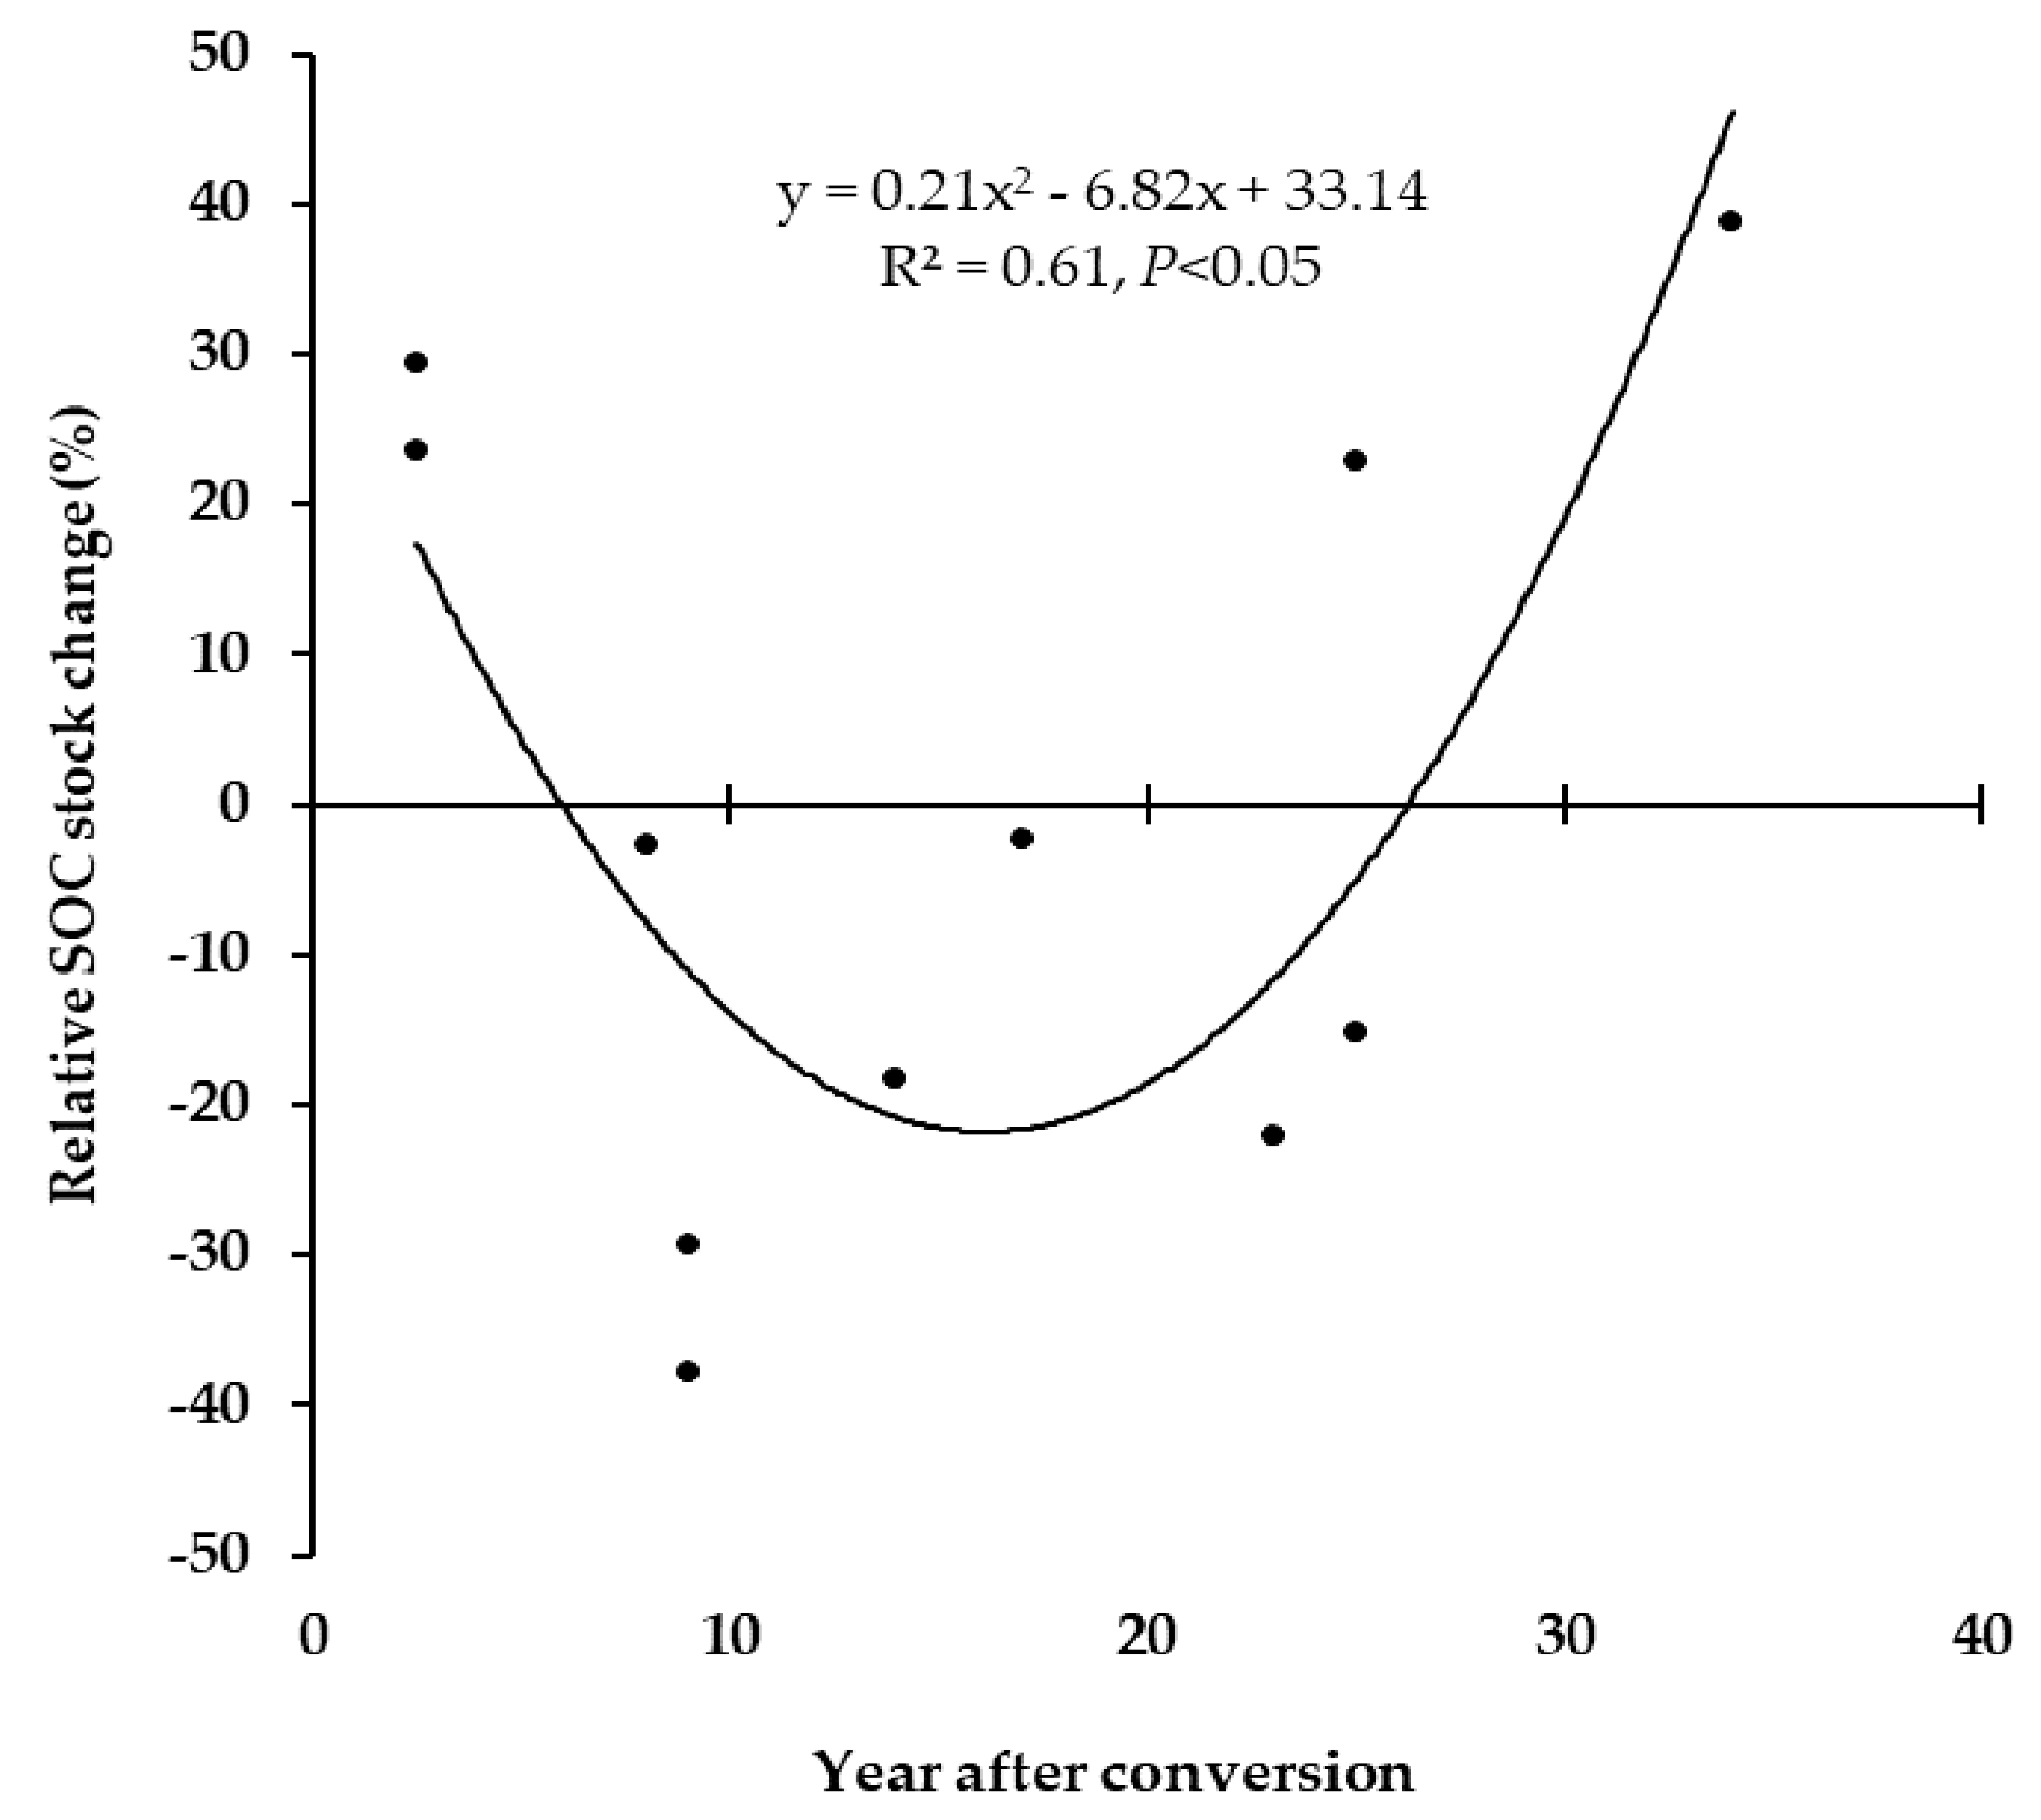
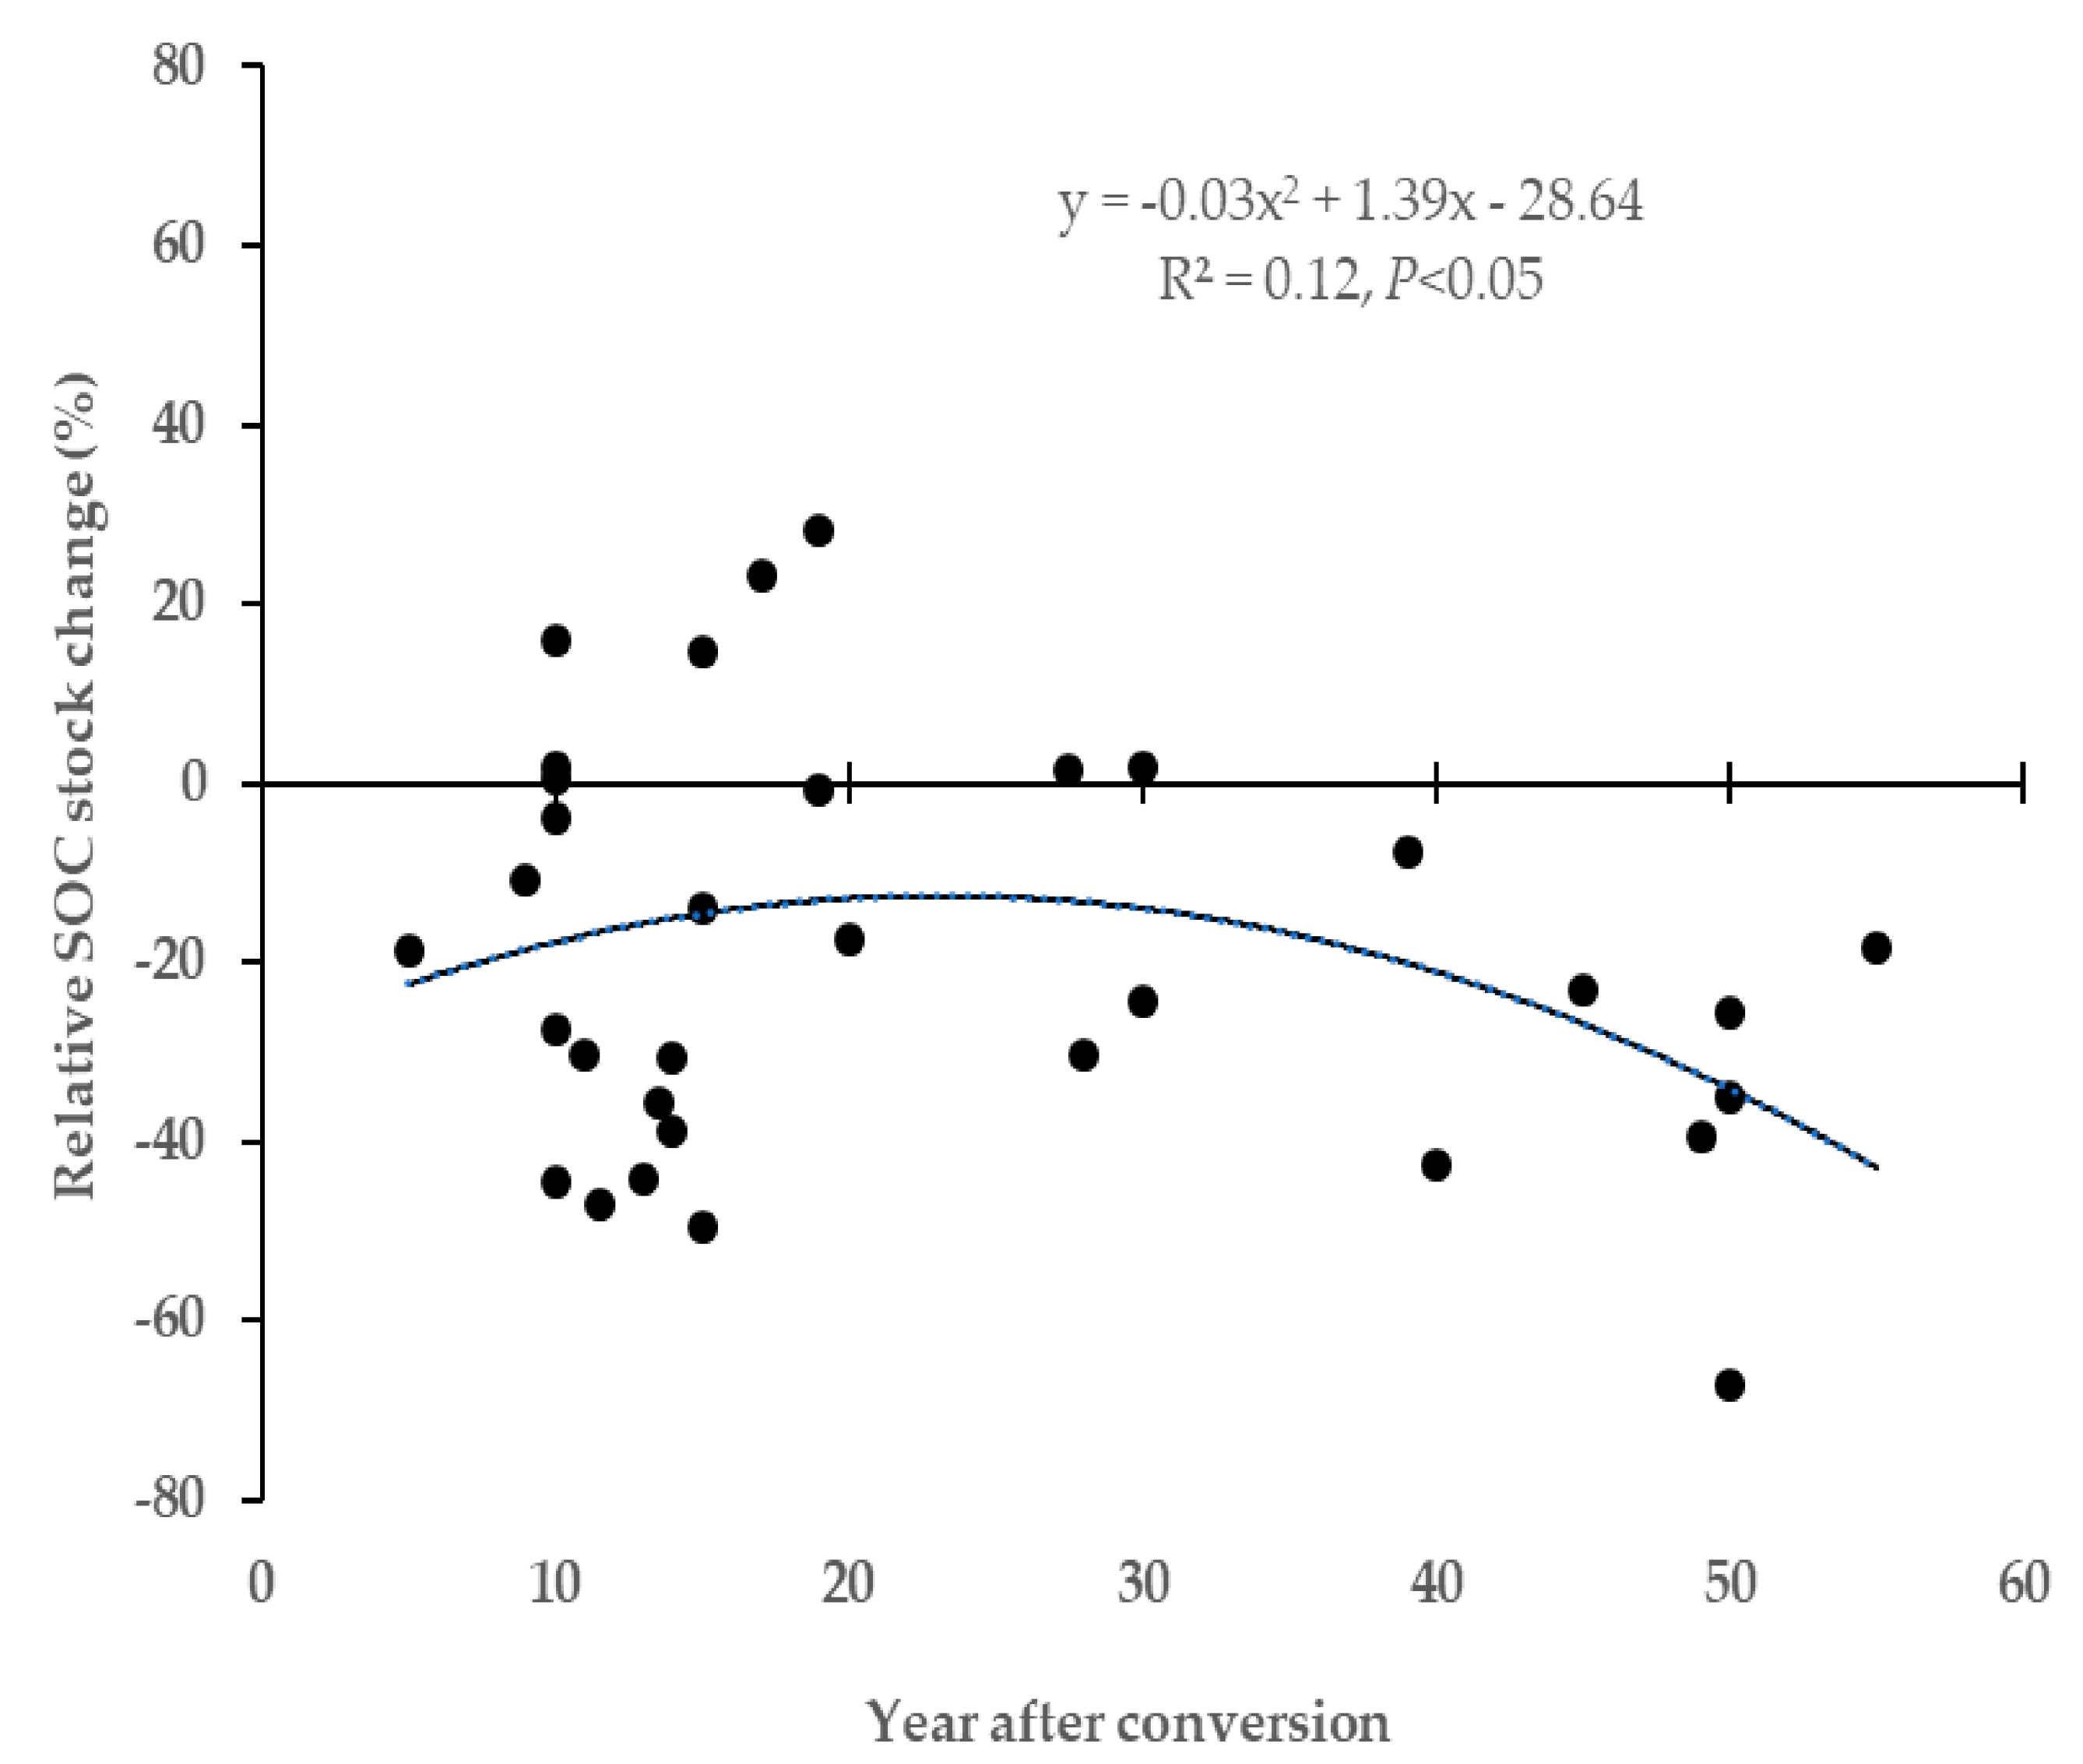
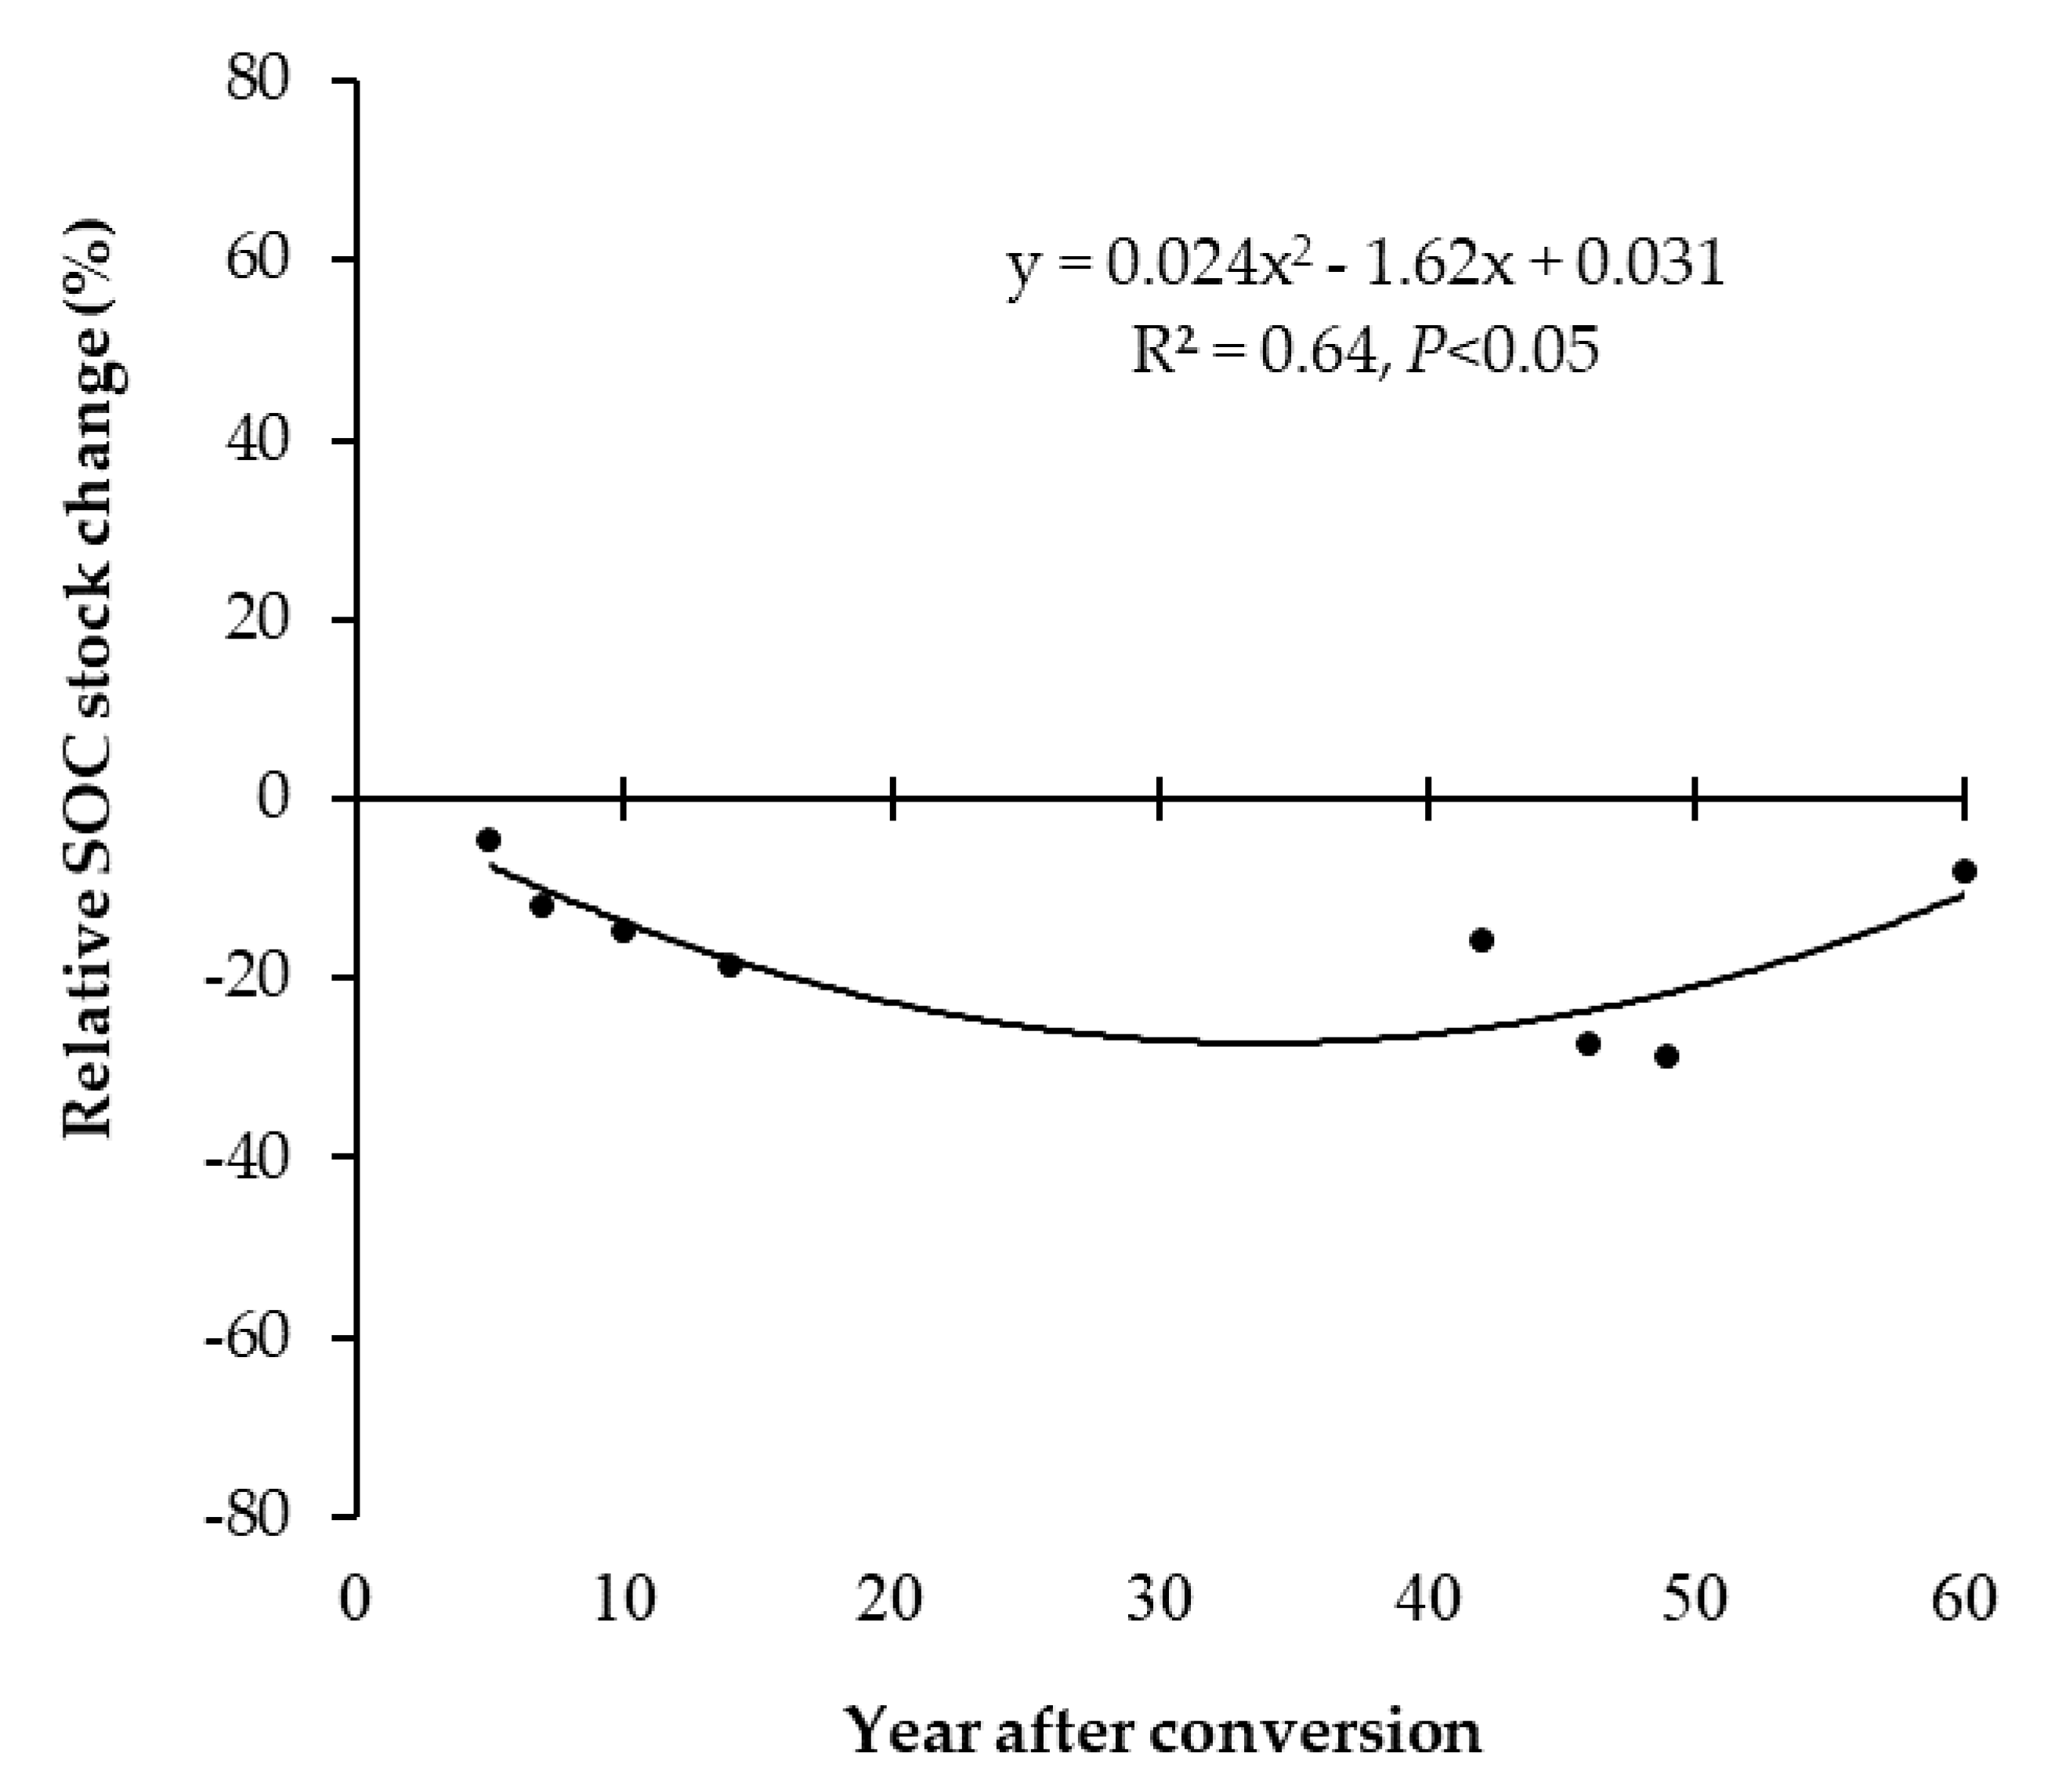
3.2. Time Trend in SOC Changes Following Land Use Change

From our analysis of the SOC stocks reported in Table 1, we further examined the time-trend in SOC stocks after land use conversion to plantations. The relative SOC stock changes over the years after conversion from forests to oil palm and rubber plantations on tropical mineral soils are shown in Figure 2, Figure 3, Figure 4 and Figure 5, respectively, using the data listed in Tables S1–S4.
Conversion of both primary and secondary forests to oil palm plantations resulted in an initial decrease of the relative SOC stock, shown in Figure 2 and Figure 3, respectively, which reached the maximum loss at 16 years after establishment of the oil palm plantations. This period generally coincides with the maximum oil palm yield, hence maximum biomass removal from the site [30,31,32,33]. The SOC stocks then gradually increased and attained the original level between 25 and 30 years in oil palm plantations (Figure 2 and Figure 3), approximately the maximum period considered for oil palm plantation. Considering the spread of the relative SOC stock data, we draw two tentative conclusions: (i) for assessing the changes in SOC stocks due to land use change (for example [17]) the period since land use conversion should be reported; and (ii) the replantation after the first oil palm plantation cycle should involve minimum soil disturbance (such as no-till and retain land cover) so as to maintain the restored SOC levels. Additional dataset on SOC stocks are required from monitored oil palm plantation sites over a number of years to draw firm conclusions and make recommendation.
The time trends in changes in relative SOC stocks in rubber plantations were more variable than that in oil palm plantation. Moreover, generally the relative SOC stocks remained below the original SOC stocks for over 60 years (Figure 4 and Figure 5). The conversion of primary forest to rubber plantation initially lost SOC stock and then gained somewhat around 25 years and slowly decreased again 55 years (Figure 4). The conversion of secondary forest to rubber plantation resulted in a gradual decrease of SOC stock and peaks its maximum loss at around 34 years and then slowly regained the SOC stock to close to original value between 60 and 70 years (Figure 5). However, because of wide spread of the dataset the trends in relative changes in SOC stocks were not clearly defined and therefore, no conclusions could be made. Again, additional dataset on SOC stocks are required from monitored rubber plantation sites over a number of years to draw firm conclusions. Moreover, provided there is enough dataset from different soil types the time trends in SOC dataset should be examined within a given soil type since soil minerals exert considerable influence in SOC stabilisation and loss.
The SOC stock-time trends in oil palm plantation usually follow the stage of growth of oil palm. The peak palm oil yield is usually attained by 12 years. The oil palm trees are destroyed and replanted after 25–30 years. At that point trunks and fronds can be recycled into the soil to replenish the SOC stock to a variable extent [30,31,33,34,35,36,37,38,39]. Generally, 96% of the total annual net primary production (dry biomass) is stored in aboveground parts such as the trunk, fronds and bunches [32,40]. Aboveground plant C input to the soil is brought about by recycling pruned fronds and other biomass into the soil during the plantation life cycle [29,41,42,43,44]. However, since fronds are usually stacked in every second row, this results in spatial variability in SOC stocks. For example, Frazão et al. [42] found that SOC stocks were 1.7–2.6 times higher under frond piles than in the inter-rows, after 24–34 years age of plantations. However, insight into the efficiency of pruned frond conversion to SOC for different aged oil palm plantations is thus far lacking and cultivation practices are too variable to draw firm conclusions [29,42].

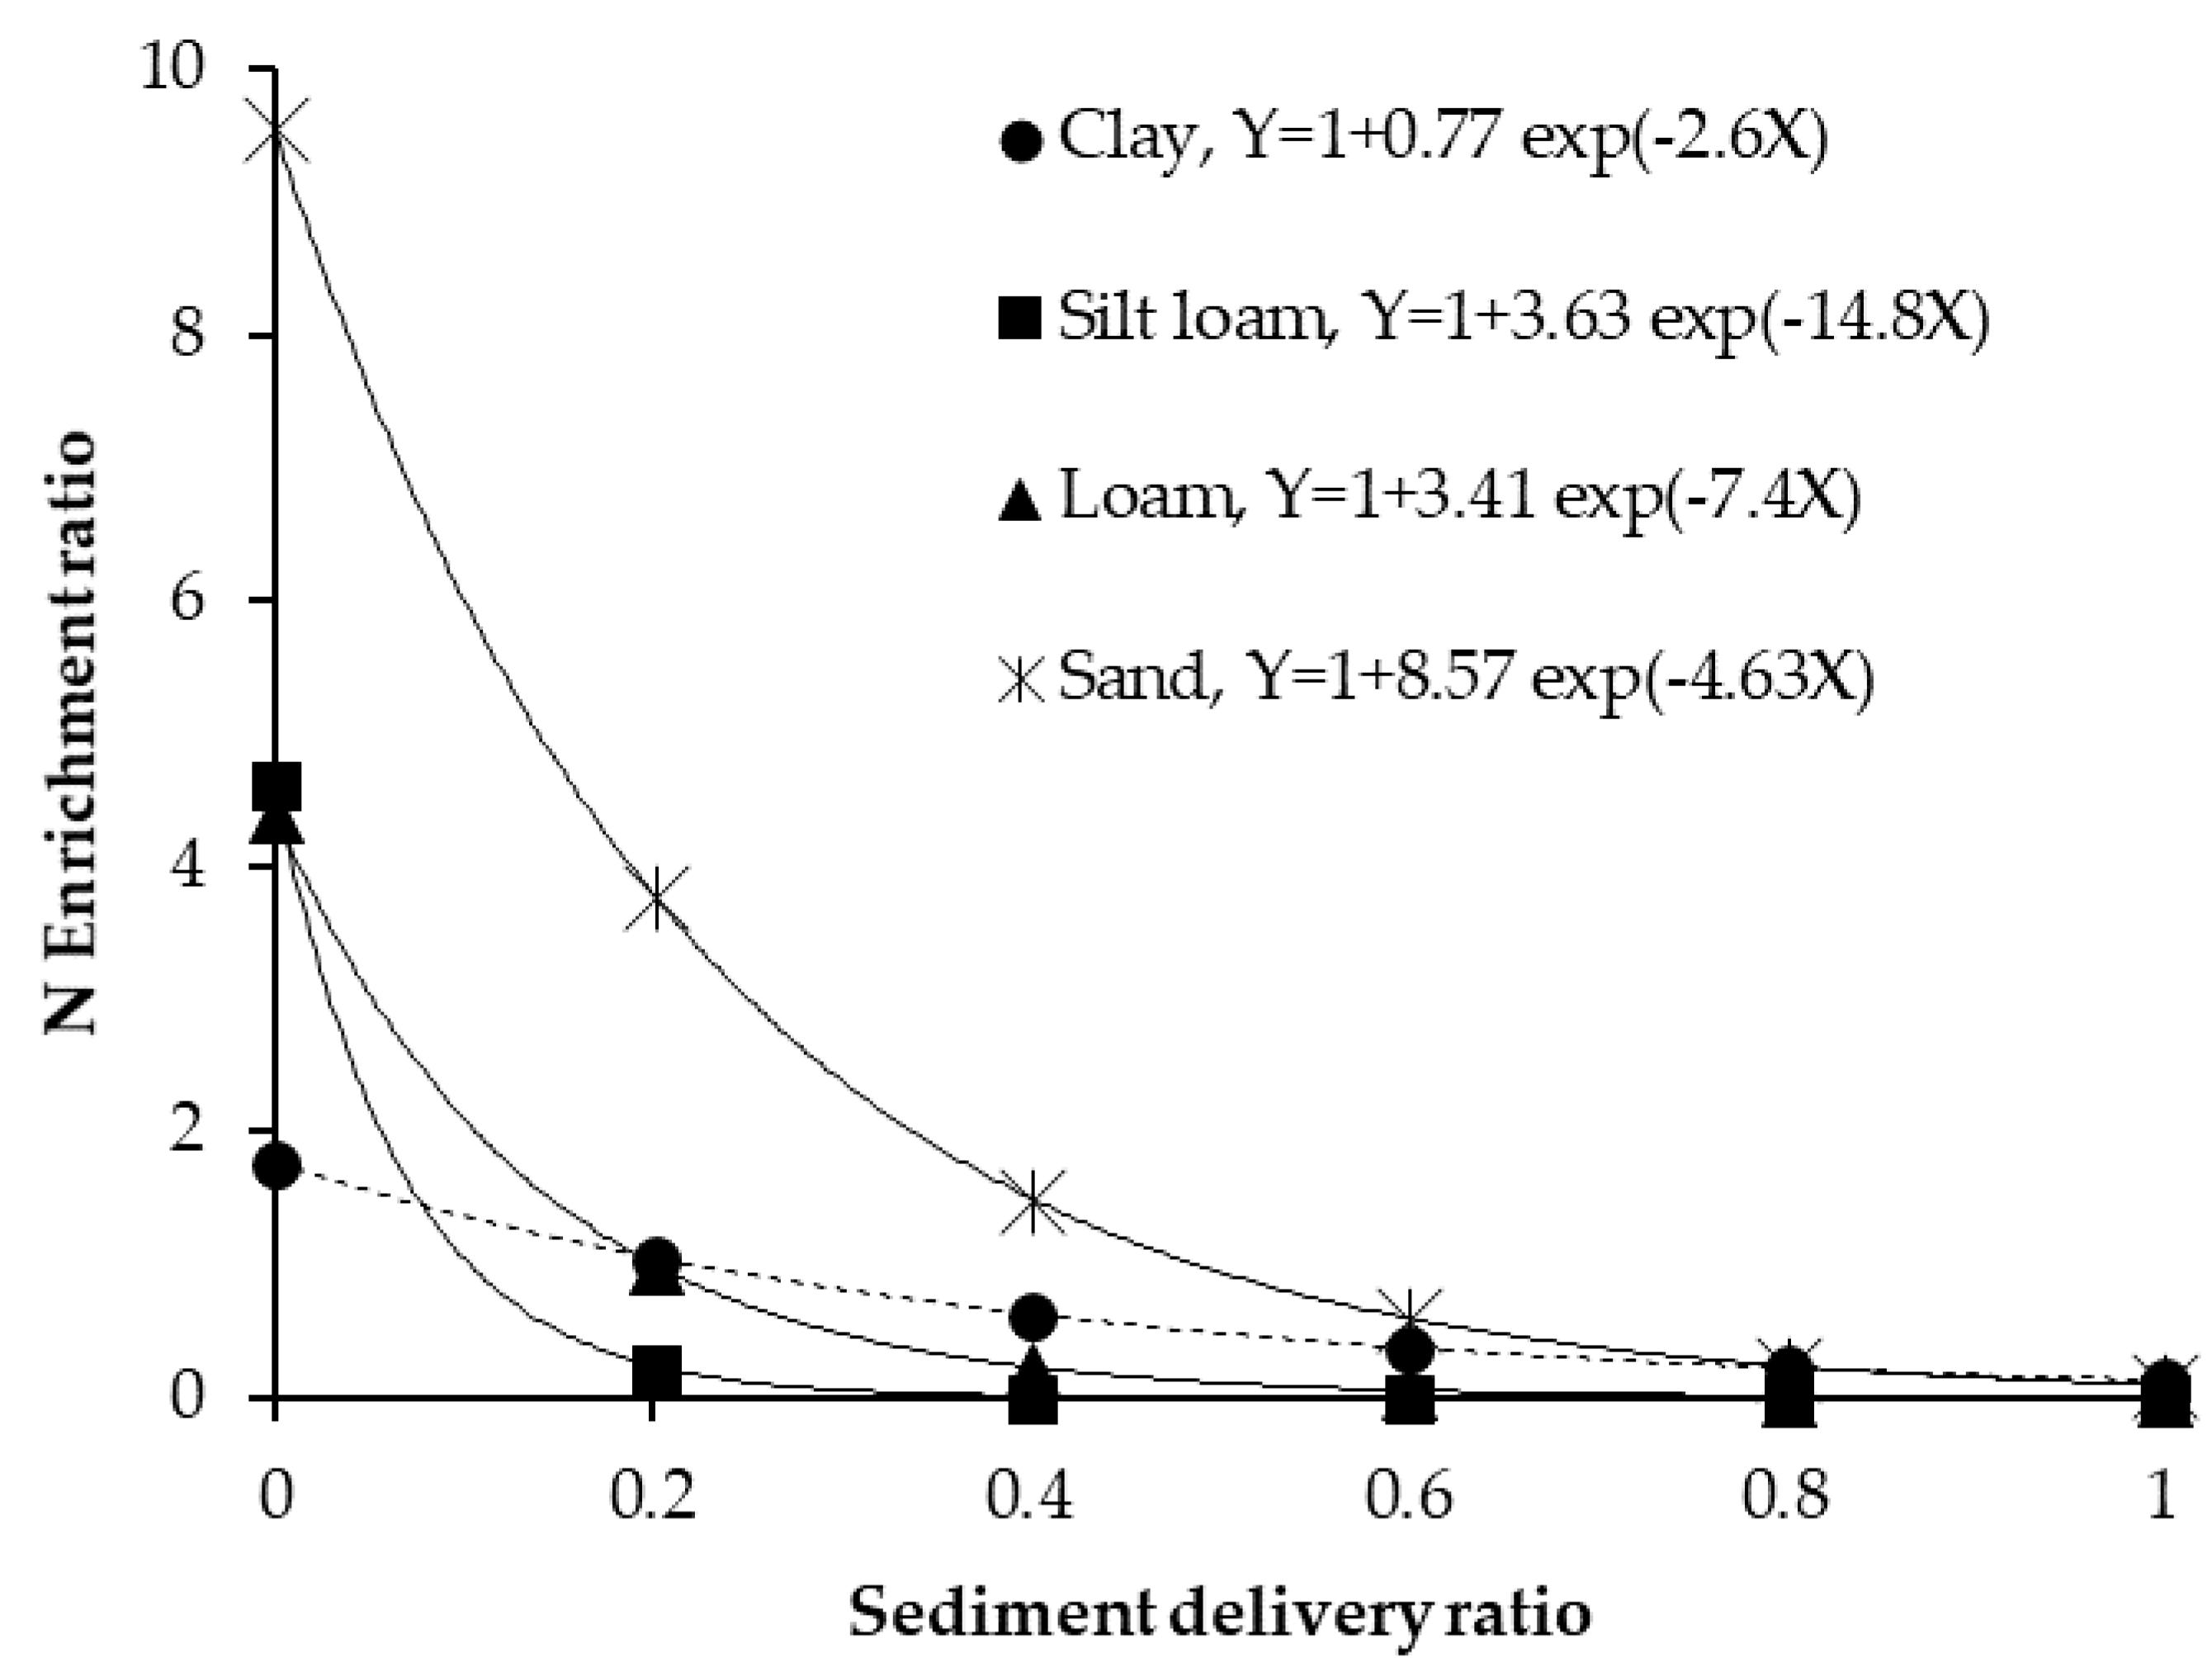
3.3. Magnitude of SOC Losses Due to Soil Erosion

Loss of the litter layer and vegetation canopy exposes the soil surface to soil erosion following land use conversion to plantation [45] and requires conservation measures [46,47]. The SOC loss due to soil erosion is rarely taken into account, however, as its overall impact on CO2 emissions is considered uncertain due to the sediment erosion at one location but deposition at another location, which may alter SOC decomposition. For example, if eroded soil is deposited in wet environments where it may be slowly decomposed [48]. However, for a given land use, soil erosion should be accounted for as it depletes the SOC stock and affects soil fertility, especially with respect to nitrogen and soil structure due to loss of SOM. The N enrichment ratio, which is the concentration of N in the eroded sediment divided by that of the parent soil, varies from 1.1 to as high as 10, depending on the soil texture, degree of aggregation, rainfall intensity and land use, as represented by the sedimentary delivery ratio. The sediment delivery ratio, also expressed as a percentage, is the sediment yield from an area divided by the gross soil erosion from that same area. At a sediment delivery ratio of 10%, the eroded sediment may have an N enrichment ratio (eroded sediment/bulk soil) of ~2 in a clay soil, ~3 in a loamy soil but >6 in a sandy soil (Figure 6) [49,50]. Organic C enrichment ratios of detached sediments are likely to be similar to N enrichment ratios, because soil organic C and N are closely correlated.
Soil erosion negatively affects SOC by disrupting or slaking aggregates with an associated increase in mineralisation, by preferential removal of C in runoff water, and by increased mineralisation of SOC in the displaced sediments. However, eroded sediments may be re-aggregated into organo-mineral complexes and buried as C-enriched sediments in flood plains, lakes, or the ocean floor [48], mitigating the effects of C losses on CO2 emissions to an unknown extent.
Soil erosion is increased when land use changes from a relatively undisturbed land use such as forest to relatively disturbed land use such as cropland [51]. The loss of SOC may be up to 50 t C/ha within 5–10 years following conversion from natural vegetation to cropland, depending on climate, soil, slope, drainage, method of land preparation, and extent of residual vegetation cover [52]. Almost 50% of this SOC loss at the site could be due to soil erosion on steep sloping lands. Moreover, in the tropics, intensive rainfall may cause high rates of erosion [53,54]. For example, Gharibreza et al. [55] estimated soil erosion losses of 47 to 99 mm per year on newly cleared land and of 3.5 to 15.6 mm per year from mature oil palm/rubber plantations in Malaysia. Assuming the soil (Ferrosol) contained 4% organic C and had bulk density of 1 Mg/m3, SOC losses would amount to18.8 and 39.6 t C/ha per year from newly cleared land and 1.4 to 6.2 t C/ha per year from the mature plantation. Losses may be higher considering that eroded sediments are generally enriched in SOC compared with the bulk soil (Figure 6). For example, Boye and Albrecht [56] measured a SOC enrichment ratio of 3.3 in Kenya and Bilgo et al. [57] reported 4.3 in Burkina Faso.
These findings were confirmed by a recent study conducted in secondary rainforests in the lowland mineral soils of Indonesia (Jambi province, Sumatra) [23]. Guillaume et al. [23] observed erosion–related SOC loss of about 10.1 ± 2.9 t C/ha after 15 years of land use change from secondary forest to rubber and oil palm plantations on a coarse-textured soil; this soil contained almost 50% lower amounts of SOC than the Ferrosol studied by Gharibreza et al. [55]. Moreover, the magnitude of SOC losses by erosion from the topsoil depends on the region, land-use change and intensity, soil texture and the time after conversion [23]. Simulation studies using the soil redistribution model Landsoil and a SOC model based on RothC-26.3 also identified land use change (from native vegetation to cropland) as the most important factor determining SOC loss from soil erosion [58]. Particulate organic C (POC) was the most important component of SOC lost due to soil erosion, especially by sheet (inter-rill) erosion, with coarse-textured soils being more prone to the POC loss than fine-textured soils [59]. Muller-Nedebock and Chaplot [59] estimated that tropical soils, on average, lost 66 kg C/ha/year compared with only 17 kg C/ha/year from temperate soils. The highest SOC loss (as POC) was 2400 kg C/ha/year from a sandy soil in a wet environment in Kenya (>1500 mm annual rainfall, [60].
Thus, SOC losses, especially as POC, from soil erosion must be taken into account and minimised following land use change. Erosion can be most effectively minimised by retaining the surface vegetation cover and by reducing soil disturbance to a minimum when preparing the land for oil palm or rubber plantation.

4. Effect of Different Land Uses on GHG Fluxes from Tropical Mineral Soils

The GHG fluxes (N2O, CH4 and CO2) following various land use changes are reported in Table 2. N2O emissions following land use change from primary forest to secondary forest or perennial plantations (rubber and oil palm) were generally small (<0.25 kg/ha/year), primarily because of low amounts of mineral N in the soil, except during the establishment phase of plantations and N fertilisation [61,62,63]. Net decreases in N2O emissions were reported when a primary and a secondary forest were converted into grasslands (Table 2). If the grassland receives N fertiliser N2O emissions will increase [18,64,65,66]. Any previous land use change to croplands, generally resulted in high N2O emissions (2.8–9.4 kg/ha/year; Table 2; [18,67,68]). However, N2O emissions measurements are too few for the tropical mineral soils, especially for oil palm and rubber plantations, to draw firm conclusions at this stage.
CH4 emissions from tropical mineral soils are generally <5 kg/ha/year, except for paddy rice, where emissions may be an order of magnitude higher (Table 2). Where oil palm and rubber plantations or even pasture lands become flooded, CH4 emissions increase because methanogens utilize labile C substrates under anaerobic conditions, resulting in CH4 production [61,63,69,70,71]; this is generally related to soil fertility [72].
CO2 emissions from soil, calculated from net SOC changes (primarily from heterotrophic respiration), varied between 1 t/ha/year (from grassland to oil palm plantation) and 5.5 t/ha/year (from slash-burn agriculture to oil palm plantation) (Table 2) [42,73,74,75,76,77,78,79,80,81]. Land use change from secondary forest to oil palm and degraded grassland to young rubber tree plantation may even create a soil CO2 sink (2–3.7 t/ha/year), although only limited data are available at this stage to support this claim for young rubber plantations.
The amount of GHG emitted when a primary or secondary forest is converted to an oil palm or a rubber plantation depends on land preparation and management, and on the age of plantation [61,62,72]. In the first years after conversion, higher amounts of mineral N are still present in the soil and/or from fertiliser application, and combined with lower plant N uptake, generally results in increased N2O emissions [82]. In an older plantation N2O emissions would be lower because less mineral N is available [63]. Direct measurements of N2O and CH4 fluxes that cover land use conversion to oil palm are rare, however, and the N2O and CH4 flux values should be used with caution (Table 2).

Changes in Total GHG Emissions Following Land Use Change

The combined effect on climate change originating from soil emissions of all three gases (CO2, N2O and CH4) is usually expressed in terms of global warming potential (GWP in CO2 equivalents or CO2e and summed to calculate total GHG emissions), taking CO2e values 1 for CO2, 28 for CH4 and 265 for N2O on a 100-year time horizon [83].
The change in total GHG expressed as CO2e following land use change is shown in Table 3. The highest total GHG emissions (4.7 t CO2e/ha/year) were obtained from the land use change from primary forest to croplands, followed by secondary forest to croplands (3.2 t CO2e/ha/year), then the emissions from primary and secondary forests. Generally, other perennial tree plantations (including rubber plantations) show the total GHG emissions below 2.9 t CO2e/ha/year (Table 3). However, land use change from secondary forest to oil palm plantations resulted in low GHG emissions. Although these total GHG emissions values are in good agreement with the global meta-analysis for different land use changes [16], these values have large uncertainties. At this stage, regional scale GHG accounting may be more reliable than site-specific GHG accounting. We propose that to reduce uncertainty in GHG accounting site-specific total GHG emissions data (CO2, N2O, CH4 emissions) should be obtained from oil palm and rubber plantation studies that address the sources and sinks of all three greenhouse gases.

5. Perspectives

Since there is a genuine environmental and social concern in establishing plantations on peatlands oil palm plantations on tropical mineral soils are increasingly being established on conversion from a variety of land uses including primary forest, secondary forest, grassland, other plantations and cropland. From the limited data available on SOC stock changes under oil palm and rubber plantations following land use change, we found that the largest SOC losses occurred when primary forest land was converted to plantations. Secondary forest lands showed much lower SOC losses when converted to oil palm plantation although conversion to rubber plantation still had large SOC losses. From the limited data available, we estimated that total GHG emissions (CO2, N2O and CH4) were lower from the oil palm plantation established on previous cropland or grassland than the primary and secondary forests. Rubber plantation still had high GHG emissions than the oil palm plantation established on previous secondary forest lands. On a regional basis, large scale GHG accounting was more reliable than that on site-specific basis.
Main key gaps identified from this review are: (i) the lack of measured bulk density data to calculate SOC stocks under different land uses and management practices and on equivalent soil mass basis; pedo-transfer functions provide much less reliable measure of bulk density than the site-specific values; (ii) sparse or lack of SOC and GHG dataset from long-term monitoring of soil under oil palm and rubber plantations on tropical mineral soils, which is critical for robust and reliable GHG accounting for all three major gases; (iii) limited data on the time trends in SOC stocks on tropical mineral soils under perennial plantations since SOC stocks and GHG emissions change over time after the establishment of plantation; (iv) ad hoc measures of the effect of soil type and management practices on GHG emissions, including SOC stocks; and (v) limited data available from oil palm and other perennial plantations on mineral soils from the tropical African region.
Admittedly, noticeable progress has been made towards sustainable palm oil industry, especially reducing environmental concerns by avoiding the land use conversion of peat soils for oil palm plantation. As is evident from this review, there still remain environmental issues such as SOC losses and large GHG emissions from land use change from primary forest and secondary forest to oil palm and rubber plantations, including that from soil erosion. These can most efficiently be addressed from long-term monitoring of key sites on major soils used for perennial plantations in the tropics. Appropriate management practices need to be evaluated to optimise production and sustainable economic returns and minimise adverse environmental impact from perennial plantations on tropical mineral soils from the tropical Asian, Papua New Guinea, African and American regions.

Supplementary Materials

The following are available online at https://www.mdpi.com/2077-0472/8/9/133/s1, Figure S1: Default values for remaining SOC fraction after land use change from [17] and IPCC (Penman et al., 2003), Table S1: Change of SOC stock on conversion of primary forest land in subtropical and tropical (30° N–30° S) regions, Table S2: Change of SOC stock on conversion of secondary forest land in subtropical and tropical (30° N–30° S) regions, Table S3: Change of SOC stock on conversion of pasture and grassland in subtropical and tropical (30° N–30° S) regions, Table S4: Change of SOC stock on conversion of cropland in subtropical and tropical (30° N–30° S) regions, Table S5: Annual N2O fluxes in primary forests and in the associated land use change in subtropical and tropical (30° N–30° S) regions, Table S6: Annual CH4 fluxes in primary forests and following land use change in subtropical and tropical (30° N–30° S) regions, Table S7: Annual N2O fluxes in secondary forests and following land use change in subtropical and tropical (30° N–30° S) regions, Table S8: Annual CH4 fluxes in secondary forests and following land use change in subtropical and tropical (30° N–30° S) regions, Table S9: Annual N2O fluxes in natural savannah and following land use change in subtropical and tropical (30° N–30° S) regions, Table S10: Annual CH4 fluxes in natural savannah and following land use change in subtropical and tropical (30° N–30° S) regions.

Author Contributions

S.S. compiled the literature from all co-authors and web search, R.C.D. assisted in organising the contents of the review and verified by H.J. and R.J.R. and G.K.J. provided the soil fertility data, and all authors assisted in writing, and approved the final version of the manuscript.

Funding

This research review was funded by the High Carbon Stock Science Study of the Sustainable Oil Palm Manifesto, grant number HCS-6.

Acknowledgments

We thank the University of Queensland (Neal Menzies and Peter Kopittke) for administrative support. We thank the funders of the High Carbon Stock Science Study of the Sustainable Oil Palm Manifesto for financial support.

Conflicts of Interest

The authors declare that there is no conflict of interest in terms of the content, technical and financial support for producing this review.

References

  1. UNCTAD. Palm Oil. 2016. Available online: http://unctad.org/en/PublicationsLibrary/INFOCOMM_cp08_PalmOil_fr.pdf (accessed on 12 March 2017).
  2. Wahid, M.B.; Akmar-Abdullah, S.N.; Henson, I.E. Oil palm—Achievements and potential. Plant Prod. Sci. 2005, 8, 288–297. [Google Scholar] [CrossRef]
  3. Tan, K.T.; Lee, K.T.; Mohamed, A.R.; Bhatia, S. Palm oil: Addressing issues and towards sustainable development. Renew. Sustain. Energy Rev. 2009, 13, 420–427. [Google Scholar] [CrossRef]
  4. UNEP. Oil Palm Plantations: Threats and Opportunities for Tropical Ecosystems. Global Environmental Alert Service (GEAS). Taking the Pulse of the Planet: Connecting Science with Policy (December Issue). Available online: www.unep.org/geas (accessed on 2 October 2015).
  5. UNEP. UNEP and Roundtable on Sustainable Palm Oil Sign New Agreement. Available online: http://web.unep.org/newscentre/unep-and-roundtable-sustainable-palm-oil-sign-new-agreement (accessed on 12 March 2017).
  6. Weicke, B.; Sikkema, R.; Dornburg, V.; Faaij, A. Exploring land use changes and the role of palm oil production in Indonesia and Malaysia. Land Use Policy 2011, 28, 193–206. [Google Scholar] [CrossRef]
  7. UNCTAD. Infocomm Commodity Profile, Palm Oil. Available online: http://www.unctad.info/en/Infocomm/AACP-Products/Palm-oil/ (accessed on 2 October 2015).
  8. Gunarso, P.; Hartoyo, M.E.; Agus, F.; Killeen, T.J. Oil palm and land use change in Indonesia, Malaysia and Papua New Guinea. Reports from the Technical Panels of the 2nd Greenhouse Gas Working Group of the Roundtable on Sustainable Palm Oil (RSPO). Available online: www.rspo.org (accessed on 2 October 2015).
  9. HCS. High Carbon Stock Scientific Study. The Sustainable Palm Oil manifesto. Sime Darby Plantation, Bd: Kuala Lumpur, Malaysia. Available online: http://www.simedarbyplantation.com/sustainability/beliefs-progress/high-carbon-stock (accessed on 1 May 2018).
  10. Cheah, L.W.; Gan, H.H.; Goh, K.J. Production, Stock and Management of Carbon in Oil Palm Plantations on Mineral Soils. In Proceedings of the International Palm Oil Conference on Green Opportunities from the Golden Crop: Agriculture, Biotechnology and Sustainability, Kuala Lumpur, Malaysia, 19–21 November 2013; p. 16. [Google Scholar]
  11. Khasanah, N.; van Noordwijk, M.; Ningsiha, H.; Rahayua, S. Carbon neutral? No change in mineral SOC stock under oil palm plantations derived from forest or non-forest in Indonesia. Agric. Ecosyst. Environ. 2015, 211, 195–206. [Google Scholar] [CrossRef]
  12. Koh, L.P.; Miettinen, J.; Liew, S.C.; Ghazoul, J. Remotely sensed evidence of tropical peatland conversion to oil palm. Proc. Natl. Acad. Sci. USA 2011, 108, 5127–5132. [Google Scholar] [CrossRef] [PubMed] [Green Version]
  13. Paramananthan, S. Organic Soils of Malaysia. Their Characteristics, Mapping, Classification and Management for Oil Palm Cultivation; Malaysian Palm Oil Council: Kelana Jaya, Selangor, Malaysia, 2016; 156p. [Google Scholar]
  14. Tonks, A.J.; Aplin, P.; Beriro, D.J.; Cooper, H.; Evers, S.; Vane, C.; Sjögersten, S. Impacts of conversion of tropical peat swamp forest to oil palm plantation on peat organic chemistry, physical properties and carbon stocks. Geoderma 2017, 289, 36–45. [Google Scholar] [CrossRef] [Green Version]
  15. Soil Survey Staff. Keys to Soil Taxonomy, 12th ed.; Natural Resources and Conservation Service, USDA: Washington, DC, USA, 2014; 360p. [Google Scholar]
  16. Lucey, J.; Hill, J.; van de Meer, P.; Reynolds, G.; Agus, F. Change in Carbon Stocks Arising from Land-Use Conversion to Oil Palm Plantations. A Science-for-Policy Paper for the Oil Palm Research-Policy Partnership Network; British Foreign and Commonwealth Office: London, UK, 2014. [Google Scholar]
  17. Don, A.; Schumacher, J.; Freibauer, A. Impact of tropical land-use change on soil organic carbon stocks—A meta-analysis. Glob. Chang. Biol. 2011, 17, 1658–1670. [Google Scholar] [CrossRef]
  18. Dalal, R.C.; Thornton, C.M.; Cowie, B.A. Turnover of organic carbon and nitrogen in soil assessed from δ13C and δ15N changes under pasture and cropping practices and estimates of greenhouse gas emissions. Sci. Total Environ. 2013, 465, 26–35. [Google Scholar] [CrossRef] [PubMed] [Green Version]
  19. Dalal, R.C.; Allen, D.E. Greenhouse gas fluxes from natural ecosystems. Turner Review no.18. Aust. J. Bot. 2008, 56, 369–407. [Google Scholar] [CrossRef]
  20. IPCC. Special Report to the IPCC. Summary for Policy Makers. Land Use, Land Use Change and Forestry. Intergovernmental Panel on Climate Change; Watson, R.T., Noble, I.R., Bolin, B., Ravindranath, N.H., Verardo, D.J., Dokken, D.J., Eds.; Cambridge University Press: Cambridge, UK, 2000. [Google Scholar]
  21. Powers, J.S.; Corre, M.D.; Twine, T.E.; Veldkamp, E. Geographic bias of field observations of SOC stocks with tropical land-use changes precludes spatial extrapolation. Proc. Natl. Acad. Sci. USA 2011, 108, 6318–6322. [Google Scholar] [CrossRef] [PubMed]
  22. Van Straaten, O.; Corre, M.D.; Wolf, K.; Tchienkoua, M.; Cuellar, E.; Matthews, R.B.; Veldkamp, E. Conversion of lowland tropical forests to tree cash crop plantations loses up to one-half of stored soil organic carbon. Proc. Natl. Acad. Sci. USA 2015, 112, 9956–9960. [Google Scholar] [CrossRef] [PubMed] [Green Version]
  23. Guillaume, T.; Damris, M.; Kuzyakov, Y. Losses of SOC by converting tropical forest to plantations: Erosion and decomposition estimated by δ13C. Glob. Chang. Biol. 2015, 21, 3548–3560. [Google Scholar] [CrossRef] [PubMed]
  24. Bahr, E.; Chamba Zaragocin, D.; Makeschin, F. Soil nutrient stock dynamics and land-use management of annuals, perennials and pastures after slash-and-burn in the southern Ecuadorian Andes. Agric. Ecosyst. Environ. 2014, 188, 275–288. [Google Scholar] [CrossRef]
  25. Law, M.C.; Balasundram, S.K.; Husni, M.H.A.; Ahmed, O.H.; Harun, M.H. Spatial variability of soil organic carbon in oil palm. Int. J. Soil Sci. 2009, 4, 93–130. [Google Scholar]
  26. Bruun, T.B.; Egay, K.; Mertz, O.; Magid, J. Improved sampling methods document decline in soil organic carbon stocks and concentrations of permanganate oxidisable carbon after transition from swidden to oil palm cultivation. Agric. Ecosyst. Environ. 2013, 178, 127–134. [Google Scholar] [CrossRef]
  27. IPCC. Guidelines for National Greenhouse Gas Inventories Volume 4 Agriculture, Forestry and Other Land Use, Forest Land; National Greenhouse Gas Inventories Programme: Kanagawa, Japan, 2006. [Google Scholar]
  28. Tanaka, S.; Tachibe, S.; Wasli, M.E.B.; Lat, J.; Seman, L.; Kendawang, J.J.; Iwasaki, K.; Sakurai, K. Soil characteristics under cash crop farming in upland areas of Sarawak, Malaysia. Agric. Ecosyst. Environ. 2009, 129, 293–301. [Google Scholar] [CrossRef] [Green Version]
  29. Ng, P.H.C.; Gan, H.H.; Goh, K.J. Soil nutrient changes in Ultisols under oil palm in Johor, Malaysia. J. Oil Palm Environ. 2011, 2, 93–104. [Google Scholar]
  30. Bakar, R.A.; Darus, S.Z.; Kulaseharan, S.; Jamaluddin, N. Effects of ten year application of empty fruit bunches in an oil palm plantation on soil chemical properties. Nutr. Cycl. Agroecosyst. 2011, 89, 341–349. [Google Scholar] [CrossRef]
  31. Moradi, A.; Teh, B.S.; Goh, K.J.; Hanif, M.H.A.; Ishak, C.F. Chapter 11: Soil organic carbon sequestration due to different oil palm residue mulches. In Advances in Tropical Soil Science; Universiti Putra Malaysia Press: Serdang, Malaysia, 2013; pp. 169–186. [Google Scholar]
  32. Aholoukpè, H.; Dubos, B.; Flori, A.; Deleporte, P.; Amadji, G.; Chotte, J.L. Estimating aboveground biomass of oil palm: Allometric equations for estimating frond biomass. For. Ecol. Manag. 2013, 292, 122–129. [Google Scholar] [CrossRef]
  33. Aholoukpè, H.; Amadji, G.I.; Blavet, D.; Chotte, J.I.; Deleporte, P.; Dubos, B.; Flori, A.; Jourdan, C. Effect of management of pruned fronds of oil palm on soil carbon stocks and soil physico-chemical properties in Beninese smallholder plantations. Biotechnol. Agron. Soc. Environ. 2016, 20, 171–182. [Google Scholar]
  34. Khalid, H.; Zin, Z.Z.; Anderson, J.M. Quantification of oil palm biomass and nutrient value in a mature plantation. 1. Above-ground biomass. J. Oil Palm Res. 1999, 11, 23–32. [Google Scholar]
  35. Khalid, H.; Zin, Z.Z.; Anderson, J.M. Soil nutrient dynamics and palm growth performance in relation to residue management practices following replanting of oil palm plantation. J. Oil Palm Res. 2000, 12, 25–45. [Google Scholar]
  36. Carron, M.P.; Auriac, Q.; Snoeck, D.; Villenave, C.; Blanchart, E.; Robeyre, F.; Marichal, R.; Darminto, M.; Caliman, J.P. Do the impact of organic residues on soil quality extend beyond the deposition area under oil palm? Eur. J. Soil Biol. 2016, 75, 54–61. [Google Scholar] [CrossRef]
  37. Comte, I.; Colin, F.; Whalen, J.K.; Grünberger, O.; Caliman, J. Chapter three—Agricultural practices in oil palm plantations and their impact on hydrological changes, nutrient fluxes and water quality in Indonesia: A review. Adv. Agron. 2012, 116, 71–124. [Google Scholar]
  38. Comte, I.; Colin, F.; Grünberger, O.; Follain, S.; Whalen, J.K.; Caliman, J.P. Landscape-scale assessment of soil response to long-term organic and mineral fertilizer application in an industrial oil palm plantation, Indonesia. Agric. Ecosyst. Environ. 2013, 169, 58–68. [Google Scholar] [CrossRef]
  39. Yamada, H.; Tanaka, R.; Sulaiman, O.; Hashim, R.; Hamid, Z.A.A.; Yahya, M.K.A.; Kosugi, A.; Arai, T.; Murata, Y.; Nirasawa, S.; et al. Old oil palm trunk: A promising source of sugars for bioethanol production. Biomass Bioenergy 2010, 34, 1608–1613. [Google Scholar] [CrossRef]
  40. Corley, R.H.V.; Tinker, P.B. The Oil Palm, 4th ed.; Wiley-Blackwell: Hoboken, NJ, USA, 2003; 562p. [Google Scholar]
  41. Chiew, Y.L.; Shimada, S. Current state and environmental impact assessment for utilizing oil palm empty fruit bunches for fuel, fiber and fertilizer—A case study of Malaysia. Biomass Bioenergy 2013, 51, 109–124. [Google Scholar] [CrossRef]
  42. Frazão, L.A.; Paustian, K.; Cerri, C.E.P.; Cerri, C.C. SOC stocks under oil palm plantations in Bahia state, Brazil. Biomass Bioenergy 2014, 62, 1–7. [Google Scholar] [CrossRef]
  43. Stichnothe, H.; Schuchardt, F. Comparison of different treatment options for palm oil production waste on a life cycle basis. Int. J. Life Cycle Assess. 2010, 15, 907–915. [Google Scholar] [CrossRef]
  44. Stichnothe, H.; Schuchardt, F. Life cycle assessment of two palm oil production systems. Biomass Bioenergy 2011, 35, 3976–3984. [Google Scholar] [CrossRef]
  45. Ross, S.M.; Dykes, A. Soil conditions, erosion and nutrient loss on steep slopes under mixed dipterocarp forest in Brunei Darussalam. In Tropical Rainforest Research—Current Issues; Edwards, D.S., Booth, W.E., Choy, S.C., Eds.; Springer: Dordrecht, The Netherlands, 1996; Volume 74, pp. 259–270. [Google Scholar]
  46. Moradi, A.; Sung, C.T.B.; Goh, K.J.; Hanif, A.H.M.; Ishak, C.F. Effect of four soil and water conservation practices on soil physical processes in a non-terraced oil palm plantation. Soil Till. Res. 2014, 145, 62–71. [Google Scholar] [CrossRef]
  47. Moradi, A.; Teh, B.S.; Goh, K.J.; Hanif, M.H.A.; Fauziah, C.I. Evaluation of four soil conservation practices in a non-terraced oil palm plantation. Agron. J. 2012, 104, 1727–1740. [Google Scholar] [CrossRef]
  48. Lal, R. Soil erosion and global carbon budget. Environ. Int. 2003, 29, 437–450. [Google Scholar] [CrossRef]
  49. Foster, G.R.; Young, R.A.; Neibling, W.H. Sediment composition for nonpoint source pollution analyses. Trans. ASAE 1985, 28, 133–146. [Google Scholar] [CrossRef]
  50. Rose, C.W.; Dalal, R.C. Erosion and runoff of nitrogen. In Advances in Nitrogen Cycling in Agricultural Ecosystems; Wilson, J.R., Ed.; C.A.B. International: Wallingford, UK, 1988; pp. 212–235. [Google Scholar]
  51. Sidle, R.C.; Ziegler, A.D.; Negishi, J.N.; Nik, A.R.; Siew, R.; Turkelboom, F. Erosion processes in steep terrain—Truths, myths, and uncertainties related to forest management in Southeast Asia. For. Ecol. Manag. 2006, 224, 199–225. [Google Scholar] [CrossRef]
  52. Davidson, E.A.; Ackerman, H. Changes in SOC inventories following cultivation of previously untilled soils. Biogeochemistry 1993, 20, 161–193. [Google Scholar] [CrossRef]
  53. Yu, B.; Hashim, G.M.; Eusof, Z. Estimating the r-factor with limited rainfall data: A case study from peninsular Malaysia. J. Soil Water Conserv. 2001, 56, 101–105. [Google Scholar]
  54. Oliveira, P.T.S.; Wendland, E.; Nearing, M.A. Rainfall erosivity in Brazil: A review. CATENA 2013, 100, 139–147. [Google Scholar] [CrossRef]
  55. Gharibreza, M.; Raj, J.K.; Yusoff, I.; Othman, Z.; Tahir, W.Z.W.M.; Ashraf, M.A. Land use changes and soil redistribution estimation using 137 Cs in the tropical Bera Lake catchment, Malaysia. Soil Till. Res. 2013, 131, 1–10. [Google Scholar] [CrossRef]
  56. Boye, A.; Albrecht, A. Soil erodibility, control and SOC losses under short-term tree fallows in western Kenya. In Soil Erosion and Carbon Dynamics; Feller, C., Roose, E.J., Stewart, B.A., Barthes, B., Lal, R., Eds.; CRC Press: Boca Raton, FL, USA, 2006; pp. 181–196. [Google Scholar]
  57. Bilgo, A.; Serpentie, G.; Masser, D.; Fournier, J.; Hien, V. Carbon, nitrogen, and fine particles removed by water erosion on crops, fallows, and mixed plots in Sudanese savannas (Burkina Faso). In Soil Erosion and Carbon Dynamics; Roose, E.J., Feller, C., Barthes, B., Stewart, B.A., Eds.; CRC Press: Boca Raton, FL, USA, 2006; pp. 125–142. [Google Scholar]
  58. Lacoste, M.; Viaud, V.; Michot, D.; Walter, C. Landscape-scale modelling of erosion processes and SOC dynamics under land-use and climate change agroecosystems. Eur. J. Soil Sci. 2015, 66, 780–791. [Google Scholar] [CrossRef]
  59. Muller-Nedebock, D.; Chaplot, V. SOC losses by sheet erosion: A potentially critical contribution to the global carbon cycle. Earth Surf. Process. Landf. 2015, 40, 1803–1813. [Google Scholar] [CrossRef]
  60. Gachene, C.K.K.; Jarvis, N.J.; Linner, H.; Mbuvi, J.P. Soil erosion effects on soil properties in a highland area in central Kenya. Soil Sci. Soc. Am. J. 1997, 61, 559–564. [Google Scholar] [CrossRef]
  61. Ishizuka, S.; Tsuruta, H.; Murdiyarso, D. An intensive field study on CO2 CH4, and N2O emissions from soils at four land-use types in Sumatra, Indonesia. Glob. Biogeochem. Cycles 2002, 16, 22:1–22:11. [Google Scholar] [CrossRef]
  62. Ishizuka, S.; Iswandi, A.; Nakajima, Y.; Yonemura, S.; Sudo, S.; Tsuruta, H.; Murdiyarso, D. The variation of greenhouse gas emissions from soils of various land-use/cover types in Jambi province, Indonesia. Nutr. Cycl. Agroecosyst. 2005, 71, 17–32. [Google Scholar] [CrossRef]
  63. Werner, C.; Zheng, X.H.; Tang, J.W.; Xie, B.H.; Liu, C.Y.; Kiese, R.; Butterbach-Bahl, K. N2O, CH4 and CO2 emissions from seasonal tropical rainforests and a rubber plantation in Southwest China. Plant Soil 2006, 289, 335–353. [Google Scholar] [CrossRef]
  64. Verchot, L.V.; Davidson, E.A.; Cattanio, J.H.; Ackerman, I.L.; Erickson, H.E.; Keller, M. Land use change and biogeochemical controls of nitrogen oxide emissions from soils in eastern Amazonia. Glob. Biogeochem. Cycles 1999, 13, 31–46. [Google Scholar] [CrossRef] [Green Version]
  65. Verchot, L.V.; Davidson, E.A.; Cattanio, J.H.; Ackerman, I.L. Land-use change and biogeochemical controls of methane fluxes in soils of Eastern Amazonia. Ecosystems 2000, 3, 41–56. [Google Scholar] [CrossRef]
  66. Melillo, J.M.; Steudler, P.A.; Feigl, B.J.; Neill, C.; Garcia, D.; Piccolo, M.C.; Cerri, C.C.; Tian, H. Nitrous oxide emissions from forests and pastures of various ages in the Brazilian Amazon. J. Geophys. Res. 2001, 106, 34179–34188. [Google Scholar] [CrossRef] [Green Version]
  67. Weitz, A.M.; Veldkamp, E.; Keller, M.; Neff, J.; Crill, P.M. Nitrous oxide, nitric oxide, and methane fluxes from soils following clearing and burning of tropical secondary forest. J. Geophys. Res. 1998, 103, 28047–28058. [Google Scholar] [CrossRef] [Green Version]
  68. Hall, S.; Asner, G.P.; Kitayama, K. Substrate, climate and land use controls over soil N dynamics and N-oxide emissions in Borneo. Biogeochemistry 2004, 70, 27–58. [Google Scholar] [CrossRef]
  69. Singh, J.S.; Raghubanshi, A.S.; Reddy, V.S.; Singh, S.; Kashyap, A.K. Methane flux from irrigated paddy and dryland rice fields, and from seasonally dry tropical forest and savanna soils of India. Soil Biol. Biochem. 1998, 30, 135–139. [Google Scholar] [CrossRef]
  70. Awasthi, K.D.; Sitaula, B.K.; Singh, B.R.; Bajracharya, R.M. Fluxes of methane and carbon dioxide from soil under forest, grazing land, irrigated rice and rainfed field crops in a watershed of Nepal. Biol. Fertil. Soils 2005, 41, 163–172. [Google Scholar] [CrossRef]
  71. Dalal, R.C.; Allen, D.E.; Livesley, S.J.; Richards, G. Magnitude and biophysical regulators of methane emission and consumption in the Australian agricultural, forest, and submerged landscapes: A review. Plant Soil 2008, 309, 43–76. [Google Scholar] [CrossRef]
  72. Hassler, E.; Corre, M.D.; Veldkamp, A.; Tjoa, M.; Damris, S.R.; Utami, E. Soil fertility controls soil-atmosphere carbon dioxide and methane fluxes in a tropical landscape converted from lowland forest to rubber and oil palm plantations. Biogeosciences 2015, 12, 5831–5852. [Google Scholar] [CrossRef]
  73. Osher, L.J.; Matson, P.A.; Amundson, R. Effect of land use change on SOC in Hawaii. Biogeochemistry 2003, 65, 213–232. [Google Scholar] [CrossRef]
  74. Powers, J.S. Changes in SOC and nitrogen after contrasting land-use transitions in Northeastern Costa Rica. Ecosystems 2004, 7, 134–146. [Google Scholar] [CrossRef]
  75. Zhang, H.; Zhang, G.; Zhao, Y.; Zhao, W.; Qi, Z. Chemical degradation of a Ferralsol (Oxisol) under intensive rubber (Hevea brasiliensis) farming in tropical China. Soil Till. Res. 2007, 93, 109–116. [Google Scholar] [CrossRef]
  76. Galdos, M.V.; Cerri, C.C.; Cerri, C.E.P. SOC stocks under burned and unburned sugarcane in Brazil. Geoderma 2009, 153, 347–352. [Google Scholar] [CrossRef]
  77. Ziegler, A.D.; Phelps, J.; Yuen, J.Q.; Webb, E.L.; Lawrence, D.; Fox, J.M.; Bruun, T.B.; Leisz, S.J.; Ryan, C.M.; Dressler, W. Carbon outcomes of major land-cover transitions in SE Asia: Great uncertainties and REDD+ policy implications. Glob. Chang. Biol. 2012, 18, 3087–3099. [Google Scholar] [CrossRef] [PubMed]
  78. Frazão, L.A.; Paustian, K.; Cerri, C.E.P.; Cerri, C.C. SOC stocks and changes after oil palm introduction in the Brazilian Amazon. Glob. Chang. Biol. 2013, 5, 384–390. [Google Scholar] [CrossRef]
  79. Nelson, P.N.; Banabas, M.; Nake, S.; Goodrick, I.; Webb, M.J.; Gabriel, E. Soil fertility changes following conversion of grassland to oil palm. Soil Res. 2014, 52, 698–705. [Google Scholar] [CrossRef] [Green Version]
  80. Franco, A.L.C.; Cherubin, M.R.; Pavinato, P.S.; Cerri, C.E.P.; Six, J.; Davies, C.A.; Cerri, C.C. SOC, nitrogen and phosphorus changes under sugarcane expansion in Brazil. Sci. Total Environ. 2015, 515–516, 30–38. [Google Scholar] [CrossRef] [PubMed]
  81. Goodrick, I.; Nelson, P.N.; Banabas, M.; Wurster, C.M.; Bird, M.I. SOC balance following conversion of grassland to oil palm. Glob. Chang. Biol. Bioenergy 2015, 7, 263–272. [Google Scholar] [CrossRef]
  82. Dalal, R.C.; Wang, W.; Robertson, G.P.; Parton, W.J. Nitrous oxide emission from Australian agricultural lands and mitigation options, a review. Aust. J. Soil Res. 2003, 41, 165–195. [Google Scholar] [CrossRef]
  83. Myhre, G.D.; Shindell, F.M.; Bréon, W.; Collins, J.; Fuglestvedt, J.; Huang, D.; Koch, J.F.; Lamarque, D.; Lee, B.; Mendoza, T.; et al. Anthropogenic and natural radiative forcing. In Climate Change 2013: The Physical Science Basis; Contribution of Working Group I to the Fifth Assessment Report of the IPCC; Stocker, T.F., Qin, D., Plattner, G.K., Tignor, M., Allen, S.K., Doschung, J., Nauels, A., Xia, Y., Bex, V., Midgley, P.M., Eds.; Cambridge University Press: Cambridge, UK, 2013; pp. 659–740. [Google Scholar]
Figure 1. Losses of SOC stock (percent decrease) following land use change across tropical mineral soils (adapted from [17,21,22]).
Agriculture 08 00133 g001
Figure 2. Relative SOC stock change over 35 years after conversion from primary forest to oil palm plantation (data source: Tables S1–S4) in tropical mineral soils.
Agriculture 08 00133 g002
Figure 3. Relative SOC stock change over years after conversion from secondary forest to oil palm plantation (data source: Tables S1–S4) in tropical mineral soils.
Agriculture 08 00133 g003
Figure 4. Relative SOC stock change over years after conversion from primary forest to rubber plantation (data source: Tables S1–S4) in tropical mineral soils. One high value (151%; almost 4 times the nearest value) was excluded from the dataset.
Agriculture 08 00133 g004
Figure 5. Relative SOC stock change over years after conversion from secondary forest to rubber plantation (data source: Tables S1–S4) in tropical mineral soils.
Agriculture 08 00133 g005
Figure 6. Relationship between sediment delivery ratio and enrichment ratio (adapted from [49,50]).
Agriculture 08 00133 g006
Table 1. Summary of relative SOC stock change from different land use changes (data source cited in Tables S1–S4).
Previous Land UseConverted Land UseAge of New Land Use (year) (Mean ± SD)SOC Stock of Previous Land Use (t/ha) (Mean ± SD) (A)SOC Stock of Converted Land Use (t/ha) (Mean ± SD) (B)Relative Change in SOC Stock (%) *,# (Mean ± SD) [(B − A)/A] × 100Number of Data Considered
Primary forest Oil palm plantation14.4 ± 757.7 ± 21.743.2 ± 20.4−23.3 ± 21.4n = 40
Secondary forestOil palm plantation15.4 ± 10.356.1 ± 20.456.4 ± 26.6−1.2 ± 26.1n = 11
Pasture/grasslandOil palm plantation2561.8 ± 55.854.8 ± 54.5−11.7 ± 27.0n = 3
Slash-and-burn AgricultureOil palm plantation11 ± 3.760 ± 12.441.9 ± 15.6−30.6 ± 19.8n = 5
CroplandOil palm plantation2033.169.0108.5n = 1
Primary forest Rubber plantation23.2 ± 1574.7 ± 27.862.8 ± 34.7−14.3 ± 36.8n = 34
Secondary forestRubber plantation29.1 ± 22.270.3 ± 10.358.8 ± 10.6−16.3 ± 8.5n = 8
Pasture/grasslandYoung Rubber/tree plantation 9 ± 554.8 ± 8.361.2 ± 14.710. 8 ± 10.2n = 3
Pasture/grasslandOld Rubber/Broadleaf-tree plantation19 ± 1458.7 ± 37.349.0 ± 31.8−15.9 ± 8.3n = 3
Primary forest Perennial tree plantation35.4 ± 22.555.9 ± 22.341.1 ± 19.4−25.8 ± 15.9n = 23
Secondary forestTree/perennial plantation27.8 ± 20.675.9 ± 32.869.2 ± 26.5−7.4 ± 6.7n = 6
Primary forestPasture33.6 ± 24.376 ± 25.663 ± 29.6−19.9 ± 18.5n = 9
Secondary forestGrass/Cropland24.9 ± 18.766.5 ± 43.453.6 ± 36−16.1 ± 21n = 8
Primary forest Crop and fallow land29 ± 2196.4 ± 46.375.5 ± 45.7−23.1 ± 14.2n = 9
Pasture/grasslandCropland27.6 ± 20.9102.5 ± 19.780.7 ± 17.3−24.3 ± 11.3n = 5
SD—Standard Deviation; * Relative change in SOC stock (%) values with (−) signs indicate loss of SOC from the previous land use/release of CO2 into the atmosphere; # Relative change in SOC stock (%) values are not calculated directly from the above A and B values, but using mean of individual % change.
Table 2. Summary of GHG fluxes for different land use changes (data source cited in Tables S5–S10).
Previous Land UseConverted Land UseNet SOC Stock Change (t C/ha/year) * (Mean ± SD)Net SOC-CO2e Flux (CO2e t/ha/year) * (Mean ± SD)Net N2O-Flux (N2O kg/ha/year) * (Mean ± SD)Net CH4-Flux (CH4 kg/ha/year) * (Mean ± SD)
Primary forest Oil palm 1.17 ± 2.394.29 ± 8.75 (n = 40)na0.33
Secondary forestOil palm−0.52 ± 2.09−1.92 ± 7.66 (n = 11)0.095 ± 1.42 (n = 2)0.86 ± 1.14 (n = 3)
Pasture/grasslandOil palm 0.28 ± 0.371.03 ± 1.35 (n = 3)nana
Cropland—Slash-and-burn AgricultureOil palm1.51 ± 0.795.54 ± 2.9 (n = 5)nana
Primary forestRubber0.78 ± 1.612.87 ± 5.91 (n = 34)−0.23 ± 0.04 (n = 2)1.78 ± 1.41(n = 2)
Secondary forestRubber0.62 ± 0.382.26 ± 1.39 (n = 8)−0.65 ± 0.29 (n = 3)1.52 ± 0.71 (n = 3)
Secondary forestOld Rubber, >8–10 years, after tappingnana1.563.48
Pasture/grasslandYoung Rubber/other tree plantation−1.01 ± 1.40−3.69 ± 5.12 (n = 3)nana
Pasture/grasslandOld Rubber/Broad-leaf tree plantation0.87 ± 0.723.19 ± 2.65 (n = 3)nana
Secondary forestOther perennial tree plantation0.45 ± 0.431.63 ± 1.58 (n = 6)−0.470.25
Primary forestOther perennial tree plantation0.65 ± 0.922.39 ± 3.36 (n = 23)na3.10
Primary forestSecondary forestnana0.25 ± 0.10 (n = 2)−0.02 ± 0.67 (n = 2)
Primary forest Paddy ricenanana70.48 ± 90.26 (n = 2)
Primary forestPasture, (degraded, old)nana−2.11 ± 2.01(n = 4)na
Primary forestPasture and cropland 0.58 ± 0.352.11 ± 1.29 (n = 9)9.38 ± 6.38 (n = 2)4.89 ± 7.46 (n = 6)
Primary forestCrop and fallow1.31 ± 1.524.81 ± 5.58 (n = 9)nana
Pasture/grasslandCropland1.32 ± 1.074.85 ± 3.93 (n = 4)nana
Secondary forestGrasslandsnana−1.19 ± 0.17 (n = 3)na
Secondary forest/Woodland savannahCultivated pasture, cropland0.67 ± 0.852.44 ± 3.1 (n = 8)2.84 ± 5.56 (n = 5)0.30 ± 1.88 (n = 4)
* Net annual SOC stock changes were calculated assuming linear changes over time (time varies from one to 35 years); na, not available.
Table 3. Total GHG emissions (CO2e kg/ha/year) following land use change from tropical mineral soils (data source: Table 2 for SOC and Tables S5–S10 for N2O and CH4 fluxes).
Previous Land UseConverted Land UseSOC Flux (Mean ± SD)N2O Flux (Mean ± SD)CH4 Flux (Mean ± SD)Total GHG Emissions (Mean ± SD)
CO2-Equivalent (kg/ha/year)
Primary forestOil palm plantation4290 ± 8750na9.24*
Secondary forestOil palm plantation−1920 ± 766025.18 ± 37724.17 ± 32−1870 ± 8068
Primary forestRubber plantation2870 ± 5910−60.95 ± 1149.84 ± 402859 ± 5961
Secondary forestRubber plantation2260 ± 1390−171.37 ± 7742.47 ± 202131 ± 1487
Secondary forestOther perennial tree plantation1630 ± 1580−124.557.01512 ± 1580
Primary forestPasture, cropland and fallow2110 ± 12902485.7 ± 1690136.88 ± 2094733 ± 3189
Secondary forest/Woodland savannahCultivated pasture, cropland2440 ± 3100753.13 ± 14748.33 ± 533201 ± 4627
Conversion to CO2 equivalents (CO2-e) are 265 for N2O and 28 for CH4 [83]; na, not available; * no data for N2O emissions and total GHG not estimated.

