Article

Genetic Diversity of Lowbush Blueberry throughout the United States in Managed and Non-Managed Populations

1
College of Food, Agriculture, and Environmental Sciences, Ohio State University Extension, Trumbull County, Cortland, OH 44410, USA
2
Genetic Improvement of Fruits and Vegetables Laboratory, Henry A. Wallace Beltsville Agricultural Research Center, U.S. Department of Agriculture, Agricultural Research Service, Beltsville, MD 20705, USA
3
School of Biology and Ecology, University of Maine, Orono, ME 04469, USA
*
Author to whom correspondence should be addressed.
Agriculture 2019, 9(6), 113; https://doi.org/10.3390/agriculture9060113
Submission received: 2 May 2019 / Revised: 24 May 2019 / Accepted: 25 May 2019 / Published: 30 May 2019
(This article belongs to the Special Issue North American Native Food Crops)

Abstract

:
Expressed sequenced tagged-polymerase chain reaction (EST-PCR) molecular markers were used to evaluate the genetic diversity of lowbush blueberry across its geographic range and to compare diversity among four paired managed/non-managed populations. Seventeen populations were sampled in a north–south transect throughout the eastern United States with 27 km to 1600 km separating populations. The majority of genetic variation was found within populations (75%) with each population genetically unique (p ≤ 0.0001) with the exception of the Jonesboro, ME, and Lubec, ME, populations. The effects of management for commercial fruit harvesting on genetic diversity were investigated in four locations in Maine with paired managed and non-managed populations. Significant differences were found between the populations indicating that commercial management for fruit production influences the diversity of lowbush blueberries in the landscape, even though planting does not occur. Forests are harvested and the existing understory blueberry plants become established.

1. Introduction

Lowbush blueberry (Vaccinium angustifolium Aiton) is an outcrossing, rhizomatous, tetraploid (2n = 4× = 48) woody perennial in the family Ericaceae. It is native to eastern North America from Newfoundland, Canada, south to North Carolina and west to Manitoba (United States Department of Agriculture (USDA) Plants Database; [1]). Plants are commonly found in disturbed acidic soils, especially glacial outwash plains, but also in forests, bogs, or exposed rocks [2,3]. Multiple cold hardiness zones are present throughout its geographic range. Lowbush blueberries are valued primarily for their fruit, but also for their leaves for tea, and utility as a horticultural plant in the landscaping industry. Management for commercial fruit production is primarily located in Maine, Quebec, and the Canadian Maritimes with the largest acreage in the vast barrens along the Atlantic coast [4]. Lowbush blueberry is unique among fruit crops, as fields are not planted with cultivars of known traits, or genetics. Rather, an area of forest is cleared and managed with fire, mowing, and herbicides to promote the growth and spread of existing understory plants through rhizomes and the colonization of bare ground by new plants via seeds [5]. The resulting field is a mosaic of genetically unique plants, referred to as “clones”, that are visually distinct with varying pollination, yields, cold hardiness, fertility response and susceptibility to pests [6,7,8,9].
The underlying genetic diversity of lowbush blueberry is relatively unknown compared to other fruit crops [8]. Recently, a variety of techniques and molecular markers have been used to investigate the genetic heterogeneity and relatedness of V. angustifolium populations [1,8,10,11,12,13,14,15]. These studies have shown V. angustifolium to be highly diverse in Maine and the Canadian Maritimes. Restricted geographic sampling may not detect diversity influenced by latitudinal clines and geographic factors [16]. Latitudinal clines also drive the development of ecotypes in regards to photoperiod sensitivity and cold hardiness within a species [17,18]. Air temperatures are expected to increase by 1.1–1.7 °C in the primary lowbush blueberry producing regions of North America by 2050 due to climate change [19]. Already, growers in Maine are experiencing a growing season that has increased by one month since 1950 resulting in an increase in pests and pathogens [20], fall bloom [21] and 50% more days with precipitation during bloom [22].
Vaccinium angustifolium is believed to be one of the first blueberry species to be managed in North America. Clearing and burning of forests by Native Americans for harvesting occurred before the arrival of Europeans [23]. Although attempts have been made to improve or develop cultivars, cultivation has remained unchanged for hundreds of years, relying on wild plant populations pre-existing in fields [24,25]. It is assumed that plants managed for commercial harvesting retain the same genetic diversity as plants growing in a mature forest, however there has been no investigation to evaluate these assumptions. Loss of diversity has been documented in many domesticated crops as they have been selected by humans [26,27]. Despite its relatively recent domestication (1939), commercially important rabbiteye blueberry (Vaccinium virgatum Aiton) cultivars can be traced to four individual plants and as such inbreeding depression and high genetic load in cultivars have been an issue for breeders [28]. Existing lowbush genotypes in the landscape could have a founder effect on the genetic diversity of lowbush fields. A large stochastic event of removing forest cover may result in a population of plants ultimately descended from relatively few parents [29].
The objective of this study was to utilize expressed sequenced tagged-polymerase chain reaction (EST-PCR) molecular markers developed for use in Vaccinium species to evaluate the genetic diversity of lowbush blueberry across the eastern United States and to compare diversity between managed and non-managed populations [30]. Increasing the geographic assessment of population genetic composition will provide a landscape-level quantification of the genetic diversity in lowbush blueberry throughout a large portion of its native range. Sampling populations representing climates warmer than those found in Maine and the Canadian Maritimes may provide insight into how diversity may change in northern populations with rising annual temperatures, fewer chilling hours, and an increased growing season due to climate change. Additionally, incorporating managed and non-managed populations will help determine whether commercial management changes the genetics of the species.

2. Materials and Methods
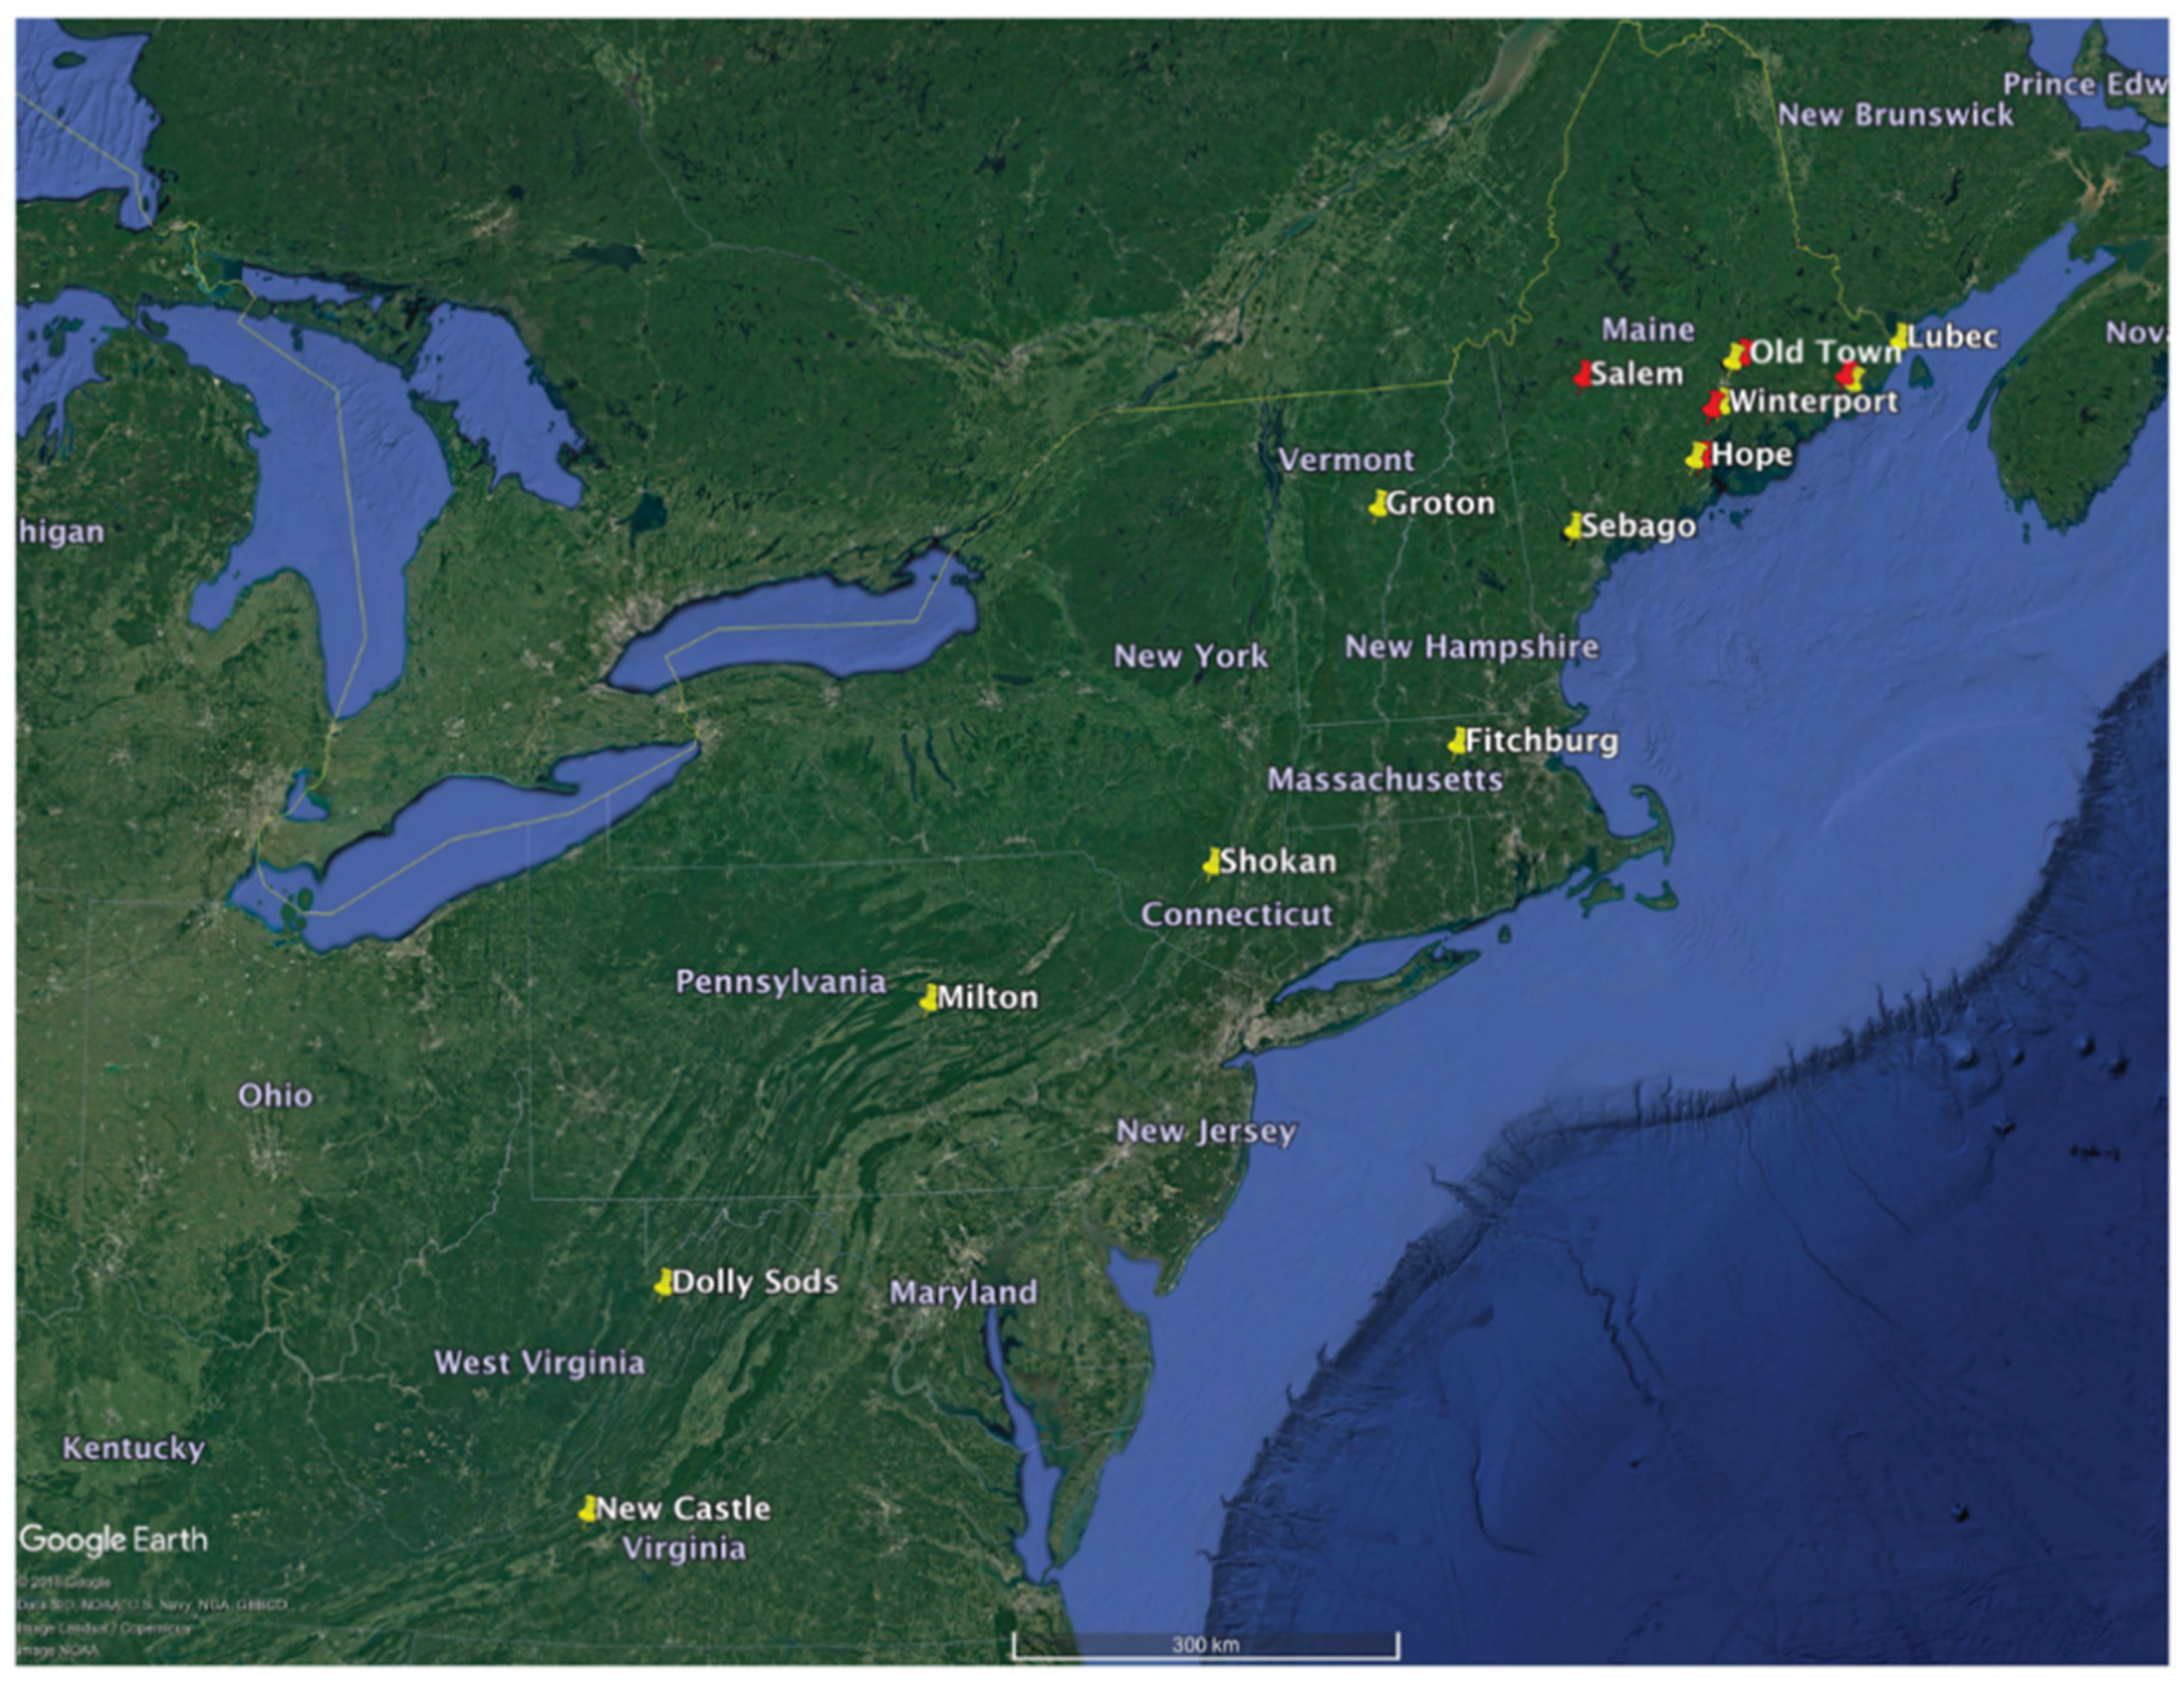
2.1. Plant Material

Lowbush blueberry stems and leaves were collected from seven locations in Maine (Lubec, Jonesboro, Old Town, Winterport, Hope, Salem, and Sebago) representing areas of primary fruit production within the state. These locations were geographically separated by at least 27 km. Populations outside of Maine (n = 6) were selected based upon prior knowledge of existing populations along a general north to south transect that would represent the geographic range in the eastern United States. These sites included Fitchburg, MA, Groton, VT, Shokan, NY, Milton, PA, Dolly Sods, WV, and New Castle, VA (Figure 1). Several USDA cold hardiness zones were represented in the populations from 4b (−31.7 to −28.9 °C) in Salem, ME to 7a (−17.8 to −15 °C) in New Castle, VA, USA (http://planthardiness.ars.usda.gov/PHZMWeb/).
To assess genetic diversity among managed commercial fields and wild unmanaged landscapes, we collected plants in a paired design in four regions in Maine making a total of 11 populations sampled in Maine (four paired and three not paired). The four “paired” populations were sampled by collecting 20 individual plants from a field managed for fruit production and 20 individual plants from an adjacent (>500 m) forest with no historical record or evidence (large mature tree stands) of management. These paired populations were sampled in Hope, Winterport, Old Town, and Jonesboro, ME. The buffer of at least 500 m between managed fields and natural areas in each pair was chosen to minimize any management “overflow” in commercial fields that could have impacted the plants in the natural areas over time, but at the same time be within the average bee-foraging distance [31] and the hypothesized fruit/seed dispersal range by birds [12].
Approximately one gram of leaf material was collected from 12–20 genetically distinct individuals in each population along transects. Since lowbush blueberry is rhizomatous, care was taken to collect from samples that were visually distinct, at least 6 m from the nearest sampled neighbor, and large enough to survive leaf removal. Plants were taxonomically verified to ensure only V. angustifolium was sampled and not visually similar (V. myrtilloides, V. boreale, and V. pallidum) which are commonly found in the same landscapes [32].

2.2. DNA Isolation and Amplification

Genomic DNA was isolated from approximately 2 mg of young, still expanding, leaf material using Qiagen DNeasy Plant Mini Kit (Valencia, CA, USA) or a CTAB (cetyl trimethylammonium bromide) extraction protocol developed by Doyle and Doyle [33]. DNA concentration and purity was measured with a Thermo Scientific NanoDrop 2000 spectrophotometer (Wilmington, DE, USA). Primer pairs previously reported in lowbush blueberry diversity studies were used, and additional EST-PCR molecular marker primers were developed from V. corymbosum EST sequences available in the blueberry genomic database (BBGD454) representing known general housekeeping and stress response genes [11,12,34]. Primer sequences were designed to amplify as much of the target gene as possible by choosing primer sequences at extreme 5′ and 3′ ends of an EST sequence using the Primer3 interface [35]. Eleven stress response [36,37], and 10 general housekeeping genes [38] were screened for polymorphisms and suitability for genetic diversity analysis. A total of 45 primer pairs were screened for this study, of which 16 were used for analysis (Table 1). Amplification protocols were performed as previously described by Rowland et al. [39]. An AdvanCE FS96 systemTM (Advanced Analytical Technologies; Ames, IA, USA) was used for separation and digital visualization of polymorphic bands via capillary electrophoresis.

2.3. Molecular Marker Analysis

Clearly defined, reproducibly amplified fragments between 200 and 1500 base pairs were scored as dominant markers (present or absent) with PROsizeTM software (Advanced Analytical Technologies; Ames, IA, USA). Primer pairs that failed to amplify in all individuals or that did not produce consistently reproducible bands were not used for further analysis. Binary scoring matrices for each EST-PCR primer pair were exported and combined in Microsoft ExcelTM for analysis with the GenAlExTM 6.5 statistical package add-in [40]. Distance measures (genetic and geographic) were calculated for single and combined populations to be used as the basis for analysis of molecular variance (AMOVA), spatial autocorrelation, and principal coordinate analysis (PCoA). Analysis of variance for band richness between populations was calculated with JMPTM software (SAS Institute 2017; Cary, NC, USA). Comparisons between managed and non-managed populations were made using non-parametric analysis of variance (PerMANOVA) measures in PC-ORD 6 with a 2-way factorial design, 4999 permutations, using Sorensen distance measures (MJM Software, Gleneden Beach, OR, USA). Bonferoni correction of p-values to maintain an overall experiment-wise error rate was conducted [41].

2.4. Sequencing of Amplified Fragments

Amplified fragments were sequenced to determine if polymorphic bands produced by EST-PCR molecular markers were different alleles in the tetraploid lowbush blueberry. DNA from 20 clones (10 managed and 10 non-managed) was amplified with a subset of 5 EST-PCR primer pairs that reliably produced 2–7 polymorphic bands. Each amplification was repeated three times per individual and then separated by electrophoresis on a 1.5% agarose gel. Bands were excised from the gel and pooled for extraction with the Qiagen QIAquick Gel Extraction Kit (Valencia, CA, USA). Sequencing of bands was performed at the University of Maine’s DNA Sequencing Facility (Orono, ME, USA). Sequences were aligned and assembled using Geneious R7 software (Biomatters, Auckland, New Zealand) before being compared with the original template EST sequence from which the primer was designed and similar sequences available in GenBank using a nucleotide BLAST (program to search a nucleotide database).

3. Results

3.1. Managed vs. Non-Managed Populations

The genetics of 175 clones were assessed with EST-PCR molecular markers. Of the 45 primer pairs tested, only 16 produced reliable bands with no missing data for further evaluation. Although GenAlEx can handle missing data (entered as −1), markers missing (not amplified) from a few locations were removed from all sites for comparing diversity among populations, as further analysis in PC-ORD 6 could not incorporate missing data. In all, a total of 142 polymorphic bands were used for comparing commercial fields and natural areas. AMOVA analysis with 9999 permutations estimated 75% of the total genetic variance within sampled populations and the remaining 25% was estimated to be among populations. Pairwise comparisons between populations provided evidence for significant differences (p < 0.0001) between all but one managed field and non-managed natural site in neighboring forest and also between location sites of the pairs, when Bonferoni corrected for the number of comparisons made (Table 2). Similarities among managed populations were observed based on PhiPT values (an FST analogue measure allowing intra-individual variation) compared to their non-managed natural site counterparts. Further analysis via PerMANOVA also provided evidence of differences between locations, management, and the interaction between location and management (p = 0.0002) (Table 3). While there is a trend for fewer polymorphic bands in the populations from managed fields when compared to non-managed natural site populations, this trend is not as large for the Hope location (p = 0.077, Figure 2). The contribution to overall diversity by stress-related primer pairs within and among managed and non-managed natural sites was also assessed with AMOVA. Separate AMOVA analyses were conducted for managed and non-managed populations using only stress-related primer pairs or only “neutral” primer pairs. Results of these analyses showed no increase or decrease in diversity between managed and non-managed populations based upon origin of primer pairs (p < 0.001 and p < 0.001, respectively) (data not shown).

3.2. Genetic Diversity throughout the Eastern United States

Of the 45 primer pairs screened, 24 EST-PCR markers were polymorphic and reliably amplified in greater than 90% of the sampled clones. Those individual plants with poor marker amplification were assigned −1 for analysis in GenAlEx [42]. A total of 202 polymorphic bands were used for analysis of 338 individuals in 17 populations. Prior results showed significant differences between managed and non-managed populations so paired populations were split and treated as individual populations. Seventy five percent of the variance associated within the populations with the remaining 25% found among populations with a total differentiation between populations of 0.252 (PhiPT, p ≤ 0.001) (Table 4). Pairwise comparisons suggest significant differences between almost all populations (p = 0.0001) with the exception of the non-managed Lubec, ME and managed Jonesboro, ME sites (p = 0.228) (Table 5). With the entire data set, populations tended to be more similar, although statistically different, among managed locations when compared to non-managed populations based on PhiPt values (PhiPt 0.037, 0.049, 0.101, 0.405, p < 0.100).

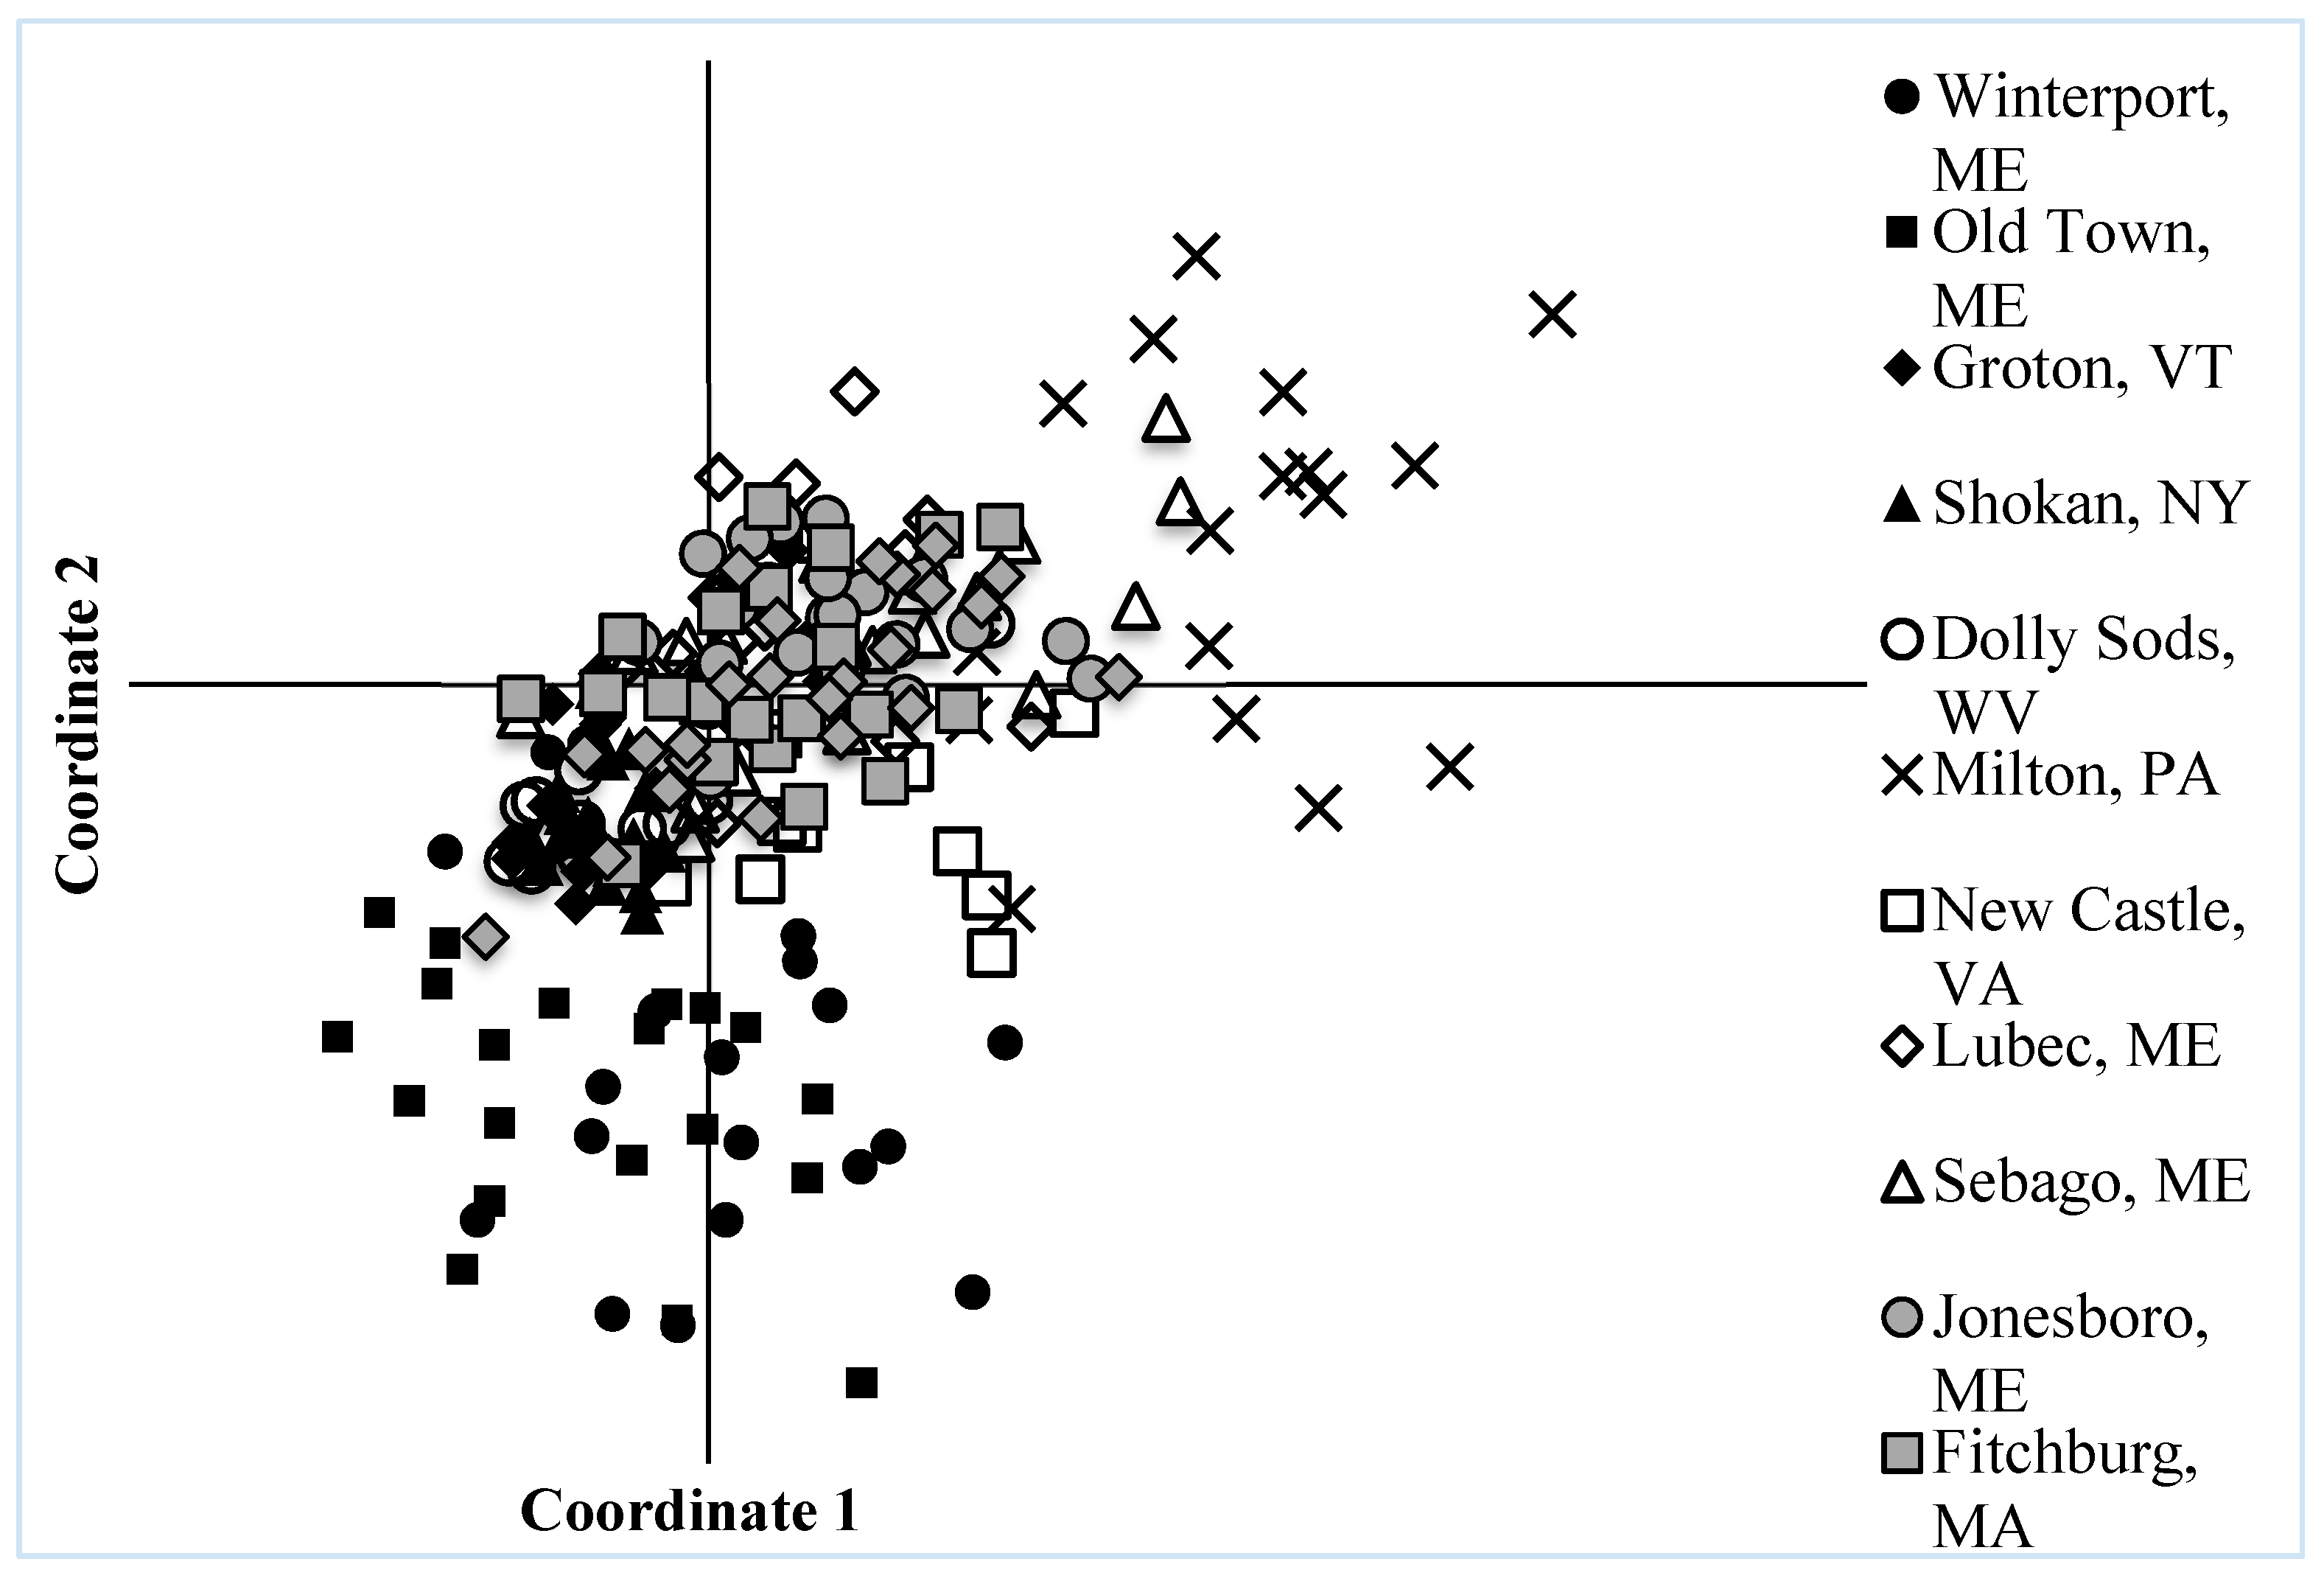
3.3. Spatial Analysis and Population Structure

Spatial autocorrelation was performed on all 17 populations with variable distance classes representing intra-field distance classes (50 m, 100 m, 250 m) and inter-field distance classes (500 m, 1000 m, 2.5 km, 10 km, 25 km, 100 km, and 1000 km) (Figure 3). Distance influenced genetic heterogeneity at the 50 m and 1000 m class as the calculated r fell above the upper confidence limit (95%). Principal coordinate analysis (PCoA) showed no clearly defined populations based on geographic and genetic distance (Figure 4). Spatial autocorrelation in conjunction with PCoA show limited spatial structure in lowbush blueberry, primarily within field distances. We attempted to cluster similar individuals with STRUCTURE software using Bayesian algorithms [43]. This was ultimately unsuccessful (data not shown), as an increasingly high number (100+) of K populations were needed for successful clustering providing little information about population structure over a large geographic range [44].

3.4. Evaluation of Stress-Related Expressed Sequenced Tagged-Polymerase Chain Reaction (EST-PCR) Molecular Markers

EST-PCR primers were developed from EST sequences of housekeeping and stress-related genes with the hypothesis that EST-PCR molecular markers would produce a higher rate of polymorphic bands due to the relaxed selective pressure compared to housekeeping genes [45]. Our results found this not to be the case as the average number of bands per primer pair designed from stress genes and housekeeping genes did not differ significantly, 7.0 and 7.16 respectively (p = 0.863). We also observed no difference in the frequency of the number of bands between management. EST-PCR markers developed from stress-related genes proved useful for genetic diversity analysis, but they did not have an advantage over the existing EST-PCR markers in terms of increased number of bands or frequency between populations. The effect of latitude and cold hardiness zone on the number of stress-related bands were evaluated with linear regression analysis. Neither latitude (r2 = 0.244, p = 0.126) nor cold hardiness zone (r2 = 0.452, p = 0.494) had a significant effect on the number of stress-related bands present in any of the sampled populations (data not shown).

3.5. Sequencing of Selected Polymorphic Bands

All sequenced bands were homologous to primer sequences at the ends, but BLAST results varied in regards to similarities with the original EST sequence from which they were designed. Generally, sequences of the same size and primer pair were highly homologous (>90%) between all 20 lowbush blueberry clones with most variation between sequences associated with gaps in the refined sequence resulting from background noise in the raw sequence contigs. At least one polymorphic band from each primer pair was homologous to the original EST sequence with other bands having little or no homology. Multiple polymorphic bands of differing size with homology to the original sequence, such as the case with primer 00064 bands of 210 bp and 250 bp, were highly similar (>98%) but the shorter sequence aligned to the middle of the longer sequence. Thus, we conclude that polymorphic bands for a particular EST marker do not generally represent different alleles.

4. Discussion

We found that lowbush blueberries managed for commercial production do not retain the same genetic diversity as found in an established forest. Although fields of lowbush blueberries are not planted with selected cultivars, management removes some genotypes from the landscape. The application of herbicides, such as hexazinone, for weed control can remove sensitive genotypes, which has been well documented in weedy species, but herbicide application can also have phytotoxic or lethal effects on lowbush blueberry plants [46,47,48]. Lowbush blueberry is managed on a two-year cycle, with a cropping year followed by a pruning year where the fields are mowed or burned [49]. Burn pruning for lowbush blueberry fields is an effective disease control measure as it removes pathogens in the stems and on the soil surface, but the intensity (heat and duration) can have a negative effect on the plants and the organic layer of the soil [49,50,51]. Although the negative effects of burn pruning have been contested, the increase in price of oil used for most burn applications has provided incentive for many growers to adopt flail mowing as an alternative pruning method with lower risk to the plants but again may negatively impact some genotypes [52].
If the Hope site populations are taken out for an analysis, there is significantly less genetic diversity in the managed populations in Old Town, Winterport, and Jonesboro when compared to the non-managed populations (p = 0.044). We are unable to draw conclusions about functional diversity in managed populations since polymorphic bands did not generally appear to represent alleles, as many of the sequenced polymorphic bands did not have homology to the original EST sequence from which the primer was designed, except at the ends. Other studies have found that the selection process under stress conditions results in a more tightly refined stress response pathway [45].
Domestication of wild crops (maize, wheat, apple, etc.) by the selection and planting of individuals with superior traits has resulted in a genetic bottleneck in many of our current traditionally-bred crops [26,53]. In contrast, intentional rogueing of plants is not a current practice among lowbush blueberry growers, so plants with less desirable traits remain in the gene pool retaining a higher-level diversity relative to domesticated plants.
Overall genetic diversity for lowbush blueberry was retained for all sampled populations reflecting the results of previous studies in Maine and the Canadian Maritimes [10,12,54] Bell et al. [12] described differences among four managed fields in the Down East region of Maine. Similar to our findings, Bell described variance (91.6%) associated within populations relative to among populations (8.4%). Positive spatial autocorrelation (SA) within fields at the 50 m-distance class found in our study was also reported by Bell et al. [12]. Differences between lowbush blueberry populations has been attributed to the last receding ice sheet that covered much of Maine [12]. Our results would not entirely support this hypothesis, as we found no correlation between diversity and latitude as would be expected with receding ice sheets [55]. Genetic differentiation as a result of geographic isolation has been found in bilberry (Vaccinium myrtillus L.) throughout Scandinavia, and the same may be true for lowbush blueberry here in North America but greater geographical separation than is reported here is likely to be a necessity [56]. The large geographic range, outcrossing, and animal seed dispersal traits associated with lowbush blueberry likely contributes to genetic diversity [57].
Our sampled populations from 8 states spanning 1600 km represent the native growing range of lowbush blueberry in the eastern United States. Spanning multiple cold hardiness zones, the populations are a good representation of climatic zones that could provide insight into how an increased average temperature may influence the lowbush blueberry industry in Maine. Wild plants can be found growing in a variety of cold hardiness zone from zone 0 (Quebec) to zone 7a (North Carolina. While plants may tolerate the extremes of the range, larger populations can be found in zones 4–6 which encompasses most of the commercial harvesting regions. Climate change has increased the growing season for lowbush blueberry by approximately one month in the past 50 years in Maine [20]. The revised USDA cold hardiness map in 2012 reflected warmer average minimum temperatures compared to the last map update in 1990 with the majority of Maine’s blueberry growing region shifting from predominantly zone 5a (−28.9 to −26.1 °C) to predominantly zone 5b (−26.1 to −23.3 °C) and to a lesser extent zone 6a (−23.3 to −20.6 °C). Populations sampled from warmer locations (New Castle, VA, Dolly Sods, WV, Milton, PA) maintained a high level of diversity similar to cooler, northern populations. Pairwise comparisons between each site and also comparisons between northern (ME, VT, MA, NY) and southern (VA, WV, PA) populations did not reveal any population structure based on latitude or prevailing hardiness zones. The numbers of stress-related marker bands also were not correlated with latitude or hardiness zone. Other studies have found population structure in lowbush blueberry based on geographic distances in the Canadian Maritimes and Quebec [58]. Our results did not show any population structure based on location, cold hardiness zone, and management. It is possible plants sampled for our study lack genetic isolation and inbreeding depression associated with genetic similarities [59].

5. Conclusions

These findings suggest that while growers in Maine may need to adapt management practices to a warmer and longer growing season, the overall genetic diversity of the plants would remain high, but might not provide the genetic ability to adapt rapidly to extreme climate change.

Author Contributions

L.B. collected and analyzed the data and wrote the first draft of the manuscript. L.J.R. provided expertise and technical assistance in conducting the genetic diversity assessment and she contributed to editing the manuscript. F.D. was involved in the conceptual design of the study, sampling protocol, assisted in the interpretation of statistical analyses, and contributed to the editing of the manuscript.

Funding

This research was made possible, in part, through support from the USDA National Institute of Food and Agriculture, Hatch project number ME0-21505, the Maine Agricultural and Forest Experiment Station. In addition, support was National Institute of Food and Agriculture, U.S. Department of Agriculture Agreement No. 2014-67014-21665 and the Wild Blueberry Commission of Maine. This is Maine Agricultural and Forest Experiment Station publication number 3664.

Acknowledgments

We would like to thank Daniel J. Bell for providing insight into the spatial pattern of lowbush blueberry genotypes across geographic space and Elizabeth L. Ogden for assistance in genotyping the plant samples with EST-PCR molecular markers. We would also like to thank the lowbush blueberry growers that allowed us to collect plant samples in their fields.

Conflicts of Interest

The authors declare no conflicts of interest. The funding agencies had no role in the design of the experiments; in the collection, analyses, or interpretation of the data; in the writing of the manuscript, or in the decision to publish the results.

References

  1. Bell, D.J.; Rowland, L.J.; Smagula, J.; Drummond, F.A. Recent Advances in the Biology and Genetics of Lowbush Blueberry. Tech. Bull. 2009, 203, 1–28. [Google Scholar]
  2. Vander Kloet, S.P. The Genus Vaccinium in North. America; Research Branch, Agriculture Canada: Ottawa, ON, Canada, 1988; 201p. [Google Scholar]
  3. Drummond, F.; Smagula, J.; Annis, S.; Yarborough, D. Organic Wild Blueberry Production. Tech. Bull. 2009, 852, 43. [Google Scholar]
  4. Yarborough, D. Factors contributing to the increase in productivity in the wild blueberry industry. Small Fruits Rev. 2004, 3, 33–43. [Google Scholar] [CrossRef]
  5. Barker, W.; Hall, I.; Aalders, L.; Wood, G. The lowbush blueberry industry in Eastern Canada. Econ. Bot. 1964, 18, 357–365. [Google Scholar] [CrossRef]
  6. Hepler, P.; Yarborough, D. Natural variability in yield of lowbush blueberries. HortScience 1991, 26, 245–246. [Google Scholar] [CrossRef]
  7. Cappiello, P.; Dunham, S. Seasonal variation in low-temperature tolerance of Vaccinium angustifolium Ait. HortScience 1994, 29, 302–304. [Google Scholar] [CrossRef]
  8. Bell, D.J.; Stommel, J.; Rowland, L.; Drummond, F. Yield variation among clones of lowbush blueberry as a function of kinship and self-compatibility. J. Am. Soc. Hort. Sci. 2010, 135, 259–270. [Google Scholar] [CrossRef]
  9. Penman, L.N.; Annis, S.L. Leaf and flower blight caused by Monilinia vaccinii-corymbosi on lowbush blueberry: Effects on yield and relationship to bud phenology. Phytopathology 2005, 95, 1174–1182. [Google Scholar] [CrossRef] [PubMed]
  10. Burgher, K.L.; Jamieson, A.R.; Lu, X. Genetic relationships among lowbush blueberry genotypes as determined by randomly amplified polymorphic DNA analysis. J. Am. Soc. Hort. Sci. 2002, 127, 98–103. [Google Scholar] [CrossRef]
  11. Bell, D.J.; Rowland, L.; Drummond, F.; Polashock, J. Suitability of EST-PCR markers developed in highbush blueberry (Vaccinium corymbosum L.) for genetic fingerprinting and relationship studies in lowbush blueberry and related species. J. Am. Soc. Hort. Sci. 2008, 133, 701–707. [Google Scholar] [CrossRef]
  12. Bell, D.J.; Rowland, L.; Zhang, D.; Drummond, F. Spatial genetic structure of lowbush blueberry, Vaccinium angustifolium, in four fields in Maine. Botany 2009, 87, 932–946. [Google Scholar] [CrossRef]
  13. Bell, D.J.; Rowland, L.; Drummond, F. Does pollen ‘neighborhood’ affect berry yield in lowbush blueberry (Vaccinium angustifolium Ait)? Int. J. Fruit Sci. 2012, 12, 65–74. [Google Scholar] [CrossRef]
  14. Bell, D.J.; Drummond, F.; Rowland, L. Evidence of functional gender polymorphisms in a population of the hermaphroditic lowbush bluberry (Vaccinium angustifolium). Botany 2012, 90, 393–399. [Google Scholar] [CrossRef]
  15. Rowland, L.J.; Bell, D.J.; Alkharouf, N.; Bassil, N.V.; Drummond, F.; Beers, L.; Buck, E.; Finn, C.E.; Graham, J.; Mccallum, S.; et al. Generating genomic tools for blueberry improvement. Int. J. Fruit Sci. 2012, 12, 276–287. [Google Scholar] [CrossRef]
  16. Eckert, C.G.; Samis, K.E.; Lougheed, S.C. Genetic variation across species’ geographical ranges: The central–marginal hypothesis and beyond. Mol. Ecol. 2008, 17, 1170–1188. [Google Scholar] [CrossRef] [PubMed]
  17. Howe, G.T.; Hackett, W.P.; Furnier, G.R.; Klevorn, R.E. Photoperiodic responses of a northern and southern ecotype of black cottonwood. Physiol. Plant 1995, 93, 695–708. [Google Scholar] [CrossRef]
  18. Friedman, J.; Roelle, J.; Gaskin, J.; Pepper, A.; Manhart, J. Latitudinal variation in cold hardiness in introduced Tamarix and native Populus. Evol. Appl. 2008, 1, 598–607. [Google Scholar]
  19. Fernandez, I.J.; Schmitt, C.; Stancioff, E.; Birkel, S.D. Maine’s Climate Future: 2015 Update; University of Maine Climate Change Institute: Orono, ME, USA, 2015; 20p. [Google Scholar]
  20. Drummond, F.A.; Yarborough, D.E. Growing season effects on wild blueberry (Vaccinium angustifolium) in Maine and implications for management. Acta Hortic. 2012, 1017, 101–107. [Google Scholar] [CrossRef]
  21. Collins, J.A.; Drummond, F. Fertilizer and fungicides: Effects on wild blueberry growth, insect attack, and leaf spot disease incidence. In Proceedings of the North American Blueberry Research and Extension Workers Conference, Orono, ME, USA, 12–15 August 2018. [Google Scholar]
  22. Drummond, F.A.; Dibble, A.C.; Stubbs, C.; Bushmann, S.; Ascher, J.S.; Ryan, J. A Natural History of Change in Native Bees Associated with Lowbush Blueberry in Maine. Northeast. Nat. 2017, 24, 49–68. [Google Scholar] [CrossRef]
  23. Eck, P.; Childers, N.F. Blueberry Culture; Rutgers University Press: New Brunswick, NJ, USA, 1966; 400p. [Google Scholar]
  24. Hall, I.; Aalders, L. Blomidon Lowbush Blueberry. Can. J. Plant Sci. 1992, 62, 519–521. [Google Scholar] [CrossRef]
  25. Hall, I. Genetic improvement of the lowbush blueberry, Vaccinium angustifolium. Can. J. Plant Sci. 1983, 63, 1091–1092. [Google Scholar] [CrossRef]
  26. Doebley, J.F.; Gaut, B.S.; Smith, B.D. The molecular genetics of crop domestication. Cell 2006, 127, 1309–1321. [Google Scholar] [CrossRef]
  27. van de Wouw, M.; Kik, C.; van Hintum, T.; van Treuren, R.; Visser, B. Genetic erosion in crops: Concept, research results and challenges. Plant Gen. Resour. 2009, 8, 1. [Google Scholar] [CrossRef]
  28. Aruna, M.; Ozias-Akins, P.; Austin, M.; Kochert, G. Genetic relatedness among rabbiteye blueberry (Vaccinium ashei) cultivars determined by DNA amplification using single primers of arbitrary sequence. Genome 1993, 36, 971–977. [Google Scholar] [CrossRef] [PubMed]
  29. Loveless, M.D.; Hamrick, J.L. Ecological determinants of genetic structure in plant populations. Ann. Rev. Ecol. Syst. 1984, 15, 65–95. [Google Scholar] [CrossRef]
  30. Rowland, L.J.; Dhanaraj, A.L.; Polashock, J.J.; Arora, R. Utility of blueberry-derived EST-PCR primers in related Ericaceae species. HortScience 2003, 38, 1428–1432. [Google Scholar] [CrossRef]
  31. Groff, S.C.; Loftin, C.S.; Drummond, F.A.; Bushmann, S.; McGill, B. Spatial prediction of lowbush blueberry native bee pollinators in Maine, USA. Environ. Model. Softw. 2016, 79, 1–9. [Google Scholar] [CrossRef]
  32. Gleason, H.A.; Cronquist, A. Manual of Vascular Plants of Northeastern United States and Adjacent Canada, 2nd ed.; Botanical Garden: New York, NY, USA, 1991; 910p. [Google Scholar]
  33. Doyle, J.J.; Doyle, J.L. A rapid DNA isolation procedure for small quantities of fresh leaf tissue. Phytochem. Bull. 1987, 19, 11–15. [Google Scholar]
  34. Darwish, O.; Rowland, L.J.; Alkharouf, N.W. BBGD454: A database for transcriptome analysis of blueberry using 454 sequences. Bioinformation 2013, 9, 883–886. [Google Scholar] [CrossRef] [Green Version]
  35. Untergasser, A.; Cutcutache, I.; Koressaar, T.; Ye, J.; Faircloth, B.C.; Remm, M.; Rozen, S.G. Primer3—New capabilities and interfaces. Nucleic Acids Res. 2012, 40, e115. [Google Scholar] [CrossRef]
  36. Thomashow, M.F. Plant cold acclimation: Freezing tolerance genes and regulatory mechanisms. Annu. Rev. Plant Physiol. Plant Mol. Biol. 1999, 50, 571–599. [Google Scholar] [CrossRef] [PubMed]
  37. Shinozaki, K.; Yamaguchi-Shinozaki, K. Gene networks involved in drought stress response and tolerance. J. Exp. Bot. 2007, 58, 221–227. [Google Scholar] [CrossRef]
  38. Coker, J.S.; Davies, E. Selection of candidate housekeeping controls in tomato plants using EST data. BioTechniques 2003, 35, 740–748. [Google Scholar] [CrossRef] [PubMed]
  39. Rowland, L.J.; Mehra, S.; Dhanaraj, A.; Ogden, E.L.; Slovin, J.P.; Ehlenfeld, M.K. Development of EST-PCR markers for DNA fingerprinting and genetic relationship studies in blueberry (Vaccinium, section Cyanococcus). J. Am. Soc. Hort. Sci. 2003, 128, 682–690. [Google Scholar] [CrossRef]
  40. Peakall, R.; Smouse, P. GENALEX 6: Genetic analysis in Excel. Population genetic software for teaching and research. Mol. Ecol. Notes. 2006, 6, 288–295. [Google Scholar] [CrossRef]
  41. Simes, R.J. An improved Bonferroni procedure for multiple tests of significance. Biometrika 1986, 73, 751–754. [Google Scholar] [CrossRef]
  42. Peakall, R.; Smouse, P. GenAlEx 6.5: Genetic analysis in Excel. Population genetic software for teaching and research—An update. Bioinformatics 2012, 28, 2537–2539. [Google Scholar] [CrossRef]
  43. Pritchard, J.K.; Stephens, M.; Donnelly, P. Inference of population structure using multilocus genotype data. Genetics 2000, 155, 945–959. [Google Scholar]
  44. Evanno, G.; Regnaut, S.; Goudet, J. Detecting the number of clusters of individuals using the software STRUCTURE: A simulation study. Mol. Ecol. 2005, 14, 2611–2620. [Google Scholar] [CrossRef]
  45. Zhen, Y.; Ungerer, M. Relaxed selection on the CBF/DREB1 regulatory genes and reduced freezing tolerance in the southern range of Arabidopsis thaliana. Mol. Biol. Evol. 2008, 25, 2547. [Google Scholar] [CrossRef]
  46. Holt, J.S.; Powles, S.B.; Holtum, J. Mechanisms and agronomic aspects of herbicide resistance. Ann. Rev. Plant Biol. 1993, 44, 203–229. [Google Scholar] [CrossRef]
  47. Yarborough, D.; Cote, J. Pre-and post-emergence applications of herbicides for control of resistant fine leaf sheep fescue in wild blueberry fields in Maine. In Proceedings of the North American Blueberry Research and Extension Workers Conference, Atlantic City, NJ, USA, 23–26 June 2014. [Google Scholar]
  48. Jensen, K.I.N.; Yarborough, D.E. An Overview of Weed Management in the Wild Lowbush Blueberry—Past and Present. Small Fruits Rev. 2004, 3, 229–255. [Google Scholar] [CrossRef]
  49. Yarborough, D. Wild blueberry culture in Maine. Univ. Maine Coop. Ext. Fact. Sheet. 2015. No. 220. Available online: https://extension.umaine.edu/blueberries/factsheets/production/wild-blueberry-culture-in-maine/ (accessed on 28 May 2019).
  50. DeGomez, T. Pruning lowbush blueberry fields. Univ. of Maine Cooop. Ext. Wild Blueberry Fact. Sheet. 1988. No. 229. Available online: https://extension.umaine.edu/blueberries/factsheets/production/pruning-lowbush-blueberry-fields/ (accessed on 28 May 2019).
  51. Smith, D.W.; Hilton, R.J. The Comparative Effects of Pruning by Burning or Clipping on Lowbush Blueberries in North-Eastern Ontario. J. Appl. Ecol. 1971, 8, 781. [Google Scholar] [CrossRef]
  52. Hanson, E.J.; Ismail, A.A.; Metzger, H.B. A Cost Analysis of Pruning Procedures in Lowbush Blueberry Production; Life Sciences and Agriculture Experiment Station: Ithaca, NY, USA, 1982; Bulletin 780. [Google Scholar]
  53. Rao, V.R.; Hodgkin, T. Genetic diversity and conservation and utilization of plant genetic resources. Plant Cell Tissue Organ. Culture 2002, 68, 1–19. [Google Scholar]
  54. Debnath, S.C. Development of ISSR markers for genetic diversity studies in Vaccinium angustifolium. Nordic J. Botany 2009, 27, 141–148. [Google Scholar] [CrossRef]
  55. Hewitt, G. The genetic legacy of the Quaternary ice ages. Nature 2000, 405, 907–913. [Google Scholar] [CrossRef] [PubMed]
  56. Zoratti, L.; Palmieri, L.; Jaakola, L.; Häggman, H. Genetic diversity and population structure of an important wild berry crop. AoB Plants 2015, 7, plv117. [Google Scholar] [CrossRef]
  57. Hamrick, J.L.; Godt, M.J.W.; Sherman-Broyles, S.L. Factors influencing levels of genetic diversity in woody plant species. New For. 1992, 6, 95–124. [Google Scholar] [CrossRef]
  58. Tailor, S.; Bykova, N.V.; Igamberdiev, A.U.; Debnath, S.C. Structural pattern and genetic diversity in blueberry (Vaccinium) clones and cultivars using EST-PCR and microsattelite markers. Genet. Resour. Crop. Evol. 2017, 64, 2071–2081. [Google Scholar] [CrossRef]
  59. Willi, Y.; Van Buskirk, J. Genomic compatibility occurs over a wide range of parental genetic similarity in an outcrossing Plant. Proc. R. Soc. 2005, 272, 1533–1538. [Google Scholar]
Figure 1. Sampled lowbush blueberry populations. Populations were collected along a 1600 km transect and represented a range of cold hardiness zones and a general north to south gradient which includes a large portion of the native growing range in the eastern United States (Gleason and Cronquist, 1991). Populations in Maine include plants commercially managed (red pins) for fruit production (Jonesboro, Old Town, Winterport, Hope, Salem) and plants from non-managed (yellow pins) natural forested landscape sites (Lubec, Jonesboro, Old Town, Winterport, Hope, Sebago). All locations outside of Maine were sampled from a forested landscape with no known history of commercial management.
Agriculture 09 00113 g001
Figure 2. Number of polymorphic bands in lowbush blueberry populations managed for commercial production and those from non-managed populations in mature forests without a known history of commercial management.
Agriculture 09 00113 g002
Figure 3. Spatial autocorrelation analysis. Distance classes (meters) were assigned to represent the distances between clones in a population (≤50 m) and the distances between populations at different sites (≥1000 m). Dashed lines indicate the upper and lower 95% confidence intervals while the solid line indicates the calculated r. Positive spatial structure appears at 50 m within a population and then again at 1 km among sites.
Agriculture 09 00113 g003
Figure 4. Principal coordinates (PCoA) analysis of genetic composition of non-managed lowbush blueberry populations (n = 11).
Agriculture 09 00113 g004
Table 1. Primer pairs used for analyses that yielded reproducible polymorphic bands throughout the dataset.
Primer NameSequence (5′ to 3′)Tm (°C)Annealing Temperature (°C)
02675AAGGAAGGGGGAGGGTTTAT5849
AAAAAGGGGCACAAAGAAGAA54
00125AGTAGGGGACACAGCCACAC6255
TGGCAGAGGGTAGAACTTGC60
00064CACAGTTTTGACGGTGATGG 5651
TGATTGCTGCACCAAGACTC58
COAAACTACCCGATGTCGATGC 5749
TCACAAAAACGATGGAACGA54
00313CAGCACAAATTGCAGAGCAT 5650
GCATGGGAAAGGAATTCTGA55
NA799TTTACCTCCCTTTGCCACAC 5752
GGAAATCCCACAGCTCAGAA57
CA448FGTGGGCAGAGTGAGGAAGAG 6053
ACACAAACCAGGGAGAAACG58
CA15FACCAAAGCTGAGCAACCAAT 5752
GTCTGCCATGAAAACCCAAC57
CA65FGTCGAATCCGAAGCCTTCTC 5848
AAACAGCAAATTCCCAATCG53
CA1463GAAGATGTCGTGGAGGTGGT 5951
TAATGCGGGTTGATGTAGCA56
CA1423TCATAGCCAATACACTCGAACC5651
GCCCCACCTTAGCAAATC56
CA1785LCACCACCACTGCGTACACC6250
GCATGAGCCGAACATAATCA55
EST133AAACAATCCACCAATCAACTTGT5449
CCTCTCCACAGTCCGATCAA59
EST193GAGGGATTCAGCACGAAGAG5850
CAACATCATCAACCCCAACA55
EST248TGGAGACTGGAGTGATGCAA5849
AAGTGCATTAAGCATCCGAAA54
EST1029GAAGTTTTCCGTTCTCTGCAA5550
CTGCAGCTAGGACCGAAGAG60
Table 2. Pairwise analysis of molecular variance (AMOVA) comparison between populations currently managed for commercial blueberry production and those from a mature forest not managed for fruit production. p-values are shown (random > data) based on 9999 permutations in GenAlEx 6.5. All populations are significantly different from all others, except Jonesboro managed from Winterport managed when the p-values are Bonferoni corrected. The Old Town managed is different at p ≤ 0.10 (Bonferoni corrected) from the Jonesboro managed. Managed populations are significantly different from their associated paired non-managed population (bold p -values) found in close proximity (≤500 m).
ManagedNon-Managed
HopeJonesboroOld TownWinterportHopeJonesboroOld TownWinterport
Non-
Managed
Winterport0.00010.00010.00010.00010.00010.00010.0001
Old Town0.00010.00010.00010.00010.00010.0001
Jonesboro0.00010.00010.00010.00010.0001
Hope0.00010.00010.00010.0001
ManagedWinterport0.00010.0056 (ns)0.0001
Old Town0.00010.0023 †
Jonesboro0.0001
Hope
p-value ≤ 0.10 when Bonferoni corrected to adjust for the number of comparisons.
Table 3. Non-parametric analysis of variance (PerMANOVA) for paired (location) managed and non-managed population comparisons. Significant differences are found between location, management, and the interaction (p = 0.0002), where df = degrees of freedom, SS = sums of squares, MS = mean square, F = F statistic, and p = probability of significance.
SourcedfSSMSFp
Location37.12332.374416.2990.0002
Management13.78563.785625.9860.0002
Interaction33.10311.03447.10040.0002
Residual15222.1430.14568
Total15936.155
Table 4. AMOVA for all sampled populations with 9999 permutations. The majority of the variance associated with our data (75%) is found within the populations with the remainder (25%) found among the populations. There are significant differences between populations (p ≤ 0.0001) indicating a high level of genetic diversity. This is confirmed with a relatively high PhiPT (0.252) for all populations showing little similarity among populations.
SourcedfSSMSEst. Var.%
Among Pops161482.82192.6764.06325%
Within Pops3213878.99512.08412.08475%
Total3375361.817 16.147100%
StatValuep
PhiPT0.2520.0001
Table 5. Pairwise comparison via AMOVA with 9999 permutations for all sampled populations. Significant differences exist between sampled populations (cut-off for Bonferoni pairwise comparisons that maintains an experiment-wise error of p = 0.05 is p ≤ 0.0136) with the exception of the non-managed Lubec, ME and managed Jonesboro, ME, populations (p = 0.2281).
Hope, MEHope, ME (Managed)Fitchburg, MAJonesboro, MESebago, MESalem, ME (Managed)Old Town, ME (Managed)Winterport, ME (Managed)Jonesboro, ME (Managed)Lubec, MENew Castle, VAMilton, PADolly Sods, WVShokan, NYGroton, VTOld Town, ME
Winterport, ME0.00010.00010.00010.00010.00010.00010.00010.00010.00010.00010.00010.00010.00010.00010.00010.0001
Old Town, ME0.00010.00010.00010.00010.00010.00010.00010.00010.00010.00010.00010.00010.00010.00010.0001
Groton, VT0.00010.00010.00010.00010.00010.00010.00010.00010.00010.00010.00010.00010.00040.0026
Shokan, NY0.00010.00010.00010.00010.00010.00010.00010.00010.00010.00010.00010.00010.0007
Dolly Sods, WV0.00010.00010.00010.00010.00010.00010.00010.00010.00010.00010.00010.0001
Milton, PA0.00010.00010.00010.00010.00010.00010.00010.00010.00010.00010.0001
New Castle, VA0.00010.00010.00010.00010.00010.00010.00010.00010.00010.0001
Lubec, ME0.00010.00010.00010.00010.00010.00010.00010.00050.2281
Jonesboro, ME (Managed)0.00010.00010.00010.00010.00010.00010.00250.0037
Winterport, ME (Managed)0.00010.00010.00010.00010.00010.00010.0001
Old Town, ME (Managed)0.00010.00010.00010.00010.00010.0001
Salem, ME (Managed)0.00010.00010.00010.00010.0001
Sebago, ME0.00010.00010.00010.0001
Jonesboro, ME0.00010.00010.0001
Fitchburg, MA0.00010.0001
Hope, ME (Managed)0.0001

