
Study on Impact Load and Head Cap Load Reduction Performance of Vehicle Entering Water at High Speed


1
School of Marine Science and Technology, Northwestern Polytechnical University, Xi’an 710072, China
2
Key Laboratory of Unmanned Underwater Vehicle Technology of Ministry of Industry and Information Technology, Northwestern Polytechnical University, Xi’an 710070, China
*
Author to whom correspondence should be addressed.
J. Mar. Sci. Eng. 2022, 10(12), 1905; https://doi.org/10.3390/jmse10121905
Submission received: 31 October 2022
/
Revised: 28 November 2022
/
Accepted: 2 December 2022
/
Published: 5 December 2022
(This article belongs to the Special Issue Computational Fluid Mechanics II)
Abstract
:Aiming at the problem of high-speed entry of vehicles with a diameter of 200 mm, a numerical model of high-speed entry of vehicles is established based on the arbitrary Lagrange–Euler (ALE) algorithm, and the numerical simulation of high-speed entry of flat-nosed and round-nosed vehicles is carried out. On this basis, the experimental research on the entry of vehicle with buffer caps is carried out. The following conclusions are obtained through simulation. The peak value of the axial load of the vehicle raises with the increase of the inlet velocity and angle, while the stable value only raises with the increase of the inlet velocity. The impact load on the round-nosed vehicle is obviously smaller than that on the flat-nosed vehicle when the water entry angle is greater than 80°. The peak value of axial load can be reduced by 22% when entering water vertically at 100 m/s. The following conclusions are obtained through experiments. The buffer head cap has a significant load reduction effect. It shows compaction, cracks and breakage under the impact of water. These processes can absorb part of the impact energy, reduce the peak value of axial load and increase the pulse width. The load reduction rate grows from 4.7% to 18.5% when the length of the buffer head cap is increased from 200 mm to 300 mm while the water inlet speed is the same. The damage level of the head cap increases sharply, and the load reduction rate raises when the water entry speed is increased while the length of the buffer head cap is the same.
1. Introduction
The traditional launch tube layout is difficult to meet the diversified use needs when launching underwater vehicles. In the future, aerial delivery or rocket-assisted delivery will become more common. The underwater vehicle will cross the gas–liquid interface at high speed and be subjected to huge impact load when using these two methods, which will damage the shell and internal instruments. Therefore, it is urgent and necessary to carry out research on the impact and load reduction of vehicles entering water.
The research methods of water entry impact mainly include theoretical derivation, numerical calculation and experimental testing. The research on water inflow theory is mostly based on potential flow theory, and the approximate plate theory was first proposed by von Karman [1] in 1929, which became the theoretical basis for many scholars to study related issues later. Wagner [2] improved the theory and proposed a self-similar solution, which concluded that the peak value of the water inflow impact pressure is proportional to the square of the velocity. Yu et al. [3,4,5] have further improved and perfected Wagner’s theory. Von Karman and Wagner’s water entry theory is only applicable to the initial stage of water entry of structures with small angle of rise, but not the water entry impact problem of flat plate structures. The boundary element method developed since then is applicable to structures with large angle of rise. Park [6] studied the water entry impact load of a cylinder based on the inviscid potential flow theory. Wu et al. [7] developed the similarity theory of expansive water body proposed by Longuet Higgins and studied the water entry problem of structures by using the self-similarity method. Jalalisendi et al. [8] used Donnel’s thin shell theory to establish the model of the cylindrical shell and calculated the water entry load of the cylindrical shell based on Wagner’s theory, and its theoretical calculation results were basically consistent with the test results. Mirzaei [9], based on the principle of independent expansion of cavitation and considering the memory effect of cavitation, established a theoretical model to solve the cavitation shape of structures entering water. Wang et al. [10] proposed a theoretical analytical model of elastic wedge impact load and realized high-precision and rapid prediction of structural response based on modal superposition method.
The theoretical research, which is mostly based on the assumption of the actual situation, has certain limitations. With the development of computational fluid dynamics theory, researchers began to widely use numerical simulation methods to carry out water entry research on various structures. At present, the developed numerical methods for water inflow mainly include the grid method, meshless method and hybrid method. In 1974, Hirt [11] proposed the arbitrary Lagrange–Euler (ALE) method to solve the fluid structure coupling problem with structural deformation and liquid surface movement. Sun et al. carried out a series of studies on the stress load and deformation of small balls during water entry [12,13,14,15]. Xie et al. carried out a series of studies on water impact problems of wedges and hulls [16,17,18,19,20]. Li et al. [21,22,23,24,25,26,27] carried out diversified studies on the water entry of cylinders, torpedoes and other revolving structures. Among them, Li [21] calculated the scale model of MK46 torpedo and obtained its impact load laws under different shell materials, different head types and different water entry velocities. Fang et al. [22] conducted a numerical study on the vertical water entry process of high-speed projectiles with different head types and obtained the conclusion that the peak value of water entry resistance coefficient decreases in the order of flat head, intercepting head, intercepting cone head, cone head and ball head. Song et al. [23] studied the low-speed inclined water entry process of the revolving body with different head cone angles based on the finite volume method and found that the minimum pressure value in the flow field raises with the increase of the head cone angle. Shi et al. [26] used the ALE method to conduct numerical simulation on the water entry process of flat-headed and tapered head cylinders with a diameter of 40 mm, and obtained the change laws of head deformation, pressure distribution, cavitation morphology and water entry motion state.
Although numerical calculation is widely used in water entry research, experiments are still needed to verify its correctness and accuracy. Worthington [28], a British scholar, used flash photography technology to observe the splash and cavitation effects of a small ball entering the water for the first time. The definitions are still used today. Yang et al. [29] conducted a low-speed water entry test on 10 mm diameter projectiles with different head types. The results showed that round-nosed projectiles were not easy to form cavitation. For the case of a 120° cone nose projectile entering the water vertically, the higher the velocity is, the more likely the surface closure phenomenon and complete detached bubbles will occur. Lu et al. [30] conducted an experimental study on the cavitation and ballistic characteristics of projectiles with different heads inclined into water at low speed and found that the cavitation diameter raises with the increase of the head cone angle. Lu et al. [31] carried out a low-speed vertical water entry experiment on streamlined and flat-headed revolving bodies with a diameter of 50 mm, and obtained the variation laws of bubble closure, collapse, jet and splash with the water entry speed.
When vehicles enter water at high speed, it is necessary to take buffering and load shedding measures to ensure the safety of the structure. The researchers took various measures to reduce the water entry load, such as optimizing the shape design and installing elastic expansion parts, air bags and buffer caps on the head of the vehicle [32]. Liu et al. [33] adopted the method of head air injection to reduce the impact load of a cylinder with a diameter of 7 mm when entering the water at low speed. Wei et al. [34] studied the impact of different jet structures on high-speed water entry impact of vehicles and found that the load reduction effect of nozzles with equal diameters was the best. Compared with other schemes, the buffer head cap has higher practical value. Hinckley et al. [35,36,37,38,39,40,41,42] carried out a lot of research on the head cap with different buffer materials. Among them, Xuan et al. [37] carried out an experimental study on the disassembly of the head cap when it entered water at a speed of 26 m/s, which explained the cause of the head cap’s fracture and proved that the buffer head cap can significantly reduce the impact load. Qian et al. [38] studied the reducing effect of polyurethane foam with different densities on water entry stress through experiments and simulations. Li et al. [39] designed a composite structure buffer to reduce the load during the high-speed water entry (100 m/s) of a 250 mm diameter vehicle. They respectively used rigid polyurethane foam, polystyrene and aluminum foam as the buffer materials; studied the buffer performance of different materials; and found that aluminum foam had better buffer performance when entering the water at high speed. Sun et al. [40] carried out a study on the cushioning performance of aluminum foam for the water entry load reduction of a 324 mm diameter vehicle and found that the load reduction performance first increased and then decreased with the raise of the relative density of aluminum foam. Wei et al. [41] carried out a study on the delamination of the buffer foam in the process of high-speed water entry (150 m/s) of a 324 mm diameter vehicle and found that the layered buffer foam was not easy to be completely destroyed; additionally, there was a secondary buffering phenomenon, and the load reduction performance was better than that of the single-layer foam. Shi et al. [42] carried out gradient density head cap design and load reduction performance research to solve the problem of load reduction of vehicles with a diameter of 534 mm entering water at high speed. It is found that the energy absorption effect raised with the increase of the number of layers, and the buffer performance of negative density gradient arrangement buffers was stronger than that of positive density gradient.
At present, although there are a lot of research studies on different head types entering the water, the research object is basically the model with smaller diameter and low entering speed. The water entry impact load is strongly related to the head shape, water impact area and water entry velocity. It will rise significantly when the inlet velocity increase or the impact area increase while the model’s diameter remains the same. Therefore, this paper carried out the numerical simulation of vehicles (diameter 200 mm) with flat and round heads entering the water at high speed (100 m/s–175 m/s) to obtain the effects of entering speed and angle on the impact load. In terms of load shedding research, although a large number of scholars have carried out systematic research on various buffer caps, most of them are theoretical and numerical studies. Limited by the experimental conditions, the existing experimental studies mostly consider low-speed water entry, and the experimental objects are mostly small models that do not have enough space to install large test systems. Large test systems have continuous test capability and sensors with larger range, so the model needs larger space to accommodate them. Furthermore, when the diameter of the model increases, the mass of the model raises dramatically, which requires higher launch capacity. At the same time, the improvement of the water entry speed of the model also requires a higher launching capacity. Therefore, this paper uses a high-speed water entry launcher to accelerate the 200 mm diameter model with a large test system inside, and carries out an experimental study on the model with polyurethane foam at the head entering the water at high speed (60 m/s–100 m/s) to obtain the load reduction performance of the polyurethane head cap. The paper is expected to be a reference for the research on the load reduction of vehicles entering the water at high speed.
2. Analysis of Impact Load of Vehicle
2.1. Geometric and Numerical Model
The vehicle is shown in Figure 1. The maximum diameter is 200 mm, the total length is 1872 mm, the thickness is 20 mm and the total mass is 52.8 kg. The head types are flat head and round head, respectively.
The ALE algorithm combines the advantages of Lagrange algorithm and Euler algorithm, which can accurately capture large deformation of structures and avoid severe mesh distortion. Based on ALE method, a numerical calculation model of vehicle entering water at high speed is established in this paper. The control equation of ALE algorithm consists of mass conservation equation, momentum conservation equation and energy conservation equation, as shown in Equations (1)–(3).
where is the fluid density; is the coordinate in the Euler coordinate system; is the velocity of the material, and the subscripts of represent the differential of i and j; u is the velocity of the grid; w is the relative velocity given by w = v − u; E is internal energy; is the stress tensor, and the subscript of represents the differential of j; and b is the volume force acting on the fluid.
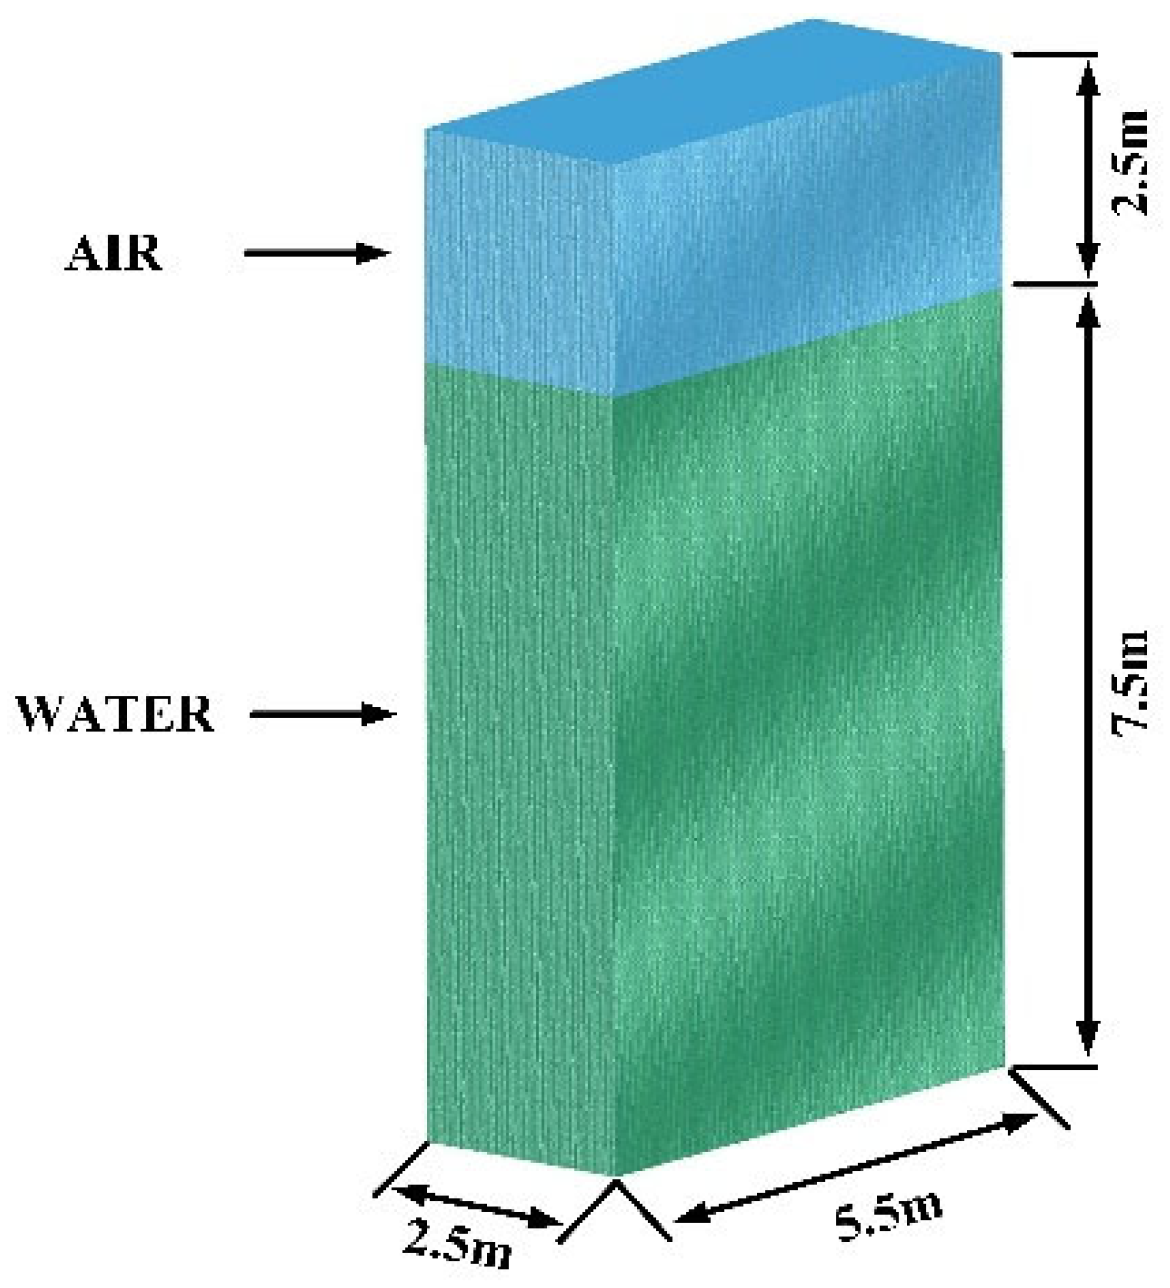
The vehicle uses Lagrange grid and Solid 164 element type. Its material is aluminum alloy, using * MAT_ RIGID material model. The size of the calculation domain is shown in Figure 2. Set the four vertical boundary interfaces and the bottom as non-reflective boundary interfaces and fix the bottom. Water and air use * MAT_ NULL constitutive model. The material parameters are shown in Table 1. The state equations of water and air are respectively determined by * EOS_ GRUNEISEN and * EOS_ LINEAR_ POLYNOMIAL. The parameter settings of the state equation follow the common settings of the research group [42]. The penalty function method is used to realize the fluid–structure coupling process.
The coordinate system is defined as shown in Figure 3, in which O0-x0y0z0 is the ground coordinate system, O-xyz is the vehicle coordinate system, and O-x1y1z1 is the velocity coordinate system. The attack angle, sideslip angle and other entry attitude angles are not considered in this paper; therefore, the vehicle coordinate system and the velocity coordinate system will coincide. Define the x direction as the axial direction, the y direction as the normal direction and the z direction as perpendicular to the xOy plane obtained by the right-hand rule as the lateral direction.
2.2. Model Validation
The established numerical method is verified. The water entry angle is 60°, and the water entry velocity is 62.6 m/s. The test model and experiment device are shown in Figure 4. The diameter of the experimental model is 200 mm. The model is accelerated by the launcher, which is designed by the author and suitable for high-speed water entry experiments of large mass model. The launcher is powered by high-pressure nitrogen and uses a 45 L high-pressure gas tank, which has a working pressure of 0.4–6 MPa as the gas storage device. The launch tube is 6000 mm long, and its inner diameter is 203 mm. The launch angle is continuously adjustable from 0 to 90°. The maximum water entry speed of the 50 kg model can reach 120 m/s.
During the experiment, two underwater high-speed cameras with frames number set at 1000 fps are arranged perpendicular to the launching direction. The aerial camera can capture the speed and attitude of the model at the moment of entering the water, while the underwater camera, located 0.5 m below the water surface, can capture the shape of the water bubble. The underwater lights are used to improve the shooting effect. The 4630A triaxial piezoresistive accelerometer is used to collect the impact acceleration data.
The cavitation comparison between simulation and experiment is shown in Figure 5, which shows good agreement of cavitation contour. The axial load, obtained by simulation, is 89 g. Comparing with the test results which the axial load is 95.97 g, the relative error of axial load is 7.3%, indicating that the numerical model established has good accuracy.
In order to determine the optimal grid size, a dimensionless parameter N describing the grid size ratio is defined.
According to the size of the vehicle, fix the Lagrange mesh size to 20 mm and take N as 2, 3 and 4, respectively. The acceleration curves obtained from different N values have very similar changing trends as shown in Figure 6. When N is taken as 2, 3 and 4, the peak acceleration is 400 g, 390 g and 378 g, respectively, while the calculation time is 108 h, 50 h and 5 h. The relative error of acceleration peak value is small, but the calculation time changes greatly. When N is 2 and 3, the relative error of the stable acceleration value is small. Considering the calculation accuracy and efficiency, N is taken as 2, and the mesh size of water and air is 40 mm. The vehicle is divided into 32,000 mesh units, and the fluid area is divided into 11,000,000 mesh units.
2.3. Analysis of Simulation Results
Firstly, the flat head model is taken as a typical working condition for analysis. Figure 7 is the water entry process diagram of the flat head model, in which the water entry angle is 90° and the water entry speed is 175 m/s. After the vehicle crushes into the water, the cavitation begins to expand, the liquid surface rises and drops splash. Within 15 ms, the cavity continues to expand as a spindle, and the maximum diameter of the cavity is always near the liquid surface. The change rate of the maximum diameter of the cavitation bubble first increases and then decreases. The curve obtained by connecting the bubble vertices in turn is almost a straight line, indicating that the velocity attenuation of the vehicle entering the water is not obvious.
Figure 8a compares the influence of water entry velocity on the axial impact acceleration of a flat-nosed vehicle. The water entry angle is 90°, and the water entry velocities are 100 m/s, 125 m/s, 150 m/s and 175 m/s. It can be found that the axial acceleration curve reaches the peak value at the moment of collision, then it rapidly drops and oscillates slightly near small values. Both the peak value and stable value of axial acceleration are raised with the increase of water entry velocity.
Figure 8b compares the influence of the water entry angle on the axial impact acceleration of the flat-nosed vehicle. The water entry velocity is 100 m/s, and the water entry angles are 50°, 60°, 70°, 80° and 90°, respectively. It can be figured that the peak value of axial acceleration rises with the increase of water entry angle, but the stable value is basically the same. Compared with Figure 8 and Figure 9, for the peak value of axial acceleration, the inlet velocity and inlet angle have a greater impact on it. For the stable value of the axial acceleration, only the inlet velocity has a great influence on it.
The round-nosed vehicle’s change trend of axial acceleration between water entry velocity and angle is basically the same as that of the flat-nosed vehicle. However, the change of head shape has a noticeable influence on the acceleration. Figure 9a shows the contact position of flat-nosed and round-nosed vehicles when entering water. Figure 9b compares the change trend of peak axial acceleration with the water entry angle under the two head types, in which the water entry speed is 100 m/s. The two curves in Figure 9b show an upward trend, that is, the peak value of axial water inflow increases with the increase of water inflow angle. However, the curve slope of the round-nosed vehicle gradually decreases. It can be concluded from Figure 9a that the water contact position of the round-nosed vehicle is closer to the axis, and the water contact area changes little, resulting in a gentle axial peak curve of the round-nosed vehicle. The curve of the flat-nosed vehicle in Figure 9b has a sudden change at 70°, and the peak value of the axial load of the round-nosed vehicle is greater than that of the flat-nosed vehicle before the sudden change, but the situation is opposite after the sudden change. It is analyzed that when the water entry angle is less than 70°, the area of the arc surface is larger than the corner’s, making the water contact area of the round-nosed vehicle slightly larger than that of the flat-nosed vehicle. Nevertheless, when the angle is greater than 80°, the front-end face of the flat-nosed vehicle touches the water in a large area, and the area of the plane is larger than the circular arc’s, making the water contact area of the flat-nosed vehicle significantly larger than that of the round-nosed vehicle. Especially, when entering the water vertically, the peak axial acceleration of the round-nosed vehicle decreases by about 22% compared with that of the flat-nosed vehicle, which indicates that the round-nosed vehicle has an obvious load reduction effect when the water entry angle is large. Consequently, the head shape has a great influence on the peak acceleration of the vehicle’s water entry impact. Different head shapes can be selected to reduce the water entry impact when entering water at different angles.
3. Analysis of Load Reduction Characteristics of Head Cap
According to the simulation results, the load reduction ability brought by the head type is strongly related to the water entry angle. The load reduction effect is obvious only when entering water vertically, making the load reduction effect not stable. However, it is difficult to ensure the vertical entry attitude of underwater vehicles during the launching process. Therefore, in engineering practice, more attention is paid to the reliable load reduction scheme when there is oblique entry. The buffer head cap is a kind of load reduction device installed on the head of the vehicle, which can absorb the impact energy through the buffer material in the process of water entry. A lot of research has been carried out on the buffer head cap, and it has been applied to the engineering practice of low-speed (50 m/s) water entry. However, limited by the experimental conditions, the experimental studies on the high-speed water entry of the head cap are limited, and the energy absorption and breaking process of the head cap still remain unclear. Therefore, this paper carried out an experimental study on the load reduction performance of a 200 mm diameter vehicle with buffer caps when entering water at high speed (100 m/s). The damage mechanism of buffer head cap can be intuitively obtained through analyzing the damage degree of polyurethane buffer material under different working conditions.
3.1. Test Conditions
In order to test the load reduction and energy absorption performance of the buffer head cap, the processed head cap is shown in Figure 10. The material properties of the three head caps are the same, all of which are polyurethane foam with a density of 70 kg/m3. They are numbered as No. 1, No. 2 and No. 3, respectively. The length of head cap No. 1 is 200 mm, and the length of head cap No. 2 and No. 3 is 300 mm. As shown in Figure 11, use No. 88 glue to fix the head cap on the head of the 200 mm diameter model. During this period, use clamp and tooling to keep them stable. After the glue is dried, an experimental model with a head cap is obtained.
As shown in Table 2, a total of seven tests were carried out, numbered T01–T07 according to the sequence of test conditions, in which T01–T03 are variable pressure tests, T04 is the repeatability test of the launcher and T05–T07 is the load reduction performance test with buffer head caps.
3.2. Analysis of Experimental Results
Taking T01 as an example, the acceleration data of axial (Ox axis), normal (Oy axis) and lateral (Oz axis) are recorded using a three-axis accelerometer during the experiment. The results obtained after Butterworth low-pass filtering (cut-off frequency 4.5kHz) are shown in Figure 12a. Within 0–0.2 s, the model is still in the launch tube. Within 0.2–0.4 s, the model starts to accelerate under the action of high-pressure gas until entering the water. After the completion of the water entry process, the model will automatically rise to the surface, and then the test is completed. Among them, the water entry process is the key data process to be analyzed. Therefore, this moment is taken as the initial time 0, and the acceleration change processes in the previous and subsequent 50 ms are analyzed, respectively.
Figure 12b shows the test results of axial acceleration. The peak value of axial load is −95.97 g, and the peak pulse width is 0.82 ms. Figure 12c shows the test results of normal acceleration. The peak value of normal load is −14.3 g, and the peak pulse width is 0.74 ms. Figure 12d shows the test results of lateral acceleration. The peak value of lateral load is −56 g, and the peak pulse width is 0.96 ms. The impact acceleration of the test model in three directions at the moment of entering the water has the characteristics of large peak value and short pulse width, which is a typical impact signal. It also proves that the process of entering the water is a transient process with dramatic changes in the mechanical environment. The axial acceleration is obviously greater than the normal and lateral acceleration. Theoretically, the lateral acceleration should be zero, but the peak value of the lateral acceleration obtained is slightly greater than the normal value. It is analyzed that the model has a certain roll motion when accelerating in the launch tube. At the moment of entering the water, an included angle is generated between the normal and lateral acceleration sensors on the model and the defined normal and lateral directions. The data processing of other working conditions is similar to T01 and will not be described repeatedly. The specific load peak value and pulse width results are shown in Table 3.
Due to rolling phenomenon, normal and lateral data have no obvious regularity; therefore, the results of axial acceleration in Table 3 are mainly analyzed. The following conclusions can be drawn:
(1) Comparing the results of T02 and T04, in which launch speed and angle are basically the same, the relative error of axial test results is about 0.05%. It can be concluded that the test system has good consistency and repeatability.
(2) Comparing the results of T01–T03, it can be seen that the peak value of axial load rises significantly with the increase of water inlet velocity, which is the same as the conclusion obtained by simulation. The ratio of the peak axial load of T03 to T01 is 2.58, and the ratio of the square velocity of the two working conditions is 2.59, which is consistent with Wagner’s water entry theory; that is, the water entry impact is proportional to the square velocity. The peak load pulse width of axial is basically the same, which is about 0.8 ms.
(3) Compare the results of T02 and T05 (with No. 1 head cap). The peak axial load of T02 is −185.9 g, and the peak pulse width is 0.81 ms. The peak axial load of T05 is −177.1 g, and the peak pulse width is 1.29 ms. After using No. 1 buffer head cap, the peak value of axial load decreases by 4.7%, and the corresponding peak pulse width increases by 0.48 ms. We can learn from the relevant knowledge of impact dynamics that the key parameters to describe a typical half sine pulse energy are the impact peak value and its pulse width. The existence of the buffer head cap reduces the peak value, increases the peak pulse width and absorbs part of the impact energy acting on the vehicle. This proves that the head cap can effectively absorb and reduce the impact load acting on the vehicle.
Figure 13 shows the cavitation morphology diagram of T05 (with No. 1 head cap) in the water entry process, and the time interval of each diagram is 5 ms. Within 15 ms (Figure 13b–d) after entering the water, the head cap deflects towards the upstream side of the vehicle under the impact of water. Then the head cap moves to the lower left under the combined action of buoyancy and initial inertia and separates from the vehicle (Figure 13e). After that, the head cap and its debris generate irregular cavitation near the water surface. The cavitation generated by the vehicle, and the head cap debris continues to expand. The cavitation is spindle shaped as a whole and is wrapped by numerous small air bubbles (Figure 13f–l).
Figure 14 compares the changes of No. 1 head cap before and after entering the water. It can be seen from the figure that under the impact load, the tip of the head cap is squeezed and slightly damaged. The contact area between the bottom surface of the head cap and the front-end surface of the vehicle appears obviously peeling after being squeezed.
(4) Compare the results of T02 and T06 (with No. 2 head cap). The peak axial load of T02 is −185.9 g, and the peak pulse width is 0.81 ms. The peak axial load of T06 is −151.5 g, and the peak pulse width is 1.31 ms. After using No. 2 buffer head cap, the peak value of axial load decreases by 18.5%, and the corresponding peak pulse width increases by 0.5 ms.
Figure 15 compares the changes of No. 2 head cap before and after entering the water. It can be seen from the figure that under the impact load, the tip of the head cap is damaged. The contact area between the bottom of the head cap and the front-end face of the vehicle is significantly compressed. The foam material is compacted, and large cracks appear with extrusion.
Compare the results of two groups using No. 1 and No. 2 head caps. The water entry speed of the two groups is basically the same, but the length of the buffer head cap is different. When the length of the buffer head cap is increased from 200 mm to 300 mm, the load reduction rate increases from 4.7% to 18.5%, indicating that increasing the length of the buffer head cap can raise the load reduction effect.
(5) Compare the results of T03 and T07 (with No. 3 head cap). The peak axial load of T03 is −247.3 g, and the peak pulse width is 0.75 ms, while the peak axial load of T07 is −179.9 g, and the peak pulse width is 1.27 ms. After using No. 3 buffer head cap, the peak value of axial load decreased by 27.3%, and the corresponding peak pulse width is increased by 0.52 ms.
Figure 16 shows the change of No. 3 head cap before and after entering the water. It can be seen from the figure that the head cap is split into upper, middle and lower parts under the impact load. Obvious erosion can be observed on the surface of the upper and middle parts. Most of the back of the middle part is stripped from the body. Half of the lower part is broken into small pieces due to the impact load; thus, only half can be collected.
Compare the results of two groups of tests using No. 2 and No. 3 head caps. The buffer head caps used in the two groups of tests are identical, but the water entry speed is different. The raise of the water entry speed increases the impact load, leading to the sharply increase of damage degree of the head cap, and the load reduction rate also increases to a certain extent.
4. Conclusions
Based on ALE method, the numerical simulation of high-speed water entry of flat-nosed and round-nosed vehicles is carried out, the variation rules of cavitation and axial acceleration are analyzed and the influence of head shape on water entry impact load is analyzed. The following conclusions are drawn:
(1) When the vehicle enters the water at high speed, the cavitation continues to expand in a spindle shape within 15 ms. The maximum diameter of the cavitation is always near the liquid surface, and the change rate shows a trend of first increasing and then decreasing, while the velocity attenuation is not obvious.
(2) The peak value of the axial acceleration of the vehicle is greatly affected by the water entry velocity and angle, while the stable value of the axial acceleration is greatly affected by the water entry velocity.
(3) Flat-nosed and round-nosed vehicles have different impact areas at different water entry angles; therefore, when the water entry angle is greater than 80°, the impact load on round-nosed vehicles is significantly smaller than that on flat-nosed vehicles, and the peak axial load can be reduced by 22% when entering the water vertically at 100 m/s.
The way of changing the head shape of the vehicle to reduce the water entry load depends on the water entry speed and angle, which makes the load reduction effect unstable. Therefore, further experimental research on the load reduction performance of the vehicle with buffer head cap entering the water at high speed is carried out, and the following conclusions are obtained:
(1) The peak value of the axial load of the vehicle increases with the water entry velocity, which is consistent with Wagner’s water entry theory. However, the peak pulse width is basically the same, both being about 0.8 ms.
(2) The front end of the buffer head cap is damaged after being impacted by water in the process of entering the water. The contact area between the bottom surface of the head cap and the front-end surface of the vehicle shows significant compression deformation. The foam material is compacted, and large damages and cracks occur along with the squeezing action. In this process, part of the water impact energy can be absorbed, so that the axial load peak value is reduced and the peak pulse width is increased, which proves that the buffer head cap has an obvious load reduction effect.
(3) The load reduction rate increases from 4.7% to 18.5% when the length of the buffer head cap is increased from 200 mm to 300 mm, while the water inlet speed is the same, which indicates that increasing the length of the buffer head cap can improve the load reduction effect.
(4) The damage extent of the buffer head cap increases sharply when the water entry speed is raised while the length of the buffer head cap is the same. Due to the increase of the water entry impact load, the damage ranges from cracks and damage at low speed to splitting into three parts, which means that most of the middle and lower parts are broken into small pieces at high speed. The load reduction rate rises to a certain extent when the water entry speed increases.
Author Contributions
Conceptualization and methodology, all authors; design of simulation ideas, H.Z. and Y.S.; setting of simulation cases, sorting and analysis of data, visualization of results and writing—original draft, H.Z.; writing—review and editing, Y.S. and H.Z.; management of project, supporting of funding and equipment, Y.S.; Q.H. and G.P. All authors have read and agreed to the published version of the manuscript.
Funding
This research was funded by the National Natural Science Foundation of China (Grant No. U21B2055, Grant No. 52171324) and the Fundamental Research Funds for the Central Universities (Grant No. 3102019JC006).
Institutional Review Board Statement
Not applicable.
Informed Consent Statement
Not applicable.
Data Availability Statement
All data and models generated or used during the research period appear in the submitted manuscript.
Acknowledgments
We are thankful to the National Natural Science Foundation of China (Grant No. U21B2055, Grant No. 52171324) and the Fundamental Research Funds for the Central Universities (Grant No. 3102019JC006) for their financial support in our research work.
Conflicts of Interest
The authors have no conflict of interest and unanimously agree to submit the manuscript to the journal.
References
- Karman, T.V. The Impact on Seaplane Floats during Landing; NACA-TN-321; National Advisory Committee for Aeronautics: Washington, DC, USA, 1929.
- Wagner, H. Phenomena associated with impacts and sliding on liquid surfaces. Z. Angew. Math. Mech. 1932, 12, 193–215. [Google Scholar] [CrossRef]
- Yu, Y.T. Virtual masses of rectangular plates and parallelepipeds in Water. J. Appl. Phys. 1945, 16, 724–729. [Google Scholar] [CrossRef]
- Logvinovich, G.V.; Buyvol, V.N.; Dudko, A.S. Free Boundary Flows; Naukova Dumka Publishing House: Kiev, Ukraine, 1985. [Google Scholar]
- Korobin, A. Analytical models of water impact. Eur. J. Appl. Math. 2004, 15, 821–838. [Google Scholar] [CrossRef]
- Park, M.; Jung, Y.; Park, W. Numerical study of the impact force and ricochet behaviour of high speed water entry bodies. Comput. Fluids 2003, 32, 939–951. [Google Scholar] [CrossRef]
- Wu, G.X.; Sun, S.L. Similarity solution for oblique water entry of an expanding paraboloid. Fluid Mech 2014, 745, 398–408. [Google Scholar] [CrossRef]
- Jalalisendi, M.; Porfiri, M. Water entry of cylindrical shells: Theory and experiments. AIAA J. 2018, 56, 11. [Google Scholar] [CrossRef]
- Mirzaei, M.; Taghvaei, H.; Golneshan, A.A. Improvement of cavity shape modeling in water-entry of circular cylinders by considering the cavity memory effect. Appl. Ocean Res. 2020, 97, 102073. [Google Scholar] [CrossRef]
- Wang, Y.W.; Zheng, C.; Wu, W.G. On slamming load and structural response of a flexible wedge via analytical methods and numerical simulations. Explos. Shock Waves 2021, 41, 100–115. (In Chinese) [Google Scholar]
- Hirt, C.W.; Amsden, A.A.; Cook, J.L. An arbitrary lagrangian-eulerian computing method for all flow speeds. J. Comput. Phys. 1974, 14, 227–253. [Google Scholar] [CrossRef]
- Sun, T.; Wang, H.; Zou, L. Experimental study on the cavity dynamics of oblique impact of sphere on a viscous liquid floating on water. Ocean Eng. 2019, 194, 106597. [Google Scholar] [CrossRef]
- Yu, P.Y.; Shen, C.; Zhen, C.B.; Tang, H.Y.; Wang, T.L. Parametric study on the free-fall water entry of a sphere by using the rans method. J. Mar. Sci. Eng. 2019, 7, 122. [Google Scholar] [CrossRef]
- Yang, L.; Wei, Y.; Wang, C.; Xia, W.X.; Li, J.C. Numerical study on the deformation behaviors of elastic spheres during water entry. J. Fluids Struct. 2020, 99, 103167. [Google Scholar] [CrossRef]
- Yang, L.; Sun, T.Z.; Wei, Y.J.; Wang, C.; Xia, W.X.; Wang, Z.L. Hydroelastic analysis of water entry of deformable spheres. J. Hydrodyn. 2021, 33, 821–832. [Google Scholar] [CrossRef]
- Xie, H.; Ren, H.L.; Qu, S.; Tang, H.Y. Numerical and experimental study on hydroelasticity in water-entry problem of a composite ship-hull structure. Compos. Struct. 2018, 201, 942–957. [Google Scholar] [CrossRef]
- Qiu, S.Y.; Ren, H.X.; Li, H.J. Computational model for simulation of lifeboat free-fall during its launching from ship in rough seas. J. Mar. Sci. Eng. 2020, 8, 631. [Google Scholar] [CrossRef]
- He, G.H.; Xie, B.Y.; Wang, W.; Liu, S.; Jing, P.L. Ship loading influence on the slamming impact of typical sections of an S-175 container ship. J. Mar. Sci. Eng. 2020, 8, 163. [Google Scholar] [CrossRef] [Green Version]
- Sun, Z.; Sui, X.P.; Deng, Y.Z.; Zuo, L.; Korobkin, A.; Xu, L.X.; Jiang, Y.C. Characteristics of slamming pressure and force for trimaran hull. J. Mar. Sci. Eng. 2021, 9, 564. [Google Scholar] [CrossRef]
- Lu, Y.J.; Buono, A.D.; Xiao, T.H.; Iafrati, A.; Deng, S.H.; Xu, J.F. On applicability of von Karman’s momentum theory in predicting the water entry load of V-shaped structures with varying initial velocity. Ocean Eng. 2022, 262, 112249. [Google Scholar] [CrossRef]
- Li, S.S. Numerical Simulation of Torpedo Water-Entry Impact; North University of China: Taiyuan, China, 2015. (In Chinese) [Google Scholar]
- Fang, C.L.; Wei, Y.J.; Wang, C.; Xia, W.X. Numerical simulation of vertical high-speed water entry process of projectiles with different heads. J. Harbin Inst. Technol. 2016, 48, 77–82. (In Chinese) [Google Scholar]
- Song, W.C.; Wang, C.; Wei, Y.J.; Wang, W. Numerical simulation of the flow field characteristics of low speed oblique water entry of revolution body. Trans. Beijing Inst. Technol. 2017, 37, 661–666+671. (In Chinese) [Google Scholar]
- Shi, Y.; Pan, G.; Yim, S.C. Numerical investigation of hydroelastic water-entry impact dynamics of AUVs. J. Fluids Struct. 2019, 91, 102760. [Google Scholar] [CrossRef]
- Li, Q.; Lu, L. Numerical investigations of cavitation nose structure of a high-speed projectile impact on water-entry characteristics. J. Mar. Sci. Eng. 2020, 8, 265. [Google Scholar] [CrossRef] [Green Version]
- Shi, H.H.; Zhou, D.; Wen, J.S.; Jia, H.X. Fluid-solid interaction simulation of elastic cylindrical Shell penetrating water based on the ALE method. J. Ballist. 2020, 32, 9–14+46. (In Chinese) [Google Scholar]
- Zhu, C.B.; Zhuang, D.H.; Fei, Q.G. Impact characteristics and strength evaluation of a slender body obliquely entering water at high speed. J. Phys. Conf. Ser. 2022, 2338, 012024. [Google Scholar] [CrossRef]
- Worthington, A.M. Impact with a liquid surface studied with aid of instantaneous photography. Philos. Trans. R. Soc. Lond. 1900, 194A, 175–199. [Google Scholar]
- Yang, H.; Zhang, A.M.; Gong, X.C.; Yao, X.L. Experimental study of the cavity of low speed water entry of different head shape projectiles. J. Harbin Eng. Univ. 2014, 35, 1060–1066. (In Chinese) [Google Scholar]
- Lu, L.R.; Wei, Y.J.; Wang, C.; Song, W.C. Experimental investigation into the cavity and ballistic characteristics of low-speed oblique water entry of revolution body. Acta Armamentar II 2018, 39, 1364–1371. (In Chinese) [Google Scholar]
- Lu, X.H.; Wang, Z.H.; Zou, L.; Sun, T.Z.; Li, Y.G. Test on slamming characteristics of vertical water-entry of axisymmetric body with different head shapes in low velocity. China Offshore Platf. 2020, 35, 27–32. (In Chinese) [Google Scholar]
- Yang, S.X.; Li, N.J.; Xu, X.Z. Airdropped Torpedo Technology; Yunnan Science and Technology Press: Kunming, China, 2001. (In Chinese) [Google Scholar]
- Liu, H.P.; Yu, F.P.; Han, B.; Zhang, Y.Q.; Liu, G.L.; Chen, H.L. Numerical simulation study on influence of top jet in object water entering impact. J. Eng. Thermophys. 2019, 40, 64–69. (In Chinese) [Google Scholar]
- Wei, H.P.; Xin, W.Q.; Liu, H.P.; Liu, Y.Q. Research on the influence of different nozzle structures on the impact of high-speed water-entry vehicles. Astronaut. Syst. Eng. Technol. 2021, 5, 41–46+53. (In Chinese) [Google Scholar]
- Hinckley, W.M.; Yang, J.C.S. Analysis of rigid polyurethane foam as a shock mitigator. Exp. Mech. 1975, 15, 177–183. [Google Scholar] [CrossRef]
- Yan, Z.H. An approach to the behavior of water-entry missile’s mitigator. Adv. Hydrodyn. 1987, 01, 112–121. (In Chinese) [Google Scholar]
- Xuan, J.M.; Song, Z.P.; Yan, Z.H. Experimental study on the disassembly of torpedo water entry cushion protection head cap. Torpedo Technol. 1999, 7, 41–46. (In Chinese) [Google Scholar]
- Qian, H.T.; Feng, S.S.; Shao, Z.Y.; Wu, S.Y. Experimental Study on the Mitigation Effect of Polyurethane Foam Densities on the Cylindrical Objects Entering Water at High Velocity. Mater. Sci. Forum 2019, 950, 103–109. [Google Scholar] [CrossRef]
- Li, Y.; Zong, Z.; Sun, T. Crushing behavior and load-reducing performance of a composite structural buffer during water entry at high vertical velocity. Compos. Struct. 2020, 255, 112883. [Google Scholar] [CrossRef]
- Sun, L.Q.; Wang, D.L.; Li, Z.P.; Liu, D.K. Analysis on load reduction performance of foamed aluminum buffer device for high speed water entry of vehicle based on a CEL method. J. Vib. Shock 2021, 40, 80–88. (In Chinese) [Google Scholar]
- Wei, H.P.; Shi, C.B.; Sun, T.Z.; Bao, W.C.; Zhang, G.Y. Numerical study on load-shedding performance of a high-speed water-entry vehicle based on an ALE method. Explos. Shock Waves 2021, 41, 115–126. (In Chinese) [Google Scholar]
- Shi, Y.; Liu, Z.P.; Pan, G.; Gao, X.F. Structural design and load reduction performance analysis of gradient density head cap of vehicle. Chin. J. Theor. Appl. Mech. 2022, 54, 939–953. (In Chinese) [Google Scholar]
Figure 1.
Flat- and round-nosed vehicles.

Figure 2.
Calculation domain size.

Figure 3.
Coordinate system.

Figure 4.
Test model and experiment device. (a) Test model. (b) Experiment device.

Figure 5.
Cavitation comparison of simulation and experiment. (a) Simulation. (b) Experiment. (c) Comparison.
Figure 5.
Cavitation comparison of simulation and experiment. (a) Simulation. (b) Experiment. (c) Comparison.

Figure 6.
Acceleration of mesh with different size.

Figure 7.
Cavitation of vehicle entering water at speed of 175 m/s and angle of 90°.

Figure 8.
Axial acceleration. (a) Different velocities with angle of 90°. (b) Different angles with velocity of 100 m/s.
Figure 8.
Axial acceleration. (a) Different velocities with angle of 90°. (b) Different angles with velocity of 100 m/s.

Figure 9.
Comparison of two models. (a) Water contact positions. (b) Peak values.

Figure 10.
Buffer head caps.

Figure 11.
Test model with buffer head cap.

Figure 12.
Three-axis acceleration of T01. (a) Original data recorded by sensor. (b) Axial acceleration. (c) Normal acceleration. (d) Radial acceleration.
Figure 12.
Three-axis acceleration of T01. (a) Original data recorded by sensor. (b) Axial acceleration. (c) Normal acceleration. (d) Radial acceleration.

Figure 13.
Cavitation evolution of T05 (with No. 1 head cap).

Figure 14.
Comparison of No. 1 head cap before and after water entry.

Figure 15.
Comparison of No. 2 head cap before and after water entry.

Figure 16.
Comparison of No. 3 head cap before and after water entry.


Table 1.
Material parameters.
| Object | Density/(kg·m−3) | Young’s Modulus/(GPa) | Poisson’s Ratio |
|---|---|---|---|
| Vehicle | 2700 | 76.3 | 0.33 |
| Water | 998 | −10 | 0.0008684 |
| Air | 1.25 | −1 | 0.000017465 |
Table 2.
Test conditions.
| Test Number | Launch Angle/(°) | Launch Pressure/(Mpa) | Water Entry Speed/(m/s) | Remarks |
|---|---|---|---|---|
| T01 | 60 | 1 | 62.6 | Different water entry speeds |
| T02 | 60 | 3 | 82.6 | |
| T03 | 60 | 4 | 100.8 | |
| T04 | 60 | 3 | 83.4 | Repeatability test |
| T05 | 60 | 3 | 82.0 | No. 1 buffer head cap |
| T06 | 60 | 3 | 79.6 | No. 2 buffer head cap |
| T07 | 60 | 4 | 99.2 | No. 3 buffer head cap |
Table 3.
Test results.
| Test Number | Axial | Radial | Lateral | |||
|---|---|---|---|---|---|---|
| Load Peak/(g) | Peak Pulse Width (ms) | Load Peak/(g) | Peak Pulse Width (ms) | Load Peak/(g) | Peak Pulse Width (ms) | |
| T01 | −95.97 | 0.82 | −14.3 | 0.74 | −56 | 0.96 |
| T02 | −185.9 | 0.81 | −96.7 | 1.32 | −60.9 | 1.09 |
| T03 | −247.3 | 0.75 | −107.3 | 0.86 | −25.2 | 0.63 |
| T04 | −186.8 | 0.8 | −125.6 | 1.14 | −67.1 | 0.89 |
| T05 | −177.1 | 1.29 | −55.3 | 0.66 | −75.6 | 0.55 |
| T06 | −151.5 | 1.31 | −94.4 | 0.61 | −99.9 | 0.62 |
| T07 | −179.9 | 1.27 | −127.8 | 0.87 | −82.6 | 0.52 |
Publisher’s Note: MDPI stays neutral with regard to jurisdictional claims in published maps and institutional affiliations. |
© 2022 by the authors. Licensee MDPI, Basel, Switzerland. This article is an open access article distributed under the terms and conditions of the Creative Commons Attribution (CC BY) license (https://creativecommons.org/licenses/by/4.0/).
Share and Cite
MDPI and ACS Style
Zhao, H.; Shi, Y.; Pan, G.; Huang, Q. Study on Impact Load and Head Cap Load Reduction Performance of Vehicle Entering Water at High Speed. J. Mar. Sci. Eng. 2022, 10, 1905. https://doi.org/10.3390/jmse10121905
AMA Style
Zhao H, Shi Y, Pan G, Huang Q. Study on Impact Load and Head Cap Load Reduction Performance of Vehicle Entering Water at High Speed. Journal of Marine Science and Engineering. 2022; 10(12):1905. https://doi.org/10.3390/jmse10121905
Chicago/Turabian StyleZhao, Hairui, Yao Shi, Guang Pan, and Qiaogao Huang. 2022. "Study on Impact Load and Head Cap Load Reduction Performance of Vehicle Entering Water at High Speed" Journal of Marine Science and Engineering 10, no. 12: 1905. https://doi.org/10.3390/jmse10121905
Note that from the first issue of 2016, this journal uses article numbers instead of page numbers. See further details here.