Article

Experimental Study on Prediction for Combustion Optimal Control of Oil-Fired Boilers of Ships Using Color Space Image Feature Analysis and Support Vector Machine

Division of Marine System Engineering, Korea Maritime and Ocean University, 727, Taejong-ro, Yeongdo-gu, Busan 49112, Republic of Korea
*
Author to whom correspondence should be addressed.
J. Mar. Sci. Eng. 2023, 11(10), 1993; https://doi.org/10.3390/jmse11101993
Submission received: 20 August 2023 / Revised: 3 October 2023 / Accepted: 11 October 2023 / Published: 16 October 2023

Abstract

:
The International Maritime Organization strives to improve the atmospheric environment in oceans and ports by regulating ship emissions of air pollutants and promoting energy efficiency. This study deals with the prediction of eco-friendly combustion in boilers to reduce air pollution emissions. Accurately measuring air pollutants from ship boilers in real-time is crucial for optimizing boiler combustion. However, using data obtained through an exhaust gas analyzer for real-time control is challenging due to combustion process delays. Therefore, a real-time predictive modeling approach is proposed to enhance the accuracy of prediction models for N O x , S O 2 , C O 2 , and O 2 by analyzing the color spectrum of flame images in a quasi-instantaneous combustion state. Experimental investigations were carried out on an oil-fired boiler installed on an actual ship, where the air damper was adjusted to create various combustion conditions. This algorithm is a saturation-based feature extraction filter (SEF) through color spectrum analysis using RGB (red, green, and blue) and HSV (hue, saturation, and value). The prediction model applying the proposed method was verified against exhaust gas analyzer data using a new data set, and real-time prediction performance and generalization were confirmed.

1. Introduction

Minimizing exhaust gas emissions from ships is crucial for addressing global warming, considering that maritime trade accounts for 80% of the global trade volume [1]. The estimated annual emissions from ships include approximately 5.0 × 10 5 tons of nitrogen oxides ( N O x ), 6.3 × 10 5 tons of sulfur oxides ( S O x ), and 3.1 × 10 5 tons of carbon dioxide ( C O 2 ) [2].
To reduce N O x emissions, the International Maritime Organization (IMO) has implemented regulations up to Tier 3, enforced through MARPOL Annex VI from 2006 to 2012. Moreover, starting in 2020 [3], IMO has limited the sulfur (S) content in ship fuels to 5% to reduce S O x emissions [4].
There is a growing trend toward equipping the primary engines and generators of ships with additional devices such as selective catalytic reduction (SCR), exhaust gas recirculation (EGR), and scrubbers. Various methods, including the use of environmentally friendly fuels, have been proposed to reduce air pollution emissions [3,5]. However, regulations on air pollutant emissions from ship boilers for N O x have received relatively less attention compared with S O x . Nevertheless, awareness of the need for N O x emission limitations is increasing, with recent studies emphasizing its importance [6,7]. Consequently, there is growing importance placed on regulating air pollutants generated by ship boilers.
The measurement system for air pollutants plays a crucial role in emissions regulation. Implementing these regulations requires the installation of measurement systems for N O x and S O x in marine internal combustion engines with power outputs of 130 kW and above [8]. Additionally, some countries, including the European Union, have regulations concerning the measurement system for C O 2 , with the expectation of further expansion in the future [8,9]. Therefore, the importance of regulation and monitoring of emissions from boilers has been highlighted [10].
Measurement methods include direct and indirect (soft) approaches. Direct measurement sensors have low durability and pose economic challenges due to the need for regular calibration and maintenance. Consequently, indirect measurement (soft measurement) methods have gained attention [11].
Efforts have been made in the indirect measurement of air pollutants using operational data. Several related studies have been conducted within the past five years. Sun [12] proposed an algorithm combining the weighted principal component analysis (WPCA) technique with an improved least-square support vector machine (LSSVM) [12]. Tan [13] developed a dynamic model based on long short-term memory (LSTM) for prediction [13]. Park proposed a double ensemble model based on operational data by adjusting combustion states [14]. However, these operational data-based models are economically unfavorable because numerous data collection devices are required. Moreover, the loss of a single operational data point or sensor error can significantly impact prediction accuracy. Additionally, the presence of various time delays in such processes limits their real-time monitoring capabilities. The prediction of air pollutants using quasi-instantaneous combustion images addresses these challenges.
The use of instantaneous combustion state images for predicting air pollutants can address the aforementioned issues. Xia proposed a learning model that combines principle component analysis (PCA) and Kernel-SVM for flame images from a gas-fired boiler (GFB) [15]. Yang developed an algorithm for predicting exhaust gas emissions by applying Garbor filters to gray-level co-occurrence matrix (GLCM) features in flame images from an industrial circulating fluidized bed (CFB) [16]. Ganpati [17] predicted the oxygen ( O 2 ) content by combining GFB images with operational data using a data ensemble model [17]. However, applying these models to oil-fired boilers (OFBs) is difficult because the level of impurities in the flame images differs from those in CFB or GFB.
Han [18] researched applying an ensemble deep learning model and adversarial denoising autoencoder (ADAE) to OFB flame images to improve prediction accuracy [18]. However, using data compression filters such as ADAE on low-resolution images has limitations in learning the fine features of parameters. Experimental studies on flame image-based prediction require additional observation points to obtain high-quality image data, rendering its application to field sites challenging.
Therefore, in this study, a high-resolution (1080p) complementary metal-oxide-semiconductor (CMOS) camera is installed in the existing observation port of a heavy fuel oil boiler on an operating vessel without additional observation points. This enables the collection of flame images with abundant parameter data. Simultaneously, exhaust gas analyzers are installed in an exhaust pipe to collect data on N O x , C O 2 , sulfur dioxide ( S O 2 ), and O 2 . These data are used to train the prediction model. Figure 1 provides an overview of the entire research process.
This study introduced a saturation extraction filter (SEF) that extracts features related to exhaust gas by analyzing the color space of high-resolution images containing abundant parameter data while eliminating unnecessary parameters.
The experiments were conducted on a 3000-kg/h heavy fuel oil boiler on a training vessel. Flame images under six different combustion conditions were used to evaluate the feature extraction method for predicting exhaust gas components (EGCs) such as O 2 , C O 2 , N O x , and S O 2 . The original flame images from the boiler were processed using SEF while simultaneously collecting data from the exhaust gas analyzer. Then, the collected data was used to train an SVM model.
In terms of the validity of the SEF, three groups were evaluated as comparison groups, including RGB (red, green, and blue) original images, histogramized RGB data, and histogramized hue, saturation, and value (HSV) data that involve color space conversion of brightness. The results showed significant findings in support of the SEF.
Figure 1 shows a schematic for the experiment.
Through generalization verification, practicality in actual processes was proven, and through comparison of immediacy, it was proven that quasi-instantaneous combustion prediction using flame images is more suitable for measuring instruments for real-time control than exhaust gas analyzers.
The objectives of this study can be summarized as follows:
  • Analysis and evaluation of the color spectrum of flame images using changes in the combustion equivalence ratio.
  • Introduction of a spectrum feature extraction filter utilizing color modulation techniques.
  • Comparison of SVM learning rates for flame images based on different color transformation techniques.
  • Generalization validation using a new dataset.

2. Boiler Description and Set-Up of Experiment

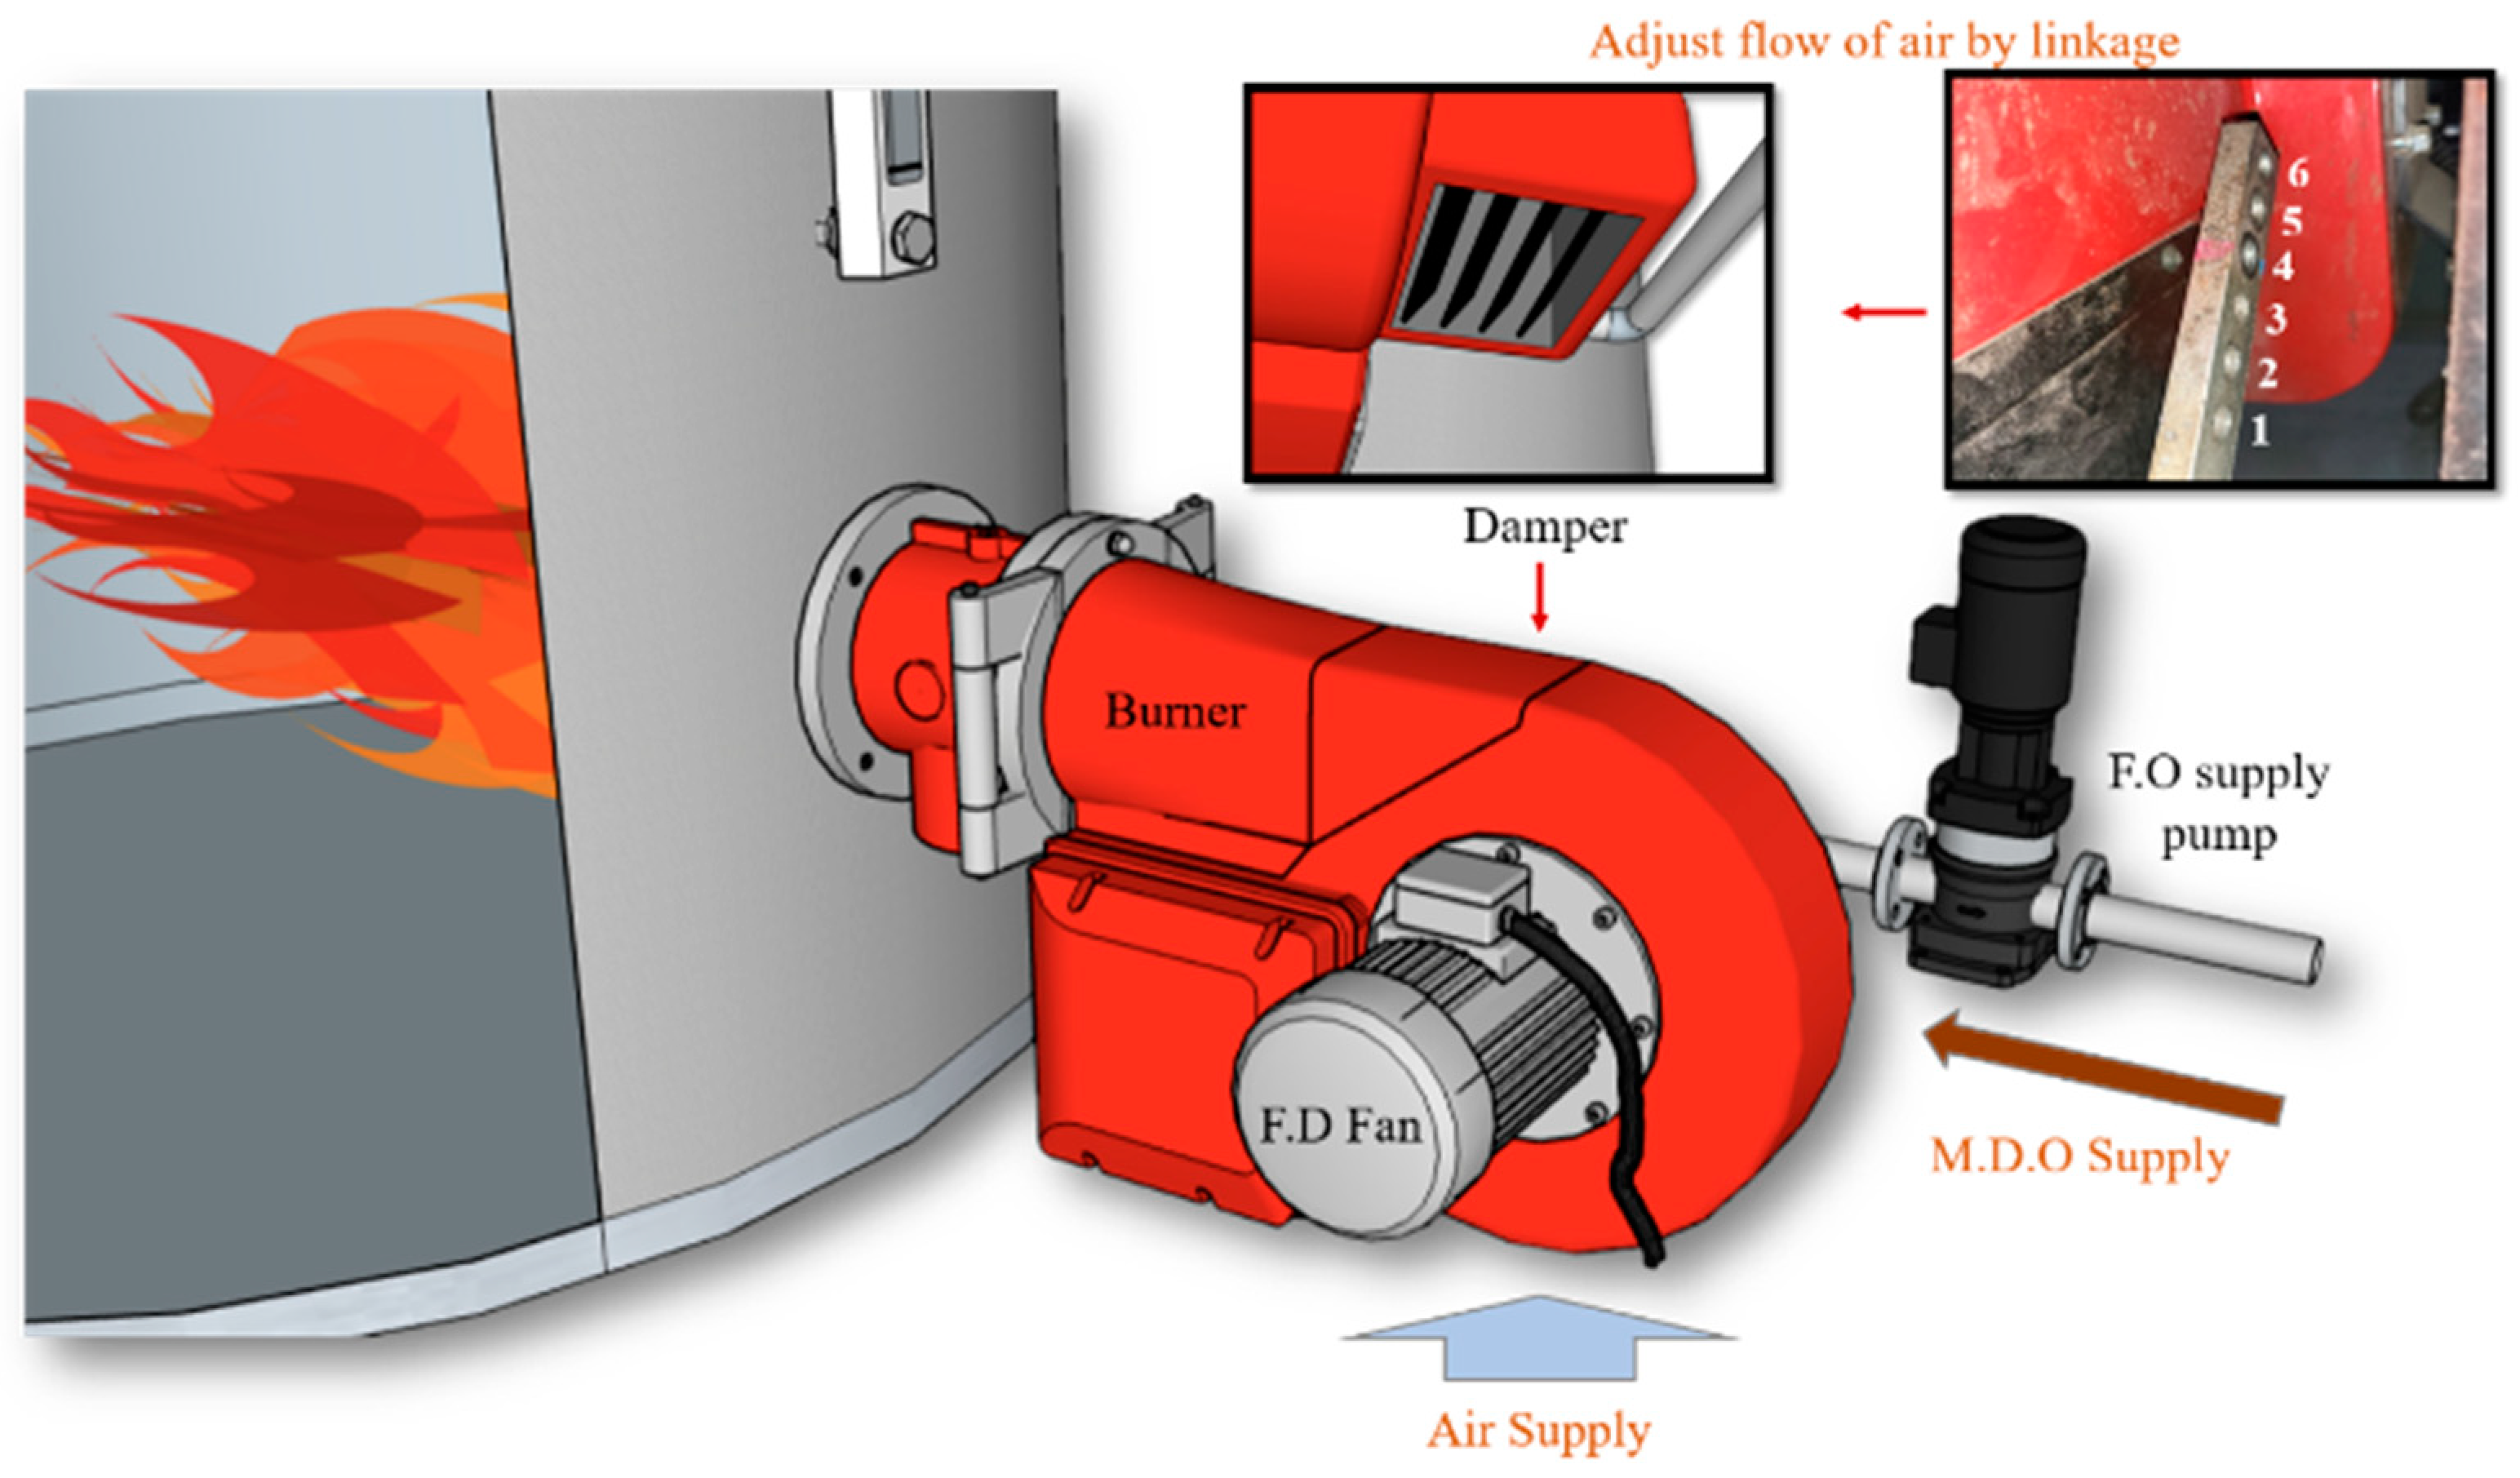
2.1. OFB Combustion System

Figure 2 shows the burning process of the OFB of the training ship.
The fuel oil (F.O.) supplied from the fuel tank in the OFB is delivered to the burner through the F.O. supply pump and pressurized to approximately 30 bar by the F.O. booster pump mounted on the burner. The pressurized fuel oil is sprayed through the burner nozzle, mixed with combustion air, and ignited.
The combustion air is supercharged and supplied from the bottom of the burner through the damper by a forced draft (FD) fan.
The burner load controls the amount of fuel sprayed by adjusting the fuel returned from the nozzle, and the amount of combustion air is controlled through the damper connected to the linkage. The fuel control and combustion air control components are interconnected through the linkage. When a load signal is received from the controller, the servo motor is adjusted, and the F.O. return valve and damper connected to the end of the motor shaft are adjusted together to control the load while maintaining an appropriate equivalence ratio.
The OFB starts at a 20% load after ignition in an automatic mode and operates within a load range of 70–90% during the normal operation phase.
During the combustion process, nitrogen ( N ), surfur ( S ), and carbon ( C ) react with O 2 in air to produce N O x , S O 2 , and C O 2 , with the amounts varying depending on the load and combustion equivalence ratio (CER).
2 N , S , C + 4 O 2 N O x N O , N O 2 , S O 2 , C O 2
The specifications of the boiler used in the experiment are as Table 1:

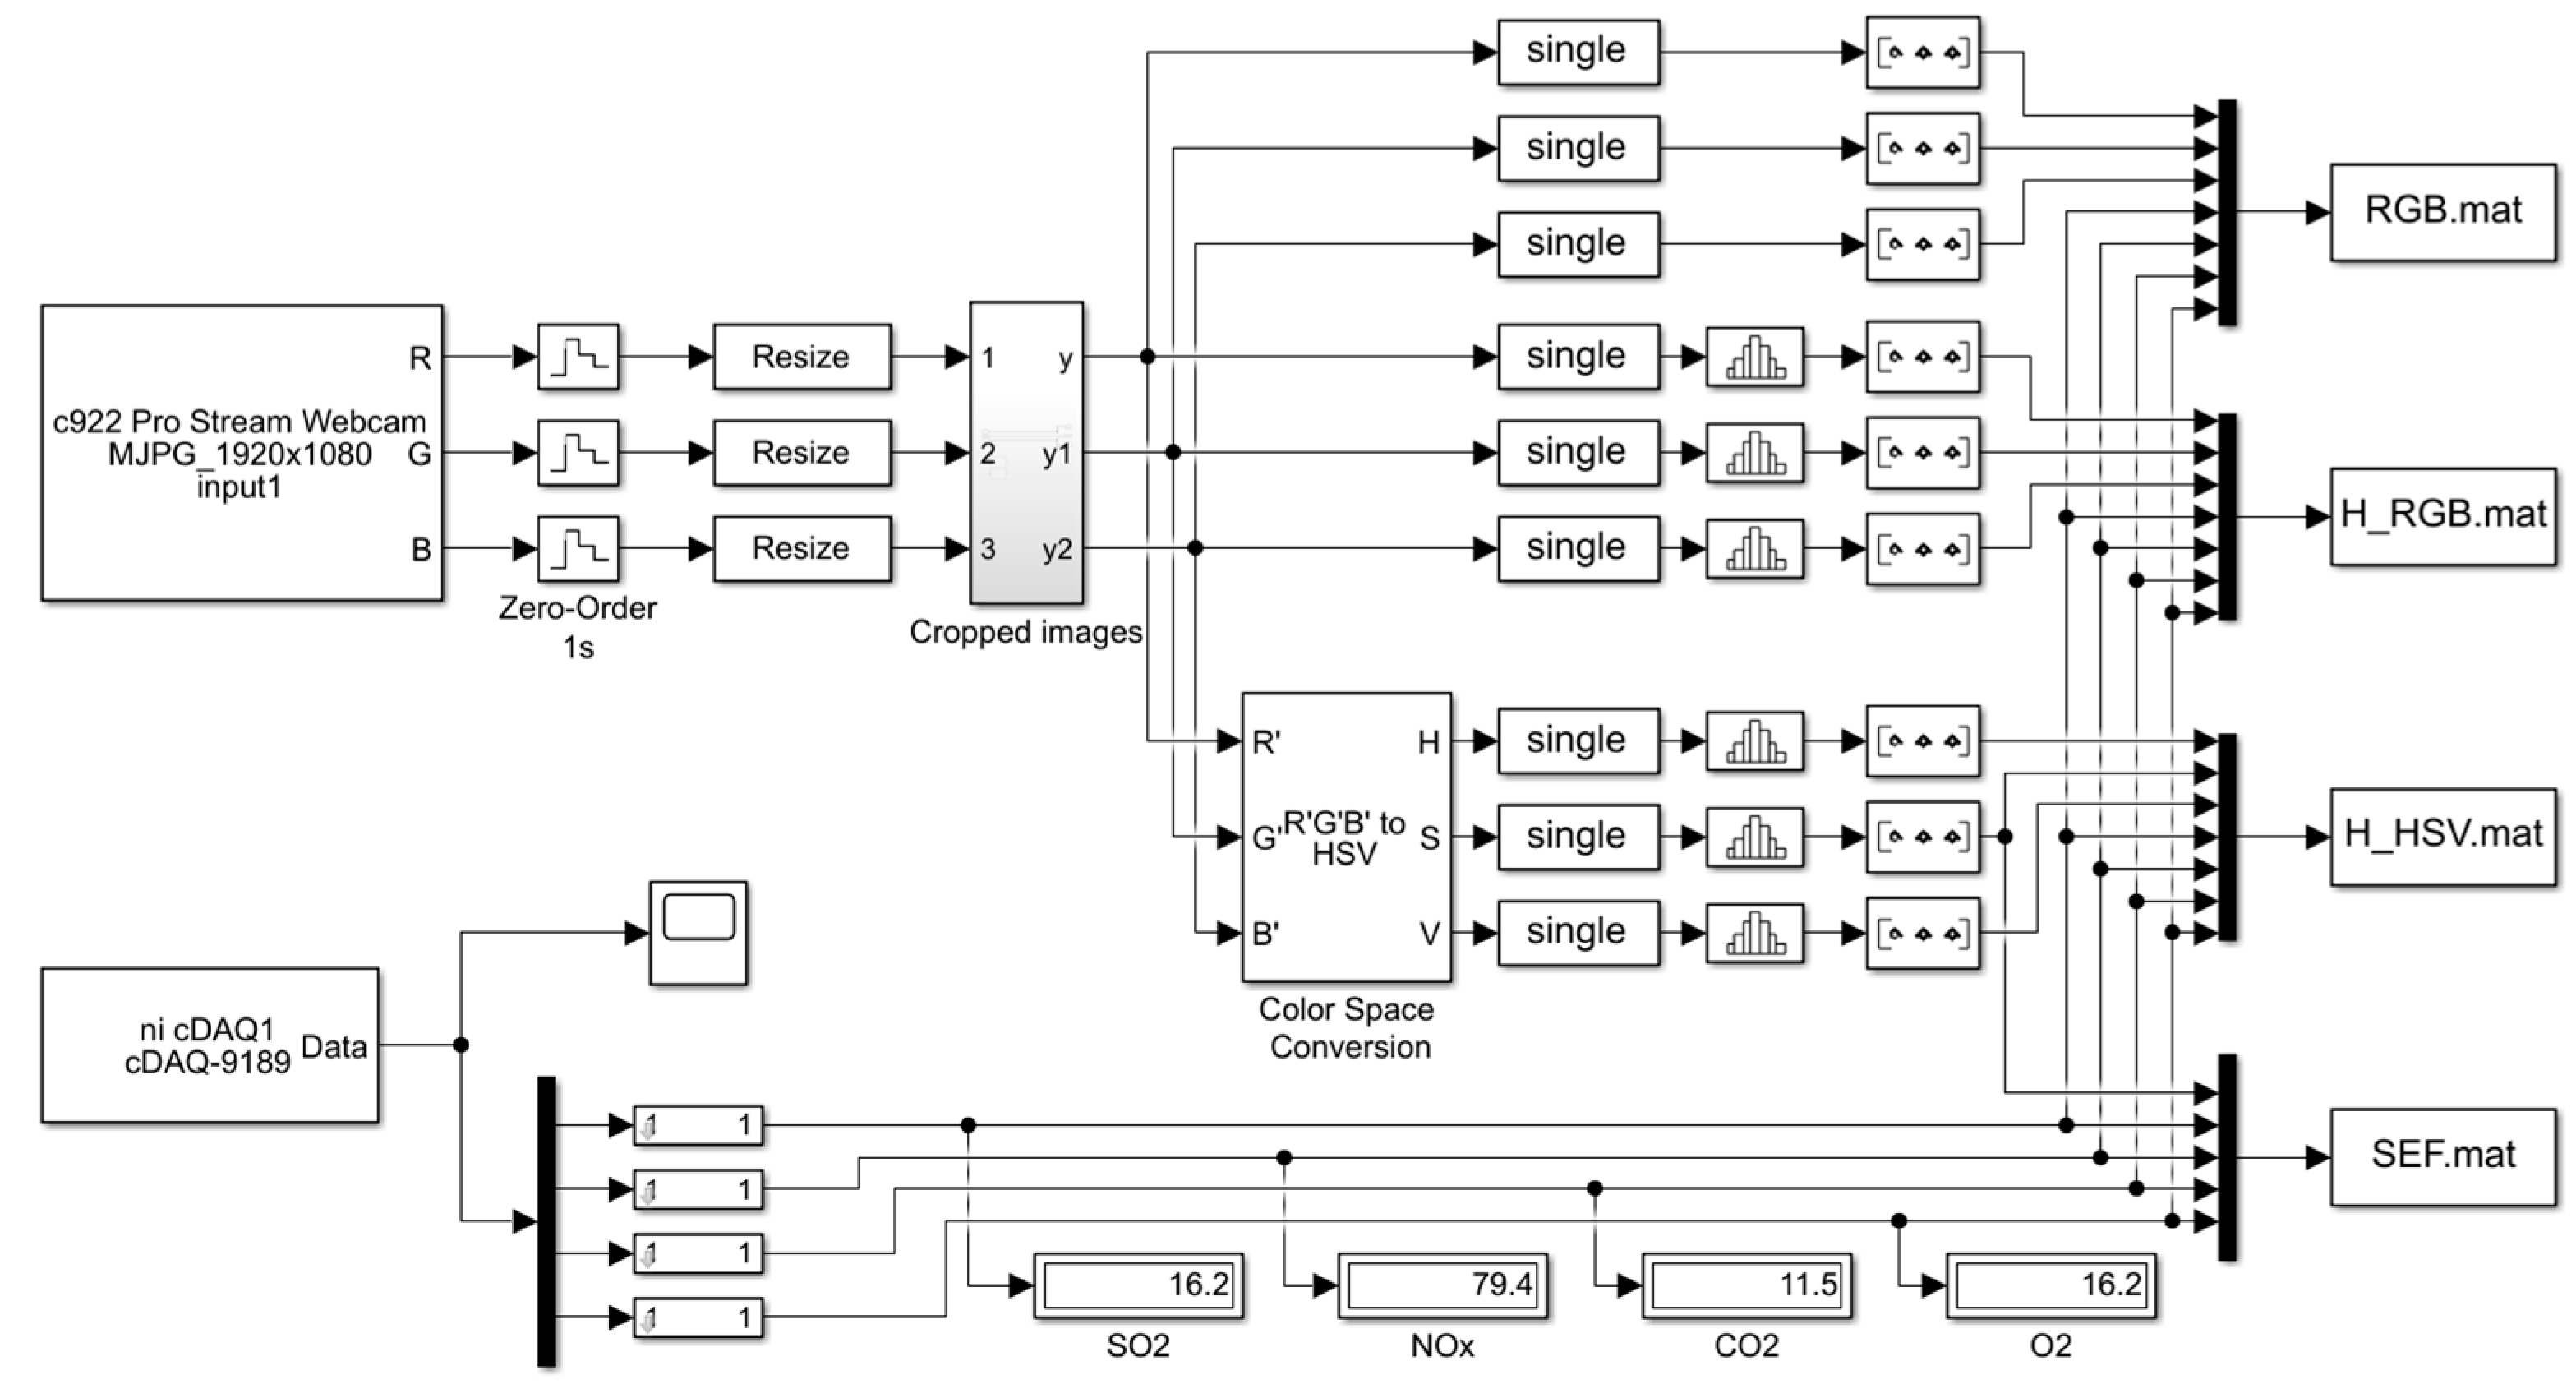
2.2. Data Acquisition System for OFB

In the experiment, the load of the OFB is fixed at 80% and the supplied fuel oil is kept constant at 0.158 kg/h to change the combustion conditions by adjusting the amount of combustion air.
In this state, the combustion environment is changed by changing LINKAGE from 1 to 6 in sequence and adjusting the amount of air supplied to the FD fan.
The data collection procedure is below.
As shown in Figure 1A, air pollutants such as C O 2 , S O 2 , N O X , and O 2 , which serve as an indirect measure of the CER, are measured at the top of the funnel. To accomplish this, the exhaust gas analyzer Marine350 from TESTO is utilized. This particular product is approved for verifying SCR NOx emission rates in compliance with Marpol regulations [19]. As shown in Figure 1C, the data collected by the exhaust gas analyzer is output as analog signals through the analog output device illustrated in Figure 1C and then transmitted to the PC via NI’s cDAQ9189. cDAQ9189 supports resolutions of approximately 24 bits and can achieve a maximum sample rate of 10 k S / s , enabling precise measurements.
Simultaneously, flame image data are processed through the fire observation port of the boiler, as shown in Figure 1B.
For image acquisition, a webcam (Logitech C920 PRO HD) in CMOS format is employed. In previous studies, high-resolution flame images have been predominantly obtained using charge-coupled device (CCD) format cameras [20,21]. These cameras offer superior resolution compared with CMOS cameras and exhibit noise resistance. However, with recent technological advancements, CMOS cameras have also attained high resolutions (1080p, 30 fps). Moreover, webcams are favored owing to their real-time data transmission capability to a PC.

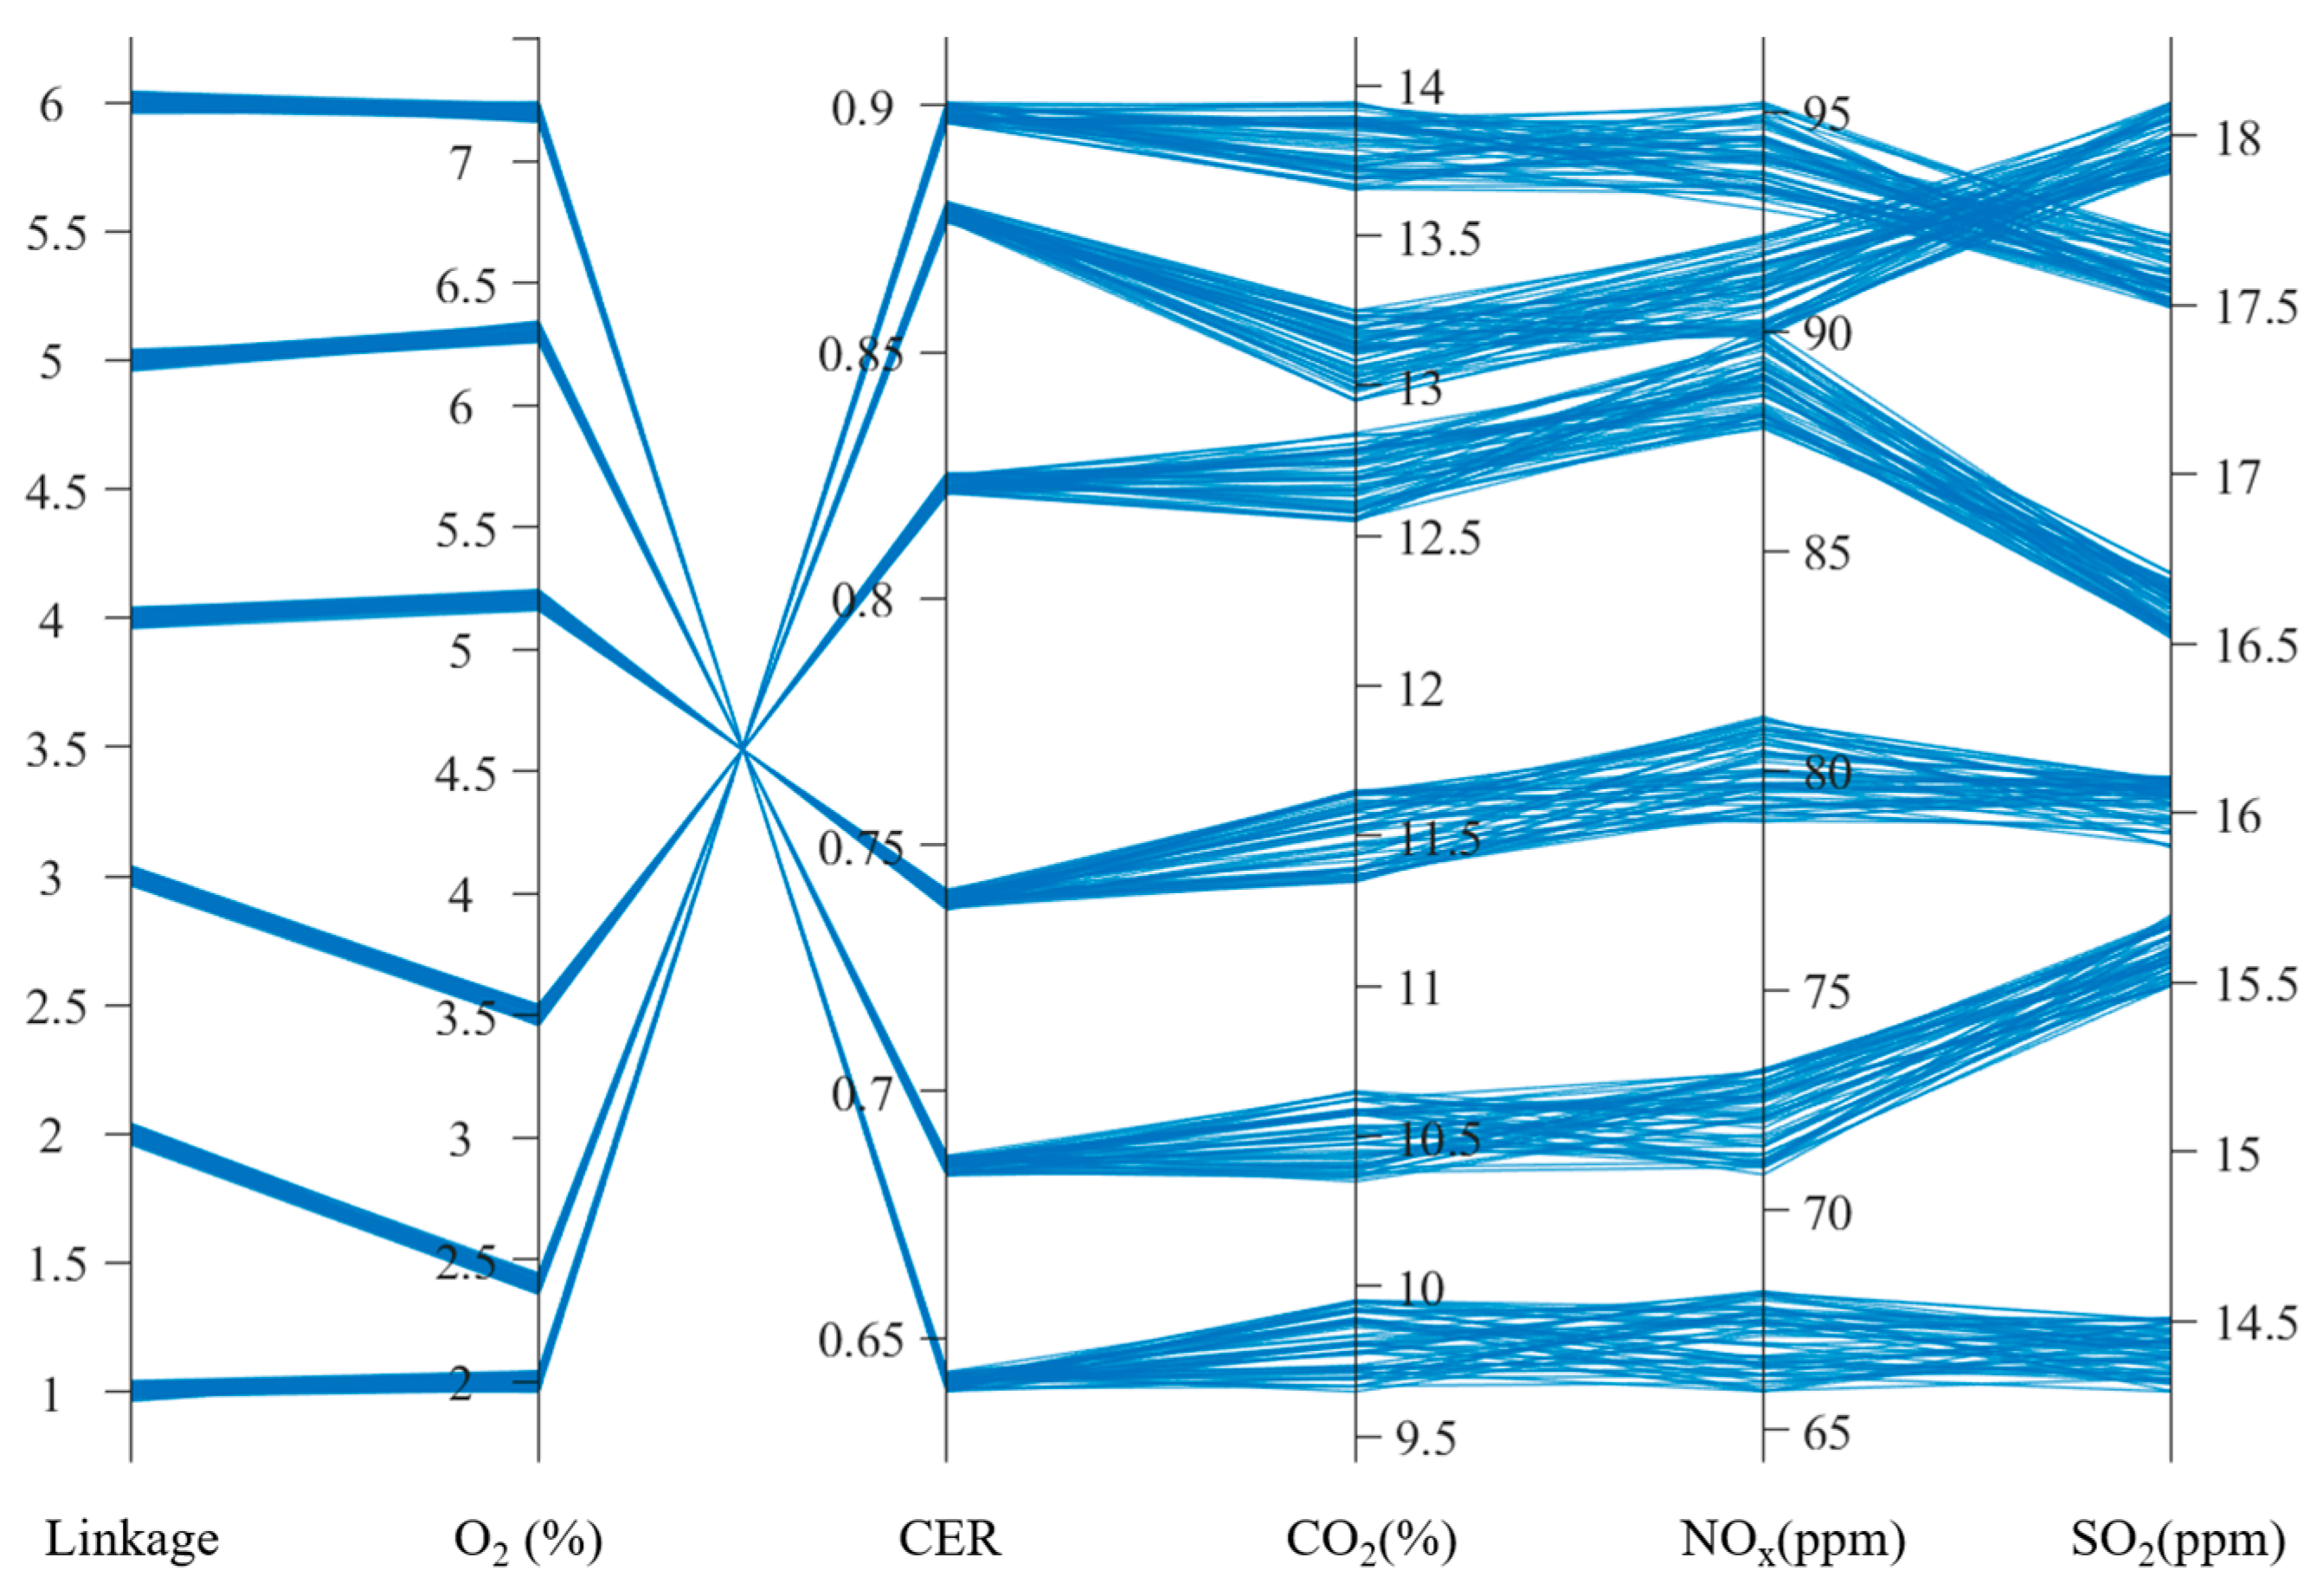
2.3. Variations in CER Based on Linkage Control

In a combustion field, the equivalence ratio is commonly used to describe the ratio of the actual fuel-to-air ratio in a combustion process to the stoichiometric fuel-to-air ratio. The stoichiometric ratio is the ideal ratio at which all fuel and oxidants (typically air) are consumed without excess or deficiency. The CER is a crucial parameter in combustion analysis and optimization. It influences various combustion characteristics, including flame temperature, combustion efficiency, and the formation of pollutants. By controlling and adjusting the CER, the combustion process can be optimized for specific applications, such as maximizing energy efficiency or minimizing emissions.
As the linkage changes, the concentration of O 2 in the exhaust gas varies. The measured O 2 concentration can be utilized to estimate the CER, enabling the determination of the completeness of combustion in the OFB.
The OFB used in the experiment requires about 15% excess air to ensure complete combustion. In addition, if the fuel is oversaturated, combustion in this OFB will disappear and the plant will not be able to continue, so this study deals only with fuel-lean combustion. Gas oil with the chemical formula C 12 H 26 is used as the fuel for the OFB. The concentration of nitrogen in air is estimated to be 3.76 times that of O 2 .
Also, since this experiment deals with fuel-lean combustion, HC (hydrocarbons) was not considered, and similarly, CO (carbon monoxide), which generates less than CO2 in fuel-lean combustion, was not considered.
CER in fuel-lean combustion is defined as follows:
C 12 H 26 + ρ a O 2 + 3.76 N 2 = 12 C O 2 + 13 H 2 O + χ a O 2 + 3.76 ρ a N 2
1   m o l of C 12 H 26 requires ρ a   m o l of air for complete combustion. This combustion has the following characteristics. It produces 12   m o l of C O 2 , 13   m o l of H 2 O , and 3.76 ρ a   m o l of N 2 , along with the presence of unreacted O 2   m o l χ a , depending on the value of ρ a .
The molecular formula for O 2 is as follows:
2 ρ a = 24 + 13 + 2 χ a
ρ a = χ a + 18.5
In the case of complete combustion, as per the theoretical equation, χ a   should be 0. Thus, the theoretical amount of air required, ρ e , is 18.5   m o l . The O 2 concentration δ o of the exhaust gas can be obtained from the ratio of moles of O 2   χ e to the total moles of combustion products. In addition, if this is denoted as ρ a , it can be expressed as follows:
δ o = χ e 12 + 13 + χ e + 3.76 ρ a
ρ a = 13 δ o + 37 2 9.52 δ o
Therefore, the CER based on the O 2 concentration of the exhaust gas can be expressed as:
C E R = ρ e ρ a = 18.5 13 δ o + 37 2 9.52 δ o 1
When the CER is 1, the mixture is in a chemically balanced state. This means that the fuel and air theoretically experience a complete chemical reaction [22].
If the CER is less than 1, fuel is considered to be lacking, indicating more air than stated in the stoichiometric requirements. In such cases, incomplete combustion may occur, resulting in a decrease in temperature [23].
Conversely, a value greater than 1 shows fuel richness, indicating more fuel than stated in the stoichiometric requirements. This can lead to the formation of pollutants such as fuel residues and carbon monoxide ( C O ), along with an increase in exhaust gas temperature [24].
Therefore, by estimating the CER based on the measured O 2 volume ratio by using the exhaust gas analyzer through the six-step change in linkage in the experiment, the combustion performance of the OFB can be evaluated for each combustion condition.

3. Analysis of Collected Data

The experiments were conducted 50 times, resulting in the collection of 300 datasets through six-step changes in Linkage.
Flame image data and exhaust gas data were obtained, as shown in Figure 3, using Matlab’s Simulink, which enables real-time integration of a Webcam and cDAQ, an analog data collection device.
The original data of the flame image collected from the webcam was resized (cropped) to fit the size of the learning data. The experiment collected an RGB original dataset, histogramized RGB data, and the proposed SEF data columns from the RGB original dataset and concatenated them with the measured values of air pollutants to obtain training data.

3.1. Exhaust Gas Data

The exhaust gas data were collected, as depicted in Figure 4, showing the average and distribution of the exhaust gas components with respect to the CER.
Depending on the position of the linkage, the O 2 concentration exhibited a proportional relationship, whereas the concentrations of C O 2 , N O x and S O 2 decreased in an inverse proportion. As the linkage position changed from 1 to 6, the O 2 concentration increased, and the levels of C O 2 , N O x and S O 2 decreased. Expanding the damper opening resulted in an increase in O 2 concentration increased, and the CER decreased.
As a result, it can be seen that in the OFB used in the experiment, as the CER decreases, the production of C O 2 , N O x and S O 2 decreases.
This resulted in a lower CER for boiler combustion, leading to improved combustion quality and reduced production of
In Table 2, examining the data characteristics in terms of CER changes according to linkage, it can be observed that the variance of the mean for each dataset is uniform. This indicates low data uncertainty, ensuring the reliability of the data for both model training stability and model interpretation.

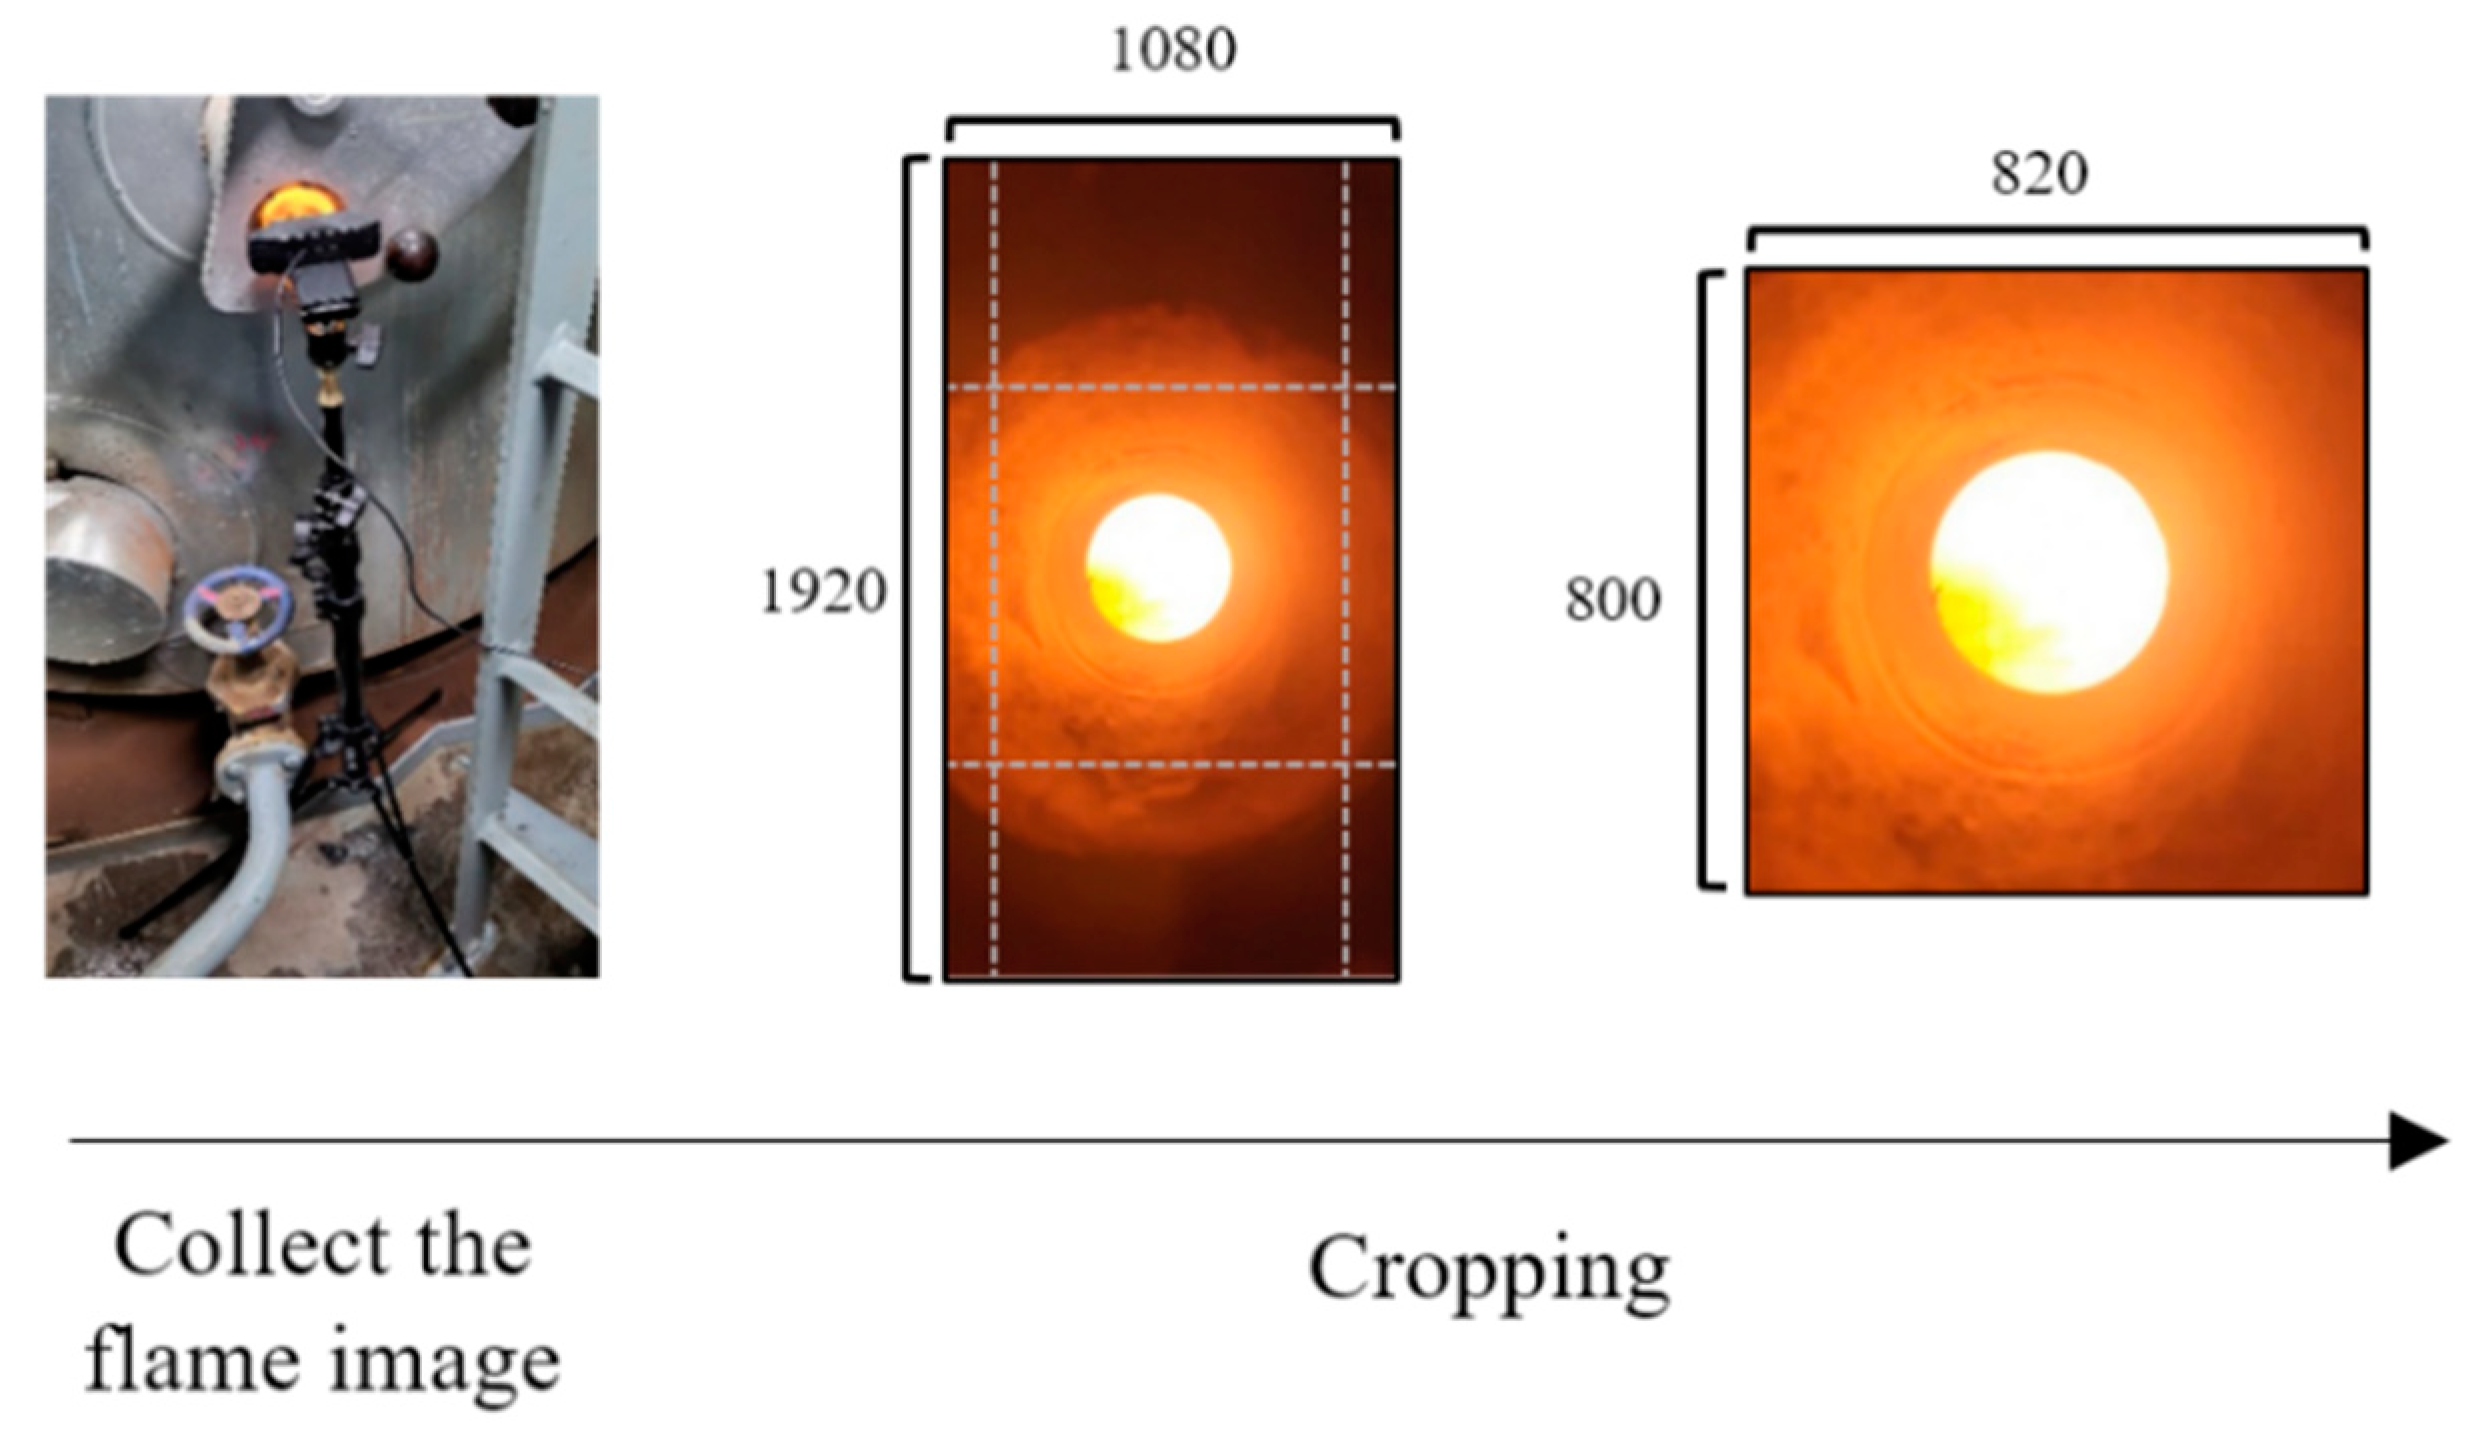
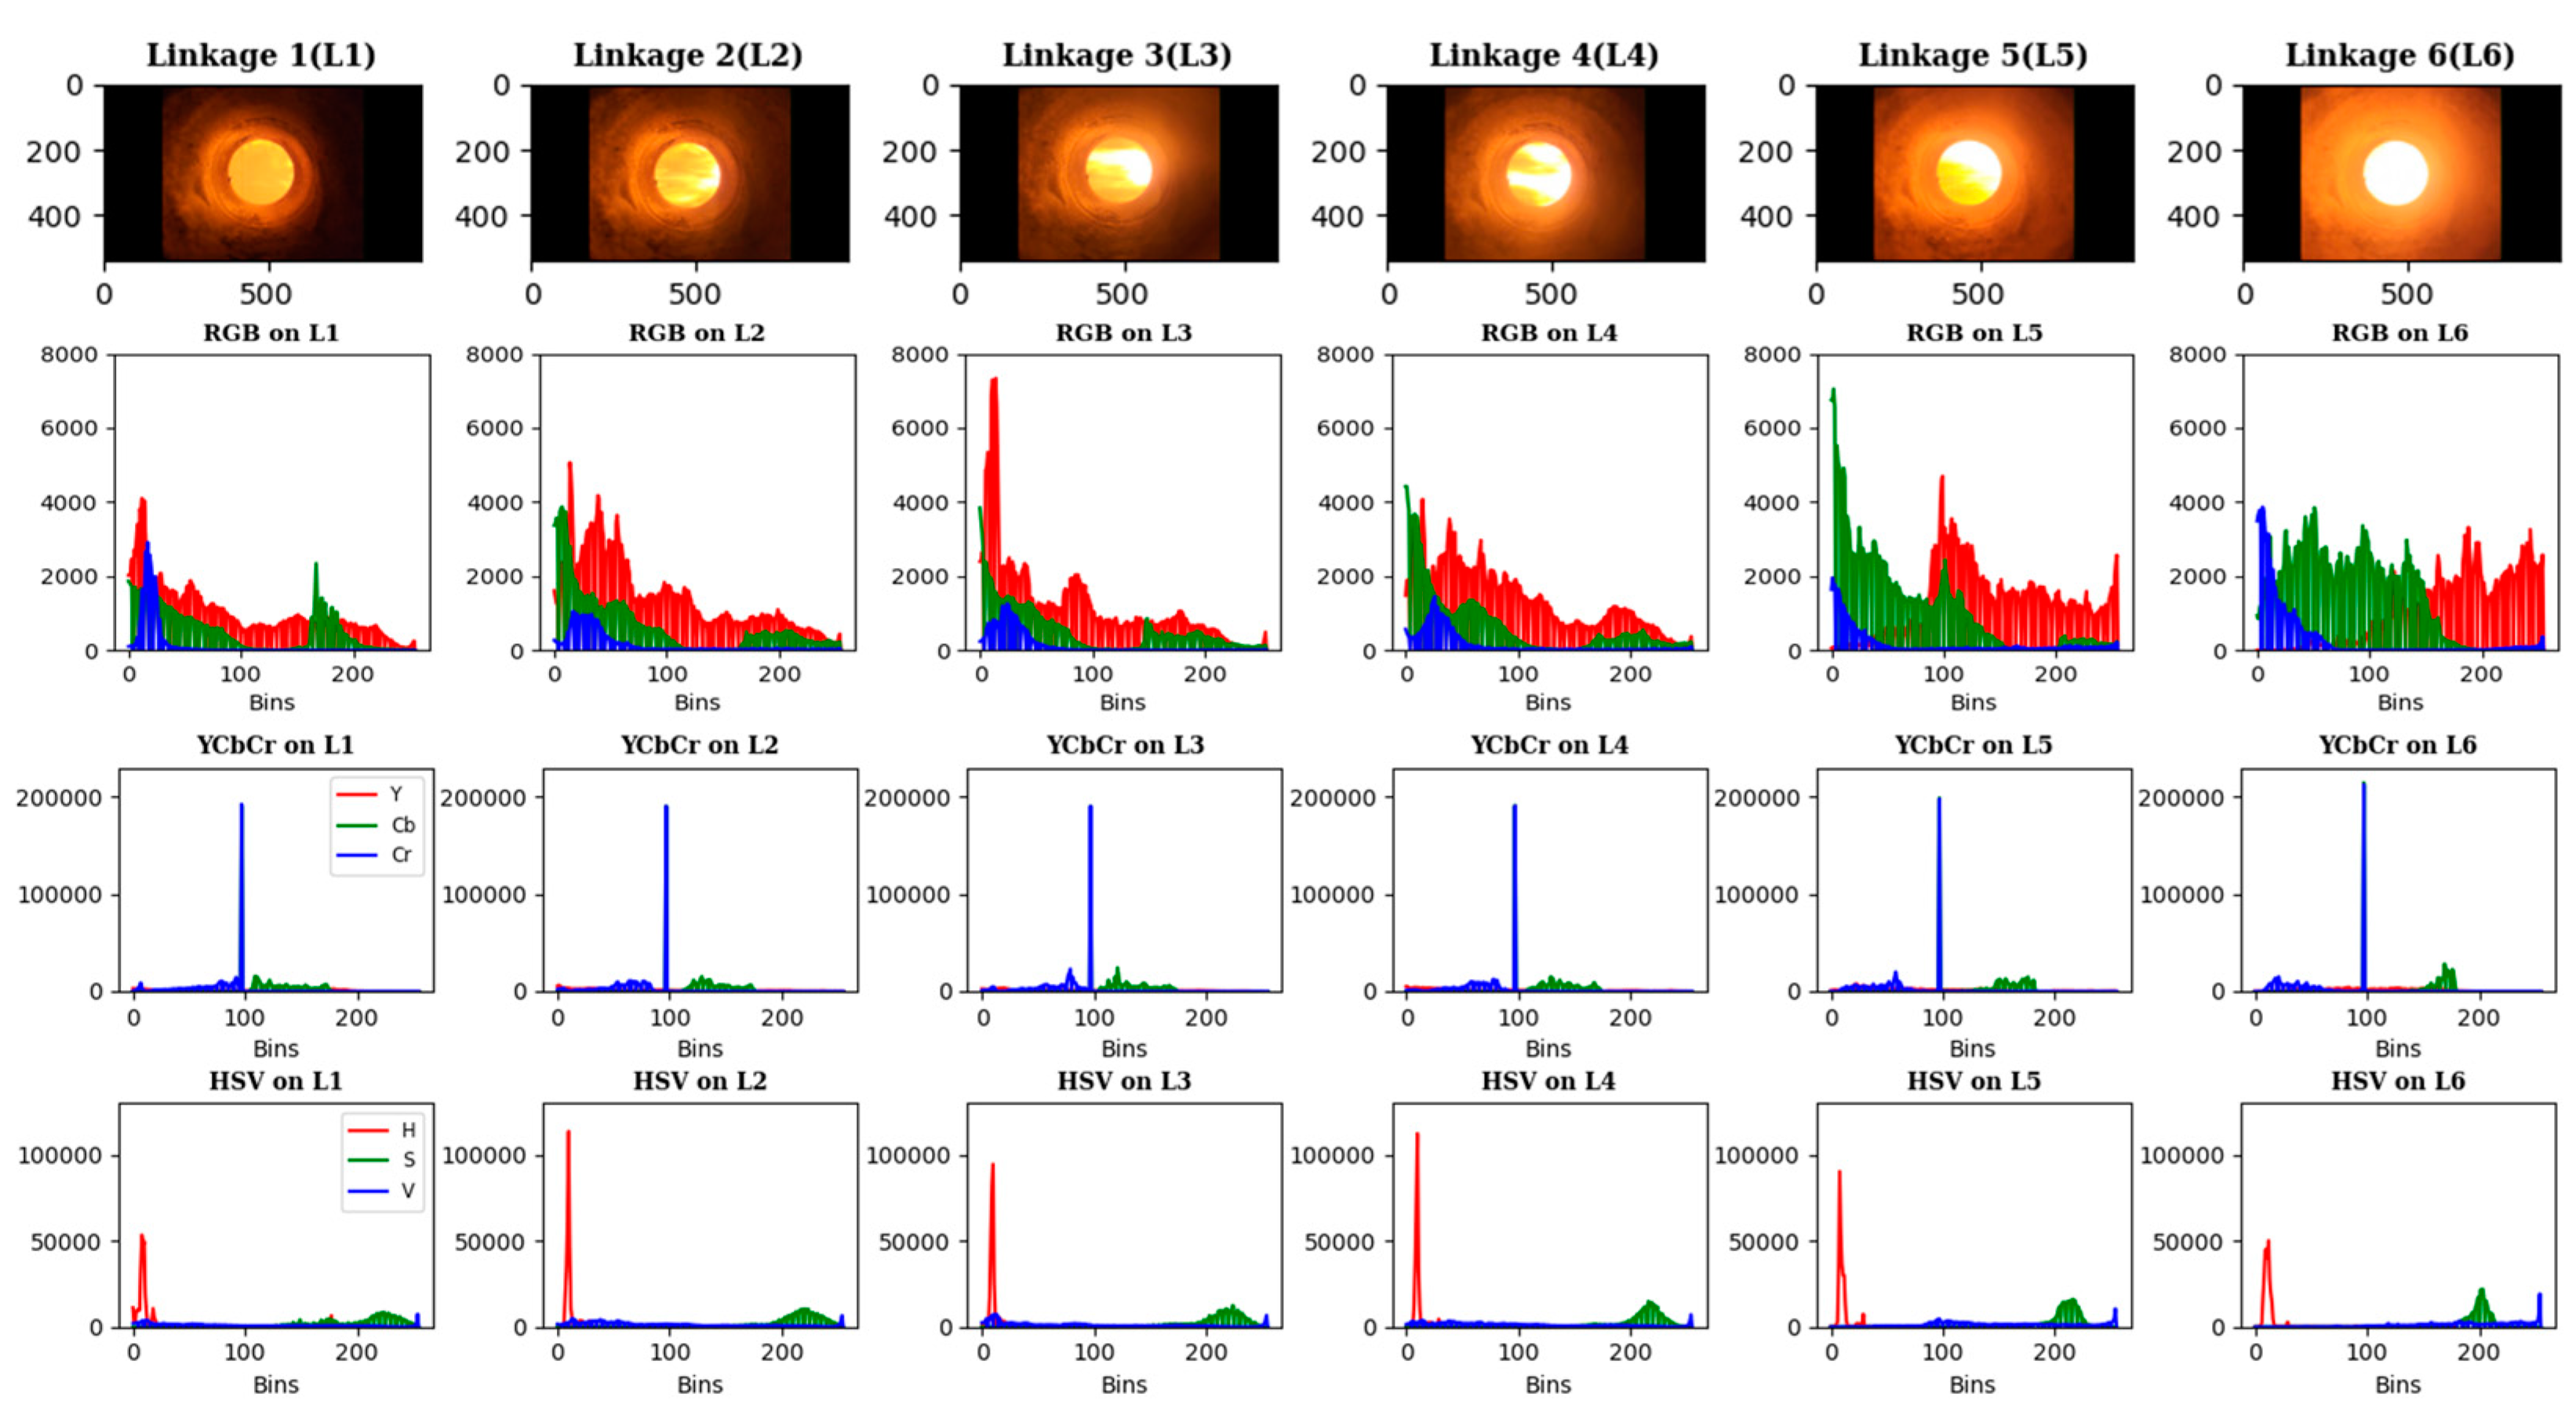
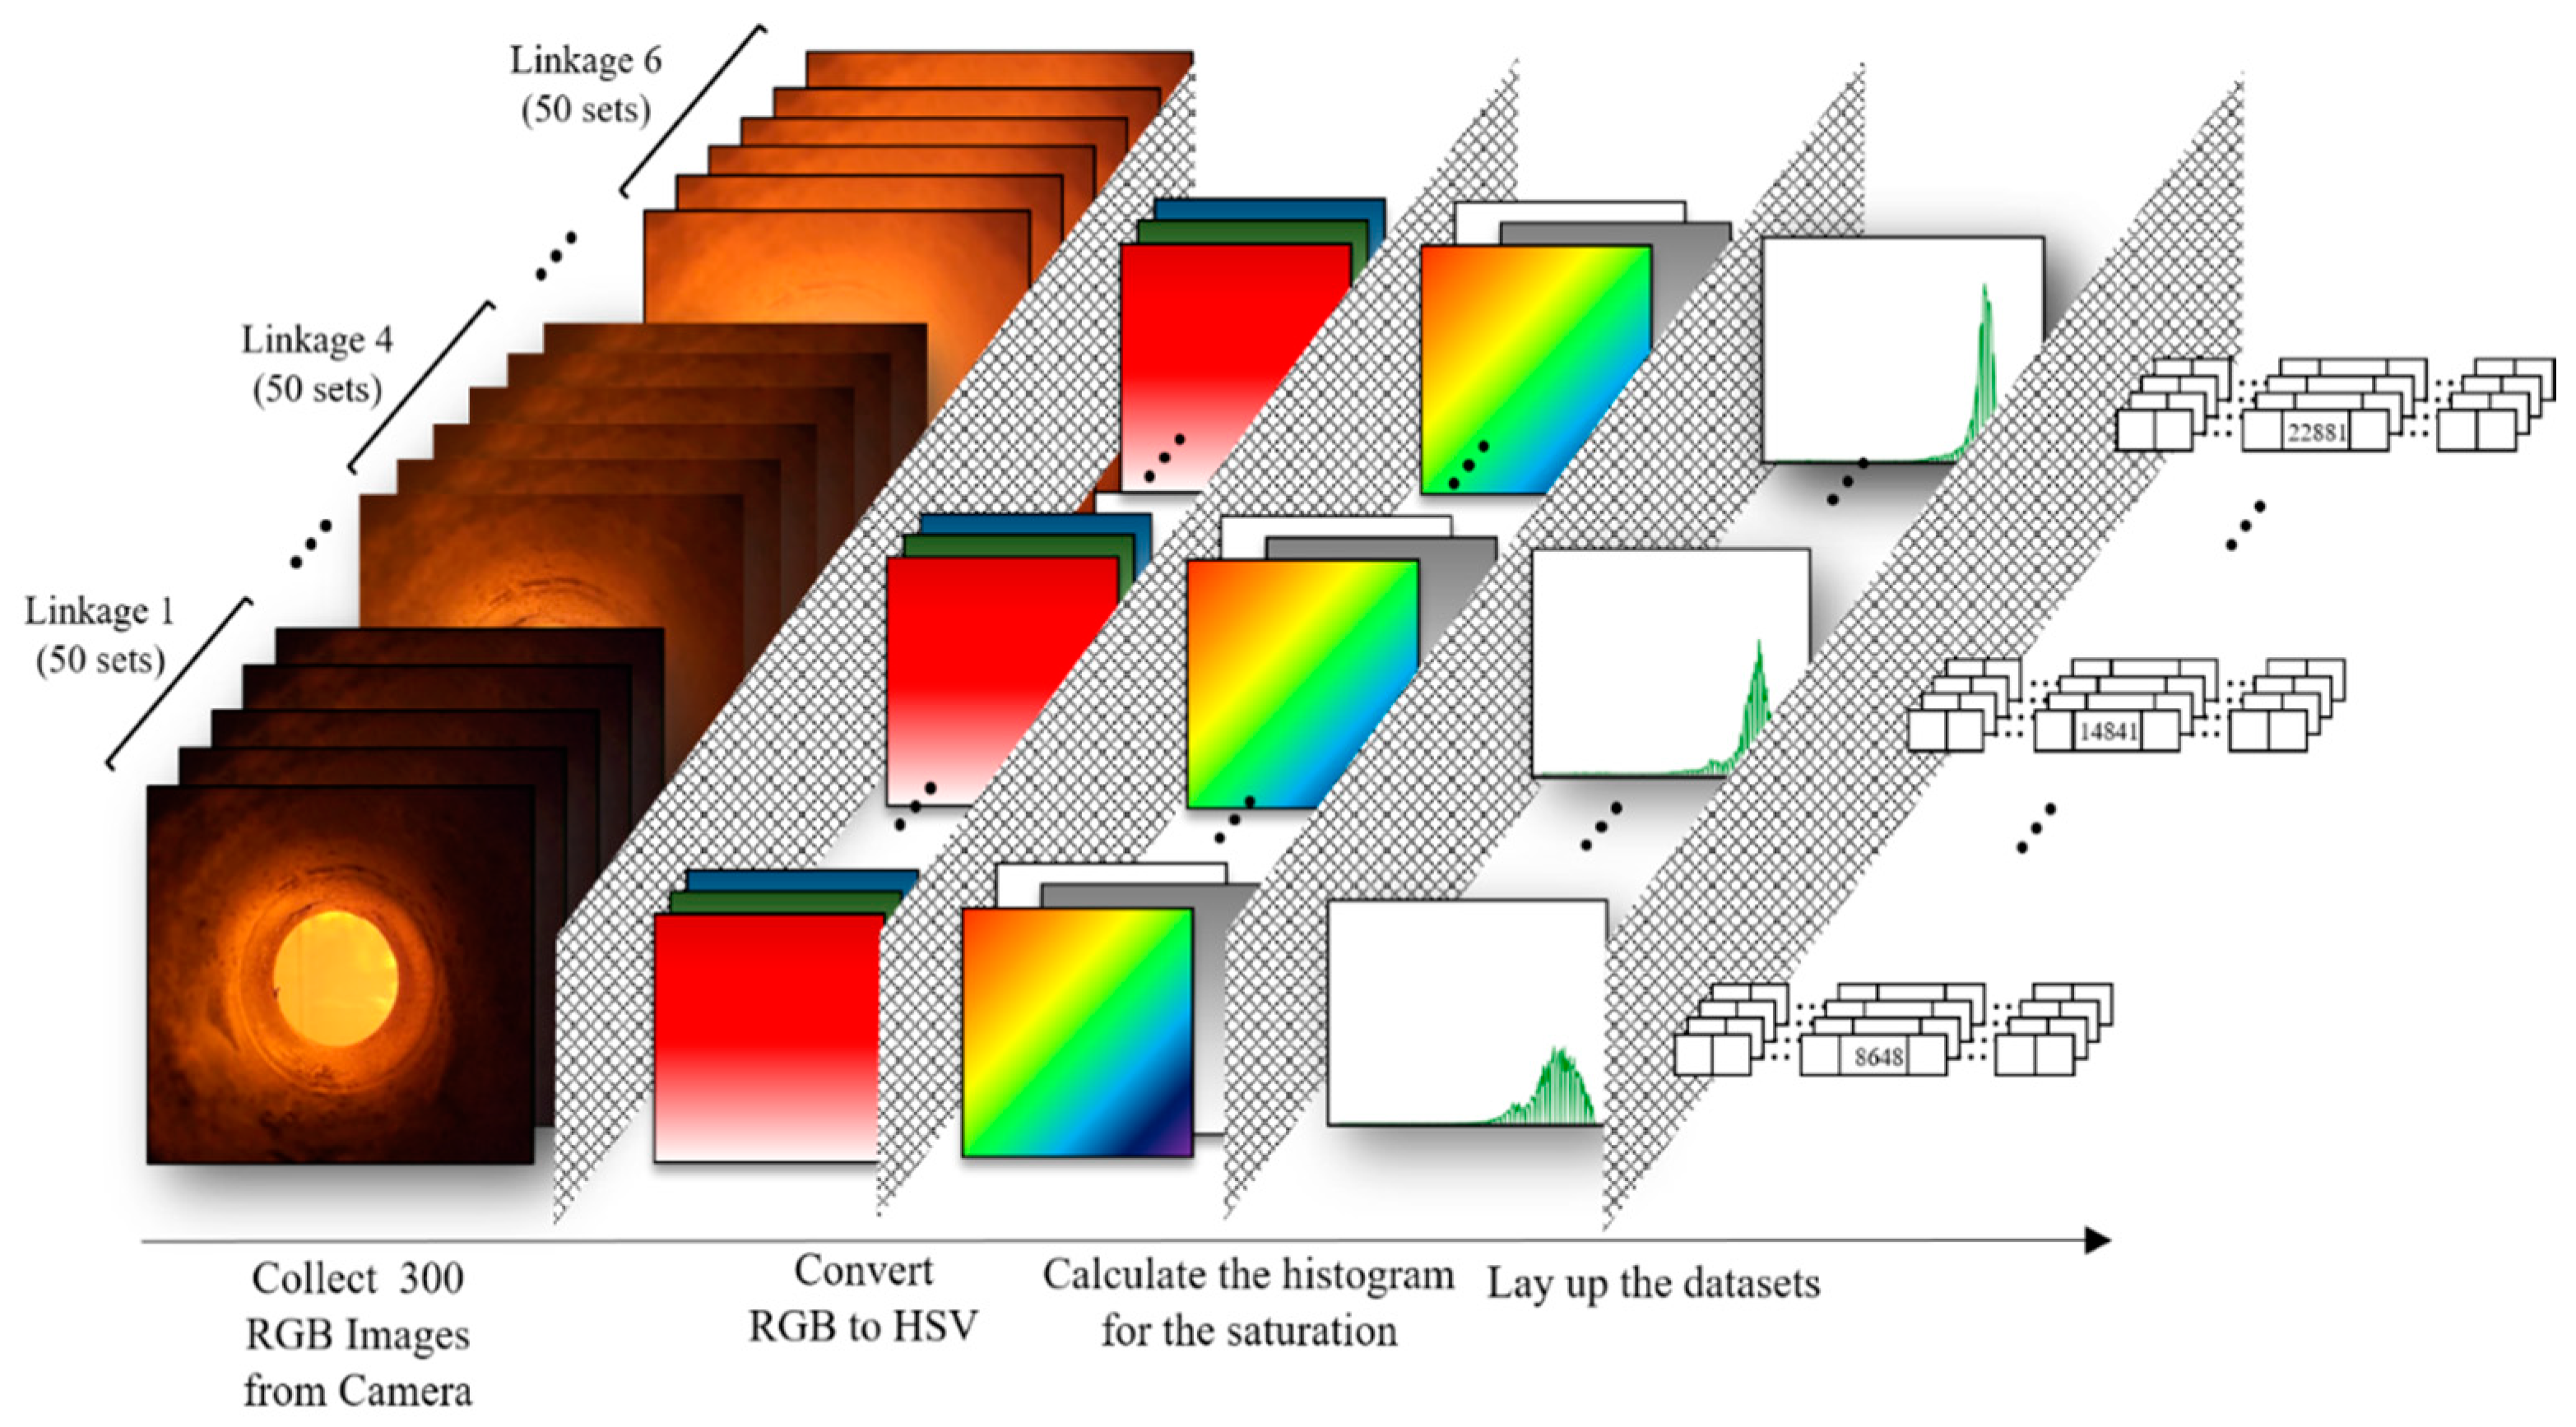
3.2. Collection of Flame Images

In the flame image shown from the fire observation port, minimal variation in shape depending on the CER is observed. Therefore, to identify differences in the parameter data of the flame image depending on the CER, detailed information regarding brightness, saturation, and luminance is required. In previous studies, image data ranging from resolutions of 488 × 582 to 1280 × 1024 were obtained using a CCD camera [15,25]. However, because of insufficient information, characteristics cannot be asserted to be solely based on flame shape. Therefore, additional information, such as brightness and saturation, is required.
In this study, flame images are captured using a high-resolution CMOS webcam in the format of 1920 (H) × 1080 (W) (1080p) to obtain detailed information. The camera is positioned at the flame-fire observation port located on the side of the boiler, following SOLAS regulations [26]. Using a flame-fire observation port has the advantage of being cost-effective, as it enables image data collection without requiring additional construction. However, it has the limitation that the entire shape of the flame cannot be captured in the image. As image collection aims to observe the brightness characteristics of fire using O 2 concentration, numerous image characteristics should be captured by measuring both the color of the flame and reflected light. Additionally, when storing the collected image information through histogramization, if the histogramized high-definition data exceeds 2 bytes ( 2 16 ) per bin, not all features can be included. Therefore, in the original 1920 × 1080 pixel image, the image area that does not exceed 2 bytes of information per bin needs to be cropped. Through several experiments, the area where the image features can be effectively extracted was designated as 800 (H) × 820 (W), as shown in Figure 5, and the stored images are primarily collected in an RGB format before color modulation.

4. Color Space Conversion of Flame Images

The color space spectrum used in this study can be referenced in Figure 6 [27].

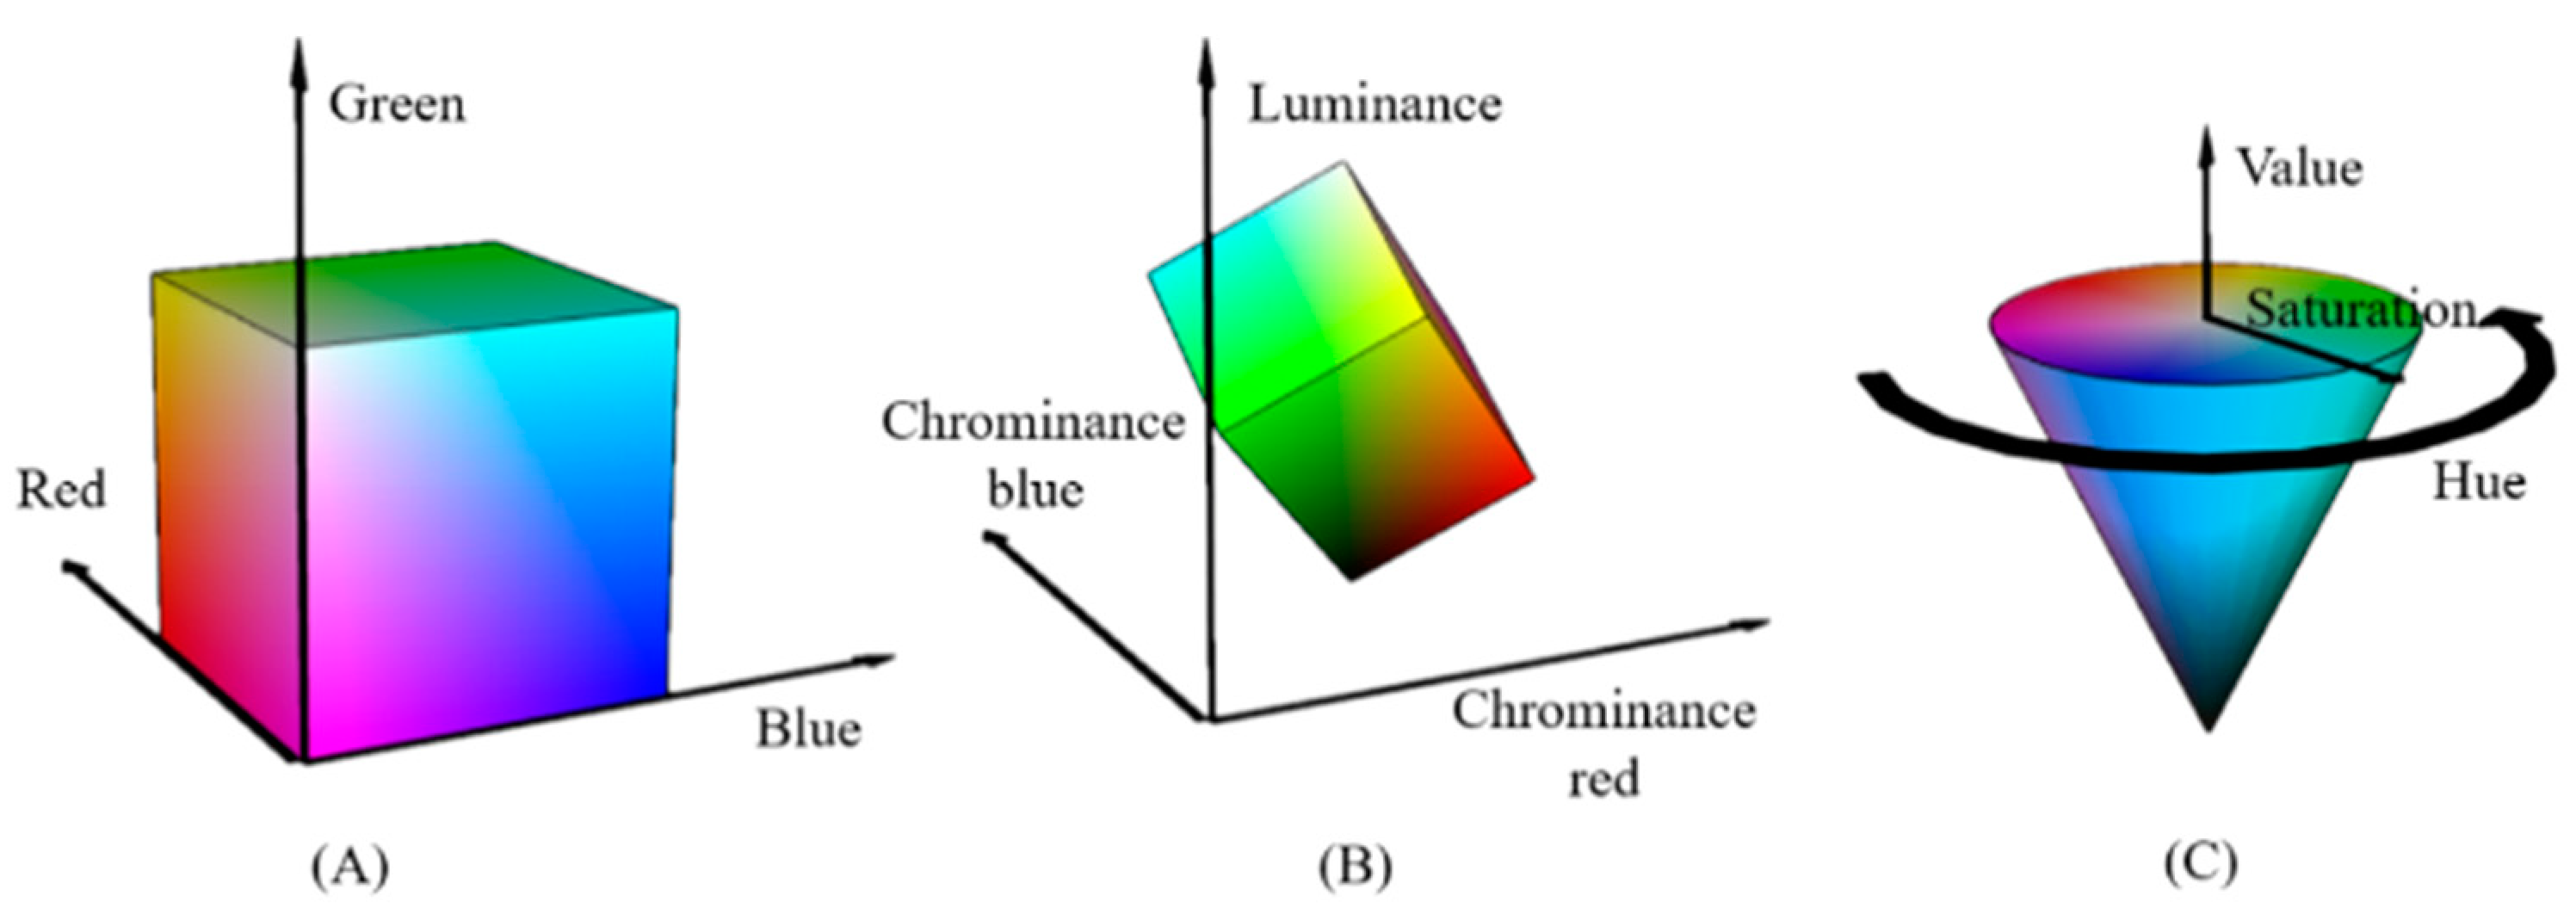
4.1. RGB, YCbCr Space, and HSV Space

4.1.1. RGB

RGB hue modification is a technique used to alter the hue of an image within the RGB color space. It involves adjusting the pixel values of the red (R), green (G), and blue (B) channels to change the color tone of an image. This method is commonly used in image processing and color correction tasks to achieve desired color effects. RGB hue modification is widely employed in various applications related to image manipulation and color correction [28,29].
r = R R + G + B , g = G R + G + B , b = B R + G + B

4.1.2. YcbCr

Owing to the high sensitivity of the RGB color domain to changes in intensity, various color spaces are being proposed to enhance color accuracy or segmentation. In the YcbCr color space, “Y” represents the luminance component, and “Cb” and “Cr” represent the differences between blue and luminance (B_Y) and red and luminance (R_Y), respectively. If R, G, and B are represented with 8-bit digital precision, the YcbCr values can be obtained from the RGB coordinates using a transformation matrix, as demonstrated below [30].
    Y = 16 + 65.481 R + 128.533 G + 24.966 B C b = 128 37.797 R 74.203 G + 112 B C r = 128 + 112 R + 93.786 G 18.214 B

4.1.3. HSV

HSV color spaces were originally designed to provide an intuitive method of handling colors and were intended to approximate human perception of colors. These color spaces were developed when colors had to be identified manually. However, they are rarely used currently as people can easily select colors with their eyes or specify Pantone colors [31].

4.2. Color Space Analysis for Image Feature Extraction

In this study, a histogram technique is employed to analyze the spectrum for each CER of the images stored in the form of a three-dimensional array. This technique involves graphically representing the distribution of pixel data values in specific regions (bins) within an image. It is widely used in the field of computer vision for identifying and analyzing image characteristics, providing a visual means of spectrum analysis [32].
Figure 7 presents representative images collected for each linkage position and displays the color data histograms obtained through color modulation for the RGB original data, YCbCr, and HSV color spaces. In the RGB histogram, L2 and L4 exhibit similar spectra in terms of distribution and numerical values. Therefore, feature differences between them cannot easily be distinguished.
In the YCbCr histogram, the Cr value increases as the linkage position increases. Nevertheless, the difference between L1 and L4 is minimal, resulting in low data separability. However, the saturation spectrum of HSV exhibits noticeable differences.
Figure 8 represents the extraction of the saturation component from the HSV histogram of the flame image, with the maximum values for each bin displayed. This figure shows that within the HSV color space, where the hue remains consistently distributed between 0 and 30, the histogram distribution of saturation exhibits a consistent pattern while the values increase, indicating a spectrum. The hue of all combustion flame images being distributed within a certain range means that they have similar colors. Additionally, as CER increases, saturation decreases, meaning the intensity of a specific color increases. The data distribution of saturation for each linkage in the flame images obtained from a total of 300 experiments is shown in Figure 9.
The image data for each linkage, comprising 50 samples, exhibited similar distributions across the saturation histogram bins but displayed variations in the maximum values. Table 3 shows the highest values of the average values of the maximum and minimum from the saturation histogram for each linkage.
As presented in Table 3, the distribution range of saturation varies for each linkage, depending on the average values. This difference ensures a noticeable distinction in data characteristics.

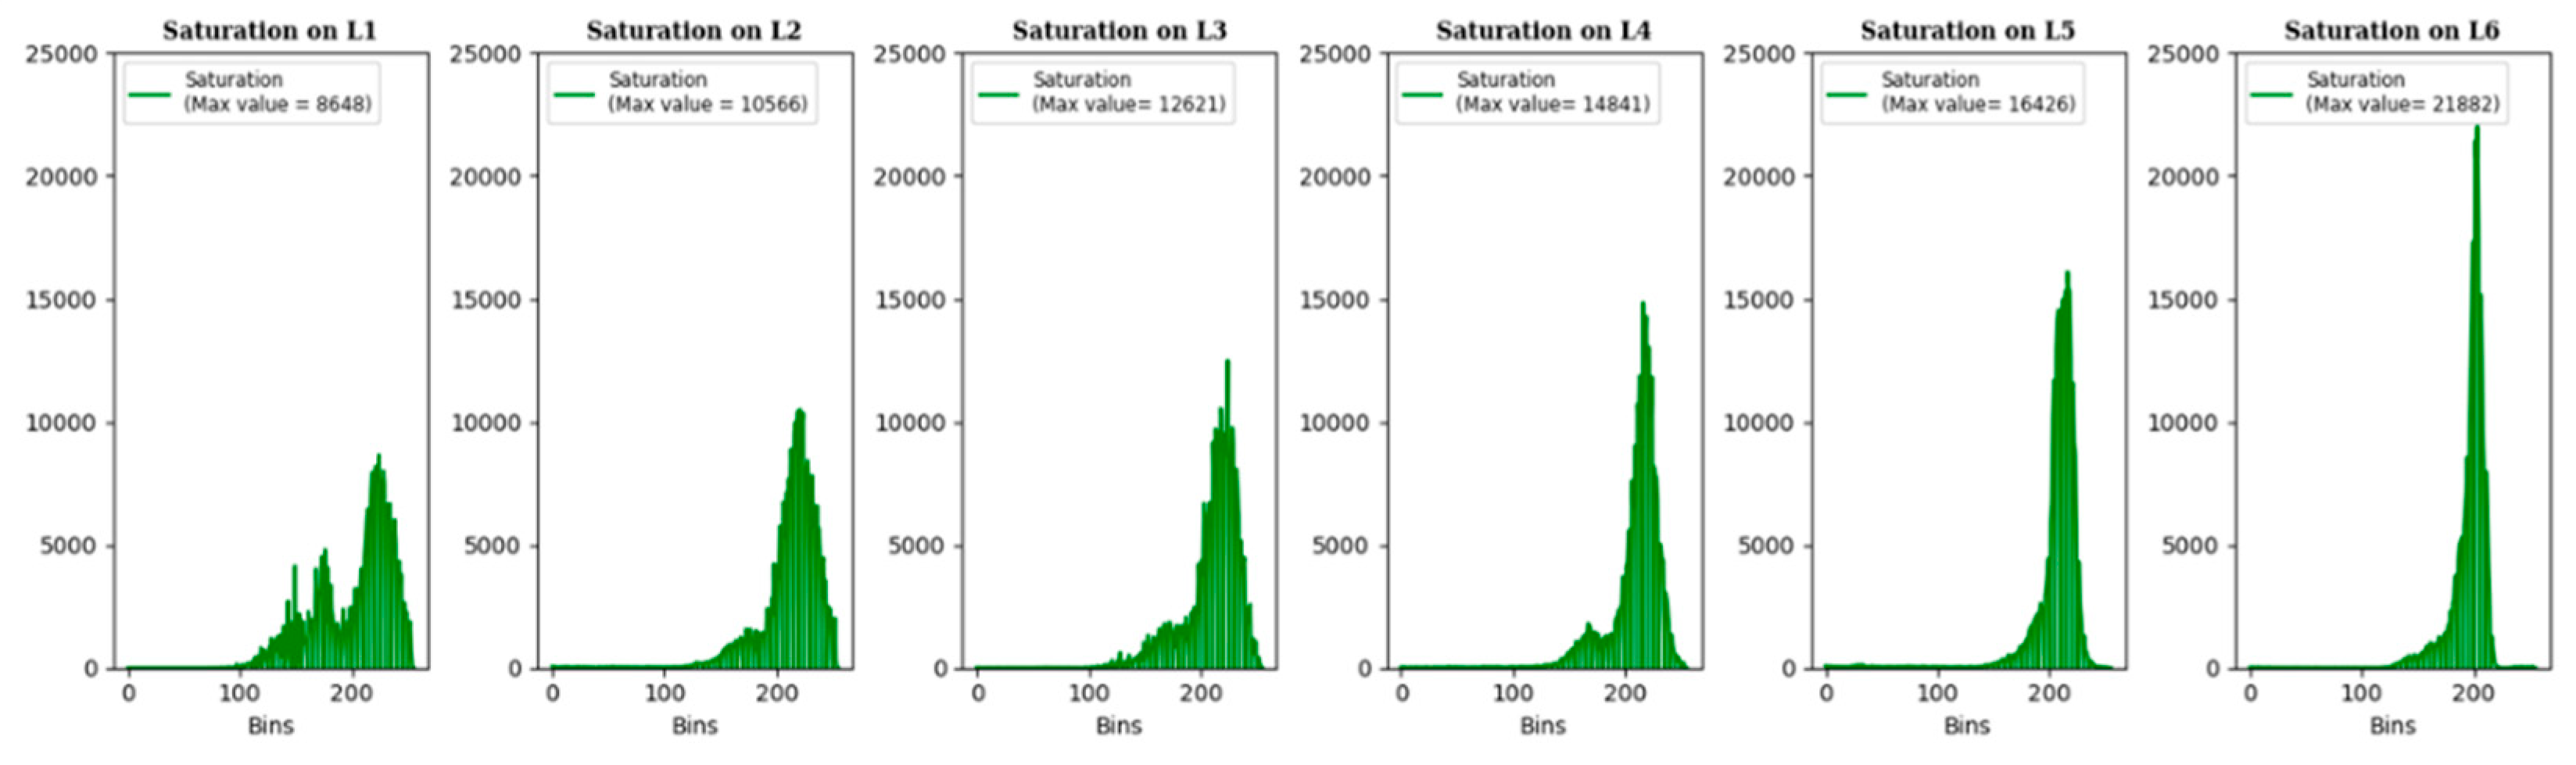
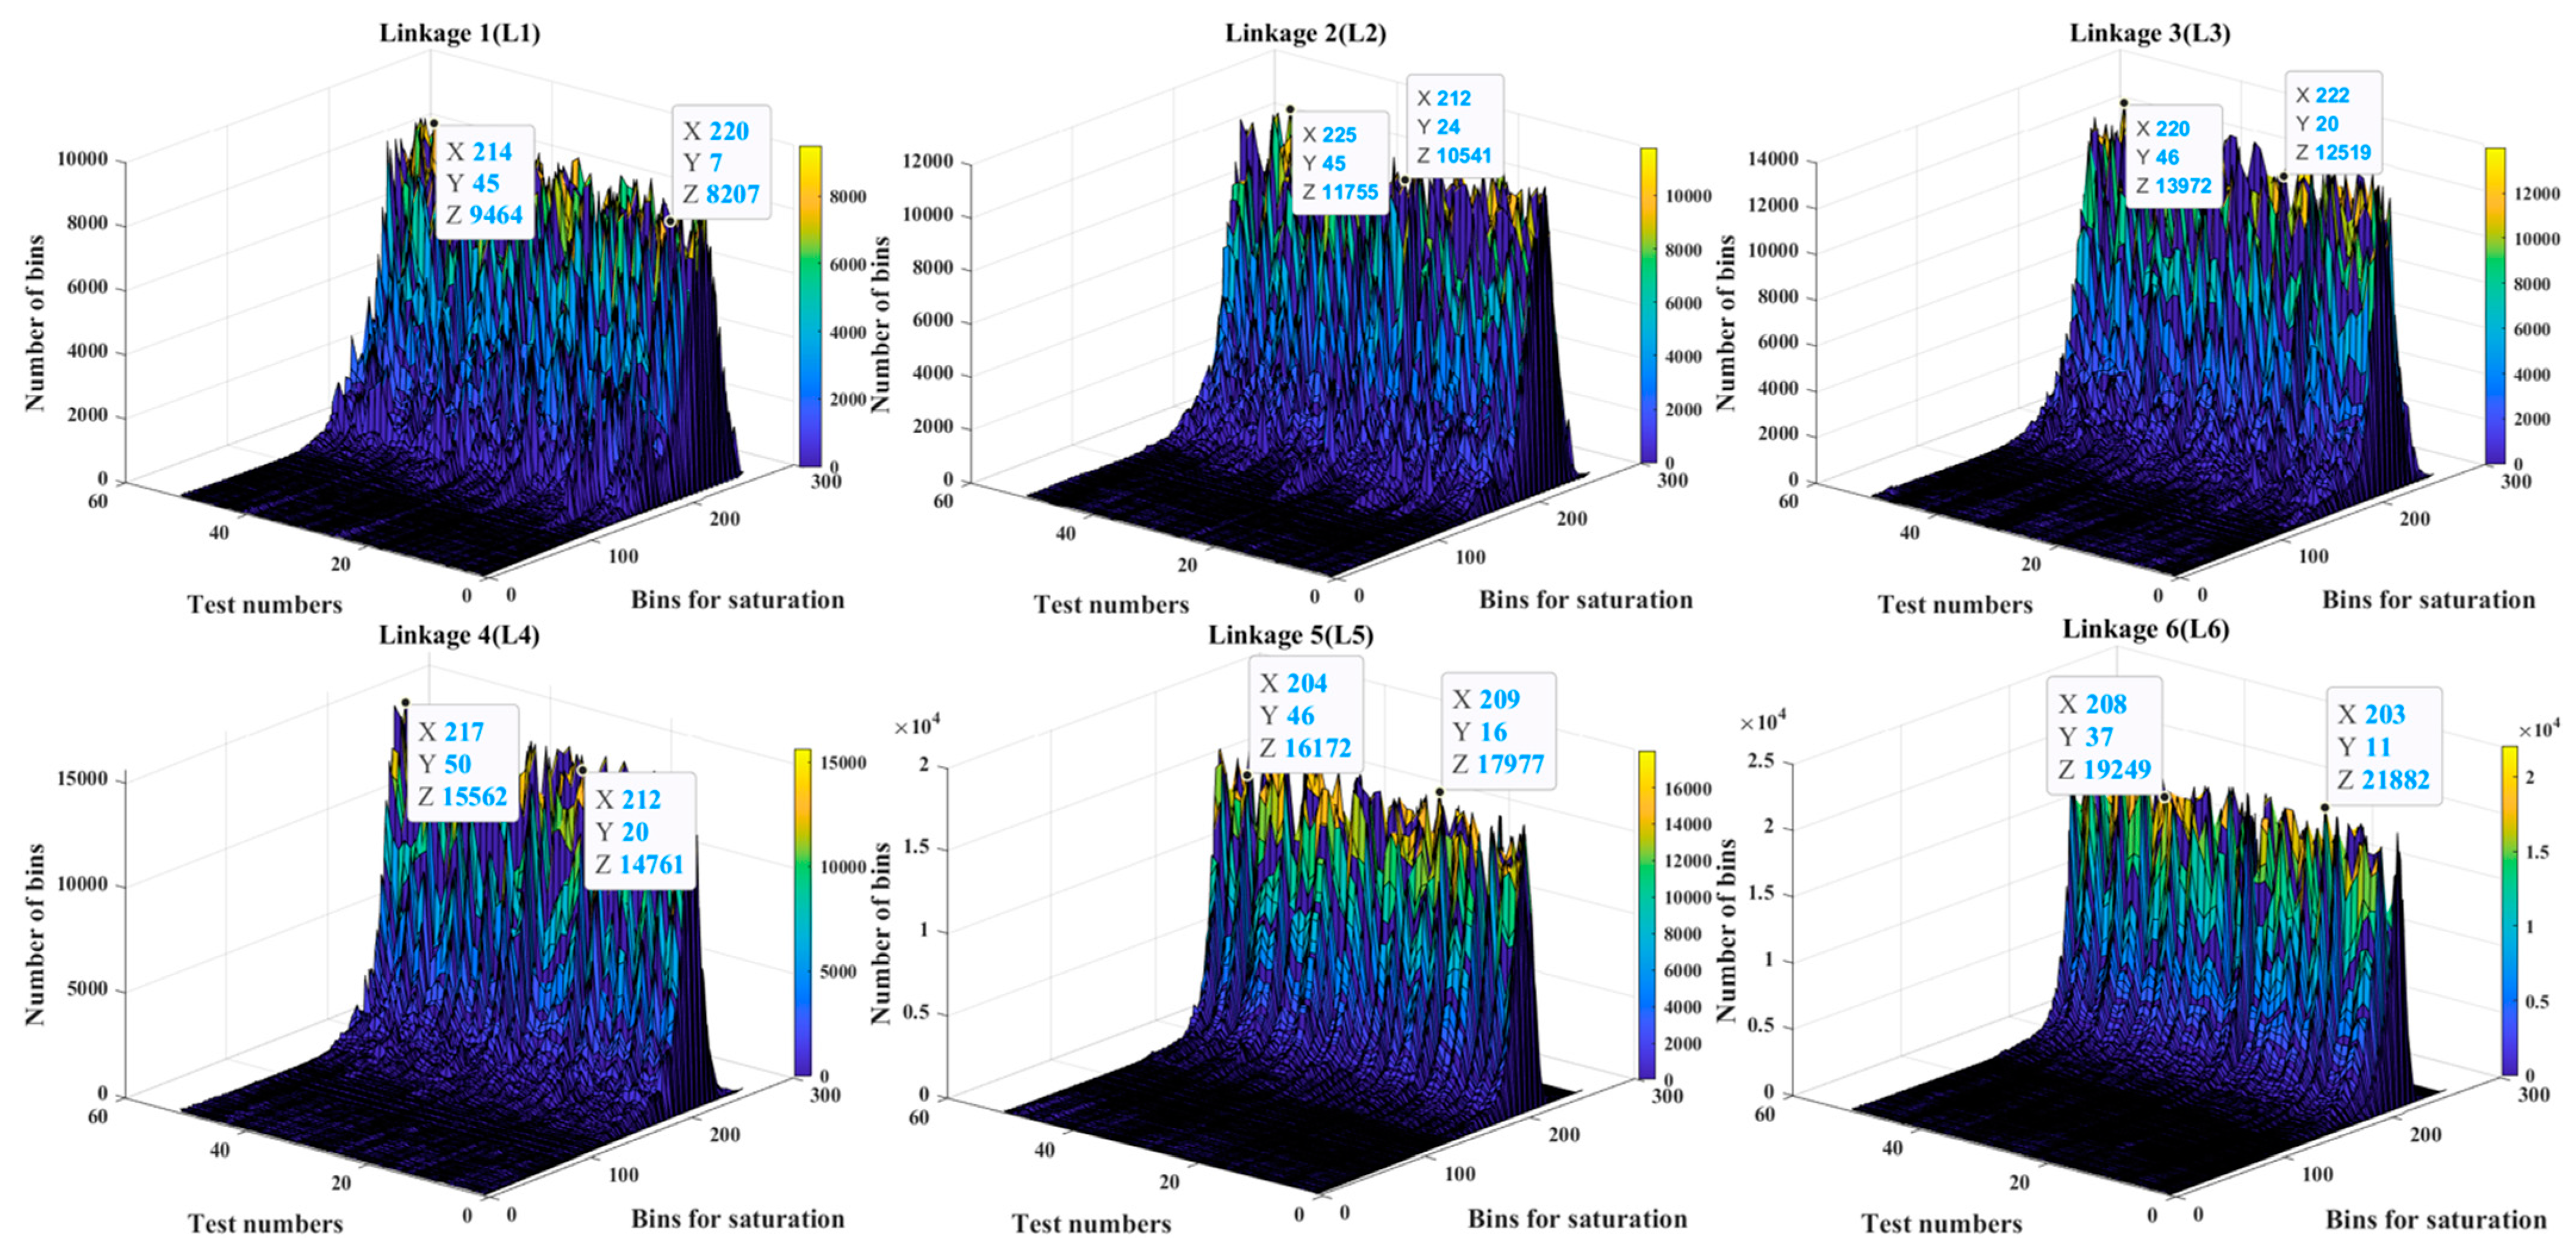
4.3. Saturation Extraction Filter (SEF) for Image Feature Extraction

The original color data from the CMOS Webcam with a resolution of 1080p has a size of 6,220,800 bytes, as indicated in the equation:
1920 H × 1080 W × 3 D i m e n s i o n : R , G , B × 1 b y t e s = 6,220,800   b y t e s
Notably, using this data input for the learning model may increase training time and decrease prediction accuracy because of overfitting. Therefore, dimensionality reduction techniques such as PCA and convolutional neural networks (CNN) are commonly employed in the field of computer vision [33,34]. However, the use of these techniques can result in the loss of fine-grained information from the data, and excessive reduction in dimensions can lead to overfitting and decreased prediction accuracy [35,36].
In this section, the study presents a filtering method for extracting data features in the form of feature data extraction rather than dimensionality reduction. This approach reduces data size while preserving detailed information by leveraging the spectral aspect of saturation analyzed in Section 3.
To consider the difference in the saturation spectrum of flame images across different linkages as input for learning, RGB image data are converted to HSV data.
Then, only the saturation component is extracted. Subsequently, the extracted saturation values are histogramized.
{ 180 ( H u e ) + 256 ( S a t u r a t i o n ) + 256 ( v a l u e ) ) × 2 ( b y t e s ) = 1384   b y t e s
Consequently, the size of the flame image data amounts to 6,220,800 bytes and is ultimately output in the form of feature extraction with a size of 256 × 2 bytes using the equation:
256 S a t u r a t i o n × 2 b y t e s = 512   b y t e s

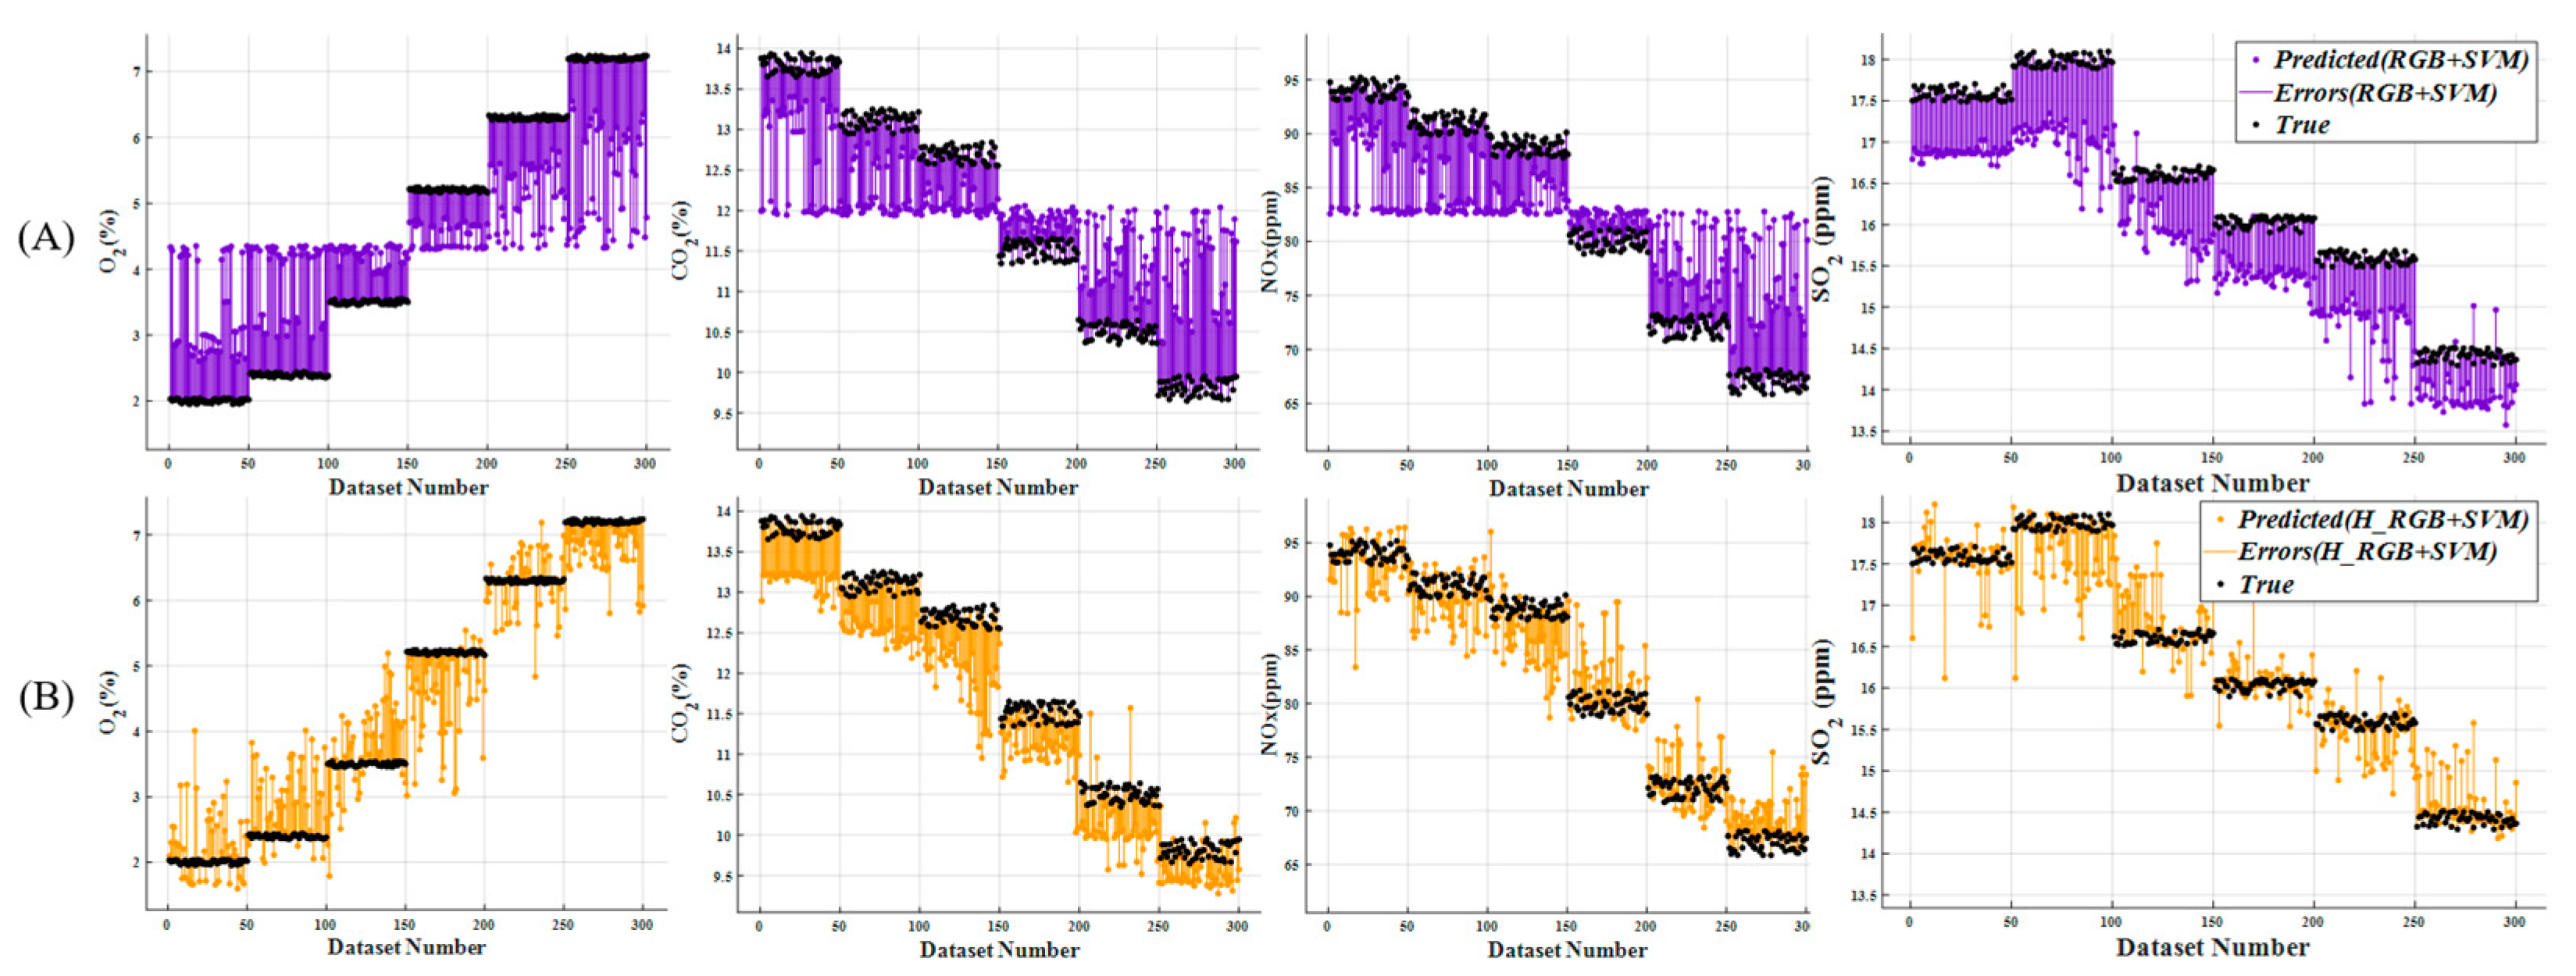
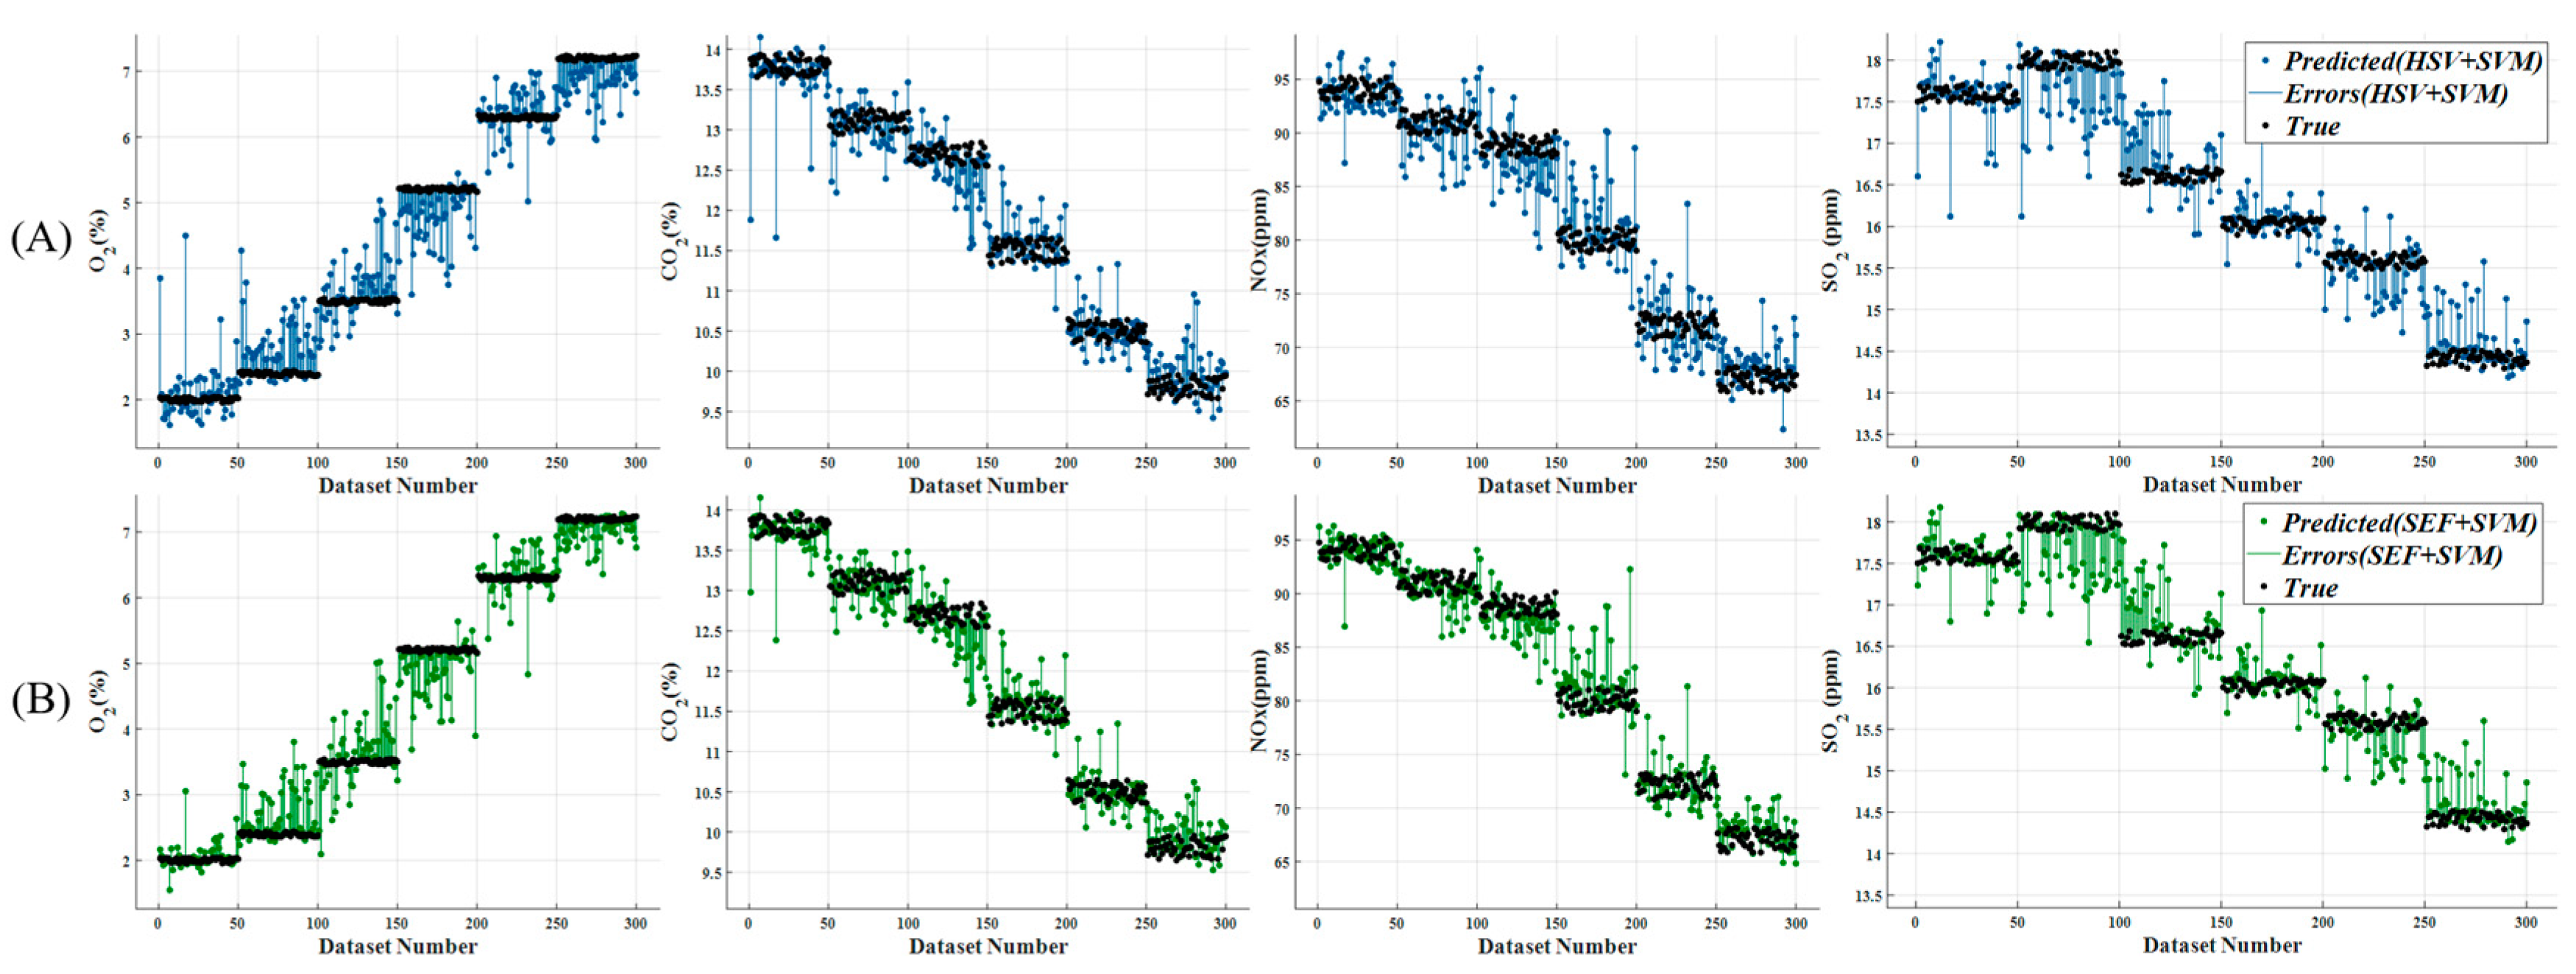
5. Comparison of Prediction Accuracy and Results

The data formation process through the proposed SEF can be seen in Figure 10.

5.1. Constructing the Dataset

To validate the effectiveness of the image extraction filter proposed in this study, a set of 300 images captured using a CMOS webcam were transformed into RGB original, histogramized RGB, histogramized HSV, and SEF-filtered image data. The learning accuracies of these different image data sets were compared with assess their performance.
As seen in Figure 10, the training dataset was prepared by combining 300 data samples of the original RGB image data (RGB_Origin) with a size of 800(H) × 820(W) × 3(D), histogramized RGB data (Histo_RGB) with a size of 768 (256 + 256 + 256), histogramized HSV data obtained after converting to HSV (Histo_HSV) with a size of 692 (180 + 256 + 256), and the SEF-transformed data with a size of 256. This resulted in a dataset of 300 × 4 EGC data.
The size of each dataset is presented in Table 4.

5.2. Model of Prediction

An SVM is a machine learning algorithm used for data classification and regression that determines the decision boundary and maximizes the distance between the closest data points, known as support vectors, to classify them [37,38]. The position of the decision boundary is determined by the distance between these support vectors. SVMs can solve nonlinear classification problems using various kernel functions to transform them into linear problems. Additionally, it has robustness against outliers, ensuring high classification accuracy.

5.3. Performance Evaluation

Mean squared error (MSE) is one of the methods used to measure the difference between predicted and actual values by calculating the average of the squared differences. The smaller the value, the better the predictive performance. It is primarily used in regression problems and to evaluate the performance of models along with other error measurement methods.
M S E = 1 n i n ( y i y w ) 2
  • n = the number of predicted and actual values;
  • y i = actual values;
  • y w = predicted values.
Root mean squared error (RMSE) is calculated by taking the square root of the mean of the squared differences between the predicted and actual values. It represents the average difference between the predicted and actual values. Notably, a lower value indicates better performance of the model in making predictions. RMSE is commonly used as a performance metric in regression problems, along with other error measurement methods.
R M S E = 1 n i = 1 n y i y w 2
The mean absolute error (MAE) is the average of the absolute differences between the predicted and actual values. It represents the average difference between the predicted and actual values and is less sensitive to outliers than RMSE because it does not square the differences.
M A E = 1 n i = 1 n y i y w
R-squared ( R 2 ) is a metric that represents the proportion of variability in the predicted values that is explained by the actual values. It ranges between 0 and 1, with a higher value indicating that the model is better at explaining the data. When the predicted values perfectly match the actual values, ( R 2 ) is 1, whereas a model that does not fit the data well will have an ( R 2 ) value closer to 0.
R 2 = 1 i = 1 n y i y w 2 i = 1 n y i y w 2 = 1 S S E S S T = S S R S S T
y w = the average of the Actual values.
Lower RMSE, MAE, and MSE values indicate better model performance.

5.4. Training of Prediction Model

To validate the effectiveness of the SEF with a size of 5123 bytes, comparative experiments were conducted by performing regression learning on the RGB_Origin dataset, which is 6,220,800 bytes in size and consists of uniformly cropped 800(H) × 820(W) images without histogramization, and on the histogramized datasets: 1536, 1384, and 512 bytes of Histo_RGB, Histo_HSV, and SEF datasets obtained through compression, respectively.
The training process for the deep neural network model is conducted using MathWorks’ software, Matlab’s Regression Learner application. The training runs on a computing system equipped with an Intel i7-8700 CPU, 32 GB RAM, and GeForce GTX 1060Ti GPU.
Figure 11 shows the learning outcomes of predictions for EGCs, such as O 2 , S O 2 , C O 2 and N O X , which were trained using a SVM on the original RGB image of the flame and histogramized RGB data.
Figure 11A represents the results of regression learning on the RGB_Origin dataset of the flame image. In the learning results, O 2 exhibits a maximum error of 3.0% at L6, S O 2 exhibits an error of 2.0 ppm at L5, N O X exhibits an error of 16 ppm at L6, and C O 2 exhibits an error of 2.4% at L6.
Figure 11B represents the results of regression learning using the Histo_RGB dataset. In the overall learning outcomes, O 2 exhibits a maximum error of 2.2% at L4, S O 2 exhibits an error of 1.9 ppm at L2, N O X exhibits an error of 11 ppm at L1, and C O 2 exhibits an error of 1.8% at L3. These results indicate that learning from histogramized RGB color tone data outperforms learning from the original RGB data, which has a larger data capacity. This demonstrates the impact of data capacity on learning outcomes. Additionally, Table 5 presents the performance evaluation for EGC learning, revealing that the prediction performance of R 2 , RMSE, and MAE is significantly improved for RGB histogram data compared with RGB color data. However, the values of R 2 (0.86, 0.87, and 0.79) indicated that the prediction accuracy did not reach satisfactory levels.
Additionally, the RMSE and MAE values showed that a significant difference in errors was still observed. To improve the prediction performance, a color space that can effectively distinguish the characteristics of the parameters should be used.
Figure 12 shows the learning outcomes of SVM-trained predictions for EGCs ( O 2 , C O 2 , N O X and S O 2 ) using HSV color histogram data that include saturation, exhibiting a linear variation in the spectrum, and the SEF, which solely extracts the saturation component. Figure 12A shows the regression learning results of the Histo_HSV dataset of the flame image. The maximum error observed in the learning results was 2.6% for O 2 at L1, 1.9 ppm for S O 2 at L2, 10 ppm for N O X at L5, and 2.1% for C O 2 at L1, across the entire dataset. Figure 12B shows the regression learning results for the SEF data. In these results, the maximum error was 1.4% for O 2 at L5, 1.5 ppm for S O 2 at L2, 12 ppm for N O X at L4, and 1.5% for C O 2 at L1. These values were densely distributed, demonstrating excellent performance in terms of R 2 , RMSE, and MAE.
As analyzed in Figure 12, the Histo_HSV dataset, which includes the linear spectral change in saturation, exhibited better learning performance in terms of parametric features than the RGB Histogram data.
Consequently, as shown in Table 6, the SVM-trained prediction results for the EGCs, O 2 , C O 2 , N O X and S O 2 using image data with feature parameters extracted using SEF demonstrated excellent prediction rates, with R 2 values of 0.97, 0.96, 0.96, and 0.95, respectively. Additionally, the errors in the RMSE and MAE were minimal, providing evidence of the reliability of the feature extraction filter, SEF.

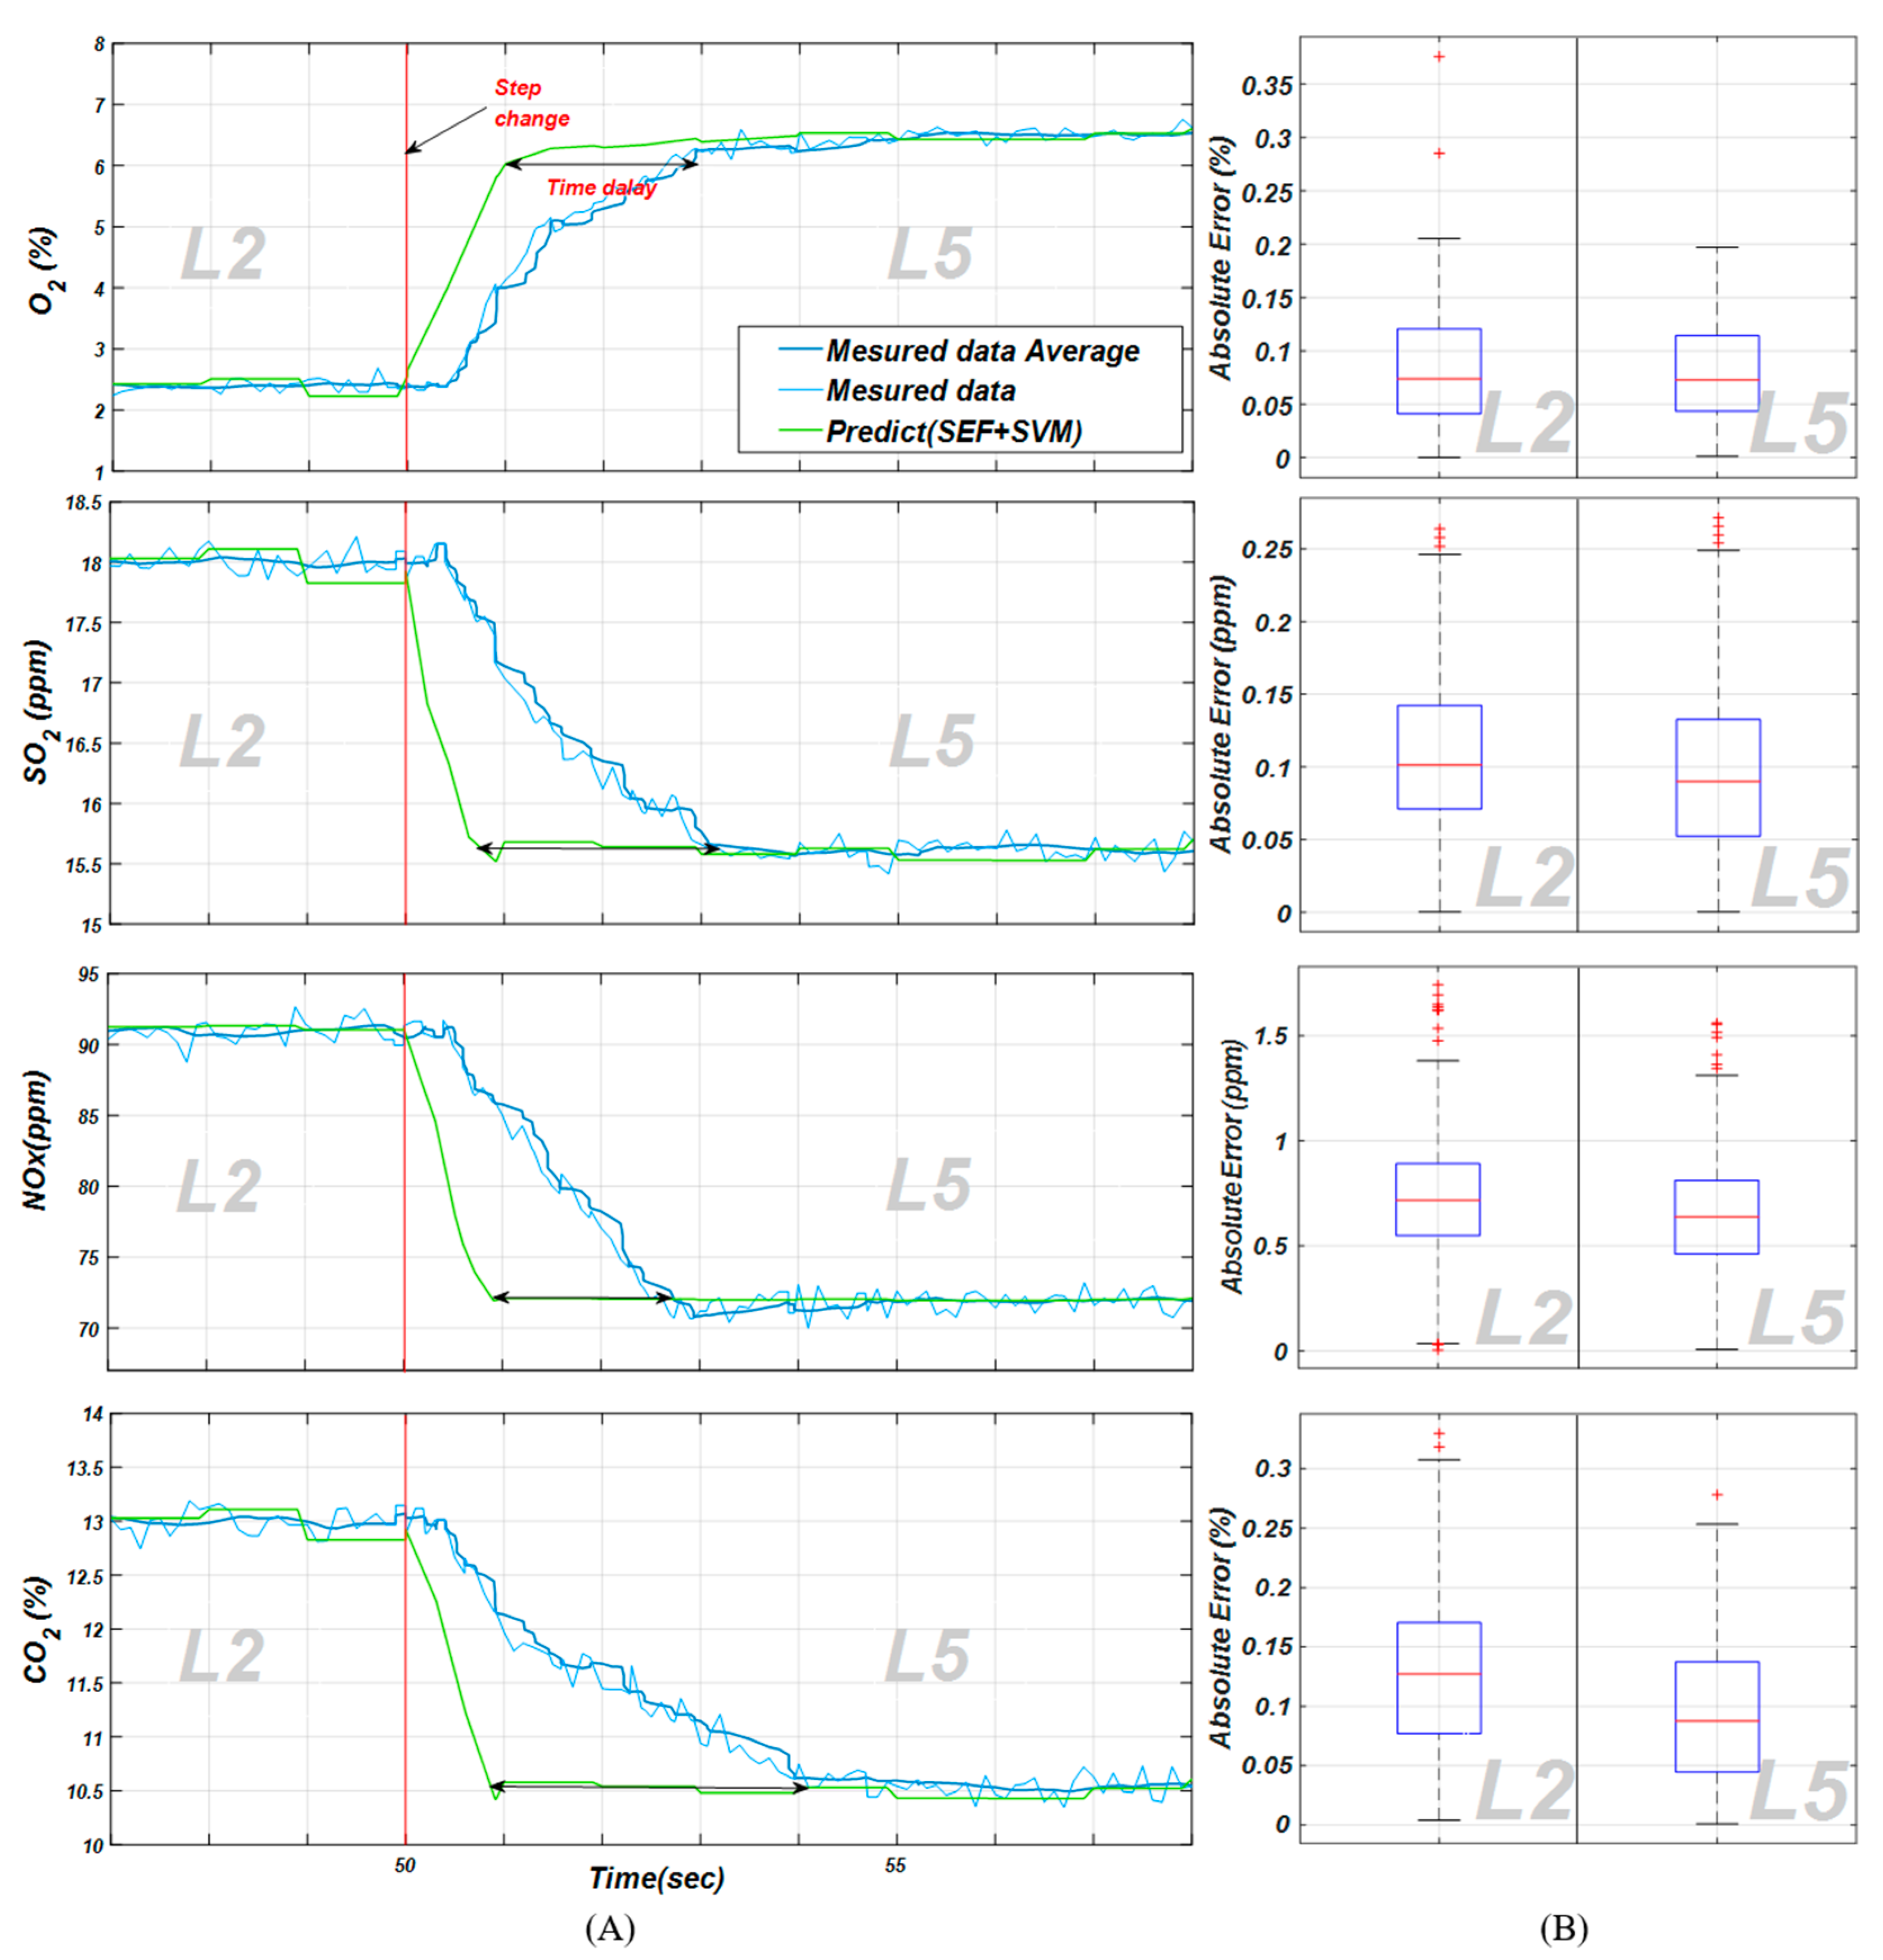
5.5. Generalization Verification

To assess the generalization performance of the proposed SEF in this study, flame images were captured from the same OFB after 1 month using the model trained on the dataset. An experiment was conducted by using these images as input, generating real-time predictions, and comparing them with the exhaust gas meter. The experiment was recorded for approximately 100 s starting with Linkage 2, and the STEP was changed to Linkage 5 after 50 s. The prediction response and error were measured during the steady state. As time passes, the OFB undergoes various environmental changes, including contamination of the heating surface and variations in atmospheric temperature and humidity. To ensure the stability of the prediction, the STEP was changed from 2 to 5 instead of 1 to 6, considering the changes in the upper and lower limits of the learning data due to environmental variations.
Figure 13 represents the EGC values predicted from the flame images and the actual values obtained from the exhaust gas analyzer for a new environment. It shows 47 to 58 s after the experiment, capturing both the steady-state conditions of L2 and L5 and the excessive response caused by a step change between L2 and L5.
Figure 13A shows the analog signal measured from the exhaust gas analyzer and the predictions of the SVM using the SEF applied to real-time input flame images. Figure 13B shows the boxplot of the errors between each EGC and the corresponding predictions from SEF-applied SVM in the steady-state conditions of each linkage compared with the measurements from the exhaust gas analyzer.
In the OFB, the combustion state initially starts in the L2 condition and transitions to the steady state of L5 after 50 s. The errors between the SEF-applied SVM predicted values and the measured average values in the steady-state interval are as follows: for L2, the maximum errors are 0.1207, 0.1703, 0.8909, and 0.1423; for L5, the errors are 0.1143, 0.1374, 0.8112, and 0.2377. These values fall within the range of the MAE of the SEF-applied SVM training performance in Section 5.4, which are 0.1213, 0.2135, 1.1724, and 0.2377. This validates the generalization performance of the SEF-applied SVM model.
Figure 13A shows that the predicted values from flame images exhibit a faster response than the actual values, starting from the step change after 50 s until reaching the steady-state interval of L5. The flame images, representing the quasi-instantaneous combustion state, respond immediately to changes in the CER. However, the measured EGC experiences a delay due to the transit time through the exhaust pipe and the time required for post-combustion chemical reactions in the exhaust gas. Therefore, the prediction of EGC using flame images is more suitable for real-time optimization control in OFB than measurements from the exhaust gas analyzer.

6. Conclusions

In this study, a new feature extraction filter is proposed to minimize the loss in characteristic parameter data through the spectral analysis of flame image color spaces for real-time monitoring of EGC in the OFB systems of ships. The effectiveness of the proposed filter was validated through experimental testing and verification using an experimental device installed on an actual ship. To induce various changes in the CER, the fuel quantity was fixed and the air quality adjusted, thereby forming a dataset of 500 data points for flame images and EGC measurements in an OFB. For performance comparison, SVMs were used as base models, and the performance of the SEF for each EGC was evaluated against the comparison groups of RGB_Origin, Histo_RGB, and Histo_HSV datasets. The training results showed excellent prediction performance for O 2 , S O 2 , N O x and C O 2 with R2 values of 0.97, 0.96, 0.94, and 0.95, respectively.
The generalization performance of the proposed method was validated through real-time testing in a new combustion environment. By observing the error between the prediction performance of the SEF, represented by MAE, and the exhaust gas measurement within the normal operating range during the step changes in the combustion environment, it was confirmed that the generalization performance was within the expected range. Furthermore, the response speed to step changes demonstrated that flame image-based predictions were more suitable for real-time control than direct measurement using exhaust gas analyzers.
In the case of the OFB, the CER varies over time because of factors such as changes in the amount of combustion air and variations in temperature and humidity. In the future, based on the validated real-time prediction of image-based EGCs, as demonstrated in this study, a control system will be developed to minimize EGCs and enhance combustion efficiency in OFBs. This control system will incorporate an output device and optimize the control process.

Author Contributions

Conceptualization, C.-M.L. and B.-G.J.; methodology, C.-M.L.; formal analysis, C.-M.L.; writing—original draft preparation, C.-M.L.; writing—review and editing, J.-H.C. All authors have read and agreed to the published version of the manuscript.

Funding

This research was supported by the Korea Institute of Marine Science & Technology Promotion (KIMST), funded by the Ministry of Oceans and Fisheries (20220630).

Institutional Review Board Statement

Not applicable.

Informed Consent Statement

Not applicable.

Data Availability Statement

Not applicable.

Acknowledgments

This research was supported by the Korea Institute of Marine Science & Technology Promotion (KIMST), funded by the Ministry of Oceans and Fisheries (20220630).

Conflicts of Interest

The authors declare no conflict of interest.

Nomenclature

N O x Nitrogen oxides
S O x Sulfur oxides
S O 2 Sulfur dioxides
C O 2 Carbon dioxide
C O Carbon monoxide
O 2 Oxygen
N Nitrogen
S Surfur
C Carbon
N 2 Nitrogen molecule
H 2 O Water
RRed
GGreen
BBlue
YLuminance
CbDifferences between blue and luminance
Cr Differences between red and luminance
HHue
SSaturion
VValue
L1~L6Linkage 1~6
n The number of predicted and actual values
y i Actual values
y w Predicted values
y w The average of the Actual values
Greek symbols
ρ a Mol of air
χ a Mol of Unreacted O 2
δ o The O 2 concentration of the exhaust gas
χ e The ratio of moles of O 2 to the total moles of combustion products
ρ e The theoretical amount of air required
μ Average
σ 2 Variance
Index
SCRSelective catalytic reduction
CFBCoal-fired boiler
GFBGas-fired boiler
OFBOil-fired boiler
CMOSComplementary metal-oxide-semiconductor
CCDCharge-coupled device
SEFSaturation extraction filter
EGCsExhaust gas components
SVMSupport vector machine
RGBRed, green, and blue
HSVHue, saturation, and value
F.O.Fuel oil
F.D.Forced draft
CERCombustion equivalence ratio
PCAPrincipal component analysis
RGB_Origin Original RGB image data
Histo_RGB Histogramized RGB data
Histo_HSV Histogramized HSV
MSEMean squared error
MAEMean absolute error
RMSERoot mean squared error
R 2 R-squared

References

  1. Seol, S.; Jung, S.; Seong, M.; Lim, J.; Yeo, S.; Jin, H. Estimation of Air Pollutant Emissions from Ships and Their Contributions in Korea. J. Korean Soc. Atmos. Environ. 2021, 37, 324–337. [Google Scholar] [CrossRef]
  2. Xing, H.; Spence, S.; Chen, H. A comprehensive review on countermeasures for CO2 emissions from ships. Renew. Sustain. Energy Rev. 2020, 134, 110222. [Google Scholar] [CrossRef]
  3. Ni, P.; Wang, X.; Li, H. A review on regulations, current status, effects and reduction strategies of emissions for marine diesel engines. Fuel 2020, 279, 118477. [Google Scholar] [CrossRef]
  4. Kilicarslan, A.; Qatu, M. Exhaust Gas Analysis of an Eight Cylinder Gasoline Engine Based on Engine Speed. Energy Procedia 2017, 110, 459–464. [Google Scholar] [CrossRef]
  5. Di Natale, F.; Carotenuto, C.; Addio, L.D.; Lancia, A.; Antes, T.; Szudyga, M.; Jaworek, A.; Gregory, D.; Jackson, M.; Volpe, P.; et al. New technologies for marine diesel engine emission control. Chem. Eng. Trans. 2013, 32, 361–366. [Google Scholar] [CrossRef]
  6. Deng, J.; Wang, X.; Wei, Z.; Wang, L.; Wang, C.; Chen, Z. A review of NOx and SOx emission reduction technologies for marine diesel engines and the potential evaluation of liquefied natural gas fuelled vessels. Sci. Total Environ. 2021, 766, 144319. [Google Scholar] [CrossRef]
  7. Bakalov, I. Constructive solutions to reduce the NOx and SOx in the marine boiler burners. Trans Motauto World 2016, 1, 7–9. [Google Scholar]
  8. Čampara, L.; Hasanspahić, N.; Vujičić, S. Overview of MARPOL ANNEX VI regulations for prevention of air pollution from marine diesel engines. SHS Web Conf. 2018, 58, 01004. [Google Scholar] [CrossRef]
  9. McCaffery, C.; Zhu, H.; Karavalakis, G.; Durbin, T.D.; Miller, J.W.; Johnson, K.C. Sources of air pollutants from a Tier 2 ocean-going container vessel: Main engine, auxiliary engine, and auxiliary boiler. Atmos. Environ. 2021, 245, 118023. [Google Scholar] [CrossRef]
  10. Li, H.; Jia, P.; Wang, X.; Yang, Z.; Wang, J.; Kuang, H. Ship carbon dioxide emission estimation in coastal domestic emission control areas using high spatial-temporal resolution data: A China case. Ocean Coast. Manag. 2023, 232, 106419. [Google Scholar] [CrossRef]
  11. Kujanpää, L.; Teir, S. Implications of the New EU Maritime Emission Monitoring Regulation on Ship Transportation of CO2. Energy Procedia 2017, 114, 7415–7421. [Google Scholar] [CrossRef]
  12. Sun, J.; Meng, X.; Qiao, J. Prediction of Oxygen Content Using Weighted PCA and Improved LSTM Network in MSWI Process. IEEE Trans. Instrum. Meas. 2021, 70, 1–12. [Google Scholar] [CrossRef]
  13. Tan, P.; He, B.; Zhang, C.; Rao, D.; Li, S.; Fang, Q.; Chen, G. Dynamic modeling of NOX emission in a 660 MW coal-fired boiler with long short-term memory. Energy 2019, 176, 429–436. [Google Scholar] [CrossRef]
  14. Park, M.-H.; Hur, J.-J.; Lee, W.-J. Prediction of oil-fired boiler emissions with ensemble methods considering variable combustion air conditions. J. Clean. Prod. 2022, 375, 134094. [Google Scholar] [CrossRef]
  15. Bai, X.; Lu, G.; Hossain, M.; Yan, Y.; Liu, S. Multimode Monitoring of Oxy-Gas Combustion Through Flame Imaging, Principal Component Analysis, and Kernel Support Vector Machine. Combust. Sci. Technol. 2017, 189, 776–792. [Google Scholar] [CrossRef]
  16. Yang, G.; He, Y.; Li, X.; Liu, H.; Lan, T. Gabor-GLCM-based texture feature extraction using flame image to predict the O2 content and NOx. ACS Omega 2022, 7, 3889–3899. [Google Scholar] [CrossRef] [PubMed]
  17. Sharma, K.G.S.; Bhusnur, S. Data Ensemble Model for Prediction of Oxygen Content in Gas fired Boiler for Efficient Combustion. In Proceedings of the 2023 IEEE International Students’ Conference on Electrical, Electronics and Computer Science (SCEECS), Bhopal, India, 18–19 February 2023; pp. 1–8. [Google Scholar] [CrossRef]
  18. Han, Z.; Li, J.; Zhang, B.; Hossain, M.; Xu, C. Prediction of combustion state through a semi-supervised learning model and flame imaging. Fuel 2021, 289, 119745. [Google Scholar] [CrossRef]
  19. Khan, M.Y.; Ranganathan, S.; Agrawal, H.; Welch, W.A.; Laroo, C.; Miller, J.W.; Cocker, D.R., III. Measuring in-use ship emissions with international and U.S. federal methods. J. Air Waste Manag. Assoc. 2013, 63, 284–291. [Google Scholar] [CrossRef]
  20. Najarnikoo, M.; Targhi, M.Z.; Pasdarshahri, H. Experimental study on the flame stability and color characterization of cylindrical premixed perforated burner of condensing boiler by image processing method. Energy 2019, 189, 116130. [Google Scholar] [CrossRef]
  21. Han, Z.; Li, J.; Hossain, M.; Qi, Q.; Zhang, B.; Xu, C. An ensemble deep learning model for exhaust emissions prediction of heavy oil-fired boiler combustion. Fuel 2022, 308, 121975. [Google Scholar] [CrossRef]
  22. Stephen, T. An Introduction to Combustion: Concepts and Applications; McGraw Hill: New York NY, USA, 2000; p. 230. [Google Scholar]
  23. Gera, D.; Mathur, M.P.; Freeman, M.C.; Robinson, A. Effect of Large Aspect Ratio of Biomass Particles on Carbon Burnout in a Utility Boiler. Energy Fuels 2002, 16, 1523–1532. [Google Scholar] [CrossRef]
  24. Zhou, H.; Ren, T.; Yang, Y. Impact of OFA on combustion and NOx emissions of a large-scale laboratory furnace fired by a heavy-oil swirl burner. Appl. Therm. Eng. 2015, 90, 994–1006. [Google Scholar] [CrossRef]
  25. Tóth, P.; Garami, A.; Csordás, B. Image-based deep neural network prediction of the heat output of a step-grate biomass boiler. Appl. Energy 2017, 200, 155–169. [Google Scholar] [CrossRef]
  26. International Maritime Organization (IMO). SOLAS (Safety of Life at Sea)–Chapter II-2-Construction-Fire Protection, Fire Detection and Fire Extinguishing; Section A.60; International Maritime Organization: London, UK, 2023. [Google Scholar]
  27. Srigul, W.; Inrawong, P.; Kupimai, M. Plastic classification base on correlation of RGB color. In Proceedings of the 2016 13th International Conference on Electrical Engineering/Electronics, Computer, Telecommunications and Information Technology (ECTI-CON), Chiang Mai, Thailand, 28 June–1 July 2016; pp. 1–5. [Google Scholar]
  28. binti Zaidi, N.I.; binti Lokman, N.A.A.; bin Daud, M.R.; Achmad, H.; Chia, K.A. Fire recognition using RGB and YCbCr color space. ARPN J. Eng. Appl. Sci. 2015, 10, 9786–9790. [Google Scholar]
  29. Muhammad, B.; Abu-Bakar, S.A.R. A hybrid skin color detection using HSV and YCgCr color space for face detection. In Proceedings of the 2015 IEEE International Conference on Signal and Image Processing Applications (ICSIPA), Kuala Lumpur, Malaysia, 19–21 October 2015; pp. 95–98. [Google Scholar]
  30. Kolkur, S.; Kalbande, D.; Shimpi, P.; Bapat, C.; Jatakia, J. Human Skin Detection Using RGB, HSV and YCbCr Color Models. arXiv 2017, arXiv:1708.02694. [Google Scholar]
  31. Xie, J.; Fang, J.; Liu, C.; Li, X. Deep Learning-Based Spectrum Sensing in Cognitive Radio: A CNN-LSTM Approach. IEEE Commun. Lett. 2020, 24, 2196–2200. [Google Scholar] [CrossRef]
  32. Nahiduzzaman, M.; Goni, M.O.F.; Anower, M.S.; Islam, M.R.; Ahsan, M.; Haider, J.; Gurusamy, S.; Hassan, R.; Islam, M.R. A novel method for multivariant pneumonia classification based on hybrid CNN-PCA based feature extraction using extreme learning machine with CXR images. IEEE Access 2021, 9, 147512–147526. [Google Scholar] [CrossRef]
  33. Sahoo, J.P.; Ari, S.; Patra, S.K. Hand Gesture Recognition Using PCA Based Deep CNN Reduced Features and SVM Classifier. In Proceedings of the 2019 IEEE International Symposium on Smart Electronic Systems (iSES) (Formerly iNiS), Rourkela, India, 16–18 December 2019; pp. 221–224. [Google Scholar] [CrossRef]
  34. Glorot, X.; Bengio, Y. Understanding the difficulty of training deep feedforward neural networks. In Proceedings of the Thirteenth International Conference on Artificial Intelligence and Statistics, JMLR Workshop and Conference Proceedings, Sardinia, Italy, 13–15 May 2010; pp. 249–256. [Google Scholar]
  35. Hastie, T.; Tibshirani, R.; Friedman, J.H.; Friedman, J.H. The Elements of Statistical Learning: Data Mining, Inference, and Prediction; Springer: New York, NY, USA, 2009. [Google Scholar]
  36. Zhou, H.; Tang, Q.; Yang, L.; Yan, Y.; Lu, G.; Cen, K. Support vector machine based online coal identification through advanced flame monitoring. Fuel 2014, 117, 944–951. [Google Scholar] [CrossRef]
  37. Hsu, C.W.; Chang, C.C.; Lin, C.J. A practical guide to support vector classification. 2003, pp. 1396–1400. Available online: http://www.datascienceassn.org/sites/default/files/Practical%20Guide%20to%20Support%20Vector%20Classification.pdf (accessed on 1 October 2023).
  38. Zeng, W.; Jia, J.; Zheng, Z.; Xie, C.; Guo, L. A comparison study: Support vector machines for binary classification in machine learning. In Proceedings of the 2011 4th International Conference on Biomedical Engineering and Informatics (BMEI), Shanghai, China, 15–17 October 2011; pp. 1621–1625. [Google Scholar] [CrossRef]
Figure 1. Schematic of image-based regression model training. (A) Exhaust gas measurement probe (B) CMOS webcam (C) Exhaust gas analyzer and data acquisition device.
Jmse 11 01993 g001
Figure 2. Combustion process of oil-fired boilers.
Jmse 11 01993 g002
Figure 3. Real-time data acquisition process in MATLAB Simulink.
Jmse 11 01993 g003
Figure 4. OFB emission data according to different linkage positions.
Jmse 11 01993 g004
Figure 5. Flame image pre-processing.
Jmse 11 01993 g005
Figure 6. Representative color spaces. (A) RGB, (B) YCbCr, and (C) HSV.
Jmse 11 01993 g006
Figure 7. Histograms by color spaces for various combustion conditions.
Jmse 11 01993 g007
Figure 8. Spectral variation of saturation for various combustion condition.
Jmse 11 01993 g008
Figure 9. Distribution plot of saturation histogram for the entire flame image dataset.
Jmse 11 01993 g009
Figure 10. Schematic of data formation for the proposed SEF.
Jmse 11 01993 g010
Figure 11. Predicted results based on SVM. (A) RGB_origin (B) Histo_RGB.
Jmse 11 01993 g011
Figure 12. Predicted results based on SVM. (A) Histo _HSV (B) SEF.
Jmse 11 01993 g012
Figure 13. Real and predicted values of EGC with further environment.
Jmse 11 01993 g013
Table 1. Specifications for Boiler, Burner, FD Fan of OFB.
BoilerModelSteam productionWorking Steam pressure
MA03R0202 (Kangrim)3000 kg/h5.5–7 kg/cm2
BurnerModelAtomizing oil pressureFuel oil consumption—min/max
RP-250M25–30 bar68.5/205.5 kg/h
FD FanModelAir supply pressureAir supply Volume—min/max
Svend hoyer HMA20.0275–0.039 bar1650–3700 m3/h
Table 2. Data on Exhaust gas components by CER.
LinkageCERO2 (%)CO2 (%)NOX (ppm)SO2 (ppm)
μσ2μσ2μσ2μσ2
L10.8992.000.000813.80.007694.000.421517.580.0041
L20.8972.390.000613.110.007890.990.488517.990.0043
L30.8243.500.000812.690.007788.830.424616.60.0033
L40.7395.210.000511.510.010780.010.514216.040.0035
L50.6866.300.000610.510.007972.150.551315.590.0039
L60.6427.20.00069.810.008467.070.493414.420.0039
Table 3. Saturation peak data of flame image by CER.
Linkage
Position
CERSaturation
Peak Min
Saturation
Peak Max
μ
L10.899820794649023.86
L20.89710,54111,75511,155.64
L30.82412,51913,97213,185.80
L40.73914,76115,56215,204.44
L50.68616,17217,97716,918.22
L60.64219,24921,88220,339.84
Table 4. Structure of the train dataset.
Color Space ConversionRGB_OriginHisto_RGBHisto_HSVSEF
Size of color space800(H) × 820(W) × 3256(R) + 256(G) + 256(B)256(S)256(S)
Flame Image data matrix300 × 656,000300 × 768300 × 692300 × 256
EGC data matrix300 × 4
Conbined train dataset matrix300 × 656,004300 × 772300 × 696300 × 260
Table 5. Prediction performance for RGB_origin and Histo_RGB based on SVM.
EGCImage DatasetsR2RMSEMAE
O 2 RGB_origin0.481.39791.2325
Histo_RGB0.860.71650.5560
C O 2 RGB_origin0.441.07540.9251
Histo_RGB0.790.61430.54804
N O x RGB_origin0.467.34736.3918
Histo_RGB0.883.51552.7705
S O 2 RGB_origin0.570.78790.7276
Histo_RGB0.870.43610.3089
Table 6. Prediction performance for Histo_HSV and SEF based on SVM.
EGCImage DatasetsR2RMSEMAE
O 2 Histo_HSV0.910.34410.2458
SEF0.970.16980.1213
C O 2 Histo_HSV0.850.37650.2562
SEF0.950.32650.2377
N O x Histo_HSV0.903.12282.3381
SEF0.941.72691.1724
S O 2 Histo_HSV0.890.40330.2872
SEF0.960.31600.2135
Disclaimer/Publisher’s Note: The statements, opinions and data contained in all publications are solely those of the individual author(s) and contributor(s) and not of MDPI and/or the editor(s). MDPI and/or the editor(s) disclaim responsibility for any injury to people or property resulting from any ideas, methods, instructions or products referred to in the content.

