Article

A Spatio-Temporal Analysis of Shoreline Changes in the Ilaje Coastal Area of Ondo State, Nigeria

by
Olujumoke Adesola Ogunrayi
1,*,
Precious Agbeko Dzorgbe Mattah
1,
Regina Folorunsho
2,
Emmanuel Jolaiya
3 and
Omoniyi John Ikuomola
3
1
Centre for Coastal Management, Africa Centre of Excellence in Coastal Resilience (ACECoR), University of Cape Coast, Cape Coast PMB TF0494, Ghana
2
Department of Fisheries and Aquatic Sciences, School of Biological Sciences, College of Agriculture and Natural Sciences, University of Cape of Coast, Cape Coast PMB TF0494, Ghana
3
Department of Remote Sensing and Geoscience Information Systems, Federal University of Technology, Akure 340252, Nigeria
*
Author to whom correspondence should be addressed.
J. Mar. Sci. Eng. 2024, 12(1), 18; https://doi.org/10.3390/jmse12010018
Submission received: 9 September 2023 / Revised: 23 October 2023 / Accepted: 24 October 2023 / Published: 20 December 2023

Abstract

:
Erosion presents a significant challenge to coastlines worldwide, and the Ilaje area in Nigeria’s Niger Delta is no different. Aggressive flooding along this shoreline has led to property damage, economic disruption, and a looming threat to the survival of riverine communities in the region. This study presents a comprehensive analysis of spatial and temporal changes in the Ilaje coastal area of Ondo state from 1986 to 2020. The analysis utilized the SCE, EPR, and LRR methods to examine shoreline changes. Additionally, spatial digitization was performed for Ayetoro, a highly susceptible coastal community, spanning from 2008 to 2023. The results indicate that approximately 86% of the coastline experienced erosion, while the remaining 14% underwent accretion. Notably, the western and central sections of the coastline emerged as the areas most vulnerable to erosion. Ayetoro, situated centrally, faces dire circumstances. The interplay of natural geomorphic processes and human activities played a role in driving these changes. Beyond the immediate physical alterations, erosion has reverberated through the local ecosystems, livelihoods, and infrastructure, posing risks to numerous communities. This study emphasizes the need for urgent actions through integrated coastal zone management (ICZM) strategies to promote coastal stability in the region. The results of the study further provide valuable insights into the need for coastal managers and planners to regularly assess the state of the coastline and proactively proffer suitable solutions to reduce rampant coastal degradation.

1. Introduction

Coastlines worldwide are experiencing significant shoreline changes as a result of rising sea levels, resulting in the depletion of beaches, land inundation, and coastal flooding. These changes pose severe threats to human settlements, infrastructure and ecosystems [1,2,3]. McDonnell [4] specifically predicts that the combined impact of rising sea levels and more intense storms could displace over 200 million people by 2050. Consequently, coastal ecosystems and settlements, especially those reliant on fishing and located in low-lying regions, face significant risks and potential impacts. Areas with low topography and limited sediment availability are particularly vulnerable to coastal erosion and shoreline retreat, further emphasizing the need for attention and action [5].
The shoreline, a crucial part of the coasts, represents an important linear feature on the Earth’s surface that continuously changes its shape and position [6,7]. Short-term and long-term shoreline changes are controlled by various factors, both natural and anthropogenic. Natural factors, including storm surges, the strength of winds, tidal currents, and the height of waves, which are amplified by sea level rise and annual changes in precipitation, together with geology and geomorphology, play an important role in shaping the shoreline [5,8,9,10,11,12]. In addition, anthropogenic modifications to coastal systems such as urbanization, construction of harbor defenses, removal of sand and vegetation, and the construction of dams also contribute to coastal changes [13]. These changes often lead to erosion and flooding of coastal areas or accumulation of sediment [14]. These human influences have a significant impact on coastal geomorphology and processes, whether direct or indirect [15].
Coastal erosion, a major marine geologic disaster, presents varying degrees of hazards, indicating possible future erosion events based on its causes and damage characteristics [16,17,18]. The growing number of coastal risks as well as nearby development and human density highlight the urgent need for adaptation. However, the implementation of adaptation measures is fraught with difficulties due to technical, economic, financial, and social factors [19]. Hence, understanding shoreline dynamics, which includes natural processes such as coastal erosion and periodic flooding [20], is crucial for shaping coastal landscapes and preserving ecosystem functions, as emphasized in Cooper et al. [21]. Consequently, conducting a comprehensive assessment of shoreline change rates is essential for achieving sustainable coastlines and reducing erosion.
The availability of remote sensing data from Earth Observation Satellites offers a cost-effective means to access long-term coastal change observations spanning the past three decades at numerous global sites. Notably, the introduction of Google Earth Engine [22] has simplified access to the expanding repository of publicly accessible satellite imagery, thereby enabling global-scale analyses dating back decades [17,23,24,25]. To analyze coastal change, it is imperative to have a shoreline indicator that comprehensively considers the dynamic nature of this boundary in both the spatial and temporal dimensions, accounting for its variability over time [26]. Notably, optical imaging satellites have recently been employed to pinpoint shoreline locations [27,28,29,30]. Coastal managers, planners, engineers, and scientists highly regard this as a pivotal indicator for understanding the variation in and evolution of coastlines over time [31].
Specifically, this study investigates the change that occurred along the shoreline of Ilaje in Ondo State between 1986 and 2020. Ilaje is one of the oil-producing regions in Nigeria. Studies have linked intensive oil exploration to escalating coastal recession [32,33,34,35,36]. The exacerbation of wave and tidal flood impacts on the coastal plain, potentially amplified by rising sea levels due to global warming, has further contributed to the situation [37]. Many scientific studies have examined the shoreline changes and associated risks of accelerated erosion in the Ilaje. Adediji and Ezenwa [38] compared satellite images from 1986 and 2013 with a topographic map from 1969, while Dada et al. [39] examined coastline changes using satellite images from 1987 to 2017 in the Ilaje region. Additionally, Badru et al. [40] and Komolafe et al. [41] investigated coastal changes using statistical techniques such as end point rate (EPR) and Net Shoreline Movement (NSM) over different time periods. Daramola et al. [42] conducted a study on changes in coastal positions employing the linear regression rate (LRR), endpoint rate (EPR), and root mean square error (RMSE) methods. On the other hand, Popoola [43] employed the linear regression rate (LRR), endpoint rate (EPR), and ALOS PALSAR (AW3D30) elevation models to investigate shoreline changes.
This study employs a methodology not utilized in prior research to assess the Ilaje shoreline changes. Shoreline images of Ilaje from 1986, 1999, 2010, and 2020 were digitized using Google Earth Engine (GEE). Coastal change rates were determined through the widely recognized shoreline change envelope (SCE), end point rate (EPR), and linear regression rate (LRR) methods. Additionally, spatial analysis was conducted using Google Earth to enhance comparative insights, providing a deeper understanding of shoreline dynamics in the Ilaje region. This approach contributes fresh perspectives to the study of coastline evolution in Ilaje. This paper is structured as follows: Section 2 presents the materials and methods including details about the study region; Section 3 and Section 4 present results and the discussions, respectively; and Section 5 provides the conclusion.

2. Materials and Methods

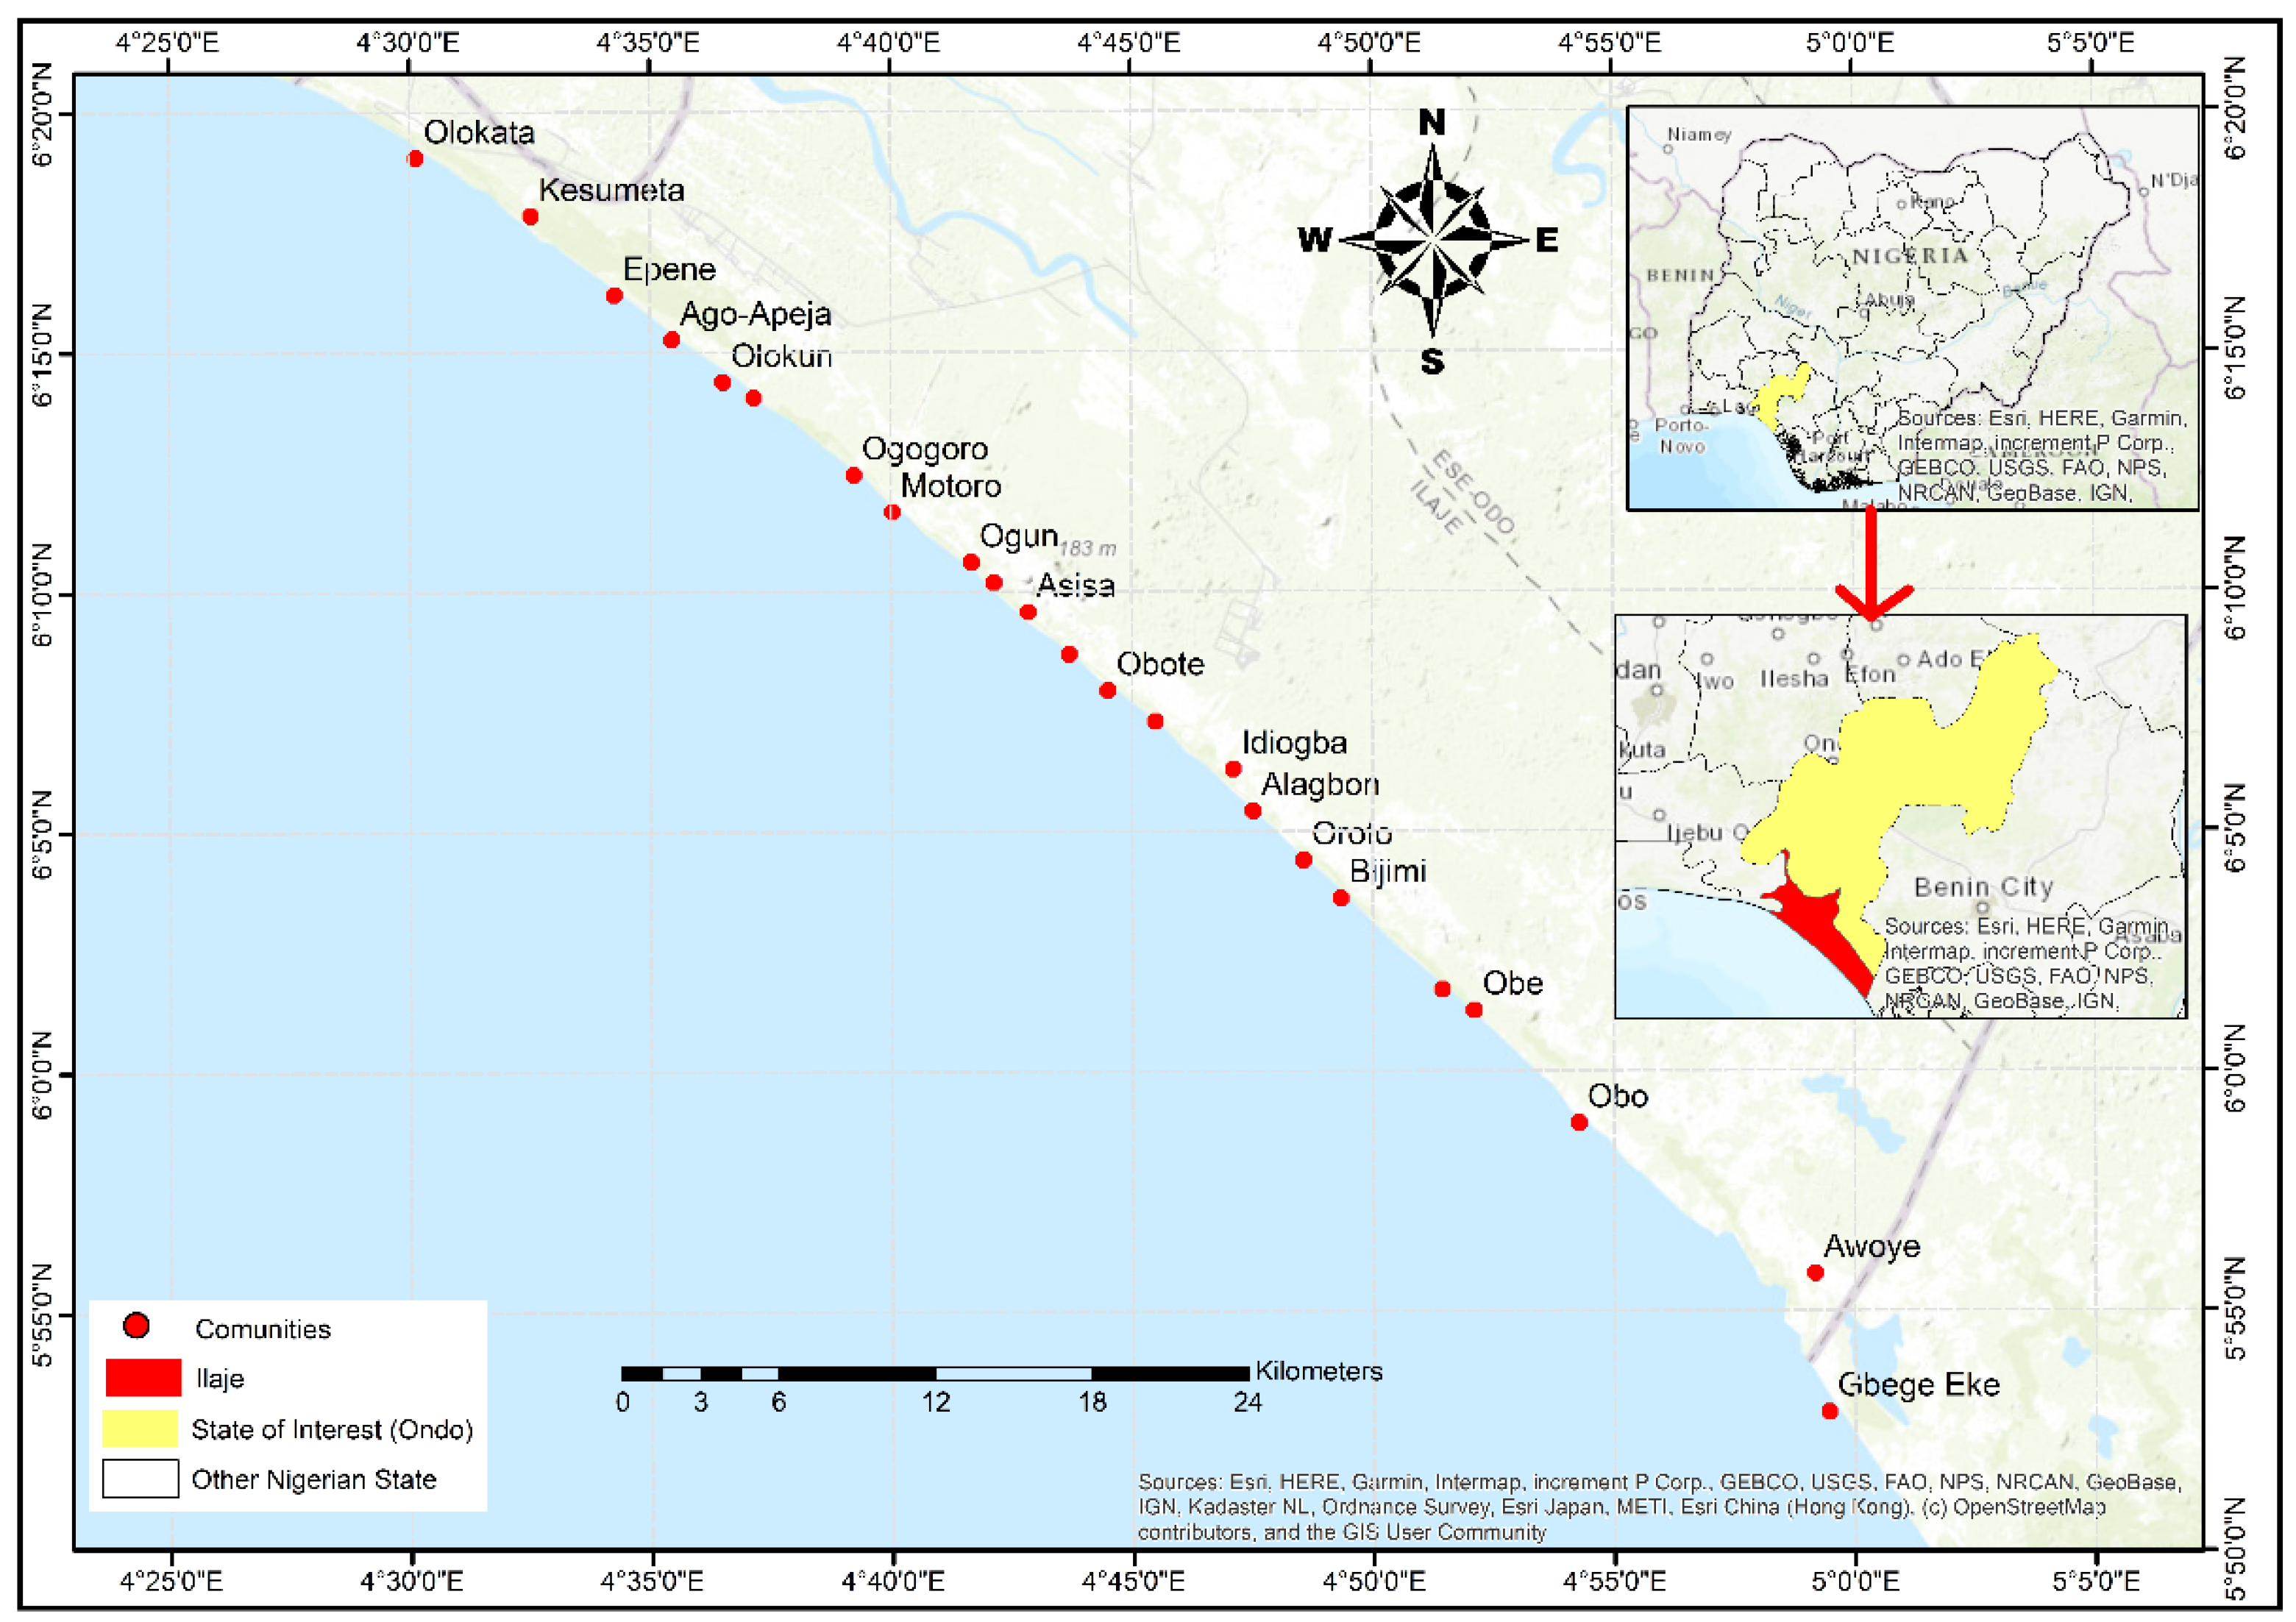
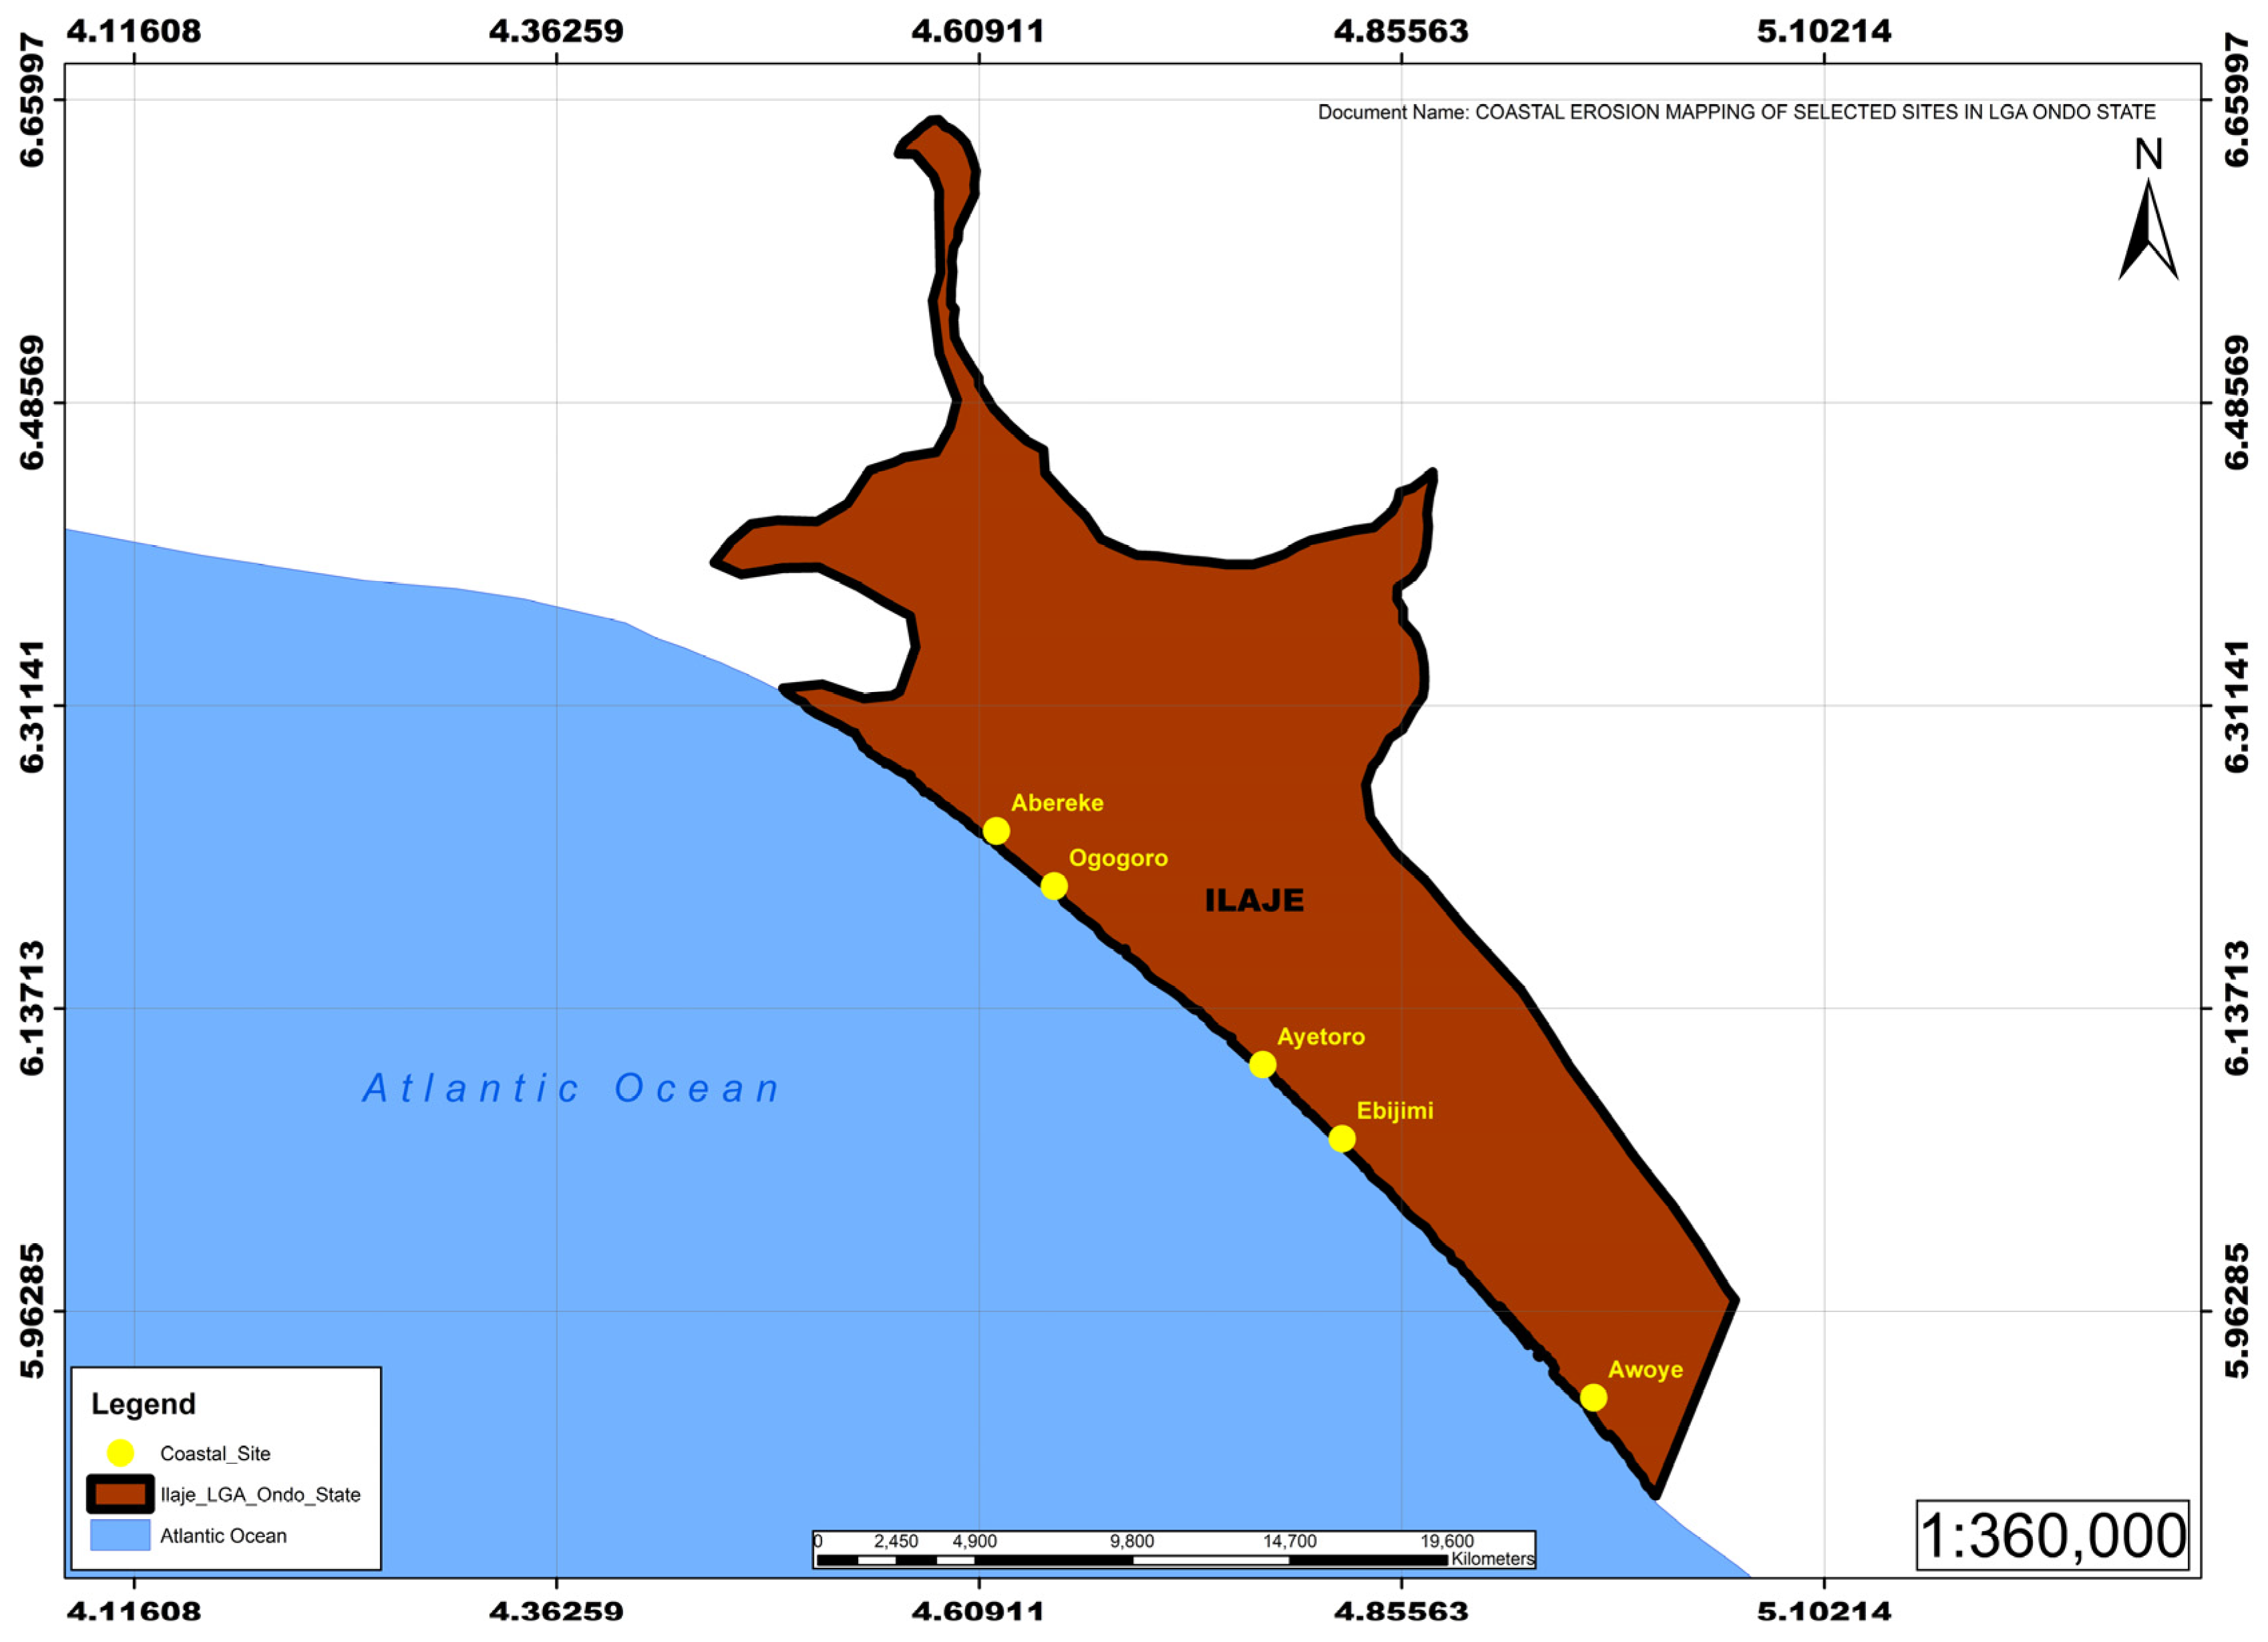
2.1. Description of the Study Area

Ilaje Coastline (Mahin Transgressive Mud Coast)

The coastline of Ilaje in Ondo State, Nigeria (Figure 1) is recognized as the Mahin transgressive mud coast from a geomorphological perspective. The coastline is contiguous to the Atlantic Ocean and is situated within the larger geographical region known as the Niger Delta [44]. It spans approximately 84 km along the Nigerian coast, with its coordinates lying between latitudes 5°45′ and 6°30′ north of the equator, and longitudes 4°30′ and 5°07′ east of Greenwich. The area had a population of 289,838 according to the 2006 national population census. Based on the national population growth rate of 2.87%, the projected population of Ilaje for 2022 using the exponential projection model is estimated to be 458,758 [45]. The main occupation of the local community is fishing. However, it is worth noting that the Mahin mud coast exhibits an erosional shoreline, unlike the predominantly depositional nature of the rest of Nigeria’s coastline [46]. The topography is generally flat and low-lying, making it highly susceptible to coastal erosion and flooding, particularly during high tides. The environment is composed of easily erodible sediments that are vulnerable to washing away even with minimal wave or tidal action. The influence of the Mahin canyon further contributes to the erosive processes [33]. The Mahin canyon punctures the general bathymetric contour of the Mahin mud coast shelf, and to the west lies the Avon canyon. Both canyons act as chutes through which eroded sediments along the coastline are trapped and channeled towards the deep sea, leading to the deposition of mud.
The coastline experiences semi-diurnal tides with two inequalities, as documented by Awosika et al. [47]. The semi-diurnal nature of the tides generates tidal currents that align with the tidal cycles. During the two daily high tides, water levels near the shore are elevated, facilitating the movement of waves further inland. This phenomenon contributes to flooding and the deterioration of the coastline. The vegetation along the coastline is predominantly composed of coastal brackish mangroves, interspersed with grass and freshwater swamps. However, extensive erosion has resulted in a significant loss of vegetation. Many of the mangroves have been decimated and replaced by the hardy and more tolerant grass species Paspalum vaginatum [48]. The area is crisscrossed by transportation canals, some of which are now open to the ocean, allowing the ingress of saline waters. This influx of saltwater leads to increased salinity in both the ground fresh water and soil, causing detrimental effects on vegetation that cannot withstand high salinity levels. Consequently, the elevated salinity contributes to the death of vulnerable vegetation species in the area.
The region experiences a tropical climate characterized by an average annual rainfall of 2721 mm and an average temperature of 27.8 °C [49]. The poor drainage system allows stormwater to accumulate in the hollows, leading to significant flooding of the area. During periods of normal flooding, a significant portion of the area is submerged, but with the projected sea level rise associated with climate change, there is a risk of permanent inundation due to marine encroachment. In the rainy/wet season, wider sections of the mud coast are subject to wave overtopping and flooding, with water levels rising up to 45 cm [32]. The persistent flooding that characterizes the mud coast has further exacerbated the erosion problem in the area. The monthly distribution of wave heights in both the nearshore and offshore zones indicates that the sea state ranges from moderate to rough, with swell-derived waves having a maximum period of 12–25 s. The direction of longshore drift, although predominantly northwest, has minimal influence on the transport of eroded sediments [32].
The ecological and socio-economic consequences of accelerated erosion in Ilaje have prompted the Ondo State government to take local action and collaborate with the federal government and international development organizations, such as the World Bank, in search of practical solutions. The Ondo State Oil Producing Area Development Commission (OSOPADEC) and the Niger Delta Development Commission (NDDC) have made attempts to address the challenges through interventions. OSOPADEC, an agency established to address the interests of the oil-producing areas of Ondo State, has implemented several measures to mitigate sea surges and other environmental challenges. The NDDC also deployed jute tubes with sandfill in December 2004 to combat riverbank flooding/erosion (Figure 2). However, these initiatives have faced shortcomings in project planning, corporate negligence, and institutional failure, as highlighted by Dada et al. [39], resulting in incomplete projects and limited consideration of long-term coastal hydrodynamics and environmental factors.
In 2018, the Ondo state government expressed its commitment to supporting the ongoing West Africa Coastal Areas Management (WACA) project, recognizing its potential to address the diverse environmental challenges faced by coastal areas. As part of this initiative, a WACA technical meeting was held in Akure on 26 April 2018, providing an opportunity for stakeholders to visit affected communities in Ilaje known as ‘hotspots’ for physical ecological impact assessment. The purpose of the visit was to gather information that would form the basis for external interventions and partnerships between OSOPADEC, the Federal Government, and donor agencies. During these visits, sites in the Aiyetoro (the mainstay of the area), Awoye, and Abereke coastal communities were observed, highlighting the detrimental effects of coastal erosion. It has become evident that the current ecological challenges surpass the capabilities of the Commission and the Ondo State government alone. Many of the previous initiatives have not effectively resolved the problems and have even exacerbated instability in the coastal environment [37]. Additionally, the approval of a deep-sea port by the Federal Government of Nigeria in May 2023 raises concerns about potential environmental challenges alongside the economic opportunities it presents. The tremendous destruction of these vital ecosystems has largely been caused by the absence of governmental regulations protecting them. Interviews with relevant agencies revealed the absence of specific policies and regulations for effective coastal management in Ilaje.
Bearing in mind the very low carrying capacity of the Ilaje coastline, structures and installations in the area are highly likely to be vulnerable to being washed away by the dynamic coastal processes. The flat nature of this environment, extreme sea wave conditions, combined with the impacts of climate change and the projected rise in sea levels, pose a significant threat to the existence of the current Ilaje region. The potential consequences of these factors could result in the complete disappearance of the area as we know it today. Therefore, the unique characteristics of Ilaje coastline make it an important area to study in terms of its geological and environmental dynamics.

2.2. Data and Software Used

This study used satellite imagery and GIS tools to extract the shorelines and the corresponding changes that have taken place in the past 34 years. Four intermittent years (1986, 1999, 2010, and 2020) between 1986 and 2020 were selected for this study. The imageries were acquired from the United States Geological Survey (USGS). The range of time and years chosen was due to data availability. The detailed characteristics of the Landsat images used in this study are presented in Table 1. All operations to determine the shoreline changes were performed in ArcGIS Desktop v10.8.1. The Digital Shoreline Analysis System (DSAS) software extension [50], which runs in the ArcGIS environment, ArcMap version 5.1, was used to analyze the changes in the vector-form shorelines.

2.3. Determining Changes in the Shoreline

The Landsat images were retrieved, pre-processed, and visualized in the cloud-based Google Earth Engine (GEE) platform. The instantaneous shorelines were digitized via visual analysis of the RGB true color composition for each year under study. RGB accentuates the contrast between the land and the ocean and makes the shoreline visually well defined. The shorelines were digitized from images for the years 1986, 1999, 2010, and 2020. The vectorized shorelines were downloaded from the GEE platform and further imported into the ArcGIS Desktop Environment to carry out the shoreline change analysis using the installed Digital Shoreline Analysis System (DSAS) plugin. The Digital Shoreline Analysis System (DSAS) is a freely available software application that works within the Environmental Systems Research Institute (ESRI) Geographic Information System (ArcGIS) software. The digitized shorelines for the years 1986, 1999, 2010, and 2020 in the vector format (.shp) from Google Earth Engine (GEE) were used as the input to the Digital Shoreline Analysis System (DSAS) to calculate the rate of shoreline change. The analysis also requires transect information and, hence, transects (in the form of Shapefile) were laid at every 500 m interval along the shoreline. The rate of shoreline change was calculated at each transect using three different statistical techniques, shore change envelope (SCE), end point rate (EPR) for short-term analysis (e.g., 1986–1999, 1999–2010, 2010–2020), and linear regression rate (LRR) of change for long-term analysis (e.g., 1986–2020) using the DSAS tool. The SCE method provides a distance measurement rather than a rate.
The SCE represents the distance between the shorelines farthest from and closest to the baseline at each transect. This method quantifies the most significant change that has occurred on each transect, incorporating all available shoreline positions independently of their dates [51].
In the EPR method, the total coastal change distance is divided by the time difference, as shown in Equation (1). For its calculations, this approach uses shorelines from two different dates. The EPR approach is applied to numerous combinations when dealing with more than two shorelines, providing thorough calculations.
This method is widely utilized in shoreline change studies due to its simplicity and ease of application [51,52,53].
EPR = ( d 1 d 0 ) ( t 1 t 0 ) m / y
On the other hand, the LRR utilizes all available shoreline data to determine the least-squares regression line for each transect, which represents the slope of the regression line [51]. This statistical method is particularly useful when studying shoreline change over a long period with consistent erosion or accretion trends [53]. It is commonly employed to calculate shoreline change rates [54], minimizing potential random errors and short-term variability through a statistical approach [55]. The procedure used to calculate the linear line is described in Equation (2) and by Thieler et al. [50]. Positive EPR and LRR values represent shoreline movement toward the sea (rate of accretion), whereas negative values represent erosion [56].
y = m x + b
where y is the dependent variable, m is the slope of the line, x is the independent variable, and b is a constant [50].

2.4. Coastal Erosion Assessment

Spatial analysis techniques were employed to assess coastal erosion in the study area. The data sources encompassed modern spatial assessment technologies like remote sensing and GPS. Both primary and secondary data were collected, with ArcGIS Pro 10.2.2, Microsoft Office Professional Plus 2019, Excel version 2309, and base maps used for analysis. The primary data involved ground truthing coastal erosion sites, while coordinates were collected from the field and processed using location maps and Google Earth Pro 7.3.6.9345. The administrative map of Ondo state was scanned and imported into the GIS environment using ArcGIS 10.2.2 software for geo-referencing. It was thereafter overlaid on Google Earth to obtain the absolute location of the buildings on the Earth’s surface in the mandated areas. For the technical analysis, the map data were analyzed descriptively and statistically. The statistical analysis involved the use of spatial analysis within the GIS software to compare the acquired information. GIS software was used for spatial analysis, while the map digitization process utilized ESRI ArcGIS software. Geometric spatial analysis was skillfully performed to determine the length and area measurements of important geographic features, including canal, river, and stream lengths within the vulnerable coastal communities (Figure 3). An illustrated map series tailored exclusively to Ayetoro was carefully drawn up. This series focuses on documenting the historical shoreline variations from 2008 to 2020.
This map series was created based on integrating compiled historical satellite imagery and contemporary landscape data. This singular focus on Ayetoro was driven by its pivotal significance as a coastal community facing alarming rates of disappearance. In particular, Ayetoro serves as a vital maritime stronghold and gateway to other coastal communities stretching towards the vast high seas intimately connected to the Atlantic Ocean [57]. Notably, the computations had to start from 2008 because that was the earliest possible reference point due to the lack of a base map. A pyramid was built for each mosaic plate and, subsequently, statistical analyses were performed using the ArcCatalog window. A geodatabase was generated for each map layer to streamline workflow and enhance organization. This strategy facilitated a smoother workflow and enabled systematic categorization of various geographic features within distinct feature datasets.

3. Results

In this study, the shoreline change calculation uses the SCE, LRR, and EPR models of the DSAS to describe the respective long-term and short-term changes that have occurred. The results of the analysis are reported for each of these measurements and rates, with an overall average calculated across all transects.

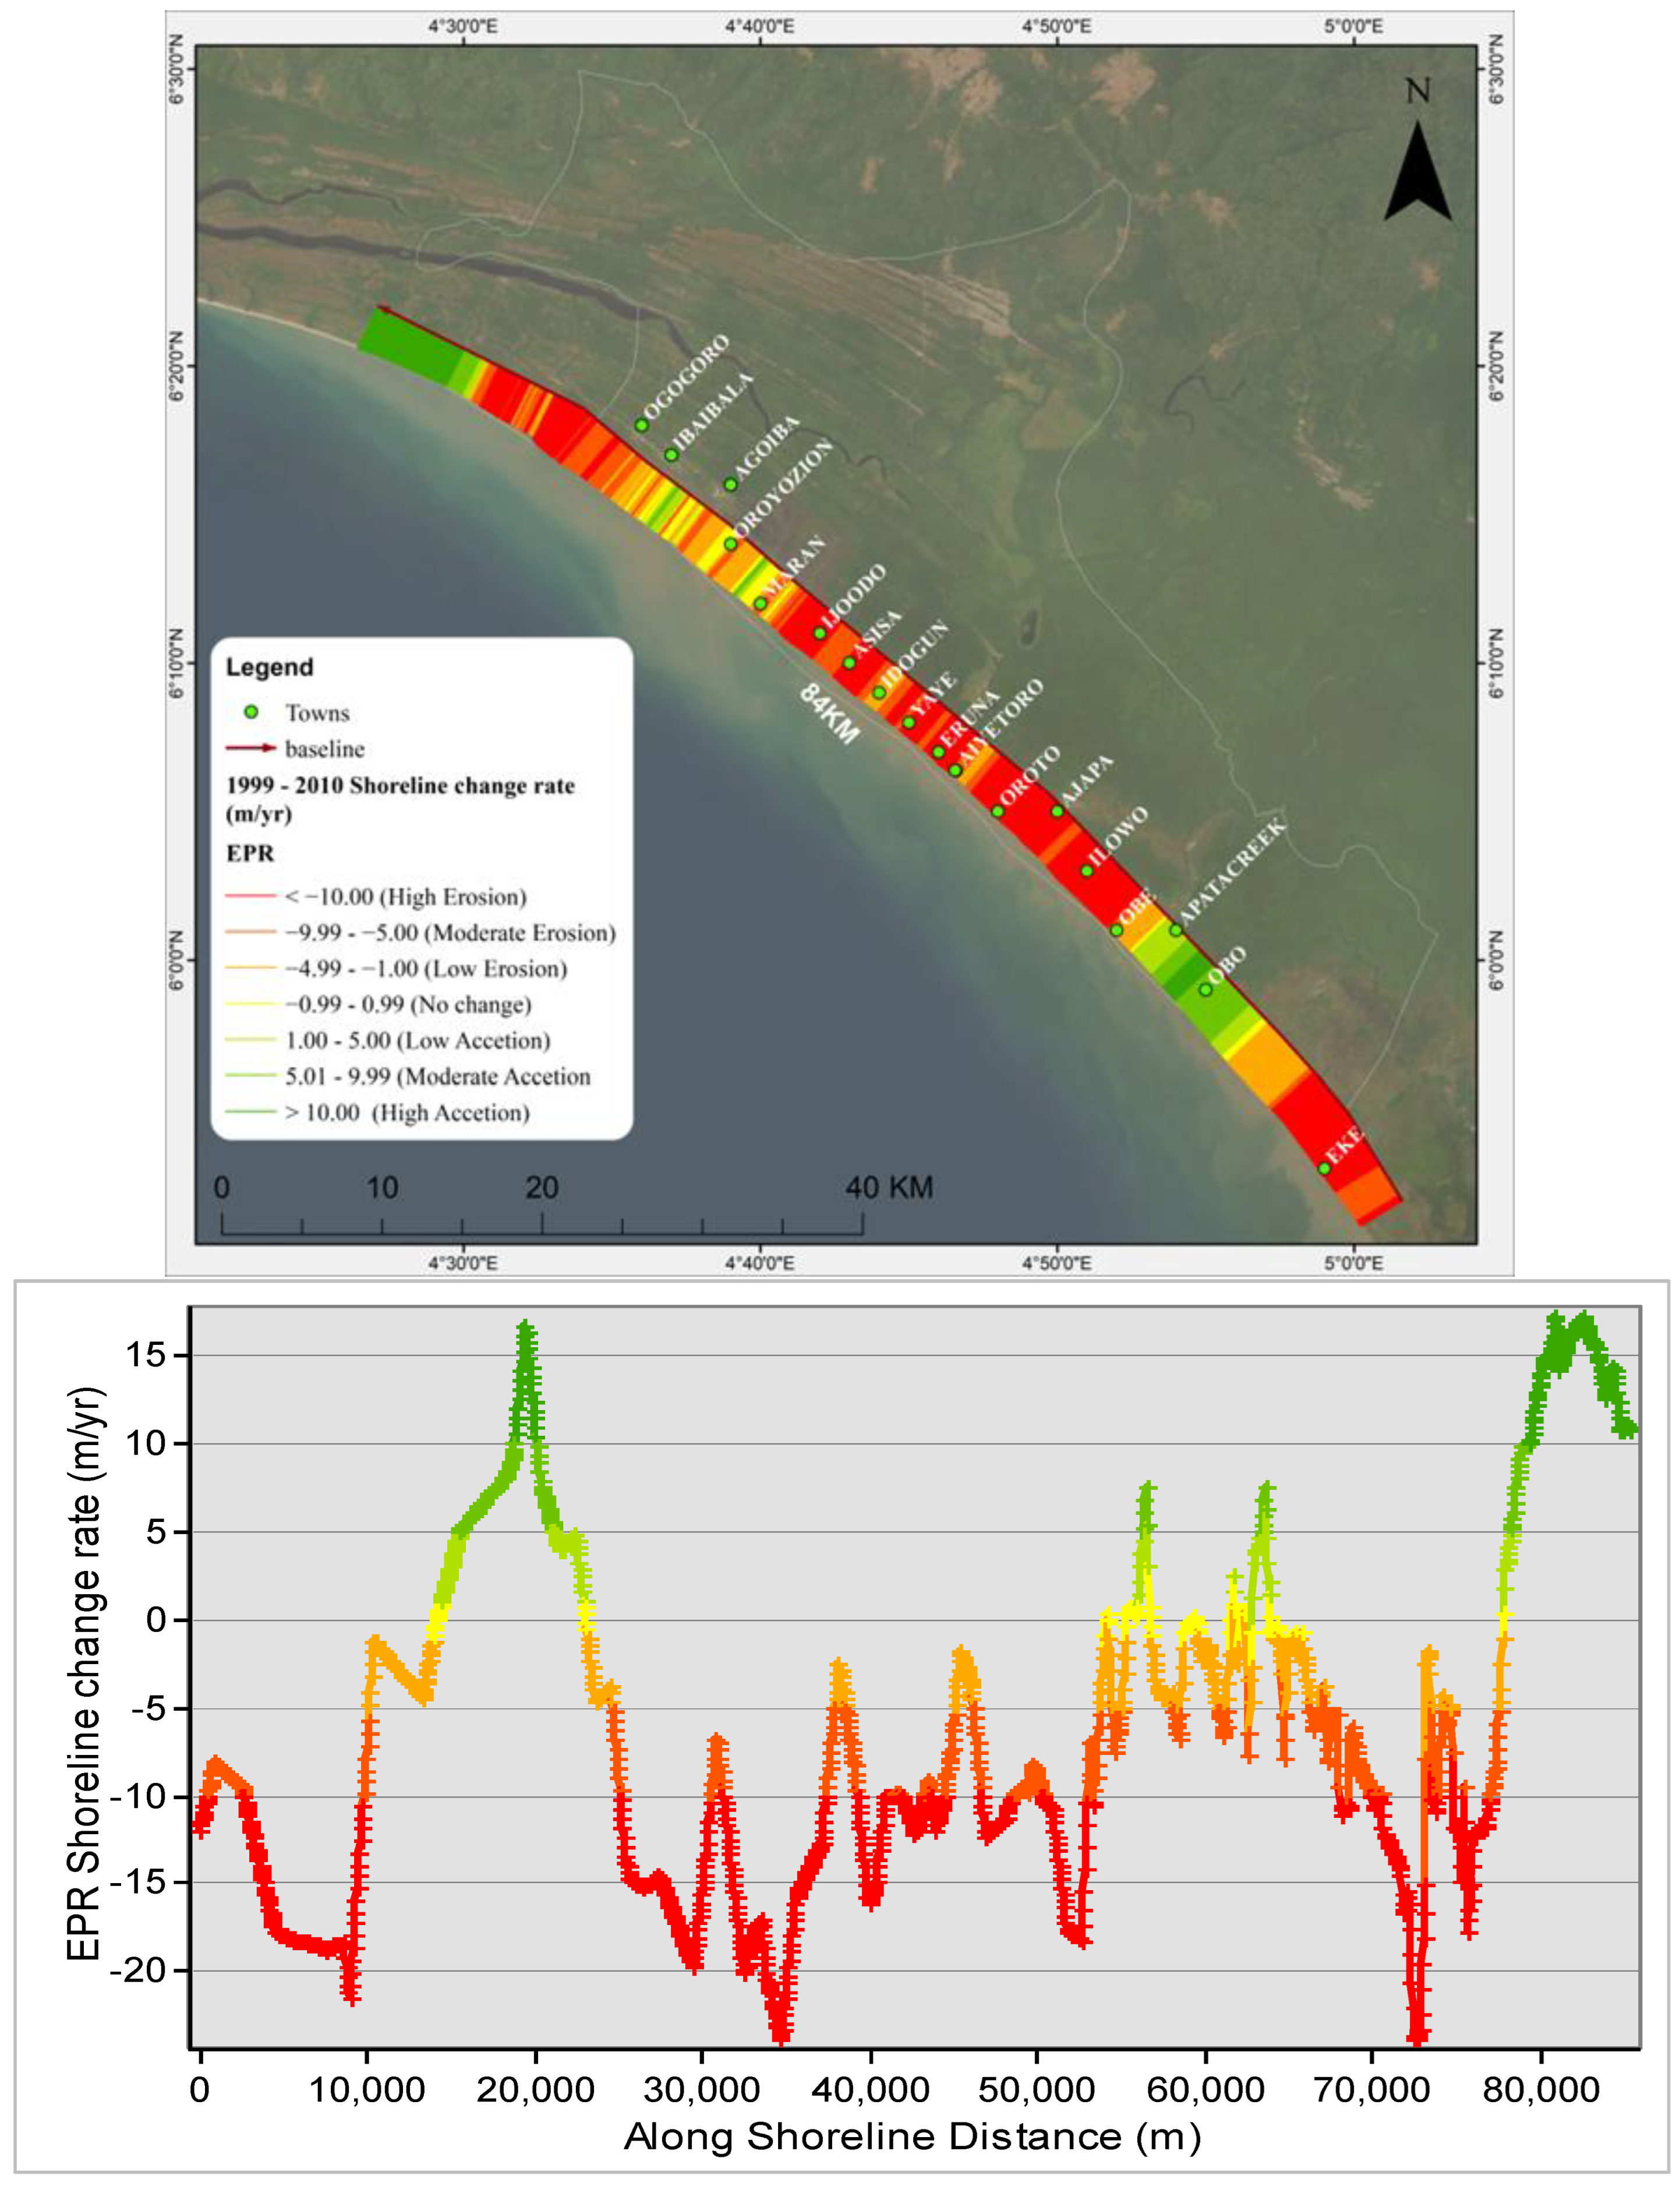
3.1. Shoreline Change Envelope (SCE)

The shoreline change envelope (SCE) analysis reveals an average shoreline change distance of 310.04 m across all transects. The maximum change of 1057.02 m and the minimum change of 41.24 m signify significant variability in shoreline dynamics along the studied coast.

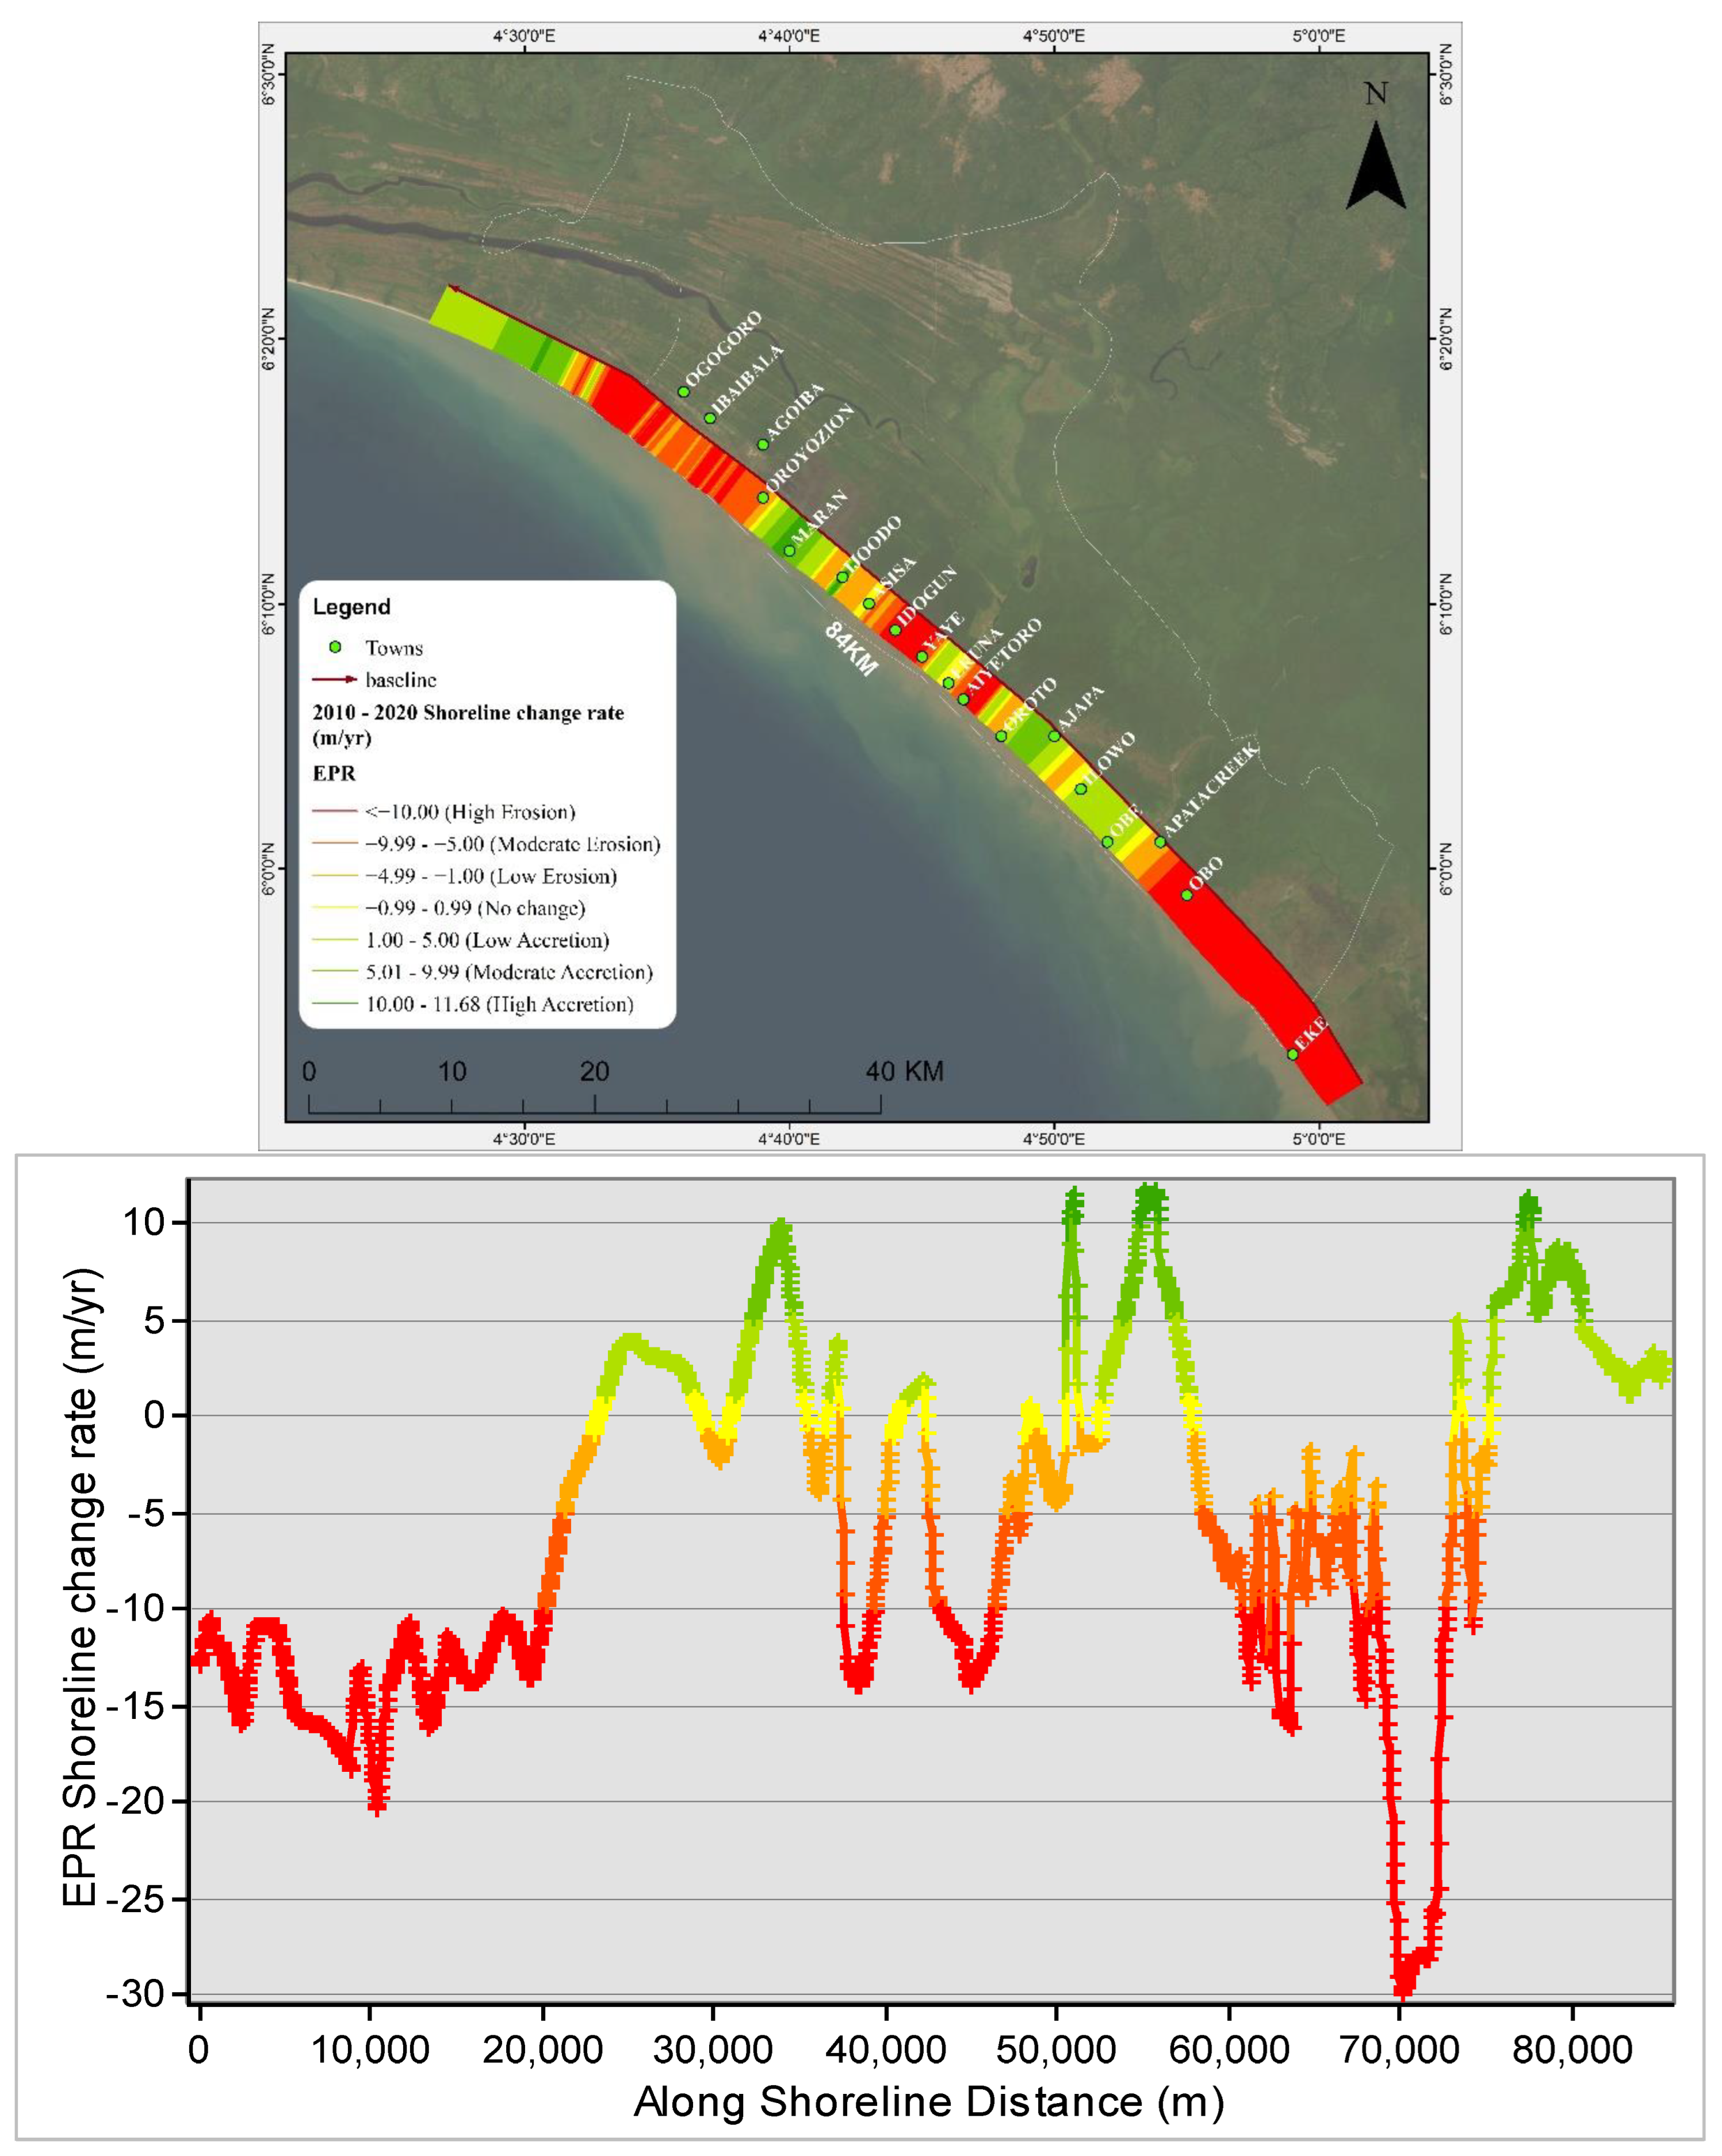
3.2. Short-Term Shoreline Change

The investigation of shoreline changes focused on three distinct time periods: 1986–1999, 1999–2010, and 2010–2020. Through this analysis, this study provides insight into the erosion and accretion changes observed along the shoreline over the 34-year study period.
Shoreline change between 1986 and 1999
During the time span between 1986 and 1999, the shoreline underwent a notable erosion rate (Figure 4). The analysis conducted using the EPR method reveals an average erosion rate of −8.15 m per year, along with an average accretion rate of 26.12 m per year. Throughout this period, approximately 60% (50.4 km) of the entire coastline experienced erosion, while 40% (33.6 km) experienced accretion. It is evident that there was a significant retreat of the shoreline in certain areas, while other areas showed growth. Notably, the northwestern and central parts of the coastline exhibited the highest erosion rates, while the eastern part demonstrated a predominant pattern of accretion.
Shoreline change between 1999 and 2010
The analysis for the period between 1999 and 2010 shows sustained coastal dynamics. EPR analysis shows that the rate of erosion was −10.42 m per year. The accretion rate was 8.3 m per year. This means a net change in shoreline of −2.12 m per year. Additionally, the findings show that 23% (19.3 km) of the shoreline accreted during this time, whereas 77% (64.7 km) of it eroded. Erosion was dominant in the central part of the coast (Figure 5).
Shoreline change between 2010 and 2020
In the period between 2010 and 2020, the rate of shoreline erosion was −10.27 m per year, while the accretion rate was 4.5 m per year. Out of the total shoreline extent, approximately 35% (29.4 km) experienced accretion, while 65% (54.6 km) suffered erosion. Figure 5 indicates that erosion was the dominant process, resulting in a net rate of −5.77 m per year. Specifically, the eastern section of the shoreline exhibited predominant erosion, while certain areas in the western and central sections experienced a combination of erosion and accretion (Figure 6).

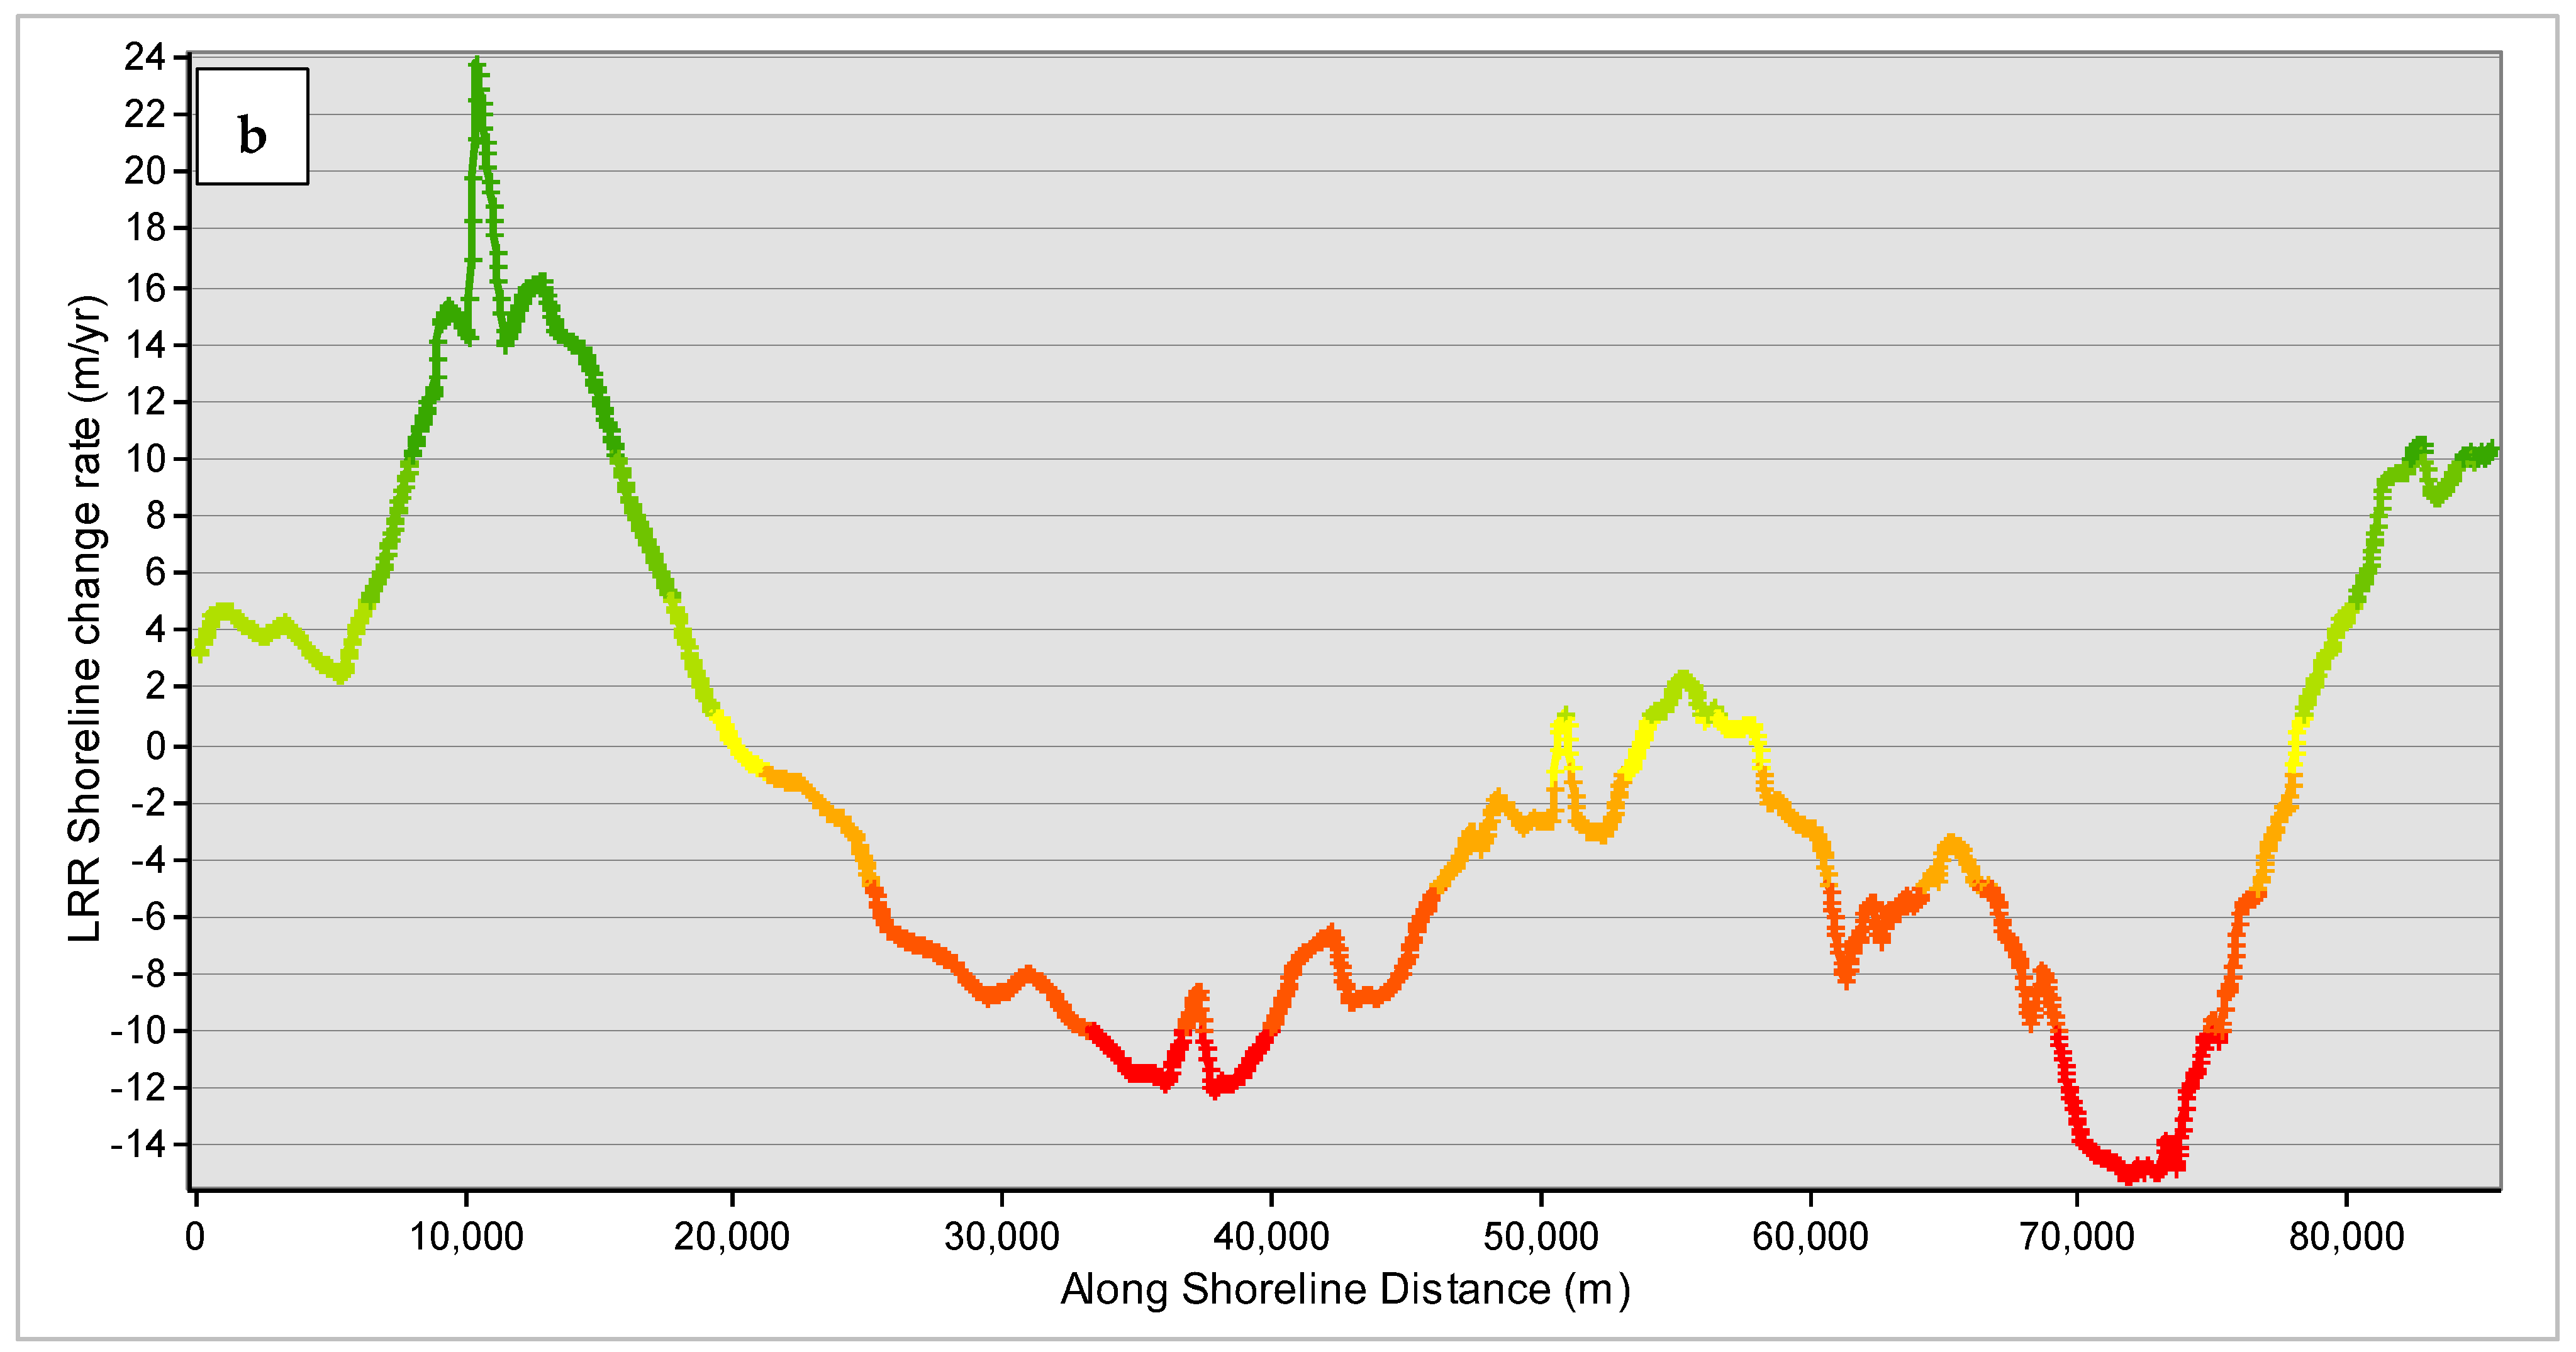
3.3. Long-Term Shoreline Variation (1986–2020)

The analysis of the long-term shoreline variation spanning from 1986 to 2020 provides comprehensive insights into the dynamics of the studied shoreline over multiple time periods. According to the LRR rate of change statistics for the Ilaje mud coast, about 76% (63.8 km) of the coastline was eroded between 1986 and 2020, as shown in Figure 7. The average erosion rate across all erosional transects was −6.9 m per year, with the highest erosion rate of −15.2 m per year, indicating a general trend of coastline retreat (Table 2). A small fraction of transects, 24% (36.2 km) experienced accretion, with an average accretion rate of 7.05 m per year. The analysis of LRR data spanning 34 years reveals noteworthy trends in shoreline dynamics. Specifically, the western and central segments of the coastline experienced considerable erosion rates, while the eastern portion displayed significant accretion activity (Figure 7a).

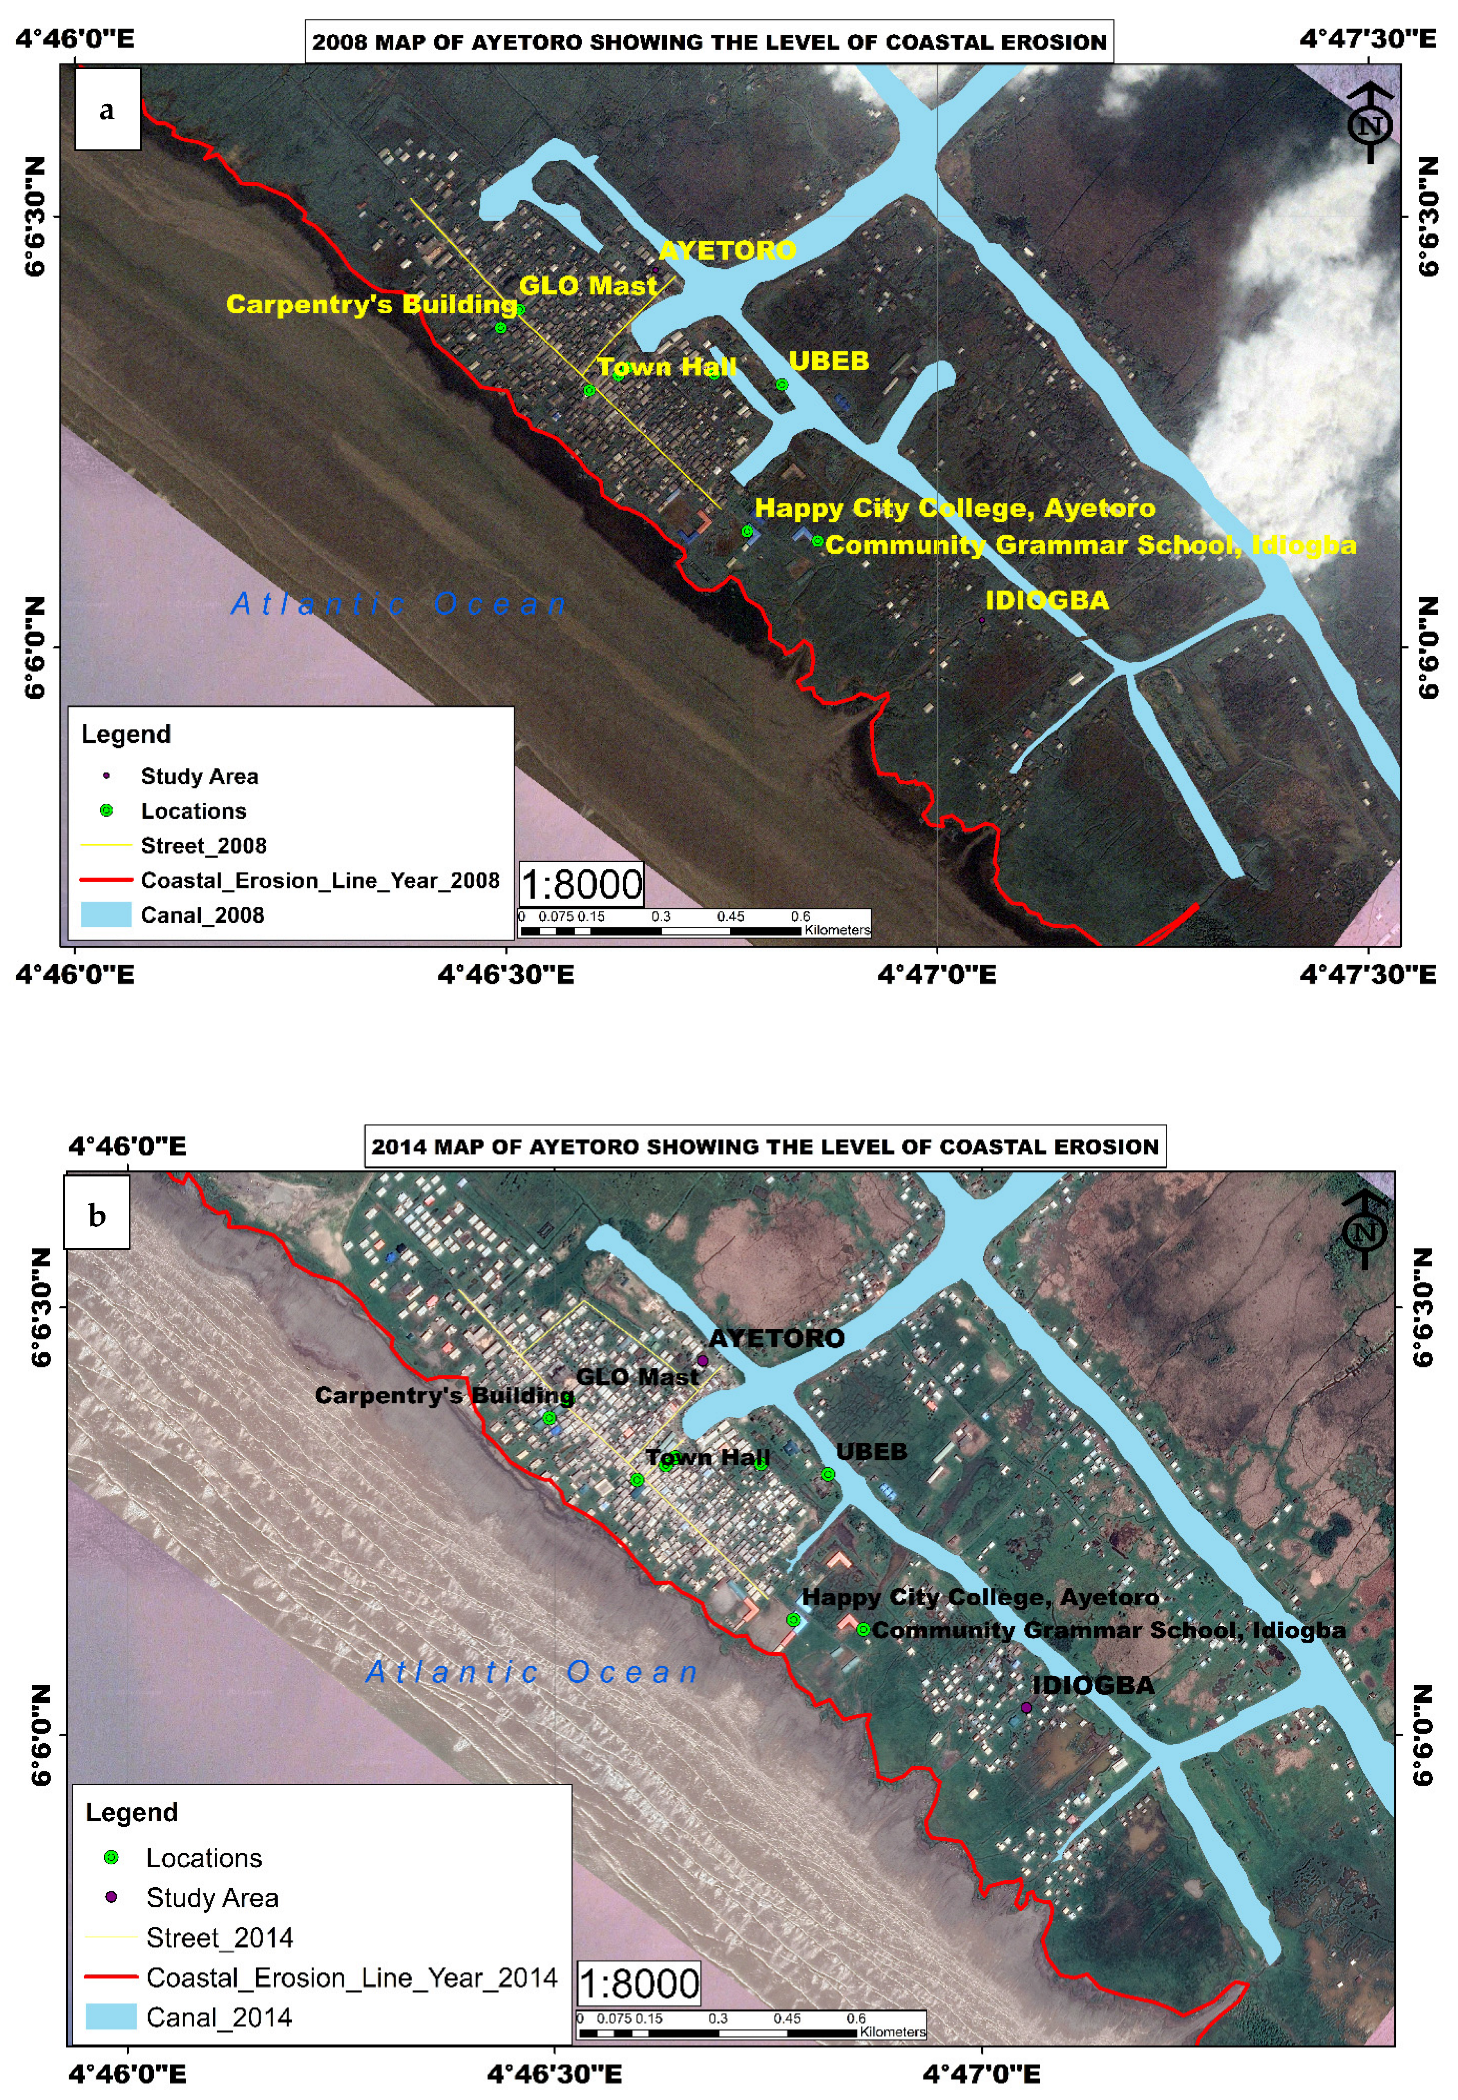
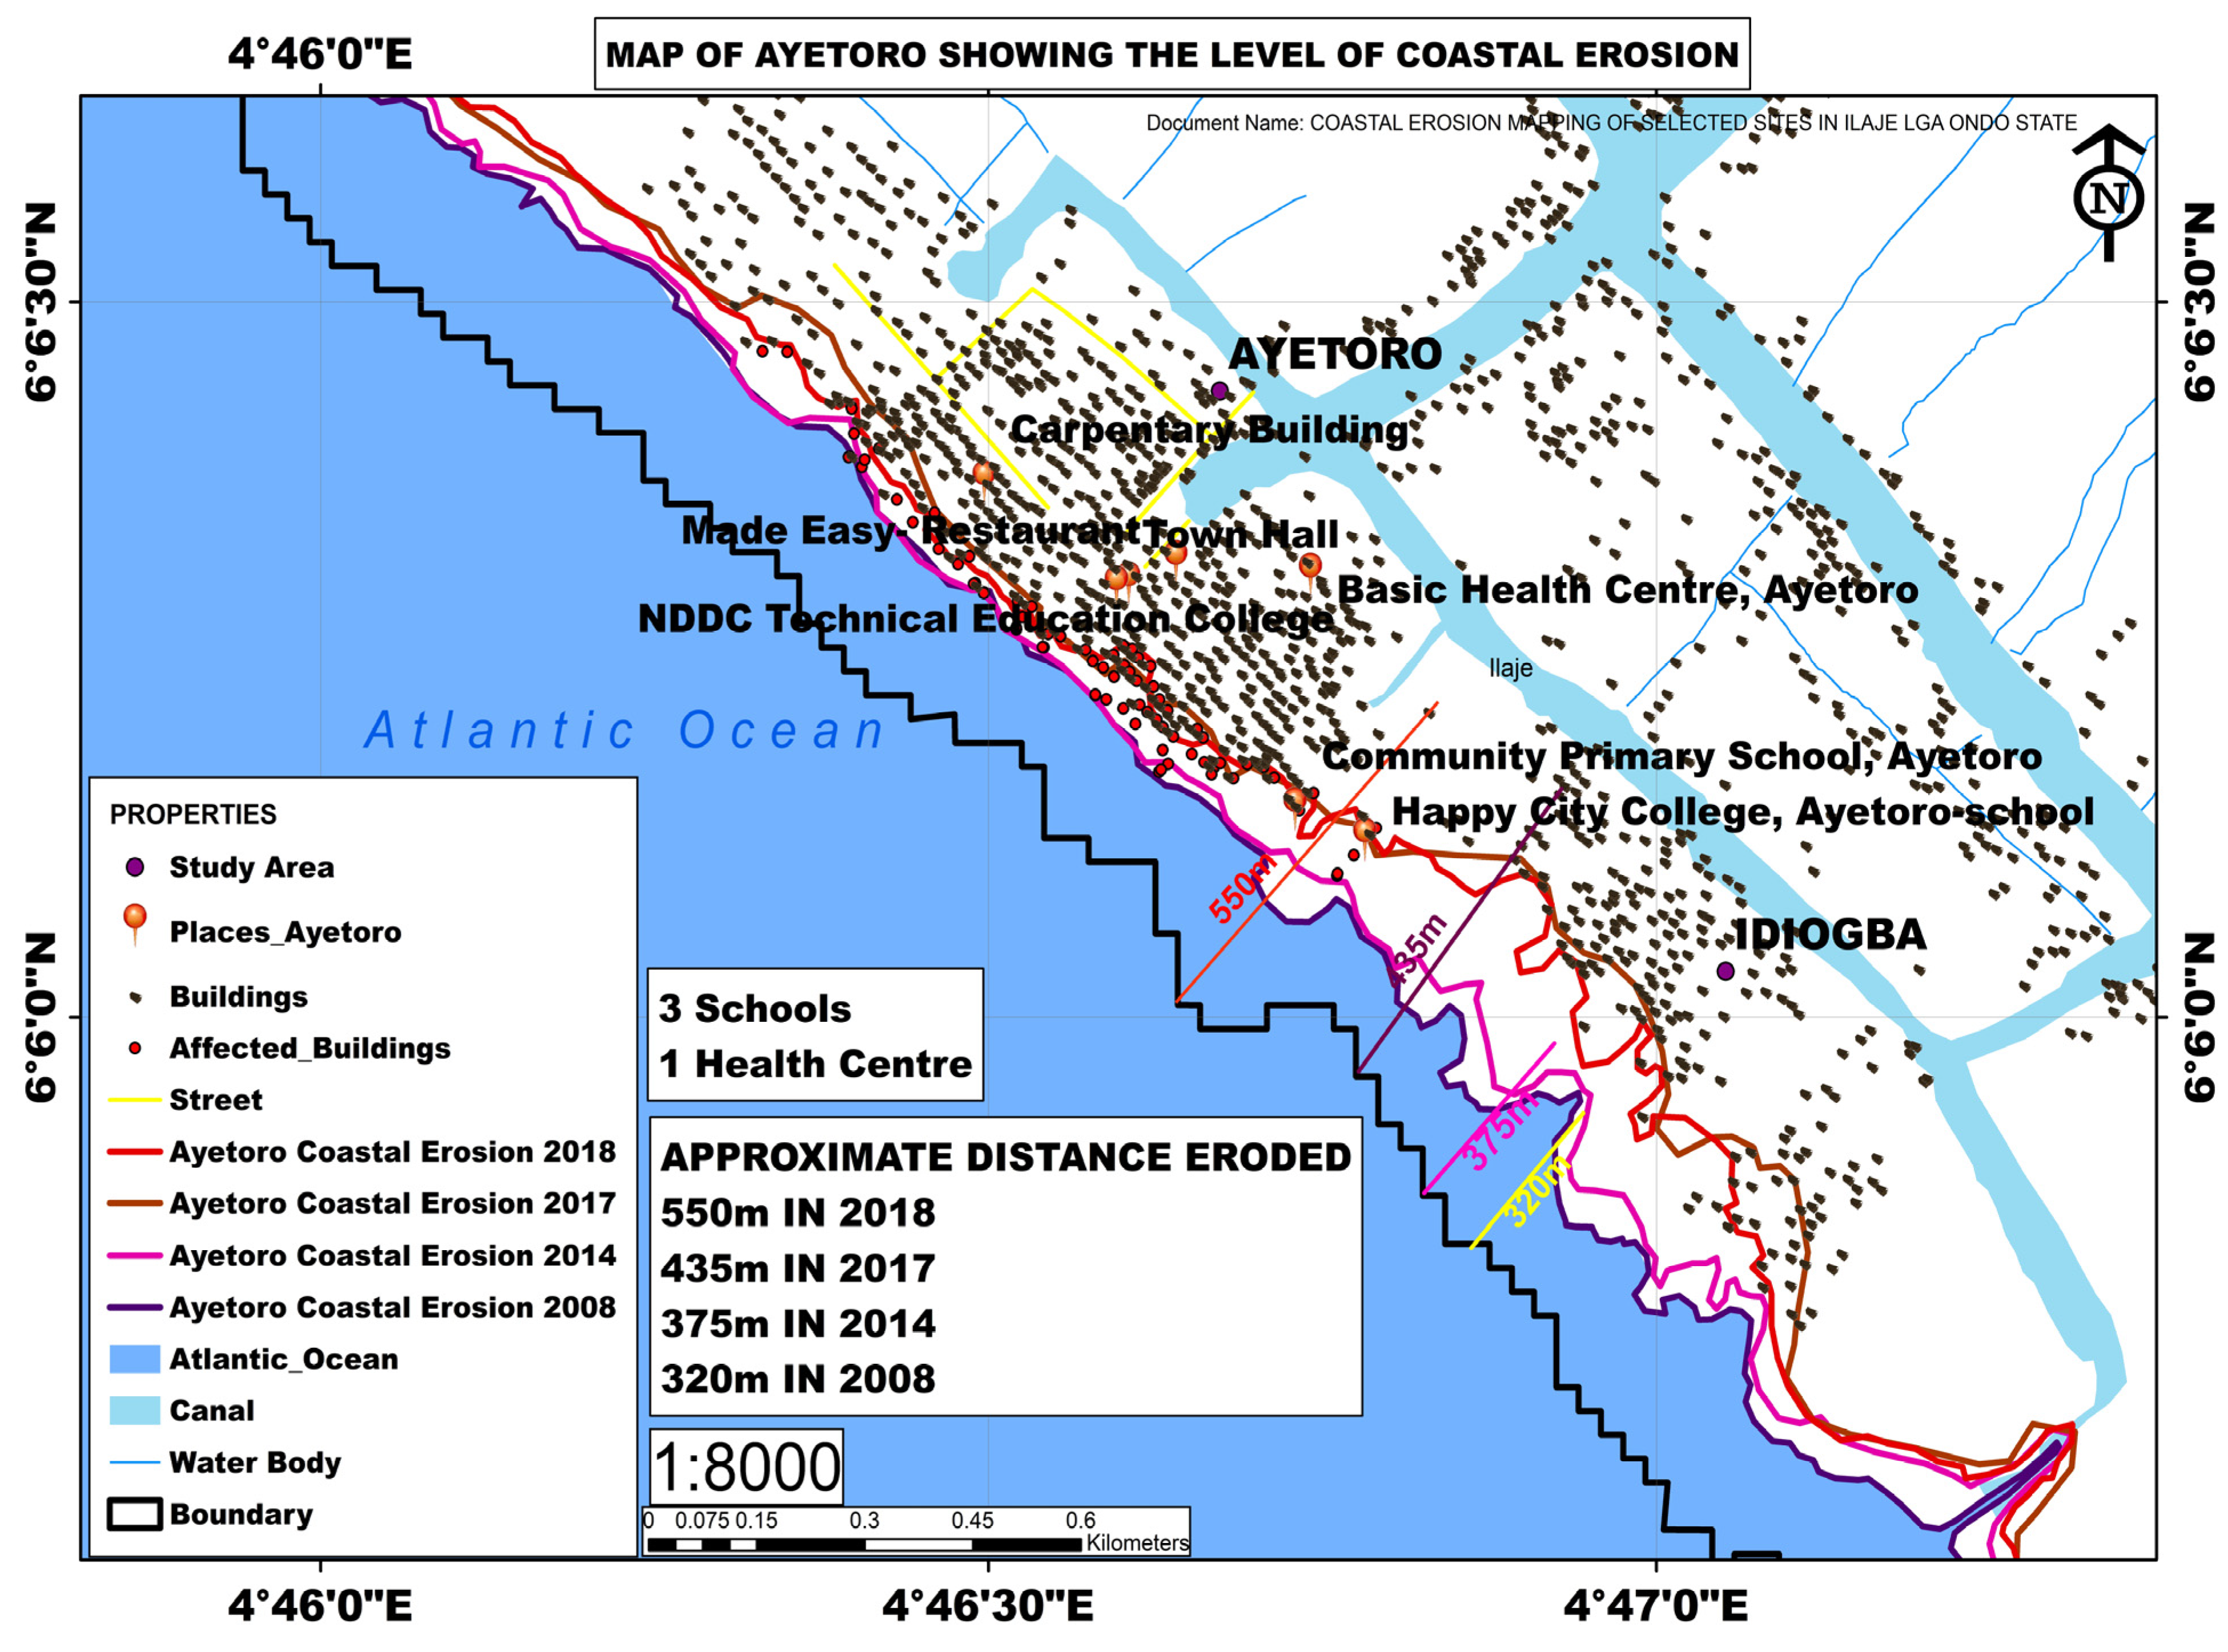
3.4. Spatial Analysis for Assessment of Ayetoro

The spatial analysis and map digitization of Ayetoro community in Ilaje is described and represented in Table 3 and Figure 8, Figure 9 and Figure 10.

4. Discussion

In the study area, the shoreline, stretching 84 km, has experienced both erosion and accretion. Through long-term shoreline variation analysis, it is evident that chronic erosion has significantly impacted large areas of the Ilaje coastline. Popoola [43] reported a landward shift of up to 1042.34 m due to erosion between 1986 and 2021, utilizing the shoreline change envelope parameter (SCE) method, which closely aligns with our study’s findings. In this study, the maximum amount of erosion was calculated to be 1057.02 m using the SCE method, representing the farthest landward or seaward shift in the shoreline along specific transects during the study period. Dada et al. [39] previously approximated a 50.7 km eroded coastline between 1986 and 2017. In contrast, the current study observed a higher approximate eroded area of 63.8 km for the period between 1986 and 2020 (Table 2). These discrepancies in the estimated eroded coastline between the two studies may be attributed to variations in the methodologies, data sources, and time frames used in each investigation.
The coastal erosion rate (m/a) was calculated using the EPR and LRR methods. Since the analyses with the EPR method considered two coastlines, the calculations were carried out separately in different time frames. The results obtained with the EPR method showed that between 1986 and 2020 the maximum erosion rate was −15.3 m per year, with an average value of −1.36 m per year (Table 2). EPR values indicated that erosion was dominant in the Ilaje region in the period 1986 to 2020, indicated by the higher percentage of erosional transects. The average erosion rate, particularly the overall average of all erosion rates, indicates that some areas experienced greater land loss than others. The presence of accretion transects and their average rate of accretion suggest that some parts of the coast have acquired sediments, contributing to local land growth. After assessing erosion rates through the LRR method between 1986 and 2020, the most substantial erosion rate observed was −15.2 m per year. Notably, the results derived from both the LRR and EPR methodologies exhibited remarkable similarity. The average annual erosion rate was −1.36 m when using the EPR method and −1.66 m when employing the LRR approach. Additionally, the maximum erosion rate was −15.3 m per year with EPR and −15.2 m per year using LRR (Table 3).
This study confirms the prevalence of erosional processes in the western and central sections of the coast, with erosion being more pronounced in the central section. These findings align with the conclusions of previous studies by Badru et al. [40] and Dada et al. [39]. Popoola [43] also observed erosion dominating the central section of the coast in his research. Remarkably, Badru et al. [40] emphasized the vulnerability of the Okesiri, Abereke, and Aiyetoro areas to persistent erosional tendencies, underscoring the significance of these communities due to their substantial size within the region. The widespread erosion along the Ilaje mud coast is influenced by a combination of geomorphic and anthropogenic factors. The region’s low relief, deforestation, canal dredging, severe storm surges, and rising sea levels due to climate change contribute to the erosion. Human activities, such as canal dredging and navigation channel construction, disrupt sediment transport, while climate change exacerbates the vulnerability of the coastal area.
Through reconnaissance efforts, it has come to light that numerous coastal communities are perilously close to submergence, with Ayetoro being a particular cause for concern. Ayetoro, a coastal community founded by a Christian movement in 1947, is renowned for its fishing and trading activities. However, it gained national recognition for its rapid development in the 1950s and 1960s, becoming a prominent tourist attraction that drew both local and international visitors. Dependent on the sea for its economic sustenance, Ayetoro has a rich history of producing sea vessels, speed boats, skilled captains, marine engineers, and carpentry experts. It was the first town in the old Ondo province, part of the now-defunct Western Region, to generate its own electricity, a feat it continues to maintain. From its modest founding in 1947, Ayetoro has blossomed into one of the powerhouse towns and is one of the most historically remarkable settlements along the coastal stretch in the Ilaje local government area [58]. The Nigerian census of 1991 reported a population of 14,000, which increased to 26,000 by 2006. Projections for 2022 indicate a population of 34,118 [46].
A spatial analysis and digitization of Ayetoro have revealed the distressing reality of many homes already submerged by the advancing Atlantic Ocean, while others teeter on the brink of the same fate. A comprehensive analysis of the provided information reveals significant trends in terms of building submergence, land area submergence, and encroachment length over specific time periods. Between 2008 and 2014, approximately 77,822.331 square meters of land were submerged. From 2014 to 2018, this submerged land area increased to approximately 129,882.080 square meters. Between 2018 and 2023, the submerged land area further increased to approximately 202,402.715 square meters (Table 3, Figure 10).
The consistent increase in the number of submerged buildings and encroachment length over time underscores the vulnerability of the area to coastal erosion and sea incursion. The rise in the number of buildings submerged between 2018 and 2023 signals an alarming escalation, indicating an accelerated deterioration of the coastal environment (Figure 10). Distinctive landmarks, including the NDDC Technical Education College, Happy City College, and Ayetoro City Hall, have already succumbed to the relentless forces of the sea. Due to the relentless destructive invasion of the sea, the inhabitants have been forced to constantly relocate from one place to another in search of safety and refuge. Figure 8, Figure 9 and Figure 10 present a comparative view of Ayetoro in 2008, 2014, 2018, and 2023, offering a stark visual depiction of the severity of the situation. The patterns observed have grave implications for the community, including potential displacement of residents, loss of property and infrastructure, saltwater intrusion, and disruption of livelihoods (Figure 11).
As highlighted by Popoola [43], the implications are far-reaching, encompassing the loss of lives, properties, and land, as well as the upheaval of communities, leading to emotional and psychological trauma. The impact further extends to the devastation of marine life and the local economy, as well as the disruption of income-generating activities for the inhabitants. To address this urgent crisis, it is imperative to implement robust coastal management strategies, including shoreline protection measures, sustainable development practices, and community engagement. Additionally, the analysis calls for ongoing monitoring and adaptive management to safeguard the Ayetoro coastal community against the ongoing challenges of coastal erosion. Furthermore, this study underscores the need for continuous monitoring and adaptable management, essential for safeguarding Ayetoro and other susceptible coastal communities from the persistent threats posed by coastal erosion.

5. Conclusions

This study conducted on the Ilaje shoreline, known as the Mahin transgressive mud coast, unveiled significant changes over time, characterized by erosion and accretion processes. These changes have resulted from a complex interplay of coastal processes influenced by natural factors and potentially human activities. This study analyzed the spatial and temporal changes in the Ilaje coastline between 1986 and 2020, using the SCE, EPR, and LRR methods for shoreline change analysis. Additionally, spatial digitization was performed for Ayetoro, a highly susceptible coastal community, spanning from 2008 and 2023.
The analysis revealed that approximately 86% of the coastline experienced erosion, while the remaining 14% showed accretion. Erosion emerged as a prevalent issue in the western and central sections of the coastline, leading to the loss of coastal land and posing a threat to communities residing in vulnerable areas. Notably, Ayetoro, situated centrally, faces dire circumstances. Beyond geographical alterations, erosion has also had severe impacts on local ecosystems, livelihoods, and infrastructure, putting them at risk.
This study emphasizes that human settlements and economic activities in close proximity to the shoreline face heightened vulnerability due to these changes. Therefore, it calls for adopting an integrated coastal zone management approach to promote coastal stability in the study area. The quantitative results of this study are expected to provide valuable guidance to managers and planners for assessing the current critical situation of the coastline and estimating possible future changes. Subsequently, any proposed projects or interventions should consider the short-, medium-, and long-term potential impacts, with planning conducted holistically in this context.
The findings enhance our understanding of shoreline dynamics in the Ilaje coastal area, emphasizing the severity of erosion and the urgency of implementing effective coastal management strategies in this vulnerable region. Continuous monitoring and assessment of coastal dynamics are vital to inform decisionmakers, urban planners, and policymakers, enabling the development of sustainable coastal management plans that balance environmental conservation with development goals.
This study emphasizes the necessity of integrated coastal zone management (ICZM) measures to address coastal erosion and degradation and urges prompt action in the Ilaje coastal area. Vulnerable communities like Ayetoro deserve special consideration since they might need to be relocated or have protective infrastructures put in place. Future development plans must strike a balance between development and environmental protection, taking into account long-term coastal stability. It is crucial to continuously monitor coastal dynamics in order to inform decisionmakers and modify plans of action as circumstances change.
However, the accuracy of the study is substantially impacted by data availability and quality. It might be difficult to distinguish anthropogenic influences from natural variability in coastal processes. This study’s conclusions are unique to the coastal region of Ilaje and might not be immediately applicable to other coastal areas. The scope of this study may have been constrained by a lack of resources, particularly money and staff. This study does not take into account potential future changes or dynamic adaption strategies; instead, it provides a static assessment of shoreline changes over a certain period. Future studies should expand their temporal scope to gain a more comprehensive understanding of shoreline changes and evaluate the effectiveness of implemented strategies over time. In-depth research into the specific impacts of erosion on ecosystems, livelihoods, and infrastructure will support the development of targeted mitigation measures. Examining the socio-economic factors and consequences of shoreline change provides a holistic overview of the challenges faced by affected communities. Taking into account climate change projections is crucial to anticipate possible exacerbations of existing problems.

Author Contributions

Conceptualization, O.A.O., P.A.D.M. and R.F.; methodology, O.A.O., E.J. and O.J.I.; software, E.J.; validation, O.A.O., formal analysis, O.A.O., E.J. and O.J.I.; investigation, O.A.O.; writing—original draft preparation, O.A.O.; writing—review and editing, O.A.O., P.A.D.M. and R.F.; visualization, O.A.O.; supervision, P.A.D.M. and R.F. All authors have read and agreed to the published version of the manuscript.

Funding

This work was supported by the World Bank through the Africa Centre of Excellence in Coastal Resilience (ACECoR) Project at the Centre for Coastal Management, University of Cape Coast (Credit No.: 6389-GH).

Institutional Review Board Statement

Not applicable.

Informed Consent Statement

Not applicable.

Data Availability Statement

All data herein are publicly available.

Acknowledgments

The authors would like to thank the World Bank for funding this research. Special recognition is extended to the Google Earth Engine and Google Earth platforms for their invaluable provision of free resources. Olujumoke Adesola Ogunrayi is particularly thankful to Segun Leke for his generous contribution to this work.

Conflicts of Interest

The authors declare no conflict of interest.

References

  1. Nicholls, R.J.; Marinova, N.; Lowe, J.A.; Brown, S.; Vellinga, P.; De Gusmao, D.; Hinkel, J.; Tol, R.S. Sea-level rise and its possible impacts given a ‘beyond 4 C world’ in the twenty-first century. Philos. Trans. R. Soc. A Math. Phys. Eng. Sci. 2011, 369, 161–181. [Google Scholar] [CrossRef]
  2. Vousdoukas, M.I.; Ranasinghe, R.; Mentaschi, L.; Plomaritis, T.A.; Athanasiou, P.; Luijendijk, A.; Feyen, L. Sandy coastlines under threat of erosion. Nat. Clim. Change 2020, 10, 260–263. [Google Scholar] [CrossRef]
  3. Giardino, A.; Schrijvershof, R.; Nederhoff, C.M.; De Vroeg, H.; Briere, C.; Tonnon, P.K.; Caires, S.; Walstra, D.J.; Sloff, C.J.; Van Verseveld, W.; et al. A quantitative assessment of human interventions and climate change on the West African sediment budget. Ocean Coast. Manag. 2018, 156, 249–265. [Google Scholar] [CrossRef]
  4. McDonnell, T. Climate Migrants Face a Gap in International Law; Centre for International Governance: Waterloo, ON, Canada, 12 February 2019; p. 2019. [Google Scholar]
  5. IPCC. Special Report on the Ocean and Cryosphere in a Changing Climate. 2019. Available online: https://www.ipcc.ch/srocc/ (accessed on 25 August 2023).
  6. Shenbagaraj, N.; Senthil Kumar, K.; Rasheed, A.M.; Leostalin, J.; Kumar, M.N. Mapping and Electronic Publishing of Shoreline Changes using UAV Remote Sensing and GIS. J. Indian Soc. Remote Sens. 2021, 49, 1769–1777. [Google Scholar] [CrossRef]
  7. Mohanty, P.C.; Mahendra, R.S.; Nayak, R.K.; Sirinivasa, T.K. Impact of sea level rise and coastal slope on shoreline change along the Indian coast. Nat. Hazards 2017, 89, 1227–1238. [Google Scholar] [CrossRef]
  8. Ding, Y.; Wang, S.S.Y. Development application of a coastal estuarine morphological process modeling system. J. Coast. Res. 2008, 52, 127–140. [Google Scholar] [CrossRef]
  9. Hakkou, M.; Maanan, M.; Belrhaba, T.; El khalidi, K.; El Ouai, D.; Benmohammadi, A. Multi-decadal assessment of shore-line changes using geospatial tools and automatic computation in Kenitra coast. Morocco. Ocean Coast. Manag. 2018, 163, 232–239. [Google Scholar] [CrossRef]
  10. Kumar, A.; Jayappa, K.S. Long short-term shoreline changes along Mangalore coast India. Int. J. Environ. Res. 2009, 3, 177–188. [Google Scholar] [CrossRef]
  11. Tano, R.A.; Aman, A.; Toualy, E.; Kouadio, Y.K.; Francois-Xavier, B.B.D.; Addo, K.A. Development of an Integrated Coastal Vulnerability Index for the Ivorian Coast in West Africa. J. Environ. Prot. 2018, 9, 1171–1184. [Google Scholar] [CrossRef]
  12. Boateng, I.; Wiafe, G.; Jayson-Quashigah, P.-N. Mapping Vulnerability and Risk of Ghana’s Coastline to Sea Level Rise. Mar. Geod. 2016, 40, 23–39. [Google Scholar] [CrossRef]
  13. WACOM (West African Coastal Observation Mission). Regional Study for Shoreline Monitoring and Drawing Up a Management Scheme for the West African Coastal Area. 2011. Available online: http://www.climateandcoast.com/moloa (accessed on 4 September 2023).
  14. Aman, A.; Tano, R.A.; Toualy, E.; Silué, F.; Addo, K.A.; Folorunsho, R. Physical forcing induced coastal vulnerability along the Gulf of Guinea. J. Environ. Prot. 2019, 10, 1194–1211. [Google Scholar] [CrossRef]
  15. Brown, A.G.; Tooth, S.; Bullard, J.E.; Thomas, D.S.; Chiverrell, R.C.; Plater, A.J.; Murton, J.; Thorndycraft, V.R.; Tarolli, P.; Rose, J.; et al. The geomorphology of the Anthropocene: Emergence, status and implications. Earth Surf. Process. Landf. 2017, 42, 71–90. [Google Scholar] [CrossRef]
  16. Pollard, J.; Spencer, T.; Brooks, S. The interactive relationship between coastal erosion and flood risk. Prog. Phys. Geogr. Earth Environ. 2018, 43, 574–585. [Google Scholar] [CrossRef]
  17. Mentaschi, L.; Vousdoukas, M.I.; Pekel, J.-F.; Voukouvalas, E.; Feyen, L. Global long-term observations of coastal erosion and accretion. Sci. Rep. 2018, 8, 12876. [Google Scholar] [CrossRef] [PubMed]
  18. Wan, L.; Zhang, H.; Lin, G.; Lin, H. A small-patched convolutional neural network for Mangrove mapping at species level using high-resolution remote-sensing image. Ann. GIS 2019, 25, 45–55. [Google Scholar] [CrossRef]
  19. Leo, K.L.; Gillies, C.L.; Fitzsimons, J.A.; Hale, L.Z.; Beck, M.W. Coastal habitat squeeze: A review of adaptation solutions for saltmarsh, mangrove and beach habitats. Ocean Coast. Manag. 2019, 175, 180–190. [Google Scholar] [CrossRef]
  20. Westphal, H.; Murphy, G.N.; Doo, S.S.; Mann, T.; Petrovic, A.; Schmidt, C.; Stuhr, M. Ecosystem design as an avenue for improving services provided by carbonate-producing marine ecosystems. PeerJ 2022, 10, e12785. [Google Scholar] [CrossRef]
  21. Cooper, J.A.G.; Masselink, G.; Coco, G.; Short, A.D.; Castelle, B.; Rogers, K.; Anthony, E.; Green, A.N.; Kelley, J.T.; Pilkey, O.H.; et al. Sandy beaches can survive sea-level rise. Nat. Clim. Change 2020, 10, 993–995. [Google Scholar] [CrossRef]
  22. Gorelick, N.; Hancher, M.; Dixon, M.; Ilyushchenko, S.; Thau, D.; Moore, R. Google Earth Engine: Planetary-scale geospatial analysis for everyone. Remote Sens. Environ. 2017, 202, 18–27. [Google Scholar] [CrossRef]
  23. Donchyts, G.; Baart, F.; Winsemius, H.; Gorelick, N.; Kwadijk, J.; Van De Giesen, N. Earth’s surface water change over the past 30 years. Nat. Clim. Change 2016, 6, 810–813. [Google Scholar] [CrossRef]
  24. Li, H.; Wan, W.; Fang, Y.; Zhu, S.; Chen, X.; Liu, B.; Yang, H. A Google Earth engine-enabled software for efficiently generating high-quality user-ready landsat mosaic images. Environ. Model. Softw. 2019, 112, 16–22. [Google Scholar] [CrossRef]
  25. Luijendijk, A.; Hagenaars, G.; Ranasinghe, R.; Baart, F.; Donchyts, G.; Aarninkhof, S. The state of the world’s beaches. Sci. Rep. 2018, 95, 372–376. [Google Scholar] [CrossRef] [PubMed]
  26. Boak, E.H.; Turner, I.L. Shoreline Definition and Detection: A Review. J. Coast. Res. 2005, 21, 688–703. [Google Scholar] [CrossRef]
  27. García-Rubio, G.; Huntley, D.; Russell, P. Evaluating shoreline identification using optical satellite images. Mar. Geol. 2015, 359, 96–105. [Google Scholar] [CrossRef]
  28. Kuleli, T.; Guneroglu, A.; Karsli, F.; Dihkan, M. Automatic detection of shoreline change on coastal Ramsar wetlands of Turkey. Ocean Eng. 2011, 38, 1141–1149. [Google Scholar] [CrossRef]
  29. Liu, Q.; Trinder, J.; Turner, I.L. Automatic super-resolution shoreline change monitoring using Landsat archival data: A case study at Narrabeen–Collaroy Beach, Australia. J. Appl. Remote Sens. 2017, 11, 016036. [Google Scholar] [CrossRef]
  30. Pardo-Pascual, J.E.; Sanchez-García, E.; Almonacid-Caballer, J.; Palomar-Vazquez, J.M.; de los Santos, E.P.; Fernandez-Sarría, A.; Balaguer-Beser, A. Assessing the accuracy of automatically extracted shorelines on microtidal beaches from Landsat 7, Landsat 8 and sentinel-2 imagery. Remote Sens. 2018, 10, 326. [Google Scholar] [CrossRef]
  31. Vos, K.; Splinter, K.D.; Harley, M.D.; Simmons, J.A.; Turner, I.L. CoastSat: A Google Earth Engine-enabled Python toolkit to extract shorelines from publicly available satellite imagery. Environ. Model. Softw. 2019, 122, 104528. [Google Scholar] [CrossRef]
  32. Ebisemiju, F.S. An evaluation of factors controlling present rates of shoreline retrogradation in the Western Niger Delta, Nigeria. CATENA 1987, 14, 1–12. [Google Scholar] [CrossRef]
  33. Ibe, A.C. Nigeria. In Artificial Structures and Shorelines; Walker, H.F., Ed.; KluwerAcademic Publishers: Dordrecht, The Netherlands, 1988; pp. 287–294. [Google Scholar]
  34. Ashton-Jones, N.S.A.; Douglas, O. The Human Ecosystems of the Niger Delta: An Era Handbook; ERA: Benin City, Nigeria, 1998. [Google Scholar]
  35. Bayode, O.J.A.; Adewunmi, E.A. Environmental implications of oil exploration and exploitation in the coastal region of Ondo State, Nigeria: A regional planning appraisal. J. Geogr. Reg. Plan. 2011, 4, 110. [Google Scholar]
  36. Ayeku, P.O. Climate Change and Anthropogenic Impacts on the Ecosystem of the Transgressive Mud Coastal Region of Bight of Benin, Nigeria. In Vegetation Dynamics, Changing Ecosystems and Human Responsibility; IntechOpen: London, UK, 2022. [Google Scholar]
  37. Olorunlana, F.A. State of the environment in the Niger Delta area of Ondo State. Eur. Sci. J. 2013, 9, 351–357. [Google Scholar]
  38. Adediji, A.; Ezenwa, K.O. Geospatial Analysis of Shoreline Dynamics in Ondo State, Nigeria. Ife Res. Publ. Geogr. 2018, 15, 52–62. [Google Scholar]
  39. Dada, O.A.; Agbaje, A.O.; Adesina, R.B.; Asiwaju-Bello, Y.A. Effect of coastal land use change on coastline dynamics along the Nigerian Transgressive Mahin mud coast. Ocean Coast. Manag. 2019, 168, 251–264. [Google Scholar] [CrossRef]
  40. Badru, G.; Odunuga, S.; Omojola, A.; Oladipo, E. Shoreline change analysis in parts of the barrier–lagoon and mud sections of Nigeria coast. J. Extrem. Events 2017, 4, 1850004. [Google Scholar] [CrossRef]
  41. Komolafe, A.A.; Apalara, P.A.; Ibitoye, M.O.; Adebola, A.O.; Olorunfemi, I.E.; Diallo, I. Spatio-temporal analysis of shoreline positional change of Ondo State coastline using remote sensing and GIS: A case study of Ilaje coastline at Ondo State in Nigeria. Earth Syst. Environ. 2021, 6, 281–293. [Google Scholar] [CrossRef]
  42. Daramola, S.; Li, H.; Omonigbehin, O.; Faruwa, A.; Gong, Z. Recent retreat and flood dominant areas along the muddy Mahin coastline of Ilaje, Nigeria. Reg. Stud. Mar. Sci. 2022, 52, 102272. [Google Scholar] [CrossRef]
  43. Popoola, O. Spatio-Temporal Assessment of Shoreline Changes and Management of the Transgressive Mud Coast, Nigeria. Eur. Sci. J. ESJ 2022, 18, 20–99. [Google Scholar] [CrossRef]
  44. Mafimisebi, O.P.; Ogbonna, O.C. Environmental risk of gas flaring in Nigeria: Lessons from Chevron Nigeria and Ilaje crisis. J. Econ. Sustain. Dev. 2016, 7, 180–204. [Google Scholar]
  45. Department of Research and Statistics, Ministry of Economic Planning and Budget. Facts and Figures on Ondo State; Department of Research and Statistics, Ministry of Economic Planning and Budget: Akure, Nigeria, 2010.
  46. Sexton, W.J.; Murday, M. The morphology and sediment character of the coastline of Nigeria: The Niger Delta. J. Coast. Res. 1994, 5, 959–977. [Google Scholar]
  47. Awosika, L.F.; Folorunsho, R.; Dublin Green, C.O.; Imevbore, V.O. Chevron Nigeria Limited Report on Review of the Coastal Erosion at Awoye and Molume Area of Ondo State; Chevron Nigeria Ltd.: Lagos, Nigeria, 2001. [Google Scholar]
  48. Isebor, C.E.; Awosika, L.E. Conservation et utilisation rationnelle des forets de Mangrove de l’Amdrique latine et de l’Afrique. In Les Ressources de la Mangrove au Nigeria: Son Etat et sa Mise en Valeur; UNESCO-COMAR: Paris, France, 1993; pp. 169–188. [Google Scholar]
  49. Fasona, M.; Omojola, A.; Soneye, A. A Study of land degradation pattern in the Mahin Mud-beach Coast of Southwest Nigeria with spatial-statistical modelling geostatistics. J. Geogr. Geol. 2011, 3, 141–159. [Google Scholar] [CrossRef]
  50. Thieler, E.R.; Himmelstoss, E.A.; Zichichi, J.L.; Ergul, A. Digital Shoreline Analysis System (DSAS) version 4.0—An ArcGIS Extension for Calculating Shoreline Change. In U.S. Geological Survey Open-File Report No. 2008-1278; U.S. Geological Survey: Reston, VA, USA, 2009. [Google Scholar]
  51. Gentz, A.S.; Fletcher, C.H.; Dunn, R.A.; Frazer, L.N.; Rooney, J.J. The predictive accuracy of shoreline change rate methods and alongshore beach variation on Maui, Hawaii. J. Coast. Res. 2007, 23, 87–105. [Google Scholar] [CrossRef]
  52. Dolan, R.; Fenster, M.S.; Holme, S.J. Temporal analysis of shoreline recession and accretion. J. Coast. Res. 1991, 7, 723–744. [Google Scholar]
  53. Terrano, J.F.; Flocks, J.G.; Smith, K.E.L. Analysis of shoreline and geomorphic change for Breton Island, Louisiana, from 1869 to 2014. In U.S. Geological Survey Open-File Report. No. 2016–1039; U.S. Geological Survey: Reston, VA, USA, 2016; p. 34. [Google Scholar] [CrossRef]
  54. Douglas, B.C.; Crowell, M. Long-term shoreline position prediction and error propagation. J. Coast. Res. 2000, 16, 145–152. [Google Scholar]
  55. Jackson, C.W.; Alexander, C.R.; Bush, D.M. Application of the AMBURR package for spatio-temporal analysis of shoreline change: Jekyll Island, Georgia, USA. Comput. Geosci. 2012, 41, 199–207. [Google Scholar] [CrossRef]
  56. Perez-Alberti, A.; Pires, A.; Freitas, L.; Rodrigues, C.; Chamine, H.I. GIS mapping and shoreline change analysis along the rocky coast of Galicia (NW Spain): Preliminary approach, Trabalho apresentado em Coastal Management Congress, Innovative Coastal Zone Management: Sustainable Engineering for a Dynamic Coast. In Proceedings of the Coastal Management Congress, Innovative Coastal Zone Management: Sustainable Engineering for a Dynamic Coast, Belfast, Ireland, 15–16 November 2011; ICE: St. Detroit, MI, USA, 2011. 10p. [Google Scholar]
  57. Natesan, U.; Thulasiraman, N.; Deepthi, K.; Kathiravan, K. Shoreline change analysis of Vedaranyam coast, Tamil Nadu, India. Environ. Monit. Assess. 2012, 185, 5099–5109. [Google Scholar] [CrossRef]
  58. FIJ. Foundation for Investigative Journalism. 2021. Available online: https://fij.ng/article/investigation-ilaje-coastline-residents-die-so-nigeria-may-survive/ (accessed on 7 July 2023).
Figure 1. Location map of the study area.
Jmse 12 00018 g001
Figure 2. Failed jute tube on the sea shore of Ayetoro.
Jmse 12 00018 g002
Figure 3. Map showing communities vulnerable to erosion. Failed jute tube on the sea shore of Ayetoro.
Jmse 12 00018 g003
Figure 4. Shoreline change using EPR model from 1986 to 1999.
Jmse 12 00018 g004
Figure 5. Shoreline change using EPR model from 1999 to 2010.
Jmse 12 00018 g005
Figure 6. Shoreline change using EPR model from 2010 to 2020.
Jmse 12 00018 g006
Figure 7. Shoreline change using LRR model from 1986 to 2020 (a,b).
Jmse 12 00018 g007aJmse 12 00018 g007b
Figure 8. Coastal erosion along Ayetoro shoreline between 2008 and 2023: (a) Erosion along Ayetoro shoreline in 2008. (b) Erosion along Ayetoro shoreline in 2014. (c) Erosion along Ayetoro shoreline in 2018. (d) Erosion trend along Ayetoro shoreline 2023.
Jmse 12 00018 g008aJmse 12 00018 g008b
Figure 9. Ayetoro shoreline evolution (2008–2018). The map illustrates the dynamic changes in Ayetoro’s shorelines over the decade. It presents shifts in shoreline positions and provides an estimation of the eroded distance along the coast.
Jmse 12 00018 g009
Figure 10. Illustrates the evolving shorelines of Ayetoro from March 2008 to February 2023. The map visually represents the dynamic shifts in shoreline positions, with buildings impacted by these changes between 2018 and 2023 highlighted in red.
Jmse 12 00018 g010
Figure 11. (ac) present sections depicting the extent of damage and washed-away buildings, showcasing the situation of Ayetoro community as of 2022. The mangrove forests have been entirely obliterated. These images visually portray the effects on the community, offering a tangible representation of the impacted buildings up to the specified year. (d,e) present aerial views of Ayetoro directly facing the Atlantic Ocean, captured in June 2022.
Jmse 12 00018 g011
Table 1. Details of satellite images used in the study.
S/NDataAcquisition DateResolution in MetersData Source
1.Landsat 5 12 December 198630https://developers.google.com/earth-engine/datasets/catalog/landsat-7
2. Landsat 7 11 December 199930https://developers.google.com/earth-engine/datasets/catalog/landsat-7
3.Landsat 7 01 December 201030https://developers.google.com/earth-engine/datasets/catalog/landsat-7
4. Landsat 8 03 December 202030https://developers.google.com/earth-engine/datasets/catalog/landsat-7
Table 2. Shoreline change rates in Ilaje according to the EPR and LRR methods.
EPR (m/y) LRR (m/y)
1986–19991999–20102010–20201986–20201986–2020
Total number of transects17061708170817081708
Average rate5.51−6.08−5.12−1.36−1.66
Maximum value erosion−39.7−23.91−29.97−15.33−15.2
Average of all erosional rates−8.15−10.42−10.27−6.62−6.9
Erosion transects, number (%)60.1476.8165.1662.5476.23
Accretion transects, number (%)39.8623.1934.8437.4623.77
Average of all accretional rates26.128.34.58.37.05
Table 3. Changes in Ayetoro community’s coastal landscape (2008–2023).
YearBuildings SubmergedLand Area Submerged (sqm)Encroachment Length (m)
20087N/AN/A
Mar 2008–Feb 20141177,822.33171.31
Mar 2014–Feb 201864129,882.08084.19
Mar 2018–Feb 2023282202,402.715145.62
Disclaimer/Publisher’s Note: The statements, opinions and data contained in all publications are solely those of the individual author(s) and contributor(s) and not of MDPI and/or the editor(s). MDPI and/or the editor(s) disclaim responsibility for any injury to people or property resulting from any ideas, methods, instructions or products referred to in the content.

