Article

Study on the Sand-Scouring Characteristics of Pulsed Submerged Jets Based on Experiments and Numerical Methods

1
International Shipping Research Institute, GongQing Institute of Science and Technology, Jiujiang 332020, China
2
School of Aerospace and Mechanical Engineering/Flight College, Changzhou Institute of Technology, Changzhou 213032, China
3
College of Hydraulic Science and Engineering, Yangzhou University, Yangzhou 225009, China
4
Department of Energy and Power Engineering, Tsinghua University, Beijing 100084, China
5
National Research Center of Pumps, Jiangsu University, Zhenjiang 212013, China
6
State Key Laboratory of Ecohydraulics in Northwest Arid Region, Xi’an University of Technology, Xi’an 710048, China
*
Authors to whom correspondence should be addressed.
J. Mar. Sci. Eng. 2024, 12(1), 57; https://doi.org/10.3390/jmse12010057
Submission received: 1 November 2023 / Revised: 4 December 2023 / Accepted: 13 December 2023 / Published: 26 December 2023
(This article belongs to the Special Issue Computational Fluid Mechanics II)

Abstract

:
Water-jet-scouring technology finds extensive applications in various fields, including marine engineering. In this study, the pulse characteristics are introduced on the basis of jet-scouring research, and the sand-scouring characteristics of a pulsed jet under different Reynolds numbers and the impact distances are deeply investigated using Flow-3D v11.2. The primary emphasis is on the comprehensive analysis of the unsteady flow structure within the scouring process, the impulse characteristics, and the geometric properties of the resulting scouring pit. The results show that both the radius and depth of the scour pit show a good linear correlation with the jet-flow rate. The concentration of suspended sediment showed an increasing and then decreasing trend with impinging distance. The study not only helps to enrich the traditional theory of jet scouring, but also provides useful guidance for engineering applications, which have certain theoretical and practical significance.

1. Introduction

Water-jet-scouring technology is widely used in marine engineering and its related ancillary fields, such as in the maintenance and repair of marine structures, extraction of deep-sea resources, dredging works, seabed geological research, and cleaning and maintenance of ships. The jet flow establishes a velocity shear layer at its boundary, leading to the destabilization and subsequent generation of vortices. These vortices undergo continuous deformation, rupture, merging, and evolution into turbulence during their movement. Consequently, they entrain surrounding fluid into the jet region, facilitating the transfer of momentum, heat, and mass between the jet and its ambient environment [1,2,3]. Therefore, numerous scholars have carried out detailed studies on the scouring characteristics associated with jets. Chatterjee et al. [4] investigated the local scouring and sediment-transport phenomena due to the formation of horizontal jets during the opening of sluice gates based on experiments, and successfully established empirical expressions for the correlation between the time of reaching the equilibrium stage, the maximum depth of scouring, and the peak of the dune. The important role of jet-diffusion properties in the scouring process was also emphasized. Hoffmans [5] calculated the equilibrium scour process induced using a horizontal jet in the absence of a streambed and used experiments to verify the accuracy of the equations for jet-scour depths in the relevant literature. Luo et al. [6] investigated the induction mechanism of scour in planar jets through particle-image velocimetry (PIV). It was found that the initial stage of scour was dominated by wall shear, while the later stages of the scour process were mainly influenced by the turbulent vortex. Canepa et al. [7] investigated the scour characteristics of gas-doped water jets and found that gas-doped jets significantly reduce the scour depth if the velocity of the mixture is used as a reference.
Pulsed jets introduce pulsation, resulting in a water-hammer effect, as well as increased diffusion and coil suction rates. These factors contribute to a more intricate interaction between the pulsed jet and the adjacent wall. The process of generation, development and evolution of its internal vortex structure as well as the interaction between the vortex structure and the surrounding ambient fluid and solid wall have changed significantly [8,9]. At this juncture, researchers in this domain have undertaken investigations centered on the utilization of pulsed jets. Coussement et al. [10] investigated the flow characteristics of a pulsed jet in a cross-flow environment based on Large Eddy Simulation (LES). A new approach to characterize mixing was introduced, which successfully explains and quantifies the complex mixing process between the pulsating jet and the ambient fluid. Bi et al. [11] investigated the thrust of a deformable body generated through a pulsed jet based on an axisymmetric immersed-boundary model. The numerical results show that in addition to the momentum flux of the jet, the jet acceleration is also an important source of thrust generation. Zhang et al. [12] studied the complex unsteady flow characteristics of a pulsed jet impinging on a rotating wall using numerical methods, and it was found that the impact pressure of the pulsed jet on the wall is greater than that of the continuous jet on the wall for a certain period of time when the water-hammer effect occurs. Rakhsha et al. [13] used experiments and numerical simulations to study the effect of pulsed jets on the flow and heat-transfer characteristics over a heated plane. It was found that the Nussell number increases with increasing pulse frequency and Reynolds number and decreases with increasing impinging distance. It is evident that existing studies predominantly center on the unsteady flow characteristics of pulsed jets and their properties related to heat and mass transfer. Conversely, there is a noticeable dearth of research concerning the scouring attributes of pulsed jets in the available literature.
The pulsed submerged impinging jet represents a complex jet flow with a significant engineering application background and substantial theoretical research value. Exploring the unsteady hydraulic characteristics of pulsed jets can enhance classical impinging jet theory, deepen our comprehension of the jet–wall interaction mechanism, and establish a scientific foundation for addressing engineering-application challenges. Therefore, this paper introduces the pulse characteristics into the impinging jet, and, based on the Flow-3D software, the sand-scouring characteristics of the impinging jet under different Reynolds numbers and impinging distances are deeply investigated. The surface geometry of the scour pit is characterized while obtaining the pulsation characteristics of the unsteady flow structure during sand scouring. This study not only offers a foundation for implementing flow control and enhancing the understanding of unsteady flow characteristics but also furnishes theoretical backing for predicting impact pressure and impact pit formation.

2. Modeling and Numerical Methods

2.1. Model Building

The geometric model consists of a jet pipe, a body of water, a baffle, and a sand bed, as shown in Figure 1. The inner diameter D of the jet pipe is 20 mm, and the length L is set to 50D to ensure that the turbulence inside the pipe is fully developed. H represents the impinging height, and the initial water height (Hw) is 1600 mm. Baffles positioned on both sides serve to maintain a constant water level. The length Ls and thickness Hs of the sand bed are 5000 mm and 160 mm, respectively. It is worth stating that the sand bed is composed of non-cohesive sand. The median grain size dm of the sand is 0.77 mm, the specific gravity Δ is 1.65, and the particle gradation σg is 1.21.

2.2. Numerical Models

In fluid mechanics, the continuity and momentum equations are the basic governing equations [14]:
u A x x + v A x y + w A z z = 0
u t + 1 V F u u x + v u y + w u z = 1 ρ P x + G x + f x
u t + 1 V F u v x + v v y + w v z = 1 ρ P y + G y + f y
u t + 1 V F u w x + v w y + w w z = 1 ρ P z + G z + f z
where u, v, w denote the velocity of the fluid in the x, y, z direction, respectively; Ax, Ay, Az denote the area fraction of the fluid in the x, y, z direction, respectively; VF denotes the volume fraction; P is the pressure exerted on the fluid micrometric elements; Gx, Gy, Gz are the gravitational acceleration in the x, y, z direction, respectively; and fx, fy, fz are the viscous forces in the x, y, z direction, respectively.
In numerical simulations, the selection of a turbulence model significantly influences the accuracy of the calculations. Hence, it is imperative to choose an appropriate turbulence model. Given that this paper primarily deals with fully developed circular tube turbulence, which entails velocity and momentum coupling among fluids and features substantial time and spatial scales in the non-constant flow, the RNG k-ε turbulence model [15,16,17] has been chosen for the conclusive numerical simulation work. The RNG model takes into account the effect of eddies on turbulence and improves the accuracy of vortex-flow prediction [18]. Its equations are as follows:
k t + u j k x j = v t u i x j + u j x i u i x j + x j α k v e f f k x j ε
ε t + u j ε x j = c ε 1 ε k v t u i x j + u j x i u i x j + x j α ε v e f f ε x j c ε 2 ε 2 k c μ η 3 1 η η 0 ε 2 1 + c 3 η 3 k
v e f f = v t 1 + c μ k μ ε 2
η = u i x j + u j x i u i x j k ε
where vt is the eddy viscosity coefficient; μ is the kinetic viscosity coefficient; the empirical constants cε1 and cε2 have values of 1.42 and 1.68; c3 = 0.012; η0 = 4.38; cμ = 0.085; and the values of Prandtl numbers αk and αε corresponding to the turbulent kinetic energy k and the dissipation rate ε are both 0.7194.
The Flow-3D software realizes an accurate description of the sediment movement with the help of an empirical equation model proposed by Mastbergen and Van den Berg [19]. The critical Shields number first needs to be calculated from the Soulsby–Whitehouse equation [20], which is given below:
θ c r = 0.3 1 + 1.2 d * + 0.055 1 exp ( 0.02 d * ) ,   d * = d ρ f ρ i ρ f g μ f 2 1 3
where ρi is the sediment density, ρf is the fluid density, di is the sediment diameter, μf is the hydrodynamic viscosity, and ‖g‖ is the magnitude of gravitational acceleration.
Under the action of the jet, part of the deposited sediment will be disturbed to show a suspended state and it will continue to move under the carrying of the fluid. The uplifting velocities of entrained sediment ulift,i and usetting,i are calculated as follows:
u l i f t , i = α i n s d * 0.3 θ i θ c r , i 1.5 g d i ρ i ρ f ρ f
u s e t t i n g , i = v f d i 10.36 2 + 1.049 d * 3 0.5 10.36
where αi is the sediment carryover coefficient with a recommended value of 0.018 [19]; ns is the normal direction of the bed; and vf is the kinematic viscosity of the liquid.

2.3. Grid-Independent Analysis

It is well known that the number of the grid is closely related to the accuracy and cost of the numerical calculation. In order to investigate the optimal number of grids suitable for this numerical simulation, the scour depth Ht of the sand bed at H/D = 2 and inlet flow velocity Vb = 1.485 m/s is chosen as the monitoring parameter for the grid-independent analysis. Five sets of grid schemes with increasing numbers are set, and the results of the independence analysis are shown in Figure 2. From the figure, it can be seen that the depth of the scour pit Ht increases gradually with the encryption of the grid. When the grid is encrypted to Scheme 4, Ht almost no longer increases. It is considered that the number of meshes at this time can already meet the accuracy requirements of numerical calculations. Therefore, the grid number scheme in Scheme 4 is selected for the subsequent numerical simulation study, and the grid number is 43,825.

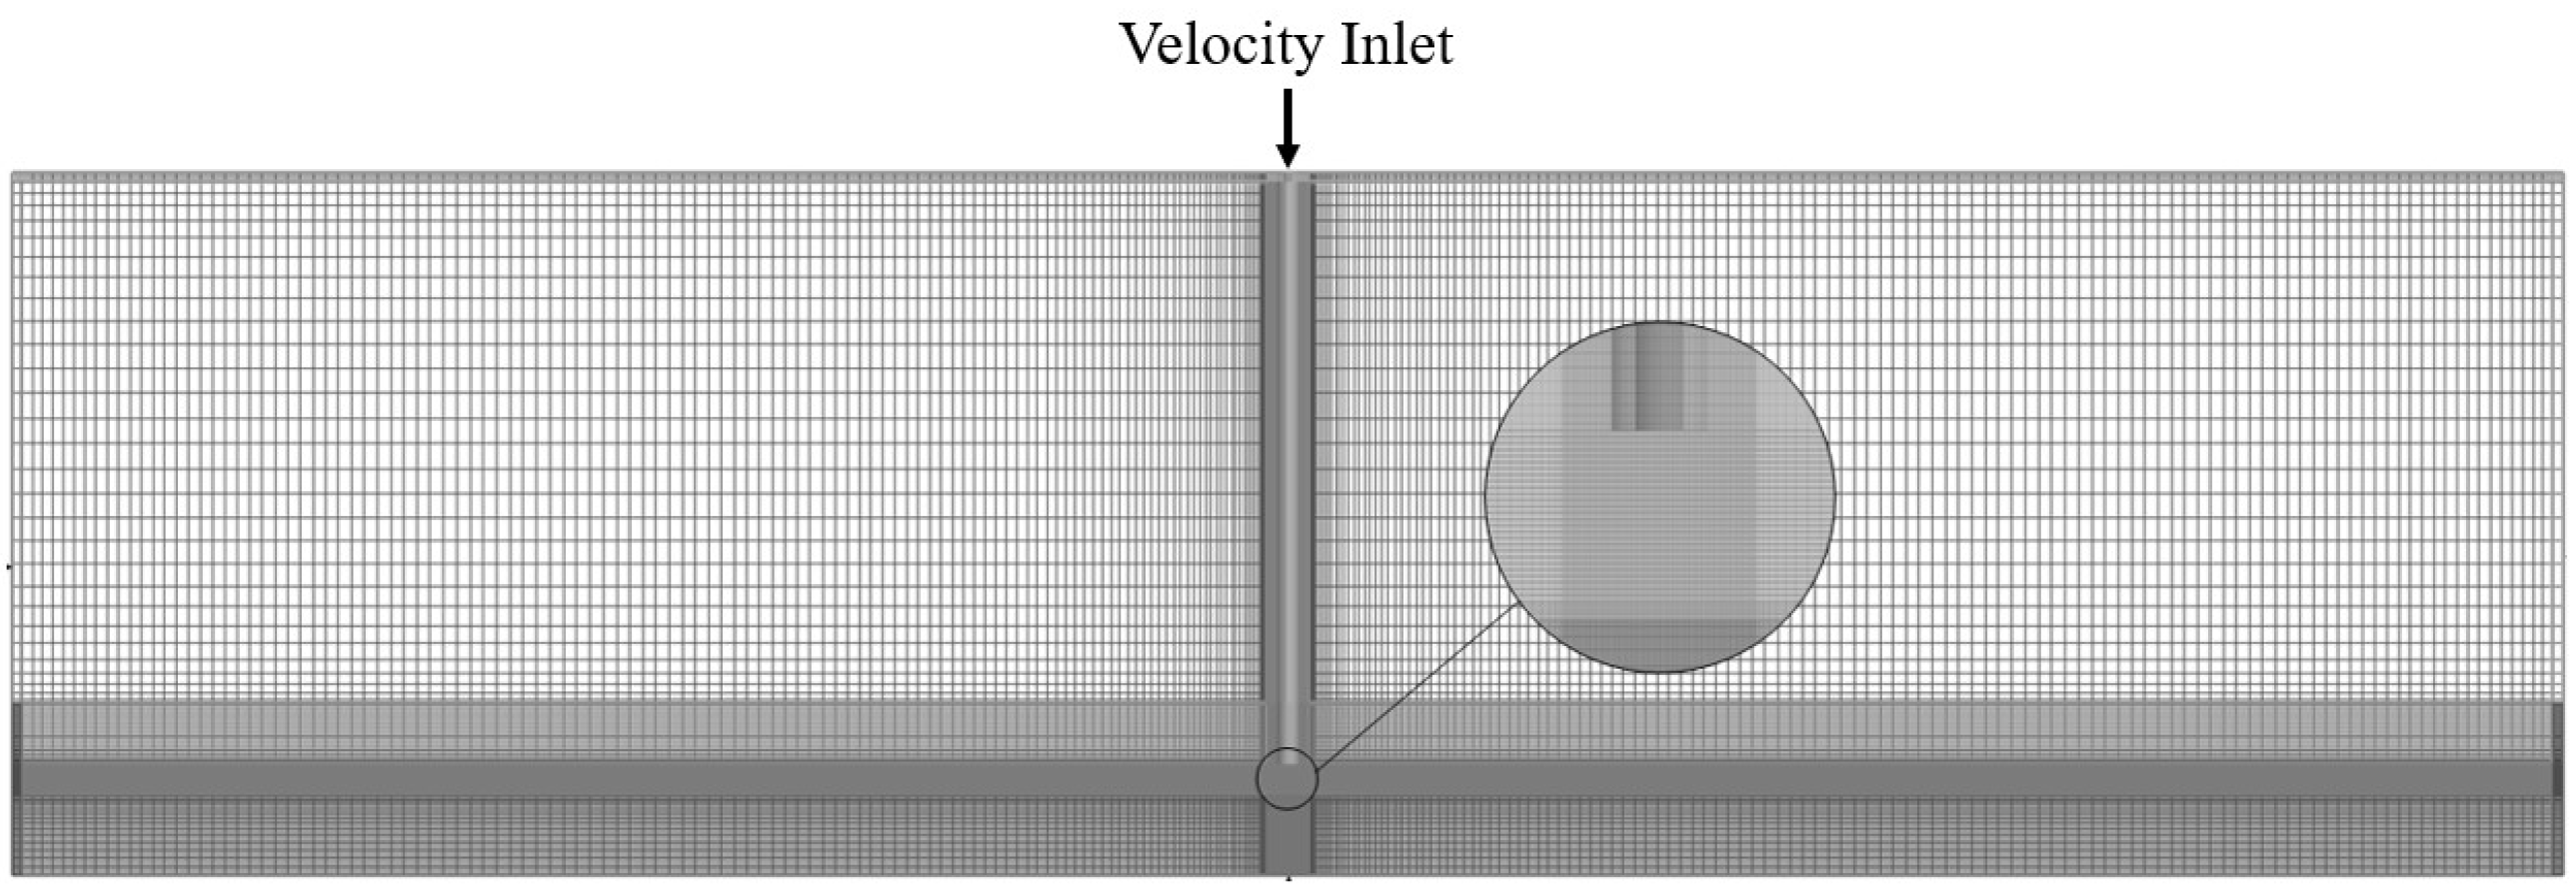
2.4. Grid Delineation and Boundary Conditions

Within the Flow-3D software, a grid block is used that covers the entire 2D computational area as shown in Figure 1. Given the large aspect ratio of the jet pipe and the significant turbulent coupling between the fluid and sediment near the pipe outlet, grid refinement is implemented in the vicinity of the pipe outlet. The grid-encrypted area is mainly the area between the jet outlet and the sand bed, as shown in Figure 3. In addition, a mesh node is provided at the baffle on each side of the computational domain to ensure proper identification of the fluid boundary during numerical simulations. The upper boundary of the computational domain is defined as a velocity inlet, where the velocity magnitude is denoted as Vb, and the direction is oriented vertically downward. The lower boundary is the wall and no fluid or sediment flux is allowed. The two side boundaries are specified as pressure boundaries and the pressure is set to be 0 Pa. Based on the requirement of 2D numerical simulation, the boundaries of the front and rear sides are set as symmetric boundaries, both with one grid node. At the same time, the boundary-layer mesh near the pipe and the sand bed is encrypted accordingly. y+ is set at around 30 to ensure that the first grid nodes are in the turbulence core region, so as to ensure that the RNG k-ε turbulence model is perfectly adapted to the boundary conditions. Considering that the velocity strength and pressure gradient of the fluid around the baffle are small and it is not an observation area, the encryption of the boundary-layer grid is not performed for the time being.
Numerical simulations are performed using the discrete control equations of the control volume method, with the diffusion term of the equations in the central difference format and the convection term in the second-order upwind format, and the equations are solved using a coupled algorithm. The standard wall equations are used, and the no-slip option in the wall shear boundary conditions is checked. In the non-stationary numerical simulation, the time step is set to 0.05 s. In order to ensure the accuracy of the numerical calculations, each time step is iterated 100 times, and the convergence accuracy is set to 10−5.
In this paper, the continuous jet is periodically truncated to form a blocking pulsed jet. The pulse period of its pulse velocity can be expressed as T = tj + t0 (tj and t0 are the jet time and truncation time, respectively, taking the value of 0.5 s), and the inlet flow rate of the jet pipe is Vb during the jet time period, while the inlet flow rate of the jet pipe is 0 during the truncation time period, as shown in Figure 4.

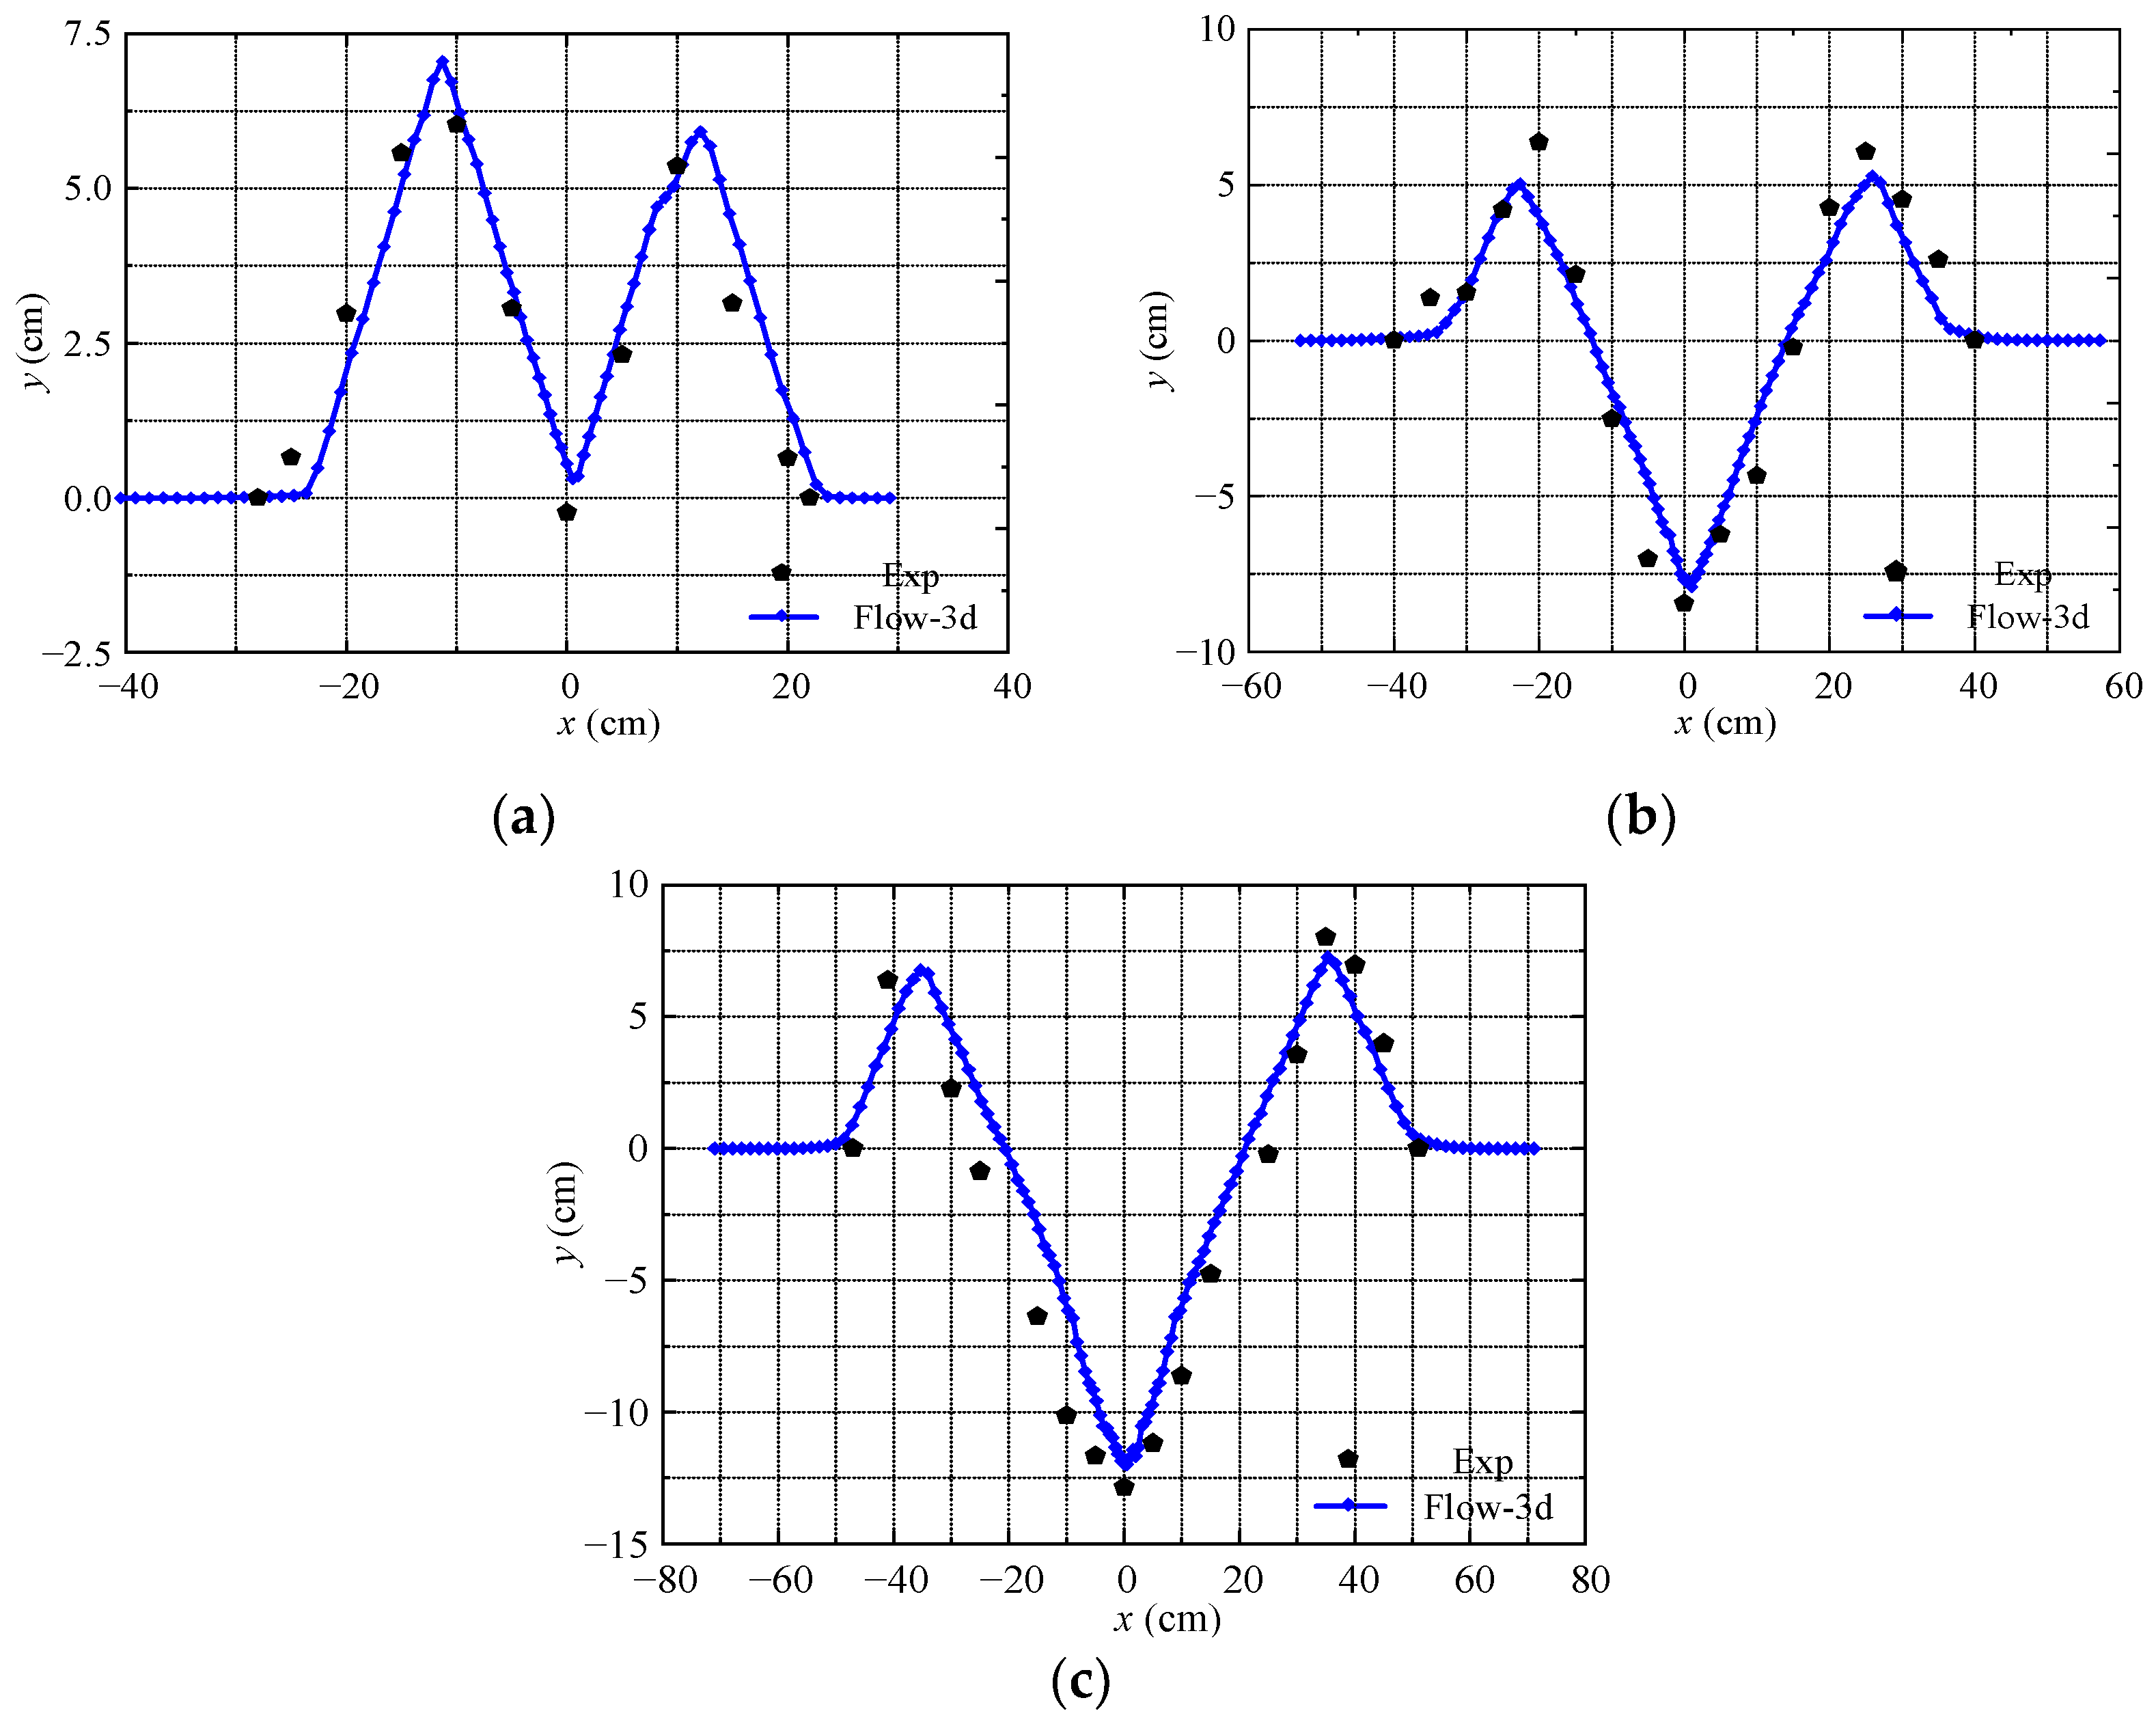
3. Experimental Validation

To validate the accuracy of the numerical simulations, an experimental investigation of jet impingement on sediment is conducted. The experimental setup is shown in Figure 5. The parameters characterizing the sediment in the experiments are guaranteed to be the same as the settings in the numerical simulations. Specifically, non-cohesive sand is used with a median particle size dm of 0.77 mm, a specific gravity Δ of 1.65, and a particle gradation σg of 1.21. An angle plate is employed to control the impinging angle of the jet pipe, a COMS camera captures images of the pit, and a laser range finder is utilized for precise measurements of pit depth and dune height. In order to quantitatively describe the effect of jet impingement, the depth of the sand pit and the height of the dune are defined as d and h, respectively.
Figure 6 compares the stabilized morphology of the sand bed formed under the scouring of the jet for an impinging distance H/D of two in the numerical simulation and the experiment. The inlet flow velocities Vb of the jet pipe are 0.424 m/s, 0.955 m/s, and 1.485 m/s, respectively. As depicted in the figure, the ultimate scouring morphology of the sand bed, as obtained through numerical simulation, closely aligns with the experimental results. This alignment underscores the strong agreement between the numerical simulation and the experimental data. Nevertheless, it must be recognized that the final scour depths of the numerical simulations are all slightly smaller than the experimental values under the same conditions. The possible reason for this is the wall effect, i.e., the porosity of the actual sand bed is not homogeneous, with the upper sand layer being slightly more porous [21], whereas the porosity of the sand bed in the numerical simulation strictly follows the set value. Given that the accuracy of numerical calculations is subject to various influencing factors, and considering that the numerical solution inherently involves an approximation process, the numerical methods employed in this study can be deemed both accurate and dependable.

4. Results and Discussion

There are many factors that affect the performance of jet scouring, such as the shape of the nozzle, the size of the nozzle, the inlet flow rate of the jet pipe, the impinging distance, and the sediment parameters. Changes in any one of these factors can have a large effect on the parameters that measure the scouring performance of the jet, such as the depth of the scouring pit |ymin|, the height of the dune ymax, the radius of the scouring pit R. In this paper, the effects of the inlet velocity Vb and impinging distance H/D on the scouring performance of the jet pipe are investigated. Seven working conditions with inlet velocity Vb of 0.424 m/s, 0.690 m/s, 0.955 m/s, 1.220 m/s, 1.485 m/s, 1.751 m/s and 2.016 m/s are calculated for different impinging distances H/D (H/D = 2, 4, 6 and 8). The corresponding Reynolds numbers Re are 8404, 13,657, 18,910, 24,162, 29,415, 34,667, and 39,920, respectively.

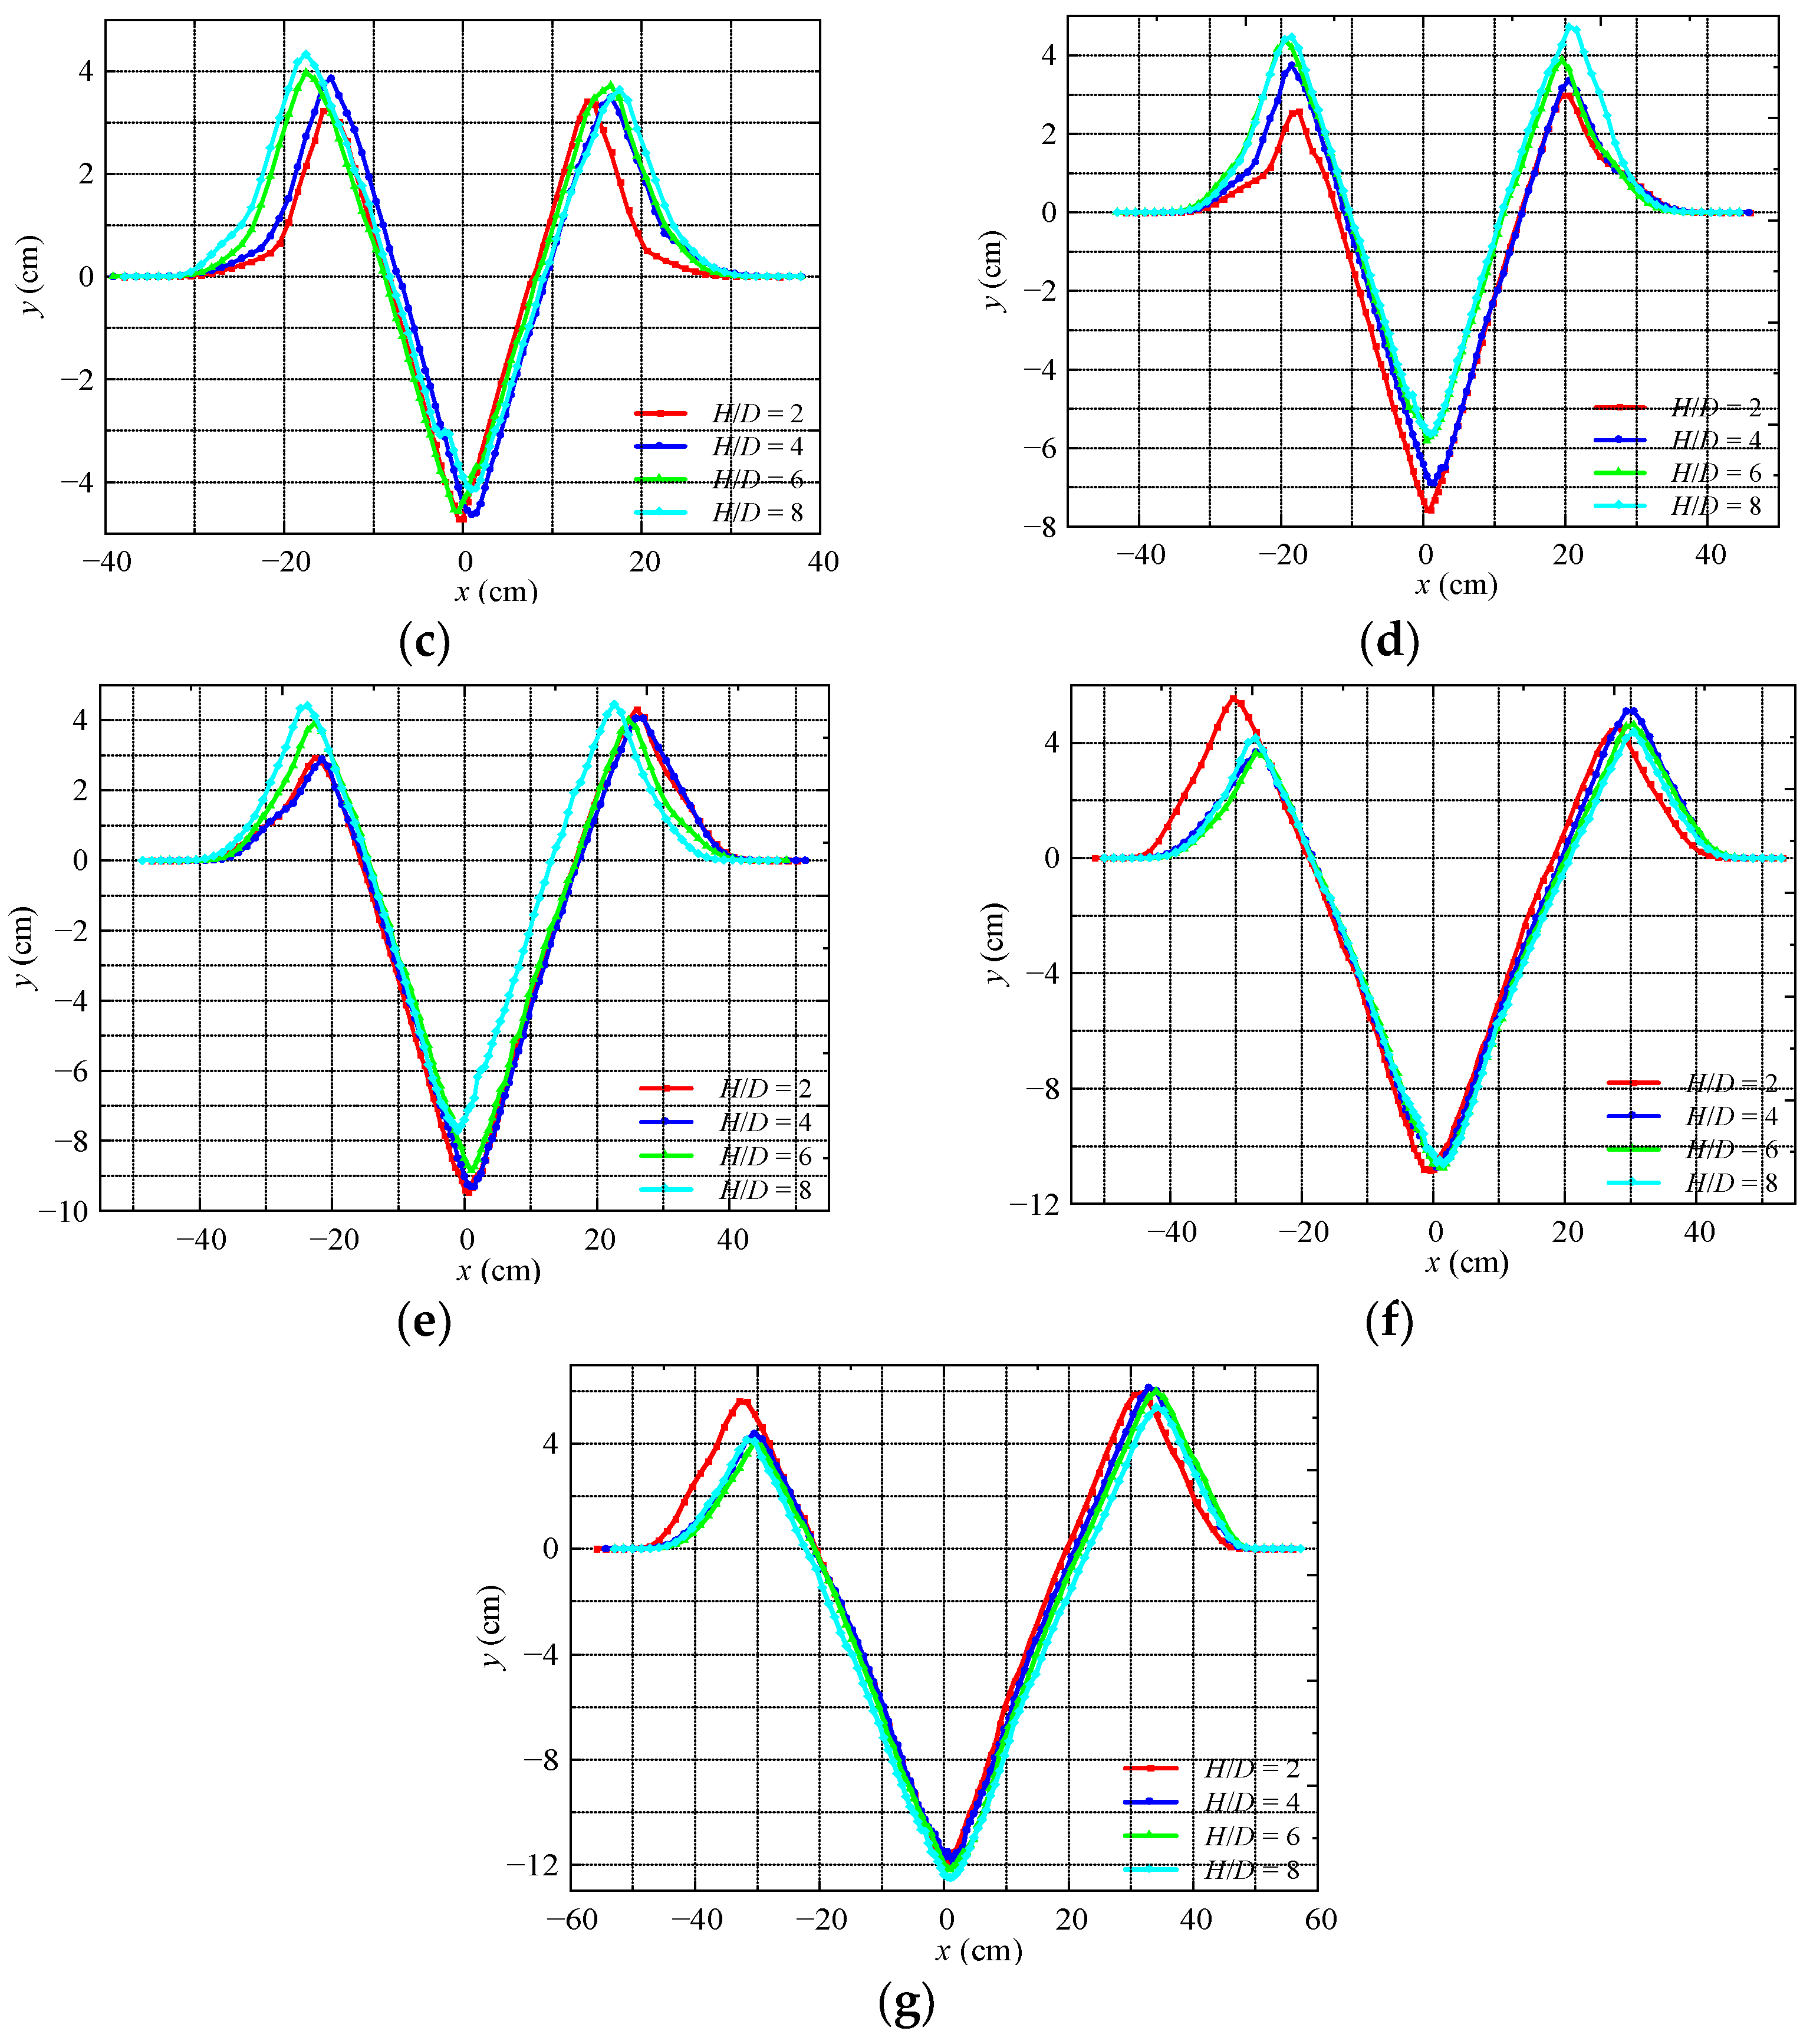
4.1. Characterization of Pit at Different Impinging Distances

After the jet impinges on the sand bed for a sustained period of time, the shape of the sand bed will no longer change and remain stable. Figure 7 shows the stable bed morphology formed by the jet impinging on the sand bed with different velocities Vb, and at different impinging distances H/D. The x-axis is at the axial position of the jet pipe, and the y-axis is the initial horizontal plane of the sand bed. As can be seen from the figure, under the condition of Vb = 0.424 m/s, the pit depths |ymin| corresponding to impinging distances H/D of two and four are basically equal. However, when H/D is increased to six, |ymin| becomes significantly smaller, and when H/D is eight, |ymin| increases again. Under the Vb = 0.690 m/s condition, the effect of H/D on the scour pit depth |ymin| is small, and its size basically stays around 3.5 cm. Under the Vb = 0.955 m/s condition, the pit depth corresponding to H/D = eight is slightly smaller than the pit depths at other impinging distances, and the magnitude of |ymin| is basically maintained near 4.6 cm. Under the Vb = 1.220 m/s condition, the change of the scouring pit depth |ymin| with the impinging distance H/D starts to be gradually significant, especially the scouring pit depth |ymin| which decreases by about 1.7 cm when the size of H/D increases from two to six. Under the condition of Vb = 1.220 m/s, the larger the H/D, the smaller the pit depth |ymin|, especially when the H/D is eight, the pit depth is obviously larger than the pit depth at other impinging distances. The corresponding pit depths |ymin| for Vb of 1.751 m/s and 2.016 m/s remain basically unchanged. From the above analysis, it can be seen that under the same Reynolds number conditions to some extent the impinging distance has a very limited effect on the depth of the pit |ymin|. When the impinging distance increases, the depth of the pit begins to decrease. This can be attributed to the fact that the increased distance results in the jet encountering the initial static water resistance over a longer duration, leading to a greater dissipation of kinetic energy and a subsequent reduction in the impinging force of the jet.
The depth of the scouring pit serves as a critical parameter for assessing the impact of jet impingement on sand beds, just as the height of the dune represents a key indicator for evaluating the effectiveness of this process. In Figure 7a, it can be seen that the dune height ymax increases synchronously with the increase of the impinging distance H/D at Vb = 0.424 m/s. When Vb ≥ 0.955 m/s, the dune height ymax no longer grows significantly with the increase of impinging distance H/D. To further explore the relationship between dune height and impinging distance, Figure 8 is plotted with the impinging distance as the horizontal coordinate and the dune heights on either side as the vertical coordinate. From the figure, it can be seen that when 0.424 m/s ≤ Vb ≤ 1.485 m/s, the dune height ymax increases with the increase of the impinging distance H/D, and the dune height ymax starts to decrease with the increase of the impinging distance H/D when Vb > 1.485 m/s. The reason behind the aforementioned phenomenon is that when the inlet velocity Vb of the jet pipe is low, suspended sediment tends to displace towards the sides of the dune, causing some of the sediment to accumulate on the dune and thereby increase its height. When Vb ≥ 1.485 m/s, due to the enhanced impact force, most of the suspended sediment no longer moves and accumulates near the dunes and sand pits, and it starts to move on the outside of the dunes, causing the dune height to decrease.
In order to clarify the relationship between the pit radius R and the impinging distance H/D, the relationship is given in Figure 9. From the figure, it can be seen that when 0.424 ≤ Vb ≤ 0.690, the increase of impinging distance H/D has basically no effect on the radius R of the pit, and its magnitude always stays near 13 cm. As the inlet velocity Vb of the jet pipe increases (1.220 ≤ Vb ≤ 1.485), the impact of the pulsed jet intensifies. Consequently, the suspended sediment is propelled towards the sides of the sand pit; although, it has not reached the dune and the area beyond it. Instead, a substantial amount of suspended sediment settles within the sand pit on both sides. Simultaneously, as the impact distance increases, the reach of jet impact and the turbulence induced by the jet expand, leading to enhanced sediment transport on both sides of the sand pit. This ultimately results in a reduction in the radius of the scouring pit as the impinging distance increases.

4.2. Characterization of Piting at Different Reynolds Numbers

Figure 10 depicts the stabilized morphology of the sand pit resulting from the influence of jets with varying Reynolds numbers. Under the conditions of H/D = two and four, the inlet velocity Vb of the jet pipe is 0.424 m/s and 0.690 m/s, and the depth of the pit |ymin| is basically equal, which indicates that the impact of the jet on the sand bed at this time is small, and the sediment is only transported and circulated in the sand pit. When Vb ≥ 0.955, the depth of the pit |ymin| increases significantly with the increase of Vb. Under the condition of H/D = 6, the depth of the pit, denoted as |ymin|, ceases to remain constant when Vb is less than or equal to 0.690 m/s. However, the disparity between the two measurements remains relatively small, suggesting that the impact force and turbulence of the jet are already capable of transporting sediment from the bottom of the pit to its flanks when Vb ≤ 0.690 m/s. In the H/D = 8 condition, due to the impinging distance H/D is larger, and when the velocity of the jet pipe is small (Vb ≤ 0.690 m/s), the kinetic energy of the jet is continuously exchanged with the static water body and then reduced, making its impact force reduce, and the sediment can only be transported and circulated at the bottom of the sand pit. To further investigate the effect of the Reynolds number of the jet on the depth of the pit |ymin|, Figure 11 is plotted with the jet velocity Vb as the horizontal coordinate and the depth of the pit |ymin| as the vertical coordinate. From the figure, it is evident that there exists a strong linear relationship between the depth of the scouring pit and the jet velocity. The data points in the figure can be fitted to establish the following relationship between the depth of the scouring pit and the jet velocity:
y min = 6.10   V b 0.36

4.3. Characterization of Pits with Different Impinging Times

Figure 12 illustrates the deformation of the sand bed caused by the impact of the pulsed jet over a time range from 0.75 s to 3.5 s (with intervals of 0.25 s). When the jet velocity Vb is 0.424 m/s, within the initial 0.75 s of jet initiation, the impact of the pulsed jet leads to noticeable deformation of the sand pit and dune, with their fundamental shapes taking form. The depth of the pit, denoted as |ymin|, continuously increases from 0.75 s to 2 s, eventually stabilizing around 2.75 s. By the onset of the pulsed jet, the dune has already assumed a fundamental profile, and its maximum height, represented as ymax, exhibits minimal variation over time, remaining relatively constant.

5. Conclusions

In this paper, a numerical computational study is conducted to examine the characteristics of sand-bed impingement using obstructing pulsed jets. A comprehensive analysis is undertaken, encompassing impingement-pit depth, dune height, and impingement-pit radius. The following conclusions are drawn:
  • Under consistent jet-velocity conditions, the impingement distance (H/D) has minimal impact on the depth of the scouring pit within the range of 2 ≤ H/D ≤ 6. However, beyond this range (H/D > 6), increased impingement distance leads to heightened jet-energy dissipation, resulting in a weakened impact force and a subsequent reduction in pit depth. Additionally, for lower jet velocities, impinging-distance variations have negligible effects on pit radius, while higher jet velocities induce a decrease in pit radius with an increase in impinging distance.
  • The study establishes strong linear relationships between both the radius and depth of the scouring pit and the jet velocity. However, the relationship between dune height and pulsed-jet velocity is characterized by randomness and uncertainty. The dynamics of sediment transport contribute to the lack of symmetry in the stable configuration of the sand pit concerning the jet-pipe axis. Furthermore, the relationship between dune height and pulsed-jet velocity exhibits transient characteristics, highlighting the complex nature of these interactions.
  • The numerical computational analysis emphasizes the transient characteristics of the sand-pit configuration due to sediment-transport dynamics. The stable state of the pit does not assume symmetry with the jet pipe as the axis, introducing a level of asymmetry in the system. This asymmetry is crucial in understanding the complex behavior of the sand-bed impingement. The findings underscore the need to consider dynamic and transient factors when studying the impact of obstructing pulsed jets on sand-bed characteristics.

Author Contributions

Data curation, H.W. (Hongliang Wang) and C.W.; formal analysis, B.H. and X.J.; writing—original draft preparation, X.J. and S.L.; writing—review and editing, H.W. (Hui Wang) and W.C. All authors have read and agreed to the published version of the manuscript.

Funding

This research was funded by the Science Center for Gas Turbine Project (P2021-A-I-003-002), National Natural Science Foundation of China (No. 52009013, 51979240), China Postdoctoral Science Foundation (No. 2023M732828), Jiangsu Province Key R&D Program (No. BE2020330), and the Open Research Foundation of GongQing Institute of Science and Technology.

Institutional Review Board Statement

Not applicable.

Informed Consent Statement

Not applicable.

Data Availability Statement

Data are contained within the article.

Conflicts of Interest

The authors declare no conflict of interest.

References

  1. Wang, C.; Wang, X.; Shi, W.; Lu, W.; Tan, S.K.; Zhou, L. Experimental investigation on impingement of a submerged circular water jet at varying impinging angles and Reynolds numbers. Exp. Therm. Fluid Sci. 2017, 89, 189–198. [Google Scholar] [CrossRef]
  2. Hu, B.; Yao, Y.; Wang, M.; Wang, C.; Liu, Y. Flow and Performance of the Disk Cavity of a Marine Gas Turbine at Varying Nozzle Pressure and Low Rotation Speeds: A Numerical Investigation. Machines 2023, 11, 68. [Google Scholar] [CrossRef]
  3. Yu, H.; Wang, C.; Li, G.; Wang, H.; Yang, Y.; Wu, S.; Cao, W.; Li, S. Steady and Unsteady Flow Characteristics inside Short Jet Self-Priming Pump. Sustainability 2023, 15, 13643. [Google Scholar] [CrossRef]
  4. Chatterjee, S.S.; Ghosh, S.N.; Chatterjee, M. Local scour due to submerged horizontal jet. J. Hydraul. Eng. 1994, 120, 973–992. [Google Scholar] [CrossRef]
  5. Hoffmans, G.J. Jet scour in equilibrium phase. J. Hydraul. Eng. 1998, 124, 430–437. [Google Scholar] [CrossRef]
  6. Luo, A.; Cheng, N.-S.; Lu, Y.; Wei, M. Characteristics of Initial Development of Plane Jet Scour. J. Hydraul. Eng. 2023, 149, 06023004. [Google Scholar] [CrossRef]
  7. Canepa, S.; Hager, W.H. Effect of jet air content on plunge pool scour. J. Hydraul. Eng. 2003, 129, 358–365. [Google Scholar] [CrossRef]
  8. Krueger, P.S. Vortex ring velocity and minimum separation in an infinite train of vortex rings generated by a fully pulsed jet. Theor. Comput. Fluid Dyn. 2010, 24, 291–297. [Google Scholar] [CrossRef]
  9. Zhou, Z.; Ge, Z.; Lu, Y.; Zhang, X. Experimental study on characteristics of self-excited oscillation pulsed water jet. J. Vibroeng. 2017, 19, 1345–1357. [Google Scholar] [CrossRef]
  10. Coussement, A.; Gicquel, O.; Degrez, G. Large eddy simulation of a pulsed jet in cross-flow. J. Fluid Mech. 2012, 695, 1–34. [Google Scholar] [CrossRef]
  11. Bi, X.; Zhu, Q. Pulsed-jet propulsion via shape deformation of an axisymmetric swimmer. Phys. Fluids 2020, 32, 081902. [Google Scholar] [CrossRef]
  12. Zhang, L.; Wang, C.; Zhang, Y.; Xiang, W.; He, Z.; Shi, W. Numerical study of coupled flow in blocking pulsed jet impinging on a rotating wall. J. Braz. Soc. Mech. Sci. Eng. 2021, 43, 508. [Google Scholar] [CrossRef]
  13. Rakhsha, S.; Zargarabadi, M.R.; Saedodin, S. Experimental and numerical study of flow and heat transfer from a pulsed jet impinging on a pinned surface. Exp. Heat Transf. 2021, 34, 376–391. [Google Scholar] [CrossRef]
  14. Idowu, I.A.; Adewuyi, J.B. Relationship between continuity and momentum equation in two dimensional flow. Afr. J. Math. Comput. Sci. Res. 2010, 3, 031–035. [Google Scholar]
  15. Kim, B.J.; Hwang, J.H.; Kim, B. FLOW-3D Model Development for the Analysis of the Flow Characteristics of Downstream Hydraulic Structures. Sustainability 2022, 14, 10493. [Google Scholar] [CrossRef]
  16. Jalal, H.K.; Hassan, W.H. Three-Dimensional Numerical Simulation of Local Scour around Circular Bridge Pier Using Flow-3D Software. In Proceedings of the Fourth Scientific Conference for Engineering and Postgraduate Research, Baghdad, Iraq, 16–17 December 2019; IOP Publishing: Bristol, UK, 2020; Volume 745, p. 012150. [Google Scholar]
  17. Nazari-Sharabian, M.; Nazari-Sharabian, A.; Karakouzian, M.; Karami, M. Sacrificial piles as scour countermeasures in river bridges a numerical study using flow-3D. Civ. Eng. J. 2020, 6, 1091–1103. [Google Scholar] [CrossRef]
  18. Abraham, J.; Magi, V. Computations of transient jets: RNG ke model versus standard ke model. SAE Trans. 1997, 106, 1442–1452. [Google Scholar]
  19. Mastbergen, D.R.; Van Den Berg, J.H. Breaching in fine sands and the generation of sustained turbidity currents in submarine canyons. Sedimentology 2003, 50, 625–637. [Google Scholar] [CrossRef]
  20. Soulsby, R. Dynamics of Marine Sands; Thomas Telford Ltd.: London, UK, 1997; ISBN 9780727725844. [Google Scholar]
  21. Atkins, J.E.; Mcbride, E.F. Porosity and packing of holocene river, dune, and beach sands (1). AAPG Bull. 1992, 76, 339–355. [Google Scholar] [CrossRef]
Figure 1. Geometric modeling for sand scouring.
Jmse 12 00057 g001
Figure 2. Grid-independent analysis.
Jmse 12 00057 g002
Figure 3. Computational grid.
Jmse 12 00057 g003
Figure 4. Velocity characteristics of the blocking pulsed jet.
Jmse 12 00057 g004
Figure 5. Schematic diagram of the experimental setup.
Jmse 12 00057 g005
Figure 6. Comparison of sand-scouring experiment and numerical simulation: (a) Vb = 0.424 m/s; (b) Vb = 0.955 m/s; (c) Vb = 1.485 m/s.
Jmse 12 00057 g006
Figure 7. Pit characteristics at different impinging distances: (a) Vb = 0.424 m/s; (b) Vb = 0.690 m/s; (c) Vb = 0.955 m/s; (d) Vb = 1.220 m/s; (e) Vb = 1.485 m/s; (f) Vb = 1.751 m/s; (g) Vb = 2.016 m/s.
Jmse 12 00057 g007aJmse 12 00057 g007b
Figure 8. Variation in the height of dunes on either side of the scour pit with Vb: (a) left; (b) right.
Jmse 12 00057 g008
Figure 9. Relationship between pit size and impinging distance.
Jmse 12 00057 g009
Figure 10. Pit characteristics at different Reynolds numbers: (a) H/D = 2; (b) H/D = 4; (c) H/D = 6; (d) H/D = 8.
Jmse 12 00057 g010
Figure 11. Linear relationship between scouring-pit depth and jet velocity.
Jmse 12 00057 g011
Figure 12. Changes in time scales of pits: (a) Vb = 0.424 m/s; (b) Vb = 0.690 m/s; (c) Vb = 0.955 m/s; (d) Vb = 1.220 m/s; (e) Vb = 1.485 m/s; (f) Vb = 1.751 m/s; (g) Vb = 2.016 m/s.
Jmse 12 00057 g012aJmse 12 00057 g012b
Disclaimer/Publisher’s Note: The statements, opinions and data contained in all publications are solely those of the individual author(s) and contributor(s) and not of MDPI and/or the editor(s). MDPI and/or the editor(s) disclaim responsibility for any injury to people or property resulting from any ideas, methods, instructions or products referred to in the content.

