
Energy-Aware Integrated Scheduling for Quay Crane and IGV in Automated Container Terminal
1
School of Automobile and Traffic Engineering, Wuhan University of Science and Technology, Wuhan 430070, China
2
School of Transportation and Logistics Engineering, Wuhan University of Technology, Wuhan 430063, China
*
Author to whom correspondence should be addressed.
J. Mar. Sci. Eng. 2024, 12(3), 376; https://doi.org/10.3390/jmse12030376
Submission received: 31 December 2023
/
Revised: 19 February 2024
/
Accepted: 19 February 2024
/
Published: 22 February 2024
(This article belongs to the Special Issue Recent Advances in Intelligent Port Logistics)
Abstract
:In this study, we address the integrated scheduling problem involving quay cranes and IGVs in automated terminals. We construct a mixed-integer planning model with the aim of minimizing the total energy consumption during quay crane and IGV operations, focusing on the loading-operation mode. The model considers the impact of the actual stowage of container ships on the loading order. We propose a dimension-by-dimension mutation sparrow search algorithm to optimize the model’s solution quality. Building upon the standard sparrow search algorithm, we incorporate cat mapping to enhance the diversity of the initial sparrow population. To improve global search in the early stage and local search in the later stage of the algorithm, we introduce an adaptive t-distribution mutation strategy. Finally, a total of 12 instances with container counts containing 30, 100, and 250 were designed for experiments to validate the effectiveness of the model and algorithm. The experiments demonstrate that, by appropriately increasing the number of quay cranes, configuring more than two or three IGVs can achieve optimal energy consumption for overall operations.
1. Introduction
1.1. Background and Motivation
In response to economic-development needs, container ships are evolving towards larger scales, resulting in a proportional increase in port throughput [1]. This trend not only raises the bar for the operational efficiency and service levels of modern container terminals but also presents more formidable challenges in resource conservation, energy efficiency, and emissions reduction for sustainable and green operation [2,3]. To enhance operational efficiency and energy conservation, the Port of Rotterdam in the Netherlands pioneered the use of automation equipment in terminal operations as early as 1993. After nearly 30 years of development, terminal production operations widely employ automated loading and unloading equipment, including automated dual-trolley quay crane (AQC), automated guided vehicles (AGV), and automated rail-mounted gantry cranes (ARMG). Unlike the “AQC + AGV + ARMG” loading and unloading system prevalent in most terminals, the Nansha IV Terminal of Guangzhou Port in this study uses a system comprising a single-trolley quay crane, intelligent guided vehicle (IGV), and single cantilevered rail crane. This system, coupled with the advanced “5G + BeiDou” navigation method, achieves more efficient and environmentally friendly operations. However, solely elevating the technological level proves insufficient to meet the growing demand for energy-efficient operations. Terminal operators are leaning towards devising advanced equipment scheduling solutions to attain cost reductions and efficiency gains. Consequently, the significance of researching relevant operational equipment scheduling issues has gained prominence. Currently, the emphasis in related research has shifted from singular resource scheduling to integrated scheduling involving multiple pieces of equipment. However, existing research on the integrated scheduling of QC and horizontal transportation equipment predominantly concentrates on the equipment itself, neglecting the influence of ship stowage and container weight on equipment operation. Consequently, this research delves into the integrated scheduling problem of QCs and IGVs in the Nansha Phase IV Terminal of Guangzhou Port. It explores strategies for minimizing the operational energy consumption of QCs and IGVs.
1.2. Literature Review
In this section, we conducted a review of research pertaining to integrated scheduling and energy conservation in container terminals. Regarding integrated scheduling, the discussion is focused on quay cranes and horizontal transportation equipment, distinct from other types of integrated scheduling research. A brief explanation is provided for the modeling and algorithmic solution ideas associated with integrated scheduling. In the domain of energy saving and emission-reduction research, the emphasis is on carbon emissions and methods for energy conservation.
1.2.1. Integrated Scheduling in Container Terminal
- (1)
- Integrated scheduling of QC and horizontal transportation equipment
In previous studies, Homayouni et al. [4] developed an integrated scheduling model for QC and AGV, assigning QC loading and unloading tasks based on AGV availability. They employed a simulated annealing algorithm (SA) to optimize the QC job sequence, minimizing the maximum completion time. To evaluate the model’s accuracy, Homayouni et al. [5] investigated the impact of three cooling processes and two sets of control parameters on SA, ensuring optimal or near-optimal solutions across all experimental scenarios. Additionally, Homayouni et al. [6] explored the use of genetic algorithms (GA) for similar problems. Their GA incorporated a coding method generating task sequences according to loading and unloading task priorities, yielding superior results in large-scale task examples compared to other algorithms. Recent studies have considered more comprehensive factors. Xiong et al. [7] addressed the influence of AGV power changes in integrated scheduling, determining optimal AGV configurations and power-change thresholds through analyses of different-scale instances. Yin et al. [8] established an integrated scheduling model for QC and shuttle vehicles (SV) under ramp buffer capacity constraints, developing sequential insertion, greedy insertion, and improved genetic algorithms to solve scheduling problems in medium and large-scale tasks. Zhao et al. [9] considered the capacity limitations of QCs’ transfer platforms when constructing an integrated scheduling model for dual-trolley quay cranes and AGVs. They designed a two-stage tabu search algorithm to minimize operational energy consumption. In a similar vein, Yue et al. [10] designed an integrated scheduling model for dual-trolley QC and AGV, incorporating factors such as AGV endurance time. They utilized a genetic algorithm to minimize operational costs. Yue et al. [11] further included customer satisfaction in the evaluation index system, creating a multiobjective mixed-integer programming model to select scheduling schemes based on customer satisfaction. However, previous studies tended to address QC and AGV operations separately, diminishing their interaction. In contrast, Chen et al. [12] integrated two stages, formulating a model with energy consumption and ship departure delay as optimization objectives. They designed a genetic algorithm with an embedded tabu search operator, yielding results superior to traditional genetic algorithms. Nevertheless, they weighted the two objectives when implementing the solution method, posing challenges to ensuring the reasonable allocation of objective weights. Duan et al. [13] established a multiobjective integrated scheduling model targeting overall makespan and AGV unloading time. They employed NSGA-II to obtain a noninferior solution set, demonstrating superior results compared to the weighted method under a large number of tasks.
- (2)
- Other integrated scheduling problems
It is valuable to consider modeling and solution approaches for other integrated scheduling problems. In the context of QC, a prevalent focus lies on the integrated berth and QC allocation and scheduling problem (BQCASP). Bouzekri et al. [14] integrated Laycan, dynamic continuous berth allocation, and QC allocation problems to establish a model, validating its feasibility using the Xpress-IVE optimizer. Some studies delve into robust BQCASP. Xiang et al. [15] developed a BQCASP model with approximate robust optimization (ARO) characteristics, employing mean objective and weighted maximum penalty function. This ARO model adeptly handles uncertainty, reducing overall expected cost and ship delay time compared to deterministic and fully robust models. Rodrigues et al. [16] formulated a two-stage BQCASP robust model considering uncertainty in ship arrival time. They introduced an exact decomposition algorithm to split the initial problem into the main problem and the separation problem. Additionally, they utilized a heuristic algorithm to streamline operation scenarios during separation-problem resolution, effectively reducing ship time in port. Wang et al. [17], also working on a two-stage BQCASP robust optimization model, initially established a complete baseline plan using a proactive strategy. They then constructed a rescheduling model based on a response strategy, solving it with the C&CG algorithm to obtain precise solutions. Nourmohammadzadeh et al. [18] developed a multiobjective robust model for BQCASP considering QC breakdown. They applied multiobjective simulated annealing (MOSA) and Pareto simulated annealing (PSA) algorithms based on a new two-layer coding scheme with berth information to comprehensively optimize three objectives, including ship delay time. Another facet of research encompasses major operational equipment such as QCs, AGVs, and yard cranes (YC). Xu et al. [19] explored the cooperative scheduling problem involving three types of equipment in a U-shaped terminal. They formulated a mixed-integer planning model with the objective of minimizing operation time and designed an improved genetic algorithm incorporating a reinforcement learning mechanism, significantly enhancing AGV utilization rates. Cahyono et al. [20] constructed a dynamic model integrating QC, internal trucks, and YC operations based on the finite state machine (FSM) framework. They proposed a model prediction algorithm (MPA) to obtain near-optimal solutions for equipment scheduling and container storage location. To address cascading effects due to uncertainties in the terminal, Cai et al. [21] introduced an evaluation index based on the entropy theory of complex network structures. This index assesses cascading-effect resistance and the robustness of the integrated scheduling scheme for QC, internal vehicles (IV), and YC obtained via genetic algorithms. Naeem et al. [22] developed a model centered on the integrated scheduling of YC and AGV, considering buffer capacity under QC limitations. They verified the model’s feasibility using the Gurobi solver. Liu et al. [23] investigated the coscheduling problem involving railroad gantry cranes (RCOGC), YC, and IV in an intermodal container terminal. They formulated a multiobjective model and designed an adaptive large neighborhood search (ALNS) algorithm combined with discrete event simulation (DES) to address the problem.
1.2.2. Energy Saving and Emission Reduction in Container Terminal
In the exploration of the quay crane scheduling problem (QCSP), Tan et al. [24] aimed to balance the operational efficiency and energy consumption of dual-trolley QCs by calculating operational details, such as the minimum horizontal moving distance and the minimum lifting height of the main trolley. Li et al. [25] developed a dual-objective model focusing on minimizing the ship’s makespan and QC operation energy consumption. They employed the branch delimiting method to identify the nondominated solution set. Zhong et al. [26] constructed a multiobjective QC scheduling model, considering the safe operating distance between heterogeneous QCs. They adopted a cooperative operation strategy between QCs. In terms of multiequipment integrated scheduling, Yue et al. [27] used an avoidance strategy to adjust QC operation sequences, reducing energy consumption during QC waiting. They employed a genetic algorithm to find optimal AGV operation sequences, maximizing AGV utilization and reducing empty-load energy consumption. Karam et al. [28] incorporated realistic factors, such as internal truck shortages and handling time, into a model integrating berth, QC, and internal truck allocation, achieving energy savings without increasing truck quantity. Hong et al. [29] addressed the integrated scheduling problem of dual-trolley QC and driverless electric trucks (DETs) by using a pooling strategy to schedule DETs to meet QC transportation service demand. This achieved a more efficient scheduling scheme with lower energy consumption. Zheng et al. [30] designed a three-dimensional coding method to integrate scheduling information for three types of equipment, considering dependencies among the QC, truck, and YC. This improved the search accuracy of the genetic algorithm and optimized energy consumption. Zhong et al. [31] devised a two-layer genetic algorithm for the integrated scheduling problem of QC, AGV, and YC, searching for the optimal scheduling scheme of QC and YC. They proposed a conflict-free path-solving strategy, enabling AGVs to achieve minimal operation energy consumption without the loss of utilization. Sun et al. [32] established a multiresource integrated scheduling optimization model based on the principle of the blocking hybrid flow shop problem (B-HFSP). Their objectives were to minimize QC completion time and reduce energy consumption of AGV transportation, maintaining a low QC idleness rate. Jiang et al. [33] constructed a robust integrated scheduling model for multiple terminal berths and QCs, using the expected arrival time of the ship and average operating efficiency plus slack as actual values. The goal was to minimize carbon emissions from terminal operations. A concise literature summary of this section is shown in Table 1.
1.3. Research Gaps
Existing research on optimizing energy usage in the scheduling of QC and transport vehicles exhibits the following gaps:
- (1)
- To mitigate QC delay, some studies opt for an excessive number of horizontal transport vehicles. However, this configuration provides limited actual effectiveness in reducing QC delay, diminishes the utilization rate of transport vehicles, and elevates transportation energy consumption;
- (2)
- Previous studies have arbitrarily determined the loading order of containers, overlooking the influence of the ship’s actual stowage on this order. When formulating the ship’s stowage plan, constraints such as preventing heavy containers from exerting pressure on lighter ones, heeling moment limitations, and avoiding placing containers in midair significantly impact the loading sequence;
- (3)
- Most studies uniformly define the loading and transportation speed of containers. However, they overlook the impact of container weight on equipment loading rates. The operational speed of equipment varies based on the weight category of containers;
- (4)
- Some studies address the operational process of QC and horizontal transportation equipment in distinct stages. This approach undermines the linkage between the two operational phases, hinders the flexible operation of equipment, and adversely affects the quality of the final scheduling scheme.
To address issues identified in the previous research and further decrease the operational energy consumption of loading and transportation equipment in container terminals, we consolidate the scheduling challenges of single-trolley QC and IGV in the loading process under single-vessel operation surface mode. We quantify the operational energy consumption of each equipment under various working conditions. Accounting for vessel-stowage constraints and other limiting factors, we establish a mixed-integer planning model with the optimization goal of minimizing overall operating energy consumption. We analyze the comprehensive operating energy consumption and the time distribution of energy consumption for each working condition under different equipment quantity configurations.
The subsequent structure of this paper is outlined as follows: Section 2 elucidates the integrated scheduling problem involving QC and IGV, presenting the mathematical model devised for its resolution. Section 3 introduces an algorithm devised to tackle the model. Section 4 delineates variously sized arithmetic cases for experimental validation of the proposed model and algorithm and subsequently analyzes the experimental outcomes. Lastly, Section 5 consolidates the findings of this study and outlines future research directions.
2. Problem Description and Formulation
2.1. Problem Description
The integrated scheduling problem involving QCs and IGVs in an automated container terminal aims to define the loading sequence of each container and assigns specific equipment based on the loading and unloading process. This optimization targets specific operational indices. When a container ship docks, terminal staff decide the number of QCs and IGVs based on the ship’s required in-port time and stowage information. Figure 1 illustrates IGVs operating on the surface, serving all QCs. During loading, the IGV retrieves containers from the storage yard, traverses the horizontal transport area, and delivers the container below the QC. The QC lifts the container from the IGV to a designated bay on the ship. The empty IGV returns to the yard for the next loading task. Upon scrutinizing the operational intricacies of QC and IGV, it becomes apparent that the energy consumption throughout the entire loading process is manifested in operational phases, including IGV movement with a container, IGV movement without a load, IGV waiting due to QC operation delays, QC container hoisting, QC movement, QC waiting due to adjacent QC interference, and QC waiting due to IGV operation delays.
In the case of QC, insufficiently configured IGVs or excessive QC configurations may lead to potential delays in IGV transportation operations, resulting in extended QC waiting times. Regarding IGV scheduling, insufficiently configured QCs or excessive IGV configurations may cause delays in QC loading tasks or lead to IGV queues, resulting in excessively long IGV waiting times. This study is grounded in the following assumptions:
- (1)
- The stacking yard is equipped with an ample number of yard cranes, eliminating the need for IGVs to wait in the yard;
- (2)
- Details including the destination port, weight, and quantity of the containers to be loaded have been provided. All containers are of uniform size;
- (3)
- All IGVs transport containers with uniform power. The operation process maintains a consistent speed. Containers of varying weights are transported at distinct speeds. Path conflicts among IGVs are not taken into account;
- (4)
- All QCs load containers with uniform power and operate on a shared track. Loading containers of varying weights incurs distinct time durations. QCs maintain a minimum safe operating distance of one bay;
- (5)
- Unforeseen circumstances such as equipment failure, adverse weather effects, and temporary operational schedule adjustments are ignored.
2.2. Definition of Notations and Variables
2.3. Mathematical Model
The mixed-integer planning model comprises an objective function representing energy consumption during operation and constraint equations for each equipment type, utilizing the notations and variables delineated in Table 2 and Table 3. Specifically, the objective function aggregates the energy consumption of all equipment across different operational states. The constraints encompass operational limitations for IGVs and QCs, as well as constraints related to ship stowage.
2.3.1. Objective Function
The objective function represents the total energy consumption across six states, namely QC loading, QC moving, QC waiting, IGV traveling empty, IGV traveling with containers, and IGV waiting. The breakdown is as follows:
Equation (1) can calculate the energy consumption of all QCs during the container loading process at the target bay.
Equation (2) describes the energy consumption incurred by the QC during movement along the ship.
Equation (3) describes the energy consumption during QC waiting. The first term represents energy consumption caused by neighboring QC interference during the wait. The second term represents energy consumption when QC waits for the IGV.
Equation (4) calculates the energy consumption during the travel process of the IGV carrying the container to the position beneath the QC.
Equation (5) describes the energy consumption incurred by the IGV during travel without a load.
Equation (6) is the energy consumption generated by the IGV waiting for the QC process.
The total operational energy consumption, as represented in Equation (7), can be calculated by summing the energy consumption from the six aforementioned states.
2.3.2. Constraints
- (1)
- IGV operational constraints
The operational constraints of the IGV mainly involve limitations on transportation capacity, operation sequence, and temporal relationships, as outlined below.
Equations (8) and (9) specify that every transportation task accomplished by the IGV is preceded and followed by other tasks. Equation (10) guarantees that each container is exclusively transported by a single IGV. Equation (11) states that if the IGV v handles container i, the task is either the first transportation task for the IGV v or the immediately following task for other containers. Equation (12) specifies that the IGV can transport only one container at a time.
Equation (13) describes the initial transportation task of the IGV, which involves directly carrying the container from the yard to be subsequently unloaded by the QC upon arrival beneath it, thereby completing the entire transportation process. Equation (14) describes the temporal relationship between the completion of the preceding transportation task and the commencement of the subsequent task for the IGV. Equation (15) states that the moment of completion for the current transportation task by the IGV is not earlier than the moment when the QC completes the preceding loading task;
- (2)
- QC operational constraints
QCs face limitations on loading capacity, operation sequence, and temporal dependencies during operations. Moreover, a defined safety interval between QCs must be upheld. The specific equations are outlined below:
Equations (16)–(22) mirror the role for the QC as Equations (8)–(14) do for the IGV. Equation (23) specifies that QC q operating on bay a loads the designated containers into bay a. Equation (24) states that if container i is the first loading task assigned to QC q, and it is designated to be loaded at bay a, then bay a will be the initial bay processed by QC q. Equation (25) states that if container i is the final loading task assigned to QC q, and it is designated to be loaded in bay a, then bay a will be the last bay processed by QC q. Equation (26) specifies that if neighboring containers i and j to be loaded are not in the same bay, the QC moves to the next bay a′ to load container j after completing the loading of container i at the current bay a.
Equations (27)–(31) mirror the role for bay as Equations (16)–(20) do for QC. Equation (32) states that the minimum operational spacing between QCs is one bay. Equation (33) guarantees that the operational areas of the QCs do not overlap. Equation (34) ensures that the initial operational spacing between adjacent QCs is at least one bay.
Equation (35) defines the start and end moments of each bay operation. Equation (36) ensures that the loading of all containers is completed no earlier than the start of operations at the corresponding bay. Equation (37) ensures that the loading of all containers is completed no later than the end of operations at the corresponding bay;
- (3)
- Ship stowage constraints
Previous studies have failed to consider that the stowage plan imposes constraints on the container loading sequence, thereby impacting the operational sequence of the QC and IGVs, potentially hindering the improvement of their operational efficiency. Stowage constraints primarily address bay space limitations and ship stability.
Equation (38) specifies that each container position can accommodate only one container. Equation (39) states that each container must occupy a distinct position. Equation (40) ensures that containers are not suspended. Equation (41) ensures that heavier containers are not positioned above lighter ones. Equation (42) represents the total weight of containers in each stack. Equation (43) represents the heeling moment constraint for each bay. Equation (44) represents the total weight of containers for each bay. Equation (45) represents the constraint on the longitudinal weight difference of the ship.
3. Solution Design
The integrated scheduling problem involving QC and horizontal transportation equipment is an NP-hard problem [34]. Previous heuristic algorithms struggled to meet the requirements for solving these problems [35]. In recent years, the sparrow search algorithm (SSA) has demonstrated significant advantages in addressing these issues.
3.1. Standard Sparrow Search Algorithm
SSA is an algorithm that mimics the foraging and antipredation behavior of sparrow populations. It offers advantages such as strong search ability, few control parameters, and a relatively simple structure. Based on the fitness advantages and disadvantages, SSA divides the sparrow population into finders and followers, then randomly selects some individuals as scouts. Finders with higher fitness values share foraging information with the population, while followers use this information to locate food. Scouts alert the population in case of predator encounters. The three types of sparrows update their positions during foraging, each employing its own strategy to obtain food.
If there are n sparrows in the D-dimensional search space, the position of the entire sparrow population can be denoted by Equation (46).
In this equation, i = 1, 2, …, n; d = 1, 2, …, D; xid represents the position of sparrow i along dimension d.
In SSA, the sparrow with a more advantageous position will be the first to locate the food and share information about its direction with the follower. Upon detecting a predator, the sparrow issues a warning message and adjusts its position based on the severity of the warning signal, as per Equation (47).
In this equation, t represents the current iteration number. itermax indicates the maximum number of iterations of the algorithm. α is a random real number in the interval (0, 1]. Q follows a normal distribution as a random number. L is a 1 × D matrix with all element values equal to 1. R2 ∈ [0, 1] and ST ∈ [0.5, 1] represent the warning value and the safety threshold, respectively. When R2 < ST, no predators are detected near the sparrow population, allowing the finder to expand the search. When R2 ≥ ST, predators are detected by some sparrows. In this scenario, the finder must issue an early-warning message and guide other sparrows to a safe area.
Followers will move to the food location based on the message sent by the finders and compete with them for the food. If followers succeed, they take over the food location from the finders; otherwise, they fly to another area for foraging. Followers update their location according to Equation (48).
In this equation, Xworst represents the global worst position in the current population. denotes the current best position of the finders. Matrix A is a 1 × D matrix with elements randomly assigned to either 1 or −1 and . If i > n/2, follower i is in the worst position fails to obtain food and must relocate to another region for foraging. If i ≤ n/2, follower i will forage near the current best position .
Finally, 10% to 20% of individuals in the population are randomly chosen as scouts, tasked with vigilance and predator avoidance. Scouts adjust their positions based on Equation (49).
In this equation, Xbest represents the location of the current global optimum individual. β follows a normal distribution with a mean of zero and a variance of one, regulating the individual’s step size. K is a random number within the range [−1, 1], controlling the direction of the individual’s movement and serving as the control parameter for the step size. fi denotes the fitness value of scout i. fg and fw denote the current global optimum and worst fitness values, respectively. ε is a very small constant used to avoid division by zero. When fi > fg, the individual is at the periphery of the sparrow population and highly susceptible to predators. When fi = fg, the individual is alerted to the danger and must seek proximity to other individuals to evade predator attacks.
3.2. Improved Sparrow Search Algorithm
SSA faces challenges in preventing decreasing convergence accuracy and is prone to trapping in local extremes. To enhance the optimization performance of the algorithm, we propose the dimension-by-dimension mutation sparrow search algorithm (DMSSA) with an introduced cat mapping initialization method and an adaptive t-distribution mutation perturbation. DMSSA, compared to SSA, enhances initial population diversity using cat chaotic mapping and adaptively adjusts search preferences at different stages using t-distribution variation, thereby enhancing the solution quality of the integrated scheduling problem.
3.2.1. Cat Chaotic Mapping
The stochastic nature of the SSA population initialization results in drawbacks like uneven distribution and low diversity in the initial population. Hence, we incorporate cat mapping to enhance the initial population distribution. Cat mapping possesses the advantage of a relatively simple structure and is less likely to form small loops or fixed points. Thus, the cat mapping defined by Equation (50) is employed to initialize the sparrow population, promoting a more even distribution in the search space and enhancing the diversity of the initial population. In this equation, a1 and b1 represent arbitrary real numbers, where mod1 denotes the fractional part of a1.
The cat map integrates the inverse solution within the feasible domain to generate the initial chaotic sequence as follows. Equation (40) is utilized to randomly generate a feasible solution for the current sparrow population, denoted as . The resulting inverse solutions are denoted as and . In the formulas, uid and vid represent the upper and lower bounds of individual sparrows in the d-dimensional search space, with l as a real number following a uniform distribution on the interval [0, 1]. The inverse solution information incorporated into cat mapping enhances the algorithm’s search capability, thereby preventing entrapment in local extreme value regions [36,37].
The population size is 1000, with upper and lower boundaries set to 0 and 1. Figure 2 and Figure 3 depict the distribution and frequency statistics of population generated by both methods. It is evident that populations from random initialization are concentrated in the latter half of the chaotic value interval. Conversely, the population distribution achieved through cat mapping is more uniform and exhibits greater diversity.
3.2.2. Adaptive t-Distribution Mutation
The t distribution, also known as the student distribution, is described by its probability density function in Equation (41). Varying the degrees of freedom parameter, denoted as n in the formula, lead to different forms of the distribution function curve.
In Figure 4, when the degree of freedom n = 1, , and the function curve coincides with the Cauchy distribution. As the degree of freedom n approaches infinity, , and the function curve approaches a Gaussian distribution. Consequently, the Cauchy and Gaussian distributions serve as the boundary distributions for the t distribution.
The optimal individual in each generation of the sparrow population undergoes mutation through the adaptive t-distribution operator. We set the number of iterations iter to be the parameter of the degrees of freedom of the mutation operator. The best individual sparrow is denoted as . Each dimension value of the individual is modified according to Equation (42) to generate a new individual, . In the equation, t(iter) is the value of the corresponding t-distribution function. The fitness values of Xbest and Xnew are compared, and individuals with smaller values are retained for subsequent calculations. The t-distribution mutation, being bounded by the Cauchy and Gaussian distributions, behaves similarly to the Cauchy mutation when the degree of freedom is small initially, gradually resembling the Gaussian mutation as the degree of freedom increases. The Cauchy mutation enhances the algorithm’s global search capability and sustains population diversity, while the Gaussian mutation improves local search performance and accelerates algorithm convergence. Therefore, with an increase in the number of iterations, the algorithm progressively transitions from reinforcing global search in the initial stages to escaping local extremes, and later intensifies local search to expedite convergence speed.
3.3. Encoding and Decoding
In the intelligent optimization algorithm aimed at solving the integrated scheduling problem, each individual in the population represents a solution vector. To efficiently address the scheduling problem, we encode the solution vectors and establish decoding rules. Encoding involves assigning key scheduling information to individuals, while decoding retrieves feasible scheduling solutions from the encoded information. To determine the index and loading order of containers for each QC and bay, real number encoding is employed to create a solution vector that documents the target loading bays for all containers. Each individual is represented as an I-dimensional array, denoted as , with I representing the number of containers. The variable xi assumes real numbers within the range (0, B). Assuming 12 containers are to be loaded onto a vessel with six bays and three QCs, we derive the initial loading scheme detailed in Table 4. A set of 12 real numbers within the range (0, 6) is generated and subsequently rounded up, yielding the decoding results that represent the initial target bay for each container.
Due to technical limitations during the loading operation, corrections are required for the initial decoding results to ensure precise loading information for each bay. Rectify loading information that surpasses the container capacity limit for bays using Equations (32) and (33). Transfer containers from the bay exceeding the capacity limit to the bay with the lightest load. Equations (38) and (39) constraints are employed to ensure the ship’s maximum longitudinal weight difference does not exceed 30 tons. Containers are shifted from the overloaded half of the bays to the other half to derive the corrected loading information presented in Table 5.
Once the final target bays for all containers are determined, the next step involves organizing a rational loading order for each bay and assigning an appropriate number of QCs. When establishing the loading order, it is imperative to adhere to the constraints, ensuring heavy containers do not exert pressure on lighter containers, and consider the heeling moment specified in Equations (35) and (37).
The procedure for loading containers into each bay, based on the principle depicted in Figure 5, is outlined as follows.
Step 1: Categorize the sequence of containers intended for loading in the current bay into two groups: one for heavy containers and the other for light containers;
Step 2: If heavy containers are designated for loading, choose the lowest position in the row near the centerline of available spaces on the larboard side to load a heavy container. If there are no heavy containers, proceed to load light containers using the same method as for heavy containers;
Step 3: Compare the heeling moments on the larboard and starboard sides. If the heeling moment on the larboard side exceeds that on the starboard side, load the starboard side using the same procedure as for the larboard side; otherwise, load the larboard side;
Step 4: Complete the loading of the remaining containers according to the above rules.
Finally, considering the nonoverlapping nature of the operating areas and the initial operating intervals outlined in Equations (28) and (29), consecutive bays are allocated to each QC for operation, following the left-to-right operating pattern depicted in Figure 6. The resulting scheduling scheme is presented in Table 6.
3.4. Overall Flow of DMSSA
Integrating the analysis above, the algorithm’s overall flow unfolds as follows.
Step 1: Instances initialization. Input parameters such as energy consumption per unit of equipment, container weight, etc.;
Step 2: Algorithm initialization. Utilize cat chaotic mapping to generate the initial sparrow population. Decode the result to obtain the initial scheduling scheme;
Step 3: Modify the initial scheduling scheme according to the loading rules mentioned above;
Step 4: Following the procedure outlined in Figure 7, the fitness value of the population is computed to derive the total energy consumption for each scheduling scheme;
Step 5: Classify the sparrow population into explorers and followers based on their fitness values. Subsequently, update the positions of explorers, followers, and sparrows that are aware of danger individually;
Step 6: Employ adaptive t distribution for mutating the optimal sparrow, resulting in a new individual Xnew. Compare the fitness values between the current global optimal position Gbest and Xnew and retain the superior individual;
Step 7: Assess if the iteration number requirement is met. If so, proceed with Step 8; otherwise, revert to Step 5;
Step 8: Output the global optimum and acquire the optimal scheduling solution.
4. Numerical Experiments
To assess DMSSA’s performance in addressing the integrated scheduling problem of QC and IGV, we designed 12 numerical instances of varying scales (small, medium, and large) for testing. Each instance is characterized by distinct quantities of containers, QCs, and IGVs, denoted as I/Q/V. The obtained results are compared with those from standard SSA, MSSA [38], SHSSA [39], GWO [40], and other algorithms [41,42]. The programming and testing processes were executed on the Intel Core i5-1035G1 CPU @ 1.00GHz and RAM 16GB platform using Python 3.10.
4.1. Instances Generation and Parameters Setting
Using the Guangzhou Port Nansha Phase IV Automated Container Terminal as an example, we examine the loading operations of ships at the port. Figure 1 illustrates the overall terminal layout and the traffic flow direction of IGVs. The terminal features 12 berths for 2000-ton inland-waterway vessels, a shoreline length of 984 m, a front operating strip width of 75 m, a yard arranged parallel to the shoreline, and a land depth of 650~840 m. It is equipped with a total of 120 IGVs for transportation. There is a need to load a river container liner with a capacity of 300 TEU in port. All containers designated for loading are situated within the eight blocks depicted in Figure 1. The precise coordinates of these containers and loading nodes are illustrated in Figure 8. The number of equipped QCs and IGVs is limited to 5 and 10 units, respectively. The relevant operational equipment and vessel parameters are detailed in Table 7.
4.2. Results and Analysis
The population size popsize for all algorithms is set to 100. The maximum number of iterations iter is set to 200. The parameters of the DMSSA algorithm have a warning value of ST = 0.6, a finder’s ratio of PD = 0.7, and a scout’s ratio of SD = 0.2. Each algorithm underwent 10 independent runs on each of the 12 instances, and the average value was recorded as the test result. The top-three results of each instance are highlighted by bolding, italicizing, and underlining, respectively. The test results for all algorithms are presented in Table 8, while the energy-consumption optimization results are depicted in Figure 9.
All algorithms achieve varying degrees of energy-optimization effects across different arithmetic cases compared to the original energy-consumption values before optimization. DMSSA emerges as the top performer overall, demonstrating the best results in medium- and large-scale algorithmic tests and achieving superior energy savings compared to all other algorithms. Even in small-scale case tests, DMSSA exhibits commendable performance, with an energy-consumption reduction ranging from 0.83% to 1.28%. Small-scale instances, constrained by container numbers, exhibit significantly lower time complexity in encoding, decoding, and objective function operators compared to medium and large-scale instances, favoring algorithms emphasizing local search performance. Consequently, PSO and MSSA, featuring multidirectional learning strategies, exhibit a slight performance edge over DMSSA in this context. However, the growing container throughput in modern ports makes medium and large-scale instances more relevant for practical production operations. In these instances, time complexity grows exponentially, demanding greater algorithm population diversity and emphasizing the randomness of the generated solution vectors. Algorithms excelling in global search performance yield superior results. Thus, DMSSA calculations, with a more uniform initial population distribution biased towards Cauchy mutation in the early stage, outperform other algorithms, achieving minimum values of 430.709 kWh and 1075.953 kWh, respectively. Additionally, Figure 10 depicts the iterative variations of all algorithms for medium- and large-scale instances. The iterative curves of DMSSA exhibit a slight dip as they stabilize in the later stage of the search. This suggests that an increase in degrees of freedom aligns the individual mutation mode closer to Gaussian mutation, reinforcing the algorithm’s local search capability and optimizing the solution results further.
In the context of energy consumption, increasing the number of QCs to three reduces overall energy consumption by 1.068 kWh when handling 30 containers. Further, increasing the number of QCs to four reduces overall energy consumption by 5.388 kWh when handling 100 containers. The increase in the number of QCs allows IGVs to unload containers in more areas of the QC’s operation, thereby reducing the time IGVs spend waiting in line under the QC. However, the number of QCs cannot be increased indefinitely due to two primary reasons. Firstly, Equations (32) and (33) constrain the operational space for QCs. Secondly, the addition of new QCs entails higher initial investment and operating costs. Therefore, optimized scheduling becomes crucial for cost and energy-consumption reduction in an integrated manner while maintaining the original terminal operating conditions. IGVs must replenish containers in a timely manner for QC to avoid additional QC waiting situations, necessitating a corresponding increase in the configured number of IGVs. However, a diminishing effect occurs when the number of IGVs surpasses a certain threshold, leading to an overall increase in energy consumption rather than a decrease. Hence, it is crucial to determine the optimal number of configured IGVs relative to the QCs. Examining the results of large-scale instance tests reveals that configuring seven IGVs for five QCs results in the lowest overall energy consumption of 1075.953 kWh. Configuring six IGVs leads to an increase in QC waiting time due to insufficient IGVs, resulting in elevated waiting energy consumption for QCs. Configuring more than eight IGVs increases the IGV queuing wait time due to excessive configuration, leading to higher IGV waiting energy consumption. Consequently, for loading 250 containers, the optimal number of IGVs configured relative to five QCs is seven, representing a difference of two from the number of QCs. The optimal ratios for QC and IGV are 3:5 and 4:6 for small and medium scale instances, respectively, with a configuration difference of two in both cases.
To further validate the appropriateness of this configuration, we analyze the distribution of operating times for devices in various states in the large-scale example depicted in Figure 11. In Instances 10 and 11, configuring 7 to 8 IGVs for the five QCs results in continuous alternation of orange and green segments, representing IGVs traveling empty and with containers for most of the time. The individual blue segment, indicating QCs in the loaded state, lasts a long time. The red and purple segments, representing QCs and IGVs with significantly less waiting time than other states, suggest that devices handle the loading task with minimal waiting, either not waiting for each other in most cases or for only a short period. The red and purple segments, representing QCs and IGVs with significantly less waiting time than other states, suggest that devices handle the loading task with minimal waiting, either not waiting for each other in most cases or for only a short period. QC5, situated on the right side and facing a substantial task volume, lacks sufficient IGVs that can be promptly called in. Consequently, this QC fails to complete loading tasks for the current bay when QCs on the left side need to move. In Instance 12, configuring as many as 10 IGVs effectively reduces the overall makespan to less than 7000 s. However, the red segments representing the IGVs waiting last longer, leading to increased IGV waiting energy consumption.
Therefore, the analysis indicates that, to minimize energy consumption, it is optimal to configure a specific number of QCs with two to three additional IGVs compared to the number of QCs.
5. Conclusions
This study aims to effectively reduce the operating energy consumption in container terminals by considering constraints in the actual loading-operation process. It constructs an integrated scheduling model for QCs and IGVs. We design a DMSSA with cat mapping and adaptive t-distribution mutation to efficiently solve the model. The algorithm encodes the sparrow population using the target bays of containers as key information, and decoding takes into account QC operations and ship stowage constraints. Multiple sets of comparative tests confirm that the DMSSA produces a more evenly distributed initial population. It effectively balances global search in the early stage and local mining ability in the late stage, leading to superior optimization results compared to other algorithms in most operational scenarios. Additionally, the study analyzes the time distribution of each device in different states through tests that gradually increase the number of devices. This analysis identifies the optimal configuration that significantly reduces overall energy consumption. Under the condition of appropriately increasing the number of QCs, configuring two to three more IGVs than QCs optimizes the overall energy-consumption index.
This study still has some limitations. Future research on the integrated scheduling problem of a QC and an IGV will focus on the following areas: including makespan in the model to analyze its impact on energy consumption during actual operations; considering factors such as charging demands, path conflicts, and other scenarios affecting IGV operations; and conducting research on robust scheduling to address uncertainty factors like equipment failures, adverse weather conditions, and temporary operational adjustments.
Author Contributions
Conceptualization, X.L. and Y.L.; methodology, X.L. and Y.L.; software, Y.L. and W.L.; validation, X.L. and Y.L.; formal analysis, Y.L.; investigation, Y.L.; resources, X.L., Y.Z. and K.T.; data curation, Y.L.; writing—original draft preparation, Y.L.; writing—review and editing, Y.L.; visualization, Y.L.; supervision, X.L. and Y.Z.; project administration, Y.Z. and X.L.; funding acquisition, Y.Z. All authors have read and agreed to the published version of the manuscript.
Funding
This work was supported by the National Natural Science Foundation of China (Grant No. 72174160), and the Key R & D projects in Hubei Province (Grant No. 2023BAB073).
Institutional Review Board Statement
Not applicable.
Informed Consent Statement
Not applicable.
Data Availability Statement
No new data were created or analyzed in this study. Data sharing is not applicable to this article.
Conflicts of Interest
The authors declare no conflicts of interest.
References
- Ahmed, E.; El-Abbasy, M.S.; Zayed, T.; Alfalah, G.; Alkass, S. Synchronized scheduling model for container terminals using simulated double-cycling strategy. Comput. Ind. Eng. 2021, 154, 107118. [Google Scholar] [CrossRef]
- Alamoush, A.S.; Ballini, F.; Ölçer, A.I. Ports’ technical and operational measures to reduce greenhouse gas emission and improve energy efficiency: A review. Mar. Pollut. Bull. 2020, 160, 111508. [Google Scholar] [CrossRef]
- Mansouri, S.A.; Lee, H.; Aluko, O. Multi-objective decision support to enhance environmental sustainability in maritime shipping: A review and future directions. Transp. Res. Part E Logist. Transp. Rev. 2015, 78, 3–18. [Google Scholar] [CrossRef]
- Homayouni, S.M.; Hong, T.S.; Ismail, N.; Ariffin, M. Optimization of Integrated Scheduling of Quay Cranes and Automated Guided Vehicles using Simulated Annealing Algorithm. In Proceedings of the 2011 International Conference on Industrial Engineering and Operations Management, Kuala Lumpur, Malaysia, 22–24 January 2011; pp. 22–24. [Google Scholar]
- Homayouni, S.; Tang, S.; Ismail, N.; Ariffin, M. Using simulated annealing algorithm for optimization of quay cranes and automated guided vehicles scheduling. Int. J. Phys. Sci. 2011, 6, 6286–6294. [Google Scholar] [CrossRef]
- Homayouni, S.M.; Tang, S.H.; Motlagh, O. A genetic algorithm for optimization of integrated scheduling of cranes, vehicles, and storage platforms at automated container terminals. J. Comput. Appl. Math. 2014, 270, 545–556. [Google Scholar] [CrossRef]
- Xiong, Z.; Han, X. Research on joint scheduling optimization with AGVs and quay cranes consider replacement processes. Highlights Sci. Eng. Technol. 2022, 9, 459–468. [Google Scholar] [CrossRef]
- Yin, Y.-Q.; Zhong, M.; Wen, X.; Ge, Y.-E. Scheduling quay cranes and shuttle vehicles simultaneously with limited apron buffer capacity. Comput. Oper. Res. 2023, 151, 106096. [Google Scholar] [CrossRef]
- Zhao, Q.; Ji, S.; Guo, D.; Du, X.; Wang, H. Research on cooperative scheduling of automated quayside cranes and automatic guided vehicles in automated container terminal. Math. Probl. Eng. 2019, 2019, 6574582. [Google Scholar] [CrossRef]
- Yue, L.; Fan, H.; Zhai, C. Joint configuration and scheduling optimization of the dual trolley quay crane and AGV for automated container terminal. J. Phys. Conf. Ser. 2020, 1486, 072080. [Google Scholar] [CrossRef]
- Yue, L.; Fan, H.; Ma, M. Optimizing configuration and scheduling of double 40 ft dual-trolley quay cranes and AGVs for improving container terminal services. J. Clean. Prod. 2021, 292, 126019. [Google Scholar] [CrossRef]
- Chen, J.; Du, W.; Wang, H.; Guo, D. Research on integrated scheduling optimization of double-trolley quay crane and AGV in automated terminal. IOP Conf. Ser. Mater. Sci. Eng. 2020, 790, 012071. [Google Scholar] [CrossRef]
- Duan, Y.; Ren, H.; Xu, F.; Yang, X.; Meng, Y. Bi-Objective Integrated Scheduling of Quay Cranes and Automated Guided Vehicles. J. Mar. Sci. Eng. 2023, 11, 1492. [Google Scholar] [CrossRef]
- Bouzekri, H.; Alpan, G.; Giard, V. Integrated Laycan and Berth Allocation and time-invariant Quay Crane Assignment Problem in tidal ports with multiple quays. Eur. J. Oper. Res. 2021, 293, 892–909. [Google Scholar] [CrossRef]
- Xiang, X.; Liu, C. An almost robust optimization model for integrated berth allocation and quay crane assignment problem. Omega 2021, 104, 102455. [Google Scholar] [CrossRef]
- Rodrigues, F.; Agra, A. An exact robust approach for the integrated berth allocation and quay crane scheduling problem under uncertain arrival times. Eur. J. Oper. Res. 2021, 295, 499–516. [Google Scholar] [CrossRef]
- Wang, C.; Miao, L.; Zhang, C.; Wu, T.; Liang, Z. Robust optimization for the integrated berth allocation and quay crane assignment problem. Naval Res. Logist. (NRL) 2023. [Google Scholar] [CrossRef]
- Nourmohammadzadeh, A.; Voß, S. A robust multiobjective model for the integrated berth and quay crane scheduling problem at seaside container terminals. Ann. Math. Artif. Intell. 2022, 90, 831–853. [Google Scholar] [CrossRef]
- Xu, B.; Jie, D.; Li, J.; Yang, Y.; Wen, F.; Song, H. Integrated scheduling optimization of U-shaped automated container terminal under loading and unloading mode. Comput. Ind. Eng. 2021, 162, 107695. [Google Scholar] [CrossRef]
- Cahyono, R.T.; Kenaka, S.P.; Jayawardhana, B. Simultaneous Allocation and Scheduling of Quay Cranes, Yard Cranes, and Trucks in Dynamical Integrated Container Terminal Operations. IEEE Trans. Intell. Transp. Syst. 2021, 23, 8564–8578. [Google Scholar] [CrossRef]
- Cai, L.; Guo, W.; He, L.; Li, W. Port integrated scheduling under uncertain operation time and cascade effects: A complex network structure entropy solution. Comput. Ind. Eng. 2023, 182, 109435. [Google Scholar] [CrossRef]
- Naeem, D.; Eltawil, A.; Iijima, J.; Gheith, M. Integrated Scheduling of Automated Yard Cranes and Automated Guided Vehicles with Limited Buffer Capacity of Dual-Trolley Quay Cranes in Automated Container Terminals. Logistics 2022, 6, 82. [Google Scholar] [CrossRef]
- Liu, W.; Zhu, X.; Wang, L.; Zhang, Q.; Tan, K.C. Integrated Scheduling of Yard and Rail Container Handling Equipment and Internal Trucks in a Multimodal Port. IEEE Trans. Intell. Transp. Syst. 2023, 1–12. [Google Scholar] [CrossRef]
- Tan, C.; Yan, W.; Yue, J. Quay crane scheduling in automated container terminal for the trade-off between operation efficiency and energy consumption. Adv. Eng. Inform. 2021, 48, 101285. [Google Scholar] [CrossRef]
- Li, H.; Li, X. A Branch-and-Bound Algorithm for the Bi-Objective Quay Crane Scheduling Problem Based on Efficiency and Energy. Mathematics 2022, 10, 4705. [Google Scholar] [CrossRef]
- Zhong, L.; He, L.; Li, Y.; Zhang, Y.; Zhou, Y.; Li, W. Enhanced Multi-Objective Evolutionary Algorithm for Green Scheduling of Heterogeneous Quay Cranes Considering Cooperative Movement and Safety. J. Mar. Sci. Eng. 2023, 11, 1884. [Google Scholar] [CrossRef]
- Yue, L.; Fan, H.; Zhai, C. Joint configuration and scheduling optimization of a dual-trolley quay crane and automatic guided vehicles with consideration of vessel stability. Sustainability 2019, 12, 24. [Google Scholar] [CrossRef]
- Karam, A.; Eltawil, A.; Hegner Reinau, K. Energy-efficient and integrated allocation of berths, quay cranes, and internal trucks in container terminals. Sustainability 2020, 12, 3202. [Google Scholar] [CrossRef]
- Hong, C.; Guo, Y.; Wang, Y.; Li, T. The Integrated Scheduling Optimization for Container Handling by Using Driverless Electric Truck in Automated Container Terminal. Sustainability 2023, 15, 5536. [Google Scholar] [CrossRef]
- Zheng, Y.; Xu, M.; Wang, Z.; Xiao, Y. A Genetic Algorithm for Integrated Scheduling of Container Handing Systems at Container Terminals from a Low-Carbon Operations Perspective. Sustainability 2023, 15, 6035. [Google Scholar] [CrossRef]
- Zhong, Z.; Guo, Y.; Zhang, J.; Yang, S. Energy-aware Integrated Scheduling for Container Terminals with Conflict-free AGVs. J. Syst. Sci. Syst. Eng. 2023, 32, 411–443. [Google Scholar] [CrossRef]
- Sun, B.; Zhai, G.; Li, S.; Pei, B. Multi-resource collaborative scheduling problem of automated terminal considering the AGV charging effect under COVID-19. Ocean Coast. Manag. 2023, 232, 106422. [Google Scholar] [CrossRef]
- Jiang, M.; Feng, J.; Zhou, J.; Zhou, L.; Ma, F.; Wu, G.; Zhang, Y. Multi-Terminal Berth and Quay Crane Joint Scheduling in Container Ports Considering Carbon Cost. Sustainability 2023, 15, 5018. [Google Scholar] [CrossRef]
- Zhen, L.; Yu, S.; Wang, S.; Sun, Z. Scheduling quay cranes and yard trucks for unloading operations in container ports. Ann. Oper. Res. 2019, 273, 455–478. [Google Scholar] [CrossRef]
- Xue, J.; Shen, B. A novel swarm intelligence optimization approach: Sparrow search algorithm. Syst. Sci. Control Eng. 2020, 8, 22–34. [Google Scholar] [CrossRef]
- Gu, Q.; Jiang, B.; Chang, Z.; Li, X. An improved sparrow search algorithms for solving large-scale optimization problems. Control Dec. 2023, 38, 1960–1968. [Google Scholar] [CrossRef]
- Hu, S.; Wei, L. Improved Sparrow Search Algorithm Based on Hybrid Strategy. Comput. Technol. Dev. 2023, 33, 146–153, 160. [Google Scholar]
- Chai, Y.; Sun, X.; Ren, S. Chaotic Sparrow SearchAlgorithm Based on Multi-Directional Learning. Comput. Eng. Appl. 2023, 59, 81–91. [Google Scholar]
- Chen, G.; Zeng, G.; Huang, B.; Liu, J. Sparrow Search Algorithm Based on Spiral Exploration and Adaptive Hybrid Mutation. J. Chin. Comput. Syst. 2023, 44, 779–786. [Google Scholar] [CrossRef]
- Mirjalili, S.; Mirjalili, S.M.; Lewis, A. Grey wolf optimizer. Adv. Eng. Softw. 2014, 69, 46–61. [Google Scholar] [CrossRef]
- Dhiman, G.; Kumar, V. Seagull optimization algorithm: Theory and its applications for large-scale industrial engineering problems. Knowl.-Based Syst. 2019, 165, 169–196. [Google Scholar] [CrossRef]
- Mirjalili, S.; Lewis, A. The whale optimization algorithm. Adv. Eng. Softw. 2016, 95, 51–67. [Google Scholar] [CrossRef]
Figure 1.
Layout of Guangzhou Port Nansha Phase IV Terminal.

Figure 2.
Cat mapping sequence distribution. (a) Distribution of population. (b) Frequency statistics.
Figure 2.
Cat mapping sequence distribution. (a) Distribution of population. (b) Frequency statistics.

Figure 3.
Stochastic initialized sequence distribution. (a) Distribution of population. (b) Frequency statistics.
Figure 3.
Stochastic initialized sequence distribution. (a) Distribution of population. (b) Frequency statistics.
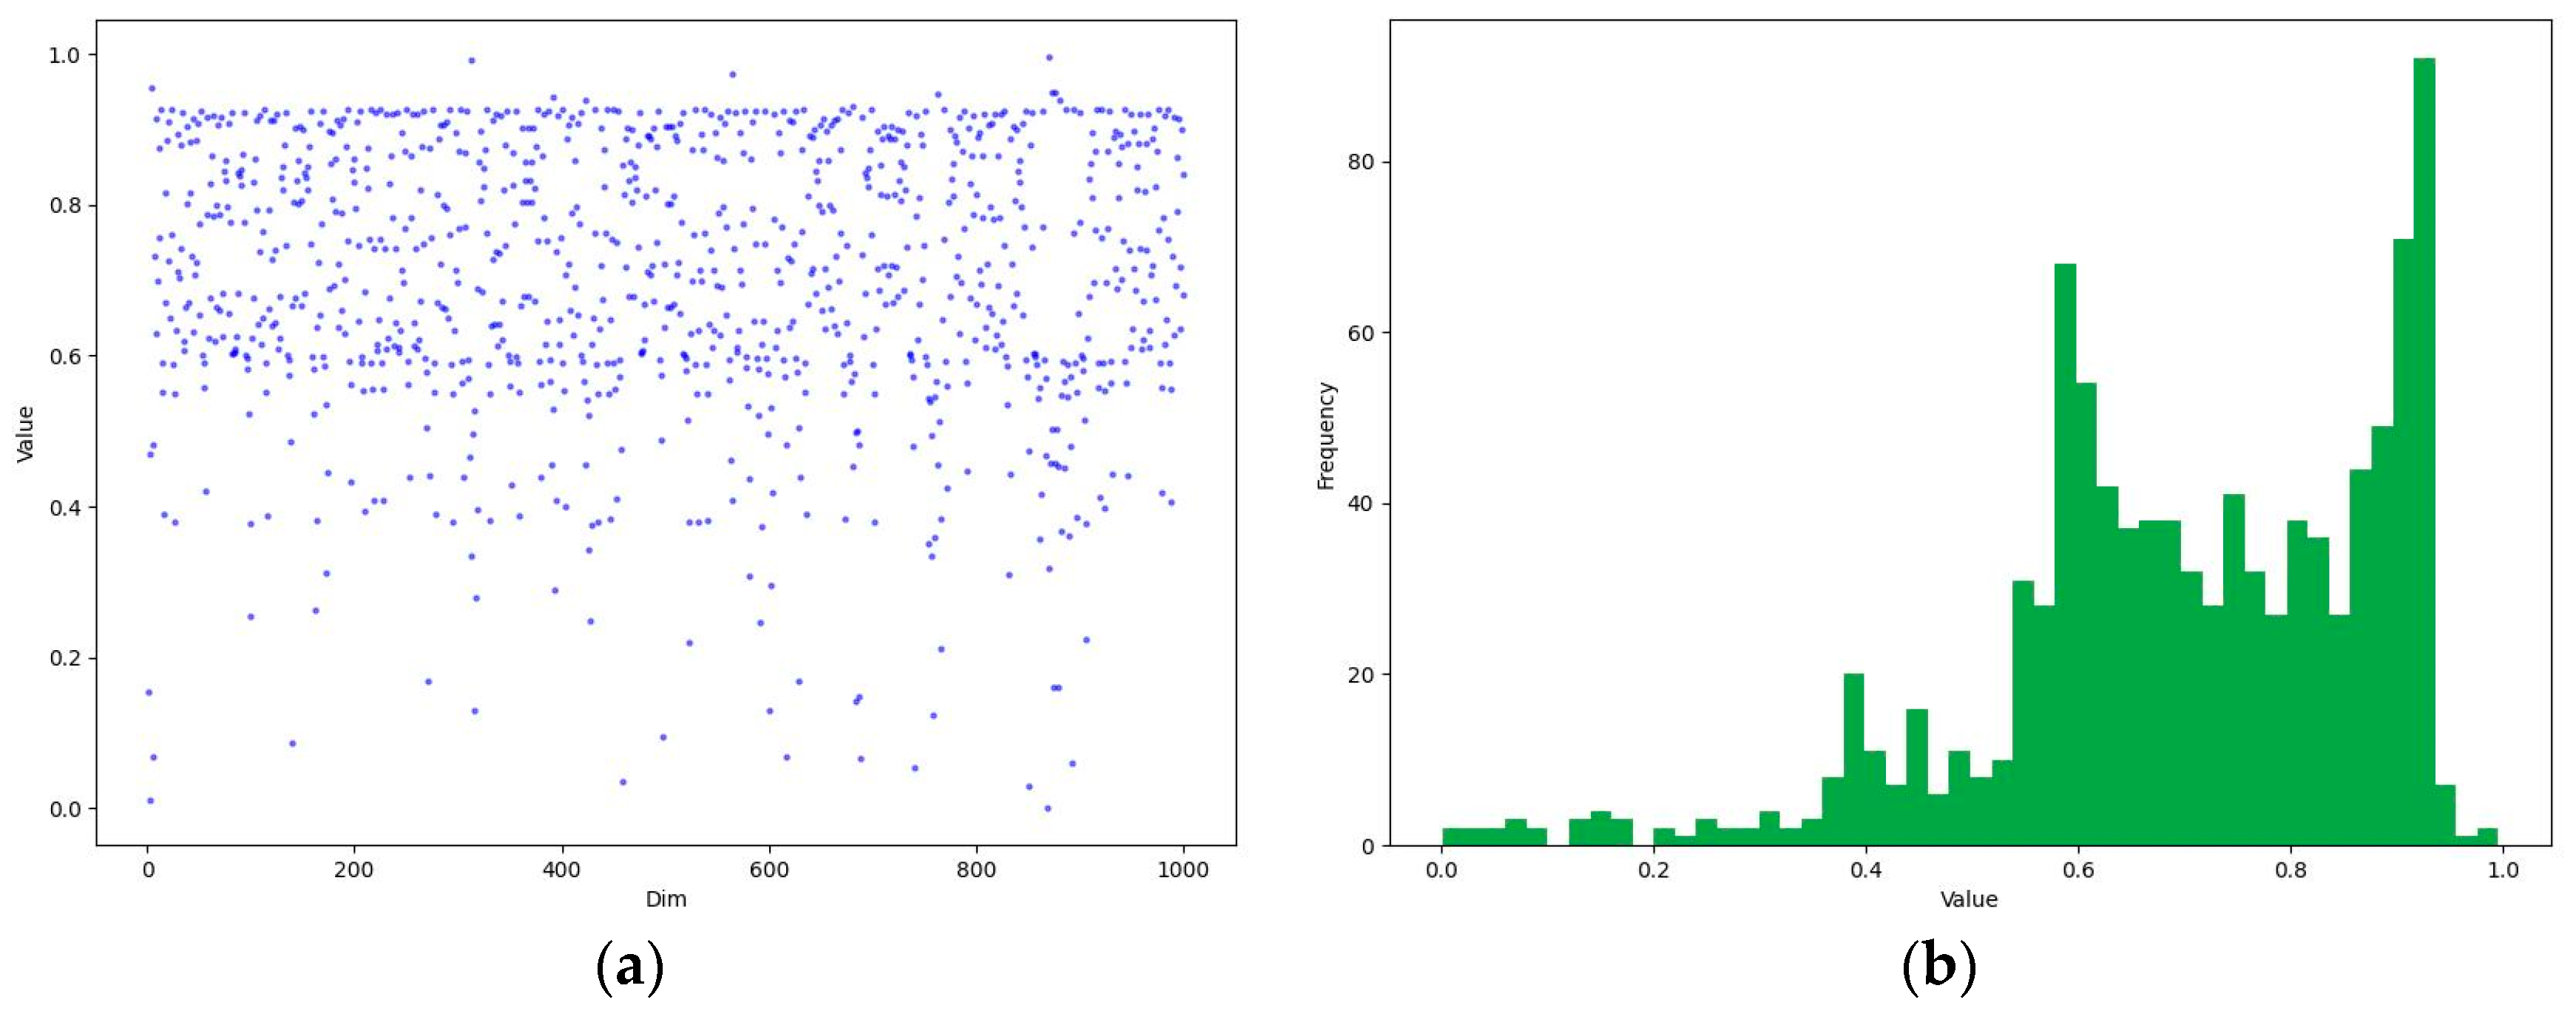
Figure 4.
Three distributions.
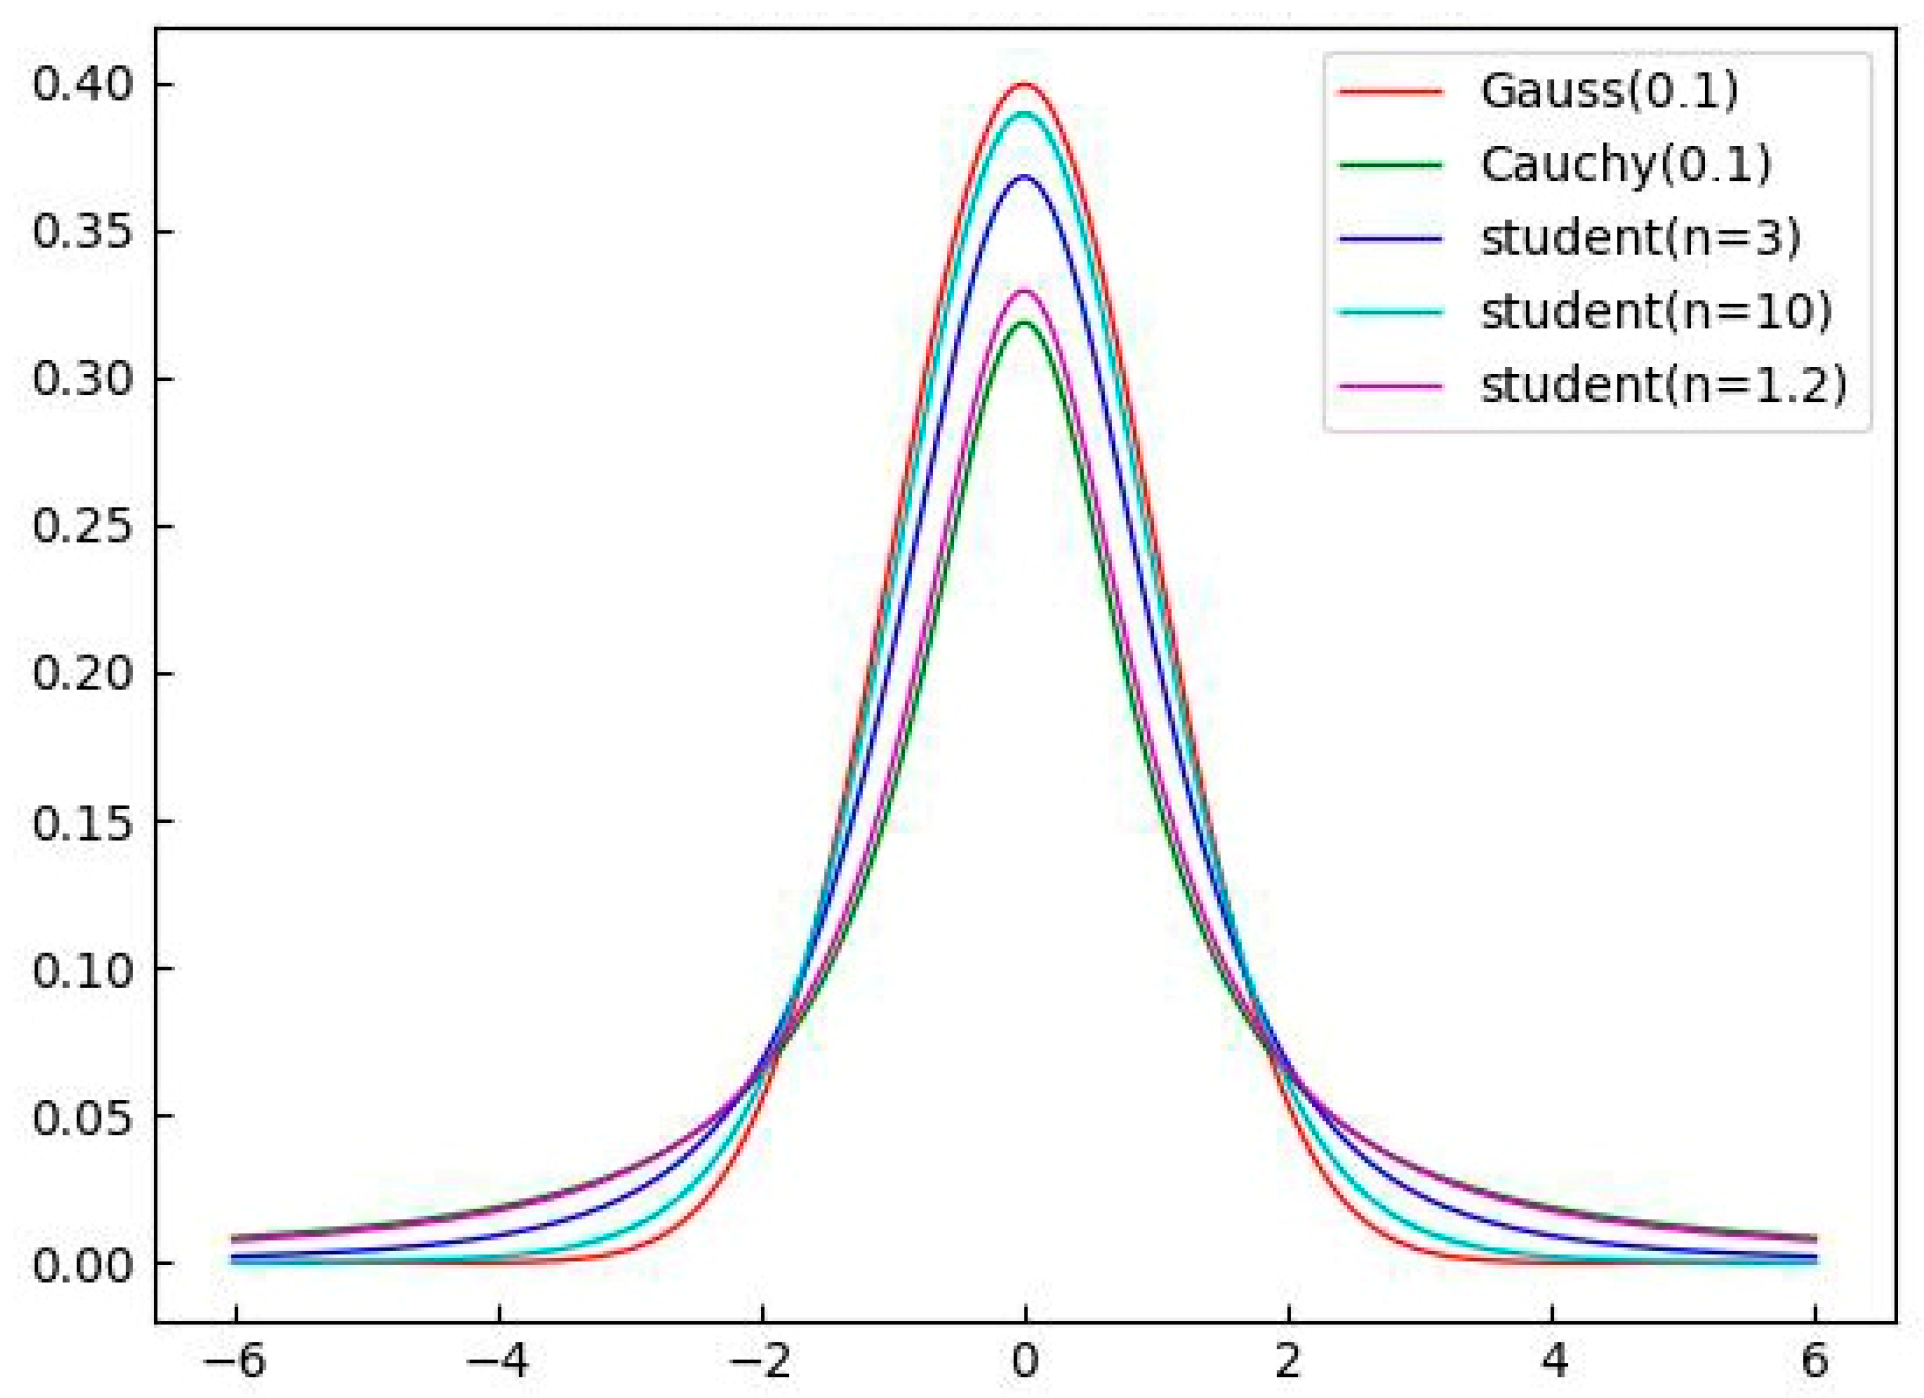
Figure 5.
Loading principle in each bay.
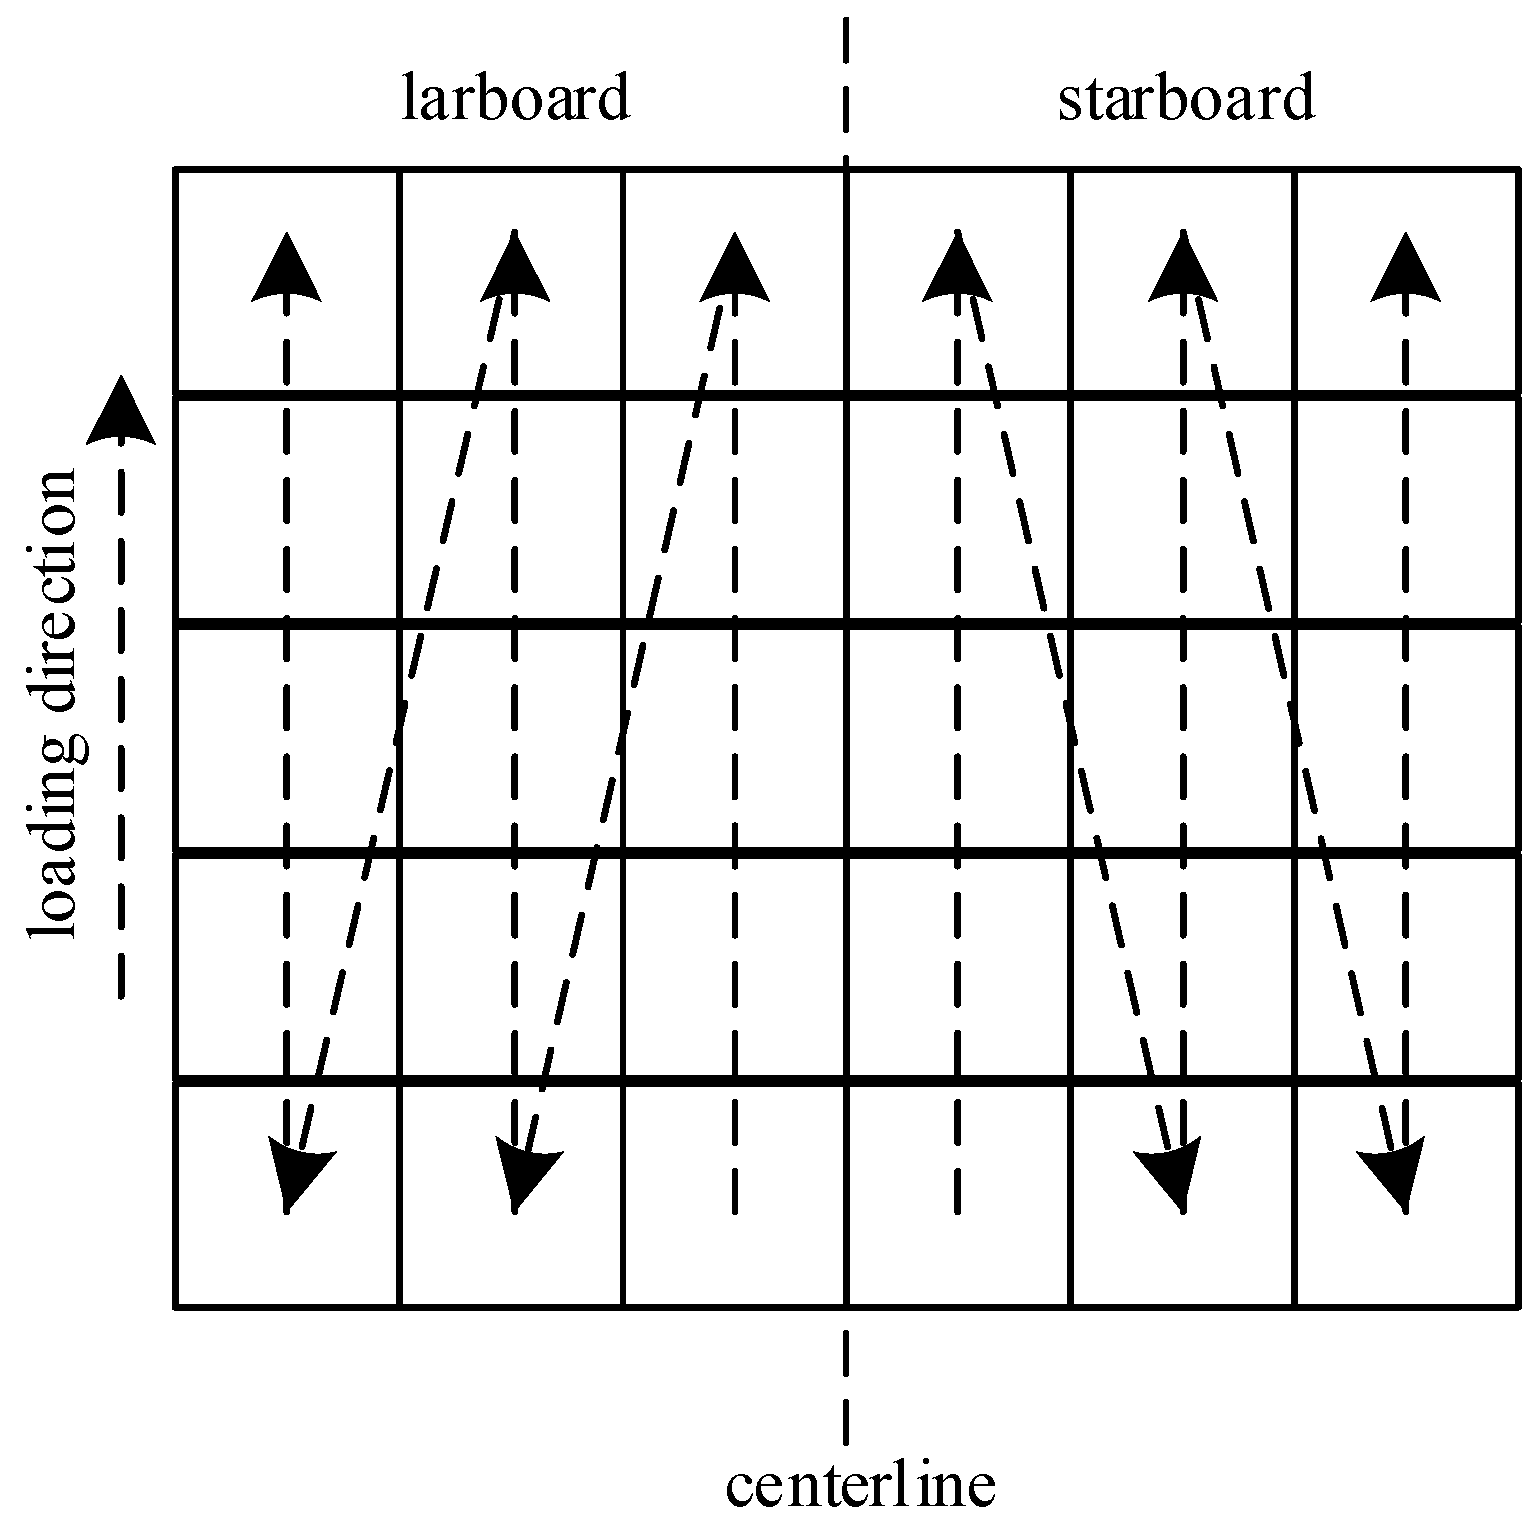
Figure 6.
Operation area of QCs.

Figure 7.
Flow of objective function calculation.
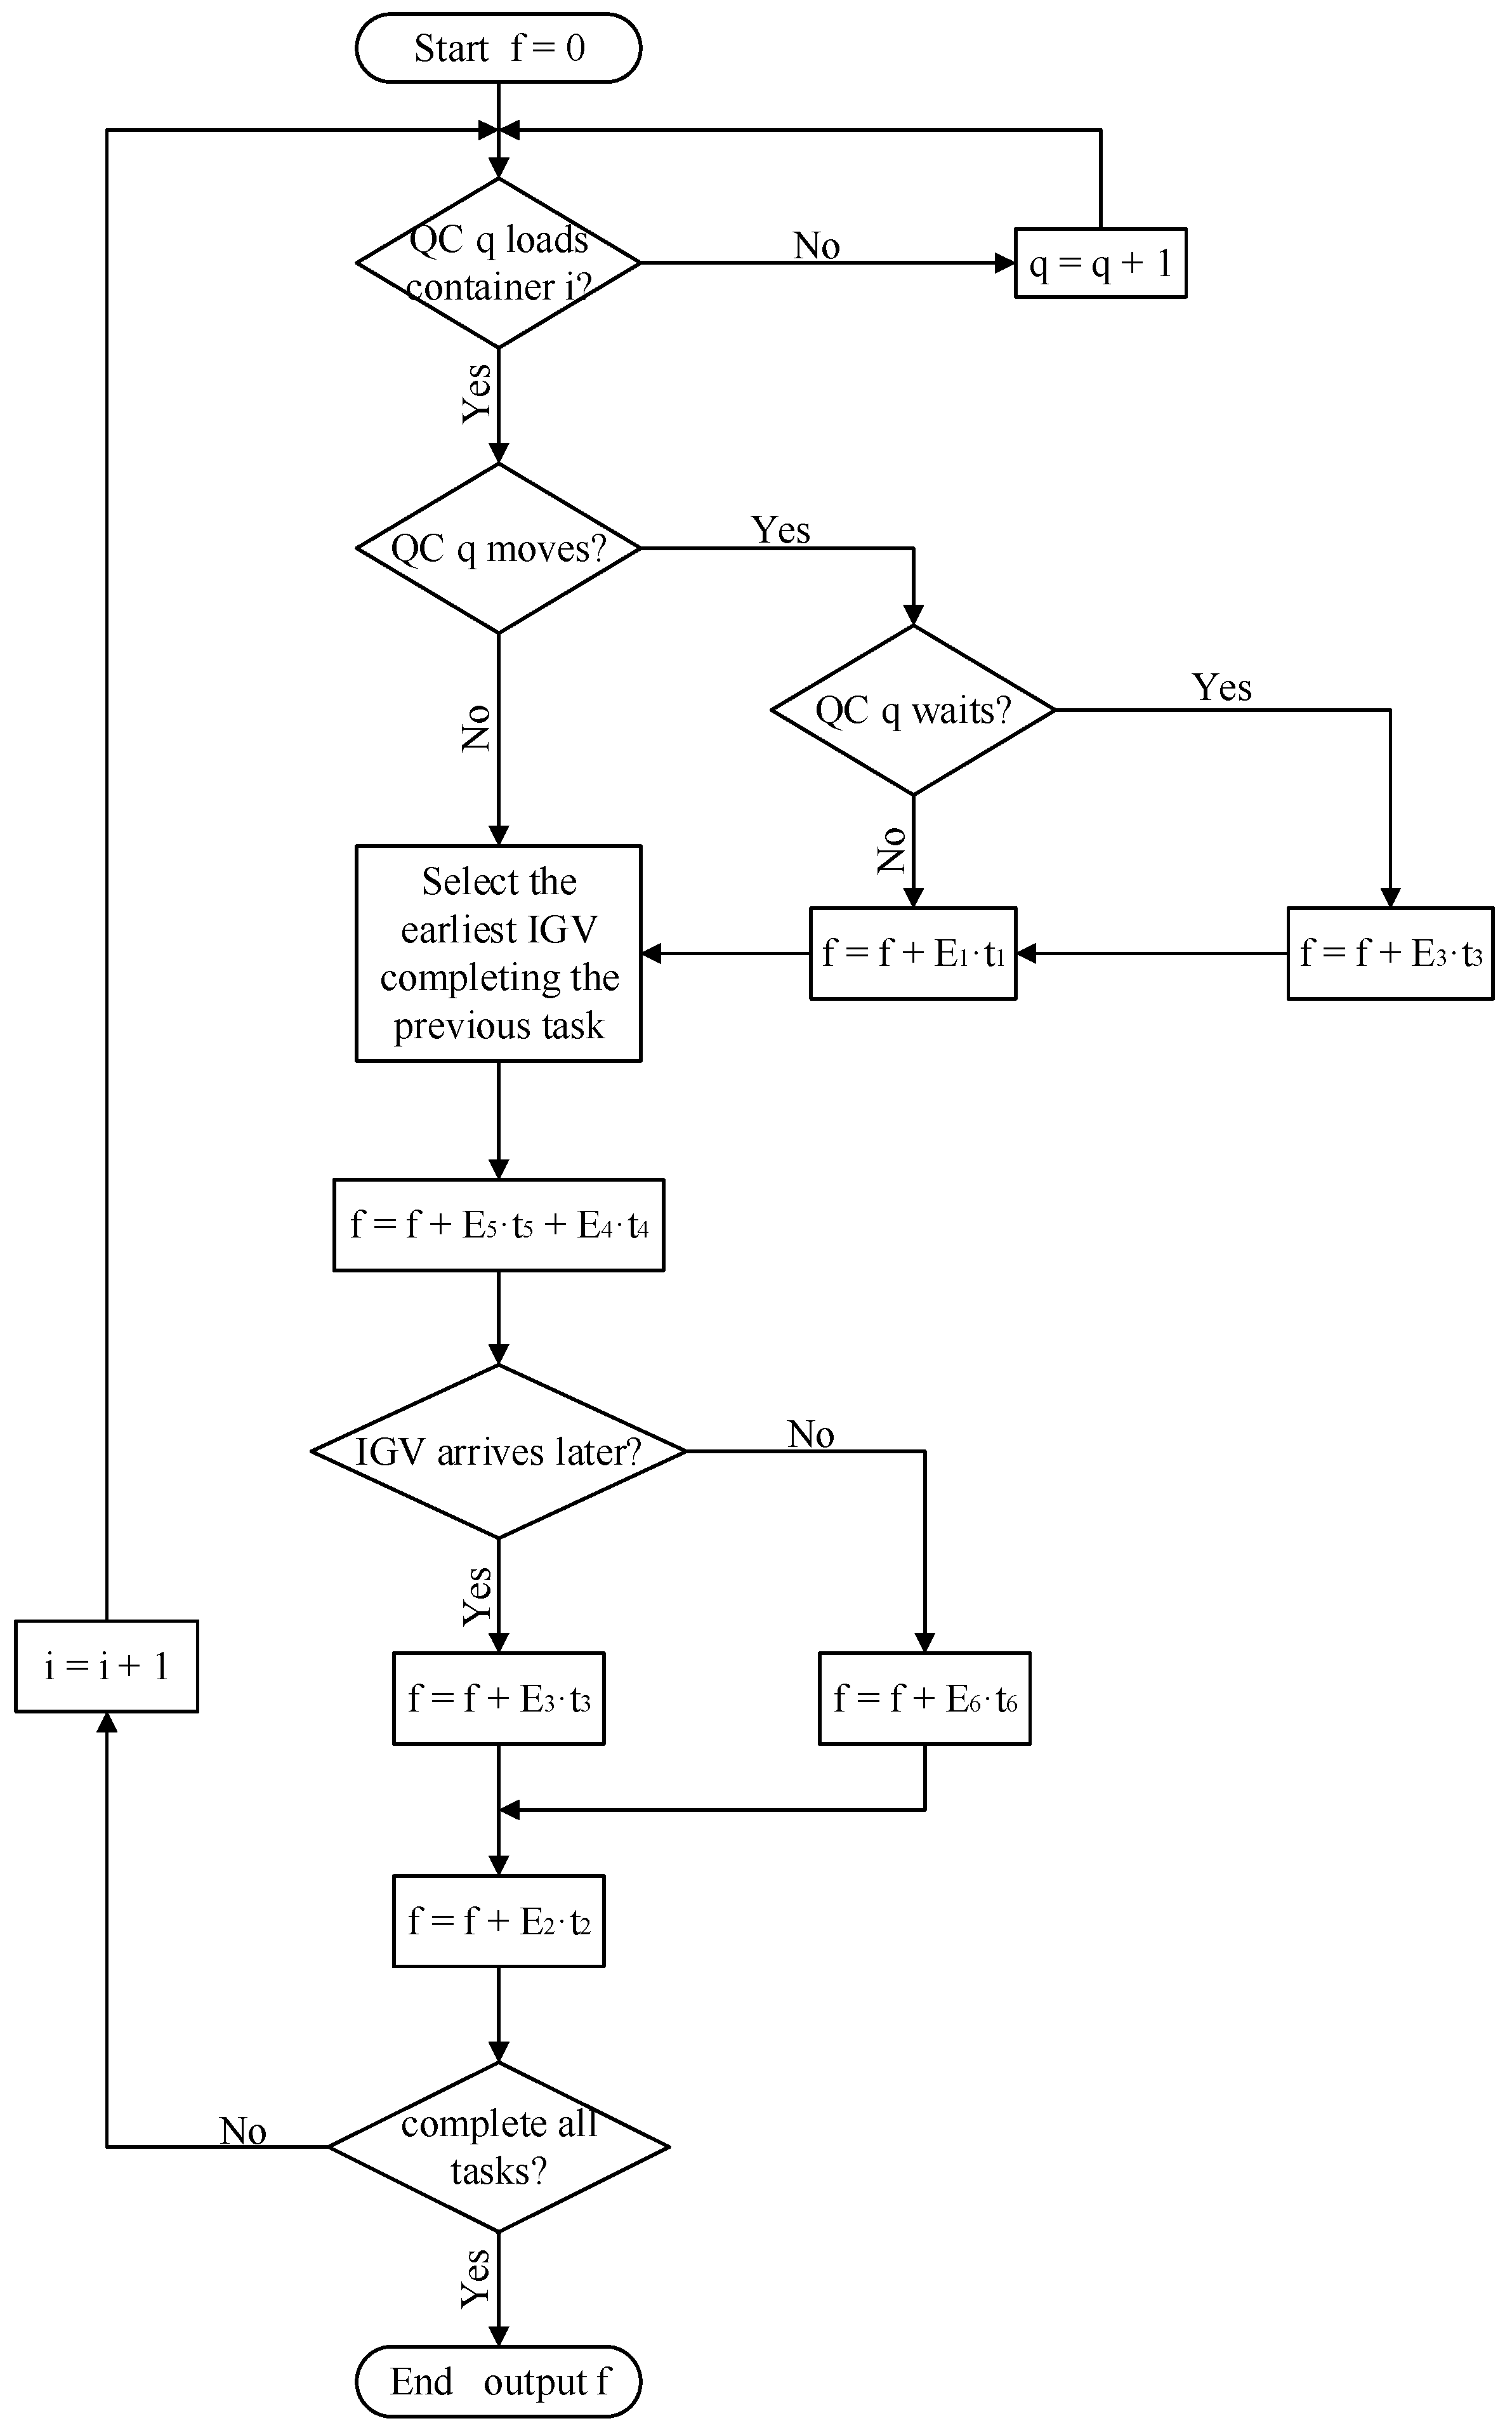
Figure 8.
Coordinate system of terminal layout.
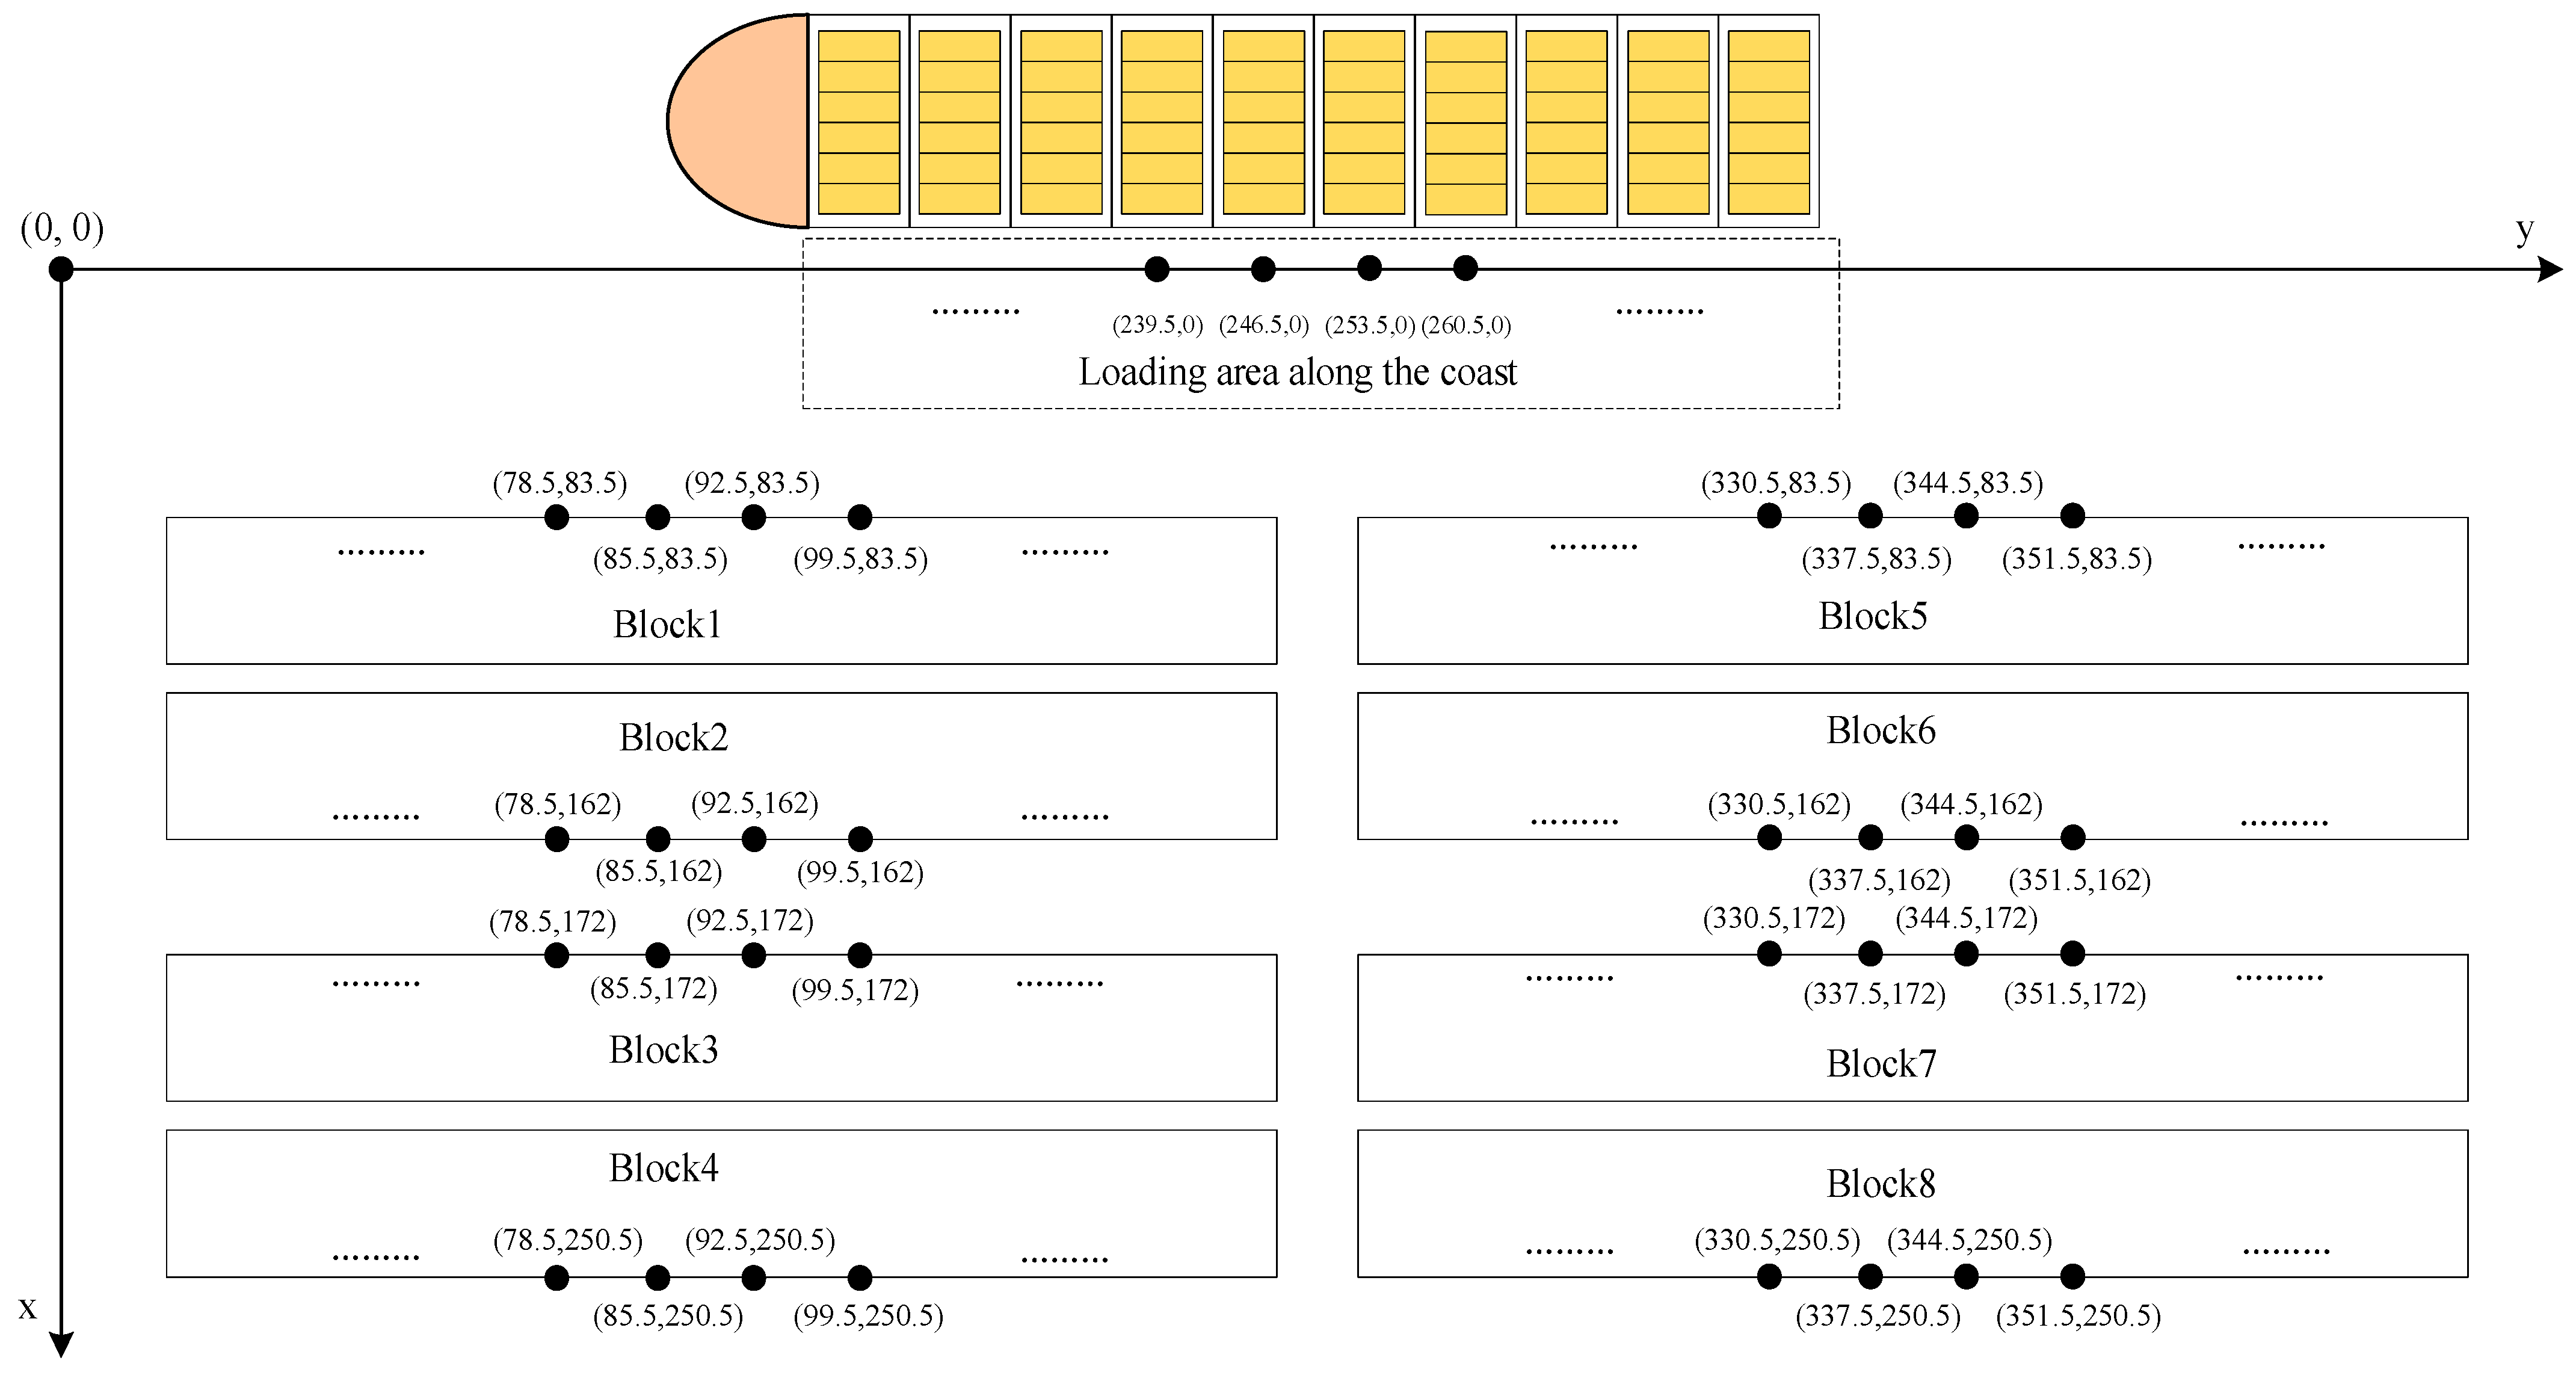
Figure 9.
Energy-consumption optimization results of all instances. (a) Instance 1. (b) Instance 2. (c) Instance 3. (d) Instance 4. (e) Instance 5. (f) Instance 6. (g) Instance 7. (h) Instance 8. (i) Instance 9. (j) Instance 10. (k) Instance 11. (l) Instance 12.
Figure 9.
Energy-consumption optimization results of all instances. (a) Instance 1. (b) Instance 2. (c) Instance 3. (d) Instance 4. (e) Instance 5. (f) Instance 6. (g) Instance 7. (h) Instance 8. (i) Instance 9. (j) Instance 10. (k) Instance 11. (l) Instance 12.
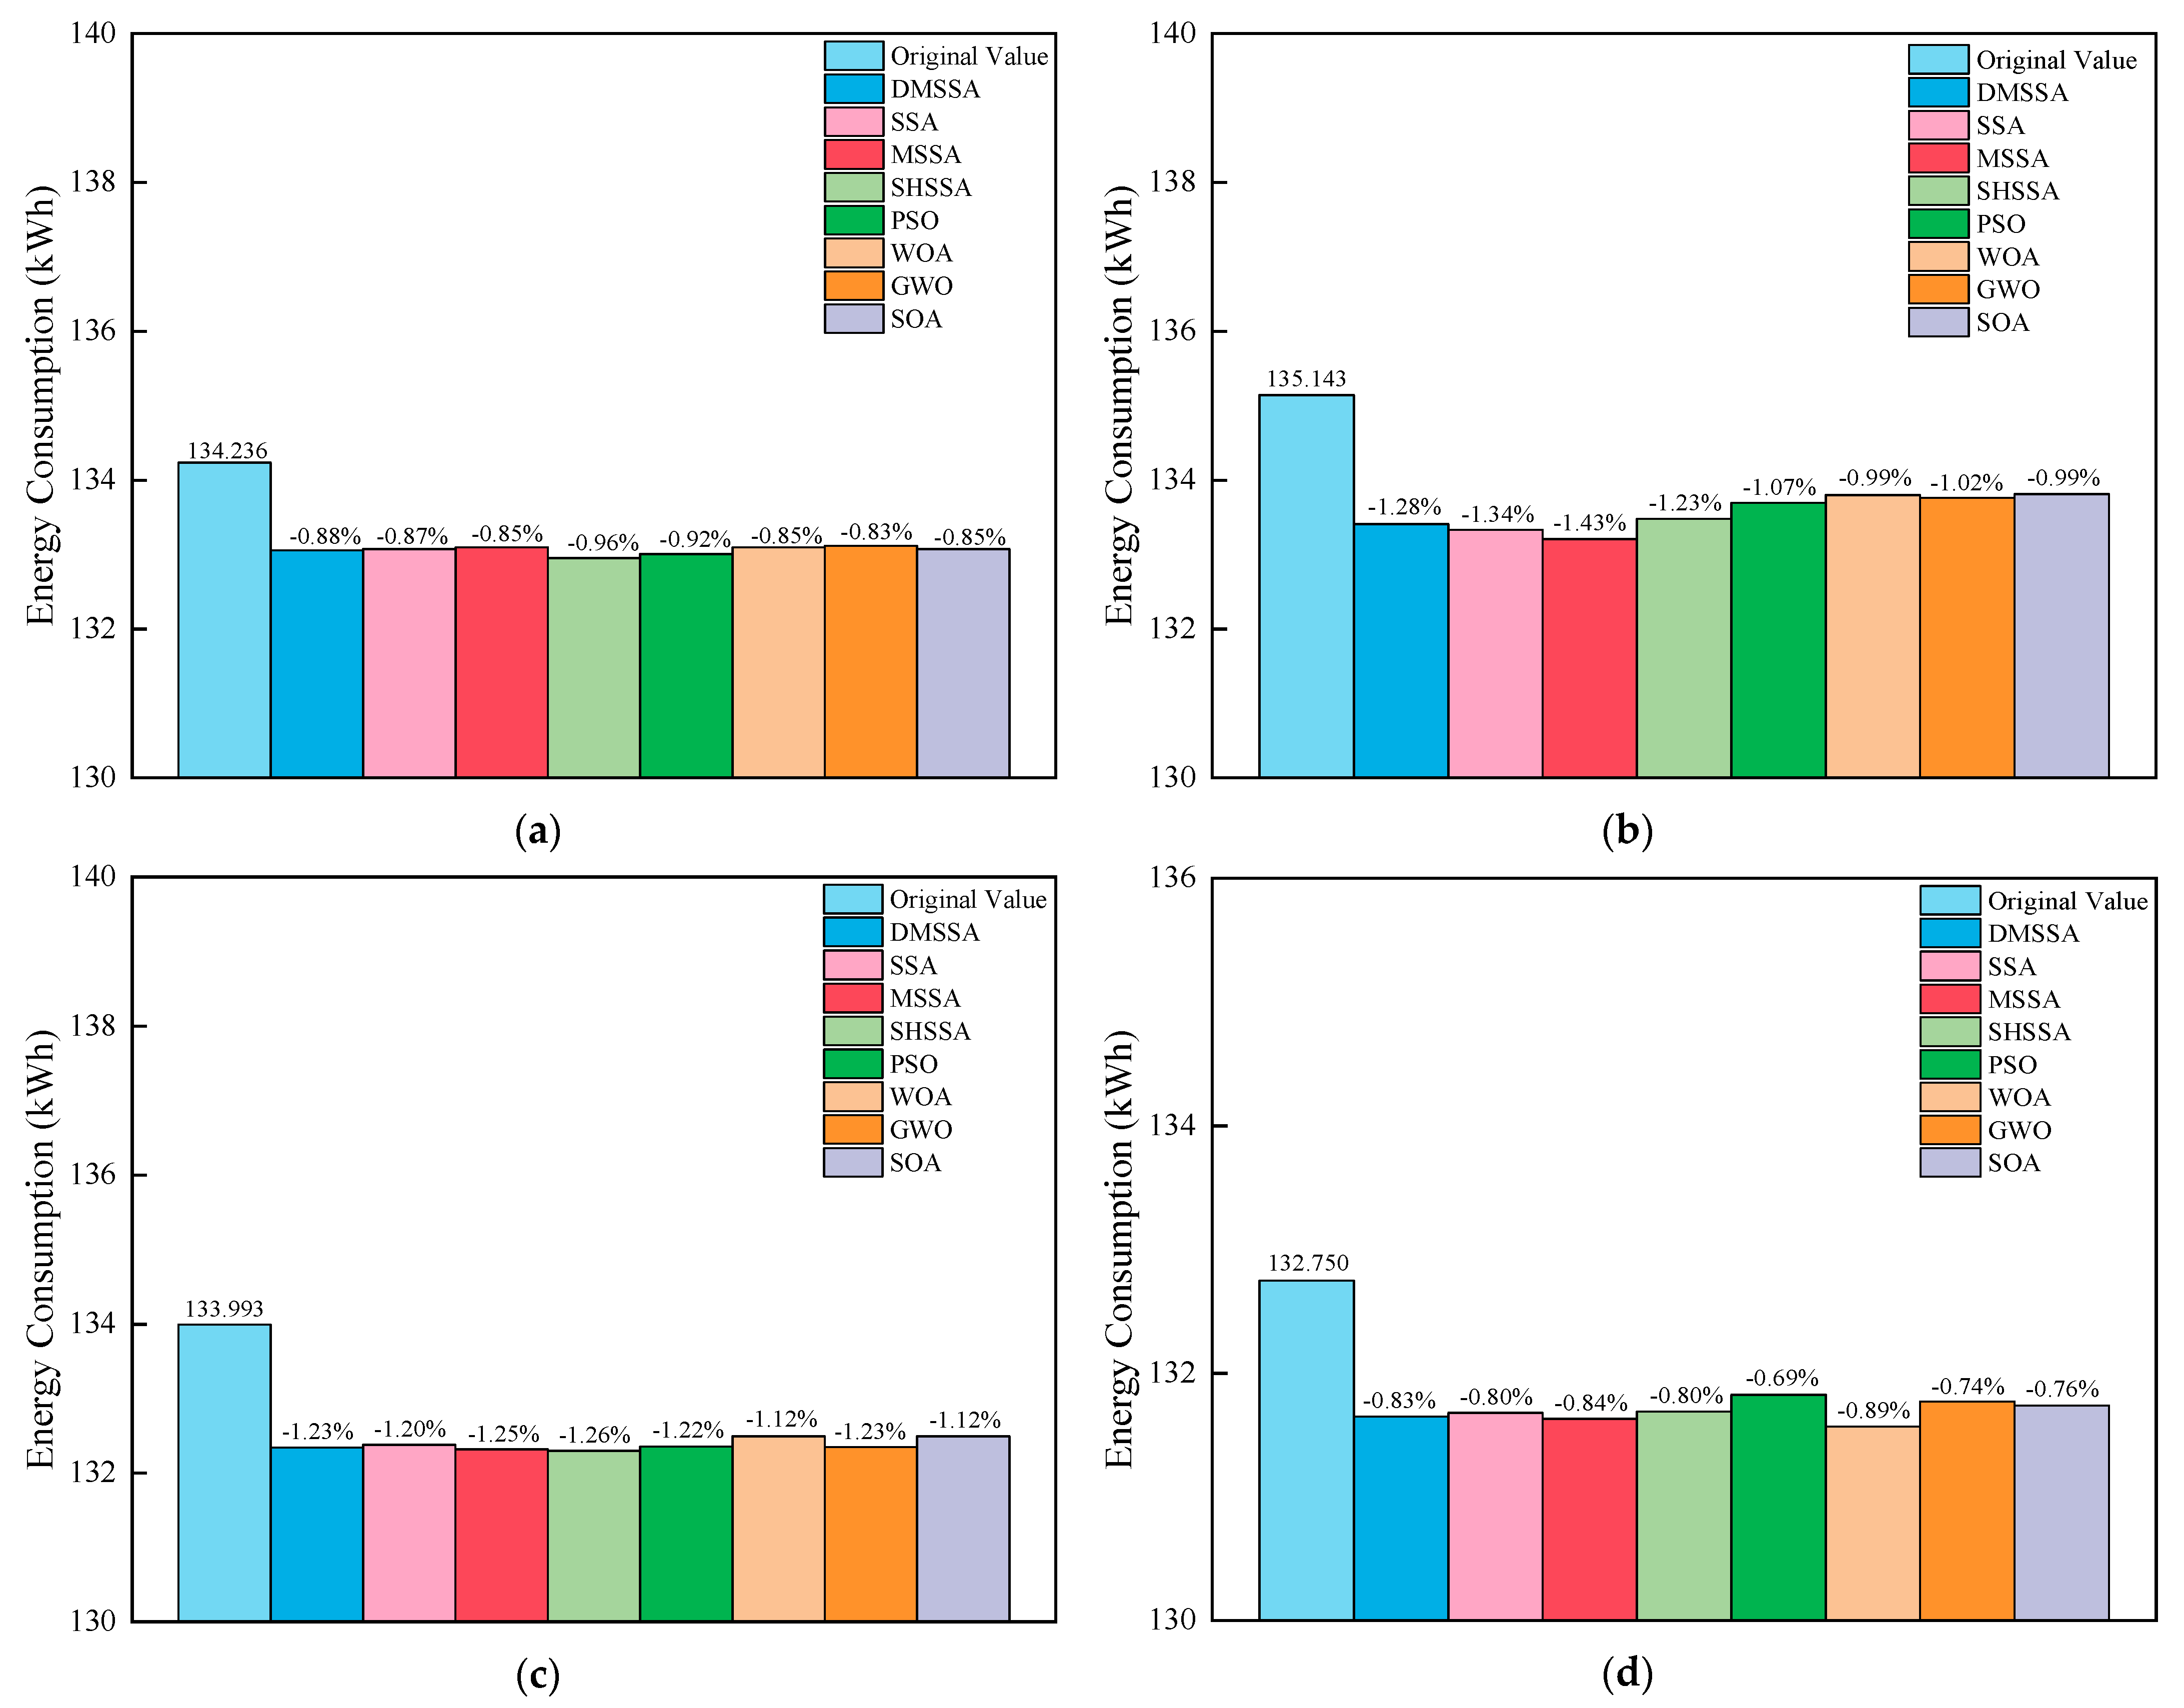
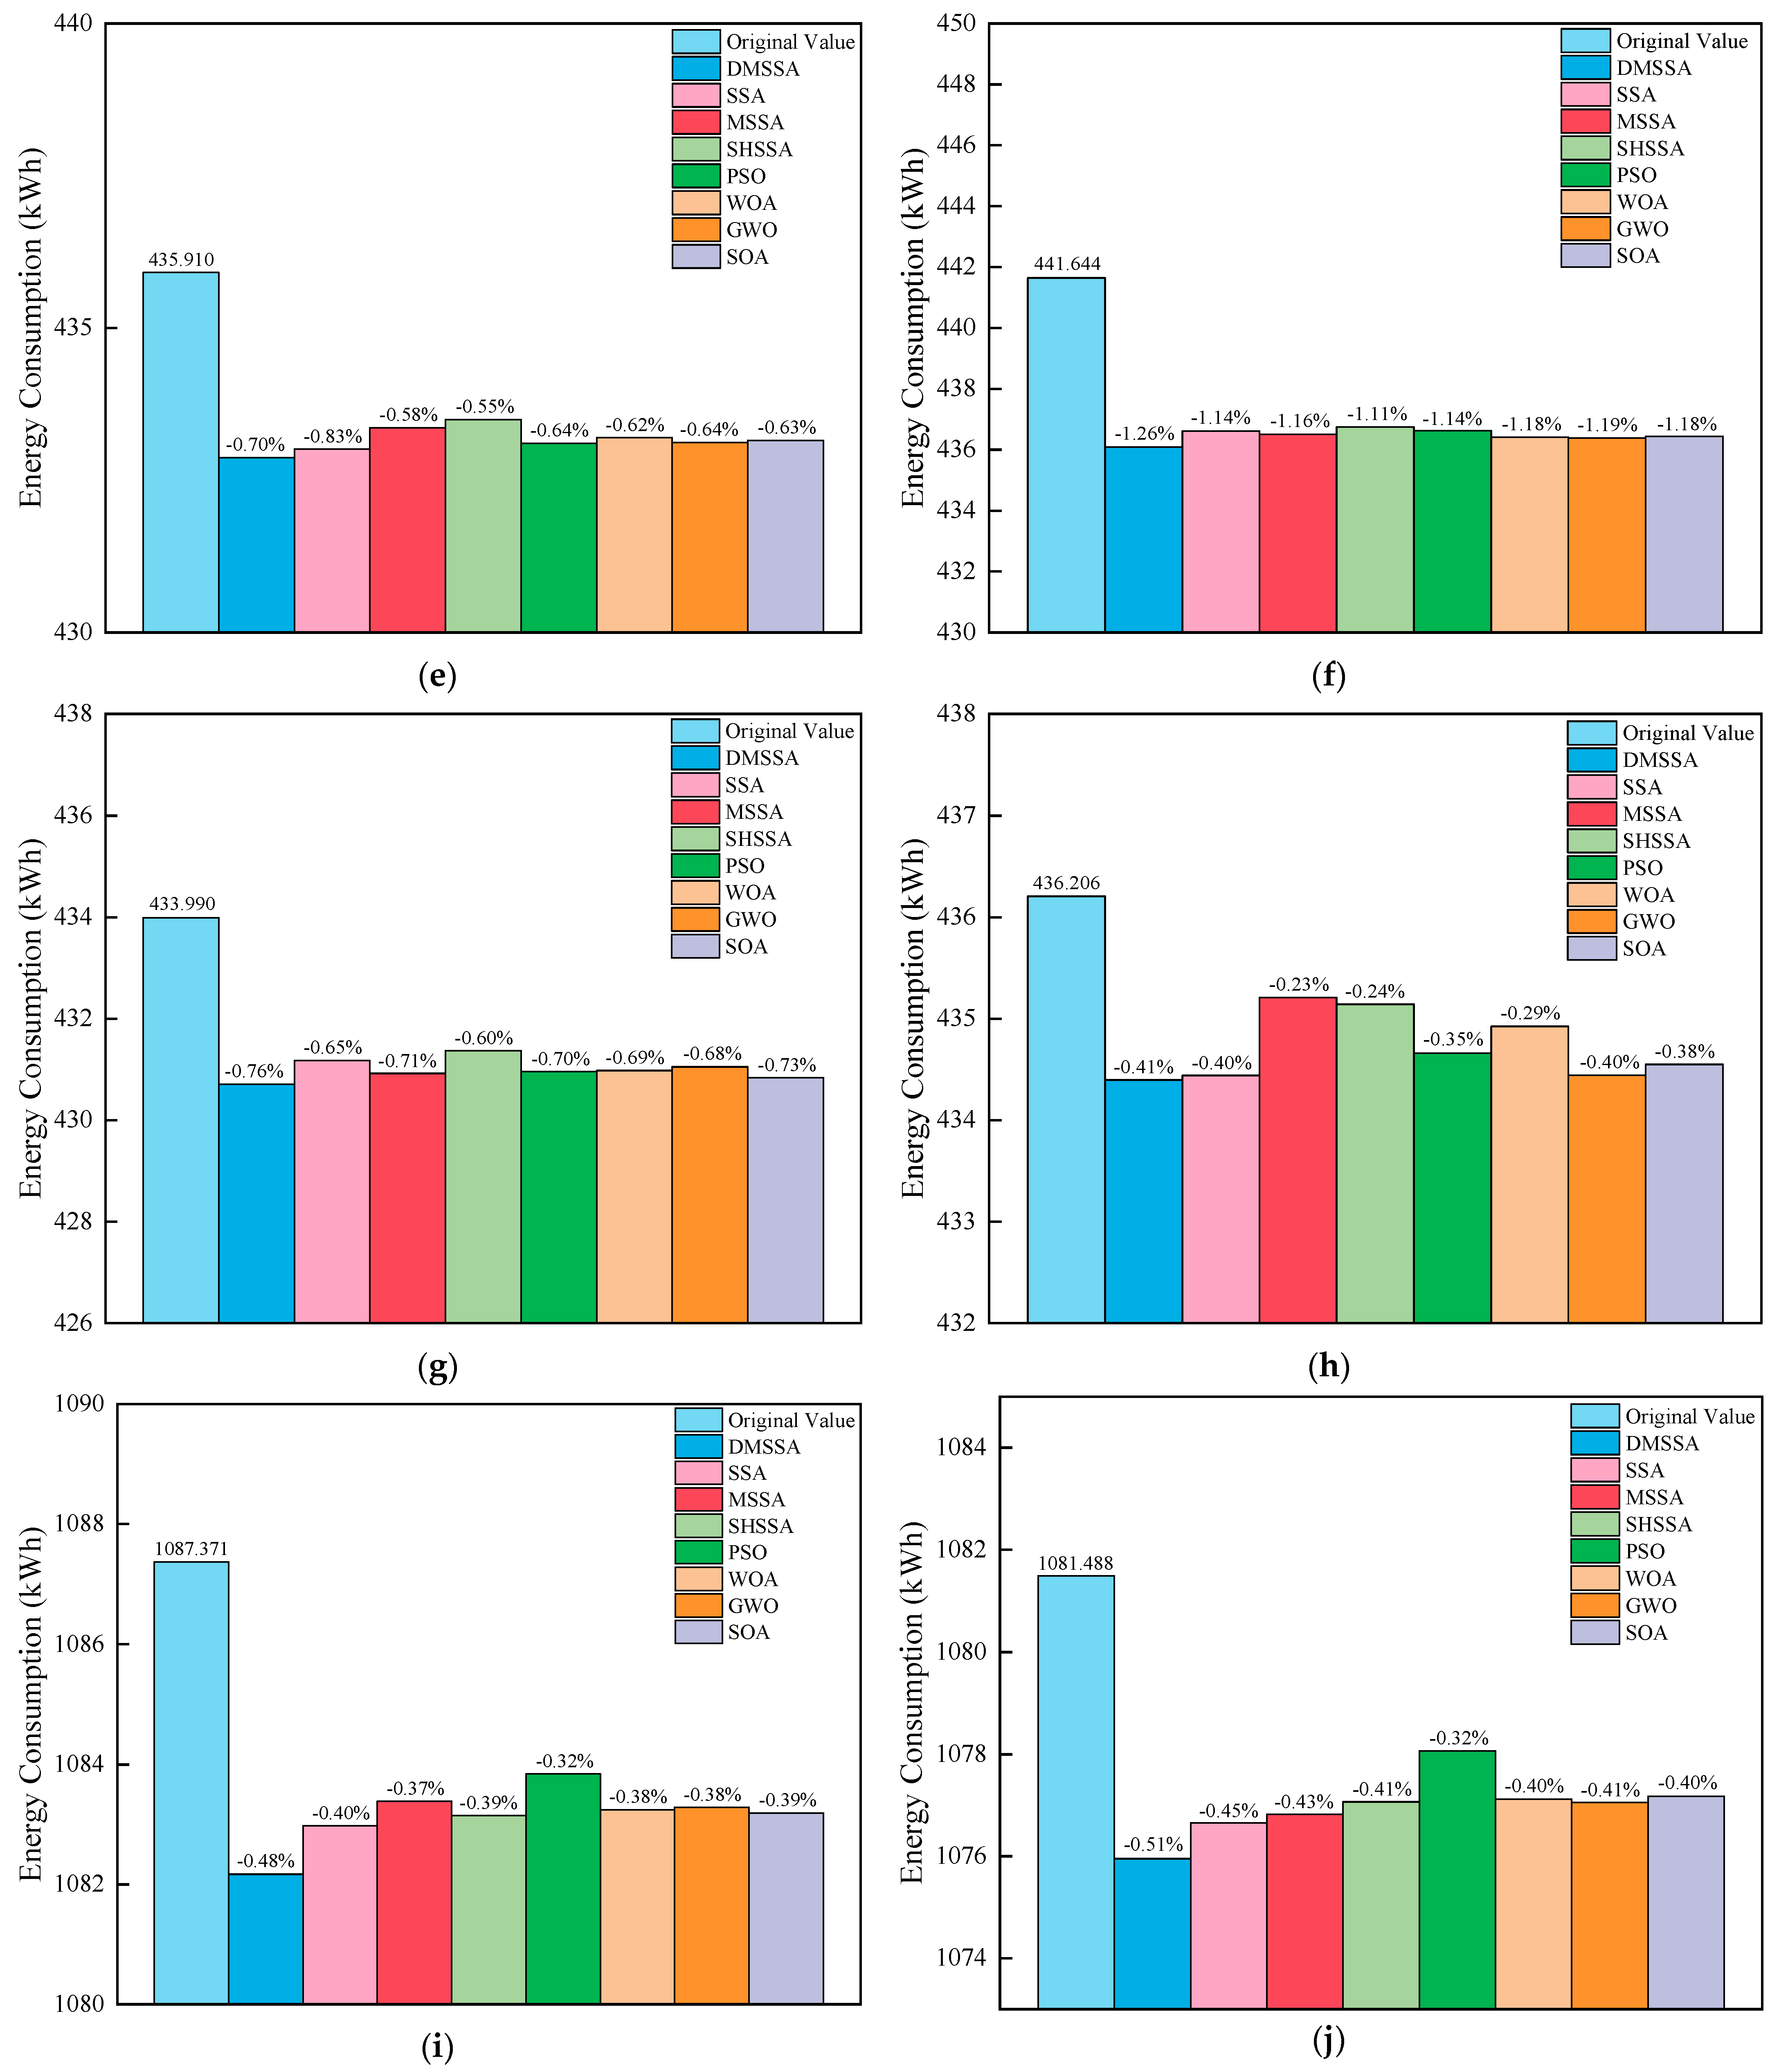
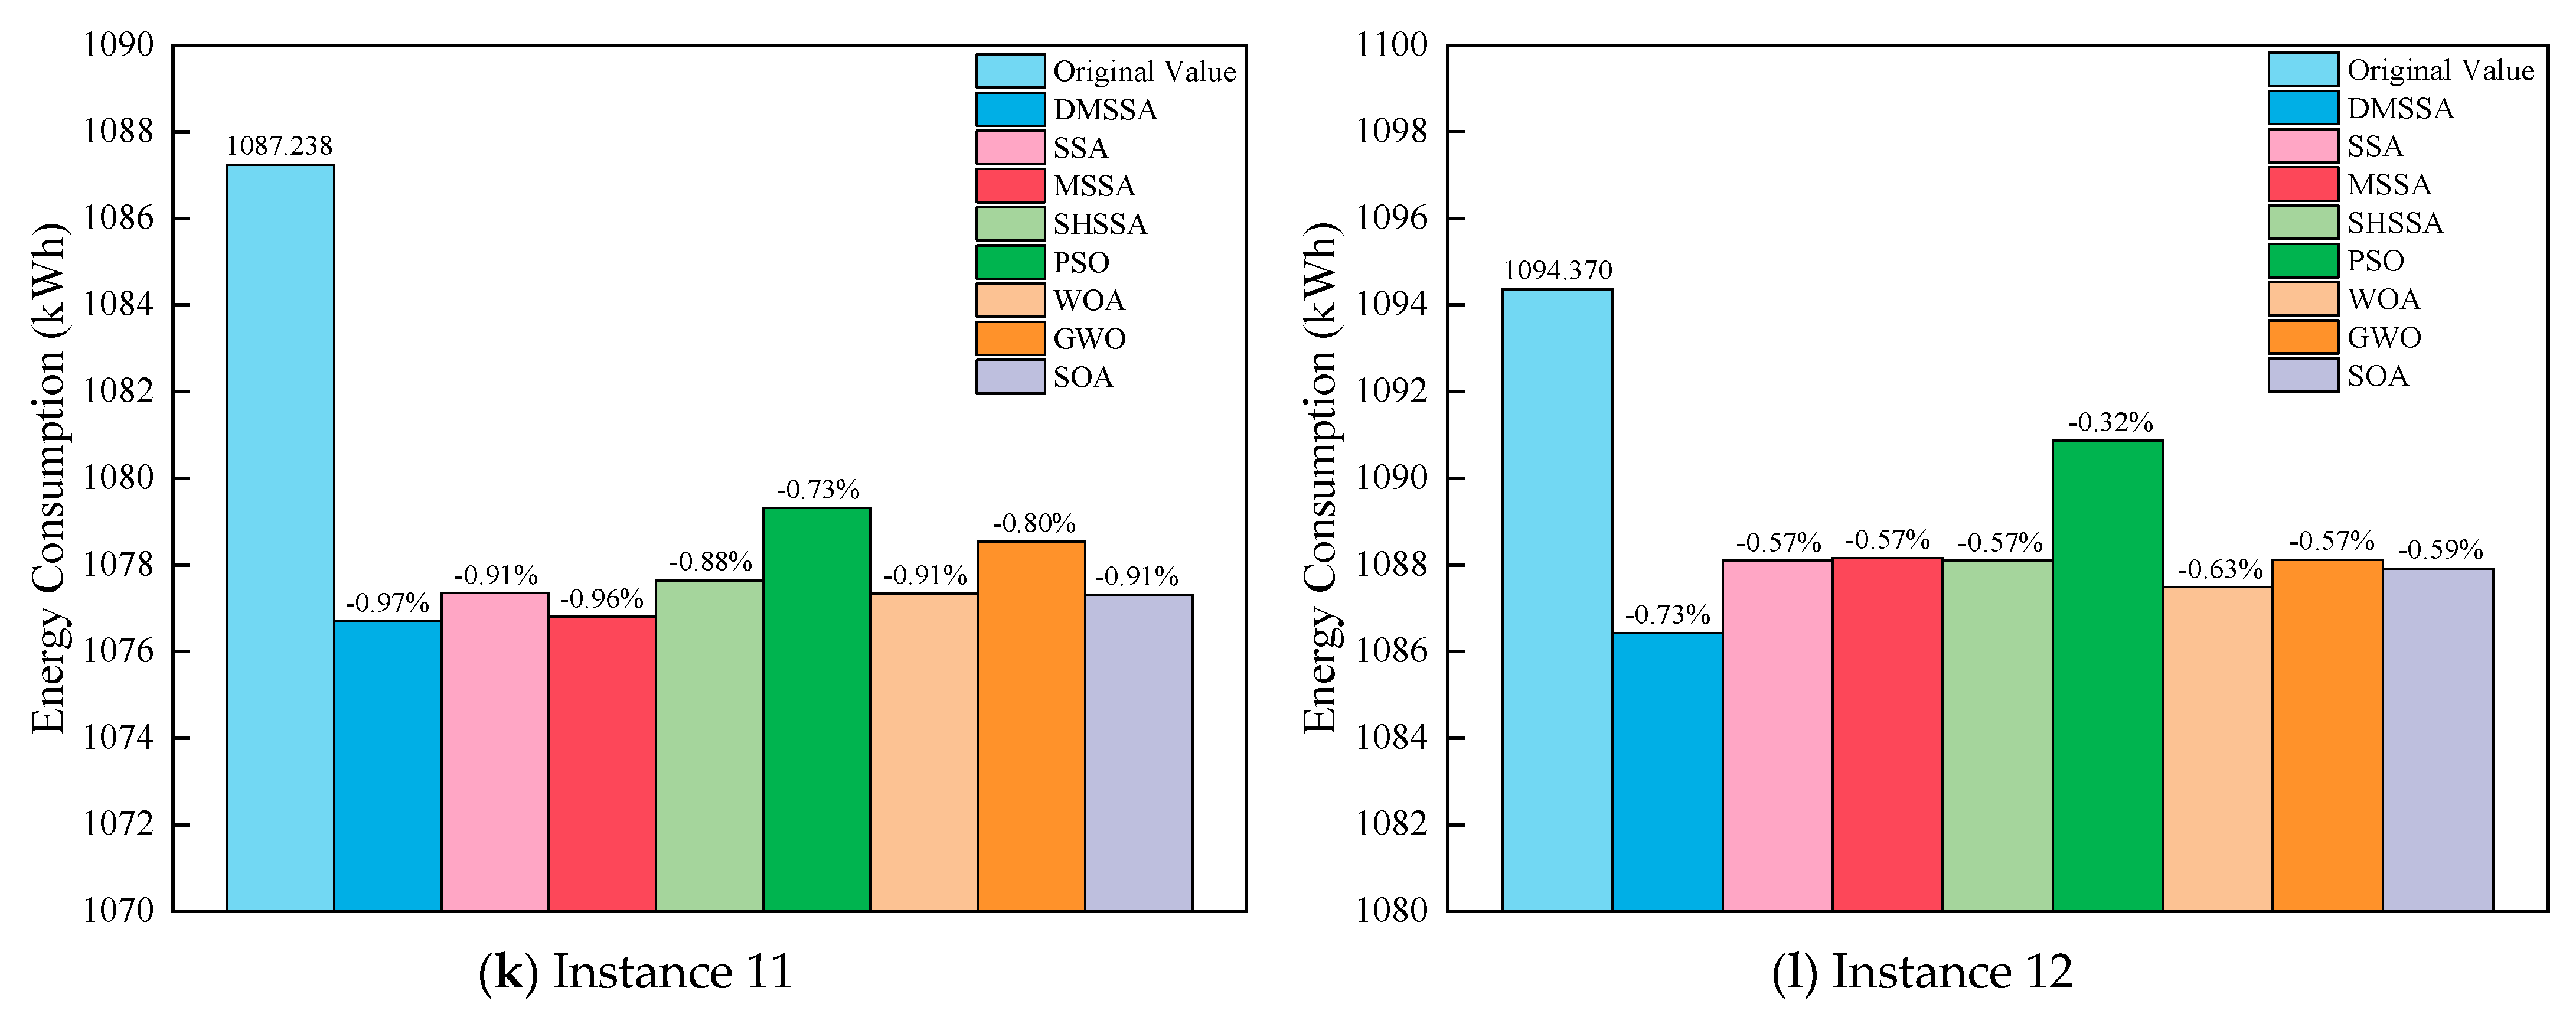
Figure 10.
Iteration curves for medium- and large-scale instance tests. (a) Instance 5. (b) Instance 6. (c) Instance 7. (d) Instance 8. (e) Instance 9. (f) Instance 10. (g) Instance 11. (h) Instance 12.
Figure 10.
Iteration curves for medium- and large-scale instance tests. (a) Instance 5. (b) Instance 6. (c) Instance 7. (d) Instance 8. (e) Instance 9. (f) Instance 10. (g) Instance 11. (h) Instance 12.
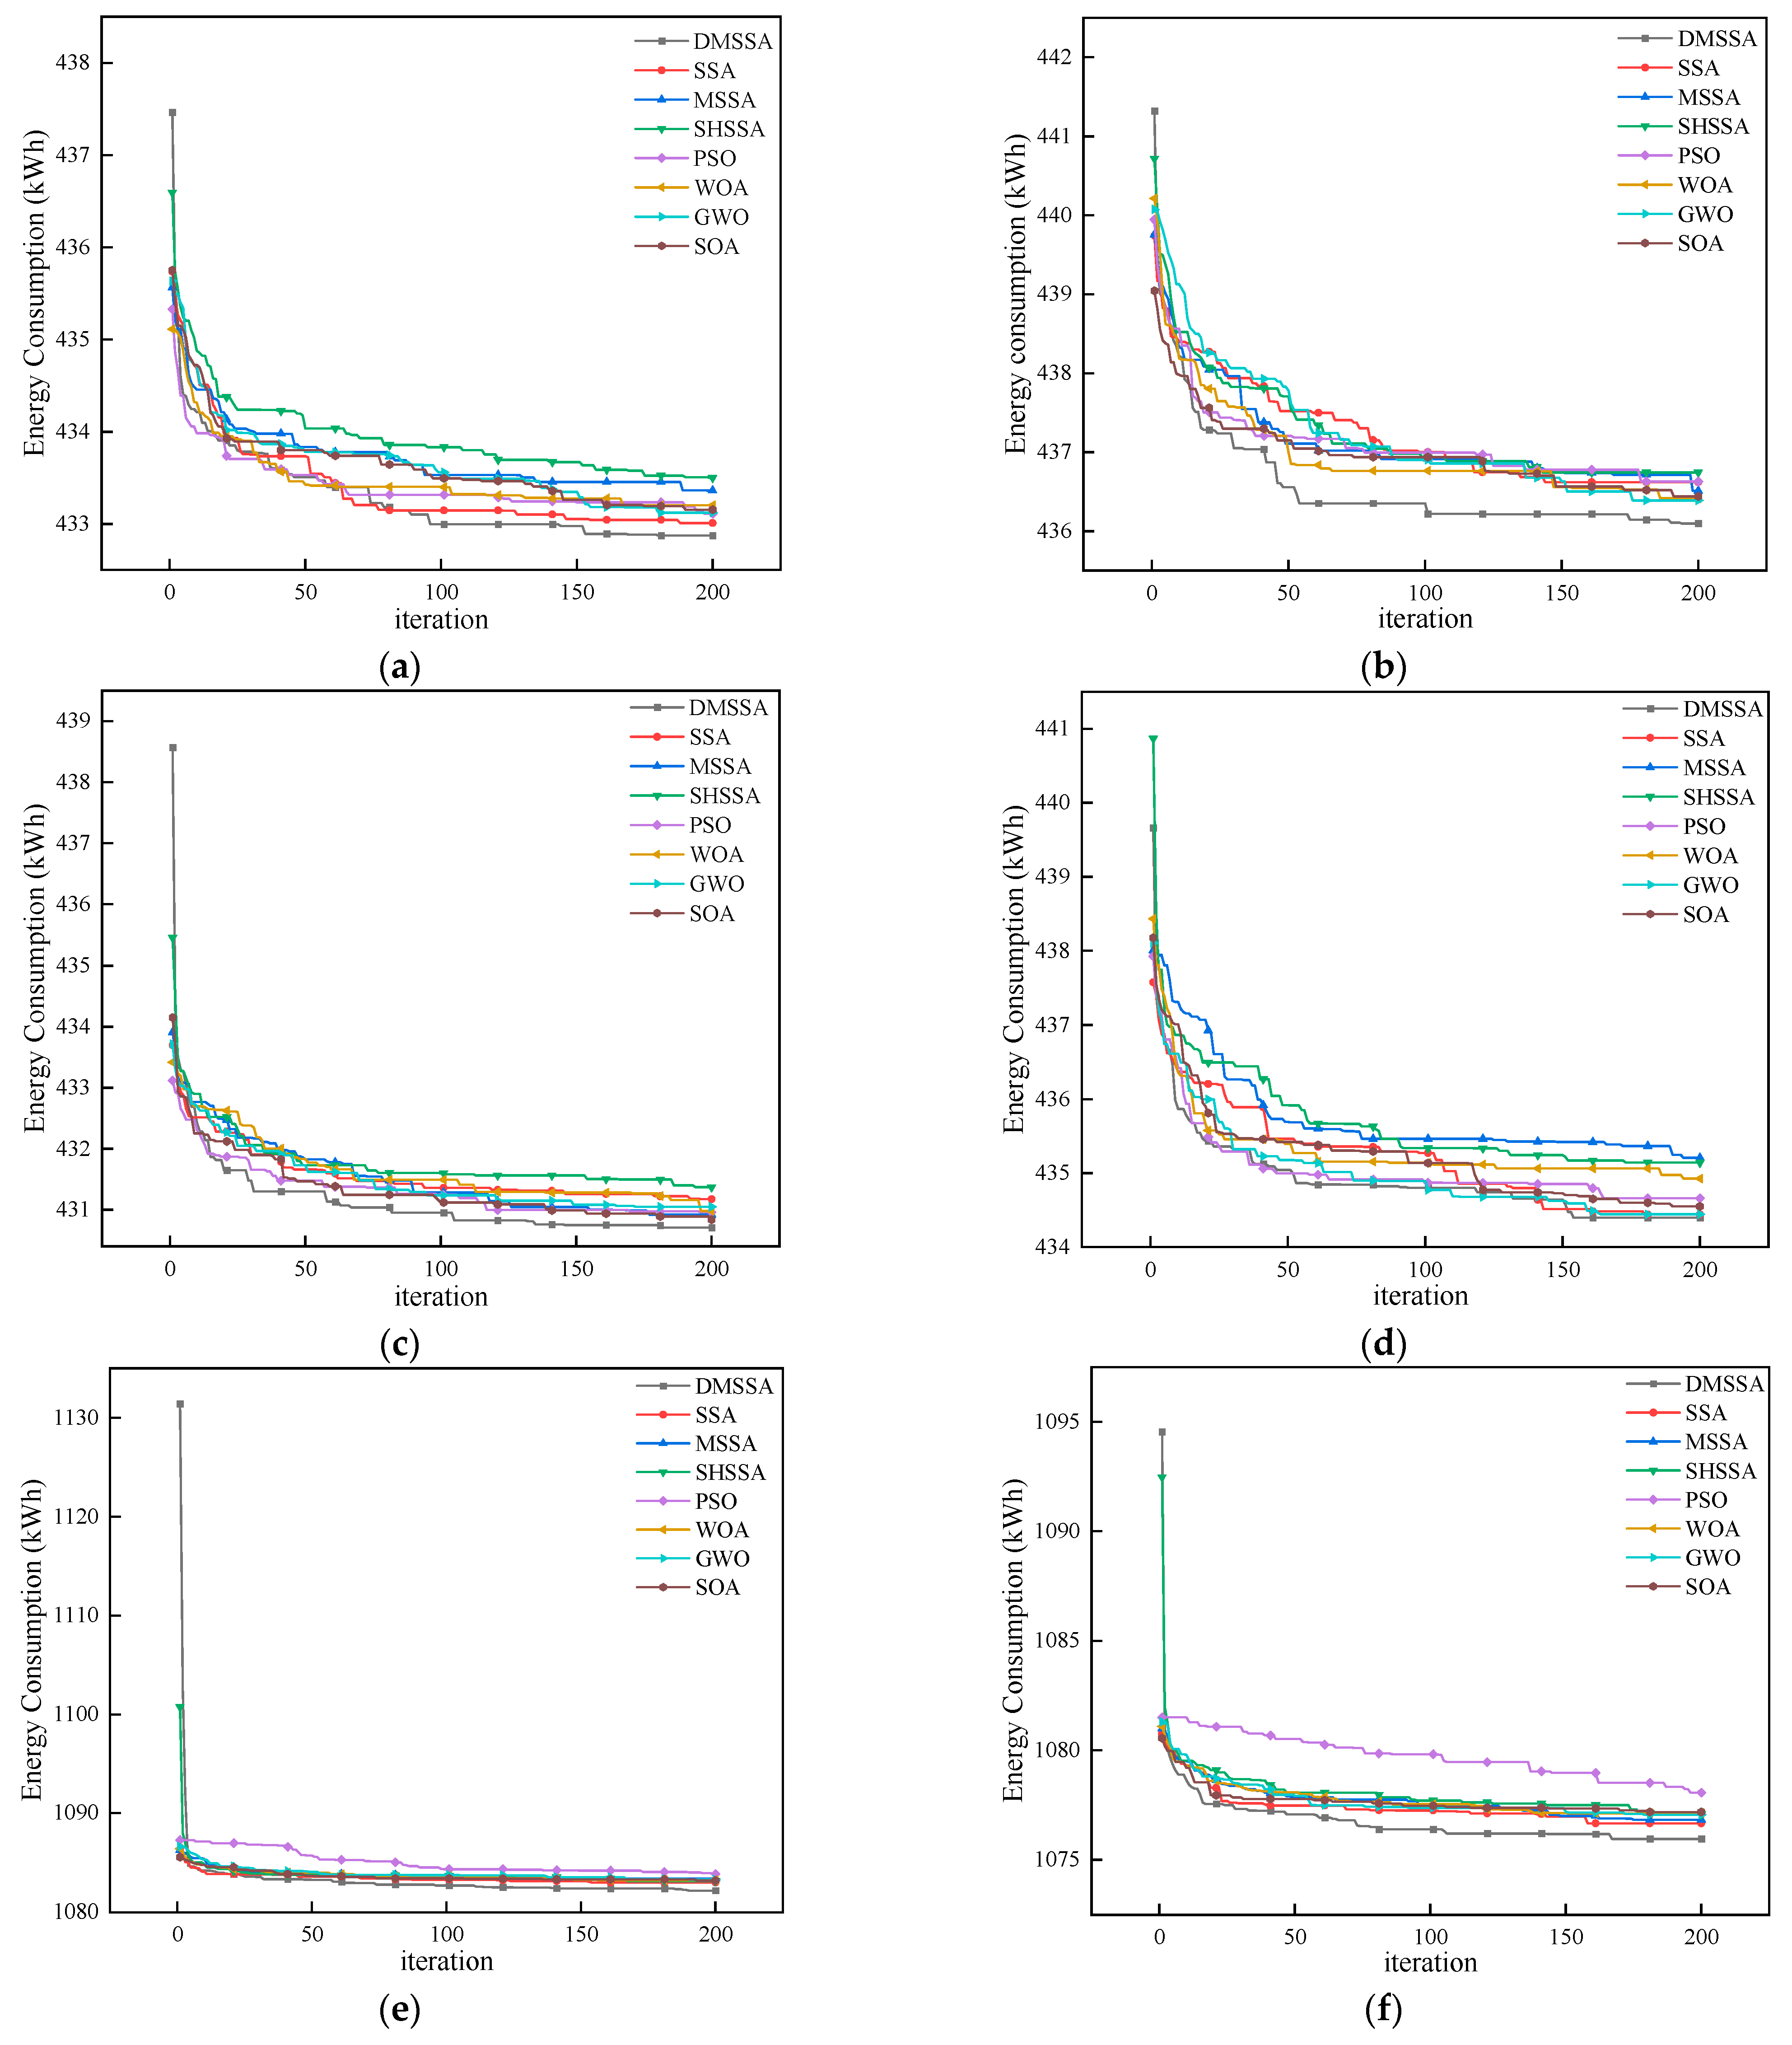
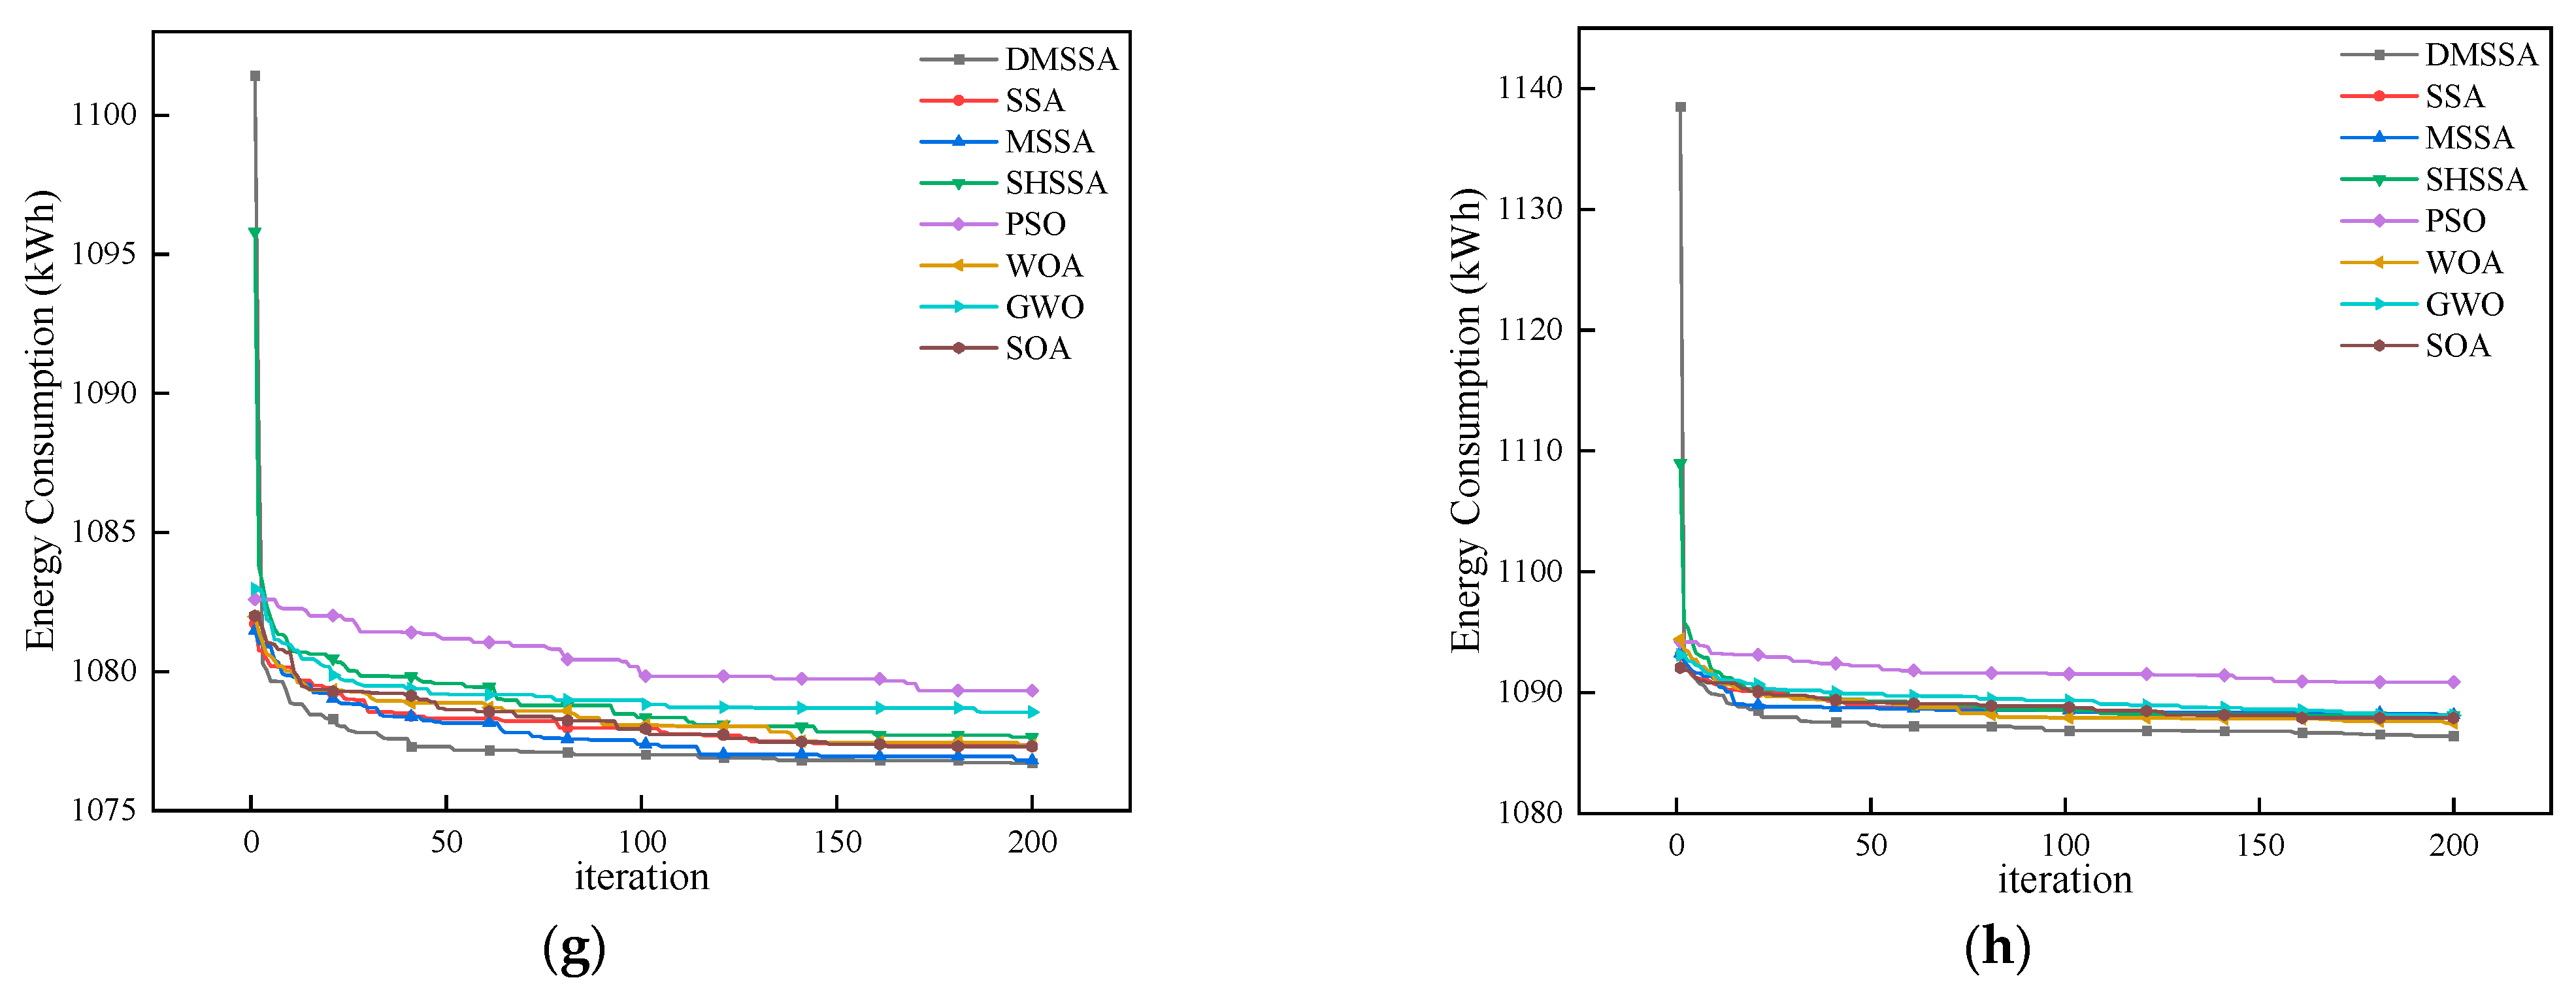
Figure 11.
Time series of equipment operations in large-scale instances. (a) Instance 9. (b) Instance 10. (c) Instance 11. (d) Instance 12.
Figure 11.
Time series of equipment operations in large-scale instances. (a) Instance 9. (b) Instance 10. (c) Instance 11. (d) Instance 12.


Table 1.
A brief literature summary of energy saving in container terminal.
| Literature | Problem | Objective | Method |
|---|---|---|---|
| Tan et al. [24] | QCSP | Time and Energy | CPLEX |
| Li et al. [25] | QCSP | Time and Energy | Branch-and-bound Algorithm |
| Zhong et al. [26] | QCSP | Time and Energy | EMOEA |
| Yue et al. [27] | QASP | Energy | Enumeration Algorithm |
| Karam et al. [28] | BACATAP | Energy | Lagrangian Solution |
| Hong et al. [29] | BACATAP | Time and Energy | Genetic Algorithm |
| Zheng et al. [30] | P_QAY | Emissions | Genetic Algorithm |
| Zhong et al. [31] | P_QAY | Energy | Bi-level Genetic Algorithm |
| Sun et al. [32] | P_QAY | Time and Energy | SA-GA |
| Jiang et al. [33] | BQCASP | Emissions | Adaptive Genetic Algorithm |
Abbreviations used in this table: EMOEA—enhanced multiobjective evolutionary algorithm; QCSP—quay crane scheduling problem; QASP—quay crane and automated guided vehicles scheduling problem; BACATAP—berth allocation crane assignment truck assignment problem; BQCASP—berth and quay crane assignment and scheduling problem; P_QYY—problem of concurrently scheduling QCs, AGVs, and YCs; SA-GA—genetic algorithm based on the operation of Simulated Annealing.
Table 2.
Notations.
| Notation | Description |
|---|---|
| I | The set of containers. S and E denote the start and the end of the loading operation, respectively. IS = I ∪ [1]. IE = I ∪ [2,3]. |
| i, j | The index of each container. |
| Q | The set of QCs. |
| q | The index of each QC. |
| V | The set of IGVs. |
| v | The index of each IGV. |
| Ni | The moment when a QC completes loading container i. |
| Oi | The time required for a QC to load container i. |
| P | The time it takes for a quay crane to traverse one bay width. |
| M | A large enough positive number. |
| Ri | The moment when a IGV completes transporting container i. |
| Sil | The time required for an empty IGV to move from the QC operating area to the yard to receive container i. |
| Siu | The time required for a IGV to transport container i from the yard to the QC operating area. |
| t1 | The time required for a QC to load a light container. |
| t2 | The time required for a QC to load a heavy container. |
| v0 | The moving speed of IGV with no load. |
| v1 | The moving speed of IGV under light load. |
| v2 | The moving speed of IGV under heavy load. |
| a | The index of each bay. |
| UaS | The start time of the operation on bay a. |
| UaE | The end time of the operation on bay a. |
| A | The set of bays. S and E denote the start and end of the operation at the bays. AS = A ∪ [4]. AE = I ∪ [5]. |
| AF | The set of bays in the forward half of the ship. |
| AA | The set of bays in the back half of the ship. |
| lq | The first bay to be served by QC q. |
| B | The set of stacks in a bay. |
| b | The index of each stack. |
| BL | The set of stacks on the larboard side. |
| BR | The set of stacks on the starboard side. |
| C | The set of layers in a bay. |
| c | The index of each layer. |
| wi | The weight of container i. |
| wab | The weight of containers in stack b within bay a. |
| ei | Container i has a weight type, denoted by values 1 and 2, representing light and heavy containers. |
| f | The width of a container is 2.438 m. |
| g | The gap between containers is 0.3 m. |
| α | Moment sensitivity factor, taking the value of 10 t. |
| HM | Heeling moment. HM = (B − 1) (f + g) α/2. |
| LG | Maximum longitudinal weight difference. |
| E1 | Energy consumption per unit time for QC loading. |
| E2 | Energy consumption per unit time for QC waiting. |
| E3 | Energy consumption per unit time during QC waiting, attributed to IGV delays or disruptions by other QCs. |
| E4 | Energy consumption per unit time for IGV transporting a container. |
| E5 | Energy consumption per unit time for IGV movement without a load. |
| E6 | Energy consumption per unit time during IGV waiting caused by QC delay. |
Table 3.
Decision variables.
| Variable | Description |
|---|---|
| Equal to 1 if QC q loads container j immediately after loading container i, and 0 otherwise. | |
| Equal to 1 if QC q loads container i, and 0 otherwise. | |
| Equal to 1 if IGV v transports container j immediately after transporting container i, and 0 otherwise. | |
| Equal to 1 if IGV v transports container i, and 0 otherwise. | |
| Equal to 1 if QC q operates on bay a, and 0 otherwise. | |
| Equal to 1 if QC q operates on bay a before bay a′, 0 otherwise. | |
| Equal to 1 if container i is loaded in position (a, b, c) and 0 otherwise. |
Table 4.
Initial loading scheme.
| Container | 1 | 2 | 3 | 4 | 5 | 6 | 7 | 8 | 9 | 10 | 11 | 12 |
|---|---|---|---|---|---|---|---|---|---|---|---|---|
| xi | 0.12 | 0.34 | 0.32 | 0.67 | 1.44 | 1.56 | 2.87 | 2.64 | 3.54 | 3.78 | 4.22 | 5.33 |
| bay | 1 | 1 | 1 | 1 | 2 | 2 | 3 | 3 | 4 | 4 | 5 | 6 |
Table 5.
Revised loading scheme.
| Container | 1 | 2 | 3 | 4 | 5 | 6 | 7 | 8 | 9 | 10 | 11 | 12 |
|---|---|---|---|---|---|---|---|---|---|---|---|---|
| bay | 1 | 5 | 1 | 6 | 2 | 2 | 3 | 3 | 4 | 4 | 5 | 6 |
Table 6.
Ultimate scheduling scheme.
| Bay | 1 | 2 | 3 | 4 | 5 | 6 |
|---|---|---|---|---|---|---|
| QC | 1 | 2 | 3 | |||
| Loading sequence in bay | 1→3 | 6→5 | 8→7 | 9→10 | 2→11 | 4→12 |
| Loading sequence at QC | 1→3→6→5 | 8→7→9→10 | 2→11→4→12 | |||
Table 7.
Parameters of equipment and vessels.
| Parameter | Value | Unit | Parameter | Value | Unit |
|---|---|---|---|---|---|
| v0 | 350 | m·min−1 | C | 5 | - |
| v1 | 280 | m·min−1 | E1 | 90.24 | kWh·(h·veh)−1 |
| v2 | 210 | m·min−1 | E2 | 70.18 | kWh·(h·veh)−1 |
| t1 | 111 | s | E3 | 49.6 | kWh·(h·veh)−1 |
| t2 | 92 | s | E4 | 21 | kWh·(h·veh)−1 |
| A | 10 | - | E5 | 14 | kWh·(h·veh)−1 |
| B | 6 | - | E6 | 9 | kWh·(h·veh)−1 |
Table 8.
Comparison of test results for each instance.
| Instance | Size | I/Q/V | Energy Consumption (kWh) | |||||||
|---|---|---|---|---|---|---|---|---|---|---|
| DMSSA | SSA | MSSA | SHSSA | PSO | WOA | GWO | SOA | |||
| 1 | Small | 30/2/3 | 133.056 | 133.073 | 133.096 | 132.953 | 133.007 | 133.097 | 133.119 | 133.073 |
| 2 | 30/2/4 | 133.410 | 133.333 | 133.207 | 133.482 | 133.696 | 133.802 | 133.762 | 133.811 | |
| 3 | 30/3/4 | 132.342 | 132.379 | 132.320 | 132.299 | 132.357 | 132.495 | 132.350 | 132.495 | |
| 4 | 30/3/5 | 131.651 | 131.682 | 131.632 | 131.692 | 131.828 | 131.570 | 131.772 | 131.739 | |
| 5 | Medium | 100/3/4 | 432.873 | 433.008 | 433.362 | 433.498 | 433.107 | 433.202 | 433.121 | 433.153 |
| 6 | 100/3/6 | 436.097 | 436.618 | 436.510 | 436.745 | 436.627 | 436.412 | 436.389 | 436.438 | |
| 7 | 100/4/6 | 430.709 | 431.175 | 430.920 | 431.370 | 430.958 | 430.978 | 431.050 | 430.837 | |
| 8 | 100/4/8 | 434.398 | 434.442 | 435.208 | 435.142 | 434.661 | 434.924 | 434.444 | 434.550 | |
| 9 | Large | 250/5/6 | 1082.168 | 1082.977 | 1083.385 | 1083.148 | 1083.841 | 1083.242 | 1083.287 | 1083.191 |
| 10 | 250/5/7 | 1075.953 | 1076.656 | 1076.820 | 1077.068 | 1078.063 | 1077.120 | 1077.055 | 1077.175 | |
| 11 | 250/5/8 | 1076.705 | 1077.349 | 1076.810 | 1077.641 | 1079.315 | 1077.335 | 1078.541 | 1077.305 | |
| 12 | 250/5/10 | 1086.418 | 1088.097 | 1088.156 | 1088.103 | 1090.878 | 1087.487 | 1088.109 | 1087.907 | |
Meaning of marked values: The optimal value for each instance is shown in bold, followed by the second-best value in italics, and the third-best value is underlined.
Disclaimer/Publisher’s Note: The statements, opinions and data contained in all publications are solely those of the individual author(s) and contributor(s) and not of MDPI and/or the editor(s). MDPI and/or the editor(s) disclaim responsibility for any injury to people or property resulting from any ideas, methods, instructions or products referred to in the content. |
© 2024 by the authors. Licensee MDPI, Basel, Switzerland. This article is an open access article distributed under the terms and conditions of the Creative Commons Attribution (CC BY) license (https://creativecommons.org/licenses/by/4.0/).
Share and Cite
MDPI and ACS Style
Luo, Y.; Liang, X.; Zhang, Y.; Tang, K.; Li, W. Energy-Aware Integrated Scheduling for Quay Crane and IGV in Automated Container Terminal. J. Mar. Sci. Eng. 2024, 12, 376. https://doi.org/10.3390/jmse12030376
AMA Style
Luo Y, Liang X, Zhang Y, Tang K, Li W. Energy-Aware Integrated Scheduling for Quay Crane and IGV in Automated Container Terminal. Journal of Marine Science and Engineering. 2024; 12(3):376. https://doi.org/10.3390/jmse12030376
Chicago/Turabian StyleLuo, Yuedi, Xiaolei Liang, Yu Zhang, Kexin Tang, and Wenting Li. 2024. "Energy-Aware Integrated Scheduling for Quay Crane and IGV in Automated Container Terminal" Journal of Marine Science and Engineering 12, no. 3: 376. https://doi.org/10.3390/jmse12030376
Note that from the first issue of 2016, this journal uses article numbers instead of page numbers. See further details here.