
A Review on Navigating Sustainable Naval Design: LCA and Innovations in Energy and Fuel Choices

Department of Engineering, University of Messina, 98166 Messina, Italy
*
Author to whom correspondence should be addressed.
J. Mar. Sci. Eng. 2024, 12(3), 520; https://doi.org/10.3390/jmse12030520
Submission received: 29 February 2024
/
Revised: 16 March 2024
/
Accepted: 19 March 2024
/
Published: 21 March 2024
(This article belongs to the Special Issue Two-Phase Flows in Marine Propulsion and Engineering)
Abstract
:The naval sector holds paramount importance for the global economy, yet it entails significant environmental impacts throughout the entire life cycle of ships. This review explores the application of life-cycle assessment (LCA) in the naval sector, a methodology for evaluating the environmental impacts associated with all the life stages of a product or service. LCA analysis in the naval context is essential for identifying and mitigating environmental impacts, thus promoting more sustainable development of the sector. This work provides a comprehensive overview of current LCA applications in the naval sector, highlighting major environmental impacts, in particular focusing on greenhouse-gas emissions and climate change. Additionally, this study integrates an analysis of greenhouse-gas emissions using a normalization approach, which has enabled the comparison of various types of fuels and ships, thereby enhancing our understanding of their environmental impacts. Moreover, the limits and challenges to applying LCA in the naval sector are discussed, offering insights for future research and developments in the field. This review aims to raise awareness among policymakers, designers, and operators in the naval sector about the importance of adopting LCA for more sustainable and responsible management of naval activities, thereby contributing to the protection of the marine and global environment.
1. Introduction
1.1. Overview
The expansion of maritime traffic continues to solidify its status as the primary mode of global goods transportation, especially for long-distance shipments, which constitute a significant portion of world trade. This enduring prosperity, spanning centuries, has propelled water transportation to encompass nearly 90% of global trade [1,2]. The escalating threat of global warming, induced by greenhouse gases (GHG), is emerging as a critical environmental concern on a global scale. Carbon dioxide (CO2) emissions have garnered escalating attention in recent years. Among all emission sources, transportation emerges as a prominent contributor to climate change due to its substantial reliance on fossil fuels. Towards the close of the twentieth century, the International Maritime Organization (IMO) began to tackle the environmental consequences arising from maritime activities. This initiative led to the implementation of MARPOL Annex VI [3], which sets limits on sulfur oxides (SOx) and nitrogen oxides (NOx) emissions [4,5]. Feasible approaches to meet the emission-reduction targets include the adoption of exhaust-gas treatment systems, transitioning to cleaner alternative fuels [6], or implementing measures to enhance energy efficiency [7,8].
Regulatory frameworks from influential organizations, such as the IMO and the European Union (EU), are taking shape, compelling industry stakeholders to implement plans that will shape decarbonization efforts for decades.
The IMO has implemented measures to control emissions in the maritime sector due to concerns about climate change. They have expanded global emission-control areas and introduced regulations such as the Energy Efficiency Design Index (EEDI) since 2013 and the Energy Efficiency Existing Ships Index (EEXI) since 2023 [9,10]. Specifically, the EEDI [11] applies to newly designed ships, representing the energy efficiency of the ship based on certain technical and design criteria. The goal is to promote the construction of more energy-efficient ships from the outset. On the other hand, EEXI [12] applies to existing ships and is part of IMO regulations aimed at enhancing the energy efficiency of these ships, with the objective of reducing GHG emissions by improving the energy efficiency of ships already in service. These measures seek to assess and regulate the energy efficiency of both new naval projects and existing ships, with the intention of significantly lowering CO2 emissions from maritime vessels. The Carbon Intensity Indicator (CII) [13] is another regulation introduced by the International Maritime Organization (IMO) to monitor and decrease GHG emissions in the shipping sector. The CII provides an indication of the carbon intensity of ships, calculated as the amount of CO2 emitted per ton of shipping and nautical miles traveled. Ships exceeding established CII limits may be subject to the implementation of corrective measures, following regulations established to enhance efficiency and reduce the environmental impact of maritime transport.
The 2020s are proving pivotal for carbon emission reduction in the shipping industry. In July 2023, the IMO introduced the IMO GHG Strategy from Ships (RESOLUTION MEPC.377(80)), significantly elevating aspirations for the global maritime sector beyond its initial target of achieving a 50% reduction in GHG emissions by 2050. Using 2008 as a baseline, the revised strategy now aims to reduce GHG emissions from well to consumption by 20% by 2030 and by 70% by 2040, ultimately achieving net-zero emissions around 2050 [14]. This document also establishes guidelines for conducting a life-cycle assessment (LCA). These guidelines aim to address the intensity and sustainability aspects of GHGs throughout the entire life cycle, encompassing production, transportation, and usage phases. These considerations specifically pertain to marine fuels and energy carriers used for ship propulsion and onboard power generation. Relevant GHGs include CO2, methane (CH4), and nitrous oxide (N2O).
It is crucial to note that these guidelines do not provide comprehensive guidance for an IMO GHG inventory for international shipping. Excluded from consideration are emissions resulting from the load, e.g., volatile organic compounds (VOC), or the use of refrigerants. Furthermore, other short-term climate drivers and precursors, such as non-methane volatile organic compounds (NMVOC), Sox, carbon monoxide (CO), particulate matter (PM), and black carbon, fall outside the scope of these LCA guidelines [15].
The LCA establishes itself as an essential tool for analyzing environmental impacts related to products or services throughout their entire life cycle, in accordance with international standards ISO 14040 [16] and ISO 14044 [17]. This method offers a holistic and scientifically rigorous analysis, essential for understanding and mitigating the environmental effects associated with human activities.
The LCA process is structured in four key phases: goal and scope definition, life-cycle inventory analysis (LCI), life-cycle impact assessment (LCIA), and interpretation of the results. Through these phases, it is possible to identify and quantify resource consumption and emissions, thus providing a solid foundation for the development of sustainable improvement strategies. The methodology lends itself to application in all sectors of industry, such as aerospace [18], manufacturing [19], automotive [20], biomedical [21], and naval, which this article focuses on. In this context, the studies conducted can be of a general nature, like those that will be analyzed in this review, but also very specific, addressing the impact of particular activities, such as the impact of fishing [22,23,24] and of fishing-specific fish species, such as tuna [25], bluefish [24,26,27], and others [28,29,30], through an LCA. Other studies focus on the manufacturing methods of boats [31,32] and the materials used [33].
Regarding the goal and scope definition part, it is crucial to establish the boundaries of the system studied. The overall approach involves a holistic study of the product, which is called cradle to grave (CtG) [34]. This approach typically includes ship manufacturing [35] (or only propulsion-system manufacturing), emissions during ship operation throughout its entire life cycle, and includes activities such as dismantling and recycling.
In the context of maritime transport, the well-to-wake (WtW) [36] approach assumes particular relevance. It focuses on the total emissions generated from the production and distribution of fuel—well to tank (WtT)—to its use in the ship’s engine—tank to wake (TtW) [37,38]. This distinction allows for a thorough examination of emissions at each stage, highlighting how optimization in any of the segments can significantly contribute to reducing the overall environmental impact of the maritime sector. The WtW approach thus facilitates the identification of effective strategies for reducing GHG emissions and pollutants, crucial for achieving sustainability goals in maritime transport. Figure 1 schematically illustrates the WtT and TtW approaches.
Once the system boundaries are established, it is possible to proceed with the inventory analysis, considering all the processes and products that contribute to the product in terms of input and output of materials and energy.
Regarding the analysis of environmental impacts, there are various standardized methods employed to assess and quantify the impact of human activities on the environment. Among the most used are the methods from the Centre of Environmental Science (CML) of Leiden University [39], ReCiPe [40], International Reference Life Cycle Data System (ILCD) [41], Tool for the Reduction and Assessment of Chemical and other environmental Impacts (TRACI) [42], and Eco-Indicator 99. These methods provide methodological frameworks for the assessment of environmental impacts, offering diversified approaches that cover a wide spectrum of impact categories.
The environmental impact categories [43] evaluated by these methods encompass a range including climate change and Global Warming Potential (GWP) [44], focusing on substances such as CO2, CH4, N2O, and SF6, which contribute to the greenhouse effect and climate change. They also examine human toxicity and ecotoxicity [45,46,47] in various environments, addressing the impact of chemical substances on both the environment and human health. Moreover, these methods assess the acidification and eutrophication [48,49,50,51] potential of emissions, which influence the acidity of soils and waters [52,53] and contribute to nutrient enrichment, leading to excessive algae growth in aquatic environments.
Furthermore, the potential for ozone-layer depletion and the creation of photochemical ozone [54], in addition to the impact of local pollutants like SOx, NOx, and particulate matter, are analyzed. Other environmental impacts include the abiotic depletion of elements and fossil fuels, land occupation, and the depletion of mineral resources and fossil fuels, along with the potential for aerosol formation.
These impact categories offer a holistic understanding of the environmental effects of human activities, providing a basis for comparative assessment and the identification of critical areas for intervention. The application of these methods and categories in life-cycle analysis enables scholars and practitioners to identify effective strategies for minimizing the negative impacts on the environment.
1.2. Scope
This review article aims to scrutinize studies employing the LCA method to evaluate the environmental impact of maritime transport, with a particular focus on those utilizing a WtW approach. The primary emphasis is on investigations encompassing various types of fuels and propulsion technologies, ranging from traditional to alternative ones, with a thorough examination of the results in terms of GWP. By normalizing the findings across the analyzed studies in the scientific literature, this review article also seeks to facilitate a comprehensive comparison, providing a broader analysis of the environmental impact associated with maritime transport.
1.3. Outline
After the introductory section, this review article proceeds, in Section 2, to outline the methodology employed for the literature review. This involved a strategic combination of relevant keywords and the meticulous selection of documents deemed most pertinent and compelling for the discussed theme. The subsequent section will showcase the bibliometric and content analysis, complemented by informative graphs and a summary table featuring selected articles, each accompanied by a concise description of its content.
Section 3 will commence with a synthesis of the selected articles, followed by a meticulous comparative analysis of results derived from a specifically chosen subset of articles within the scientific literature. This analysis was conducted employing a mathematically formulated approach designed to facilitate the comparison of study results in terms of GWP, relative to a WtW approach.
In Section 4, the obtained results will be presented and thoroughly discussed. The article will then conclude with final remarks.
2. Method
A systematic review of studies present in the scientific literature was conducted using the Scopus database (search conducted on 13 December 2023), considered one of the most important and comprehensive collections of scientific articles. The search involved combining keywords (utilizing the logical operator “AND”) searched within article titles, abstracts, and keywords of scientific articles.
To determine the keywords, semantic fields, each containing four words, were chosen. The first family pertains to the environmental impact analysis (life-cycle assessment, life-cycle analysis, LCA, and environmental impact assessment), the second focuses on the naval sector (ship, naval, maritime, and vessel), and the last addresses the energy aspect (propulsion, engine, motor, and fuel). Figure 2 shows the adopted keywords. The selection of keyword categories was made in order to obtain documents as relevant as possible to the topic under investigation. Furthermore, the choice of individual keywords was influenced by the authors’ expertise and previous knowledge.
All possible combinations of keywords were searched, for example: “Life Cycle Assessment” AND “Ship” AND “Propulsion”, or “Life Cycle Assessment” AND “Ship” AND “Engine”, and so forth. The results of this search are shown in Table 1, Table 2, Table 3 and Table 4, illustrating the types and number of documents found for each combination of keywords.
The total number of documents found amounts to 3069. It is important to note that a single scientific document may appear in multiple combinations of keywords. Consequently, the 3069 documents found do not represent unique entries, and some documents are duplicates. The data was subsequently cleaned by removing repetitions, resulting in a final count of 967 unique documents.
Among these documents, only peer-reviewed conference or scientific journal articles and book chapters in English were chosen. Following an examination of the title, abstract, and keywords, articles that seemed unrelated to the topic addressed in this review were excluded. As a result, 51 scientific articles remained, and these were subjected to a more in-depth analysis. These articles span a 10-year period from 2015 to 2024. Figure 3 illustrates both the number of publications and the corresponding citation counts for each year.
It is evident that the number of articles found has increased over the last ten years, reaching a peak of 16 articles in 2022. The citations are current as of January 2024, and those identified for this year total 108, approximately one-fifth of the total recorded in 2023 (531 citations).
The following is a brief analysis of the 51 articles, aimed at creating bar charts illustrating the usage of database software employed for conducting LCA analysis, the methods utilized, analysis categories (whole ship, propulsion system, and fuel), and the examined ships. Note that, while for the analyzed categories, the sum of instances exactly adds up to 51, for the other analyses, a higher total number will be found. This is because in some studies, for instance, more than one database or various types of ships are used.
Figure 4 illustrates the primary software utilized for conducting an LCA in the selected articles, listed in order as GREET, OpenLCA, GaBi, and SimaPro. The ‘Others’ category encompasses software used to a lesser extent, and there are instances where studies do not specify the software employed. The documents in which the software used has not been specified have been grouped with the designation “not available” (N.A.).
As for the databases used in conducting the LCA analysis, the Ecoinvent database, in its various versions, was predominantly employed in the articles, followed by the GREET and GaBi databases. The ‘Others’ category encompasses additional databases or datasets used to a lesser extent. Additionally, it includes articles that utilized other studies as datasets or obtained information through companies. In 15 articles, it was not possible to identify univocally the database used. Figure 5 presents a graph that illustrates the information discussed.
Among the various LCIA methods, the most frequently employed in the selected articles are CML, IPCC, ReCiPe, and ILCD. Additionally, other methods, such as Traci and Eco-Indicator 99, were used. However, in 18 articles, it was challenging to clearly deduce the specific method used for the LCA analysis. Figure 6 illustrates the frequency of usage for each method.
Irrespective of the investigated boundaries, certain articles analyze the entire ship, encompassing its structure and propulsion system (internal combustion engines, electric motors, etc.). Others focus on the propulsion system in conjunction with the fuel, while some exclusively analyze the propulsion system, excluding considerations of the fuel. Notably, the majority of the identified articles (30 over 51) solely examine the used fuel. This information is meticulously depicted in Figure 7.
The articles investigated encompass a wide range of ship types. In this review, ships were categorized into five groups: bulk (including unspecified cargo ships), container, ferry (encompassing passenger transport ships, Ro-Ro, and Ro-Pax), fishing, tank (irrespective of the transported cargo type), and work vessel (encompassing tugs, frigates, dredgers, and others). Notably, 15 articles lacked explicit references to the investigated vessel type. Figure 8 provides a detailed breakdown of the frequency of various ship types in the identified articles.
Table 5 displays the selected papers along with a brief description of the boundaries used and the ship types analyzed.
The majority of documents found in the scientific literature focus on the fishing of specific fish species. Indeed, the functional units used are mostly proportional to the quantity of the catch. Only those documents were considered in which an LCA analysis was conducted on fishing vessels with the aim of comparing emissions from different engine systems and types of fuel.
3. Outcomes from the Literature Review
In this section, the analysis of the 51 selected scientific articles is conducted, with the aim of presenting a comprehensive overview of the studies carried out in the field of LCA of maritime transport. Subsequently, the normalized outcomes of the papers are illustrated. The obtained data, resulting from the proposed methodology, provide a useful overview of the environmental performance of different types of fuel and ships. The data normalization makes it easier to perform a homogeneous comparison on an ecological level, offering a comparative view of the environmental impact.
3.1. Articles Description
In the study conducted by Trillos et al. [55], an LCA was conducted on a Ro-Pax ferry operating between Kirkwall and Shapinsay in the Orkney Islands, Scotland. The analysis, adopting a cradle-to-end-of-use approach, covered the entire construction of the ship, including its structure, power system, and the utilized fuel. Utilizing SimaPro 9.0 software in conjunction with the Ecoinvent 3.5 database and the ReCiPe 2016 method, the emissions of a new prototype incorporating hydrogen and fuel cells were compared with those of a diesel-configured ferry and a diesel-hybrid ferry. The functional unit chosen for assessment was 1 km of crossing distance.
Kanchiralla et al. [56] conducted an LCA on fuel and propulsion systems for a Ro-Pax ferry traveling from Gothenburg to Kiel. The analysis considered both the manufacturing and use phases, utilizing the Ecoinvent database and the Environmental Footprint 3.0 LCA method. The study focused on various energy carriers such as electrolytic hydrogen, electro-ammonia, electro-methanol, and electricity. Different configurations of propulsion systems, including engines, fuel cells, and carbon-capture technologies, were evaluated. The functional unit was defined as “one round trip from Gothenburg to Kiel and back with the case study ship”, and the analysis aimed to assess the environmental impact and associated costs of decarbonization strategies.
Wang et al. [57] aimed to evaluate the advantages and disadvantages of a marine battery propulsion system through a comparative LCA. Adopting a CtG approach for the ship’s power system, the study extensively assessed the performance of the proposed battery system against its conventional counterpart (diesel powered). OpenLCA software and the CML 2001 method were employed, with the functional unit set as the entire lifetime of the ship.
Zincir et Arslanoglu [58] assessed the environmental impacts of various fuel options using a WtW LCA method. The study considered fuels such as Fischer Tropsch diesel, ammonia, marine bio-oil, electro Fischer Tropsch diesel, pyrolysis oil, hydrogen, ultra-low sulfur fuel oil (ULSFO), marine diesel oil (MDO), renewable diesel, electro-methanol, liquefied natural gas, straight vegetable oil, bio-diesel, dimethyl ether, liquefied petroleum gas, and Marine Gas Oil (MGO). A maritime tanker model from the GREET Model 2022 was employed for life-cycle inventory analysis, and the assessment utilized the Environmental Footprint Method 3.0 integrated into OpenLCA. The chosen functional unit for this study was defined as the energy produced by burning one kilogram of ULSFO.
Seyam et al. [59] introduced an integrated hybrid tank marine engine, utilizing a gas turbine, a solid oxide fuel cell, and two organic Rankine cycles. The LCA, conducted through a WtW approach, compared this system with traditional fuels. GREET and OpenLCA software, along with the Eco-indicator 99 and Traci 2.1 databases, were employed in the analysis.
Bicer and Dincer [60] conducted an LCA using a CtG approach for two ships (a transoceanic tank and a freight ship). The assessment covered the entire life cycle, from construction to operation and dismantling, utilizing the GREET 2016 software and the CML 2001 method. Emissions of proposed fuels (ammonia and hydrogen) were evaluated in comparison with traditional heavy fuel oil (HFO), with the functional unit set as 1 ton–kilometer of marine transportation.
Fernández-Ríos et al. [61] carried out an environmental assessment of two marine propulsion technologies: a hydrogen polymer electrolyte membrane fuel cell and a hydrogen internal combustion engine. Using a CtG approach and the CML 2001 LCA method for the ship’s power system, the study aimed to compare emissions from these technologies with traditional ones. The functional unit was defined as 1 kWh of produced energy, and the analysis employed OpenLCA software, including the GaBi database and experimental data from the scientific literature.
Ahmed et al. [62] assessed the environmental impacts and performance of a green ammonia-fueled tanker designed for a route from Rotterdam to New York Harbor across the Atlantic Ocean. The comprehensive whole-ship CtG LCA analysis employed IPCC, Environmental Footprint, and ReCiPe midpoint Hierarchist methodologies. The study scrutinized the environmental impacts of the green ammonia process and conducted a comparative assessment of the environmental performance of HFO, liquefied natural gas (LNG), blue ammonia, and green ammonia. OpenLCA software, coupled with the Ecoinvent 3 database, was employed for the analysis, with the functional unit set as 1 ton–kilometer.
Hwang et al. [63] conducted an LCA to evaluate the environmental impacts of different alternative ship fuels for a coastal ferry operating in the Republic of Korea. The comparative analysis included natural gas (NG), MGO, and hydrogen, utilizing a WtW, TtW, and WtW approach. The CML 2001 LCA method was employed, and the analysis was conducted using the GaBi software, along with its associated database.
Al-Aboosi et al. [64] explored emerging trends in integrating renewable feedstocks and energy into ammonia production, assessing their impact on the techno-economic and environmental aspects of adopting green ammonia as a maritime transportation fuel. The study employed a WtW and TtW LCA approach to compare ammonia with conventional fuels, such as HFO, MGO, and marine diesel oil (MDO).
Yacout et al. [65] focused on biofuels, including forest-based biofuel, biodiesel, and ethanol, comparing them to MDO and HFO using a fuel-only WtW LCA approach. SimaPro software with the Ecoinvent 3.5 database was utilized, and the ILCD 2011 method was chosen for environmental impact assessment. The functional unit was set as 1 ton–kilometer.
Park et al. [66] conducted a comparative analysis of three zero-carbon fuels (ammonia, hydrogen, and inland electricity) using a WtW LCA approach. The study assessed environmental impacts in comparison to MGO, focusing on 27 ferries operating on coastal routes in Scotland. GaBi software was used, with the functional unit defined as the unit of energy produced (kWh).
The research of Wang et al. [67] investigated the ecological repercussions of low-emission fuel alternatives for a super yacht, evaluating MGO, LNG, methanol, biodiesel, and hydrogen over the vessel’s entire lifespan with a WtW approach. The analysis utilized openLCA software, incorporating the ELCD 3.2 and Ecoinvent 3.7.1 databases, employing the CML 2001 methodology. The chosen functional unit was the emissions associated with the released fuel per km of ship operation over a 25-year lifecycle.
Cucinotta et al. [68] conducted an LCA study on two sister Norwegian ferries operating in the Fjord Line, comparing a diesel system fueled by HFO with an Otto cycle engine fueled by LNG. OpenLCA software with the Ecoinvent 3.3 database was utilized, employing the ILCD 2018 methodology. The functional unit was based on the ship’s lifespan (25 years).
The research of Perčić et al. [69] investigated the Croatian inland waterway sector, focusing on three vessel categories (cargo ship, passenger ship, and dredger) with different designs and operational profiles. The LCA included a ship configuration propelled by a diesel engine (using Eurodiesel Blue fuel) and two configurations employing battery power (one with and one without a photovoltaic system). GREET 2020 software was used for assessments, employing a WtW approach for the propulsion system, and the chosen functional unit was the entire ship’s lifetime (20 years).
Balcombe et al. [70] conducted a comprehensive assessment of the environmental life cycle and costs associated with using LNG as a maritime fuel, comparing it against HFO, MDO, methanol, hydrogen, ammonia, biogas, and biomethanol. A CtG approach was used, considering the entire fuel supply chain and combustion process. GaBi software with Ecoinvent 3.3 as the dataset was employed, and the emissions were evaluated using the IPPC AR5 LCA method, with 1 kWh of produced energy as the functional unit.
Taghavifar and Perera [71] performed an LCA (WtW) to compare the emissions of various fuels, including HFO, low sulfur diesel (LSD), LNG, and methanol, from a tank. GREET 2020 software was used, with 1 MJ of energy produced by each fuel considered as the functional unit.
In the study by Manouchehrinia et al. [72], they investigated the environmental impact of NG for marine transportation in Vancouver, Canada, using a WtW LCA approach. They compared emissions from four engine configurations (lean-burn Otto cycle, dual-fuel gas, diesel cycle gas, and low-sulfur petroleum diesel (LSPD)) with the GHGenius software and the IPPC AR5 method.
Malmgren et al. [73] evaluated the environmental impact of the operational phase (WtW) of a proposed concept (HyMethShip) for a Ro-Pax ship, combining electro-methanol energy storage, an onboard pre-combustion carbon capture system, and a dual-fuel internal combustion engine. The OpenLCA software was used.
Jang et al. [74] introduced the ‘parametric trend LCA’, analyzing a large dataset of 7000 ships with various scenarios using a WtW and TtW approach to compare the environmental impact of LNG with that of HFO. The IPCC method was used, with a specific mathematical function as a functional unit correlating basic ship information with environmental impacts.
Perčić et al. [75] conducted an LCA of a Ro-Ro passenger ship, comparing traditional diesel systems with electric ones using a WtW and TtW approach. GREET 2020 software was utilized, and the functional unit considered was the total emissions over the entire lifespan of the ship (20 years).
Bilgili [76] employed a WtW and TtW approach to conduct an LCA on four types of fuel, i.e., HFO, LFO, very low sulfur fuel oil (VLSFO), and ULSFO. SimaPro software with the ReCiPe 2008 method was used, and the chosen functional unit was 1 ton–kilometer.
Barbosa Watanabe et al. [77] conducted an LCA (WtW approach) in the marine sector, comparing different fuels. The study examined the environmental impact of biofuels such as Bio-SNG, fast pyrolysis, Fischer–Tropsch, and hydrothermal liquefaction, in comparison to conventional fuels like HFO, LNG, and MDO. The Ecoinvent 3.6 database was adopted, and the functional unit was defined as the energy unit.
Lee et al. [78] conducted a comprehensive LCA focusing on a ferry, considering the WtW, TtW, and WtW phases of the fuel. MGO, LNG, and hydrogen were the fuels considered. GaBi software was used, along with the GaBi database, applying methodologies such as CLM 2001, Environmental Footprint 2.0, and TRACI 2.1. The functional unit was defined as the ship’s lifetime.
Dong and Cai [79] performed a CtG (whole ship) LCA on a bulk carrier with two different configurations (P20 and P30), examining the entire life cycle of the ships fueled by both HFO and low sulfur heavy fuel oil (LSHFO). The CLM 2001 methodology, GaBi software, and the GaBi database were utilized, with the functional unit defined as the transportation of one ton of bulk cargo.
Ling-Chin and Roskilly [80] conducted a CtG LCA focusing on engines for a Ro-Ro cargo ship, considering HFO and MDO. GaBi software, along with data from Ecoinvent 2.2, was used, applying methodologies such as CML2001, ILCD, and Eco-Indicator99. The functional unit was defined as the 30-year operation of the power system for the same Ro-Ro cargo ship traveling on regular routes.
Wang et al. [81] performed a comprehensive evaluation of the environmental impact with a CtG approach of the power system, specifically focusing on electric engines, both with and without the incorporation of solar panels. The assessment employed the CML methodology and GaBi software with the GaBi database. The functional unit was the entire lifetime of the ship.
Chen and Lee Lam [82] conducted a CtG life LCA to evaluate the environmental impact of two power systems (hydrogen fuel cells and diesel engines) for a tugboat. The study compared the ecological footprint of these systems using the CML-IA methodology, with Ecoinvent 3.6 as the dataset in SimaPro software. The functional unit focused on a singular power system onboard a tugboat, supporting the vessel throughout its entire 20-year lifecycle and facilitating all towing operations.
Tsang et al. [83] conducted a WtW LCA focusing solely on the fuel aspect, comparing biofuels (both soy based and algae based) to conventional diesel. TRACI v2.1 was employed as the impact-assessment method, utilizing Ecoinvent in OpenLCA. The functional unit was defined as one hour of operation of the marine vessel.
Huang et al. [84] conducted a study utilizing WtW and TtW assessments, specifically focusing on the fuel aspect. The research investigated the environmental impacts of LNG, methanol, and ammonia compared to MGO for a very large crude carrier operating between the Middle East and China. The analysis considered the mass (tons) of the ship’s fuel consumption over one year as a functional unit.
Sharafian et al. [85] conducted an LCA focused on WtW and WtW aspects, specifically analyzing the environmental impact of LNG and HFO for marine shipping, comparing emissions from domestic and imported LNG. They utilized the GREET software for the analysis.
Taghavifar and Perera [86] conducted a WtW and tank-to-propeller LCA approach, scrutinizing the environmental impact of LNG versus diesel (HFO and LSD) as marine fuels. Utilizing the GREET software and its own database, the study quantified emissions in grams per 1 MJ, providing a holistic view of the environmental performance of these fuels across their entire life cycle (20 years).
Seithe et al. [87] focused on the well-to-propeller assessment, specifically considering only the fuel aspect. The study compared HFO, LNG, and MDO for various vessel types, including containers, cruise ships, tankers, and Ro-Pax. The ILCD method was employed for the assessment, utilizing data from the Ecoinvent 2 database. The analysis was conducted using SimaPro software, with the functional unit set as 1 ton–kilometer.
Perčić et al. [88] used a WtW and a TtW LCA approach, taking into account both engine manufacturing and fuel usage. The study compared diesel, electricity, methanol, dimethyl ether, NG, hydrogen, and biodiesel for a Ro-Pax vessel in Croatia. Utilizing the GREET database and GREET 2019 software, the analysis focused on the carbon footprint of the power-system configuration released during the ship’s lifetime, presented in tons of equivalent CO2 over a period of 20 years.
Wang et al. [89] conducted a CtG LCA considering the entire ship. The study compared hydrogen to diesel (MDO) for a mainland ferry, a pelagic trawler, a large tug ship, and an interisland vessel. The CML method was employed, utilizing the ShipLCA database and ShipLCA v1.4 software. The functional unit was defined as the transportation of cargo per kilometer.
Gilbert et al. [90] investigated the WtW and TtW aspects, specifically considering the fuel component. The study compared HFO and MDO against LNG, methanol, liquid hydrogen (LH2), biodiesel, straight vegetable oil (SVO), and bio-LNG. Utilizing the Ecoinvent database and the ELCD method, the functional unit was defined as emissions per kilowatt hour (kWh) of energy produced.
Krantz et al. [91] performed an LCA focusing solely on the fuel aspect, employing a WtW approach. The study evaluated the environmental impact of various marine fuels, including high-sulfur fuel oil (HSFO), VLSFO, MGO, LNG, biomethane, biomethanol, fossil methanol, and hydro-treated vegetable oil. Utilizing the Ecoinvent 3.8 database and SimaPro v.9.3 software, the research quantified the environmental footprint in the context of 1 MJ of power output for propulsion, chosen as the functional unit.
Knight et al. [92] conducted a thorough LCA encompassing both WtW and tank-to-wheel aspects, with a focus on hydrogen propulsion. The study specifically analyzed the environmental impact of hydrogen as a marine fuel for a ferry. Utilizing the CML method and the Gabi database, the research employed Gabi software to assess the environmental footprint associated with hydrogen propulsion.
Zincir [93] conducted an LCA with both WtW and TtW approaches, comparing three different types of ammonia (brown, blue, and green) with conventional diesel fuel (MDO) in the context of a general cargo ship. The chosen functional unit for the assessment was a round-trip journey.
In the study of Thomson et al. [5], an LCA focusing solely on the fuel aspect, with a WtW approach, is performed. The work aims to compare the environmental impact of LNG gas with that of traditional diesel fuels, considering container and tug vessels in its analysis. Employing the GREET 2013 software, the research quantified the environmental footprint in kilograms per route.
Masum et al. [94] undertook a WtW LCA of the fuel. The study aimed to compare the environmental impact of diverse biofuels (biocrudes, bio-oils, diesel via Fischer−Tropsch synthesis of landfill gas, and lignin ethanol oil) with traditional low-sulfur fuel oil (LSFO). Applying the IPCC AR5 methodology and utilizing the GREET database with GREET software, the research provided insights into the environmental footprint. The chosen functional unit is 1 MJ of marine fuel.
Tomos et al. [95] performed a WtW LCA, comprehensively considering the entire ship, to evaluate the environmental impact of alternative fuels such as hydrogen, ammonia, methanol, and waste-derived biofuels. The study encompassed various vessel types, including tankers, bulk carriers, general cargo, container, and offshore vessels. Utilizing the ReCiPe 2016 and IPCC AR5 methodologies, the environmental impact assessment was evaluated using data from the literature and the Ecoinvent 3.7.1 database. Sphere LCA software was used to conduct the analysis. The chosen functional unit was the propulsion energy requirement of the global fleet over one year, totaling 5.3 EJ/year.
Chalaris et al. [96] undertook an in-depth WtW LCA, exclusively considering the fuel aspect of bulk carriers in different scenarios (S1, S2, S3, S4, T1, T2, and T3). Applying the CML 2001 methodology and utilizing the CEAS software, the research delved into the diverse environmental implications associated with eight different ammonia types in marine propulsion. The chosen approach for the functional unit involved employing mathematical equations that establish connections between fundamental ship data and environmental effects.
Zhang et al. [97] conducted a WtW LCA that comprehensively considered the entire ship’s life cycle, including construction. The focus was on MDO as the primary fuel, analyzing its environmental impact. The study covered bulk carriers, containers, and general cargo ships. IPCC 2007 LCA methodology is used, and the research assessed the unit weight of cargo capacity transported per nautical mile over a 20-year period.
In the work of Al-Douri et al. [98], a WtW LCA approach with a specific emphasis on the fuel aspect, considering LNG, is performed. The vessel types studied are tankers, containers, bulk carriers, and general cargo ships. The methodology employed for the assessment is IPCC AR4.
Taghavifar et al. [99] conducted a dual-stage LCA specifically focusing on the fuel component, adopting a WtW and tank-to-propeller approach. The study compared the environmental impacts of LNG and LSD as marine fuels. IPCC 1996 is the chosen methodology, and the functional unit used for the assessment is 1 MJ of energy output.
Yan et al. [100] adopted a WtT and TtW LCA approach (including engine manufacturing) to evaluate the environmental impact of a bulk. The study evaluated various marine fuels such as diesel, LNG hybrid, LNG, hydrogen, methanol, and ammonia. The assessment adopted the IPCC guidelines and incorporated the GREET database, along with information derived from literature sources, utilizing the GREET 2020 software for the analysis. The chosen functional unit for the evaluation was the annual carbon emissions of ships operating under different power scenarios.
Mestemaker et al. [101] conducted a CtG LCA that considered both the engines and the fuel system of a hybrid propulsion system, specifically utilizing a combination of LNG and MDO. The study adopted a comprehensive approach, assessing the entire life cycle of the vessel.
In the study led by Bilgili [102], a WtW LCA was conducted, focusing exclusively on the fuel aspect. The research aimed to compare the environmental impacts of various marine fuels throughout their life cycles. The alternative fuels considered in the analysis included ammonia, biogas, dimethyl ether (DME), ethanol, LNG, liquefied petroleum gas (LPG), methanol, and biodiesel. The ReCiPe 2008 V1.09 methodology was employed for impact assessment, utilizing data from the Ecoinvent database. SimaPro software was used to perform the analysis, and the chosen functional unit for comparison was set at 1 ton or an equivalent volume of each fuel type.
Koričan et al. [103] conducted an LCA to evaluate the environmental impacts of different alternative ship fuels and propulsion configurations (including their manufacturing process) for a fishing trawler. The comparative analysis included diesel, battery, methanol, LNG, ammonia, B20 (80% MDO and 20% biodiesel), and hydrogen, utilizing a WtW and TtW approach. GREET 2021 software was employed to conduct the analysis together with its related database. The functional unit used is the entire lifetime of the ship (20 years).
Kim et al. [104] adopted a WtT and TtW LCA approach to evaluate the environmental impact of a shipping vessel. The study evaluated various marine fuels such as marine diesel, gasoline, LPG, and two different bio-LPGs. The considered bio-LPGs are crude palm oil (CPO) and refined, bleached, and deodorized (RBD). Three scenarios are investigated: coastal, offshore, and other fishing zones. The assessment adopted GREET software and its database for the analysis. The chosen functional unit for the evaluation was 1 MJ of energy.
3.2. Emission Normalization
The use of normalized emissions can be particularly important in the field of environmental assessments, especially when comparing the performance of different vessels or energy systems. This practice allows for a common basis for data that would otherwise be difficult to compare due to variations in size, capacity, or operational modes. Normalizing emissions, for example, per volume of transport or distance traveled, enables a clearer identification of the most effective strategies for reducing the ecological footprint of these systems.
In this context, Favi et al. [105] analyzed the existing literature on the environmental performance of specific categories of vessels, adopting a normalization approach focused on the impacts related to GHG. Normalization is based on key parameters, such as the number of passengers, the weight of the cargo transported, the distance traveled, the number of trips made, and, for some vessels, the time spent navigating.
In this study, an emission normalization method for the naval sector was adopted, focusing on annual emissions relative to the power (kW) installed on ships (Equation (1)).
This methodology uses the installed power as a parameter to assess the environmental impact of the vessels. The underlying idea is that the installed power is a synthetic index that can allow comparison even between ships that are very different in terms of size and use, and it can be more effective than other parameters, such as capacity or the type of service performed.
In this review, the normalization has been carried out on the GWP impact category, but it could also be done on other categories of impact. The analysis focuses on the emissions generated from the WtW phase, which includes both the emissions arising from the production of the fuels and those associated with the operational phase on ships.
For the conduct of the study, 51 articles were initially selected. From the analysis of these, only those that provided the complete set of data necessary to implement the proposed specific methodology were chosen for normalization. This selective process ensured the coherence and reliability of the analysis. Table 6, Table 7, Table 8, Table 9 and Table 10 present a comparative analysis of GHG emissions using the WtW method for various categories of ships, focusing on ferries, bulk carriers, oil tankers, and work vessels. By normalizing WtW emissions against installed power (kW) and the operational lifespan of ships, these tables enable comparative assessments of the environmental impact associated with the use of various fuels. Each table explores a range of fuel options, from traditional HFO and MGO to more sustainable alternatives like LNG, hydrogen, and biofuels. Documenting the engine power of the analyzed ships, the tables provide a fundamental parameter for comparing emissions across different ships, essential for evaluating the energy efficiency and environmental impact of different propulsion solutions. The total environmental impact of each fuel scenario is quantified, including all stages from fuel extraction to its end use, thus offering a comprehensive view of associated CO2-equivalent emissions. At this stage, it is important to emphasize that emissions are strongly dependent on the production process used to obtain the fuel. Finally, by normalizing emissions with “kW × Year” (installed power multiplied by years of operation), direct comparisons between various propulsion solutions are facilitated, highlighting those with the least environmental impact for the maritime sector.
4. Results and Discussions
The mean values of normalized CO2-Eq emissions are depicted in Figure 9. The chart provides a visualization of normalized CO2-Eq emissions, categorized by fuel type and ship categories: bulk, ferry, fishing vessel, tank, and work vessel. Each bar in the chart represents the average emissions relative to the number of ships, which is indicated by the number positioned above each bar, utilizing that particular type of fuel. The histogram bars are grouped by macro categories even when fuels are produced with different scenarios. This allows for a comparative analysis between different fuel and ship categories in terms of environmental impact.
As shown in the figure, there are variations in emissions not only among different fuels but even within the same fuel typology. These variations can be attributed to the different fuel production methodologies. Indeed, a single type of fuel can derive from various production processes such as methanol that can be produced from coal, natural gas, with partial solar energy, or a completely solar system with battery support. Similarly, ammonia can be synthesized from various raw materials and processes, such as coal, oil, NG, NG with CCS, solar energy, or wind energy. Therefore, the emissions associated with each type of fuel can vary significantly depending on the underlying production process.
It is worth noting that certain types of fuels, such as those with low carbon content or derived from renewable sources, may have a greater environmental impact than conventional fossil fuels. This is because, although they exhibit limited or no emissions in a TtW assessment (as seen, for example, in the case of electric propulsion), the current methodologies for producing these fuels or electric energy (evaluated with a WtT approach) have a significant environmental impact component. The study of Watanabe et al. [106] effectively highlights this aspect. In this study, Watanabe et al. showed the current environmental impact of various fuels (drop-in biofuel, hydrogen-based biofuel, and power to X), taking into account the nation of production and its own energy mix, as well as the estimated impact they are expected to have in 2050. This consideration includes the assumption that production technologies will be more environmentally friendly by 2050.
Table 11 shows the range, in terms of order of magnitude, of normalized emissions for different types of fuels during the operational and production phase, expressed in kg CO2-Eq. per kW × Year.
This range represents the scale of normalized emission values for each type of fuel, allowing for a comparative evaluation of their WtW environmental performance (use of the fuel and upstream stages). The reference values can be used to examine innovative technologies and production processes of alternative fuels, aiming to reduce the environmental impact of vessels and promote greater sustainability in the maritime sector. In particular, hydrogen emerges with a wide variability in emissions, from 101 to 103 kg CO2-Eq./kW × Year, reflecting the direct uncertainties related to different production methods, application technologies, and additionally, from the production location which depends on the local energy mix, which can significantly influence the environmental impact. Similarly, methanol presents an emission range from 101 to 103, highlighting the diversity in production practices and the importance of carefully evaluating production methods to minimize the carbon footprint. On the other hand, fuels such as MDO, Eurodiesel Blue, HFO, and LNG show relatively similar emission ranges, between 102 and 103, reflecting their widespread use in the sector and the need for continuous improvements in production practices and usage efficiency to reduce emissions.
Some significant lacks identified in the documents found in the scientific literature are to be highlighted. Particularly, in some articles (not included among the 51 selected), the boundaries are not well defined, i.e., the various approaches (WtT, TtW, etc.). Additionally, regarding the boundaries, a discrepancy was found in the terminology adopted by various authors compared to that suggested by IMO RESOLUTION MECP.370(80). As can be seen from the graphs in Figure 4, Figure 5 and Figure 6, in a considerable number of articles, it was not possible to clearly obtain information regarding the software, dataset, and LCIA method used. Similar deficiencies concern the type of vessel investigated, often not available (Figure 8). In the perspective of assessing emissions related to various types of fuel even in the operational phase (TtW), the absence of characteristics of the installed propulsion system, such as engine power, proves to be limiting when a comparison based on installed power onboard is necessary, an analysis that has indeed been conducted and shown in this paper.
5. Conclusions
In this review, a thorough examination of the scientific literature relevant to LCA in the context of maritime transport was conducted, with a particular focus on fuel selection. Initially, a bibliometric analysis was implemented to outline the dominant trends and main themes emerging from academic works published in this field. This preliminary approach allowed for mapping the research landscape, highlighting the prevailing thematic axes and significant contributions in the sector.
Continuing, the study employed a targeted quantitative analysis, including the normalization of emission data measured through the application of LCA. This phase aimed to normalize the results obtained from different studies to facilitate an objective comparison and identify shared trends and patterns.
In the maritime context, a significant weakness emerges related to the absence of standardized scenario usage, which could provide a uniform framework for assessing the environmental impact in a more homogeneous and comparable manner. For example, in the automotive sector, the implementation of standardized driving scenarios has provided clear benefits in terms of study comparability and reproducibility. Adopting a similar approach in the maritime sector for studying emissions associated with different fuel types during the operational phase would underscore the need to develop and apply standardized scenarios. Furthermore, it is important to note that some studies do not clearly distinguish between LCA and carbon footprint, creating potential confusion. This terminological ambiguity requires particular attention to ensure accuracy in the presentation and interpretation of study results. For future work, it is recommended to use appropriate terminology following IMO standards. Indeed, the use of unified terminology allows for a better understanding of the documents. Moreover, it is considered necessary to use words such as “boundaries”, “method”, “functional unit”, “software”, and “database”, along with the related information. These details, together with those concerning the investigated ship (type and propulsion system), are deemed extremely necessary for a clear understanding of the work carried out.
Author Contributions
Conceptualization, F.C.; methodology, F.C.; software, F.S.; validation, E.B., F.C. and F.S.; formal analysis, E.B. and F.S.; investigation, E.B. and F.S.; resources, E.B.; data curation, E.B.; writing—original draft preparation, E.B. and F.S.; writing—review and editing, E.B. and F.C.; visualization, E.B.; supervision, F.C.; project administration, F.C. All authors have read and agreed to the published version of the manuscript.
Funding
This research received no external funding.
Informed Consent Statement
Not applicable.
Data Availability Statement
Data available upon request.
Conflicts of Interest
The authors declare no conflicts of interest.
Nomenclature
| Full Name | Nomenclature |
| Carbon Capture and Storage | CCS |
| Carbon Intensity Indicator | CII |
| Carbon Monoxide | CO |
| Centrum voor Milieuwetenschappen Leiden | CML |
| Cradle to Grave | CtG |
| Crude Palm Oil | CPO |
| Dimethyl Ether | DME |
| Energy Efficiency Design Index | EEDI |
| Energy Efficiency Existing Ships Index | EEXI |
| European Union | EU |
| Global Warming Potential | GWP |
| Greenhouse Gases | GHG |
| Heavy Fuel Oil | HFO |
| High-Sulfur Fuel Oil | HSFO |
| International Reference LifeCycle Data system | ILCD |
| International Maritime Organization | IMO |
| Intergovernmental Panel on Climate Change | IPCC |
| Life-Cycle Assessment | LCA |
| Life-Cycle Impact Assessment | LCIA |
| Life-Cycle Inventory analysis | LCI |
| Liquefied Natural Gas | LNG |
| Liquefied Petroleum Gas | LPG |
| Low-Sulfur Heavy Fuel Oil | LSHFO |
| Low-Sulfur Petroleum Diesel | LSPD |
| Low-Sulfur Diesel | LSD |
| Marine Diesel Oil | MDO |
| Marine Gas Oil | MGO |
| Natural Gas | NG |
| Non-Methane Volatile Organic Compounds | NMVOC |
| Not Available | N.A. |
| Refined, Bleached, and Deodorized | RBD |
| Steam Methane Reforming | SMR |
| Straight Vegetable Oil | SVO |
| Tank to Wake | TtW |
| Tool for the Reduction and Assessment of Chemical and other environmental Impacts | TRACI |
| Ultra-Low-Sulfur Fuel Oil | ULSFO |
| Volatile Organic Compounds | VOC |
| Well to Tank | WtT |
| Well to Wake | WtW |
References
- Yu, J.Y.; Sghaier, M.O.; Grabowiecka, Z. Deep Learning Approaches for AIS Data Association in the Context of Maritime Domain Awareness. In Proceedings of the 2020 IEEE 23rd International Conference on Information Fusion, Rustenburg, South Africa, 6–9 July 2020. [Google Scholar] [CrossRef]
- Wang, S.; Wang, X.; Han, Y.; Wang, X.; Jiang, H.; Duan, J.; Hua, R.; Zhang, Z. Decarbonizing in Maritime Transportation: Challenges and Opportunities. J. Transp. Technol. 2023, 13, 301–325. [Google Scholar] [CrossRef]
- Čampara, L.; Hasanspahić, N.; Vujičić, S. Overview of MARPOL ANNEX VI Regulations for Prevention of Air Pollution from Marine Diesel Engines. SHS Web Conf. 2018, 58, 01004. [Google Scholar] [CrossRef]
- Iannaccone, T.; Landucci, G.; Tugnoli, A.; Salzano, E.; Cozzani, V. Sustainability of Cruise Ship Fuel Systems: Comparison among LNG and Diesel Technologies. J. Clean. Prod. 2020, 260, 121069. [Google Scholar] [CrossRef]
- Thomson, H.; Corbett, J.J.; Winebrake, J.J. Natural Gas as a Marine Fuel. Energy Policy 2015, 87, 153–167. [Google Scholar] [CrossRef]
- Kołwzan, K. Life Cycle Assessment of the Alternative Fuels in the Light of the International Maritime Organization Initial GHG Reduction Strategy. Prawo Morskie 2022, XLIII, 59–78. [Google Scholar] [CrossRef]
- Horvath, S.; Fasihi, M.; Breyer, C. Techno-Economic Analysis of a Decarbonized Shipping Sector: Technology Suggestions for a Fleet in 2030 and 2040. Energy Convers. Manag. 2018, 164, 230–241. [Google Scholar] [CrossRef]
- Zhang, S.; Li, Y.; Yuan, H.; Sun, D. An Alternative Benchmarking Tool for Operational Energy Efficiency of Ships and Its Policy Implications. J. Clean. Prod. 2019, 240, 118223. [Google Scholar] [CrossRef]
- Lee, S.S. Analysis of the Effects of EEDI and EEXI Implementation on CO2 Emissions Reduction in Ships. Ocean Eng. 2024, 295, 116877. [Google Scholar] [CrossRef]
- Bayraktar, M.; Yuksel, O. A Scenario-Based Assessment of the Energy Efficiency Existing Ship Index (EEXI) and Carbon Intensity Indicator (CII) Regulations. Ocean Eng. 2023, 278, 114295. [Google Scholar] [CrossRef]
- Polakis, M.; Zachariadis, P.; de Kat, J.O. The Energy Efficiency Design Index (EEDI) BT—Sustainable Shipping: A Cross-Disciplinary View; Psaraftis, H.N., Ed.; Springer International Publishing: Cham, Switzerland, 2019; pp. 93–135. ISBN 978-3-030-04330-8. [Google Scholar]
- Ivanova, G. Analysis of the Specifics in Calculating the Index of Existing Marine Energy Efficiency EEXI in Force since 2023. In Proceedings of the 2021 13th Electrical Engineering Faculty Conference (BulEF), Varna, Bulgaria, 8–11 September 2021; pp. 1–4. [Google Scholar] [CrossRef]
- Yuan, Q.; Wang, S.; Peng, J. Operational Efficiency Optimization Method for Ship Fleet to Comply with the Carbon Intensity Indicator (CII) Regulation. Ocean Eng. 2023, 286, 115487. [Google Scholar] [CrossRef]
- Strantzali, E.; Livanos, G.A.; Aravossis, K. A Comprehensive Multicriteria Evaluation Approach for Alternative Marine Fuels. Energies 2023, 16, 498. [Google Scholar] [CrossRef]
- Maritime Forecast to 2050. Available online: https://www.dnv.com/maritime/publications/maritime-forecast-2023/index.html (accessed on 1 January 2024).
- ISO 14040:2021; Environmental Management—Life Cycle Assessment—Principles and Framework. ISO: Geneva, Switzerland, 2021.
- ISO 14044:2021; Environmental Management—Life Cycle Assessment—Requirements and Guidelines. ISO: Geneva, Switzerland, 2021.
- Mohammad, A.K.; Sumeray, C.; Richmond, M.; Hinshelwood, J.; Ghosh, A. Assessing the Sustainability of Liquid Hydrogen for Future Hypersonic Aerospace Flight. Aerospace 2022, 9, 801. [Google Scholar] [CrossRef]
- Di Bella, G.; Alderucci, T.; Salmeri, F.; Cucinotta, F. Integrating the Sustainability Aspects into the Risk Analysis for the Manufacturing of Dissimilar Aluminium/Steel Friction Stir Welded Single Lap Joints Used in Marine Applications through a Life Cycle Assessment. Sustain. Futur. 2022, 4, 100101. [Google Scholar] [CrossRef]
- Cucinotta, F.; Raffaele, M.; Salmeri, F. A Well-to-Wheel Comparative Life Cycle Assessment between Full Electric and Traditional Petrol Engines in the European Context. In Advances on Mechanics, Design Engineering and Manufacturing III; Roucoules, L., Paredes, M., Eynard, B., Morer Camo, P., Rizzi, C., Eds.; Springer International Publishing: Cham, Switzerland, 2021; pp. 188–193. [Google Scholar]
- Deepak, A.; Sharma, V.; Kumar, D. Life Cycle Assessment of Biomedical Waste Management for Reduced Environmental Impacts. J. Clean. Prod. 2022, 349, 131376. [Google Scholar] [CrossRef]
- Codotto, G.; Pizzol, M.; Hegland, T.J.; Madsen, N. Model Uncertainty versus Variability in the Life Cycle Assessment of Commercial Fisheries. J. Ind. Ecol. 2024, 28, 160–172. [Google Scholar] [CrossRef]
- Sandison, F.; Hillier, J.; Hastings, A.; Macdonald, P.; Mouat, B.; Marshall, C.T. The Environmental Impacts of Pelagic Fish Caught by Scottish Vessels. Fish. Res. 2021, 236, 105850. [Google Scholar] [CrossRef]
- Ramos, S.; Vázquez-Rowe, I.; Artetxe, I.; Moreira, M.T.; Feijoo, G.; Zufía, J. Environmental Assessment of the Atlantic Mackerel (Scomber scombrus) Season in the Basque Country. Increasing the Timeline Delimitation in Fishery LCA Studies. Int. J. Life Cycle Assess. 2011, 16, 599–610. [Google Scholar] [CrossRef]
- Hospido, A.; Tyedmers, P. Life Cycle Environmental Impacts of Spanish Tuna Fisheries. Fish. Res. 2005, 76, 174–186. [Google Scholar] [CrossRef]
- Vázquez-Rowe, I.; Moreira, M.T.; Feijoo, G. Life Cycle Assessment of Horse Mackerel Fisheries in Galicia (NW Spain): Comparative Analysis of Two Major Fishing Methods. Fish. Res. 2010, 106, 517–527. [Google Scholar] [CrossRef]
- Almeida, C.; Vaz, S.; Cabral, H.; Ziegler, F. Environmental Assessment of Sardine (Sardina pilchardus) Purse Seine Fishery in Portugal with LCA Methodology Including Biological Impact Categories. Int. J. Life Cycle Assess. 2014, 19, 297–306. [Google Scholar] [CrossRef]
- Villanueva-Rey, P.; Vázquez-Rowe, I.; Arias, A.; Moreira, M.T.; Feijoo, G. The Importance of Using Life Cycle Assessment in Policy Support to Determine the Sustainability of Fishing Fleets: A Case Study for the Small-Scale Xeito Fishery in Galicia, Spain. Int. J. Life Cycle Assess. 2018, 23, 1091–1106. [Google Scholar] [CrossRef]
- Almeida, C.; Loubet, P.; Laso, J.; Nunes, M.L.; Marques, A. Environmental Assessment of Common Octopus (Octopus vulgaris) from a Small-Scale Fishery in Algarve (Portugal). Int. J. Life Cycle Assess. 2022, 27, 849–867. [Google Scholar] [CrossRef]
- Avadí, A.A.; Adrien, R.; Aramayo, V.; Fréon, P.; Avadí, A.A.; Adrien, R.; Aramayo, V.; Fréon, P. Environmental Assessment of the Peruvian Industrial Hake Fishery with LCA To Cite This Version: HAL Id: Hal-01824165 Environmental Assessment of the Peruvian Industrial Hake Fishery with LCA. Int. J. Life Cycle Assess. 2023, 23, 1126–1140. [Google Scholar] [CrossRef]
- Cucinotta, F.; Guglielmino, E.; Sfravara, F. Life Cycle Assessment in Yacht Industry: A Case Study of Comparison between Hand Lay-up and Vacuum Infusion. J. Clean. Prod. 2017, 142, 3822–3833. [Google Scholar] [CrossRef]
- Önal, M. Evaluation of Shipyard Operation Processes with Cradle-to-Gate Life Cycle Assessment Based on Material Consumption Rates for an Aluminum and Steel Yacht. Ships Offshore Struct. 2023, 18, 1–7. [Google Scholar] [CrossRef]
- Önal, M.; Neşer, G.; Gürsel, K.T. Environmental Impacts of Steel Ship Hulls Building and Recycling by Life Cycle Assessment (LCA). Ships Offshore Struct. 2021, 16, 1061–1066. [Google Scholar] [CrossRef]
- Quang, P.K.; Dong, D.T.; Hai, P.T.T. Evaluating Environmental Impacts of an Oil Tanker Using Life Cycle Assessment Method. Proc. Inst. Mech. Eng. Part M J. Eng. Marit. Environ. 2021, 235, 705–717. [Google Scholar] [CrossRef]
- Burman, M.; Kuttenkeuler, J.; Stenius, I.; Garme, K.; Rosén, A. Comparative Life Cycle Assessment of the Hull of a High-Speed Craft. Proc. Inst. Mech. Eng. Part M J. Eng. Marit. Environ. 2015, 230, 378–387. [Google Scholar] [CrossRef]
- Kramel, D.; Muri, H.; Kim, Y.; Lonka, R.; Nielsen, J.B.; Ringvold, A.L.; Bouman, E.A.; Steen, S.; Strømman, A.H. Global Shipping Emissions from a Well-to-Wake Perspective: The MariTEAM Model. Environ. Sci. Technol. 2021, 55, 15040–15050. [Google Scholar] [CrossRef] [PubMed]
- Di Lullo, G.; Zhang, H.; Kumar, A. Evaluation of Uncertainty in the Well-to-Tank and Combustion Greenhouse Gas Emissions of Various Transportation Fuels. Appl. Energy 2016, 184, 413–426. [Google Scholar] [CrossRef]
- Del Pero, F.; Dattilo, C.A.; Giraldi, A.; Delogu, M. LCA Approach for Environmental Impact Assessment within the Maritime Industry: Re-Design Case Study of Yacht’s Superstructure. Proc. Inst. Mech. Eng. Part M J. Eng. Marit. Environ. 2023, 238, 153–170. [Google Scholar] [CrossRef]
- Guinée, J. Handbook on Life Cycle Assessment—Operational Guide to the ISO Standards. Int. J. Life Cycle Assess. 2001, 6, 255. [Google Scholar] [CrossRef]
- Huijbregts, M.A.J.; Steinmann, Z.J.N.; Elshout, P.M.F.; Stam, G.; Verones, F.; Vieira, M.; Zijp, M.; Hollander, A.; van Zelm, R. ReCiPe2016: A Harmonised Life Cycle Impact Assessment Method at Midpoint and Endpoint Level. Int. J. Life Cycle Assess. 2017, 22, 138–147. [Google Scholar] [CrossRef]
- Joint Research Centre; Institute for Environment and Sustainability. International Reference Life Cycle Data System (ILCD) Handbook—General Guide for Life Cycle Assessment—Detailed Guidance; Publications Office: Luxembourg, 2010. [Google Scholar]
- Ryberg, M.; Vieira, M.D.M.; Zgola, M.; Bare, J.; Rosenbaum, R.K. Updated US and Canadian Normalization Factors for TRACI 2.1. Clean Technol. Environ. Policy 2014, 16, 329–339. [Google Scholar] [CrossRef]
- Seppala, J.; Risbey, J.; Meilinger, S.; Norris, G.; Lindfors, G.L.; Goedkoop, M. Best Available Practice in Life Cycle Assessment Ofclimate Change, Stratospheric Ozone Depletion, Photo-Oxidant Formation, Acidification, and Eutrophication-Backgroundson General Issues; Rijksinstituut voor Volksgezondheid en Milieu RIVM: Bilthoven, The Netherlands, 2001. [Google Scholar]
- UNEP; WMO. Intergovernmental Panel on Climate Change. In Proceedings of the Report of the 21st Session of the IPCC, Vienna, Austria, 3 and 6–7 November 2003. [Google Scholar]
- Guinée, J.; Heijungs, R. A Proposal for the Classification of Toxic Substances within the Framework of Life Cycle Assessment of Products. Chemosphere 1993, 26, 1925–1944. [Google Scholar] [CrossRef]
- Hertwich, E.G.; Mateles, S.F.; Pease, W.S.; McKone, T.E. Human Toxicity Potentials for Life-Cycle Assessment and Toxics Release Inventory Risk Screening. Environ. Toxicol. Chem. 2001, 20, 928–939. [Google Scholar] [CrossRef]
- Rosenbaum, R.K. Ecotoxicity BT—Life Cycle Impact Assessment; Hauschild, M.Z., Huijbregts, M.A.J., Eds.; Springer: Dordrecht, The Netherlands, 2015; pp. 139–162. ISBN 978-94-017-9744-3. [Google Scholar]
- Morelli, B.; Hawkins, T.R.; Niblick, B.; Henderson, A.D.; Golden, H.E.; Compton, J.E.; Cooter, E.J.; Bare, J.C. Critical Review of Eutrophication Models for Life Cycle Assessment. Environ. Sci. Technol. 2018, 52, 9562–9578. [Google Scholar] [CrossRef]
- Struijs, J.; Beusen, A.; van Jaarsveld, H.; Huijbregts, M.A.J. Eutrophication. In ReCiPe 2008; Goedkoop, M., Heijungs, R., Huijbregts, M.A.J., De Schryver, A., Struijs, J., van Zelm, R., Eds.; Ministry of Housing, Spatial Planning and the Environmen: The Hague, The Netherlands, 2009. [Google Scholar]
- Bouwman, A.F.; Van Vuuren, D.P.; Derwent, R.G.; Posch, M. A Global Analysis of Acidification and Eutrophication of Terrestrial Ecosystems. Water Air Soil Pollut. 2002, 141, 349–382. [Google Scholar] [CrossRef]
- Posch, M.; Seppälä, J.; Hettelingh, J.-P.; Johansson, M.; Margni, M.; Jolliet, O. The Role of Atmospheric Dispersion Models and Ecosystem Sensitivity in the Determination of Characterisation Factors for Acidifying and Eutrophying Emissions in LCIA. Int. J. Life Cycle Assess. 2008, 13, 477–486. [Google Scholar] [CrossRef]
- Bach, V.; Möller, F.; Finogenova, N.; Emara, Y.; Finkbeiner, M. Characterization Model to Assess Ocean Acidification within Life Cycle Assessment. Int. J. Life Cycle Assess. 2016, 21, 1463–1472. [Google Scholar] [CrossRef]
- Payen, S.; Ledgard, S.F. Aquatic Eutrophication Indicators in LCA: Methodological Challenges Illustrated Using a Case Study in New Zealand. J. Clean. Prod. 2017, 168, 1463–1472. [Google Scholar] [CrossRef]
- Morales-Méndez, J.D.; Silva-Rodríguez, R. Environmental Assessment of Ozone Layer Depletion Due to the Manufacture of Plastic Bags. Heliyon 2018, 4, e01020. [Google Scholar] [CrossRef]
- Trillos, J.C.G.; Wilken, D.; Brand, U.; Vogt, T. Correction to: Life Cycle Assessment of a Hydrogen and Fuel Cell RoPax Ferry Prototype; Springer International Publishing: Cham, Switzerland, 2021; ISBN 9783030505196. [Google Scholar]
- Kanchiralla, F.M.; Brynolf, S.; Malmgren, E.; Hansson, J.; Grahn, M. Life-Cycle Assessment and Costing of Fuels and Propulsion Systems in Future Fossil-Free Shipping. Environ. Sci. Technol. 2022, 56, 12517–12531. [Google Scholar] [CrossRef]
- Wang, H.; Boulougouris, E.; Theotokatos, G.; Priftis, A.; Shi, G.; Zhou, P. A Comparative Life Cycle Assessment Study on Environmental Performances between Battery-Powered and Conventional Marine Vessels. In Maritime Technology and Engineering 5 Volume 1, Proceedings of the 5th International Conference on Maritime Technology and Engineering (MARTECH 2020), Lisbon, Portugal, 16–19 November 2020; CRC Press: London, UK, 2021; Volume 1, pp. 119–126. [Google Scholar] [CrossRef]
- Zincir, B.A.; Arslanoglu, Y. Comparative Life Cycle Assessment of Alternative Marine Fuels. Fuel 2024, 358, 129995. [Google Scholar] [CrossRef]
- Seyam, S.; Dincer, I.; Agelin-Chaab, M. Exergoeconomic and Exergoenvironmental Analyses of a Potential Marine Engine Powered by Eco-Friendly Fuel Blends with Hydrogen. Energy 2023, 284, 129276. [Google Scholar] [CrossRef]
- Bicer, Y.; Dincer, I. Environmental Impact Categories of Hydrogen and Ammonia Driven Transoceanic Maritime Vehicles: A Comparative Evaluation. Int. J. Hydrogen Energy 2018, 43, 4583–4596. [Google Scholar] [CrossRef]
- Fernández-Ríos, A.; Santos, G.; Pinedo, J.; Santos, E.; Ruiz-Salmón, I.; Laso, J.; Lyne, A.; Ortiz, A.; Ortiz, I.; Irabien, Á.; et al. Environmental Sustainability of Alternative Marine Propulsion Technologies Powered by Hydrogen—A Life Cycle Assessment Approach. Sci. Total Environ. 2022, 820, 153189. [Google Scholar] [CrossRef] [PubMed]
- Ahmed, S.; Li, T.; Yi, P.; Chen, R. Environmental Impact Assessment of Green Ammonia-Powered Very Large Tanker Ship for Decarbonized Future Shipping Operations. Renew. Sustain. Energy Rev. 2023, 188, 113774. [Google Scholar] [CrossRef]
- Hwang, S.S.; Gil, S.J.; Lee, G.N.; Won Lee, J.; Park, H.; Jung, K.H.; Suh, S.B. Life Cycle Assessment of Alternative Ship Fuels for Coastal Ferry Operating in Republic of Korea. J. Mar. Sci. Eng. 2020, 8, 660. [Google Scholar] [CrossRef]
- Al-Aboosi, F.Y.; El-Halwagi, M.M.; Moore, M.; Nielsen, R.B. Renewable Ammonia as an Alternative Fuel for the Shipping Industry. Curr. Opin. Chem. Eng. 2021, 31, 100670. [Google Scholar] [CrossRef]
- Yacout, D.M.M.; Tysklind, M.; Upadhyayula, V.K.K. Assessment of Forest-Based Biofuels for Arctic Marine Shipping. Resour. Conserv. Recycl. 2021, 174, 105763. [Google Scholar] [CrossRef]
- Park, C.; Jeong, B.; Zhou, P. Lifecycle Energy Solution of the Electric Propulsion Ship with Live-Life Cycle Assessment for Clean Maritime Economy. Appl. Energy 2022, 328, 120174. [Google Scholar] [CrossRef]
- Wang, Y.; Maidment, H.; Boccolini, V.; Wright, L. Life Cycle Assessment of Alternative Marine Fuels for Super Yacht. Reg. Stud. Mar. Sci. 2022, 55, 102525. [Google Scholar] [CrossRef]
- Cucinotta, F.; Raffaele, M.; Salmeri, F.; Sfravara, F. A Comparative Life Cycle Assessment of Two Sister Cruise Ferries with Diesel and Liquefied Natural Gas Machinery Systems. Appl. Ocean Res. 2021, 112, 102705. [Google Scholar] [CrossRef]
- Perčić, M.; Vladimir, N.; Koričan, M. Electrification of Inland Waterway Ships Considering Power System Lifetime Emissions and Costs. Energies 2021, 14, 7046. [Google Scholar] [CrossRef]
- Balcombe, P.; Staffell, I.; Kerdan, I.G.; Speirs, J.F.; Brandon, N.P.; Hawkes, A.D. How Can LNG-Fuelled Ships Meet Decarbonisation Targets? An Environmental and Economic Analysis. Energy 2021, 227, 120462. [Google Scholar] [CrossRef]
- Taghavifar, H.; Perera, L.P. Life Cycle Assessment of Different Marine Fuel Types and Powertrain Configurations for Financial and Environmental Impact Assessment in Shipping. In International Conference on Offshore Mechanics and Arctic Engineering; American Society of Mechanical Engineers: New York, NY, USA, 2022. [Google Scholar] [CrossRef]
- Manouchehrinia, B.; Dong, Z.; Gulliver, T.A. Well-to-Propeller Environmental Assessment of Natural Gas as a Marine Transportation Fuel in British Columbia, Canada. Energy Rep. 2020, 6, 802–812. [Google Scholar] [CrossRef]
- Malmgren, E.; Brynolf, S.; Fridell, E.; Grahn, M.; Andersson, K. The Environmental Performance of a Fossil-Free Ship Propulsion System with Onboard Carbon Capture-a Life Cycle Assessment of the HyMethShip Concept. Sustain. Energy Fuels 2021, 5, 2753–2770. [Google Scholar] [CrossRef]
- Jang, H.; Jeong, B.; Zhou, P.; Ha, S.; Nam, D. Demystifying the Lifecycle Environmental Benefits and Harms of LNG as Marine Fuel. Appl. Energy 2021, 292, 116869. [Google Scholar] [CrossRef]
- Perčić, M.; Frković, L.; Pukšec, T.; Ćosić, B.; Li, O.L.; Vladimir, N. Life-Cycle Assessment and Life-Cycle Cost Assessment of Power Batteries for All-Electric Vessels for Short-Sea Navigation. Energy 2022, 251, 123895. [Google Scholar] [CrossRef]
- Bilgili, L. Life Cycle Comparison of Marine Fuels for IMO 2020 Sulphur Cap. Sci. Total Environ. 2021, 774, 145719. [Google Scholar] [CrossRef] [PubMed]
- Watanabe, M.D.B.; Cherubini, F.; Cavalett, O. Climate Change Mitigation of Drop-in Biofuels for Deep-Sea Shipping under a Prospective Life-Cycle Assessment. J. Clean. Prod. 2022, 364, 132662. [Google Scholar] [CrossRef]
- Lee, G.N.; Kim, J.M.; Jung, K.H.; Park, H.; Jang, H.S.; Lee, C.S.; Lee, J.W. Environmental Life-Cycle Assessment of Eco-Friendly Alternative Ship Fuels (MGO, LNG, and Hydrogen) for 170 GT Nearshore Ferry. J. Mar. Sci. Eng. 2022, 10, 755. [Google Scholar] [CrossRef]
- Dong, D.T.; Cai, W. A Comparative Study of Life Cycle Assessment of a Panamax Bulk Carrier in Consideration of Lightship Weight. Ocean Eng. 2019, 172, 583–598. [Google Scholar] [CrossRef]
- Ling-Chin, J.; Roskilly, A.P. A Comparative Life Cycle Assessment of Marine Power Systems. Energy Convers. Manag. 2016, 127, 477–493. [Google Scholar] [CrossRef]
- Wang, H.; Oguz, E.; Jeong, B.; Zhou, P. Life Cycle and Economic Assessment of a Solar Panel Array Applied to a Short Route Ferry. J. Clean. Prod. 2019, 219, 471–484. [Google Scholar] [CrossRef]
- Chen, Z.S.; Lam, J.S.L. Life Cycle Assessment of Diesel and Hydrogen Power Systems in Tugboats. Transp. Res. Part D Transp. Environ. 2022, 103, 103192. [Google Scholar] [CrossRef]
- Tsang, M.; Fox-Lent, C.; Wallace, S.; Welp, T.; Bates, M.; Linkov, I. Life-Cycle Impacts of Soybean and Algae Biodiesel: Case Study of US Marine Vessels. Biofuels Bioprod. Biorefin. 2015, 9, 567–580. [Google Scholar] [CrossRef]
- Huang, J.; Fan, H.; Xu, X.; Liu, Z. Life Cycle Greenhouse Gas Emission Assessment for Using Alternative Marine Fuels: A Very Large Crude Carrier (VLCC) Case Study. J. Mar. Sci. Eng. 2022, 10, 1969. [Google Scholar] [CrossRef]
- Sharafian, A.; Blomerus, P.; Mérida, W. Natural Gas as a Ship Fuel: Assessment of Greenhouse Gas and Air Pollutant Reduction Potential. Energy Policy 2019, 131, 332–346. [Google Scholar] [CrossRef]
- Taghavifar, H.; Perera, L.P. Life Cycle Emission and Cost Assessment for LNG-Retrofitted Vessels: The Risk and Sensitivity Analyses under Fuel Property and Load Variations. Ocean Eng. 2023, 282, 114940. [Google Scholar] [CrossRef]
- Seithe, G.; Bonou, A.; Giannopoulos, D.; Georgopoulou, C.A.; Founti, M. Maritime Transport in a Life Cycle Perspective: How Fuels, Vessel Types, and Operational Profiles Influence Energy Demand and Greenhouse Gas Emissions. Energies 2020, 13, 2739. [Google Scholar] [CrossRef]
- Perčić, M.; Vladimir, N.; Fan, A. Life-Cycle Cost Assessment of Alternative Marine Fuels to Reduce the Carbon Footprint in Short-Sea Shipping: A Case Study of Croatia. Appl. Energy 2020, 279, 115848. [Google Scholar] [CrossRef]
- Wang, H.; Aung, M.Z.; Xu, X.; Boulougouris, E. Life Cycle Analysis of Hydrogen Powered Marine Vessels—Case Ship Comparison Study with Conventional Power System. Sustainability 2023, 15, 12946. [Google Scholar] [CrossRef]
- Gilbert, P.; Walsh, C.; Traut, M.; Kesieme, U.; Pazouki, K.; Murphy, A. Assessment of Full Life-Cycle Air Emissions of Alternative Shipping Fuels. J. Clean. Prod. 2018, 172, 855–866. [Google Scholar] [CrossRef]
- Krantz, G.; Moretti, C.; Brandão, M.; Hedenqvist, M.; Nilsson, F. Assessing the Environmental Impact of Eight Alternative Fuels in International Shipping: A Comparison of Marginal vs. Average Emissions. Environments 2023, 10, 155. [Google Scholar] [CrossRef]
- Knight, M.; Blanco-Davis, E.; Platt, O.; Armin, M. Life-Cycle and Applicational Analysis of Hydrogen Production and Powered Inland Marine Vessels. J. Mar. Sci. Eng. 2023, 11, 1611. [Google Scholar] [CrossRef]
- Zincir, B. Environmental and Economic Evaluation of Ammonia as a Fuel for Short-Sea Shipping: A Case Study. Int. J. Hydrogen Energy 2022, 47, 18148–18168. [Google Scholar] [CrossRef]
- Masum, F.H.; Zaimes, G.G.; Tan, E.C.D.; Li, S.; Dutta, A.; Ramasamy, K.K.; Hawkins, T.R. Comparing Life-Cycle Emissions of Biofuels for Marine Applications: Hydrothermal Liquefaction of Wet Wastes, Pyrolysis of Wood, Fischer-Tropsch Synthesis of Landfill Gas, and Solvolysis of Wood. Environ. Sci. Technol. 2023, 57, 12701–12712. [Google Scholar] [CrossRef] [PubMed]
- Tomos, B.A.D.; Stamford, L.; Welfle, A.; Larkin, A. Decarbonising International Shipping—A Life Cycle Perspective on Alternative Fuel Options. Energy Convers. Manag. 2024, 299, 117848. [Google Scholar] [CrossRef]
- Chalaris, I.; Jeong, B.; Jang, H. Application of Parametric Trend Life Cycle Assessment for Investigating the Carbon Footprint of Ammonia as Marine Fuel. Int. J. Life Cycle Assess. 2022, 27, 1145–1163. [Google Scholar] [CrossRef]
- Zhang, Y.; Chang, Y.; Wang, C.; Fung, J.C.H.; Lau, A.K.H. Life-Cycle Energy and Environmental Emissions of Cargo Ships. J. Ind. Ecol. 2022, 26, 2057–2068. [Google Scholar] [CrossRef]
- Al-Douri, A.; Alsuhaibani, A.S.; Moore, M.; Nielsen, R.B.; El-Baz, A.A.; El-Halwagi, M.M. Greenhouse Gases Emissions in Liquified Natural Gas as a Marine Fuel: Life Cycle Analysis and Reduction Potential. Can. J. Chem. Eng. 2022, 100, 1178–1186. [Google Scholar] [CrossRef]
- Taghavifar, H.; Perera, L.P. The Effect of Lng and Diesel Fuel Emissions of Marine Engines on Ghg-Reduction Revenue Policies Under Life-Cycle Costing Analysis in Shipping. In International Conference on Offshore Mechanics and Arctic Engineering; American Society of Mechanical Engineers: New York, NY, USA, 2023. [Google Scholar] [CrossRef]
- Yan, X.; He, Y.; Fan, A. Carbon Footprint Prediction Considering the Evolution of Alternative Fuels and Cargo: A Case Study of Yangtze River Ships. Renew. Sustain. Energy Rev. 2023, 173, 113068. [Google Scholar] [CrossRef]
- Mestemaker, B.; Van Den Heuvel, H.; Gonçalves Castro, B. Designing the Zero Emission Vessels of the Future: Technologic, Economic and Environmental Aspects. Int. Shipbuild. Prog. 2020, 67, 5–31. [Google Scholar] [CrossRef]
- Bilgili, L. Comparative Assessment of Alternative Marine Fuels in Life Cycle Perspective. Renew. Sustain. Energy Rev. 2021, 144, 110985. [Google Scholar] [CrossRef]
- Koričan, M.; Perčić, M.; Vladimir, N.; Alujević, N.; Fan, A. Alternative Power Options for Improvement of the Environmental Friendliness of Fishing Trawlers. J. Mar. Sci. Eng. 2022, 10, 1882. [Google Scholar] [CrossRef]
- Kim, J.K.; Jeong, B.; Choi, J.H.; Lee, W.J. Life Cycle Assessment of LPG Engines for Small Fishing Vessels and the Applications of Bio LPG Fuel in Korea. J. Mar. Sci. Eng. 2023, 11, 1488. [Google Scholar] [CrossRef]
- Mio, A.; Fermeglia, M.; Favi, C. A Critical Review and Normalization of the Life Cycle Assessment Outcomes in the Naval Sector. Articles Description. J. Clean. Prod. 2022, 370, 133476. [Google Scholar] [CrossRef]
- Watanabe, M.D.B.; Hu, X.; Ballal, V.; Cavalett, O.; Cherubini, F. Climate Change Mitigation Potentials of on Grid-Connected Power-to-X Fuels and Advanced Biofuels for the European Maritime Transport. Energy Convers. Manag. X 2023, 20, 100418. [Google Scholar] [CrossRef]
Figure 1.
Schematization of the WtT and TtW approaches.
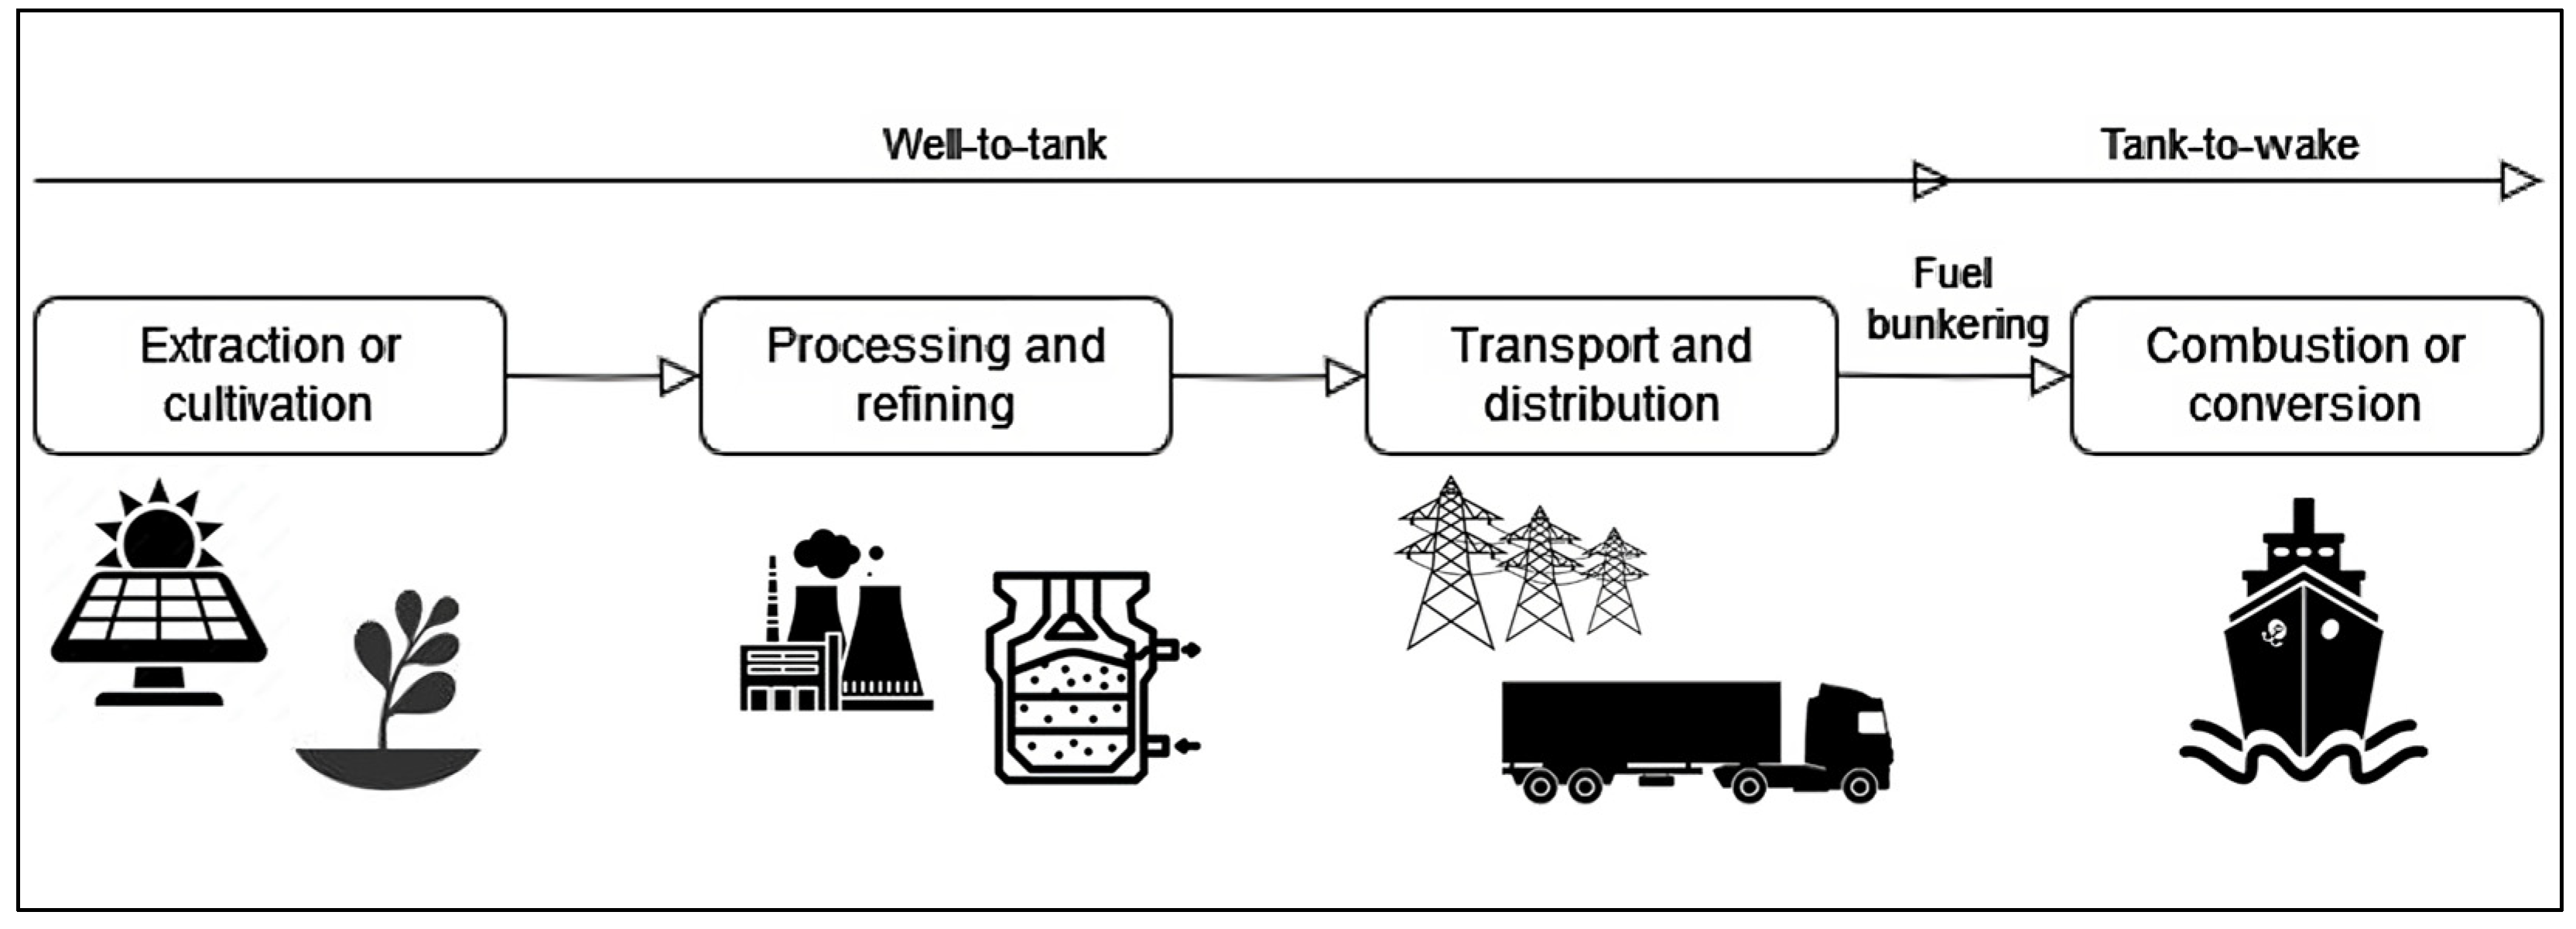
Figure 2.
Combination of keywords used to conduct this review article.
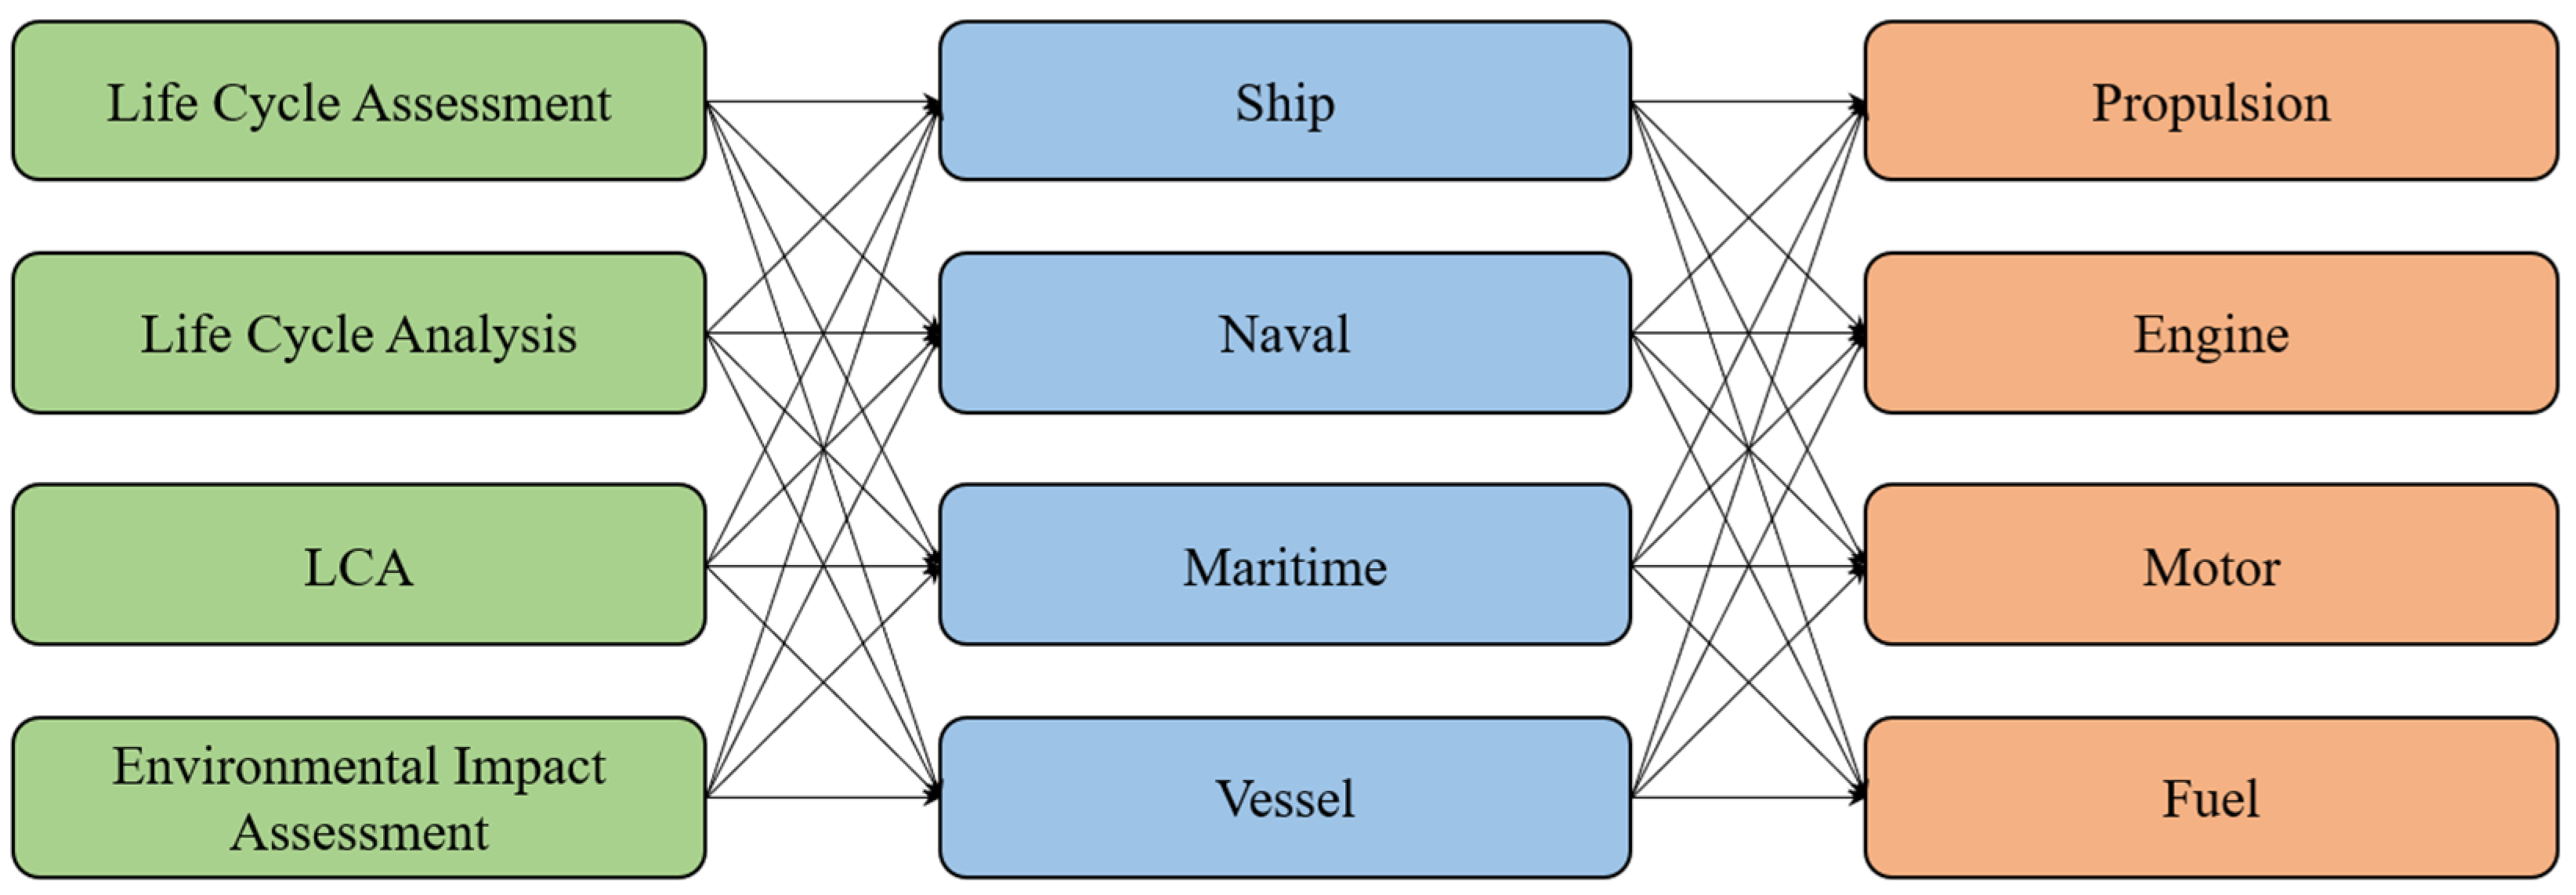
Figure 3.
Number of documents and their citation per year.
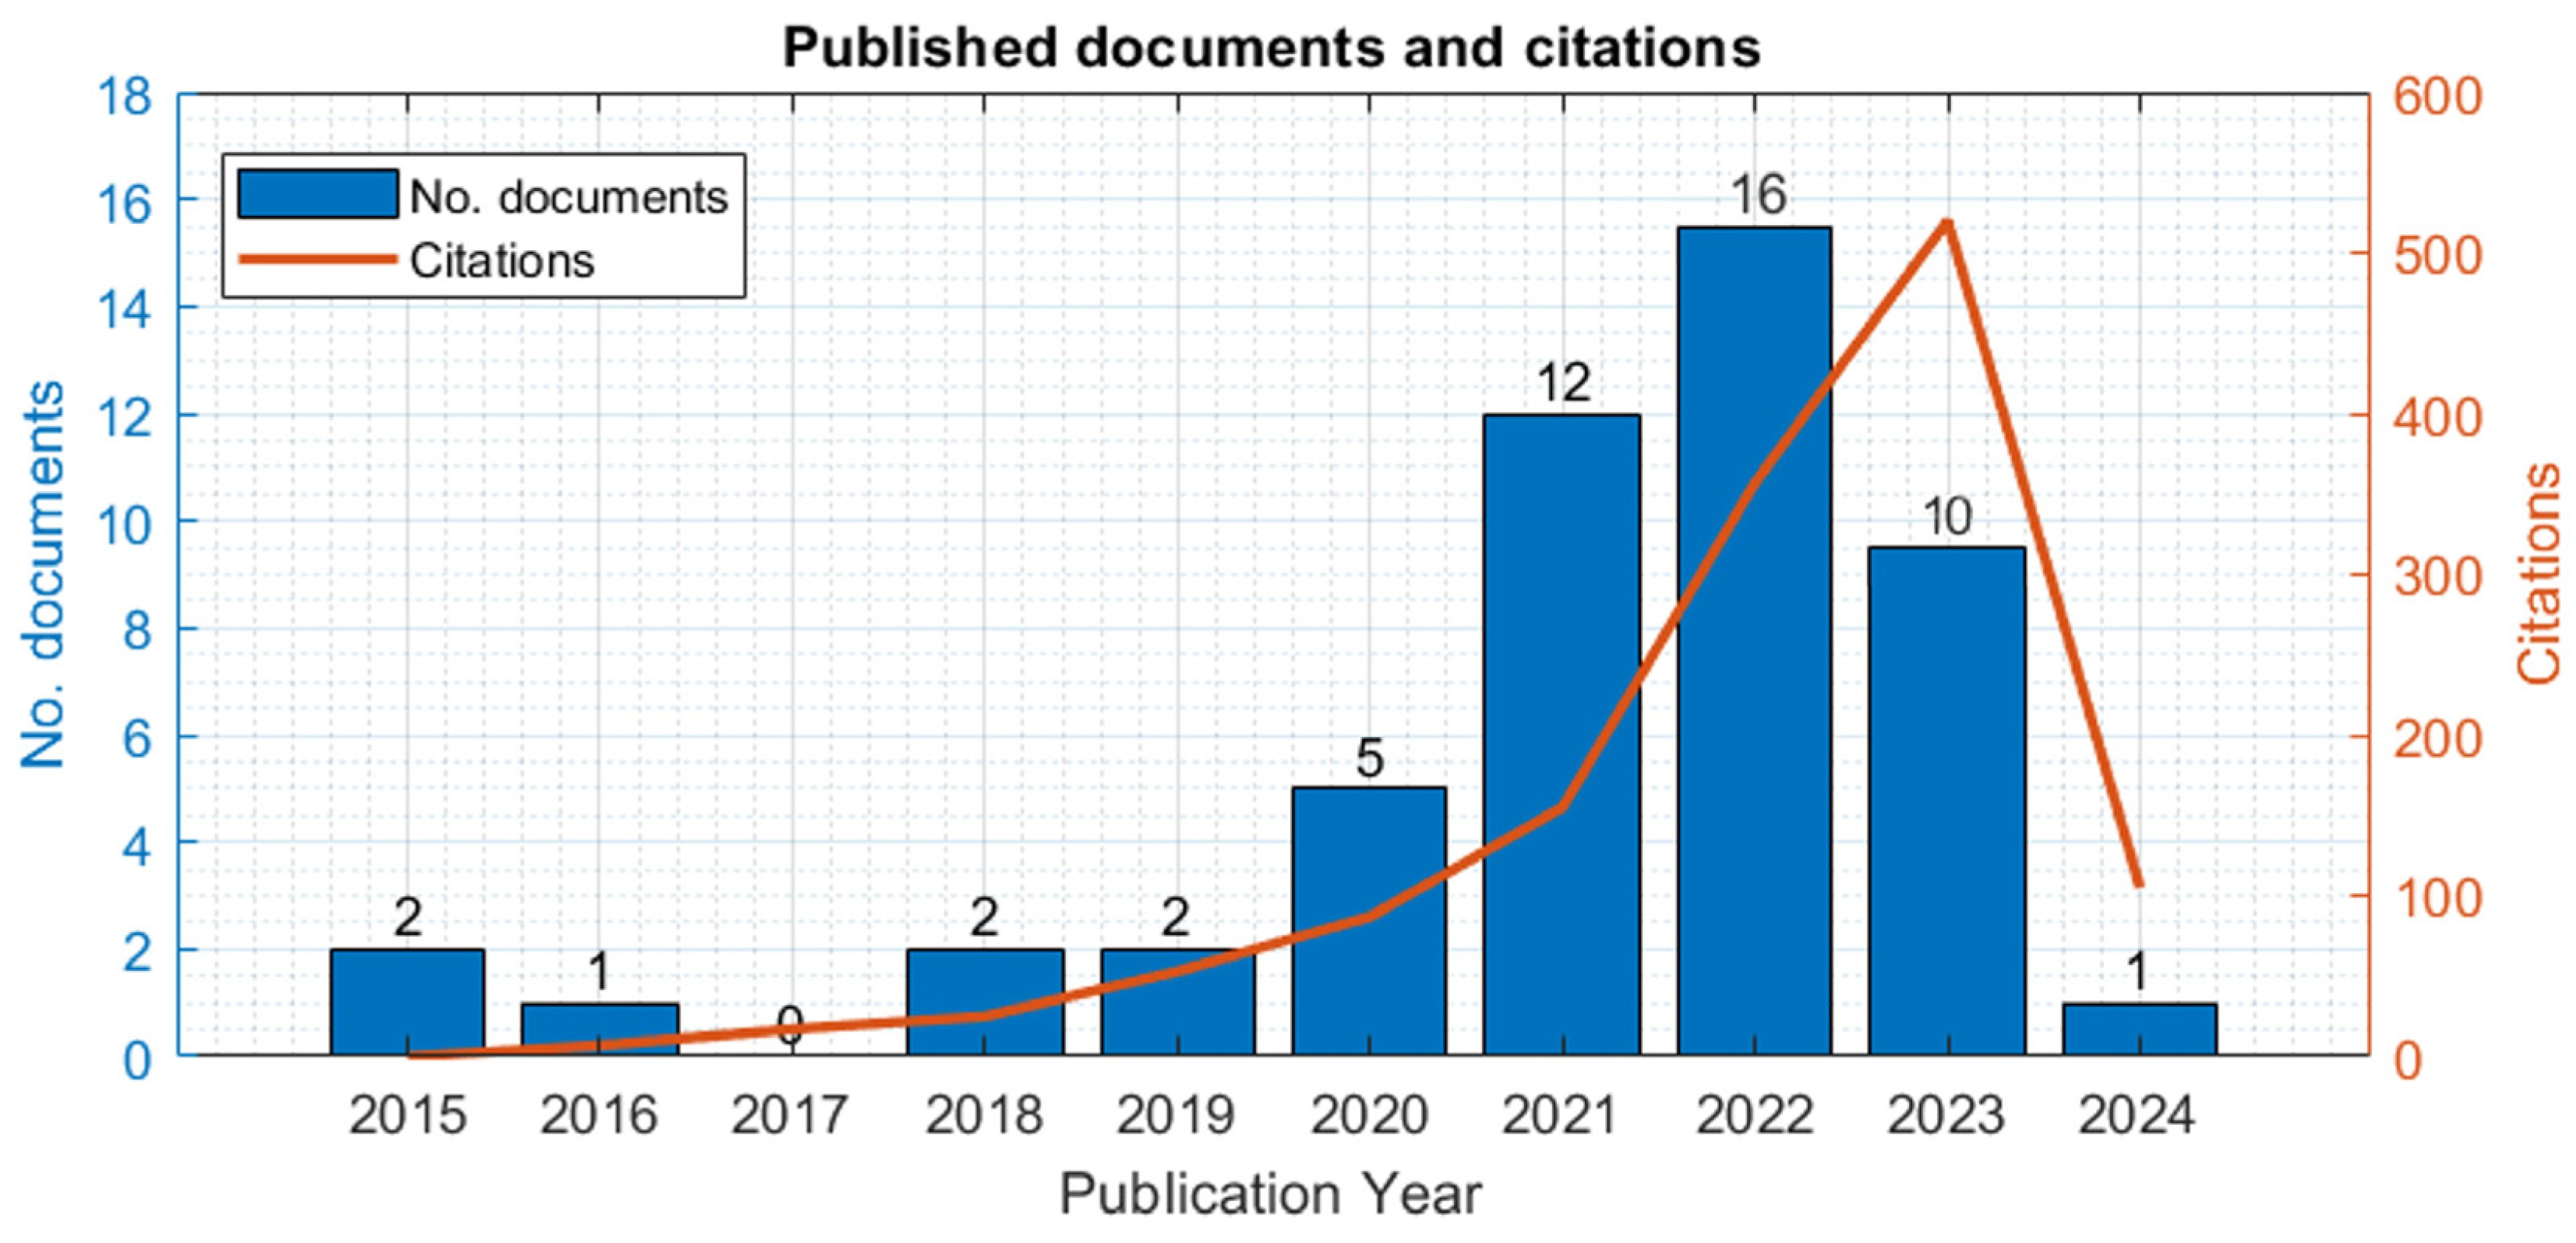
Figure 4.
Distribution of software usage: count of occurrences for each software.
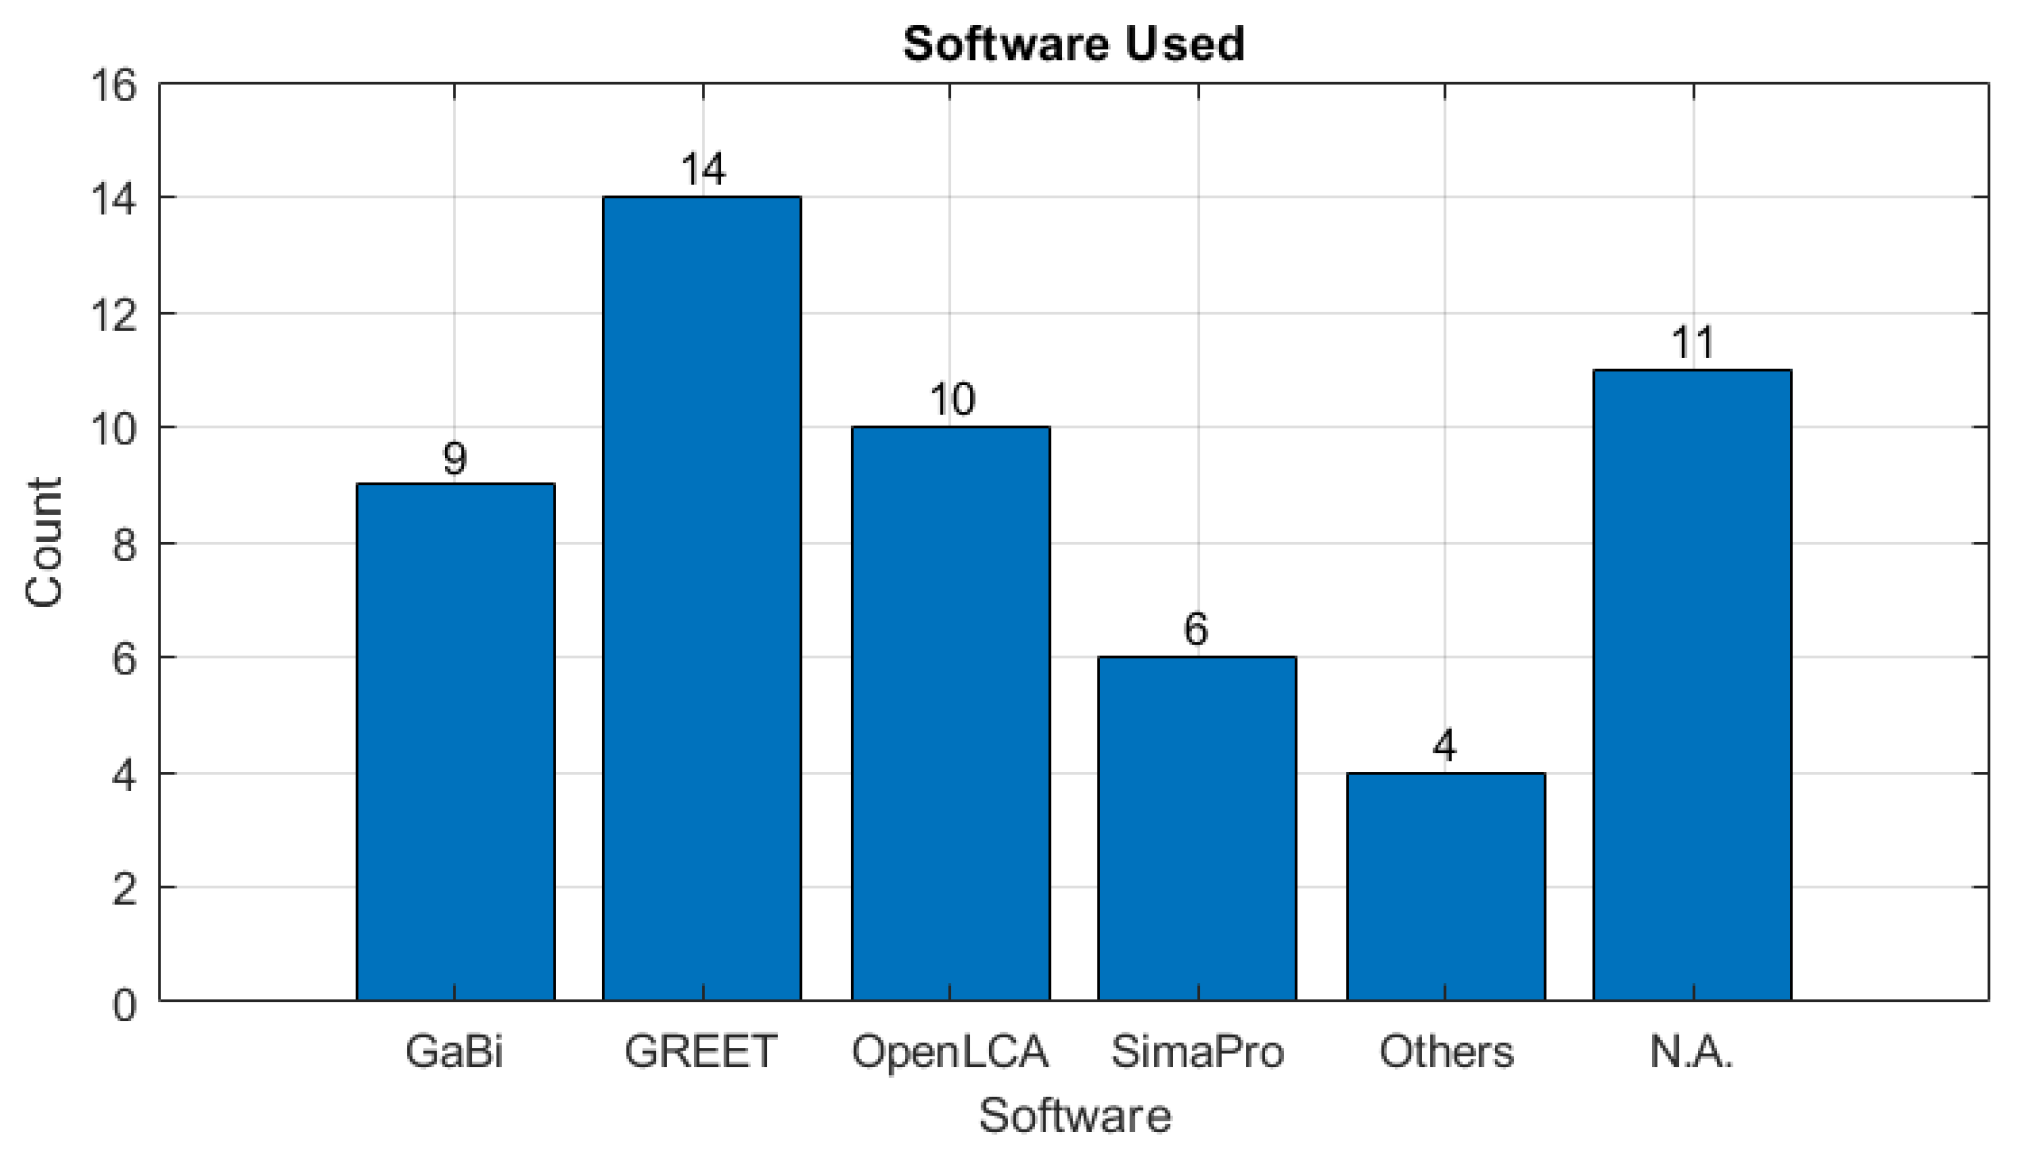
Figure 5.
Distribution of database usage: count of occurrences for each database.
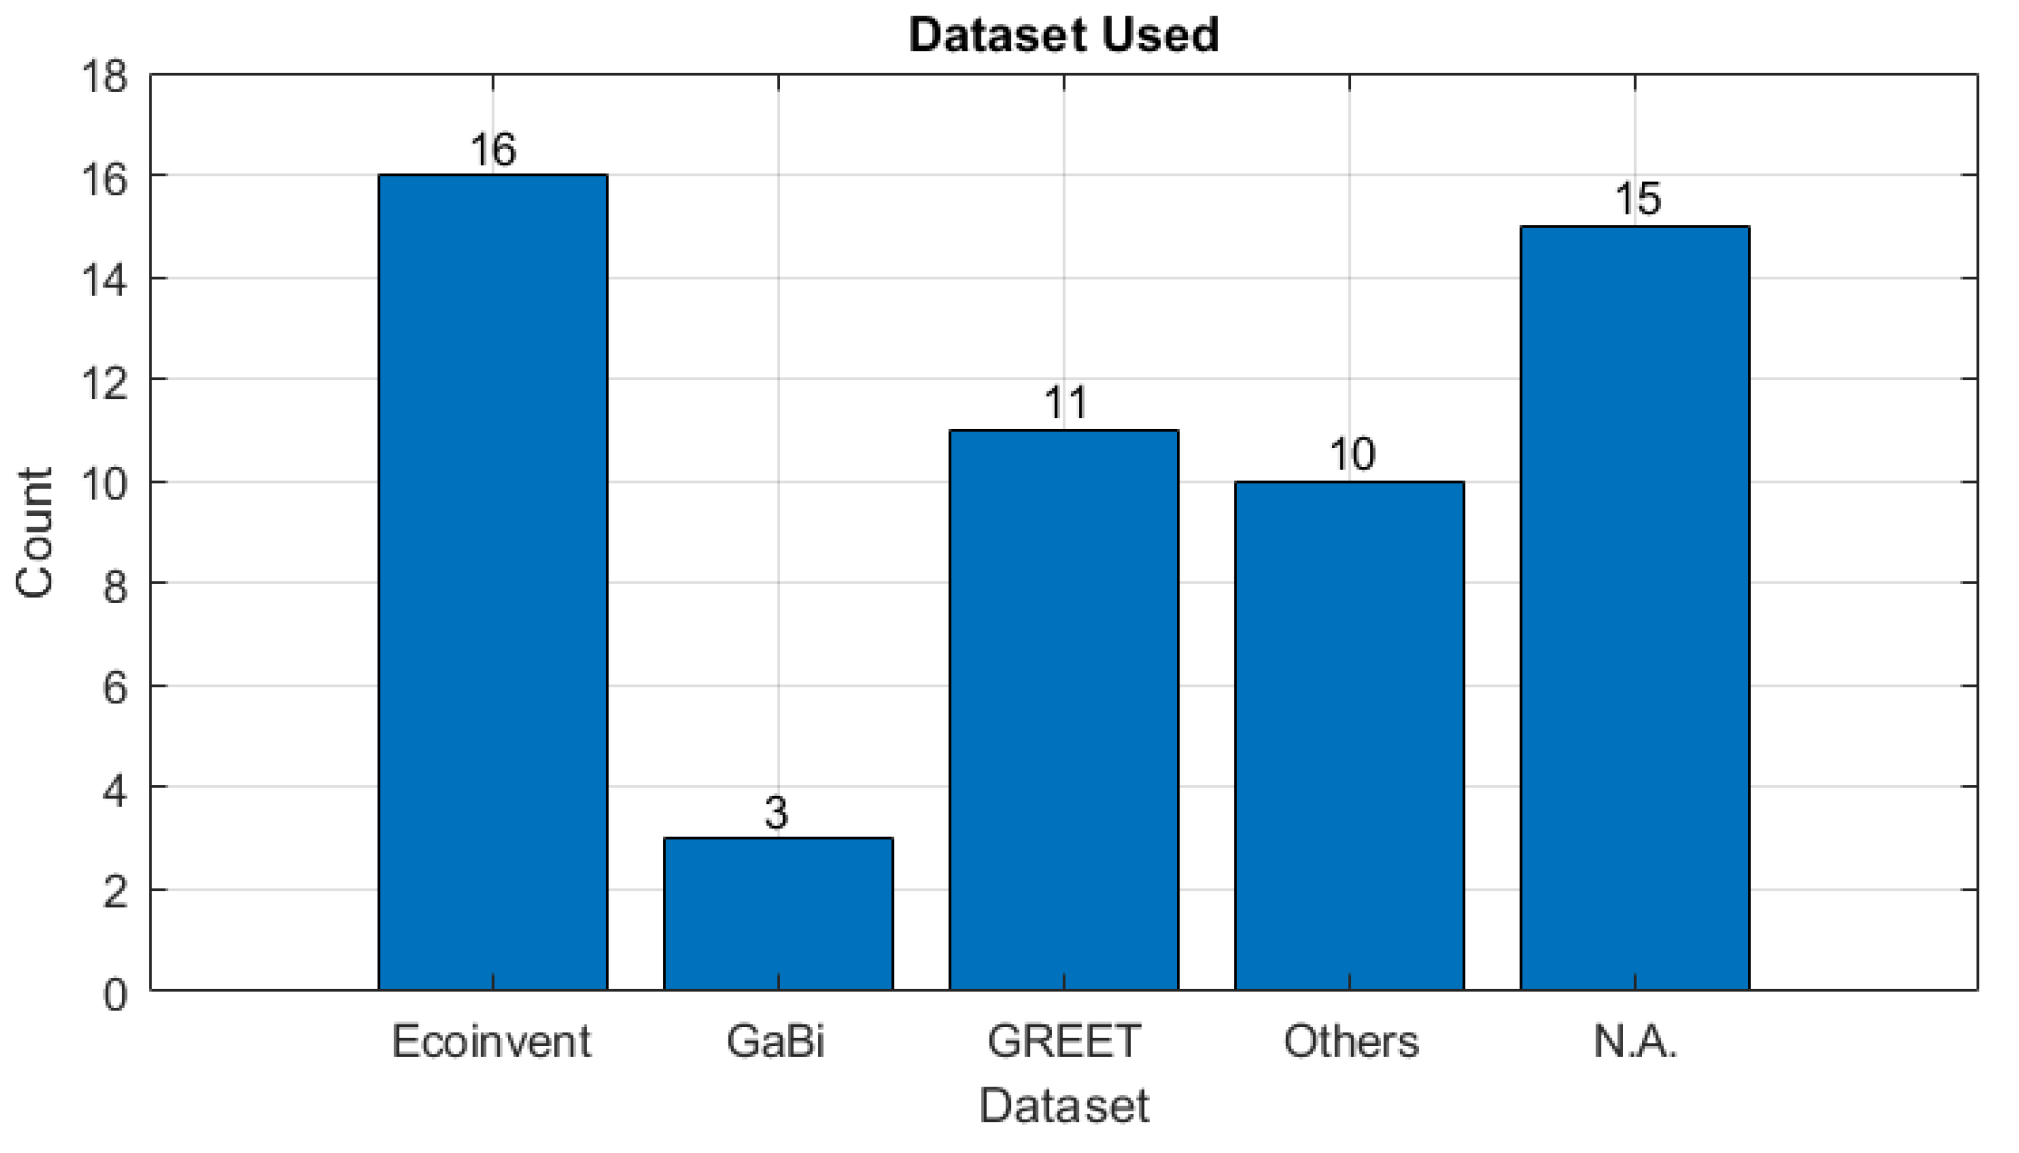
Figure 6.
Distribution of LCIA method usage: count of occurrences for each method.
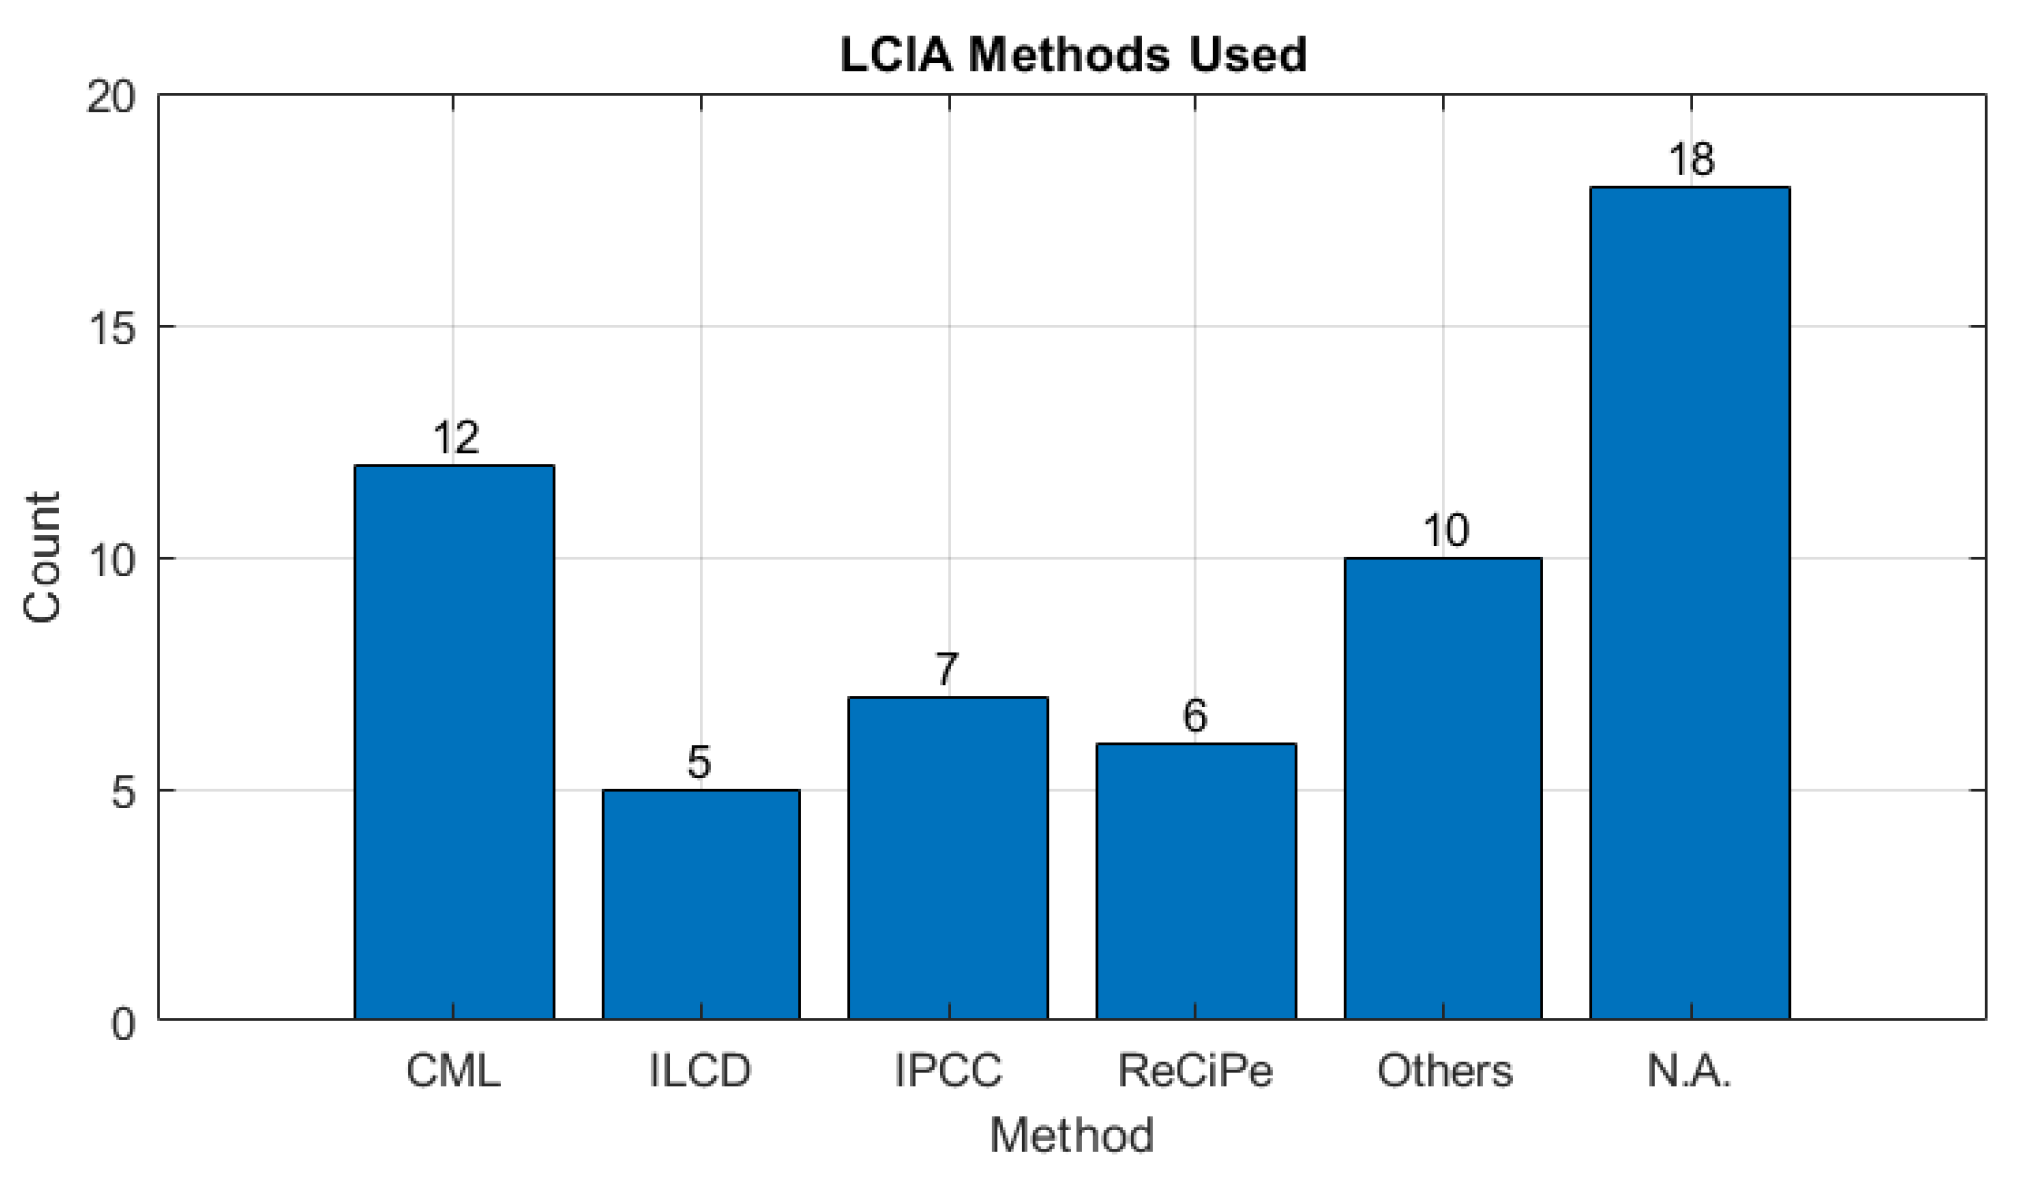
Figure 7.
Distribution of categories: count of occurrences for each category.
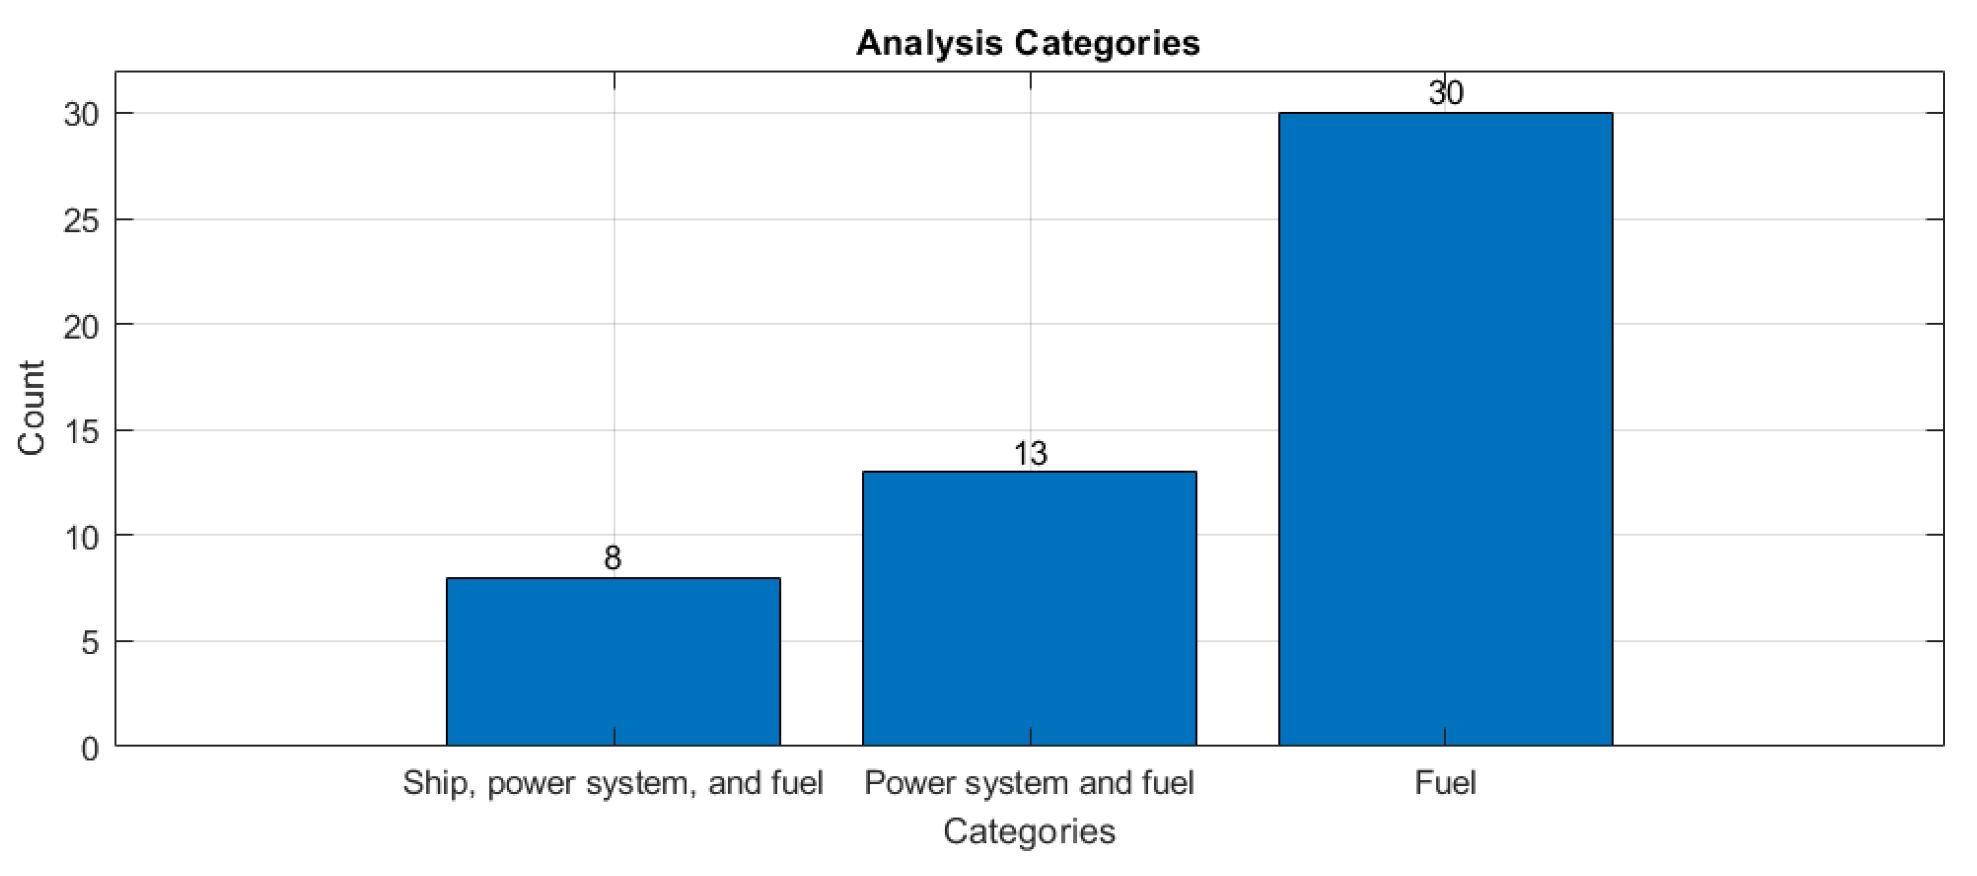
Figure 8.
Distribution of examined ships: count of occurrences for each type of ship.
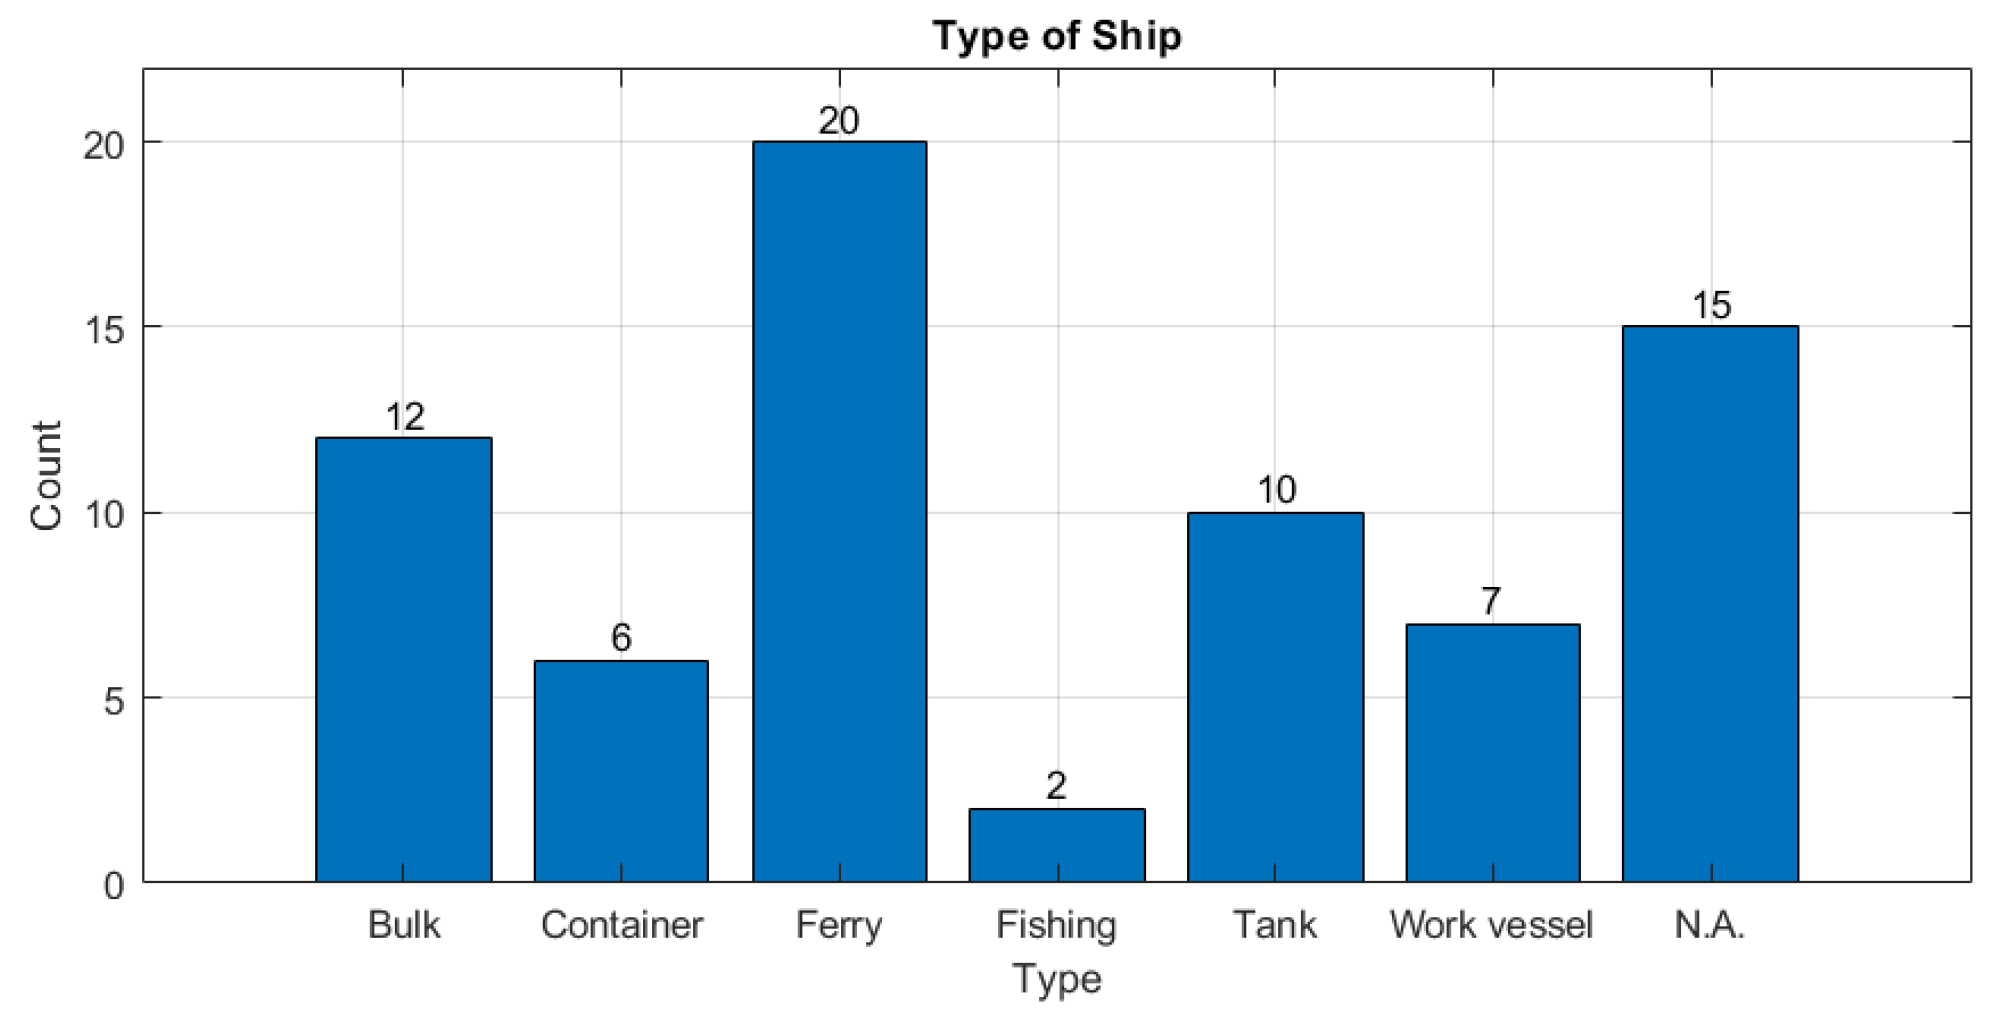
Figure 9.
Average normalized CO2-Eq. emissions per vessel type, expressed in kg CO2-Eq./kW × Year, comparing various types of fuel and propulsion technologies. The numbers above the bars represent the count of vessels analyzed for each category.
Figure 9.
Average normalized CO2-Eq. emissions per vessel type, expressed in kg CO2-Eq./kW × Year, comparing various types of fuel and propulsion technologies. The numbers above the bars represent the count of vessels analyzed for each category.


Table 1.
Keywords combination and number of documents with “Life Cycle Assessment” as the first.
| Keywords Combination | Life-Cycle Assessment | |||||||||||||||
|---|---|---|---|---|---|---|---|---|---|---|---|---|---|---|---|---|
| Ship | Naval | Maritime | Vessel | |||||||||||||
| Propulsion | Engine | Motor | Fuel | Propulsion | Engine | Motor | Fuel | Propulsion | Engine | Motor | Fuel | Propulsion | Engine | Motor | Fuel | |
| No. Documents | 52 | 78 | 10 | 163 | 9 | 8 | 5 | 11 | 18 | 32 | 2 | 87 | 24 | 52 | 13 | 130 |
| Article | 33 | 53 | 6 | 118 | 3 | 3 | 1 | 6 | 13 | 23 | 1 | 64 | 16 | 30 | 4 | 85 |
| Conference Paper | 14 | 11 | 2 | 27 | 3 | 2 | 2 | 3 | 2 | 1 | 0 | 13 | 6 | 11 | 4 | 31 |
| Book Chapter | 2 | 10 | 0 | 5 | 0 | 0 | 0 | 0 | 2 | 1 | 0 | 4 | 1 | 1 | 0 | 5 |
| Review | 3 | 4 | 2 | 12 | 3 | 3 | 2 | 2 | 1 | 7 | 1 | 5 | 1 | 10 | 5 | 9 |
| Other | 0 | 0 | 0 | 1 | 0 | 0 | 0 | 0 | 0 | 0 | 0 | 1 | 0 | 0 | 0 | 0 |
| Tot. | 694 | |||||||||||||||
Table 2.
Keywords combination and number of documents with “Life Cycle Analysis” as the first.
| Keywords Combination | Life-Cycle Analysis | |||||||||||||||
|---|---|---|---|---|---|---|---|---|---|---|---|---|---|---|---|---|
| Ship | Naval | Maritime | Vessel | |||||||||||||
| Propulsion | Engine | Motor | Fuel | Propulsion | Engine | Motor | Fuel | Propulsion | Engine | Motor | Fuel | Propulsion | Engine | Motor | Fuel | |
| No. Documents | 96 | 119 | 23 | 190 | 23 | 15 | 8 | 18 | 25 | 40 | 2 | 73 | 53 | 74 | 22 | 167 |
| Article | 52 | 67 | 8 | 135 | 9 | 7 | 2 | 8 | 15 | 26 | 1 | 56 | 24 | 36 | 8 | 90 |
| Conference Paper | 33 | 27 | 9 | 40 | 10 | 4 | 4 | 8 | 6 | 4 | 0 | 11 | 22 | 19 | 6 | 63 |
| Book Chapter | 2 | 3 | 0 | 2 | 0 | 0 | 0 | 0 | 1 | 1 | 0 | 3 | 1 | 2 | 0 | 3 |
| Review | 9 | 22 | 6 | 13 | 4 | 4 | 2 | 2 | 3 | 9 | 1 | 3 | 6 | 17 | 8 | 10 |
| Other | 0 | 0 | 0 | 0 | 0 | 0 | 0 | 0 | 0 | 0 | 0 | 0 | 0 | 0 | 0 | 1 |
| Tot. | 948 | |||||||||||||||
Table 3.
Keywords combination and number of documents with “LCA” as the first.
| Keywords Combination | LCA | |||||||||||||||
|---|---|---|---|---|---|---|---|---|---|---|---|---|---|---|---|---|
| Ship | Naval | Maritime | Vessel | |||||||||||||
| Propulsion | Engine | Motor | Fuel | Propulsion | Engine | Motor | Fuel | Propulsion | Engine | Motor | Fuel | Propulsion | Engine | Motor | Fuel | |
| No. Documents | 25 | 44 | 5 | 93 | 1 | 3 | 1 | 2 | 12 | 20 | 1 | 47 | 15 | 26 | 2 | 78 |
| Article | 16 | 33 | 5 | 75 | 0 | 1 | 0 | 1 | 8 | 15 | 1 | 34 | 11 | 19 | 1 | 67 |
| Conference Paper | 6 | 8 | 0 | 13 | 0 | 0 | 0 | 0 | 2 | 2 | 0 | 8 | 4 | 7 | 1 | 6 |
| Book Chapter | 1 | 1 | 0 | 3 | 0 | 0 | 0 | 0 | 1 | 2 | 0 | 3 | 0 | 0 | 0 | 4 |
| Review | 2 | 2 | 0 | 1 | 1 | 1 | 1 | 1 | 1 | 1 | 0 | 1 | 0 | 0 | 0 | 1 |
| Other | 0 | 0 | 0 | 1 | 0 | 1 | 0 | 0 | 0 | 0 | 0 | 1 | 0 | 0 | 0 | 0 |
| Tot. | 375 | |||||||||||||||
Table 4.
Keywords combination and number of documents with “Environmental Impact Assessment” as the first.
Table 4.
Keywords combination and number of documents with “Environmental Impact Assessment” as the first.
| Keywords Combination | Environmental Impact Assessment | |||||||||||||||
|---|---|---|---|---|---|---|---|---|---|---|---|---|---|---|---|---|
| Ship | Naval | Maritime | Vessel | |||||||||||||
| Propulsion | Engine | Motor | Fuel | Propulsion | Engine | Motor | Fuel | Propulsion | Engine | Motor | Fuel | Propulsion | Engine | Motor | Fuel | |
| No. Documents | 86 | 115 | 18 | 257 | 11 | 8 | 2 | 18 | 28 | 44 | 7 | 131 | 45 | 80 | 11 | 191 |
| Article | 51 | 75 | 13 | 186 | 6 | 3 | 1 | 7 | 17 | 31 | 4 | 98 | 25 | 47 | 7 | 127 |
| Conference Paper | 23 | 24 | 3 | 48 | 3 | 1 | 1 | 5 | 7 | 8 | 1 | 20 | 14 | 16 | 0 | 38 |
| Book Chapter | 4 | 4 | 0 | 5 | 0 | 0 | 0 | 0 | 1 | 1 | 0 | 4 | 3 | 2 | 0 | 4 |
| Review | 8 | 12 | 2 | 17 | 2 | 4 | 0 | 6 | 3 | 4 | 2 | 9 | 3 | 14 | 4 | 21 |
| Other | 0 | 0 | 0 | 1 | 0 | 0 | 0 | 0 | 0 | 0 | 0 | 0 | 0 | 1 | 0 | 1 |
| Tot. | 1052 | |||||||||||||||
Table 5.
Selected papers with publication year, boundaries used, and ship type analyzed.
| Reference | Boundaries | Ship Type |
|---|---|---|
| Trillos et al. [55] (2021) | WtW (Ship, power system, and fuel) | RoPax Ferry |
| Kanchiralla et al. [56] (2022) | WtW (Power system and fuel) | RoPax Ferry |
| Wang et al. [57] (2021) | CtG (Power system, and fuel) | Short-route ferry |
| Zincir et Arslanoglu [58] (2023) | WtW (Fuel) | Ocean tanker model |
| Seyam et al. [59] (2023) | WtT (Fuel) | Tank |
| Bicer and Dincer [60] (2017) | CtG (Ship, power system, and fuel) | Tank and freight ship |
| Fernández-Ríos et al. [61] (2022) | CtG (Power system and fuel) | N.A. |
| Ahmed et al. [62] (2023) | CtG (Ship, power system, and fuel) | Tank |
| Hwang et al. [63] (2020) | WtT, TtW, and WtW | Coastal ferry |
| Al-Aboosi et al. [64] (2021) | WtT and TtW | N.A. |
| Yacout et al. [65] (2021) | WtW (Fuel) | N.A. |
| Park et al. [66] (2022) | WtW (Fuel) | Short-route ferry |
| Wang et al. [67] (2022) | WtW and TtW (Fuel) | Super Yacht |
| Cucinotta et al. [68] (2021) | CtG (Ship, power system, and fuel) | Cruise ferry |
| Perčić et al. [69] (2021) | WtW (Power system and fuel) | Cargo, passenger, and dredger |
| Balcombe et al. [70] (2021) | WtW (Fuel) | N.A. |
| Taghavifar and Perera [71] (2022) | WtW (Fuel) | Tank |
| Manouchehrinia et al. [72] (2020) | WtW (Fuel) | Ferry |
| Malmgren et al. [73] (2021) | WtW (Fuel) | Ro-Pax |
| Jang et al. [74] (2021) | WtT and TtW (Fuel) | Bulk, container, tank, and Ro-Ro |
| Perčić et al. [75] (2022) | WtT and TtW (Power system and fuel) | Ro-Ro passenger |
| Bilgili [76] (2021) | WtT, TtW, and WtW (Fuel) | N.A. |
| Barbosa Watanabe et al. [77] (2022) | WtW (Fuel) | N.A. |
| Lee et al. [78] (2022) | WtT, WtW, and WtW (Fuel) | Ferry |
| Dong and Cai [79] (2018) | CtG (Ship, power system, and fuel) | Bulk |
| Ling-Chin and Roskilly [80] (2016) | CtG (Power system and fuel) | Ro-Ro cargo |
| Wang et al. [81] (2019) | CtG (Power system and fuel) | Ferry |
| Chen and Lee Lam [82] (2022) | CtG (Power system and fuel) | Tugboat |
| Tsang et al. [83] (2015) | WtT (Fuel) | N.A. |
| Huang et al. [84] (2022) | WtT and TtW (Fuel) | Tank |
| Sharafian et al. [85] (2019) | WtT and TtW (Fuel) | N.A. |
| Taghavifar and Perera [86] (2023) | WtT and TtW (Fuel) | N.A. |
| Seithe et al. [87] (2020) | WtW (Fuel) | Container, cruise, tanker, Ro-Pax |
| Perčić et al. [88] (2020) | WtW (Power system and fuel) | Ro-Pax |
| Wang et al. [89] (2023) | CtG (Ship, power system, and fuel) | Ferry, pelagic trawler, and tug |
| Gilbert et al. [90] (2017) | WtT and TtW (Fuel) | N.A. |
| Krantz et al. [91] (2023) | WtW (Fuel) | N.A. |
| Knight et al. [92] (2023) | WtT and TtW (Power system and fuel) | Ferry |
| Zincir [93] (2022) | WtT and TtW (Fuel) | General cargo |
| Thomson et al. [5] (2015) | WtW (Fuel) | Container and tug |
| Masum et al. [94] (2023) | WtW (Fuel) | N.A. |
| Tomos et al. [95] (2023) | WtW (Ship, power system, and fuel) | Tank, bulk, general cargo, container, and offshore vessels |
| Chalaris et al. [96] (2022) | WtW (Fuel) | Bulk |
| Zhang et al. [97] (2022) | WtW (Ship, power system, and fuel) | Bulk, container, and general cargo |
| Al-Douri et al. [98] (2021) | WtW (Fuel) | Tank, container, bulk, and general cargo |
| Taghavifar et al. [99] (2023) | WtT and TtW (Fuel) | N.A. |
| Yan et al. [100] (2022) | WtT and TtW (Power system and fuel) | Bulk |
| Mestemaker et al. [101] (2020) | CtG (Power system and fuel) | N.A. |
| Bilgili [102] (2021) | WtW (Fuel) | N.A. |
| Koričan et al. [103] (2022) | WtT and TtW (Fuel) | Fishing |
| Kim et al. [104] (2023) | WtT and TtW (Power system and fuel) | Fishing |
Table 6.
Comparative overview including data on fuel consumption, engine power (kW), WtW emissions (kg CO2-Eq.), and normalized emissions (kg CO2-Eq./kW × Year) for ferries.
Table 6.
Comparative overview including data on fuel consumption, engine power (kW), WtW emissions (kg CO2-Eq.), and normalized emissions (kg CO2-Eq./kW × Year) for ferries.
| Ref. | Fuel and Scenario | Engine Power (kW) | WtW (kg CO2 Eq.) | Normalized Emissions (kg CO2-Eq./kW × Year) |
|---|---|---|---|---|
| [63] | MGO | 4000.0 | 2.36 × 10⁸ | 2.25 × 10³ |
| LNG | 2.28 × 10⁸ | 2.44 × 10³ | ||
| Hydrogen (from LNG and coal power) | 3.27 × 10⁸ | 4.09 × 10³ | ||
| Hydrogen (from LNG and Nuclear Energy (SMR)) | 2.13 × 10⁸ | 2.66 × 10³ | ||
| Hydrogen (from LNG and Renewable) Energy (SMR) | 2.14 × 10⁸ | 2.68 × 10³ | ||
| Hydrogen (from LNG and Electricity (SMR)) | 2.77 × 10⁸ | 3.46 × 10³ | ||
| [67] | MGO | 4486.0 | 2.05 × 10⁷ | 1.83 × 10² |
| LNG | 2.20 × 10⁷ | 1.96 × 10² | ||
| Methanol (from NG) | 2.10 × 10⁷ | 1.87 × 10² | ||
| Biomethanol | 4.31 × 10⁶ | 3.84 × 10 | ||
| Biodiesel (Soy) | 1.66 × 10⁷ | 1.48 × 10² | ||
| Hydrogen (SMR) | 2.25 × 10⁷ | 2.00 × 10² | ||
| Hydrogen (Alkaline Water Electrolysis) | 1.24 × 10⁶ | 1.11 × 10 | ||
| [68] | HFO | 24,000.0 | 1.39 × 10⁸ | 2.32 × 10² |
| LNG | 22,400.0 | 8.35 × 10⁸ | 1.49 × 10³ | |
| [75] | Eurodiesel Blue | 876.0 | 4.40 × 10⁶ | 2.51 × 10² |
| Electricity (Li-ion Battery) | 2.29 × 10⁶ | 1.31 × 10² | ||
| Eurodiesel Blue | 2604 | 4.30 × 10⁷ | 8.26 × 10² | |
| Electricity (Li-ion Battery) | 2.21 × 10⁷ | 4.24 × 10² | ||
| Eurodiesel Blue | 5544.0 | 1.44 × 10⁸ | 1.30 × 10³ | |
| Electricity (Li-ion Battery) | 7.50 × 10⁷ | 6.76 × 10² | ||
| [78] | MGO | 1080.0 | 3.05 × 10⁷ | 1.41 × 10³ |
| LNG | 3.02 × 10⁷ | 1.40 × 10³ | ||
| Hydrogen | 1200.0 | 3.37 × 10⁷ | 1.40 × 10³ | |
| [81] | Diesel—Without solar panel | 1268.0 | 5.75 × 10⁷ | 1.81 × 10³ |
| Diesel—With solar panel | 5.47 × 10⁷ | 1.73 × 10³ | ||
| [88] | Eurodiesel Blue | 876.0 | 4.40 × 10⁶ | 2.51 × 10² |
| Electricity (Li-ion Battery) | 2.29 × 10⁶ | 1.31 × 10² | ||
| Methanol | 3.04 × 10⁶ | 1.73 × 10² | ||
| LNG | 4.02 × 10⁶ | 2.30 × 10² | ||
| Eurodiesel Blue | 2604.0 | 4.30 × 10⁷ | 8.26 × 10² | |
| Electricity (Li-ion Battery) | 2.21 × 10⁷ | 4.24 × 10² | ||
| Methanol | 2.99 × 10⁷ | 5.74 × 10² | ||
| LNG | 3.96 × 10⁷ | 7.61 × 10² | ||
| Eurodiesel Blue | 5544.0 | 1.44 × 10⁸ | 1.30 × 10² | |
| Electricity (Li-ion Battery) | 7.50 × 10⁷ | 6.76 × 10² | ||
| Methanol | 9.82 × 10⁷ | 8.86 × 10² | ||
| LNG | 1.30 × 10⁸ | 1.17 × 10³ |
Table 7.
Comparative overview including data on fuel consumption, engine power (kW), WtW emissions (kg CO2-Eq.), and normalized emissions (kg CO2-Eq./kW × Year) for bulk carriers.
Table 7.
Comparative overview including data on fuel consumption, engine power (kW), WtW emissions (kg CO2-Eq.), and normalized emissions (kg CO2-Eq./kW × Year) for bulk carriers.
| Ref. | Fuel and Scenario | Engine Power (kW) | WtW (kg CO2 Eq.) | Normalized Emissions (kg CO2-Eq./kW × Year) |
|---|---|---|---|---|
| [79] | HFO (P20) | 8830.0 | 3.04 × 10⁷ | 1.72 × 10² |
| LSHFO (P20) | 2.88 × 10⁷ | 1.63 × 10² | ||
| HFO (P30) | 3.11 × 10⁷ | 1.17 × 10² | ||
| LSHFO (P30) | 2.95 × 10⁷ | 1.11 × 10² | ||
| [93] | MDO | 2940.0 | 2.94 × 10⁶ | 1.00 × 10³ |
| 40% MDO—60% ammonia (from coal) | 5.51 × 10⁶ | 1.87 × 10³ | ||
| 40% MDO—60% ammonia (from oil) | 3.76 × 10⁶ | 1.28 × 10³ | ||
| 40% MDO—60% ammonia (from NG) | 2.89 × 10⁶ | 9.83 × 10² | ||
| 40% MDO—60% ammonia (from NG + CCS) | 2.15 × 10⁶ | 7.31 × 10² | ||
| 40% MDO—60% ammonia (from solar) | 2.10 × 10⁶ | 7.14 × 10² | ||
| 40% MDO—60% ammonia (from wind) | 1.47 × 10⁶ | 5.01 × 10² | ||
| 5% MDO—95% ammonia (from coal) | 7.00 × 10⁶ | 2.38 × 10³ | ||
| 5% MDO—95% ammonia (from oil) | 4.24 × 10⁶ | 1.44 × 10³ | ||
| 5% MDO—95% ammonia (from NG) | 2.86 × 10⁶ | 9.71 × 10² | ||
| 5% MDO—95% ammonia (from NG + CCS) | 1.68 × 10⁶ | 5.73 × 10² | ||
| 5% MDO—95% ammonia (from solar) | 1.61 × 10⁶ | 5.46 × 10² | ||
| 5% MDO—95% ammonia (from wind) | 6.12 × 10⁵ | 2.08 × 10² | ||
| [99] | LSD | 1346.8 | 1.81 × 10⁶ | 1.34 × 10³ |
| LNG | 1.52 × 10⁶ | 1.13 × 10³ | ||
| CH4 + LNG (S1) | 1.50 × 10⁶ | 1.11 × 10³ | ||
| CO2 sequestration from H2 gas production from NG: carbon capture (S2) | 1.41 × 10⁶ | 1.05 × 10³ | ||
| LNG + electricity (S3) | 1.48 × 10⁶ | 1.10 × 10³ | ||
| S4 | 1.56 × 10⁶ | 1.15 × 10³ | ||
| LNG 90% + Diesel 10% (T1) | 1.48 × 10⁶ | 1.10 × 10³ | ||
| LNG 90% + Diesel 10% (T2) | 1.48 × 10⁶ | 1.10 × 10³ | ||
| LNG 90% + Diesel 10% (T3) | 1.51 × 10⁶ | 1.12 × 10³ |
Table 8.
Comparative overview including data on fuel consumption, engine power (kW), WtW emissions (kg CO2-Eq.), and normalized emissions (kg CO2-Eq./kW × Year) for tankers.
Table 8.
Comparative overview including data on fuel consumption, engine power (kW), WtW emissions (kg CO2-Eq.), and normalized emissions (kg CO2-Eq./kW × Year) for tankers.
| Ref. | Fuel and Scenario | Engine Power (kW) | WtW (kg CO2 Eq.) | Normalized Emissions (kg CO2-Eq./kW × Year) |
|---|---|---|---|---|
| [84] | MGO | 22,000.0 | 8.91 × 10⁷ | 4.05 × 10³ |
| LNG | 7.25 × 10⁷ | 3.29 × 10³ | ||
| Methanol (from coal) | 2.16 × 10⁸ | 9.80 × 10³ | ||
| Methanol (from NG) | 1.12 × 10⁸ | 5.09 × 10³ | ||
| Methanol (from partial solar) | 1.21 × 10⁸ | 5.51 × 10³ | ||
| Methanol (from full solar and battery) | 5.86 × 10⁴ | 2.66 × 100 | ||
| Ammonia (from coal) | 2.36 × 10⁸ | 1.07 × 10⁴ | ||
| Ammonia (from NG) | 1.79 × 10⁸ | 8.14 × 10³ | ||
| Ammonia (from full solar and battery) | 6.66 × 10⁷ | 3.03 × 10³ | ||
| MGO | 15,400.0 | 1.62 × 10⁸ | 1.05 × 10⁴ | |
| LNG | 8.46 × 10⁷ | 5.49 × 10³ | ||
| Methanol (from coal) | 6.75 × 10⁷ | 4.38 × 10³ | ||
| Methanol (from NG) | 5.49 × 10⁷ | 3.56 × 10³ | ||
| Methanol (from partial solar) | 9.14 × 10⁷ | 5.94 × 10³ | ||
| Methanol (from full solar and battery) | 4.49 × 10⁷ | 2.92 × 10³ | ||
| Ammonia (from coal) | 1.79 × 10⁵ | 1.16 × 101 | ||
| Ammonia (from NG) | 1.30 × 10⁸ | 8.41 × 10³ | ||
| Ammonia (from full solar and battery) | 5.23 × 10⁷ | 3.40 × 10³ |
Table 9.
Comparative overview including data on fuel consumption, engine power (kW), WtW emissions (kg CO2-Eq.), and normalized emissions (kg CO2-Eq./kW × Year) for work vessels.
Table 9.
Comparative overview including data on fuel consumption, engine power (kW), WtW emissions (kg CO2-Eq.), and normalized emissions (kg CO2-Eq./kW × Year) for work vessels.
| Ref. | Fuel and Scenario | Engine Power (Kw) | WtW (kg CO2 Eq.) | Normalized Emissions (kg CO2-Eq./kW × Year) |
|---|---|---|---|---|
| [82] | Diesel | 3736.0 | 5.46 × 10⁷ | 7.31 × 10² |
| Hydrogen | 3260.8 | 8.07 × 10⁶ | 1.24 × 10² |
Table 10.
Comparative overview including data on fuel consumption, engine power (kW), WtW emissions (kg CO2-Eq.), and normalized emissions (kg CO2-Eq./kW × Year) for fishing vessels.
Table 10.
Comparative overview including data on fuel consumption, engine power (kW), WtW emissions (kg CO2-Eq.), and normalized emissions (kg CO2-Eq./kW × Year) for fishing vessels.
| Ref. | Fuel and Scenario | Engine Power (kW) | WtW (kg CO2 Eq.) | Normalized Emissions (kg CO2-Eq./kW × Year) |
|---|---|---|---|---|
| [103] | MDO | 223.0 | 4.61 × 10⁶ | 1.03 × 10³ |
| Electricity | 2.87 × 10⁶ | 6.44 × 10² | ||
| Methanol | 3.39 × 10⁶ | 7.60 × 10² | ||
| LNG | 2.93 × 10⁶ | 6.58 × 10² | ||
| Ammonia | 8.35 × 10⁶ | 1.87 × 10³ | ||
| B20 | 3.78 × 10⁶ | 8.46 × 10² | ||
| Hydrogen | 3.65 × 10⁶ | 8.19 × 10² | ||
| [104] | Gasoline (Coastal) | 186.0 | 1.15 × 10⁶ | 2.06 × 10² |
| MDO (Coastal) | 1.20 × 10⁶ | 2.15 × 10² | ||
| LPG (Coastal) | 8.25 × 10⁵ | 1.48 × 10² | ||
| CPO (Coastal) | 3.33 × 10⁵ | 5.97 × 101 | ||
| BRD (Coastal) | 3.88 × 10⁵ | 6.95 × 101 | ||
| MDO (Offshore) | 1.85 × 10⁶ | 3.32 × 10² | ||
| LPG (Offshore) | 1.29 × 10⁶ | 2.30 × 10² | ||
| CPO (Offshore) | 5.45 × 10⁵ | 9.77 × 101 | ||
| BRD (Offshore) | 6.27 × 10⁵ | 1.12 × 10² | ||
| Gasoline (Other) | 1.75 × 10⁶ | 3.14 × 10² | ||
| MDO (Other) | 2.00 × 10⁶ | 3.58 × 10² | ||
| LPG (Other) | 1.37 × 10⁶ | 2.46 × 10² | ||
| CPO (Other) | 5.45 × 10⁵ | 9.76 × 101 | ||
| BRD (Other) | 6.37 × 10⁵ | 1.14 × 10² |
Table 11.
GWP-related emission ranges for each fuel category.
| Fuel | Normalized Emissions Magnitude Range (kg CO2-Eq./kW × Year) |
|---|---|
| 40% MDO e 60% Ammonia | 102–103 |
| Ammonia | 101–104 |
| B20 | 102–102 |
| Biodiesel (Soy) | 102–102 |
| BRD | 101–102 |
| CPO | 101–101 |
| Electricity | 102–102 |
| Eurodiesel Blue | 102–103 |
| Gasoline | 102–102 |
| HFO | 102–103 |
| Hydrogen | 101–103 |
| LNG | 102–103 |
| LNG Hybrid (Electricity) | 103–103 |
| LPG | 102–102 |
| LSD | 103–103 |
| LSHFO | 102–102 |
| MDO | 103–103 |
| Methanol | 100–103 |
| MGO | 102–104 |
Disclaimer/Publisher’s Note: The statements, opinions and data contained in all publications are solely those of the individual author(s) and contributor(s) and not of MDPI and/or the editor(s). MDPI and/or the editor(s) disclaim responsibility for any injury to people or property resulting from any ideas, methods, instructions or products referred to in the content. |
© 2024 by the authors. Licensee MDPI, Basel, Switzerland. This article is an open access article distributed under the terms and conditions of the Creative Commons Attribution (CC BY) license (https://creativecommons.org/licenses/by/4.0/).
Share and Cite
MDPI and ACS Style
Cucinotta, F.; Barberi, E.; Salmeri, F. A Review on Navigating Sustainable Naval Design: LCA and Innovations in Energy and Fuel Choices. J. Mar. Sci. Eng. 2024, 12, 520. https://doi.org/10.3390/jmse12030520
AMA Style
Cucinotta F, Barberi E, Salmeri F. A Review on Navigating Sustainable Naval Design: LCA and Innovations in Energy and Fuel Choices. Journal of Marine Science and Engineering. 2024; 12(3):520. https://doi.org/10.3390/jmse12030520
Chicago/Turabian StyleCucinotta, Filippo, Emmanuele Barberi, and Fabio Salmeri. 2024. "A Review on Navigating Sustainable Naval Design: LCA and Innovations in Energy and Fuel Choices" Journal of Marine Science and Engineering 12, no. 3: 520. https://doi.org/10.3390/jmse12030520
Note that from the first issue of 2016, this journal uses article numbers instead of page numbers. See further details here.