Article

Risk Analysis and Visualization of Merchant and Fishing Vessel Collisions in Coastal Waters: A Case Study of Fujian Coastal Area

1
School of Transportation, Fujian University of Technology, Fuzhou 350118, China
2
Fujian Engineering Research Center of Safety Control for Ship Intelligent Navigation, College of Physics and Electronic Information Engineering, Minjiang University, Fuzhou 350108, China
3
College of Computer and Data Science, Minjiang University, Fuzhou 350108, China
4
Fuzhou Institute of Oceanography, Minjiang University, Fuzhou 350108, China
5
Fuzhou Aids to Navigation Division of Eastern Navigation Services Center, China Maritime Safety Administration, Fuzhou 350004, China
*
Author to whom correspondence should be addressed.
These authors contributed equally to this work.
J. Mar. Sci. Eng. 2024, 12(4), 681; https://doi.org/10.3390/jmse12040681
Submission received: 27 February 2024 / Revised: 26 March 2024 / Accepted: 13 April 2024 / Published: 19 April 2024

Abstract

:
The invasion of ship domains stands out as a significant factor contributing to the risk of collisions during vessel navigation. However, there is a lack of research on the mechanisms underlying the collision risks specifically related to merchant and fishing vessels in coastal waters. This study proposes an assessment method for collision risks between merchant and fishing vessels in coastal waters and validates it through a comparative analysis through visualization. First of all, the operational status of fishing vessels is identified. Collaboratively working fishing vessels are treated as a unified entity, expanding their ship domain during operation to assess collision risks. Secondly, to quantify the collision risk between ships, a collision risk index (CRI) is proposed and visualized based on the severity of the collision risk. Finally, taking the high-risk area for merchant and fishing vessel collisions in the Minjiang River Estuary as an example, this paper conducts an analysis that involves classifying ship collision scenarios, extracts risk data under different collision scenarios, and visually analyzes areas prone to danger. The results indicate that this method effectively evaluates the severity of collision risk, and the identified high-risk areas resulting from the analysis are verified by the number of accidents that occurred in the most recent three years.

1. Introduction

In recent years, the marine fishing industry has undergone rapid expansion and has emerged as a pivotal facet within the maritime fisheries sector. The proliferation of fishing vessels has led to a discernible increase in channel congestion, making the navigational environment more intricate and increasing the collision risk. Despite the integration of GPS, AIS, and the Beidou positioning system in many fishing vessels, merchant vessels often lack familiarity with the operational practices, methods, and working domains of fishing vessels. Consequently, insufficient attention is devoted to fishing zones and areas with a heightened risk of collisions. And effective communication between merchant and fishing vessels during hazardous situations proves challenging, culminating in collision incidents. Moreover, the visualization of high-risk navigational areas prone to collisions between merchant and fishing vessels holds paramount significance for maritime safety. Firstly, it can issue navigational hazard warnings to vessels in areas characterized by high navigational density, thereby mitigating the occurrence of maritime accidents. Secondly, with a comprehensive understanding of the primary navigation routes and operational domains of merchant fishing vessels, targeted supervision within these areas can be implemented by maritime authorities. However, devising a risk quantification model to assess collision risks between merchant and fishing vessels in different areas remains challenging due to the disparate maneuvering characteristics, navigational environments, and risk standards associated with these vessel types.
With the application requirements of AIS equipment by the IMO and the development of artificial intelligence technology, AIS data become the most powerful “big data” of maritime traffic [1]. Collision risk research based on big data has become a mainstream trend. Liu et al. [2] use static and dynamic information from the automatic identification system (AIS) to calculate the closest points of ship–ship collisions (CPCs) based on ship specifications and geographic positioning, estimate dynamic collision boundaries, and introduce a kinematics-feature-based vessel conflict ranking operator (KF-VCRO) to evaluate collision risk by integrating relative position and velocity information from AIS. Silveira et al. [3] propose a method to calculate the collision risk from the assessment of the number of collision candidates by estimating future distances between ships based on their previous positions, courses, and speeds and comparing those distances with a defined collision diameter. However, the method relies on estimating future distances between ships based on their previous positions, courses, and speeds. So this estimation may not always accurately reflect the actual future positions of the ships, leading to potential inaccuracies in the collision risk assessment.
At present, the analysis of ship collision risk under different navigation conditions can be mainly divided into qualitative analysis and quantitative analysis. Regarding the qualitative analysis of vessel collision risk, Sedov et al. [4] introduce a fuzzy linguistic model to determine collision risk levels for vessels in busy traffic areas. This model comprises 22 terms within five fundamental term sets, each endowed with membership function parameters, and a total of 200 fuzzy rules are generated to delineate collision risk levels. Additionally, Yi et al. [5] leverage fuzzy reasoning and discrete event system specification (DEVS) theory to propose a novel model for predicting vessel collision risks while considering general collision avoidance patterns. This innovative model anticipates collision risks by forecasting changes to future vessel movements, and the authors validate the functionality of the model’s structure and fuzzy reasoning module through simulation experiments. In the domain of quantitative analysis for vessel collision risk, scholars often employ the concept of closest point of approach (CPA) for situational analysis. Chin et al. [6] from the National University of Singapore have established a collision risk regression model for port waters based on CPA. In this model, distance to closest point of approach (DCPA) and time to closest point of approach (TCPA) are pivotal factors for determining collision risks.
In order to study the characteristics, causes, and risks of collision accidents between merchant and fishing vessels, scholars have adopted various methods and models for analysis and have put forward corresponding conclusions or strategies, such as risk assessment analysis methods [7,8], navigator collision avoidance behavior models, navigator error development process models [9], machine learning methods [10], and probability risk assessment (PRA) models [11]. Mou et al. [12] constructed a linear regression model employing AIS data collected from collision avoidance scenarios in busy waterways. The study ascertained correlations between vessel size, speed, and heading with distance to closest point of approach (DCPA). Additionally, the researchers proposed a dynamic method for risk assessment based on a Safety Assessment Model for Shipping and Offshore on the North Sea (SAMSON). Uğurlu et al. [13] compiled statistics on the causes of accidents involving fishing vessels during the period from 2008 to 2018. Based on the identified causes of fishing vessel accidents, the researchers constructed a Bayesian network to estimate the probabilities of accidents occurring under various circumstances.
In terms of mitigating the risk of collisions between merchant and fishing vessels, many researchers have put forward related approaches from different perspectives. These include ship-to-ship dialogue and protocols [14], human–machine cooperative collision avoidance systems [15], requirements for fishing vessels [16], safe navigation for merchant vessels [17], and collision avoidance methods during fishing seasons [18]. Obeng et al. [19] systematically summarized the patterns of collisions between merchant and fishing vessels and proposed preventive measures from aspects such as personnel, vessels, environment, and management. Chou et al. [20] conducted studies on collision accidents involving fishing vessels in different water regions. They delineated the risks and causes of collisions between fishing and non-fishing vessels with the aim of reducing incidents involving both types of vessels. In a study focused on preventing fishing vessel collisions, Seo et al. [21] developed a safety navigation system that can simultaneously receive the positions of smartphones and AIS information from vessels. It issues warnings to both merchant and fishing vessels when another vessel approaches within a 500-m range. However, these studies that specifically focused on collision prevention for fishing vessels have limitations because fishing vessels exhibit significant heading deviations, making it challenging to achieve precise risk predictions solely based on distance, DCPA, and TCPA.
Although there is a plethora of research on ship collisions, studies concerning the spatiotemporal characteristics of such collisions extend beyond the events themselves, and the literature lacks comprehensive exploration of the temporal and spatial dynamics from the initiation of ship encounters to the culmination of collision incidents. Moreover, research focusing on collisions between merchant and fishing vessels in coastal waters is relatively scant. Some of these studies often overlook the individual differences between merchant and fishing vessels at the time of collision, failing to consider the impact of fishing vessels in fishing states on collisions. Therefore, this paper conducts a collision risk analysis of merchant and fishing vessels using vessel traffic data during the fishing season in the coastal areas of Fujian. Initially, the study adopts concepts from the ship domain and incorporates considerations for the operational status of fishing vessels to extract potential collision risk events from historical AIS data. Subsequently, a comprehensive visualization analysis of the spatial distribution of encounters between merchant and fishing vessels is undertaken using a weighted kernel density estimation method. Finally, the paper identifies high-risk collision areas between merchant and fishing vessels based on the density of spatial distributions. This study utilizes the concepts of ship domains and collision risk to calculate collision risks in real-time throughout the entire process of ship encounters, which serves as the basis for visualizing collision risks. The innovations of this research are as follows:
  • When assessing collision risks, we innovatively adjust the ship domain for fishing vessels during their operations.
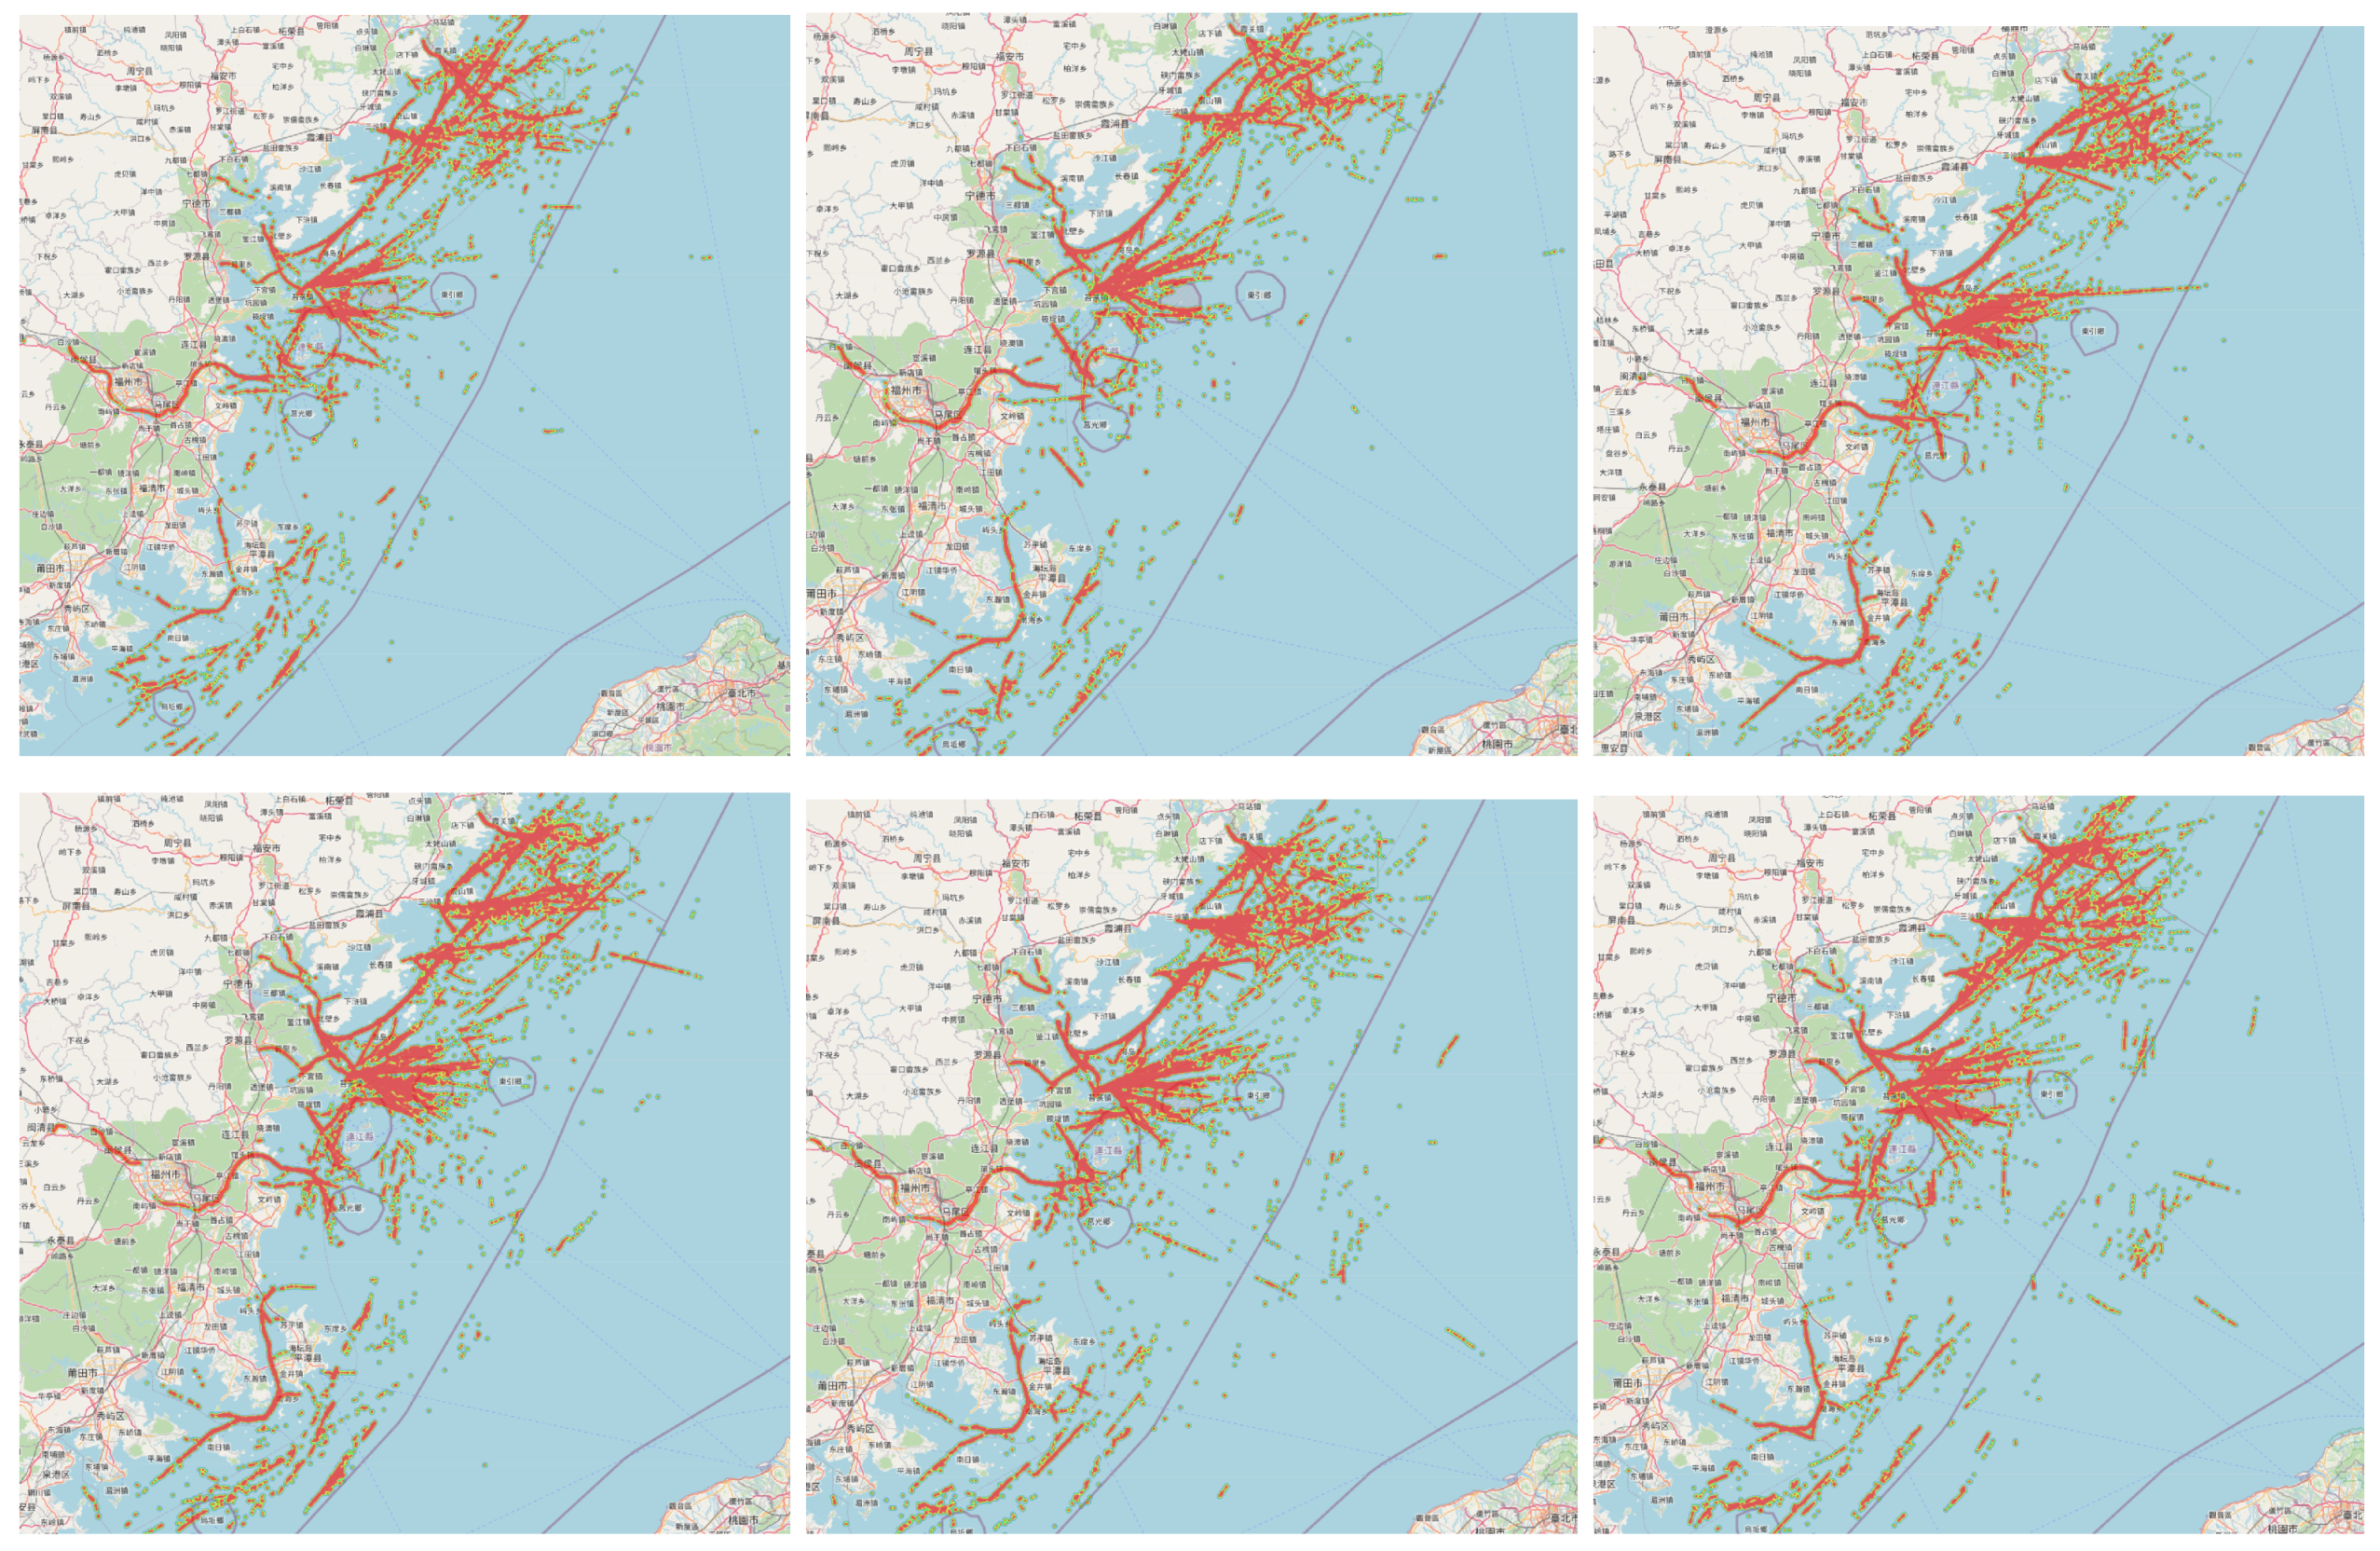
  • We conduct a visual analysis of the temporal and spatial distribution of encounter risk data.
  • We validate the accuracy of our risk assessment methodology using ship collision incidents from the past three years.
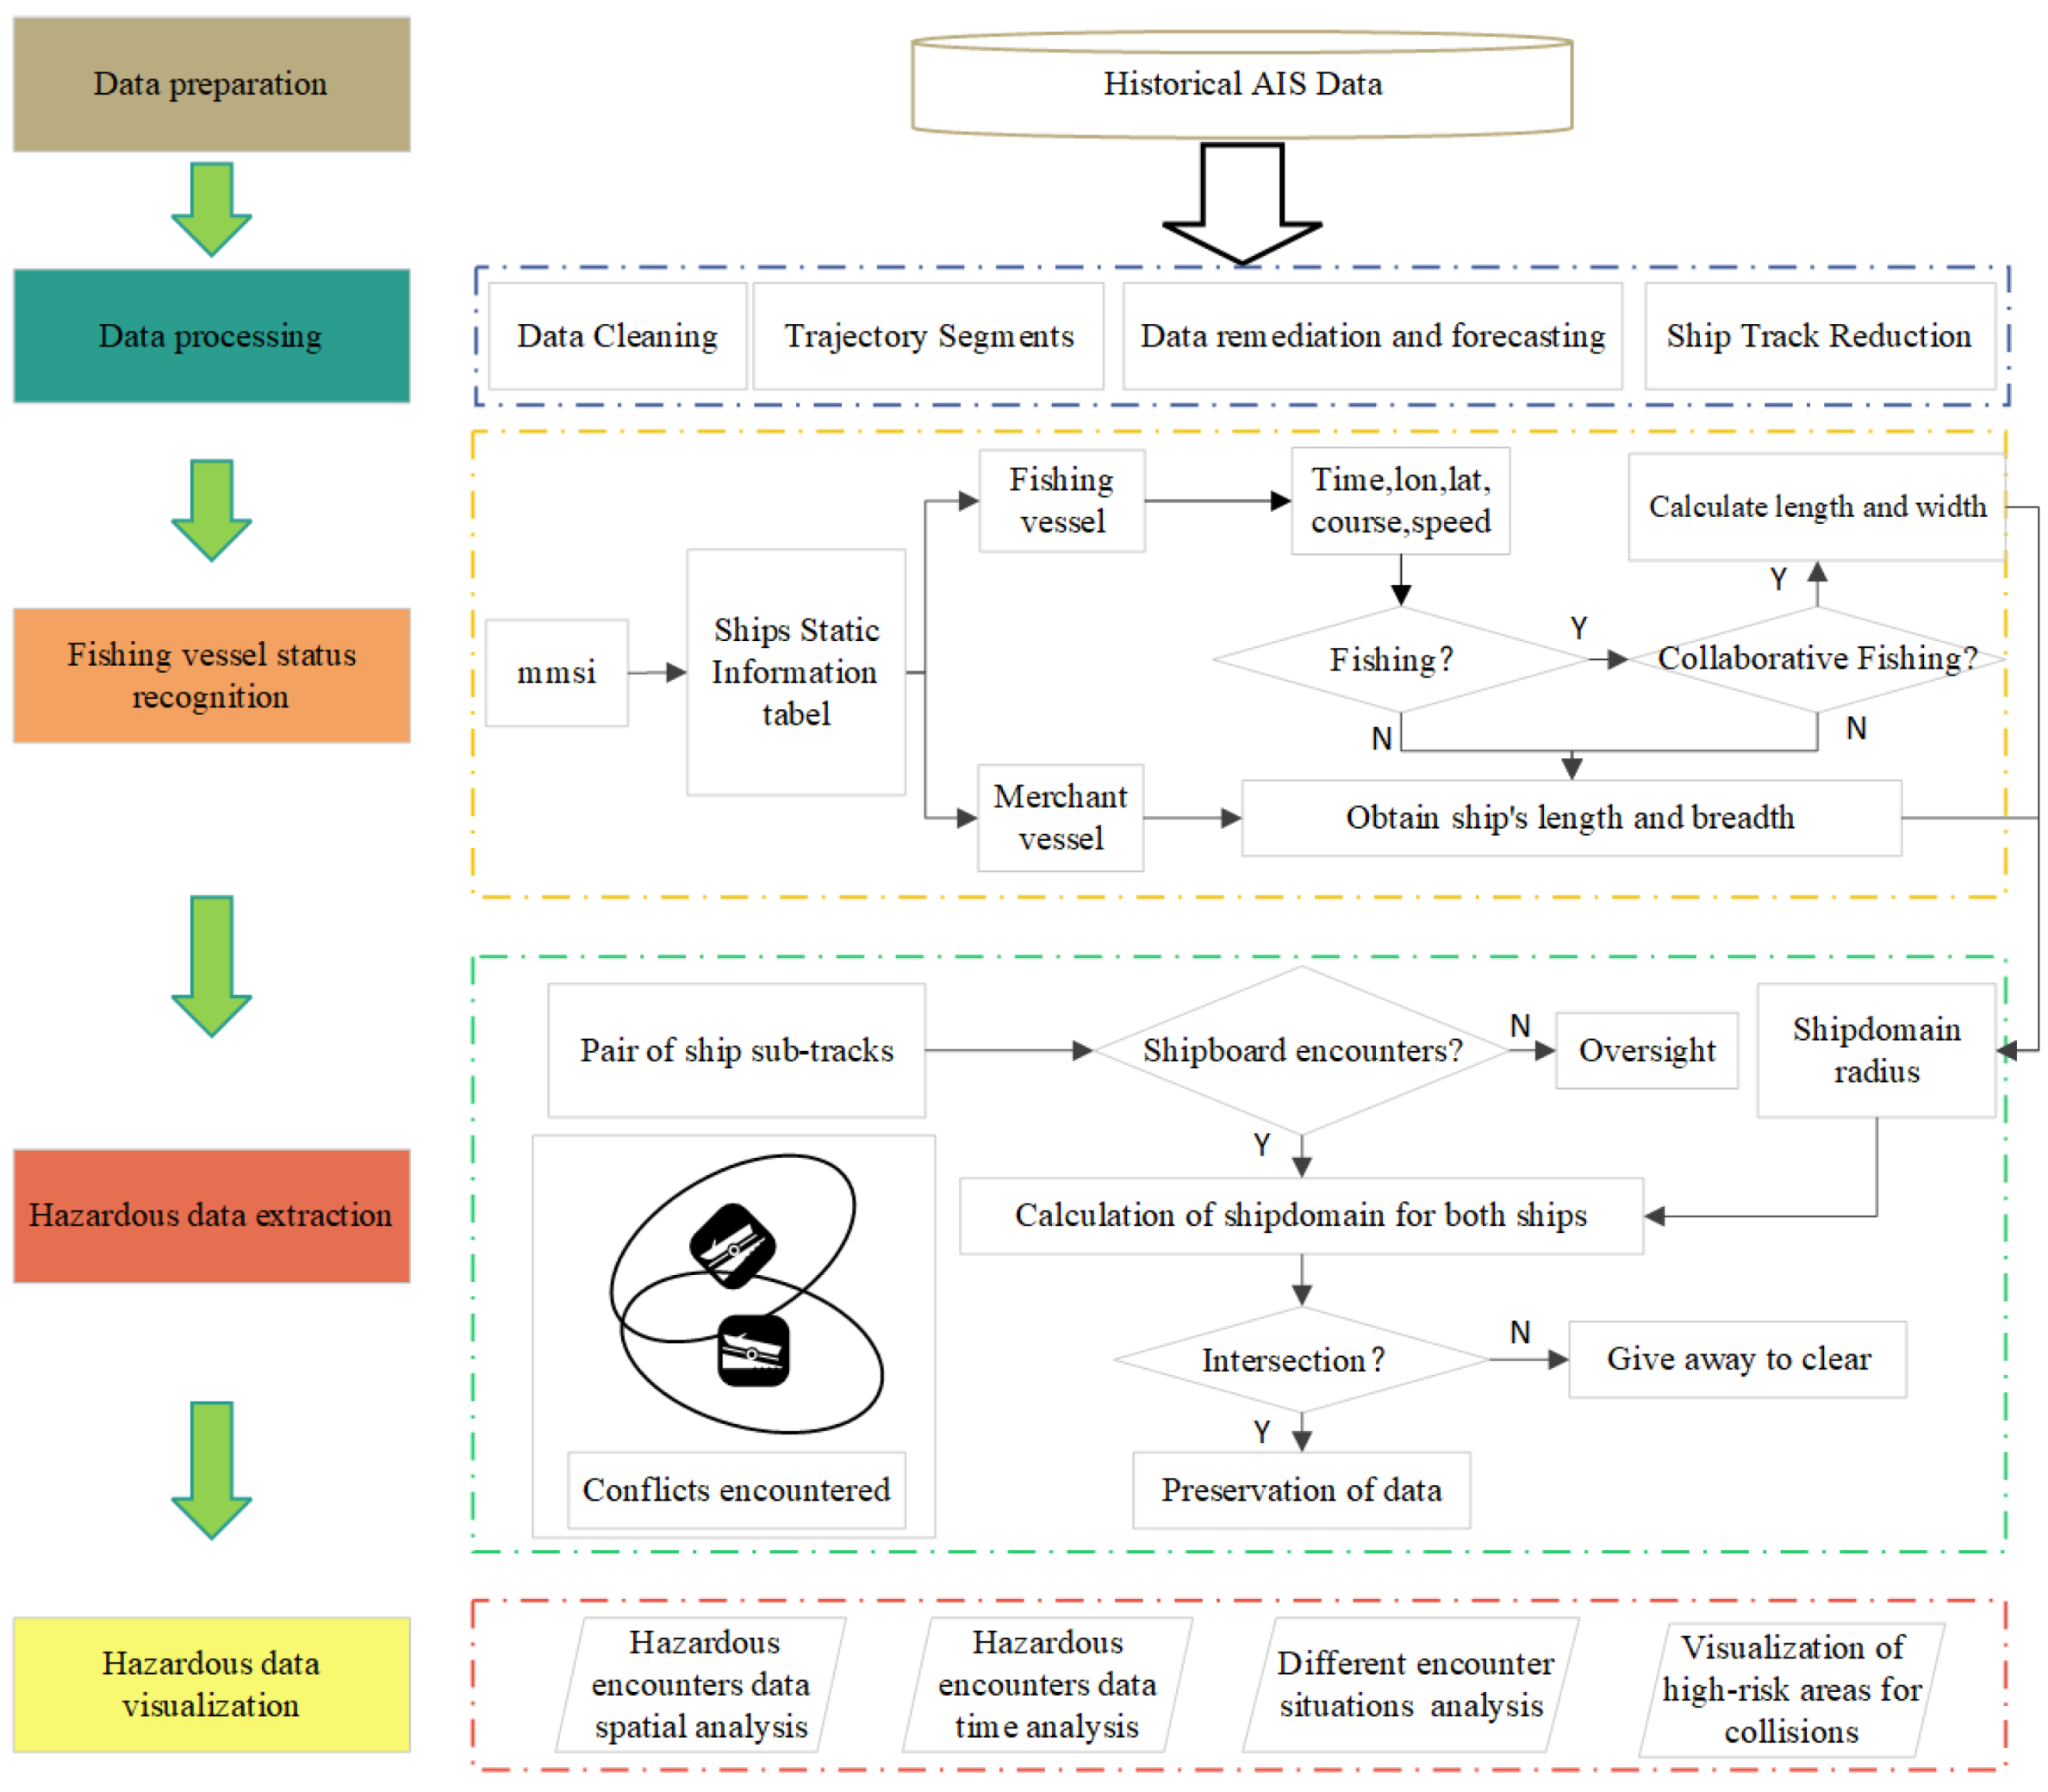
The subsequent organization of the paper is as follows: Section 2 introduces the preprocessing of historical AIS trajectories and defines encounter risks based on ship domains and the operational statuses of fishing vessels. Section 3 systematically extracts encounter risk data between merchant and fishing vessels from historical records and conducts spatial and temporal analyses using a weighted kernel density method. Section 4 examines accident data from the past three years in the study area and conducts validations of the collision risk assessment algorithm proposed in this paper. Section 5 provides a summary and highlights the shortcomings of this paper.

2. Methodology

This paper utilizes historical AIS data from the coastal areas of Fujian to establish a ship collision risk model for the research and analysis of collision risks between merchant and fishing vessels. Firstly, the historical AIS data are processed, and the encounter risk data are extracted on the basis of ship domains and the operational status identification of fishing vessels. Subsequently, a weighted kernel density estimation visualization method is employed to display encounter risk data, facilitating the identification of navigational areas prone to collision risks. Lastly, the approach is validated using the locations of ship collisions that occurred within the research area over the past three years. The workflow of this paper, as illustrated in Figure 1, primarily comprises four modules: (1) AIS data preprocessing, (2) identification of fishing vessel operational states, (3) extraction of encounter risk data, and (4) visualization of encounter risk data.

2.1. Data Preprocessing

Due to issues such as location offsets and data loss in the raw AIS data, the analysis of collision risk areas between merchant and fishing vessels based on historical AIS data necessitates preprocessing of the raw data. Processing historical AIS data for merchant and fishing vessels includes data cleaning, trajectory separation, and the repair and prediction of AIS data. Finally, vessel static information is queried based on MMSI to distinguish between merchant and fishing vessels, providing an analytical foundation for assessing collision risks between these two types of vessels.

2.1.1. Data Cleaning

The data cleaning process primarily involves removing abnormal and duplicate data from AIS data. Abnormal data include the following situations:
  • Geographical coordinates located on land;
  • Values exceeding the normal range (refer to Table 1 for data range);
  • MMSI not conforming to specifications.
The occurrence of duplicate data is primarily attributed to the repetitive transmission of AIS data by anchored vessels. As the experiment primarily focuses on the potential risks associated with moving vessels, it is necessary to eliminate AIS data for vessels at anchor.

2.1.2. Trajectory Separation

When analyzing collision risks between merchant and fishing vessels, it is crucial to identify different behavior patterns of vessels accurately by considering key features such as location, time, heading, and speed. In order to reconstruct the historical navigation behavior of vessels, trajectory separation is necessary. Trajectory separation involves two main tasks: one is to separate the trajectory data of different ships according to MMSI; the second is to separate different trajectories from the same ship. Firstly, according to the data characteristics of AIS data, MMSIs are the unique identifications of different ships and can be used as the basis for separating different ship trajectories. Here, we directly group AIS data according to MMSIs to obtain the trajectory data of different ships. Secondly, different trajectories of the same ship are separated according to the AIS data receiving time interval and the distance between adjacent points. The algorithm process for trajectory segmentation is shown in Figure 2.
The experiment selects 1 h as the time interval to determine whether the trajectories before and after the interval are consistent. In addition, the distance between two adjacent points is also used as the basis for judgment. According to the calculation of the ship speed of 0–20 knots, the sailing distance every three minutes is within 0–1 nautical miles. If the distance is excessively large, it is deemed to indicate equipment failure or latitude and longitude drift, leading to the direct exclusion of such points. The latitude and longitude data used in this paper are based on the WGS84 coordinate system. Formula (1) is used to calculate the cosine distance between two points on the sphere, where x i and y i are the longitude and latitude of the I-th point on the sphere, with i ranging from 2 to m. In Formula (2), D represents the distance between the two points being calculated, and R denotes the radius of the Earth, which is taken as 6371 km. Formula (3) is used to convert speed values from knots to meters per second.
C = sin ( y i 1 ) sin ( y i ) + cos ( y i 1 ) cos ( y i ) cos ( x i 1 x i ) i = 2 , 3 , , m 1 , m
D = R arccos ( C ) ( π 180 )
ν m = ν k 0.518
During processing, the separated AIS trajectory points are grouped into sub-trajectories and connected based on time in ascending order. This process further reconstructs the historical navigation path of the vessels, as shown in Figure 3. The processed data clearly reveal the main channels of vessel navigation and points of trajectory intersection.

2.1.3. Data Restoration

In the actual data collection process, AIS data reception can be affected by sensor noise and external environmental factors, leading to issues such as data loss. To ensure the temporal synchronization and high frequency of AIS data for various vessels, interpolation and resampling of AIS data are necessary. The proposals in references [22,23] suggest that, in the absence of prior experience, using piecewise cubic hermite (PCH) interpolation yields minimal errors when reconstructing missing data. Therefore PCH interpolation is applied in this study to restore AIS data.

2.2. Identification of Fishing Vessel Operation Statuses

The statuses of the fishing vessels are crucial in order to define the avoidance distance of passing ships, and the operating status of the fishing vessels should be taken into account when judging the risk of collision. In this experiment, the analysis of AIS trajectory data in the research area during fishing operations reveals distinctive features. Different rules are established to identify the operational states of fishing vessels, and varying safety encounter distance thresholds are set based on the specific state of each fishing vessel.

2.2.1. Characteristics of Fishing Vessel Operational Trajectories

Different fishing methods exhibit distinct trajectory characteristics during fishing operations. Fishing vessel operations can be classified into three main categories, which mainly include trawling operations, purse seine operations, and gillnet operations. Trawling operations are the trawling of fishing gear along the seabed to catch fish. Purse seining entails surrounding a school of fish with a net to capture them; gillnet operations employ a long net suspended vertically in the water to entangle fish. The trajectory characteristics for each of these fishing methods are as follows (Figure 4):
The typical trajectory characteristics for different fishing operations are as follows:
  • Trawling operation: characterized by frequent turns during operation to tow the net back and forth in a specific area.
  • Gillnet operation: marked by dropping numerous drifting gillnets along a trajectory and returning along the same path to retrieve the nets.
  • Purse seine operation: distinguished by deploying a net to encircle a target area, returning to the starting point, and then retrieving the net.

2.2.2. Fishing Boat Operation Status Judgment

In the study, the operational states of fishing vessels are categorizes into three modes: normal navigation, anchorage, and active fishing. The criteria for each state are defined as follows:
  • Normal navigation: Fishing vessels engaged in normal navigation exhibit relatively stable speed and direction, with no abrupt changes. Vessels with speeds greater than 2 knots and that maintain stable speed and heading within a 10 min interval are identified to be in a normal navigation state.
  • Anchorage: Vessels at anchor may exhibit some speed due to factors like sea currents. Therefore, during processing, vessels with speeds below 2 knots and a substantial number of AIS data positions in close proximity—exhibiting a movement distance less than 0.1 nautical miles within a 10 min interval—are identified as vessels at anchor.
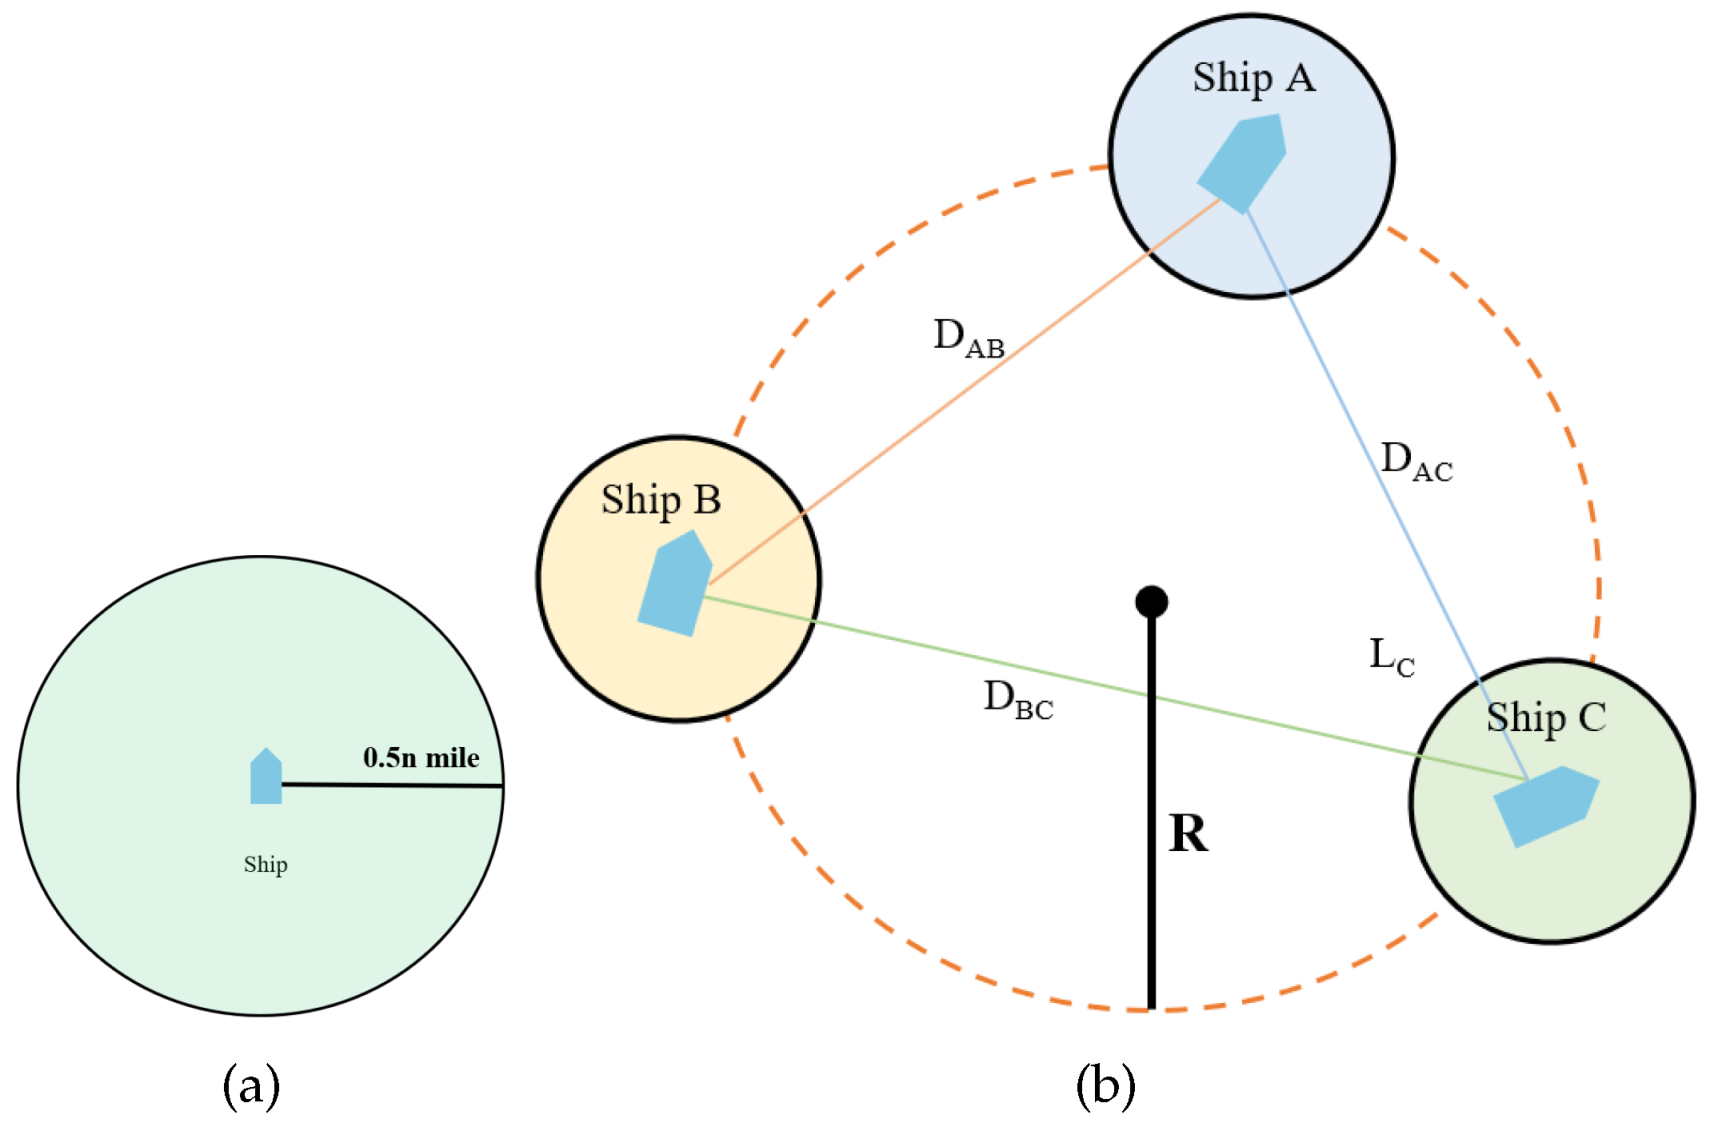
  • Fishing: Identifying whether a fishing vessel is actively fishing relies on distinguishing trajectory characteristics that differ from normal navigation. Fishing vessels typically operate at speeds ranging from 2 to 5 knots. We identify vessels within this speed range and examine their trajectories to determine if they are engaged in fishing. If nearby vessels are also in a fishing state and are within 0.5 nautical miles, this is considered to be cooperative fishing. During this operation, the fishing vessel’s maneuverability is limited, and passing merchant vessels are advised to maintain a distance of at least 1 nautical mile.

2.3. Encounter Risk Data Mining and Visualization

Establishing an effective model for identifying vessel navigation risks is crucial for extracting encounter risk data. This paper constructs a model for identifying vessel encounter risks based on ship domains. Then, this model is employed to extract data related to vessel encounter risks, and it further quantifies the collision risk by calculating the CRI. Firstly, DCPA and TCPA are computed for pairs of vessels that may encounter each other. According to the experience of relevant maritime regulatory personnel, the minimum encounter distance between large-tonnage vessels during daytime and good weather conditions with high visibility should satisfy a DCPA of at least 1 nautical mile. In adverse weather conditions or during nighttime, this distance should be at least 2 nm [24]. To obtain a sufficient number of potential collision encounter samples for analysis, we selected the maximum DCPA. After determining the DCPA threshold and considering that fishing vessels typically operate at speeds of 2–5 knots, we consider vessels to be at risk of collision if their TCPA is less than 20 min. The encounter risk is further determined by calculating whether there is an intersection in the vessel domains. Finally, the data related to encounter risks are saved, and visualization tools such as QGIS and Folium are employed for the analysis of encounter risk data.

2.3.1. Ship Domain Model

In the early 1960s, Japanese scholars Fujii et al. [25] proposed the concept of a ship domain when studying the traffic capacity in the waters near Japan, and they tried to establish a calculation method based on ship domains when ships navigated in narrow waters. According to this model, the ship domain is an elliptical area centered around the vessel and with the major axis aligned with the vessel’s heading and the minor axis perpendicular to the vessel’s heading. The variables a and b represent the major and minor axes, respectively, and determine the elliptical domain. As illustrated in Figure 5, specific values for a and b can be chosen based on the actual circumstances.
This paper employs the Fujii model to determine the values of the axis (a) and the axis (b) for the elliptical ship domains of vessels during normal navigation, as expressed in Equation (4). Here, l represents the vessel’s length, and w represents its width.
a = 1.5 × l b = 1.5 × w
In the case of fishing vessels engaged in operations, occurrences such as obstructive fishing nets render the classical elliptical ship domain inapplicable. The ship domain radius for fishing vessels involved in operations was determined by considering the lengths of the fishing nets commonly used by fishermen. According to information from the Fuzhou Aids to Navigation Division of Eastern Navigation Services Center, the maximum length of trawl nets and gillnets should not exceed 600 m. To ensure an adequate safety distance between passing merchant ships and fishing vessels engaged in operations, we expanded the length of the fishing nets by one-third to establish a safety domain for fishing vessels. Therefore, the ship domain radius for fishing vessels was set to 0.5 nm, as depicted in Figure 6a. Furthermore, for fishing vessels engaged in coordinated operations, they are treated as points on a polygon. The circumscribed circle of the polygon is considered as a whole when calculating the ship domain, ensuring that the encounter distance for each fishing vessel is not less than 0.5 nm, as shown in Figure 6b.

2.3.2. Calculation of DCPA and TCPA

DCPA and TCPA are crucial parameters for determining the risk of ship collisions when vessels encounter each other. During calculation, one of the vessels is chosen as the reference vessel in order to establish a coordinate system as illustrated in Figure 7.
Assume that A is the target ship; l o n A , l a t A , V A , and θ A are the longitude, latitude, speed, and course, respectively, of ship A. B is the encountering ship; l o n B , l a t B , V B , and θ B are, respectively, the longitude, latitude, speed, and course of ship B. Then the relative speed of the two ships is shown in Formula (5):
V r = V A 2 + V B 2 2 | V A · V B | cos ( θ B · θ A )
DCPA and TCPA can be calculated by Formulas (6)–(8):
DCPA = D × sin ( O T P )
| T P | = | O T | 2 | O P | 2
TCPA = | T P | V r = D × cos ( O T P ) V r
where D represents the relative distance between two trajectory points, which can be obtained from Formula (2). Then, DCPA and TCPA are utilized for assessment of collision risk during vessel navigation and for visualization of risk data.

2.3.3. Collision Risk Index

According to the definition of ship domains, a dangerous encounter is considered when the domain of a navigating vessel is breached. However, this cannot be used to measure the magnitude of the collision risk. In order to further quantify the risk after the invasion of the ship domain during the encounter, the CRI is introduced to quantify the collision risk. This paper evaluates the magnitude of collision risk throughout the entire ship encounter process by considering both the intersection of ship domains and the collision risk index.
Among the calculation methods of CRI, Kearon [26] comprehensively considered the influence of DCPA and TCPA and took into account both factors by using a weighted combination of DCPA and TCPA to determine the CRI, as shown in Equation (9).
ρ i = ( a · DCPA i ) 2 + ( b · TCPA i ) 2 ( i = 1 , 2 , , n )
However, the equation has severe deficiencies and even mistakes. DCPA has dimensions of length; TCPA has dimensions of time. However, the weighted summation of them only involves a value without consideration of the dimensions, which are in accordance with the actual situation. To resolve this issue, we referenced the paper [27] and improved the calculation method of the CRI.
ρ = DCPA s 2 + ( η V 0 × TCPA s ) 2 / DCPA 2 + ( η V 0 × TCPA ) 2
In Equation (10), V 0 is the speed, V 0 = DCPA s / TCPA s , DCPAs are the secure approach distances, TCPAs are the secure approach times, and η is the weighting coefficient between DCPA and V 0 ∗ TCPA, which is related to the relative speed of two ships and also varies with the encounter situation. When the ship is coming from the starboard side, then η = 0.5 × TCPA TCPA s TCPA s , and when the ship is coming from the port side, then η = 0.55 × TCPA TCPA s TCPA s . Generally speaking, the condition whereby the ship is coming from the starboard sie is more dangerous than the condition whereby the ship is coming from the port side. Therefore, when the ship is coming from the port side, η increases; then, the security vector increases, and the situation is less dangerous.

2.3.4. Risk Data Extraction

Based on the ship domain theory, navigational encounter risk can be defined as a situation where two or more vessels come into contact or overlap when encountering each other. The COLREGs defined three encounter situations: head-on, crossing, and overtaking. However, the COLREGs only quantitatively define overtaking situations and do not provide quantitative definitions for crossing encounters and head-on encounters. To extract risk data from different encounter scenarios, the experiment divides ship encounter situations based on the difference in heading between two ships [28], as illustrated in Figure 8.
The process of extracting encounter risk data involves three primary steps. Firstly, it is essential to determine whether an encounter situation has arisen between the reference ship and the approaching vessel. According to the COLREGs, the masthead light visibility distance is specified as 6 nautical miles for vessels with a length exceeding 50 m. Therefore, we only compute the DCPA and TCPA for vessels within a 6 nautical mile radius of the reference ship. It is considered that an encounter situation exists when the closest vessel’s DCPA is less than 2 nautical miles. Secondly, further calculations are performed to determine whether there is an overlap in the ship domains. If ship domains intersect, the encounter data are stored in different encounter scenario datasets based on their relative positions during the encounter. Finally, computation of the CRI for the vessels involved in the encounter is performed. The algorithm flow is illustrated in the diagram below (Figure 9).

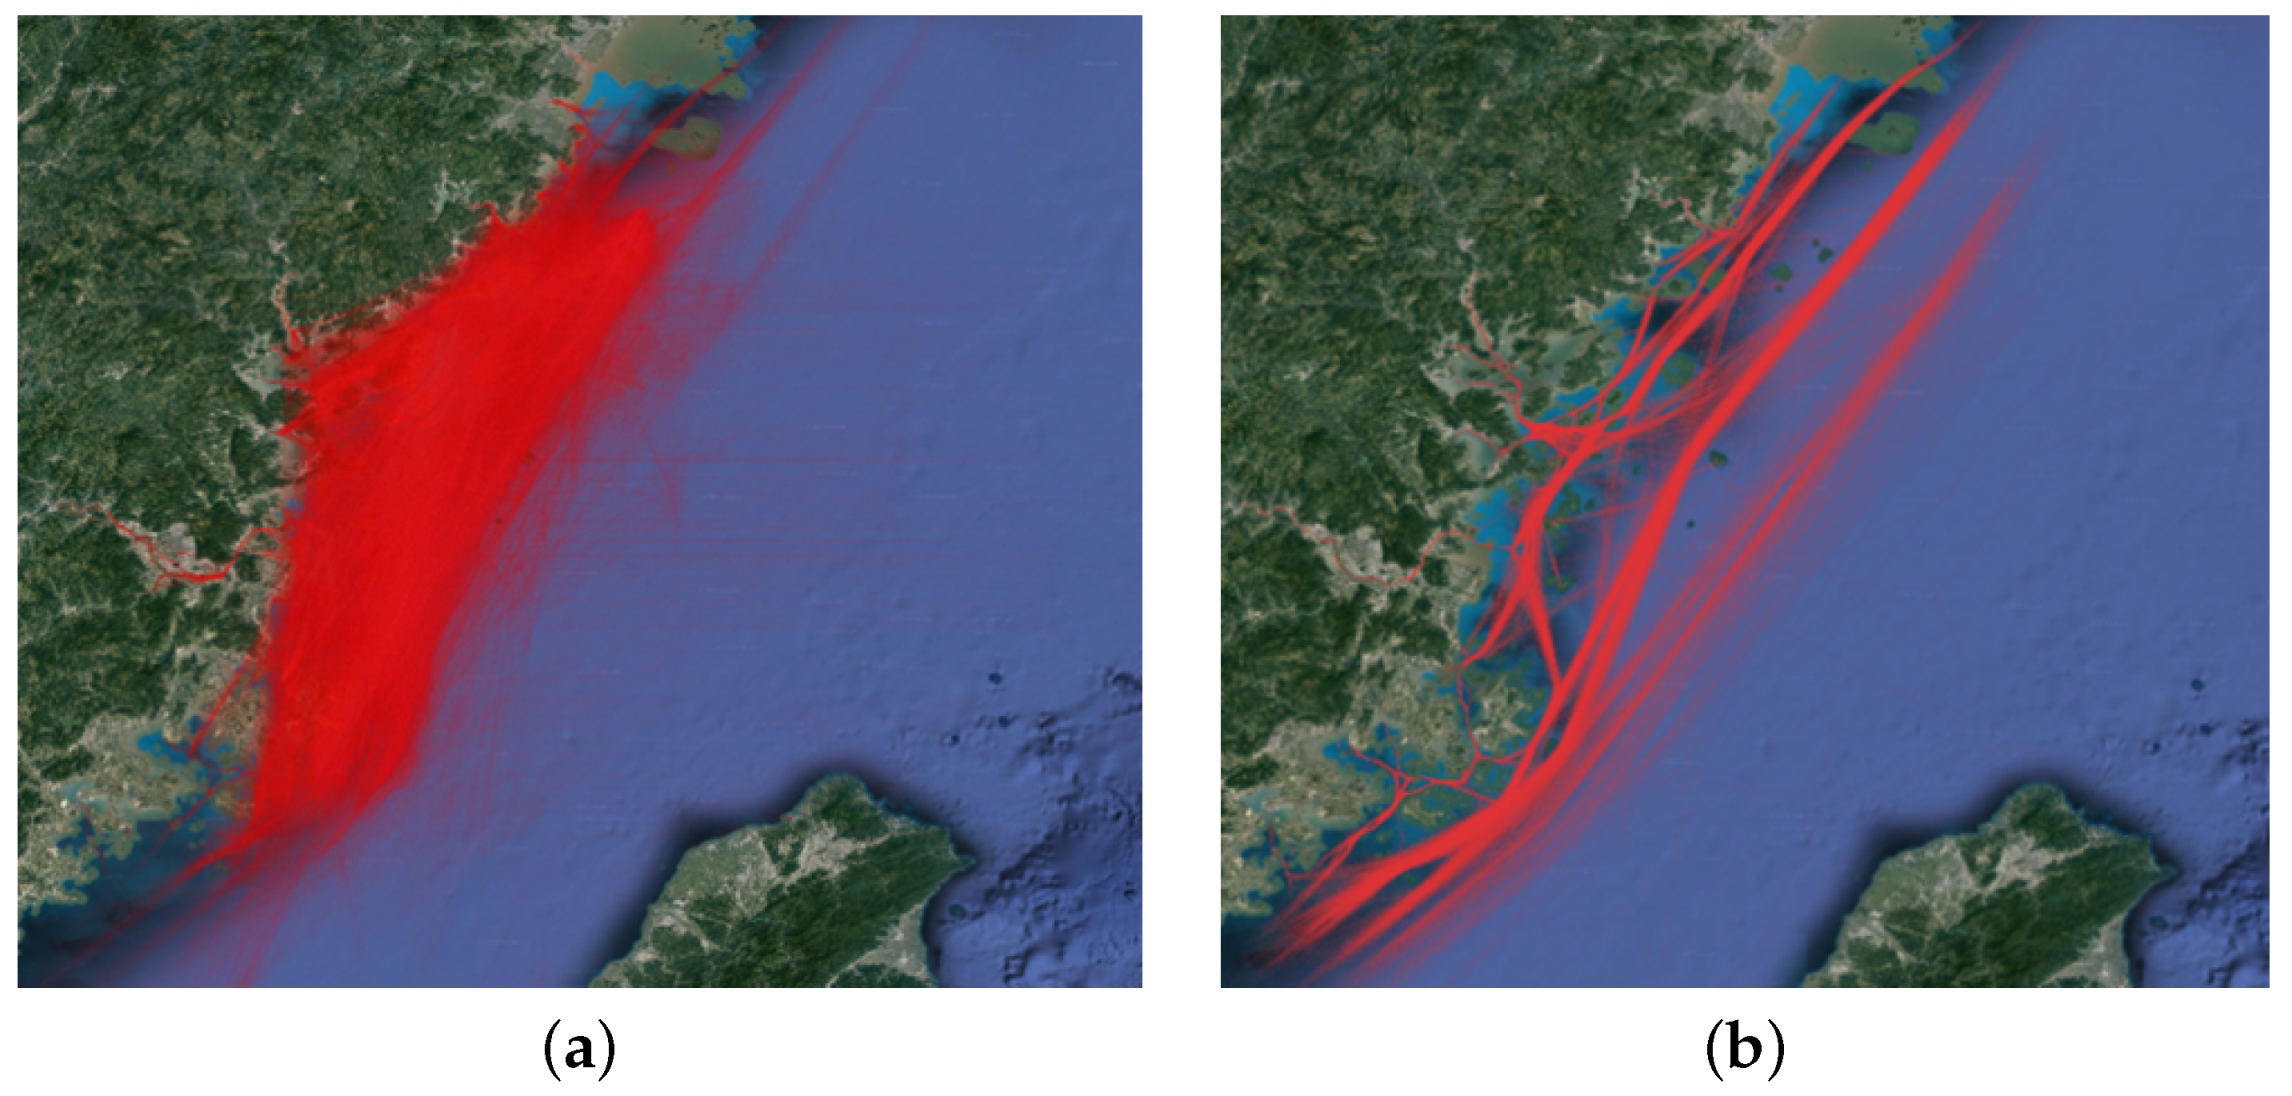
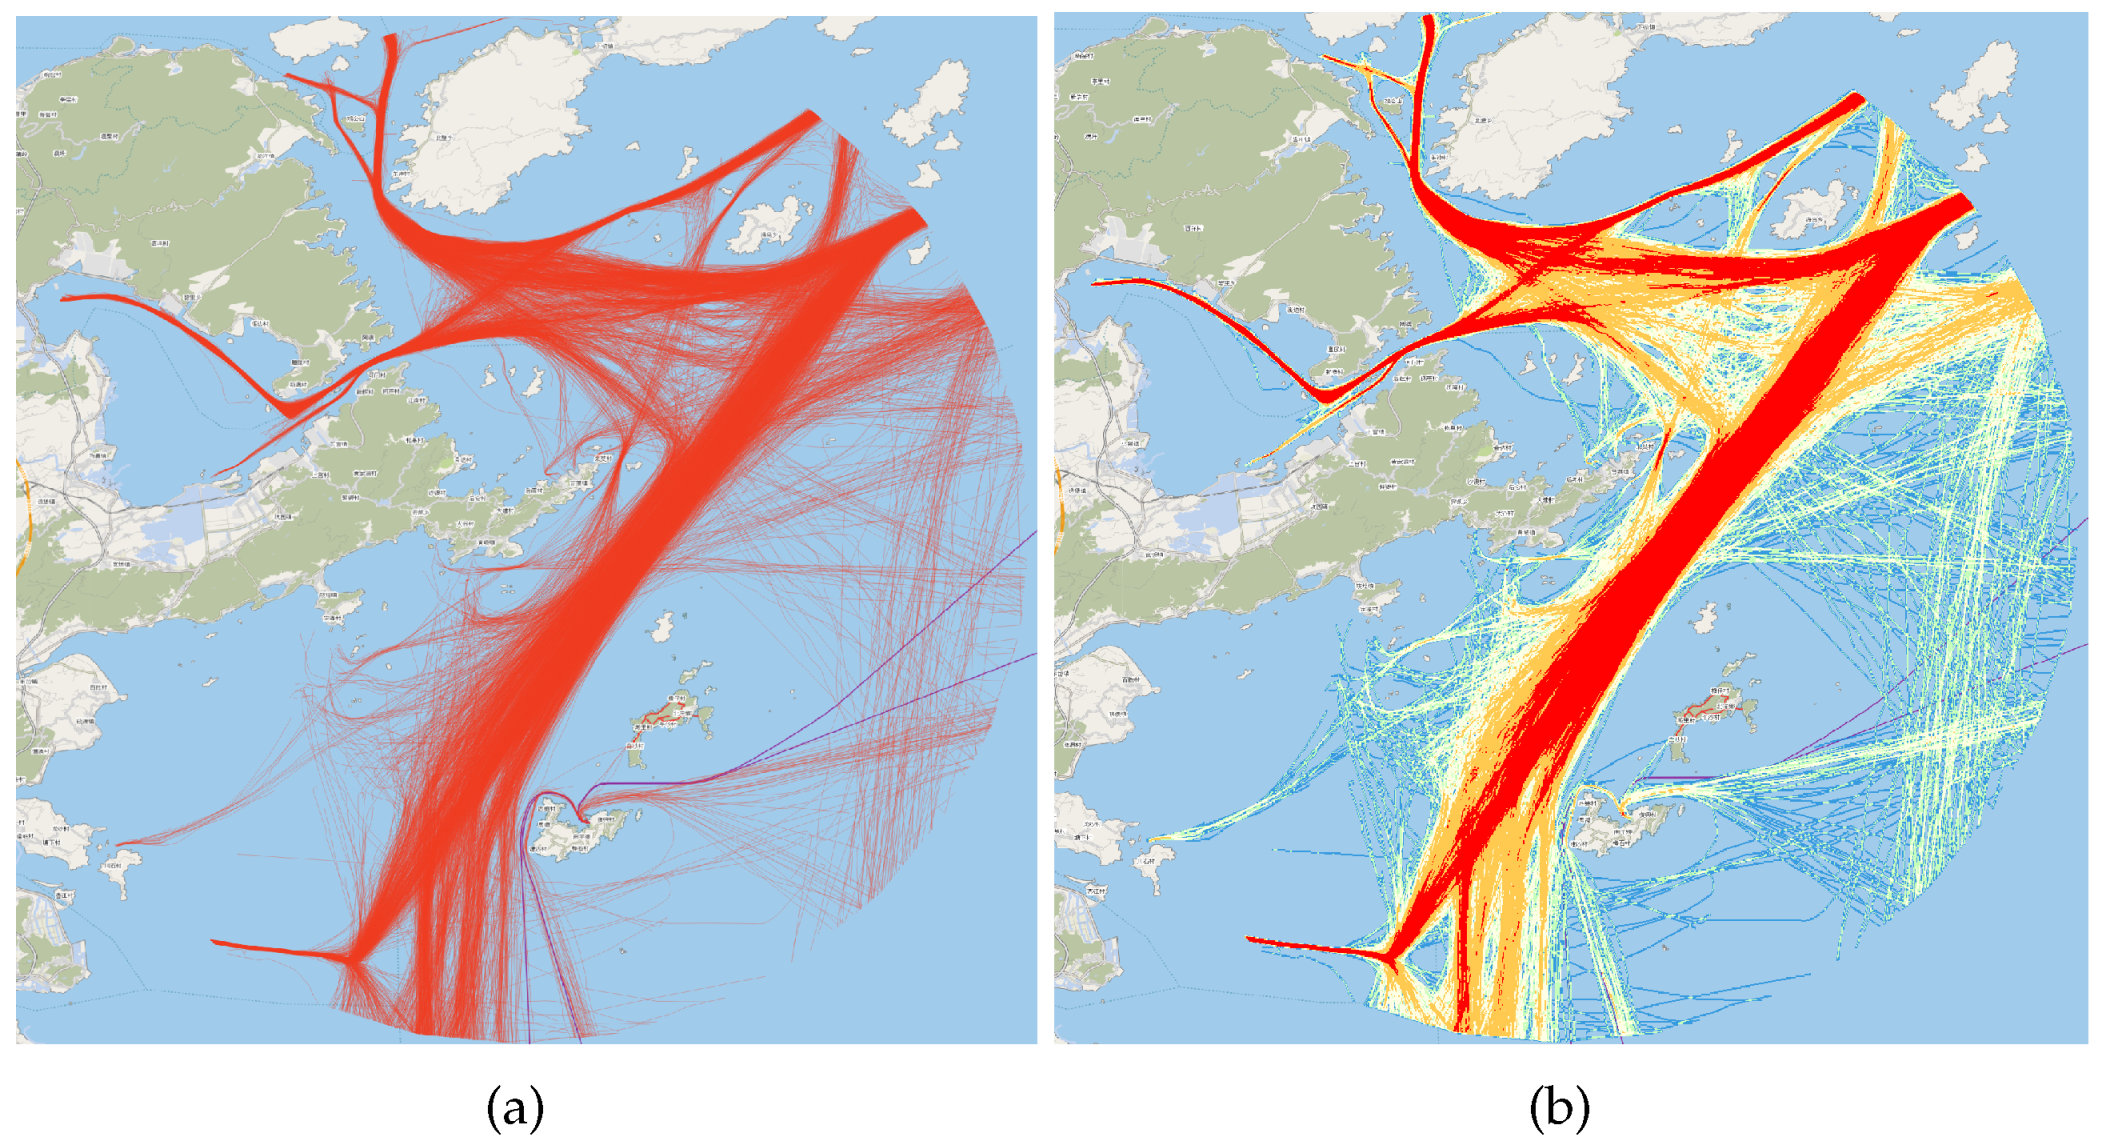
2.3.5. Risk Data Visualization

Risk data visualization enables the concise and intuitive display of spatial distribution patterns and reveals deeper insights. QGIS (Quantum GIS) is user-friendly open-source desktop GIS3.28.5 software with powerful analysis capabilities that make it suitable for conducting visual analyses of vessels’ encounter risk data. Figure 10 is based on the historical AIS track data of the coastal area of Lianjiang County, Fujian Province, combined with the navigation environment of the coastal area of Fujian Province and the status quo of customary shipping routes, traffic flow rules, conflict risk of merchant fishing vessels, and ship track clustering analysis to obtain a visualization of merchant and fishing vessel routes. Figure 10 is a visualization of vessels’ trajectories using the QGIS software. This visualization is based on historical AIS trajectory data along the coastal waters combined with the navigational environment and the analysis of traffic flow.
Kernel density analysis of ship trajectory data can also be performed using QGIS and can be used to display different colors by calculating the density in each raster pixel; this can more intuitively show the navigational density situation and risk severity in different encounter situations. Figure 11 is a kernel density visualization of the original trajectory data in the coastal waters. For typical fishing vessels engaged in operations, a circular area with a radius of 0.5 nautical miles is utilized as the safety domain; enlarging the safety radius of fishing vessels during operations can unearth more potential collision risk vessels. For vessels with potential collision risks, real-time calculation of collision risk will be conducted, and the CRI will be used as the weighting factor for risk visualization.

3. Experiments

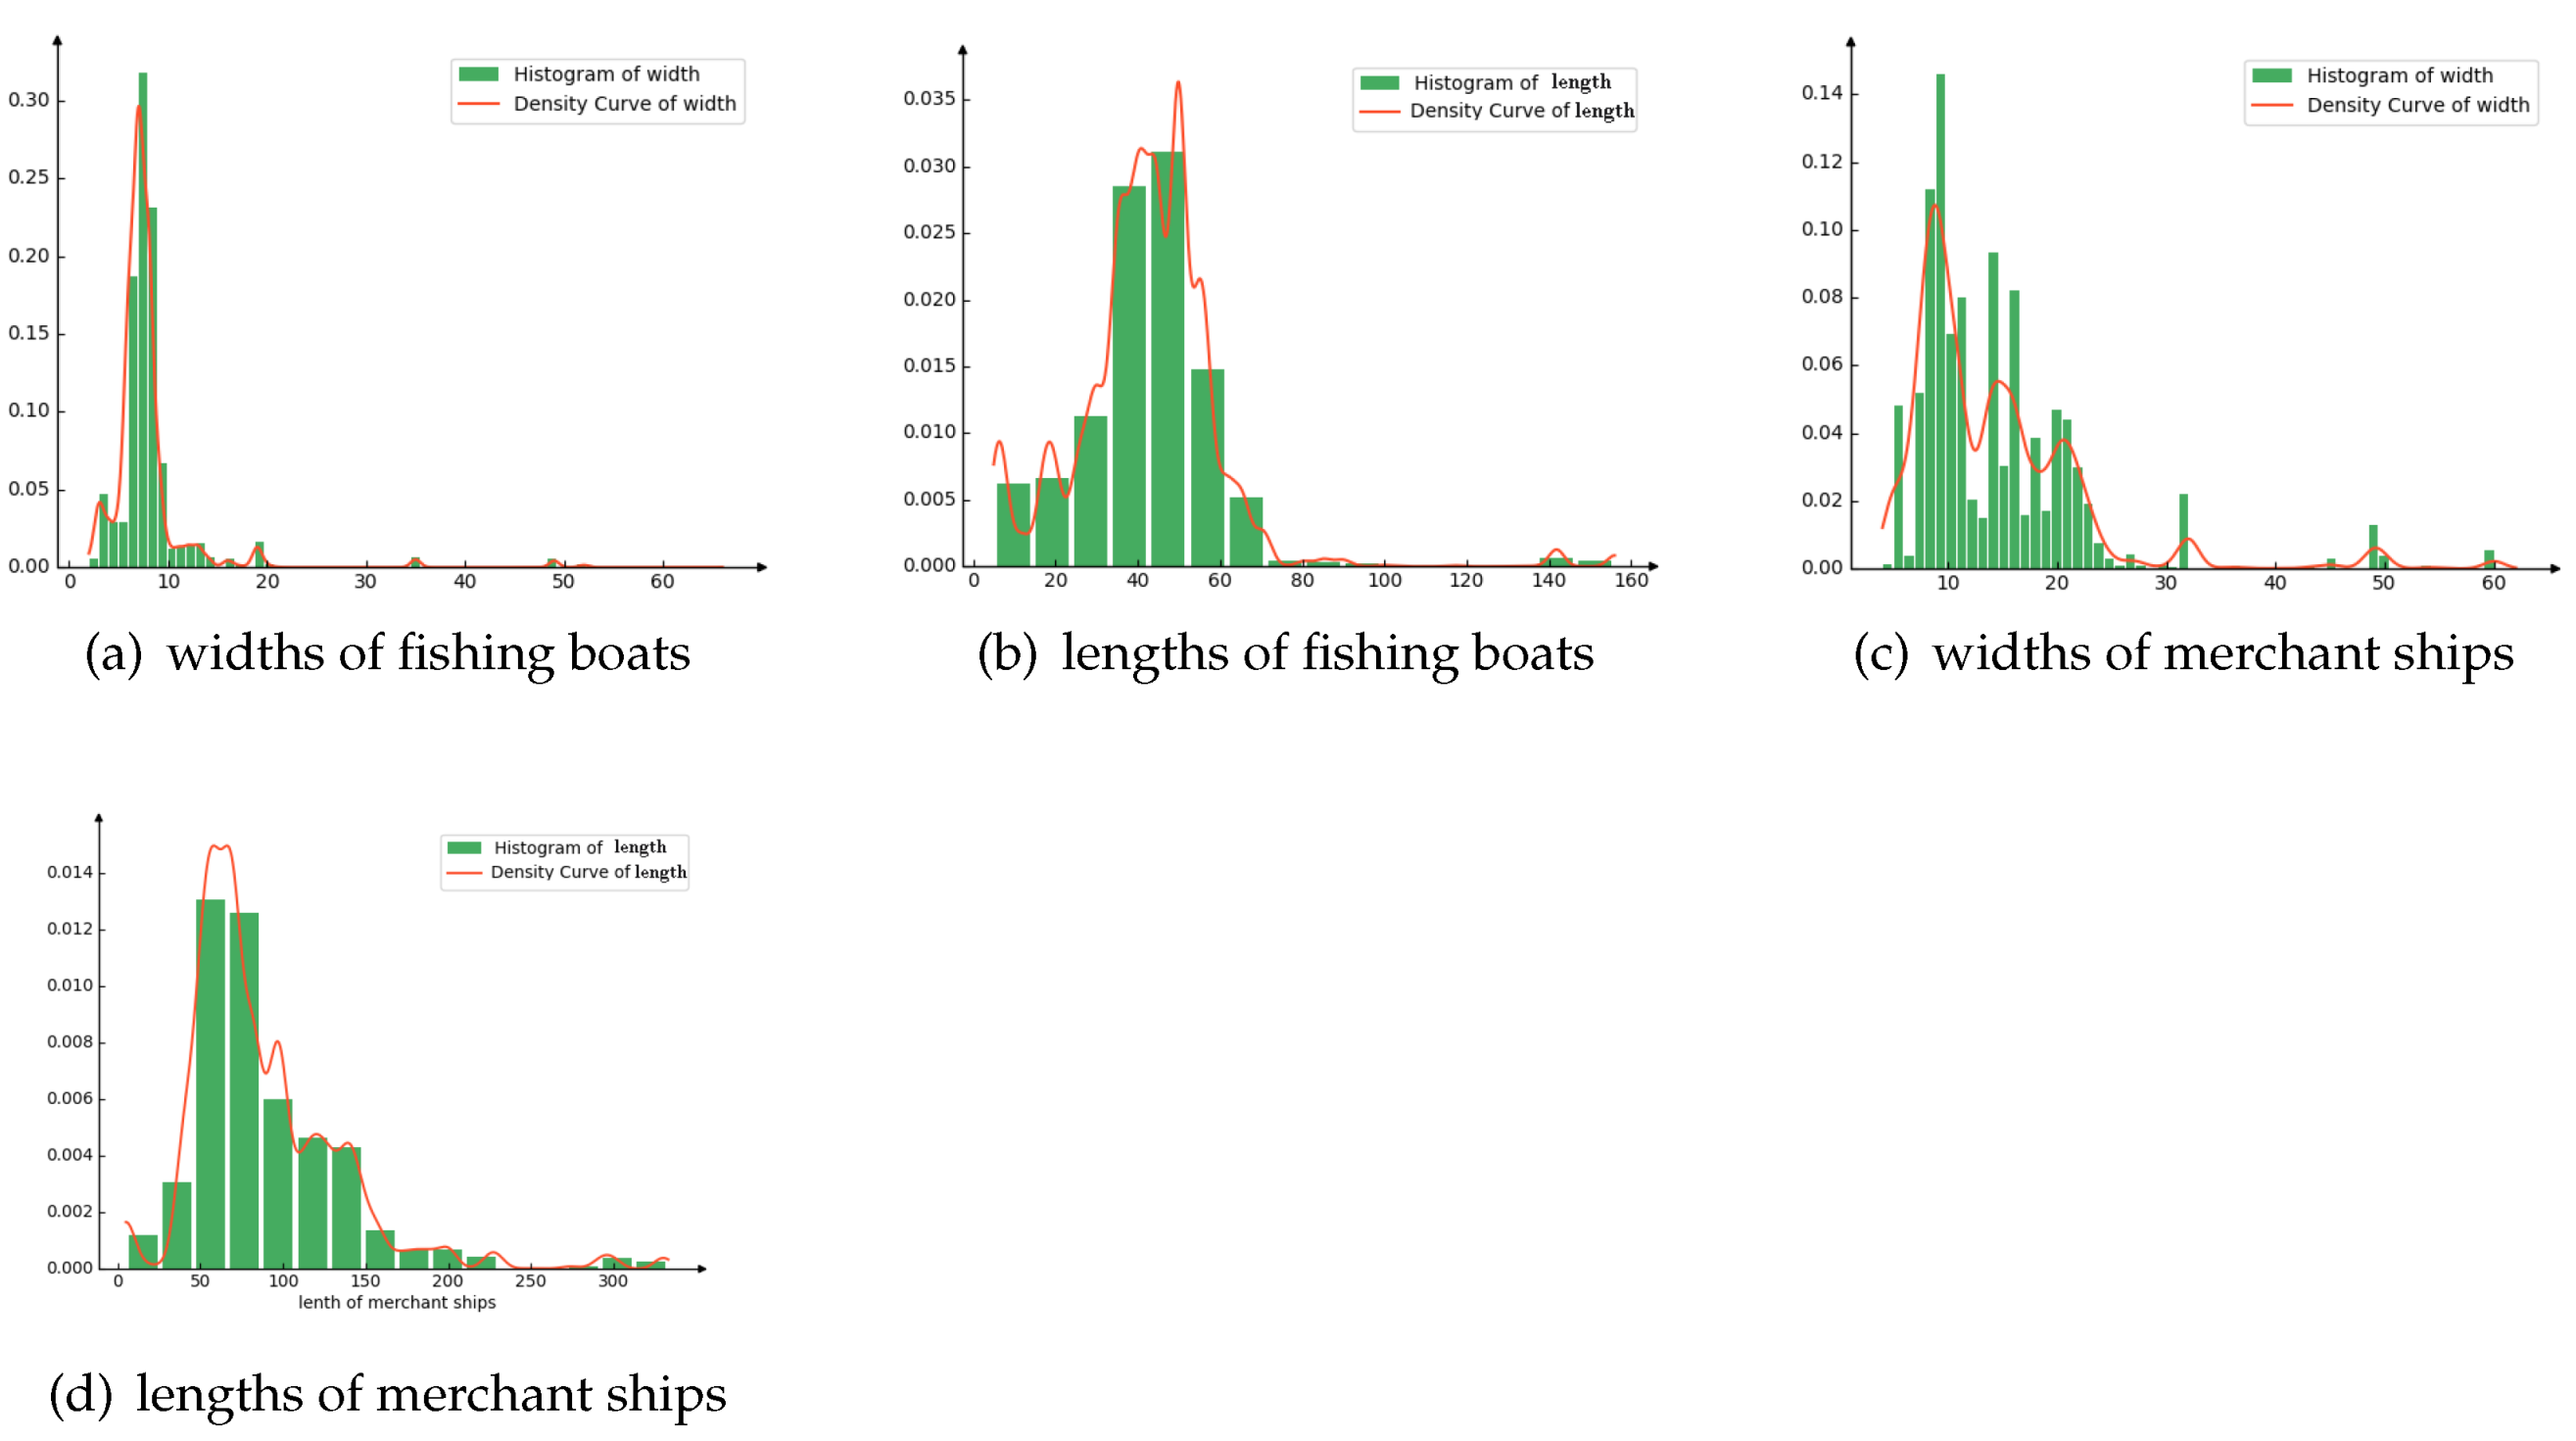
3.1. Analysis of the Characteristics of Dangerous Vessels

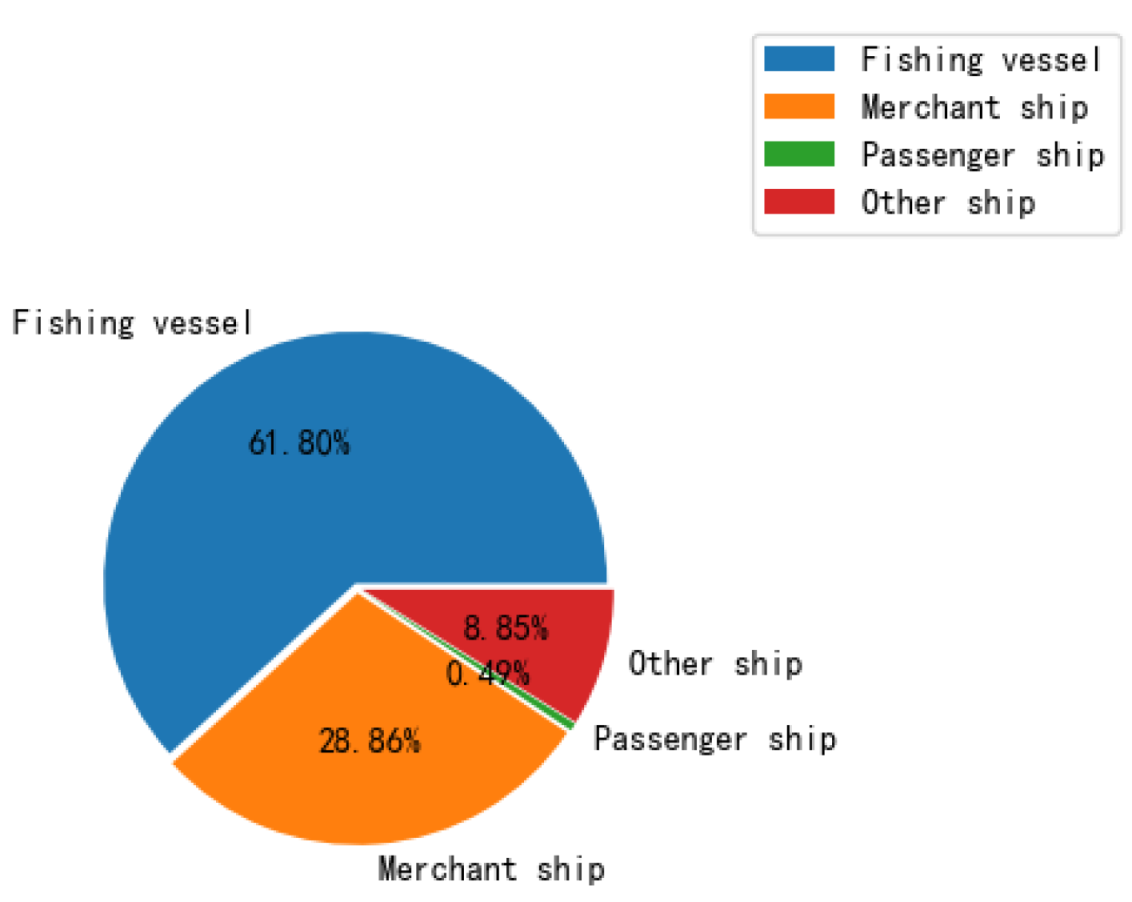
3.1.1. Ship Type Distribution in Encounter Scenarios

The experiment statistically analyzed the histogram of the distribution of ship lengths and widths involved in dangerous encounters, as illustrated in Figure 12. The histogram revealed that the lengths of fishing vessels involved in dangerous encounters were predominantly concentrated in the range of 30–50 m, with widths between 5–10 m. On the other hand, merchant ships involved in dangerous encounters showed a concentration of lengths between 50–150 m and widths between 8–20 m, comprising small- to medium-sized merchant ships. Typically, some small- to medium-sized merchant and fishing vessels studied in the research area did not strictly adhere to regulations in the same manner as large cargo ships, often as a result of discrepancies in crew equipment and instances of over-ranking of officers. Some inland individuals engage in fishing operations as temporary laborers without valid employment certificates or systematic safety training. This results in a lack of strong safety awareness, collision avoidance knowledge, and navigational skills, leading to the occurrence of collision risks. Additionally, the experiment conducted a statistical analysis of the distribution of ship types involved in dangerous encounters, as illustrated in Figure 13. Out of the 6442 vessels involved in dangerous encounters, fishing vessels accounted for the largest proportion at approximately 61.8%, followed by merchant vessels at around 28.86%. This highlights that cargo and fishing vessels are the primary types contributing to maritime accidents in this area.

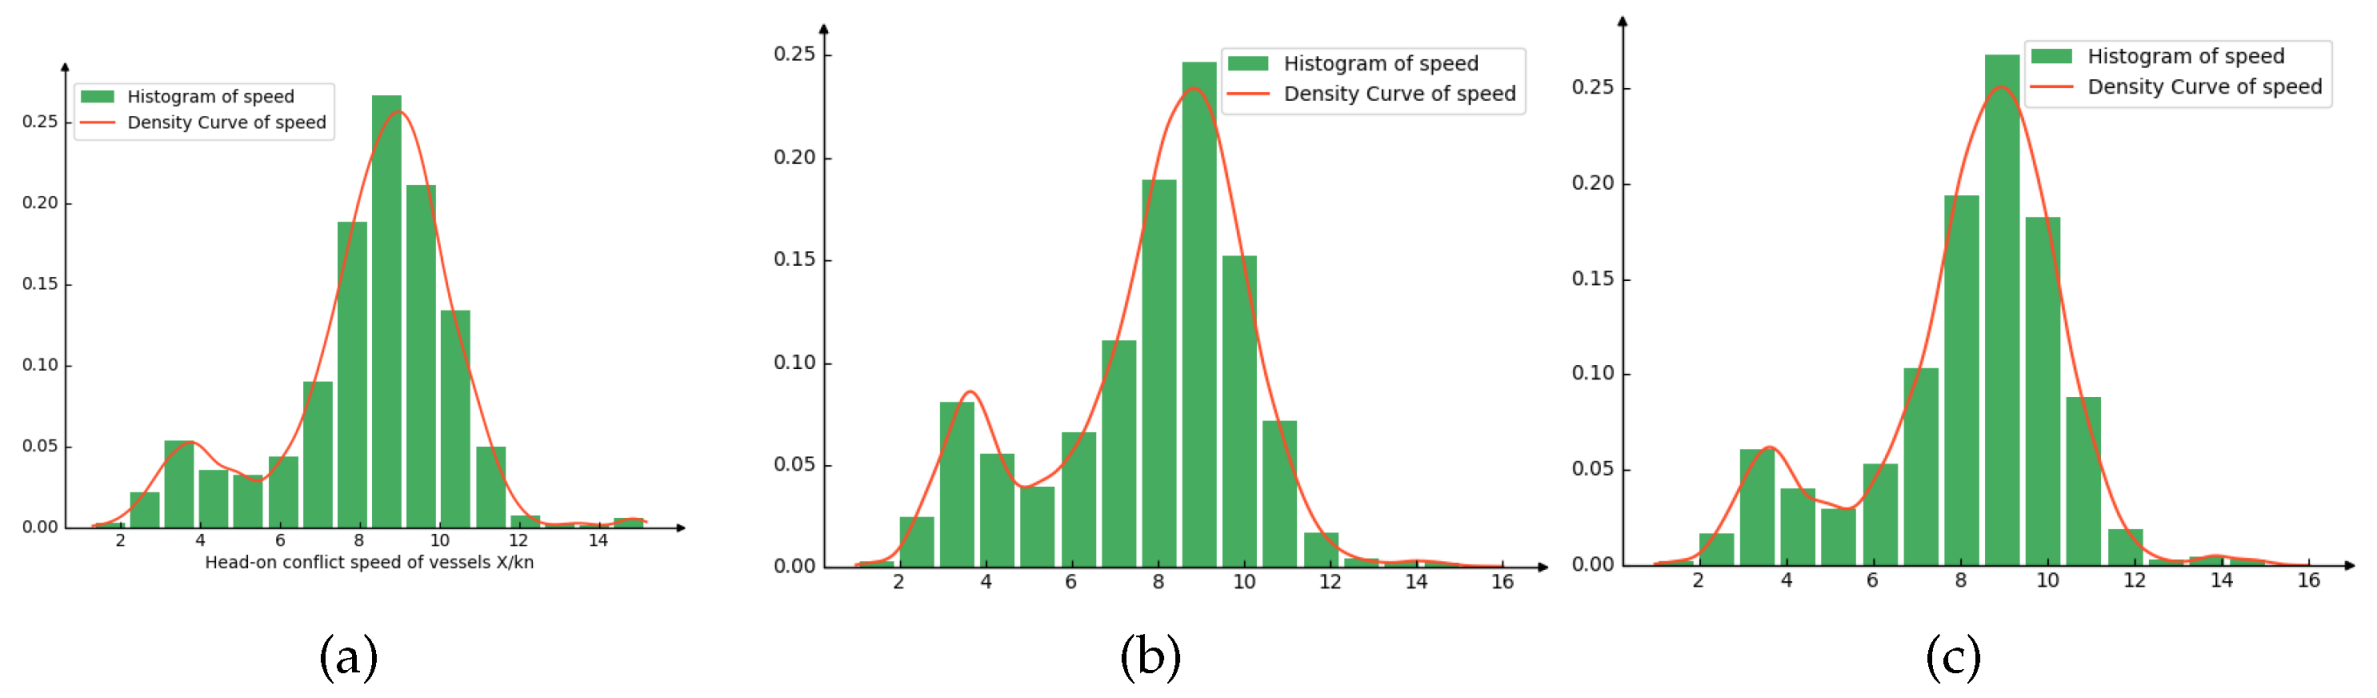
3.1.2. Speed Distribution of Encounters

A statistical analysis of vessel speeds is presented in different encounter situations in Figure 14. Overall, there is a similar trend in the distribution of speeds, with a higher proportion falling within the 7–10 knots range. Specifically, for vessels involved in head-on encounters, their speed distribution follows a Weibull distribution, as depicted in Figure 14a. The majority of speeds are in the 8–10 knot range, accounting for 50.47%, with an average speed of approximately 8.23 knots. In the case of vessels involved in crossing encounters, their speed distribution follows the distribution shown in Figure 14b. The predominant speeds are in the 8–10 knots range, constituting 39.7%, with an average speed of 7.5 knots. For vessels involved in overtaking encounters, their speed distribution is illustrated in Figure 14c. The majority of speeds are between 8–10 knots, making up 46.1%, with an average relative speed of approximately 7.94 knots. Notably, vessels involved in overtaking and crossing encounters exhibit lower average speeds compared to vessels in head-on encounters in hazardous encounter scenarios.
A heat map illustrating the velocity distribution of hazardous vessels within the study waters is depicted in Figure 15. It can be seen from the figure that the ship speed in the hazardous encounter scenarios from the internal route to the external route along the coast of Fuzhou presents an increasing distribution. The speed of the external route is significantly higher than that of the internal route; this is closely related to the wide sea depth of and fewer obstacles in the external route.

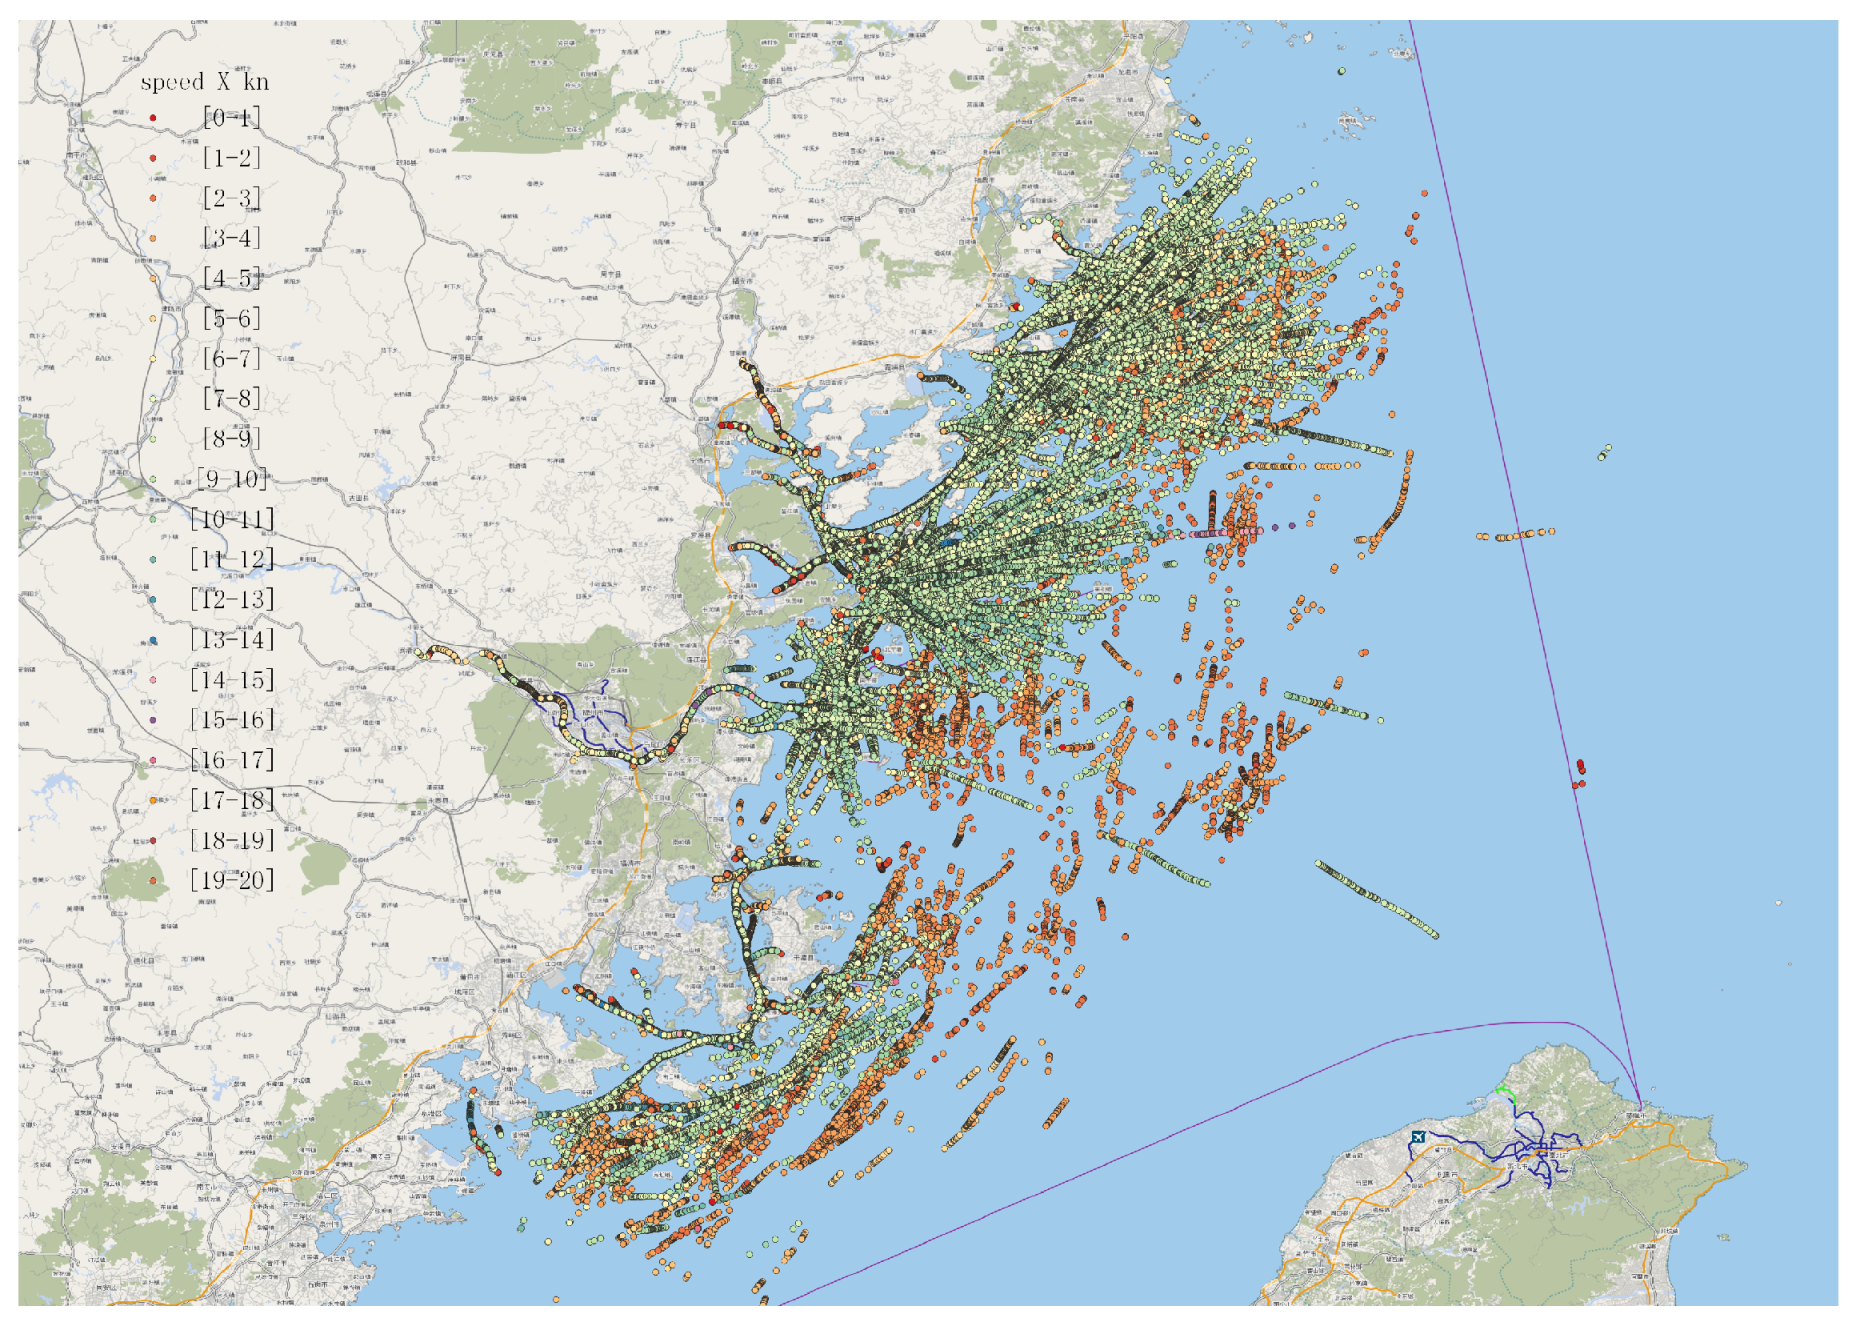
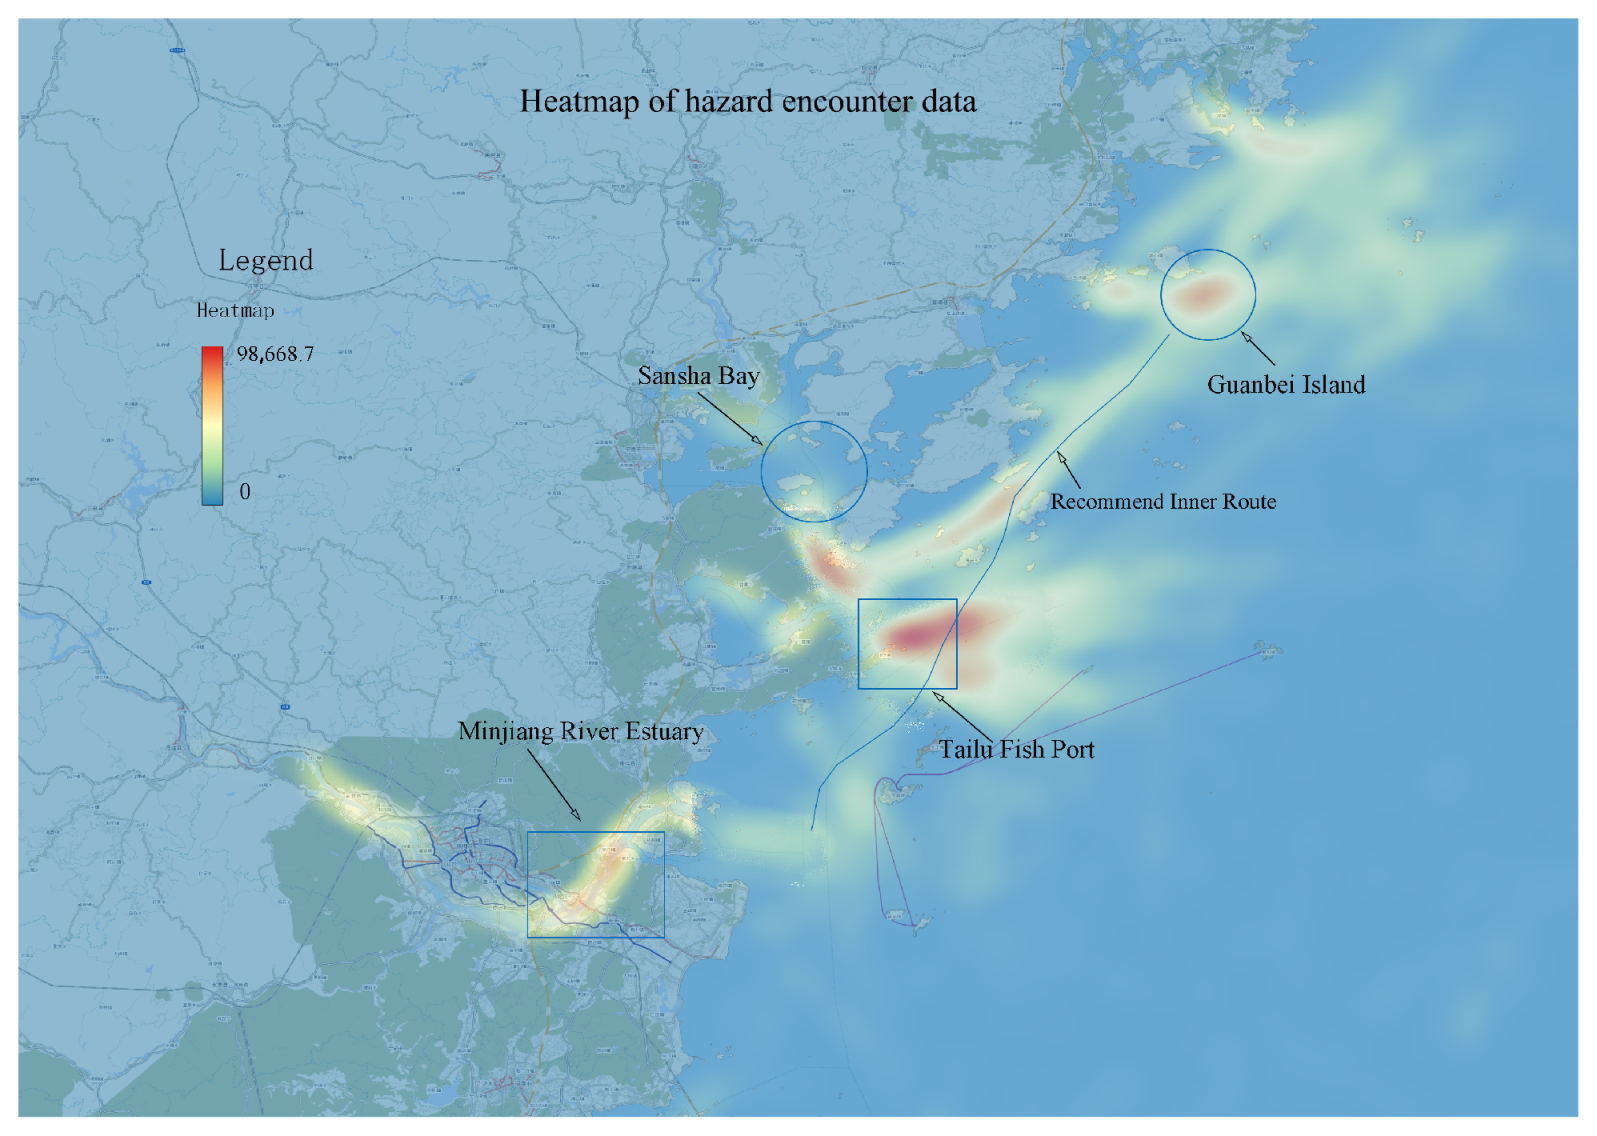
3.2. Spatial Distribution of Hazardous Encounter Events

Based on the spatial distribution of hazardous ship encounter events depicted in Figure 16, hazardous encounters along the Fujian coast are predominantly concentrated in four regions. These regions are the fishing port areas (such as Tailu Fish Port), the entrances to bays (such as Sansha Bay), the estuary of the Minjiang River, and Guanbei Island. A conflict peak is observed at the entrance waters of Sansha Bay and forms due to the fact that this is the sole entrance and exit of Sansha Bay. During the fishing season, numerous fishing vessels navigate through this area, and the complex navigation conditions, including obstacles such as reef islands in the middle of the channel, contribute to the dense distribution of collision conflicts. The secondary conflict areas are located from Guanbei Island to the main channel of the Minjiang River estuary. This area is a mandatory passage for fishermen from the town of Tailu entering and leaving the fishing port and intersects with the traffic flow to and from the Minjiang River estuary. With a higher navigation density, the likelihood of maritime collision accidents is significantly increased.

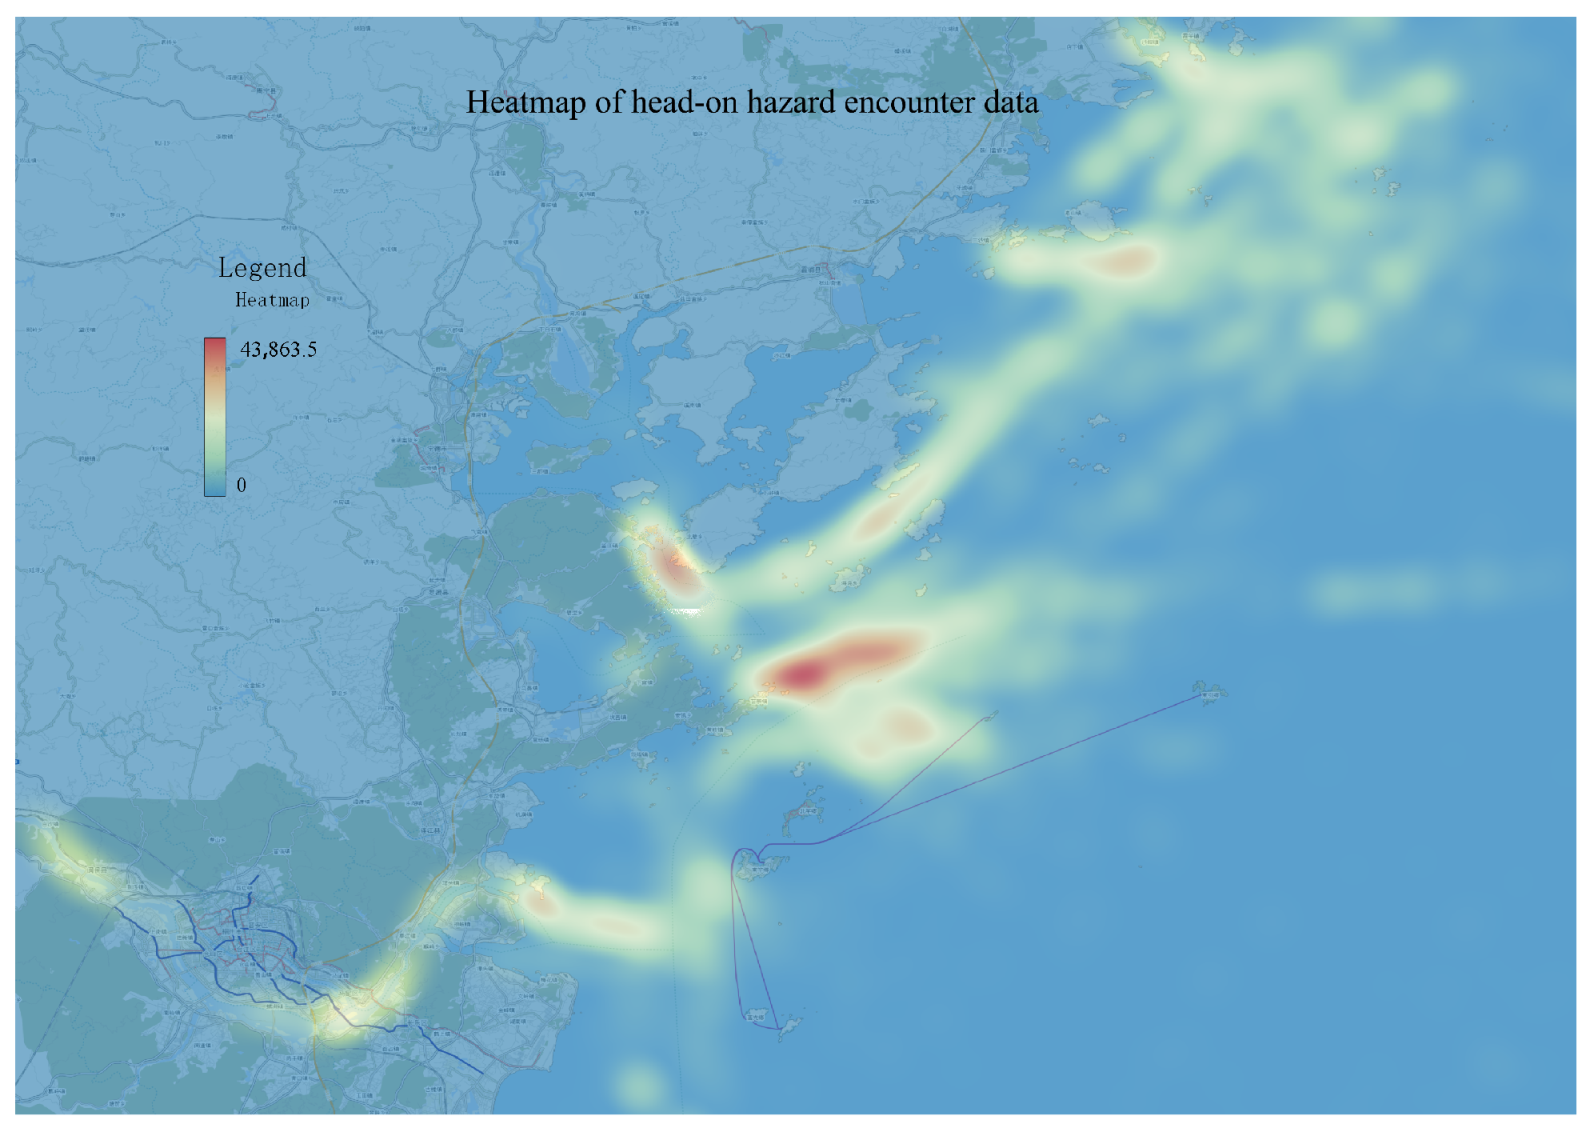
3.2.1. Spatial Distribution of Hazardous Head-On Encounter Scenarios

The most intensive area of head-on hazardous events is situated near the entrance to Sansha Bay, as illustrated in Figure 17. This area serves as the exclusive entry and exit point for fishermen heading out to sea from Sansha Bay. The presence of navigational constraints such as reefs on the southern side creates a traffic bottleneck, making it a high-traffic area prone to head-on encounter conflicts between commercial and fishing vessels. The conflicts are particularly pronounced within the primary shipping lane, emphasizing the prevalence of head-on encounter issues in this region. The second-highest density of head-on encounter hazardous events is observed in the nearshore waters. This area functions as a major transportation hub for fishermen from the town of Tailu and intersects with the recommended inland waterway connecting Guanbei Island and the Min River estuary. The notable conflict area arises from encounters between southbound and northbound commercial vessels and fishermen heading out for fishing activities. The conflicts are widespread in this area due to the high volume of fishing vessels.

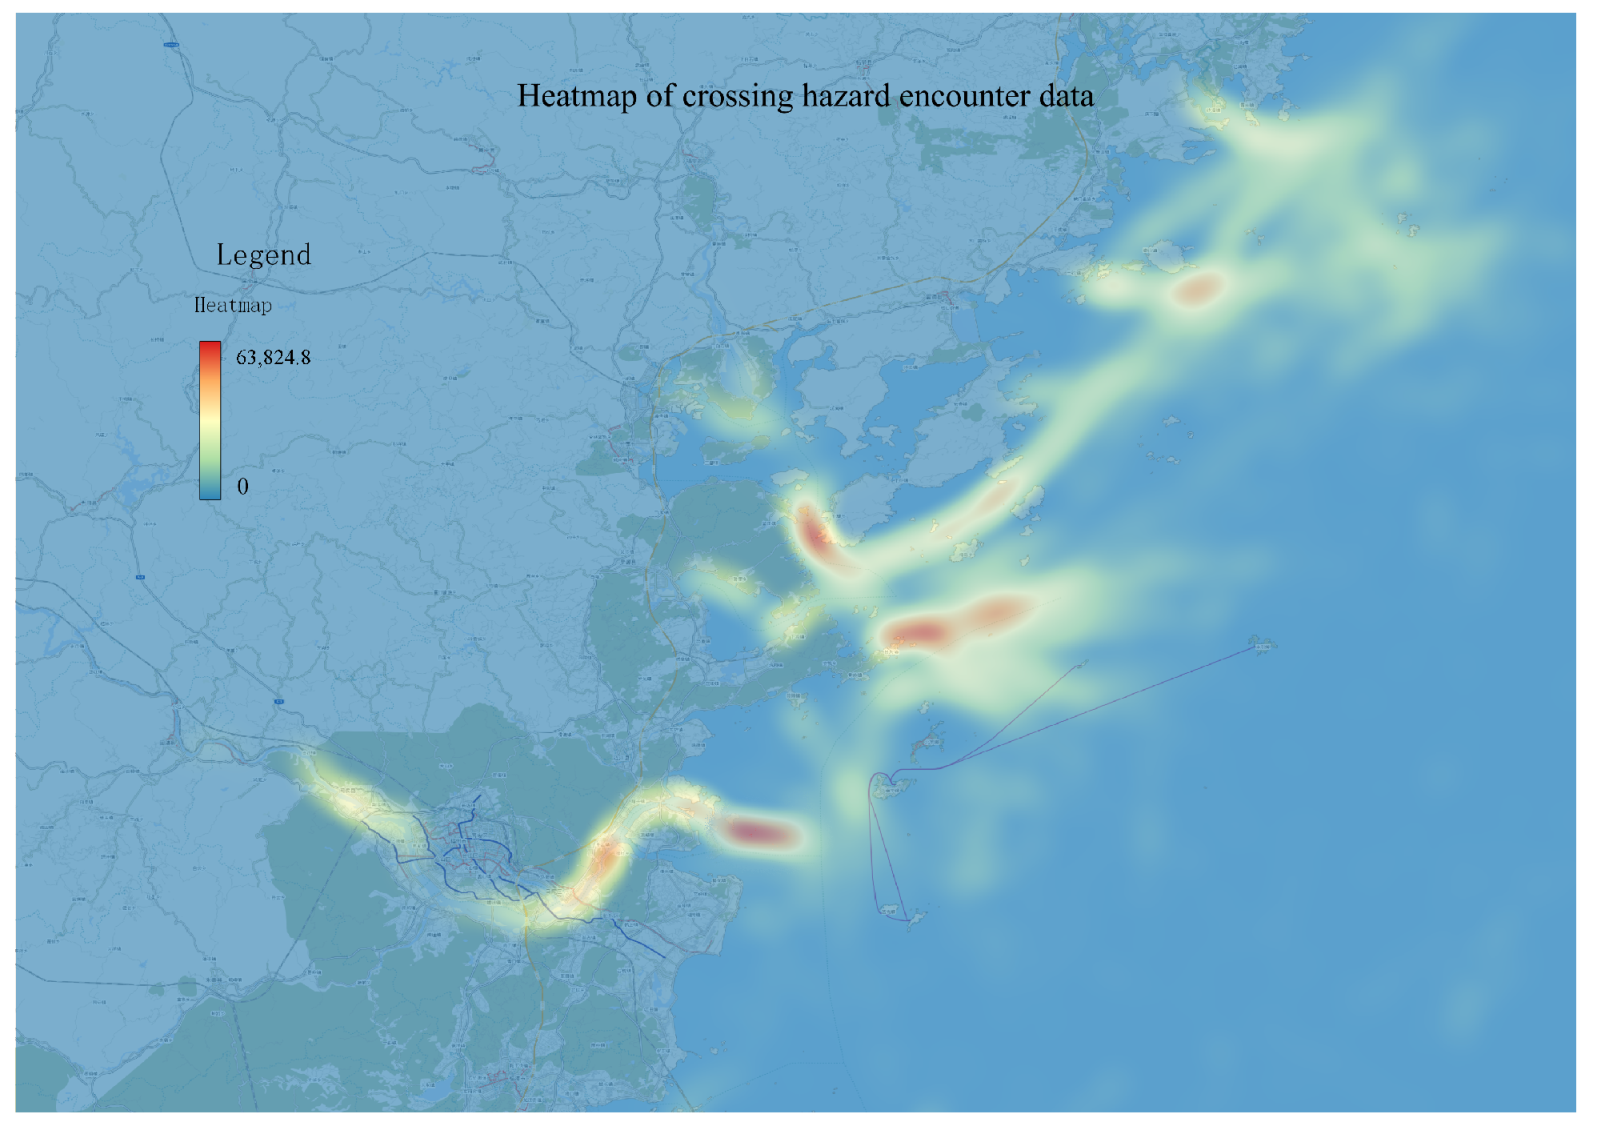
3.2.2. Spatial Distribution of Hazardous Crossing Encounter Scenarios

Hazardous crossing encounter events constitute the predominant type of maritime conflicts in the research area, accounting for a substantial 63.14%. This highlights the significance of crossing encounter hazards as a primary concern for vessels navigating the strait. Figure 18 illustrates the spatial distribution of hazardous crossing encounter events in the research area. The maximum concentration of crossing encounter hazards is located near the waters of the Minjiang River estuary. This area serves as a convergence point for river vessels from the Minjiang River and ocean-going commercial vessels entering the Minjiang River estuary. It is a crucial turning point for vessels navigating from Guanbei Island to the main channel leading to the Minjiang River, creating a region with a broad distribution and high density of crossing encounter hazards. The second dense area of crossing encounter hazards is situated in the Sansha Bay. Vessels navigating through this area tend to make significant turns near Jigongshan, leading to crossing encounter situations. Limited visibility and the necessity for vessels to make substantial maneuvers increase the potential for dangerous encounters with passing vessels, posing a significant risk of collision.

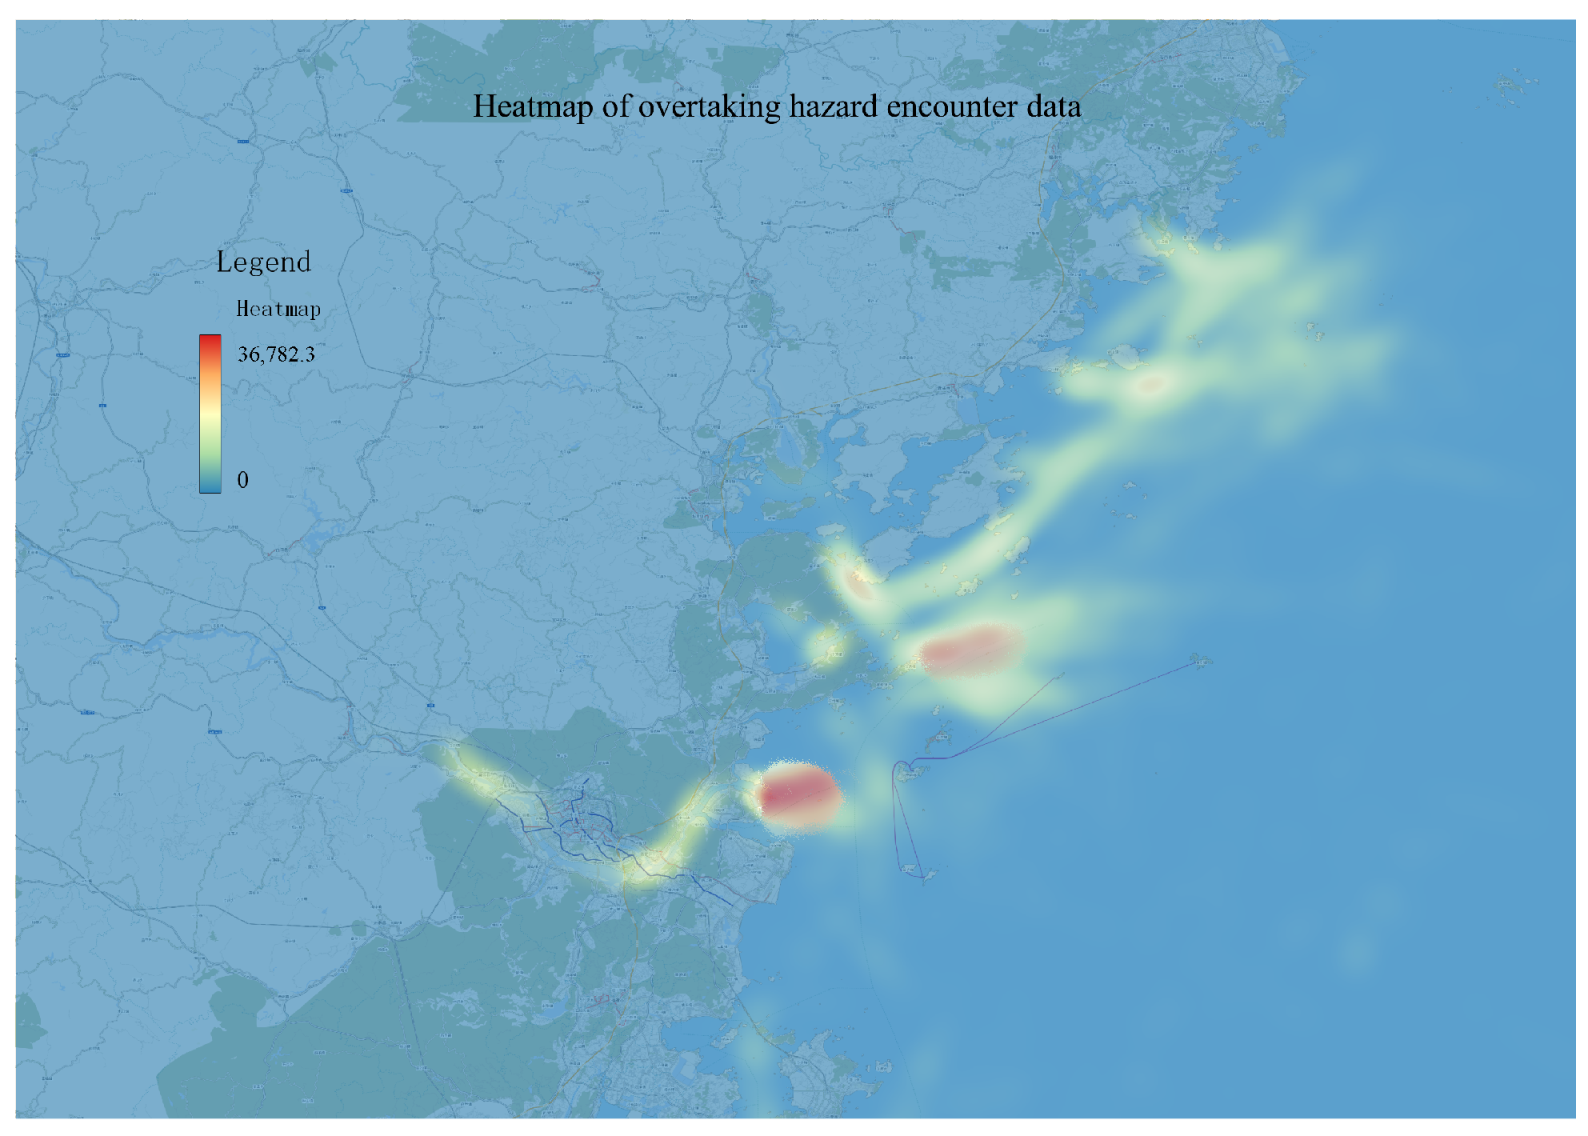
3.2.3. Spatial Distribution of Dangerous Overtaking Scenarios

The spatial distribution of hazardous overtaking encounter events within the studied area is illustrated in Figure 19. The primary hotspot for hazardous overtaking encounter events is situated at the entrance and exit points of Sansha Bay and Luoyuan Bay, especially in the vicinity of Jigongshan when navigating the channel to and from Sansha Bay. The deceleration and acceleration of vessels during course changes in this area are likely the primary contributing factors to the occurrence of hazardous overtaking encounter events. The second dense area of hazardous overtaking collision events is in the region connecting the towns of Tailu and Haidao. This area serves as a crucial intersection for fishermen from Tailu heading north to the open sea utilizing the recommended waterway, and it also serves as a convergence area for fishermen changing course to return to port. The likelihood of vessels accelerating and decelerating in this waterway is significant, making it a key factor in the numerous hazardous overtaking encounter events observed in this area.

3.3. Temporal Distribution of Hazardous Encounter Data

The study area’s fishing season is divided into two distinct periods: spring and autumn. The spring season spans from March to May, while the autumn season extends from August to November. The data utilized cover the period from August to November, corresponding to the autumn flood fishing season. Fishing vessels typically navigate without a fixed course during the operational process, involving both departure and return. These movements are generally determined by the tide and the abundance of fish. Typically, fishing vessels are small, limiting the use of large nets for deep-sea fishing. Consequently, they engage in small-scale fishing in the shallow waters near the sea. Due to the abundance of predators in shallow waters during the day, fish in these areas disperse, hide, or migrate to the deep sea. Consequently, fishermen opt to fish at night. To analyze the temporal distribution of dangerous events involving fishing vessels, statistical analysis was applied to the AIS data of the study waters.

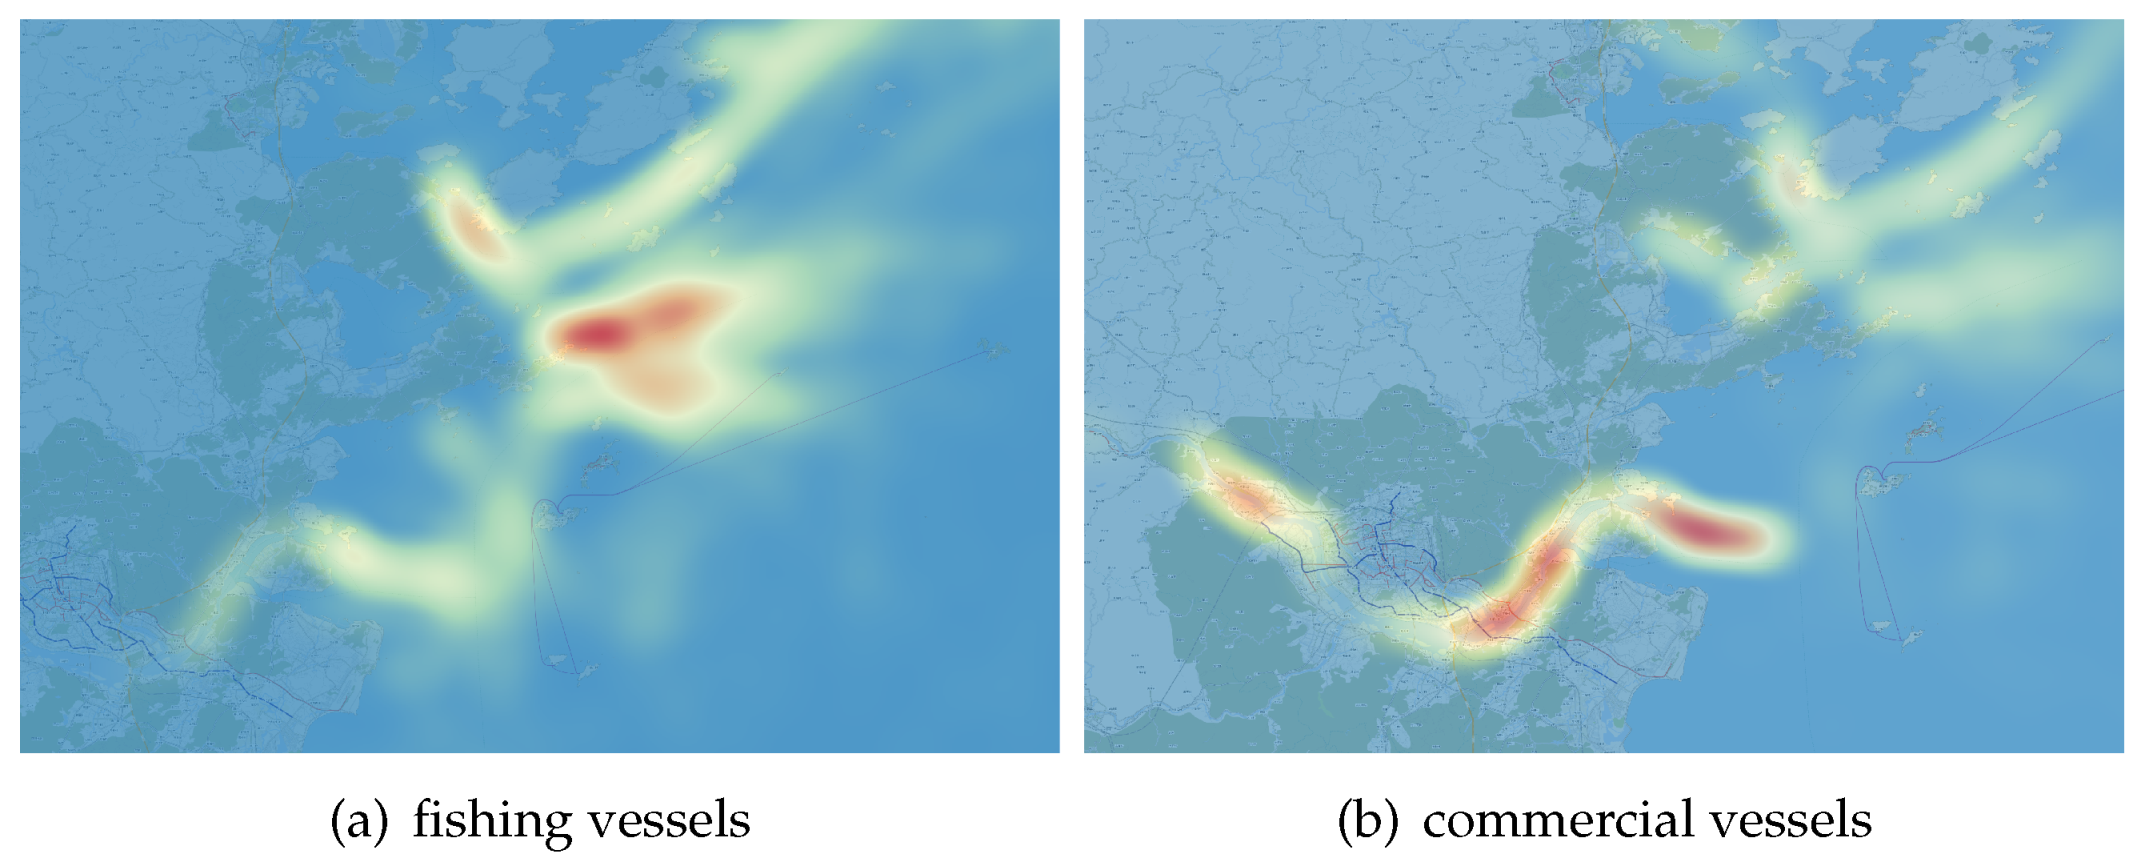
3.3.1. Distribution of Fishing Vessels in Hazardous Situations

The temporal distribution of hazardous encounter events, as shown in Figure 20, reveals a notable concentration during the evening hours from 6:00 PM to 12:00 AM. This period is often considered the peak period for fishing activities. Navigational conditions become more complex during this time due to the onset of darkness coupled with the fact that certain fish species exhibit increased activity during the night. Additionally, nighttime weather conditions at sea are typically more intricate than those during the day. The reduced visibility for crew members, coupled with fatigue from continuous work, significantly impacts their vigilance and responsiveness, thereby elevating the risk of maritime accidents [29].

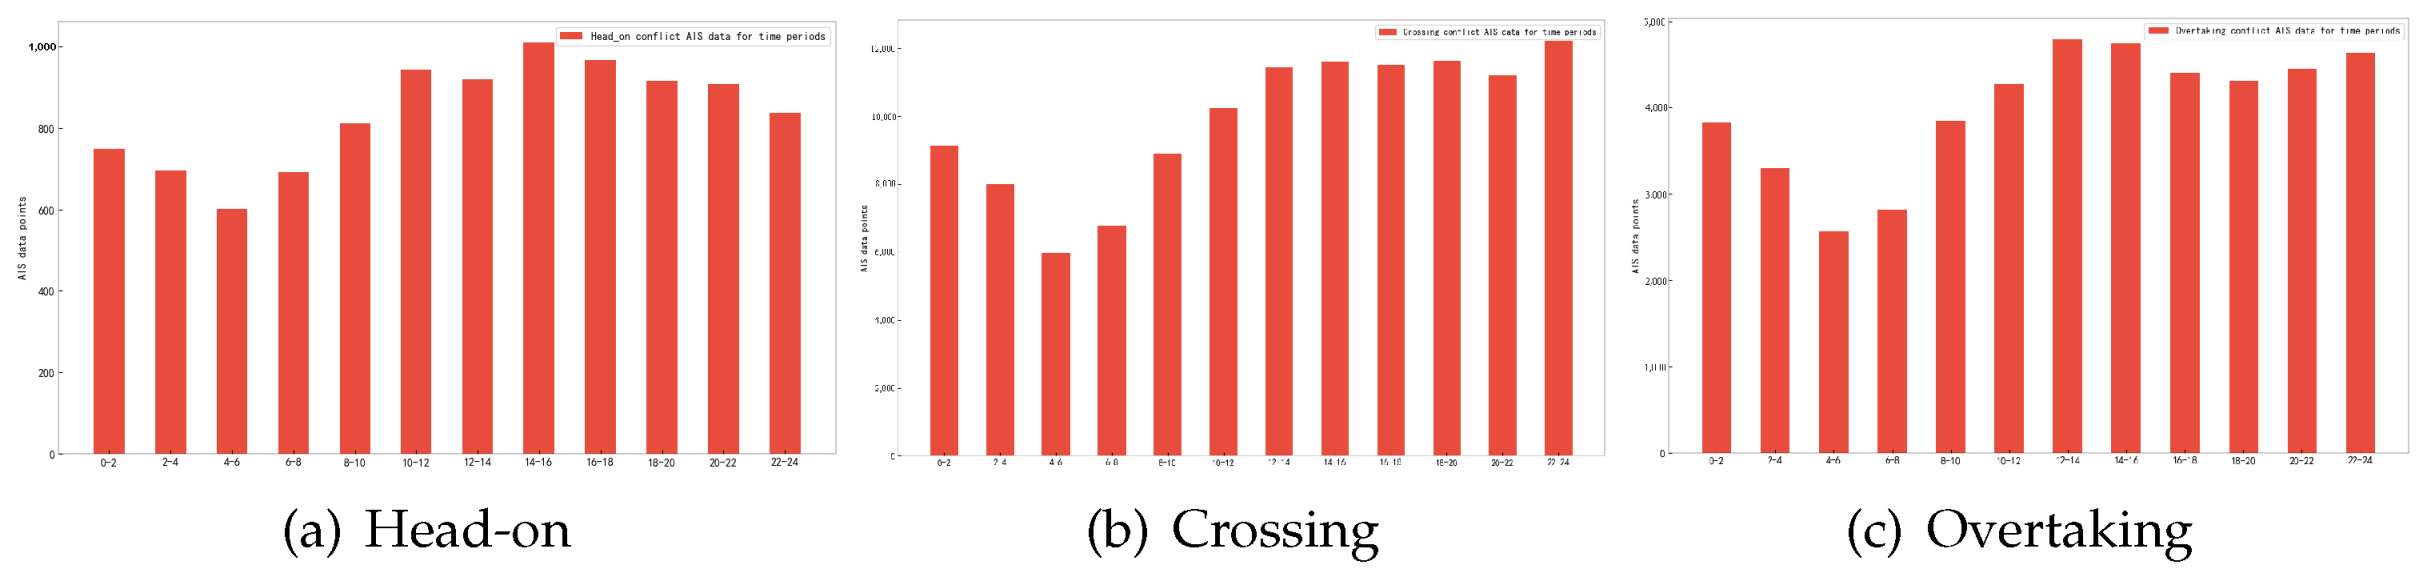
3.3.2. Temporal Distribution of Hazardous Encounter Events under Different Scenarios

The temporal distribution of hazardous encounter events under various encounter scenarios is illustrated in Figure 21. Across all encounter scenarios, the primary time frame for encountering risks is from 8:00 AM to midnight, with the least data recorded between 4:00 AM and 6:00 AM. However, the peak periods for hazardous encounter events slightly differ among the encounter situations. For head-on encounters, the peak time occurs between 2:00 PM and 4:00 PM, while for crossing encounters, it is between 10:00 PM and midnight, and for overtaking encounters, it is between 12:00 PM and 4:00 PM.

3.3.3. Spatial and Temporal Distribution of Hazardous Encounter Events

The experiment incorporated the time dimension into the heat map. Figure 22 illustrates the thermal maps representing hazardous data during six time intervals: 0–4, 4–8, 8–12, 12–16, 16–20, and 20–24. The figure reveals a similar spatial distribution of hazardous encounter events across different time periods, with relatively dense concentrations along the east coast of the Lianjiang River, the Shacheng Port, the Sansha Port, and the Minjiang estuary. It exhibits a higher density during the period from 12 to 24, corresponding to the busy hours for fishermen. Typically, merchant ships and fishing boats navigate during this period, resulting in the intersection of their sailing paths and elevating the risk of ship encounters and potential collisions.

4. Analysis and Discussion

4.1. Case Analysis of Collision Accidents

To validate the accuracy of the high-risk collision zones identified based on historical AIS data, this study gathered maritime accident data from the study area over the past three years. The analysis of accident occurrence regions was coupled with an examination of the causes behind these incidents. Furthermore, a comparison was made between the locations of six maritime collision incidents that occurred in the study area over the last three years and the high-risk collision zones identified above.

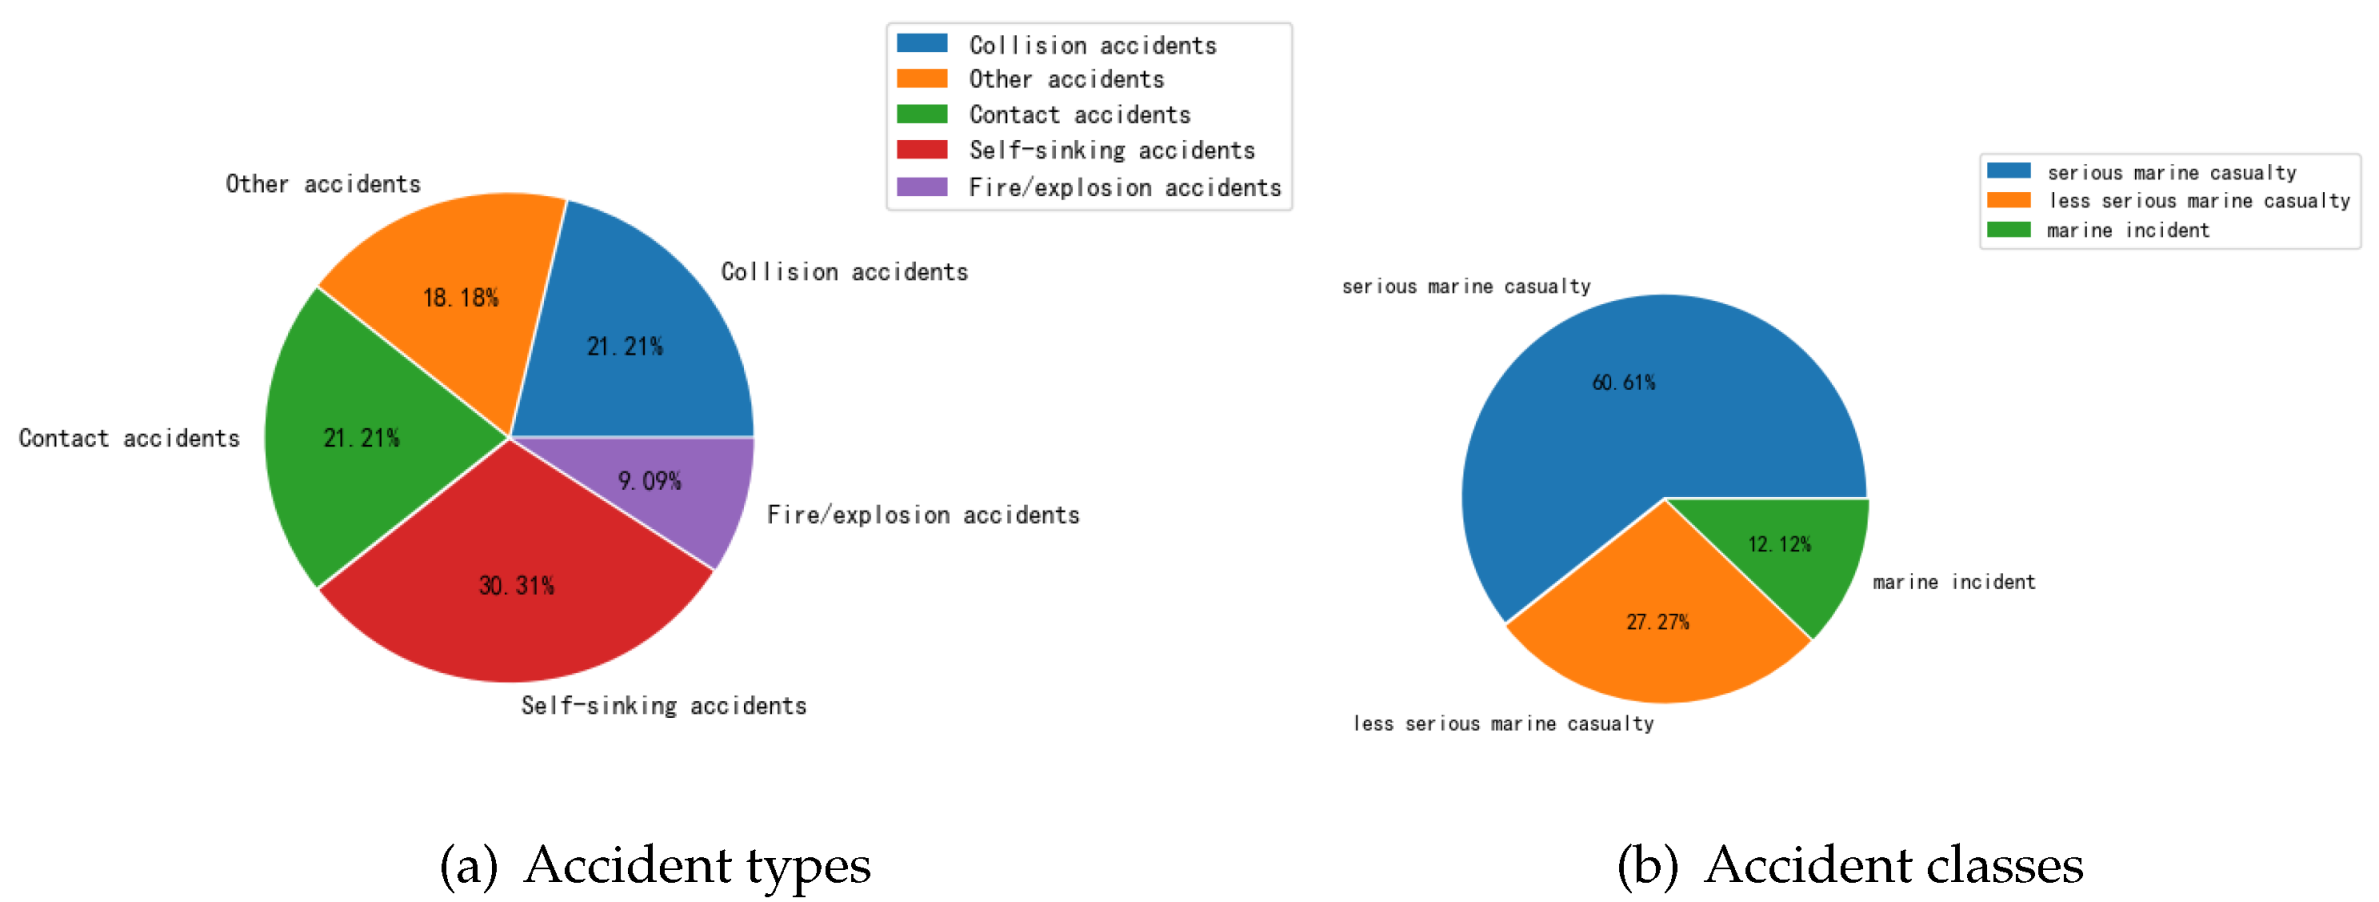
4.1.1. Marine Accident Data Statistics

According to the International Maritime Organization (IMO), maritime accidents are classified into the following major categories: (1) Very serious marine casualty: a very serious casualty means a marine casualty involving the total loss of the ship, death, and severe damage to the environment. (2) Serious marine casualty: serious casualties are ship casualties that do not qualify as very serious casualties and that involve a fire, explosion, collision, grounding, contact, heavy weather damage, ice damage, hull cracking, suspected hull defect, etc., resulting in immobilization of main engines, extensive accommodation damage, severe structural damage such as penetration of the hull under water, etc., rendering the ship unfit to proceed or pollution (regardless of quantity) and a breakdown necessitating towing or shore assistance. (3) Less serious marine casualty: less serious casualties are ship casualties that do not qualify as very serious casualties or serious casualties. (4) Marine incident: a marine incident means an event or sequence of events other than a marine casualty that occurred directly in connection with the operations of a ship that endangered or, if not corrected, would endanger the safety of the ship, its occupants, or any other person or the environment. Marine incidents include hazardous incidents and near misses.
We conducted a statistical analysis of maritime accidents that occurred in the study area from 2020 to 2023 following IMO standards. In Figure 23b, serious accidents in coastal waters made up 12.12% of the total incidents, major accidents accounted for 27.27%, while general accidents were the most frequent, representing 60.61%. Among these incidents, self-sinking accidents were the most prevalent, constituting 30.30% of the total, followed by collision accidents at 21.21%. Fire/explosion accidents had the lowest proportion, accounting for a mere 3.03%, as depicted in Figure 23a.

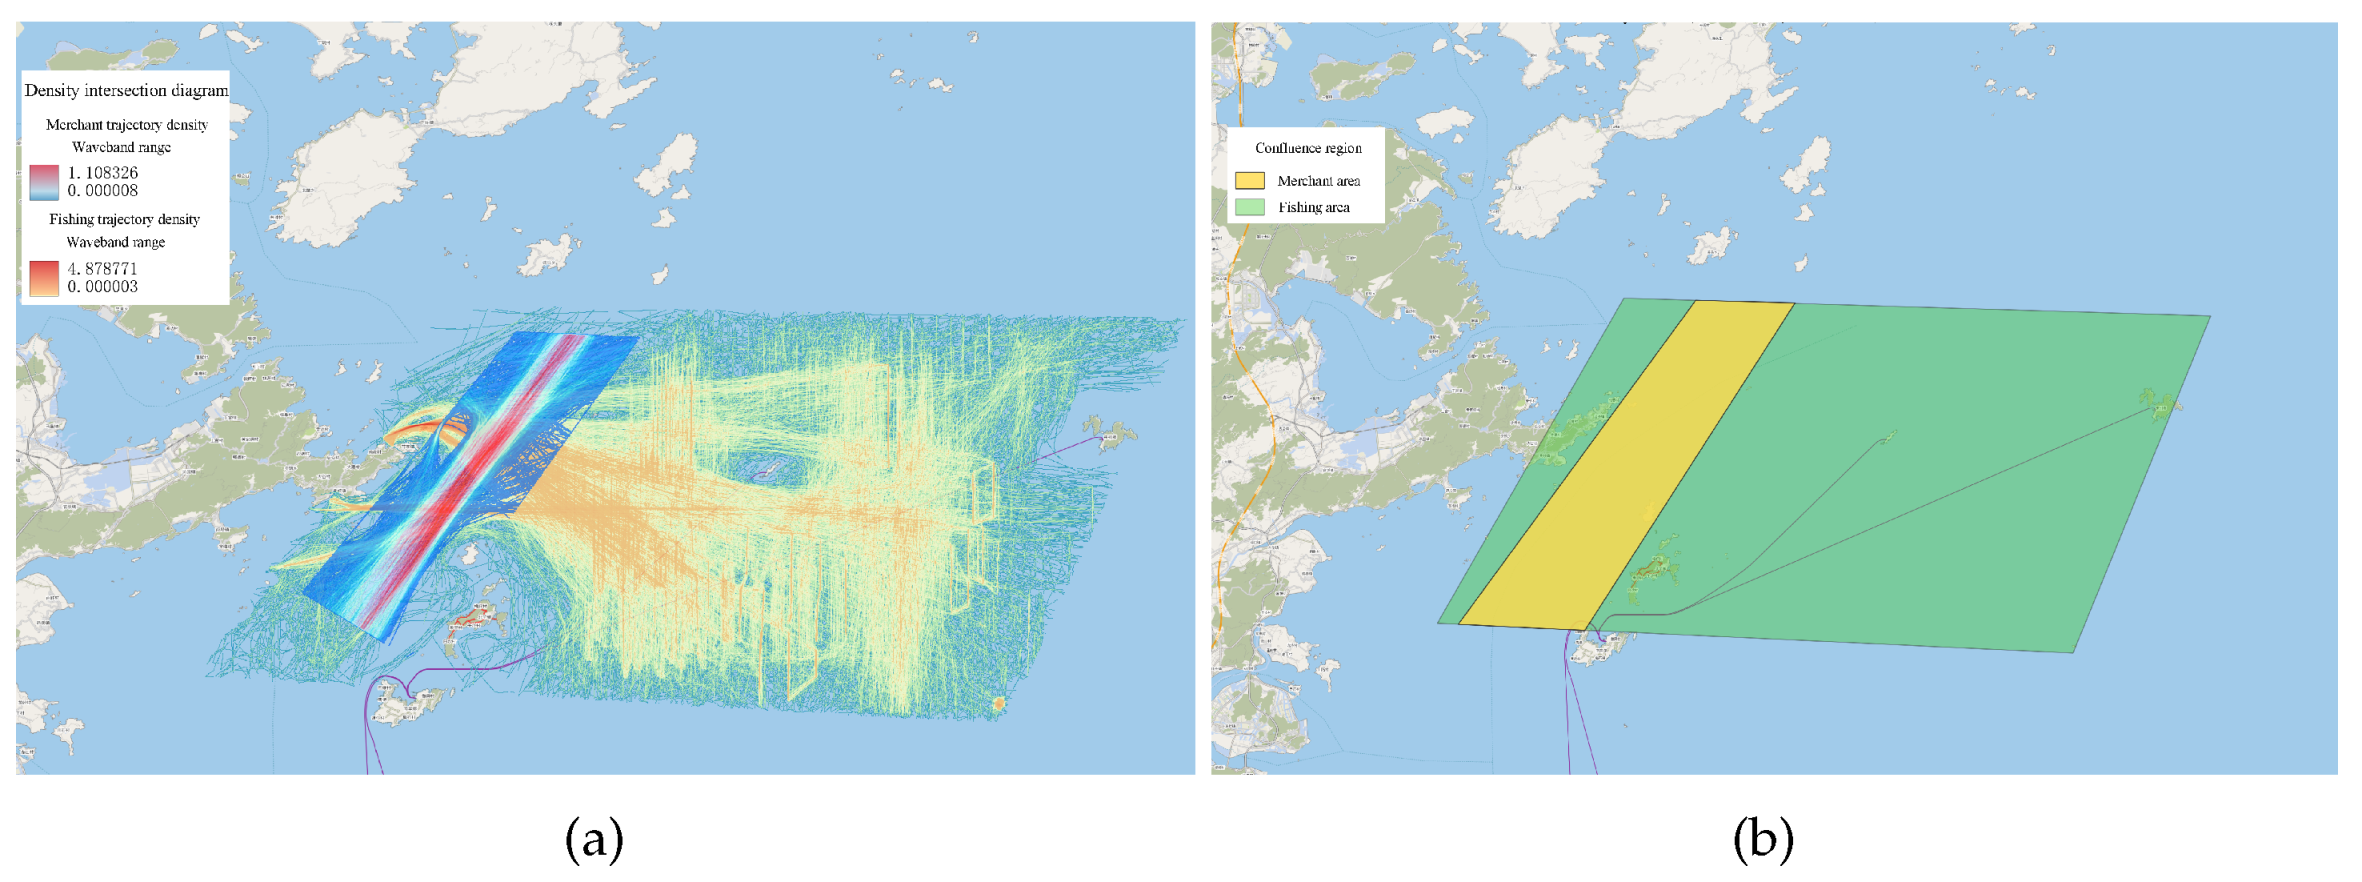
4.1.2. Analysis of High-Risk Areas of Collisions between Merchant Ships and Fishing Vessels

Merchant ships and fishing boats serve distinct purposes, resulting in varied sailing areas. To delve deeper into the analysis of high-risk collision areas for these vessels, the experiment presents heat maps depicting the frequency of encounter risks for both types. The identified high-risk areas for merchant and fishing vessels are illustrated in Figure 24.
In the case of fishing vessels, the predominant incident-prone region is around the line connecting the town of Tailu and Yangyu Island. This is attributed to the high volume of fishing vessels navigating through this area and overlapping with the recommended inner shipping route for merchant vessels. The complex interweaving of trajectories, narrow channels, numerous obstacles, and intricate water currents contribute to frequent accidents. Particularly, small- to medium-sized wooden fishing vessels with poor radar reflection and limited visibility are prone to accidents in this region, as passing merchant vessels may struggle to detect their radar echoes effectively.
For merchant vessels, the primary incident-prone area is the exit of the Minjiang River channel. This region is characterized by numerous bends, and many merchant vessels tend to overlook radar blind spots and fail to exercise sufficient caution. There is a tendency to excessively rely on radar functionality and neglect proper lookout procedures. Lack of essential experience and knowledge of utilizing radar echoes to detect smaller fishing vessels contributes to collisions in this area.

4.1.3. Comparison with Actual Collision Incidents

The analysis conducted in this study focuses exclusively on collision incidents. Therefore, a comparative analysis is performed between the areas where six collision incidents occurred in the past three years and the high-risk collision areas identified in this study. Figure 25 illustrates the comparison between the experimentally derived high-risk collision areas for merchant and fishing vessels and the actual regions where ship collisions occurred. Moreover, five out of the six collision incidents align with the areas identified as high-risk collision zones in this experiment. This correspondence validates the effectiveness of the experiment’s methodology at identifying high-risk collision areas for merchant and fishing vessels.

5. Conclusions

Based on historical AIS data collected during the autumn 2022 fishing season in the study waters, this paper proposes a method for visualizing high-risk collision areas for commercial and fishing vessels. In this method, the safety domain of fishing vessels operating is redefined by considering fishing vessels engaged in cooperative operations as a whole entity. Additionally, the process of vessel intrusion into ship domains is visualized based on the degree of collision risk using different weights.. The aim is to identify areas prone to collisions between merchant and fishing vessels in order to provide a warning for vessels to exercise sufficient caution when navigating through high-risk zones and to reduce the occurrence of maritime collisions. The primary research findings are summarized below:
  • Identification of fishing vessel operational status: The paper proposes a method to identify the operational status of fishing vessels. Recognizing the operational status of fishing vessels is crucial for collision prevention, particularly when encountering fishing vessels engaged in operations. The experiment distinguishes between the navigation trajectories of fishing vessels under different operational characteristics to effectively identify the operational statuses of fishing vessels, with a focus on those engaged in operations for encounter risk analysis.
  • Evaluation of hazardous encounter events for merchant and fishing vessels: The paper introduces a method to assess encounter risk data for merchant and fishing vessels. By calculating the CPA and TCPA, the collision risk is quantified. The experiment sets the vessel domain for fishing vessels engaged in operations to 0.5 nautical miles, ensuring a safe distance of at least 0.5 nautical miles between each vessel in a collaborative operation. The paper categorizes and assesses risk data for different encounter situations.
  • Visualization of high-risk collision areas for merchant and fishing vessels: The paper conducts a visual analysis of high-risk collision areas for merchant and fishing vessels in the research area under different encounter situations. The identified high-risk collision areas include the eastern nearshore waters of Lianjiang, with latitudes ranging from 26°17′56.40″ to 26°25′12″ and longitudes between 119°24′25.20″ and 119°48′7.20″, and the Minjiang River estuary. The paper validates the identified high-risk collision areas using data on the locations of maritime collisions in the research area over the past three years, demonstrating the reasonableness of the experiment’s outcomes.
Although the research in this paper revealed some interesting findings, there are still some limitations that need to be further studied in the future. First, this paper does not consider the impact of ship maneuverability and ship tonnage for quantifying ship collision risk, which are needed in further research. Second, the method does not consider the influence of objective conditions such as adverse weather conditions like typhoons, visibility, and traffic density on collision risks. Finally, the assumption of dynamic collision boundaries (polygon and ellipse) may influence the results of the collision risk evaluation, which will be further explored. In future research, we aim to research or refine more advanced models to better suit the characteristics of our study area. Additionally, further collaboration with relevant authorities can be pursued to equip multifunctional navigation aids within high-risk collision areas, providing real-time maritime traffic alerts and information on hazardous zones. By establishing a comprehensive maritime safety system within these high-risk collision areas, vessels’ perception of danger can be heightened, thus reducing the occurrence rate of collision incidents and ensuring safe and smooth maritime traffic flow. Additionally, the construction of vessel trajectory prediction models within high-risk collision areas can be explored to estimate the time and location of potential collisions during encounters.

Author Contributions

Conceptualization, W.H., C.Z. and J.L.; methodology, J.L. and Z.W.; validation, M.C. and D.Z.; formal analysis, W.H.; investigation, M.C. and W.H.; resources, D.Z.; data curation, C.Z.; writing—original draft preparation, C.Y.; writing—review and editing, C.Z. and J.L.; visualization, J.L. and Z.W.; supervision, M.C. and W.H.; project administration, C.Y.; funding acquisition, W.H. All authors have read and agreed to the published version of the manuscript.

Funding

This research was funded by name the National Natural Science Foundation of China grant number 52172327, the Fujian Province Natural Science Foundation, grant number 2022J05236, the Science and Technology Planning Project of Fuzhou grant number 2022-P-006, the Fujian Province Key Science and Technology Innovation Project grant number 2022G02009, 2022G02027, and the Science and Technology Key Project of Fuzhou grant number 2022-ZD-021.

Institutional Review Board Statement

Not applicable.

Informed Consent Statement

Not applicable.

Data Availability Statement

Data are contained within the article.

Acknowledgments

The authors wish to thank the Fuzhou Aids to Navigation Division of Eastern Navigation Services Center for providing ship AIS data for this study.

Conflicts of Interest

The authors declare no conflicts of interest.

References

  1. Nieh, C.Y.; Lee, M.C.; Huang, J.C.; Kuo, H.C. Risk assessment and traffic behaviour evaluation of inbound ships in Keelung harbour based on AIS data. J. Mar. Sci. Technol. 2019, 27, 2. [Google Scholar]
  2. Liu, Z.; Zhang, B.; Zhang, M.; Wang, H.; Fu, X. A quantitative method for the analysis of ship collision risk using AIS data. Ocean Eng. 2023, 272, 113906. [Google Scholar] [CrossRef]
  3. Silveira, P.; Teixeira, A.; Soares, C.G. Use of AIS data to characterise marine traffic patterns and ship collision risk off the coast of Portugal. J. Navig. 2013, 66, 879–898. [Google Scholar] [CrossRef]
  4. Sedov, V.A.; Sedova, N.A.; Glushkov, S.V. The fuzzy model of ships collision risk rating in a heavy traffic zone. Vibroeng. Procedia 2016, 8, 453–458. [Google Scholar]
  5. Yi, M. Design of the model for predicting ship collision risk using fuzzy and DEVS. J. Korea Soc. Simul. 2016, 25, 127–135. [Google Scholar] [CrossRef]
  6. Chin, H.C.; Debnath, A.K. Modeling perceived collision risk in port water navigation. Saf. Sci. 2009, 47, 1410–1416. [Google Scholar] [CrossRef]
  7. Liu, K.; Yu, Q.; Yuan, Z.; Yang, Z.; Shu, Y. A systematic analysis for maritime accidents causation in Chinese coastal waters using machine learning approaches. Ocean Coast. Manag. 2021, 213, 105859. [Google Scholar] [CrossRef]
  8. Yu, Y.; Chen, L.; Shu, Y.; Zhu, W. Evaluation model and management strategy for reducing pollution caused by ship collision in coastal waters. Ocean Coast. Manag. 2021, 203, 105446. [Google Scholar] [CrossRef]
  9. Shinoda, T.; Shimogawa, K.; Tamura, Y. Applied Bayesian Network Risk Assessment for Collision Accidents between Fishing Vessels and Cargo Vessels. J. Inst. Navig. 2012, 127, 165–174. [Google Scholar] [CrossRef]
  10. Takemoto, T.; Sakamoto, Y.; Yano, Y.; Furusho, M. Collision Avoidance Actions and Backgrounds in Fishing Vessels Collision Accidents. J. Jpn. Inst. Navig. 2010, 122, 113–120. [Google Scholar]
  11. Xiao, F.; Ma, Y.; Wu, B. Review of Probabilistic Risk Assessment Models for Ship Collisions with Structures. Appl. Sci. 2022, 12, 3441. [Google Scholar] [CrossRef]
  12. Mou, J.M.; Van der Tak, C.; Ligteringen, H. Study on collision avoidance in busy waterways by using AIS data. Ocean Eng. 2010, 37, 483–490. [Google Scholar] [CrossRef]
  13. Uğurlu, F.; Yıldız, S.; Boran, M.; Uğurlu, Ö.; Wang, J. Analysis of fishing vessel accidents with Bayesian network and Chi-square methods. Ocean Eng. 2020, 198, 106956. [Google Scholar] [CrossRef]
  14. Argüelles, R.P.; Maza, J.A.G.; Martín, F.M.; Bartolomé, M. Ship-to-ship dialogues and agreements for collision risk reduction. J. Navig. 2021, 74, 1039–1056. [Google Scholar] [CrossRef]
  15. Huang, Y.; Chen, L.; Negenborn, R.R.; Van Gelder, P. A ship collision avoidance system for human-machine cooperation during collision avoidance. Ocean Eng. 2020, 217, 107913. [Google Scholar] [CrossRef]
  16. Jung, C.H. A study on the requirement to the fishing vessel for reducing the collision accidents. J. Korean Soc. Mar. Environ. Saf. 2014, 20, 18–25. [Google Scholar] [CrossRef]
  17. Yang, J.; Sun, Y.; Song, Q.; Ma, L. Laws and preventive methods of collision accidents between merchant and fishing vessels in coastal area of China. Ocean Coast. Manag. 2023, 231, 106404. [Google Scholar] [CrossRef]
  18. Wang, X.; Zhou, Z.; Liu, Y.; Song, H. Discussions about the best methods of collision between merchant ships and fishing boats during fishing seasons near chinese coast. In Proceedings of the International Conference on Computer Information Systems and Industrial Applications, Bangkok, Thailand, 28–29 June 2015; pp. 758–761. [Google Scholar]
  19. Obeng, F.; Domeh, V.; Khan, F.; Bose, N.; Sanli, E. Capsizing accident scenario model for small fishing trawler. Saf. Sci. 2022, 145, 105500. [Google Scholar] [CrossRef]
  20. Chou, C.C. Application of ANP to the selection of shipping registry: The case of Taiwanese maritime industry. Int. J. Ind. Ergon. 2018, 67, 89–97. [Google Scholar] [CrossRef]
  21. Seo, A.; Hida, T.; Nishiyama, M.; Nagao, K. Comparison and evaluation on user interface of small ship navigation support system. Proc. Jpn. Inst. Navig. 2018, 6, 1–4. [Google Scholar]
  22. Ma, F.; Chu, X.; Yan, X.; Liu, C. Error Distinguish of Ais Based on Evidence Combination. J. Theor. Appl. Inf. Technol. 2012, 45, 83–90. [Google Scholar]
  23. Ma, F.; Chu, X.; Liu, C. The error distinguishing of automatic identification system based on improved evidence similarity. In Proceedings of the ICTIS 2013: Improving Multimodal Transportation Systems-Information, Safety, and Integration, Wuhan, China, 29 June–2 July 2013; pp. 715–722. [Google Scholar]
  24. Qin, Z. The Study on Motion Control and Swarm Coordinated Planning for Unmanned Surface Vehicles (USV). Ph.D. Thesis, Harbin Engineering University, Harbin, China, 2018. [Google Scholar]
  25. Fujii, Y.; Tanaka, K. Traffic capacity. J. Navig. 1971, 24, 543–552. [Google Scholar] [CrossRef]
  26. Kearon, J. Computer programs for collision avoidance and traffic keeping. In Proceedings of the Conference on Mathematical Aspects on Marine Traffic, London, UK, 15–16 September 1977; Academic Press: London, UK, 1979. [Google Scholar]
  27. Xu, X.; Geng, X.; Wen, Y. Modeling of ship collision risk index based on complex plane and its realization. TransNav Int. J. Mar. Navig. Saf. Sea Transp. 2016, 10. [Google Scholar] [CrossRef]
  28. Gao, M.; Shi, G.Y.; Liu, J. Ship encounter azimuth map division based on automatic identification system data and support vector classification. Ocean Eng. 2020, 213, 107636. [Google Scholar] [CrossRef]
  29. Hasanspahić, N.; Vujičić, S.; Frančić, V.; Čampara, L. The role of the human factor in marine accidents. J. Mar. Sci. Eng. 2021, 9, 261. [Google Scholar] [CrossRef]
Figure 1. Visualization and assessment method for collision risks between merchant and fishing vessels in coastal waters.
Jmse 12 00681 g001
Figure 2. Schematic diagram of trajectory segmentation algorithm.
Jmse 12 00681 g002
Figure 3. Comparison of before and after data pretreatment: ((a) before preprocessing; (b) after preprocessing).
Jmse 12 00681 g003
Figure 4. Characteristics of fishing vessel operational trajectories under different operating modes.
Jmse 12 00681 g004
Figure 5. Fujii ship domain model.
Jmse 12 00681 g005
Figure 6. Schematic diagrams of fishing vessel domains in operation; (a) single-vessel operation; (b) multi-vessel collaborative operation.
Jmse 12 00681 g006
Figure 7. Schematic diagram of the encounter of two ships.
Jmse 12 00681 g007
Figure 8. Classification of encounter situations.
Jmse 12 00681 g008
Figure 9. Schematic diagram of dangerous encounter extraction algorithm.
Jmse 12 00681 g009
Figure 10. Overlapping channels of merchant and fishing vessels; (a) Trajectory density maps of merchant and fishing ships; (b) Area of convergence of merchant and fishing ships activities.
Jmse 12 00681 g010
Figure 11. Comparison of Original and weighted kernel density trajectory visualizations; (a) Original trajectories data; (b) Weighted kernel density trajectories data.
Jmse 12 00681 g011
Figure 12. Histogram of frequency distribution of ship lengths and ship widths.
Jmse 12 00681 g012
Figure 13. Distribution of vessel types involved in hazardous encounters.
Jmse 12 00681 g013
Figure 14. Histogram of collision velocity distribution of different collision situations; (a) Head-on conflict speed of ships X/kn; (b) Crossing conflict speed of ships X/kn; (c) Overtaking conflict speed of ships X/kn.
Jmse 12 00681 g014
Figure 15. Heat map of speed distribution in dangerous situations.
Jmse 12 00681 g015
Figure 16. Spatial distribution of risk encounter data.
Jmse 12 00681 g016
Figure 17. Spatial distribution of hazardous head-on encounter scenarios.
Jmse 12 00681 g017
Figure 18. Spatial distribution of hazardous crossing encounter scenarios.
Jmse 12 00681 g018
Figure 19. Spatial distribution of dangerous overtaking scenarios.
Jmse 12 00681 g019
Figure 20. Data distribution of fishing boats during different time periods.
Jmse 12 00681 g020
Figure 21. Distributions of risk encounter times under different encounter situations.
Jmse 12 00681 g021
Figure 22. Heat maps of hazardous encounter data during different time periods.
Jmse 12 00681 g022
Figure 23. Statistical diagram of ship accident data.
Jmse 12 00681 g023
Figure 24. Commercial fishing vessel risk encounter data heat map display.
Jmse 12 00681 g024
Figure 25. Comparison of merchant fishing vessel collisions and high collision hazard areas. (The red star is the accidents place.)
Jmse 12 00681 g025
Table 1. Data range of the study area.
ParametersTypeRange
Timetimestamp1 August 2022–1 December 2022
Maritime Mobile Service Identity (MMSI)string200,000,000–799,999,999
Longitudefloat0–180°
Latitudefloat0–90°
Speed Over Ground (SOG)float0–20 KN
Course Over Ground (COG)float0–360°
True Headingfloat0–360°
Disclaimer/Publisher’s Note: The statements, opinions and data contained in all publications are solely those of the individual author(s) and contributor(s) and not of MDPI and/or the editor(s). MDPI and/or the editor(s) disclaim responsibility for any injury to people or property resulting from any ideas, methods, instructions or products referred to in the content.

