
Optimization of Berth-Tug Co-Scheduling in Container Terminals under Dual-Carbon Contexts


Transportation Engineering College, Dalian Maritime University, Dalian 116026, China
*
Author to whom correspondence should be addressed.
J. Mar. Sci. Eng. 2024, 12(4), 684; https://doi.org/10.3390/jmse12040684
Submission received: 28 March 2024
/
Revised: 15 April 2024
/
Accepted: 18 April 2024
/
Published: 21 April 2024
(This article belongs to the Special Issue Smart Seaport and Maritime Transport Management)
Abstract
:In order to address the dynamic changes in vessel preferences for berth lines caused by the deployment of shore-based power equipment in major ports and the collaborative scheduling problem of berthing and towing assistance, this paper quantifies the environmental costs of pollutants from the main engines of tugs and auxiliary engines of container ships using an environmental tax. Additionally, considering the economic costs such as vessel delay and shore power cable connection, a two-layer mixed-integer linear programming model is constructed using the task sequence mapping method. This model integrates the allocation of continuous berths at container terminals with coordinated towing scheduling for shore power selection. A solution approach is designed by combining the commercial solver (CPLEX) and the immune particle swarm optimization algorithm (IAPSO). The proposed scheme is validated using the example of the Nansha Phase IV Terminal at the Port of Guangzhou. The results show that compared to the traditional first-come-first-served and adjacent scheduling schemes, the collaborative scheduling scheme proposed in this paper reduces the total cost by 21.73%. By effectively utilizing berth resources and shore power equipment while densely arranging collaborative tasks and appropriately increasing the number of tugs, the port can convert the economic cost of leasing a small number of tugs (increased by 10.63%) into environmental benefits (decreased by 33.88%). This approach provides a reference for addressing nearshore pollution emissions in ports.
1. Introduction
As international trade experiences rapid growth and manufacturing processes become increasingly globalized, many ports are facing congestion and emissions issues. From the perspective of port operators and environmental departments, ship emissions mainly occur during ship navigation or anchorage for cargo loading and unloading processes, and this aspect of emissions deserves the most attention because these pollutants can adversely affect the health of port workers and residents in nearby port areas (Corbett et al., 2007; Eyling et al., 2010; Tang et al., 2020) [1,2,3]. In particular, when large vessels enter or leave ports, they require tug assistance due to constraints such as vessel length, draft, and berth availability (Kang et al., 2020) [4]. Therefore, to control ship speed and assist vessels in smooth berthing and departure operations, it is necessary to have tugboats tow large vessels in and out of ports or during berthing and departure maneuvers. (Paulauskas et al., 2021) [5], thereby gradually transitioning emissions during vessel entry and exit from self-propulsion to tug traction.
On the other hand, when ships are engaged in loading and unloading operations at the quayside, their auxiliary engines still produce emissions, and this portion of emissions is closer to the shore (Deniz and Durmuşoğlu, 2008) [6]. In order to reduce the impact of these emissions on the near-shore environment, the introduction of shore power equipment in the new generation of ports provides power to ships during berthing, thereby reducing emissions from auxiliary engines near the shore (Zis et al., 2014; Tseng and Pilcher, 2015; Winkel et al., 2018) [7,8,9]. Although the prevalence of shore power equipment has increased in recent years, older ships require expensive retrofitting costs for shore power equipment (Zis and Psaraftis, 2017; Arduino et al., 2011) [10,11]; furthermore, the construction of berths with attached shore power equipment represents a significant investment for port operators (Innes and Monios, 2018) [12]. Therefore, the key is how to reasonably allocate berths for arriving ships, which can more fully exploit the effectiveness of shore power equipment in reducing emissions from ships during berthing.
2. Related Works
The bottleneck of port vessel operations lies in the availability of berth and tugboat resources. Relevant research will focus on berth allocation, tugboat scheduling, and their integration, as shown in Table 1.
Traditional berth allocation problems often consider factors such as vessel stay time at the port and navigation constraints. Regarding navigation constraints, the most relevant aspect to this paper is the allocation problem of continuous berths (i.e., berths of this length segment are all available for docking). Many scholars have proposed various models and solution methods such as linear programming, mixed-integer linear programming, and others to address this specific type of berth allocation problem (Imai et al., 2005; Lee and Chen, 2009; Lee et al., 2010) [13,14,15]. In the early stages of researching berth allocation problems, the focus was primarily on ensuring that arriving vessels did not conflict with each other in terms of time and space, with relatively fewer considerations for the limitations of the port itself. Consequently, subsequent research on berth allocation incorporated considerations for restrictions on the ingress and egress channels of the port, including constraints related to one-way passage (Zhang et al., 2017; Zhang et al., 2020) [16,17]. Under this condition, it is specified that only batches of vessels are allowed to enter or exit the port within a short period of time. Additionally, some studies have taken into account restrictions that require vessels to enter or exit the port according to tidal conditions (Zhang and Zheng, 2020) [18]. Otherwise, even if a vessel arrives and there are vacant berths, it may still be unable to dock due to inadequate water depth conditions. Liu et al. [19] addressed a more practical short-term berth planning and ship scheduling problem by considering both channel restrictions (including one-way and two-way transition channels and tidal factors) and operational constraints (such as berth shifting tasks, multiple anchorages, and the alignment of berths with vessels). These studies primarily focused on deterministic problems. However, berth allocation rules at container terminals can also be affected by uncertainties. To address the contradiction between the strong planning nature of container liner transportation and the uncertainty of terminal operations, Song et al. [20] proposed an optimization model for berth scheduling considering uncertain factors. They designed a genetic embedding simulation method to form an optimization loop, aiming to solve this contradiction.
In recent years, there has been a plethora of research studies emphasizing the green development of ports, aimed at reducing vessel’s idle time to lower emissions (Li et al., 2020; Jiang et al., 2022) [21,22]. More scholars have considered the impact of new energy-saving and emission-reducing devices on berth allocation. For instance, ships equipped with shore power facilities can connect to onshore power equipment at terminals, eliminating the need for onboard auxiliary engines to supply power (Peng et al., 2021) [23]. Building upon this foundation, it is still possible to reduce pollution emissions within ports through optimized scheduling methods. For example, considering the joint allocation of shore power equipment and berths, adopting a coordinated optimization approach that balances the cost of shore power equipment usage with environmental benefits can be achieved through multi-objective genetic optimization algorithms (Min et al., 2023) [24].
Large ports increasingly employ tug escort measures as relying solely on vessels to navigate in and out has its limitations. Effective and timely scheduling of tugs to assist vessels in berthing and departure operations is crucial for improving the level of modern port services (Wei et al., 2020) [25]. Wang et al. (2012) [26] optimized and constructed a Mixed Integer planning (MIP) model, and developed a tugboat scheduling scheme based on the model. In fact, back in 2010, the author proposed an improved discrete chaotic particle swarm optimization (DPSO) method to solve the tugboat scheduling problem, aiming to minimize the total waiting time of the ship and thus maximize the efficiency. (Wang et al., 2010) [27]. These studies primarily focused on the berthing and departure stages, overlooking navigation issues during ingress and egress. If the latter is considered, the problem of scheduling tugs in multiple port areas with hundreds of task sequences becomes complex. Hence, Sun et al. [28] proposed an improved genetic algorithm based on reverse operations (GA-RE) to solve dynamic tugboat scheduling problems. Most of the above studies deal with deterministic problems. Li et al. (2021) [29] introduced a whale genetic algorithm to address uncertainty in multi-tugboat base tasks, solving scheduling problems under different confidence levels, validating the applicability of fuzzy planning, and demonstrating the feasibility of hybrid algorithms.
Towing vessels consume a significant amount of fuel and emit a large quantity of pollutants (Lou et al., 2017) [30], posing not only environmental concerns but also contributing to energy wastage. Therefore, while considering the timeliness of tugboat scheduling, environmental protection has also been integrated into research objectives. For example, the shortest time for ships in port and the shortest distance for tugboats are targeted to reduce the production of pollutants (Dong et al., 2012; Zhong et al., 2022) [31,32]. Furthermore, the fuel consumption of tugboats per unit time is related to their horsepower type and sailing speed. Thus, distinguishing between different operating modes of tugboats is crucial for accurately calculating fuel consumption (Chen et al., 2021) [33]. Aiming at the problem of river–sea combined transport, Zhu et al. [34] proposed a mixed-integer programming (MIP) model to jointly optimize the tugboat transport route considering barge transport and designed a variable neighborhood search (VNS) algorithm with the goal of minimizing the sum of carbon emissions from barge loading and unloading, tugboat running, and waiting. The results showed that the optimal difference of the VNS algorithm was 0.29%. The proposed model reduces carbon emissions by 46.93%. When the number of tugboats in the same port area is insufficient, some tugboats repeatedly move between multiple bases to assist vessels, resulting in slower sailing speeds and increased fuel consumption. The economic losses caused by ship oil pollution are substantial. The aforementioned studies mainly employ single tugboat operations that comply with horsepower standards. However, the approach utilized in this study involves a collaborative operation mode with varying quantities of tugboats of the same model. This method is closer to the multi-unit collaborative task allocation problem (Zhong et al., 2023) [35]. It aims to improve port service levels and reduce operating costs for tugboat companies by addressing the scheduling problem of multiple tugboats operating across different areas. Specifically, the focus lies in balancing completion time and fuel consumption during the tugboat scheduling process across operational areas. To achieve this, a hybrid integer programming approach for multi-objective optimization of tugboat operations has been proposed. If there are multiple tugboat bases and incoming vessels exhibit temporal uncertainties, the tugboat scheduling problem becomes increasingly intricate. Consequently, Li and Chen (2023) [36] proposed a fuzzy optimization model to incorporate uncertainties in task timing and location, with the objective of minimizing fuel and delay costs. They developed a Grey Wolf Optimization algorithm tailored to this model and compared its performance against solvers and traditional particle swarm methods, demonstrating its superiority. This approach effectively balances the environmental costs of tugboat operations with operational efficiency in fuzzy scheduling contexts.
In the realm of effectively integrating berth allocation with tugboat scheduling, Ilati et al. [37] proposed an optimization method based on simulation. Their aim was to construct an approach closely resembling an optimal berth allocation plan, combined with tugboat scheduling, to address the problem of reassigning dock cranes. They considered the uncertainty of vessel arrival times and incorporated tidal variations into their considerations. Through testing the proposed evolutionary algorithm on the RAJAEE port as a real-world case, they successfully validated the feasibility of the model and the superiority of the algorithm. On another front, Omar et al. [38] devised a mixed-integer programming (MIP) model and employed a precise solution method based on constraint separation to tackle berth operations with navigation and tugboat constraints under channel restrictions. Their solution method started from initial solutions obtained via heuristic algorithms. Subsequently, they incorporated the separated constraints into the relaxed model of the MIP formulation and updated the boundaries until the optimal solution was found. Through real-world cases and simulation experiments, they compared this model with the traditional first-come-first-served (FCFS) strategy used in ship scheduling. The results indicated that their method significantly optimized the tugboat-assisted berthing system at container terminals during port congestion periods.
In conclusion, to address the berth allocation and tug scheduling issues related to continuous berths and multi-tug base auxiliary operations in container terminals, this study, based on existing research, considers the impact of shore power equipment usage on ship berthing positions and sequences. It establishes a dual-layer berth-tug collaborative scheduling model that is more in line with actual conditions, taking into account the economic costs of tug leasing and ship delays, as well as the environmental impacts caused by ships in the port area. The model is solved using CPLEX combined with immune particle swarm optimization. Numerical experiments demonstrate that the proposed model provides more reasonable berth and tug collaborative scheduling solutions, which can offer valuable insights for port operators in addressing port congestion and emission control effectively.
3. Problem Description and Formulation
3.1. Problem Description
This paper addresses the berth allocation and tug scheduling problem in a continuous berth container terminal with a fixed number of shore power facilities and auxiliary operations involving multiple tug bases. The problem involves several key processes:
(1) Port Vessel Operations Flow
Upon the vessel’s arrival at the port, it must wait for an available berth line assisted by tugs to start its operation. Conversely, if the conditions are not met, the vessel will continue to wait at anchor. After completing the operation, the vessel departs from the port with tug assistance. To achieve environmental benefits in the port area, vessels meeting the conditions after berthing can seek the nearest shore power for cable connection.
(2) Source and Quantification of Pollutants
Using shipboard auxiliary engines and tugboat main engines generates pollution, and its costs are complex, including sulfur compounds, nitrogen compounds, particulate matter, and more (Zis et al., 2019) [39]. Borrowing from Peng et al., 2017 [40], this paper quantifies different pollutants as economic penalties through environmental taxation, which is then regarded as a quantitative indicator of environmental benefits. By adopting this approach to measure pollutant emissions, it can be further delineated into two parts: tugboats and arriving vessels.
I. The pollutant emissions from tugs can be described by the following expression:
In the formula, represents the type of pollutants; represents the conversion rate of pollutants to diesel (kg/kg); is the consumption rate of tugboat main engine diesel (kg/); is the power of the tugboat main engine (); and is the working duration of the tugboat (h).
II. For container ships using shore power equipment, only the pollutant emissions during the anchorage waiting process are considered and can be described by the following expression:
① When using shore power
② When not using shore power
In the formula, \ are as above, represents the auxiliary engine diesel consumption rate of container ships (kg/), represents the main engine power of container ships (), represents the total duration for berthing and container handling operations (h), and represents the duration of anchorage waiting (h).
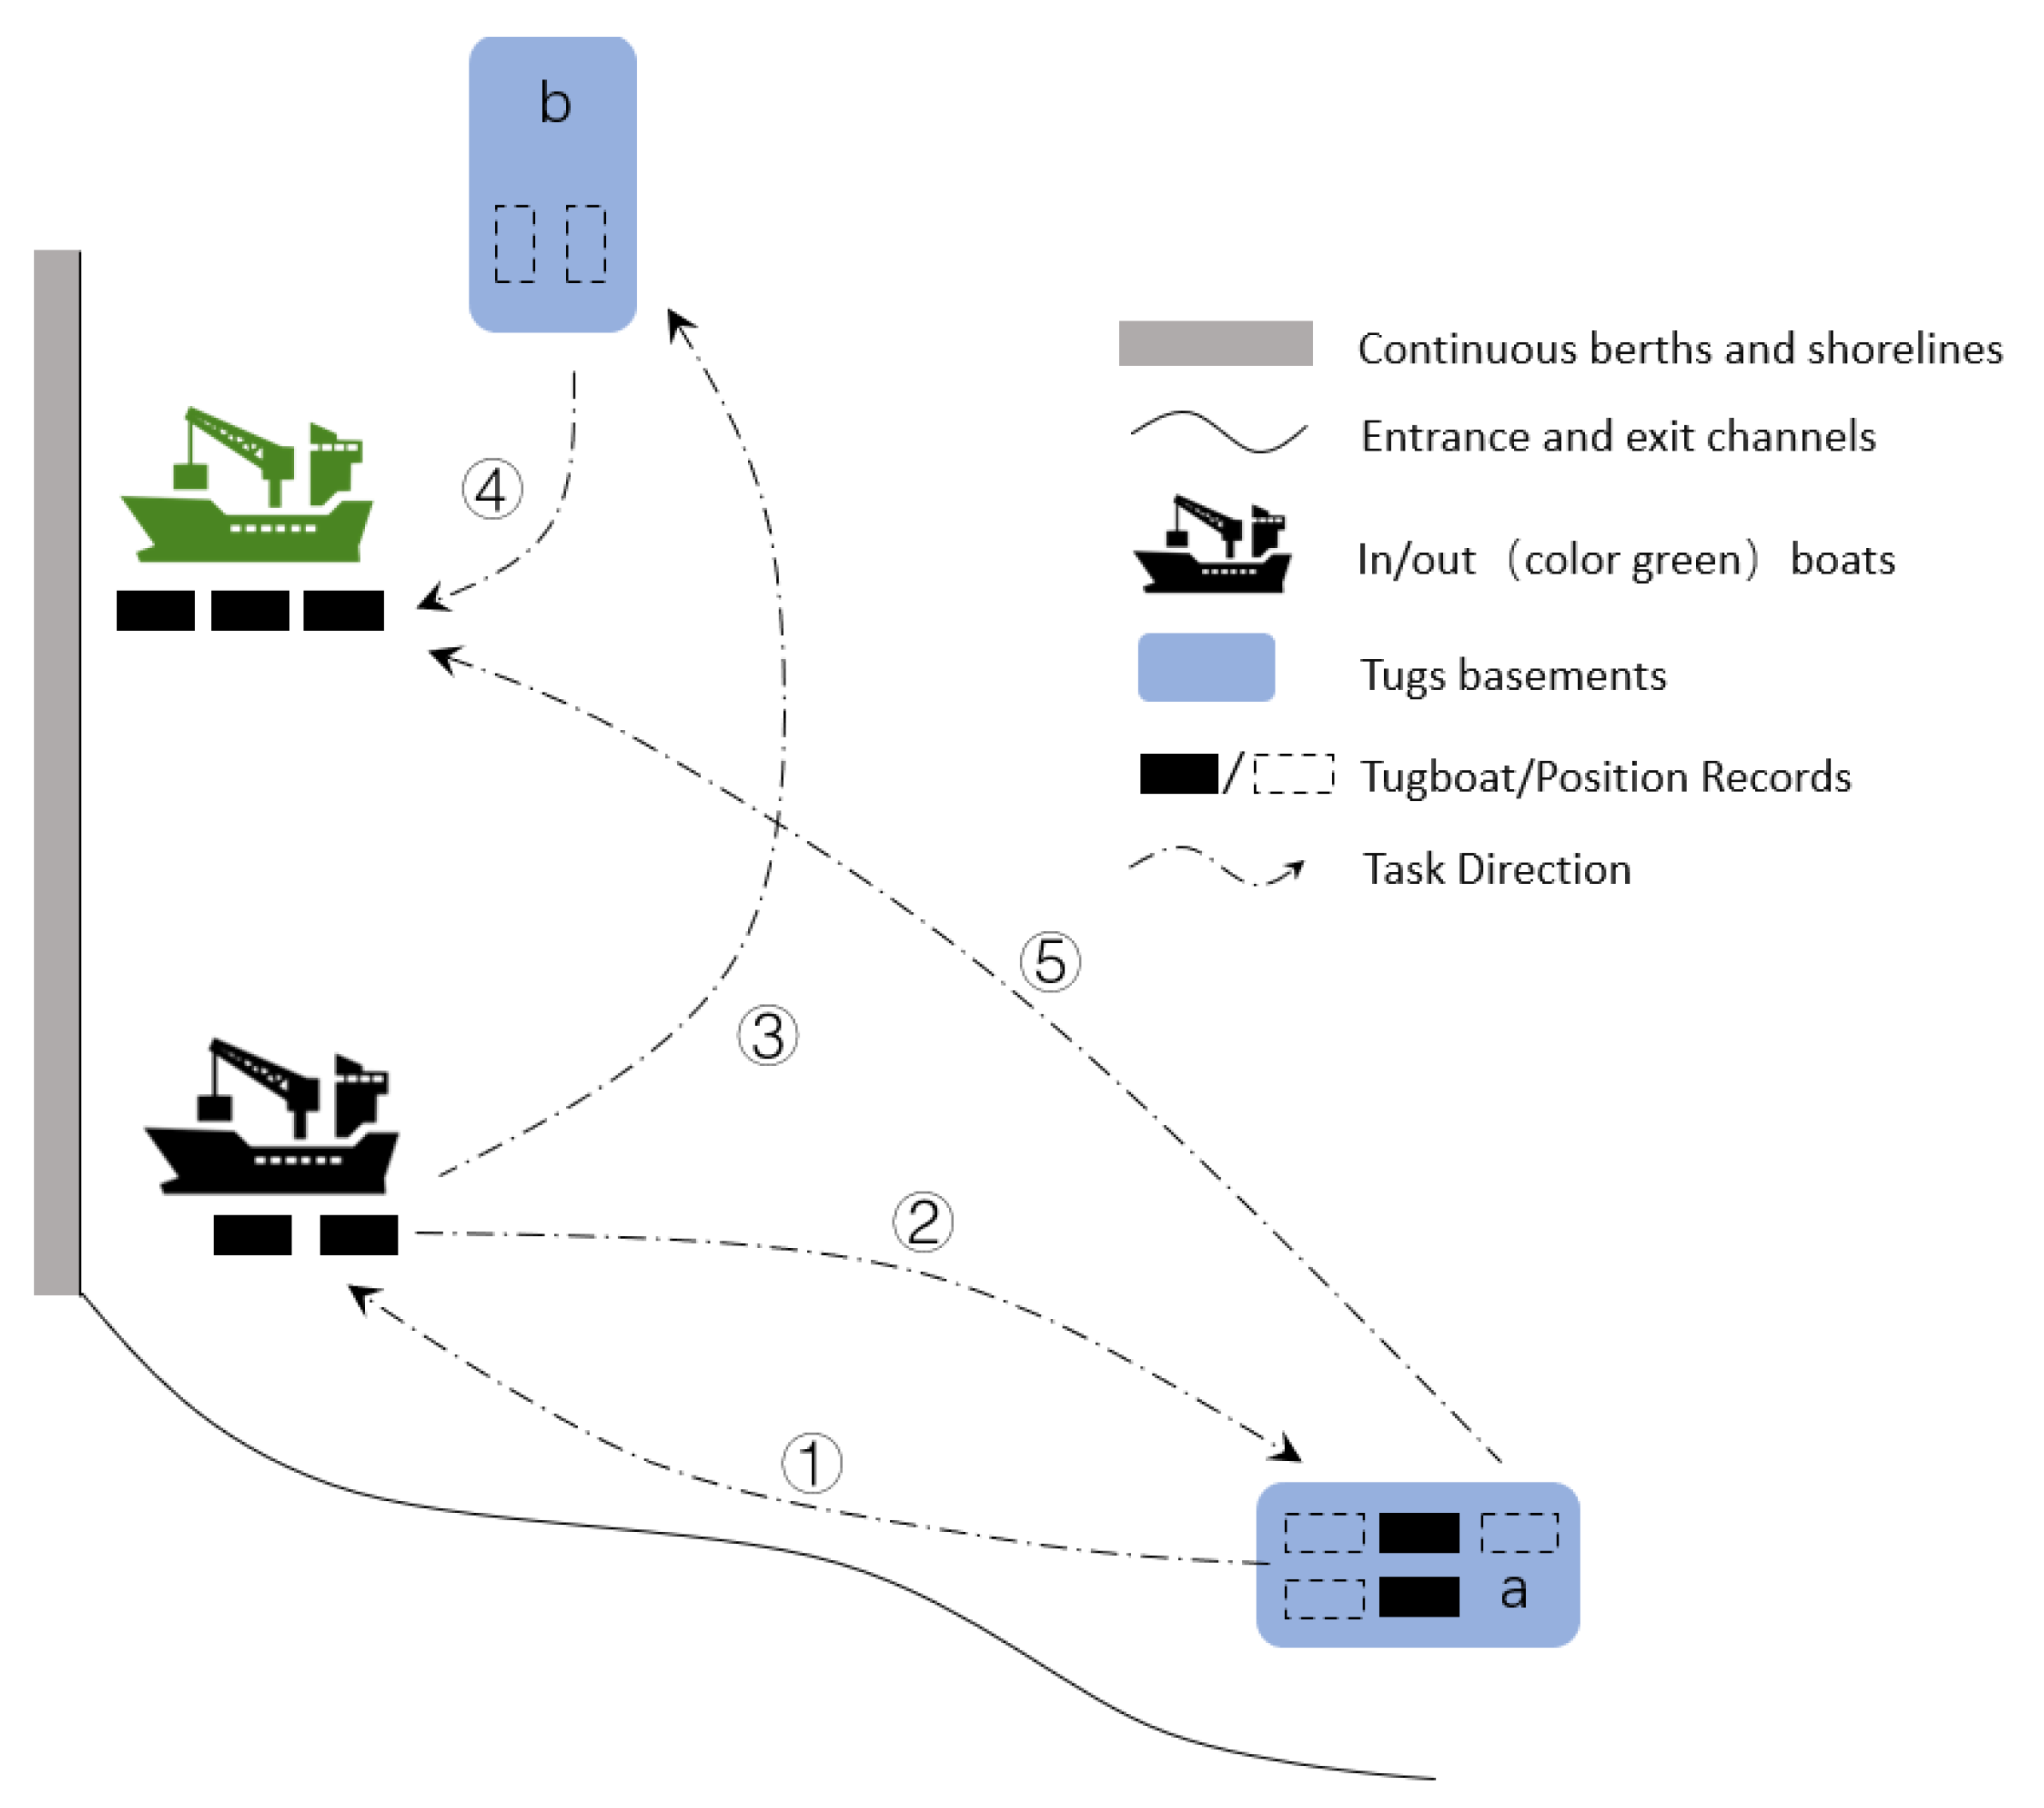
As depicted in Figure 1, tugs operate from the base at the entrance of the channel (denoted as point “a”). They can tow the black vessel into the port and out of the port, and when the green vessel needs to depart, the tug engages in the operation (①-②-⑤). Alternatively, after completing the inbound operation, the tug can directly proceed to the end base at the berth (denoted as point “b”) to continue with the outbound task for the green vessel (①-③-④). Additionally, tug operations may involve reallocation between bases “a” and “b”.
In summary, this paper aims to investigate the reasonable allocation of berthing positions and shore power usage based on the known arrival schedule of vessels. This allocation is performed considering the different auxiliary engine powers of arriving vessels. Furthermore, the goal is to assign a sufficient number of tugs for each vessel to complete inbound, outbound, berthing, and departure tasks between the two bases. The objective is to minimize the overall environmental and economic costs for the entire process.
3.2. Model Construction
To comprehensively consider the environmental benefits of vessel shore power usage, tug reduction in round-trip navigation, as well as the economic benefits of reducing vessel delay costs and manual cable connection costs, and to address the berth allocation and dual-base tug scheduling problem, this paper converts environmental impacts into economic indicators for calculation and constructs a two-layer mixed-integer linear programming model. The first layer deals with berth allocation and vessel entry and exit modeling, while the second layer focuses on tug scheduling. The main challenge in constructing the two-layer model lies in how to connect the different layers. In this paper, parameter mapping is employed. Specifically, the arrival time of vessels in the first layer is mapped to the start time of inbound tasks in the second layer. Similarly, the departure time of vessels in the first layer is mapped to the start time of outbound tasks in the second layer. The berthing position of vessels in the first layer is mapped to the end position of inbound tasks and the start position of outbound tasks in the second layer. Additionally, the entry and exit positions of vessels in the first layer are mapped to the start and end positions of inbound and outbound tasks in the second layer, respectively. Based on these mapping rules, a two-layer mixed-integer linear programming model is constructed.
Here are five assumptions:
- The terminal uses tugs of the same model, and their fuel consumption and emissions are equal.
- The inbound and outbound channels are bidirectional and have sufficient depth, so vessels arriving at the terminal do not need to consider whether they can enter or leave the port during the current period.
- All berthing vessels dock against the current.
- The power of a single shore power facility is sufficient to supply power to any berthed vessel for its own use.
- The emissions from the auxiliary engines of vessels waiting for cable connection during shore power usage are not considered.
3.3. First-Layer Vessel Entry and Exit Scheduling with Berth Allocation Model
The first-layer model addresses the scheduling of vessel entry and exit times, berth allocation, and the decision of whether to use shore power. Considering the sequence of vessels, some vessels are prioritized for early entry into the port with shore power connection to reduce emissions during waiting at anchor and operational activities. The environmental costs associated with this portion are then transformed into economic indicators. Traditional economic indicators, such as delay costs and manual connection costs, are also considered in the joint calculation.
Objective Function (4) represents the summation of environmental costs incurred by pollutant emissions from the main engines of vessels using tugs within the berth range, pollutant emissions from the auxiliary engines of vessels during berthing operations and laying at anchor, delay costs for vessels, and shore power connection service costs. Equation (5) ensures that for any vessel, there must be a moment during the entire period when inbound, outbound, berthing, and departure actions are completed. Equation (6) assigns values to the actual inbound time, actual outbound time, actual berthing time, and actual departure time for vessels. Equation (7) mandates that for any vessel, a bow berthing point must be selected during the entire period. Equation (8) assigns values to the bow berthing points for vessels. Constraint (9) restricts the berthing of vessels to not exceed the length of the berth. Constraint (10) signifies that only vessels equipped with shore power can choose to connect to shore power. Equation (11) asserts that vessels opting to connect to shore power must select a shore power facility. Equation (12) assigns values to the numbering of selected shore power connections. Constraint (13) ensures that the actual inbound time for vessels must be later than the estimated arrival time, and the actual berthing time must be later than the sum of the actual inbound time, inbound towage time, and assisted berthing time. Constraint (14) stipulates that the start of the departure time for vessels must be calculated after the completion of loading and unloading and departure. Equation (15) assigns values to the actual departure time for vessels. Constraint (16) prohibits conflicts between vessels berthed at the same berth at the same time. Constraint (17) prohibits conflicts between vessels using shore power at the same time. Equation (18) represents the environmental cost incurred by vessels at anchor, using auxiliary engines. Equation (19) represents the environmental cost incurred by vessels during berthing operations, resulting from the operation of their own auxiliary engines. If shore power is used, the cost is zero. Equation (20) represents the sum of delay costs for vessels and shore power connection service costs. Regarding , these variables are binary (0–1) variables, and each subscript is explained based on the corresponding set through the associated symbols.
3.4. Second-Layer Tug Scheduling Model
The primary focus of the second-layer model is to efficiently schedule a fixed number of tugs, minimizing unnecessary travel distances to reduce pollutant emissions. Leveraging the results from the first layer, including vessel arrival times, departure times, and assigned berths, the tug servicing process for each vessel can be regarded as two tasks: inbound berthing and outbound departure tasks. With m arriving vessels implying 2 m tasks with established sequencing, the second-layer problem can thus be transformed into a multi-unit collaborative task assignment problem with fixed time windows. Building upon this transformation, the second-layer model is developed.
The objective function (21) can be divided into three parts: the first part represents the sailing cost incurred by the tug when traveling from the base to the task’s starting position, the second part represents the sailing cost during the tug’s task operation (i.e., towing the vessel), and the third part accounts for the sailing cost of the tug returning to the base after completing the task. Constraint (22) stipulates that each task must be assigned the necessary number of tugs. If an initial base is pre-assigned for each tug, variable can obtain initial values and, simultaneously, variable is set to 0, representing the initialization of the tug, placing it in an idle state. Constraint (23) indicates that tug is currently at base , and the auxiliary variable will be set to 1 only when the tug is heading to the starting position of task . Constraint (24) signifies that when tug chooses to return to base after completing task , the auxiliary variable will be set to 1. Constraint (25) states that all tugs determining the execution sequence of the first task must arrive at the starting location of the task before it begins. Constraints (26) and (27) indicate that if a tug chooses task , it incurs a busy time ; if it does not choose the task , it continues to maintain the value from the previous task. Constraint (28) specifies that only when task starts, the tug is not in a busy time period, and the tug can choose to complete the task. Constraint (29) states that tug can only choose the next task after completing the previous one. Constraint (30) signifies that a tug can only choose to dock at one base after completing a task. Constraint (31) indicates that if a tug chooses not to complete the current task, it will continue to stay at the tug base chosen after completing the previous task. The variables are binary (0 or 1), and each subscript is explained based on the corresponding set through the associated symbols.
4. Algorithm Design
Considering that both layers of the model are mixed-integer linear programming models, commercial solvers (such as Cplex, Gurobi, CAMS, etc.) can be employed for solving. Based on the data provided by the Shanghai Shipping Research Center, the ship data for major container ports globally from 2021–2022, the average daily number of vessels waiting at Chinese major container ports (Shanghai Port, Ningbo-Zhoushan Port, Qingdao Port, and Shenzhen Port) was maintained between 24 and 45, with these ports sharing 3–4 terminal phases and dedicated berths. Therefore, for a specific continuous berth, the daily average waiting quantity is set at 9 vessel shifts, already at a relatively high level. It can be observed that the optimization object quantity for the first layer is relatively small, allowing for the utilization of commercial solvers to obtain an exact solution to the initial berthing problem. This solution can then be transformed into a set of tasks with fixed time window constraints for input into the second layer. In comparison to the first layer, the multi-unit collaborative task allocation problem in the second layer, as a typical NP-hard problem, involves a wait for the completion of twice the number of arriving vessels in the first layer. Additionally, the optimization object, namely the number of tugs, is more substantial. Therefore, for solving the second layer, heuristic algorithms have advantages in addressing multi-unit collaborative task allocation problems.
In the process of global search, particle swarm optimization exhibits a certain degree of randomness in selecting its movement directions. By introducing immune algorithms and incorporating a certain level of intervention during the process of particles’ flight and search for the optimal solution, we aim to maintain the rapid convergence characteristics of particle swarm optimization while increasing the diversity of particles to escape local optima, thereby enhancing the efficiency of the algorithm.
The immune system of organisms produces antibodies against specific antigens when invaded by viruses, and these antibodies possess memory during the organism’s subsequent survival. The immune variation-based particle swarm algorithm treats the problem to be solved as an antigen, where each particle in the population can be seen as an antibody generated by differentiated lymphocytes. Antibodies have adaptability to antigens, and those with higher adaptability are encouraged. Following this immune process, the concentration of antibodies matching the antigen will increase. However, to prevent antigen variation, the proportion of similar antibodies to the total number, termed concentration, will suppress antibody categories with higher concentrations. This prompts the generation of new antibodies to escape local searches and discover new antibodies with higher adaptability. Therefore, the immune initiation condition in this paper is set to initiate immunity if there exist DS individuals in the population with the same optimal fitness.
Particle mutation in the immune strategy adopts a roulette wheel selection mechanism, where the cumulative probability of mutation is mainly influenced by two parameters: concentration and stimulation. Concentration calculation requires knowledge of the number of similar particles in the population, which is approximated by the fitness similarity measurement. If the difference in fitness functions of different particles is less than a small, predetermined value, then they are considered similar, and the count increases by 1. Particle concentration is the ratio of the count of each type of similar particle to the total number of particles, with higher concentrations indicating a greater degree of similarity. Stimulation can be interpreted as the proportion of fitness of each particle to the total fitness of the entire particle swarm. Therefore, if the goal is to maximize the objective function, higher fitness leads to higher stimulation, making it easier for superior particles to be retained. In this paper, since the objective is to minimize the objective function, higher stimulation indicates lower-quality particles, which are more easily replaced by mutations. Introducing the random parameter , if the mutation probability = particle concentration particle concentration mutation factor, then the particle will undergo a mutation operation. Considering the characteristics of particle encoding in binary (0–1), the mutation operation employs a strategy of randomly selecting dimensions to invert. Specifically, all dimensions of the particle are assigned random integer values, and if the value at a particular dimension is 1, it is changed to 0, and vice versa.
Based on the immune particle swarm algorithm, this paper has designed an encoding scheme, a mutation operator for particles, and adopted the concept of event modeling to formulate fitness and optimal particle selection.
Particle Encoding: In this paper, a 2D matrix is generated as the particle encoding, where has rows representing the “task” sequence, and has columns representing the “tug” sequence. The matrix elements are binary variables, indicating the base number where tug needs to stop after the task event concludes. Here, “0” represents the base near the starting point of the continuous berth, and “1” represents the base near the end point of the continuous berth. Simultaneously, the initial tugs are set to all be located at base “0”.
An additional 0–1 variable is assigned to each task to differentiate whether the task is an “arrival task” (additional attribute is 0) or a “departure task” (additional attribute is 1). The fundamental reason for assigning this value is that tugs travel different distances. Tugs completing arrival tasks must first reach the starting point of the berth to pick up the arriving vessel before they can continue their operations. In contrast, tugs completing departure tasks must first reach the berthing position and deliver the vessel to the starting point before they can continue their operations.
Concrete examples are shown in Table 2, where a total of 9 tugs are responsible for completing the 6 tasks generated in the first column. The first three tasks serve as inbound tasks, while the next three serve as outbound tasks. The first row indicates the base numbers where each of the 9 tugs should stay after completing Task 1. For example, Tugs 5 and 6 choose to go to Base ‘1’ after completing Task 1, while the remaining tugs stay at their original bases. The second row shows that Tugs 1, 3, and 4 are responsible for completing Task 2 and choose to go to Base ‘1’. Tugs 5 and 6, which completed the previous task, continue to stay at Base ‘1’. The same logic applies to Tasks 3–6. It is worth noting that Tugs 7–9 are not involved in the scheduling, representing redundancy in the system.
Fitness and Optimal Particle Selection: Calculate the matching status of tugs–tasks–bases represented by each particle using the objective function as the fitness function. Evaluate the sailing costs during the numerical simulation period. Each generation of particles saves individual and population optima, choosing the particle with the smallest fitness function value as the optimal particle and recording the current particle’s path selection. Historical optimal solutions are obtained after a certain number of iterations.
5. Numerical Experiments and Results
This study focuses on a segment of continuous berths at the Nansha Phase IV Terminal of the Port of Guangzhou. Given that vessels below 200,000 tons meet the conditions for bidirectional navigation in the channel, this study does not consider channel restrictions for vessels entering or leaving the port. Taking the location of Tug Base A as the origin, with vessels beginning their inbound journey or completing their outbound journey at this point, the pilotage length for inbound and outbound vessels is approximately 3 km, the shoreline length is 1 km, and Base B is 2 km from the end of the shoreline. Additionally, according to Guangzhou Port’s regulations on the use of tugs for assisted inbound and outbound navigation, vessels below 80 m in length do not use tugs, those between 80 m and less than 120 m use one tug, those between 120 m and less than 230 m use two tugs, and those above 230 m use three tugs.
5.1. Calculation of Environmental Cost Coefficients
Before solving the case using the two-tier model, it is necessary to obtain the cost coefficients for relevant pollutant emissions. The study adopts the pollutant equivalence generated based on engine unit power consumption, as provided by PENG [9]. The load factor for auxiliary engines is set at 0.5, and the diesel consumption rate is set at 0.211 kg/kWh. Therefore, using an engine with a rated power of 1000 kW, the diesel consumption is 105.5 kg per hour, resulting in an environmental cost of EUR 247.64/h. Other power engines are proportionally converted based on this base rate.
5.2. Calculation of Vessel-Side Costs
The typical cable model for vessel shore power is 3 × 95 + 1 × 25 + 4 × 2.5. The cost of connecting the cable is generally around EUR 4.46/m. Additionally, it is assumed that if a vessel delays in the port, a fine equivalent to 20% of the standard daily charter rate will be charged as a penalty for vessel delay. The daily charter rates for container ships around 200 m in length (2021–2022), such as “YM Unity” by Taoheng Shipping, “MOL Triumph” by Mitsubishi Ore Transport, and “APL Singapura” by Singapore Alpha Shipping, are around USD 11,000 per day. Therefore, the delay cost is generally set at EUR 82.83/h, adjusted based on the fluctuation in vessel length without compromising reliability. Specific vessel data, with time units of 0.5 h, indicate that each vessel can complete inbound or outbound actions in 2 units of time and docking or undocking actions in 1 unit of time, with power being the sum of relevant onboard equipment, as shown in Table 3.
5.3. Berth Allocation Calculation Results
The calculations were performed using CPLEX (IBM ILOG CPLEX Optimization Studio version:12.6.3.0) on a computer with a Windows 10 operating system, Intel Core i7-7700HQ CPU(Produced by Intel Corporation, USA, purchased from Dalian, Liaoning Province, China), and 16GB DDR4 memory(Divided into two 8GB memory, originally produced by Kingston, USA, purchased in Dalian, Liaoning Province in 2018 and 2021 respectively). The generated optimal berth allocation Gantt chart is illustrated in Figure 2. Vessels choosing shore power connections are color-coded, with the selected shore power numbers marked in the top right corner. Vessels selecting the same shore power port have the same color designation. The berth space restriction requires adjacent vessels to maintain a 30 m space, and this length is included in the calculation of the vessel’s effective length. During plotting, this portion is excluded.
According to the solution strategy outlined in this paper, it is necessary to convert the berth allocation plan into a sequence of tasks. The parameters of the transformed tasks are presented in Table 4, where Task 1 and Task 5 correspond to the entry and exit tasks of Vessel 1, Task 2 and Task 9 correspond to the entry and exit tasks of Vessel 2, and the remaining tasks are transformed similarly, sorted in ascending order based on their start times.
5.4. Tug Dispatch Results and Analysis
If a sufficient number of tugs equipped with two 1980 kW main engines are provided throughout the entire period, with an average speed of 2 knots during the task cycle for towing operations and auxiliary berthing or departure operations, the total estimated time is 3 h. Considering different states of tug unit distance travel costs and applying weighted averages, the unit travel distance fuel and environmental costs are set at EUR 0.26/m. Testing with 20 tugs can be considered sufficient. In this case, the parameters for the immune particle swarm algorithm are set with a population of 50 particles, 100 iterations, an inertia weight of 0.3, learning factors of 1.9 and 1.5, an immune startup generation of 5, and a mutation factor of 0.33. This was tested using CPLEX and the immune particle swarm algorithm in MATLAB 2018a in the same environment, resulting in identical solutions, referred to as Solution 1 and Solution 2, respectively. Both scheduling solutions achieve a minimum cost of tug travel at EUR 112,106.54. Solution 1 utilizes all available tugs, while Solution 2 selectively searches for available tugs in sequential order. Thus, Solution 2 (using the immune particle swarm algorithm) suggests that an optimal scheduling plan can be achieved with only 15 tugs. However, this tug quantity does not account for its leasing cost. The difference between the given sufficient tug quantity and the minimum required for optimal scheduling is termed the absolute redundancy.
When considering different states of tug unit distance travel costs, the unit travel distance fuel and environmental costs are set at EUR 0.26/m. Additionally, considering the common practice of tug outsourcing at current ports, leasing one tug similar to the case study typically costs EUR 25,487.45/month. If the simulation period is 105 h, and tugs leased for any time within this period incur leasing charges, the leasing cost per tug for the period is EUR 3716.92. Adding tug leasing costs to the calculation, it becomes apparent that the port may choose to increase the number of tug round trips and unnecessary transportation distance to reduce the number of leased tugs. Therefore, in cases where there is no absolute redundancy in tug quantity, two methods are used to calculate port tug operation costs, as shown in Table 5. CPLEX’s computation is given a maximum of 1000 s; if exceeded, the current dependable value is chosen. The immune particle swarm algorithm result is the minimum of five runs. It is observed that the port cost is minimized when leasing 11 tugs. If this value is considered the optimal leasing quantity, the relative redundancy quantity of tugs within the period can be expressed as the difference between the absolute redundancy quantity and the optimal leasing quantity.
Additionally, according to Table 5, if the current available tug quantity is in a state of absolute redundancy, the most direct tug dispatch plan is for the tugs completing entry tasks to dock at Base B (i.e., the base on the side of the terminal end of the shore). As subsequent exit tasks arrive, tugs choose to complete the exit tasks and return to Base A (i.e., the base on the side of the entrance to the waterway). Once the available tug quantity drops from absolute redundancy to relative redundancy, tugs will inevitably make round trips, resulting in unnecessary transportation distance. At the same time, CPLEX’s computational logic cannot provide the optimal solution in a short time and becomes dramatically more difficult as relative redundancy decreases. The immune particle swarm algorithm (IAPSO) consistently provides the optimal solution in a short time. As the relative redundancy decreases, although the error in the solution increases, it always remains within 1.5%. When the relative redundancy decreases, its computation time shows the opposite trend to that of CPLEX due to the reduction in data dimensions.
To further verify the benefits of immune operations for the particle swarm algorithm, a vertical comparison was made between the IAPSO and traditional PSO. The tug scheduling for the optimal leasing quantity in the case study was specifically addressed, as shown in Figure 3, which illustrates the particle evolution iteration curve. Solely in terms of convergence speed, the traditional PSO achieves convergence after 20 generations of particles, showing a clear advantage over the IAPSO, which converges by the fiftieth generation. However, the IAPSO continuously breaks out of local optimal solutions, ultimately obtaining a more superior solution compared to the traditional PSO. Figure 3 additionally compares the second population whale genetic optimization algorithm (SPWOGA) used by Li et al. [28], which can also obtain optimal solutions within a specified number of iterations but converges slower than the IAPSO. The reason for this lies in the immune algorithm’s motivational operations providing better evolutionary directions for particles.
Figure 4 presents the tug scheduling solution for this satisfactory solution. Taking Tug 2 completing Tasks 5 and 8 as an example, the main blocks are color-coded to distinguish entry and exit tasks. Therefore, Task 5 is an exit task, and Task 8 is an entry task. The smaller blocks before the main block represent which base the tug comes from to pick up the task. Light yellow represents Base A, and light green represents Base B. Hence, for Task 5, Tug 2 departs from Base B to pick up the exit task, with the exit location matching Base A’s position, so no smaller block is added after the main block. Similarly, for Task 8, being an entry task with the entry location matching Base A’s position, no smaller block is added before the main block. However, after completing the entry task for Task 8, Tug 2 chooses to return to Base A, adding a light yellow block after the main block. The width of the blocks represents the duration of the respective process.
Comparing this collaborative scheduling solution with the traditional first-come-first-served approach for vessels, tugs prioritize the nearest base for docking upon completing tasks along the shoreline (as shown in Figure 5).
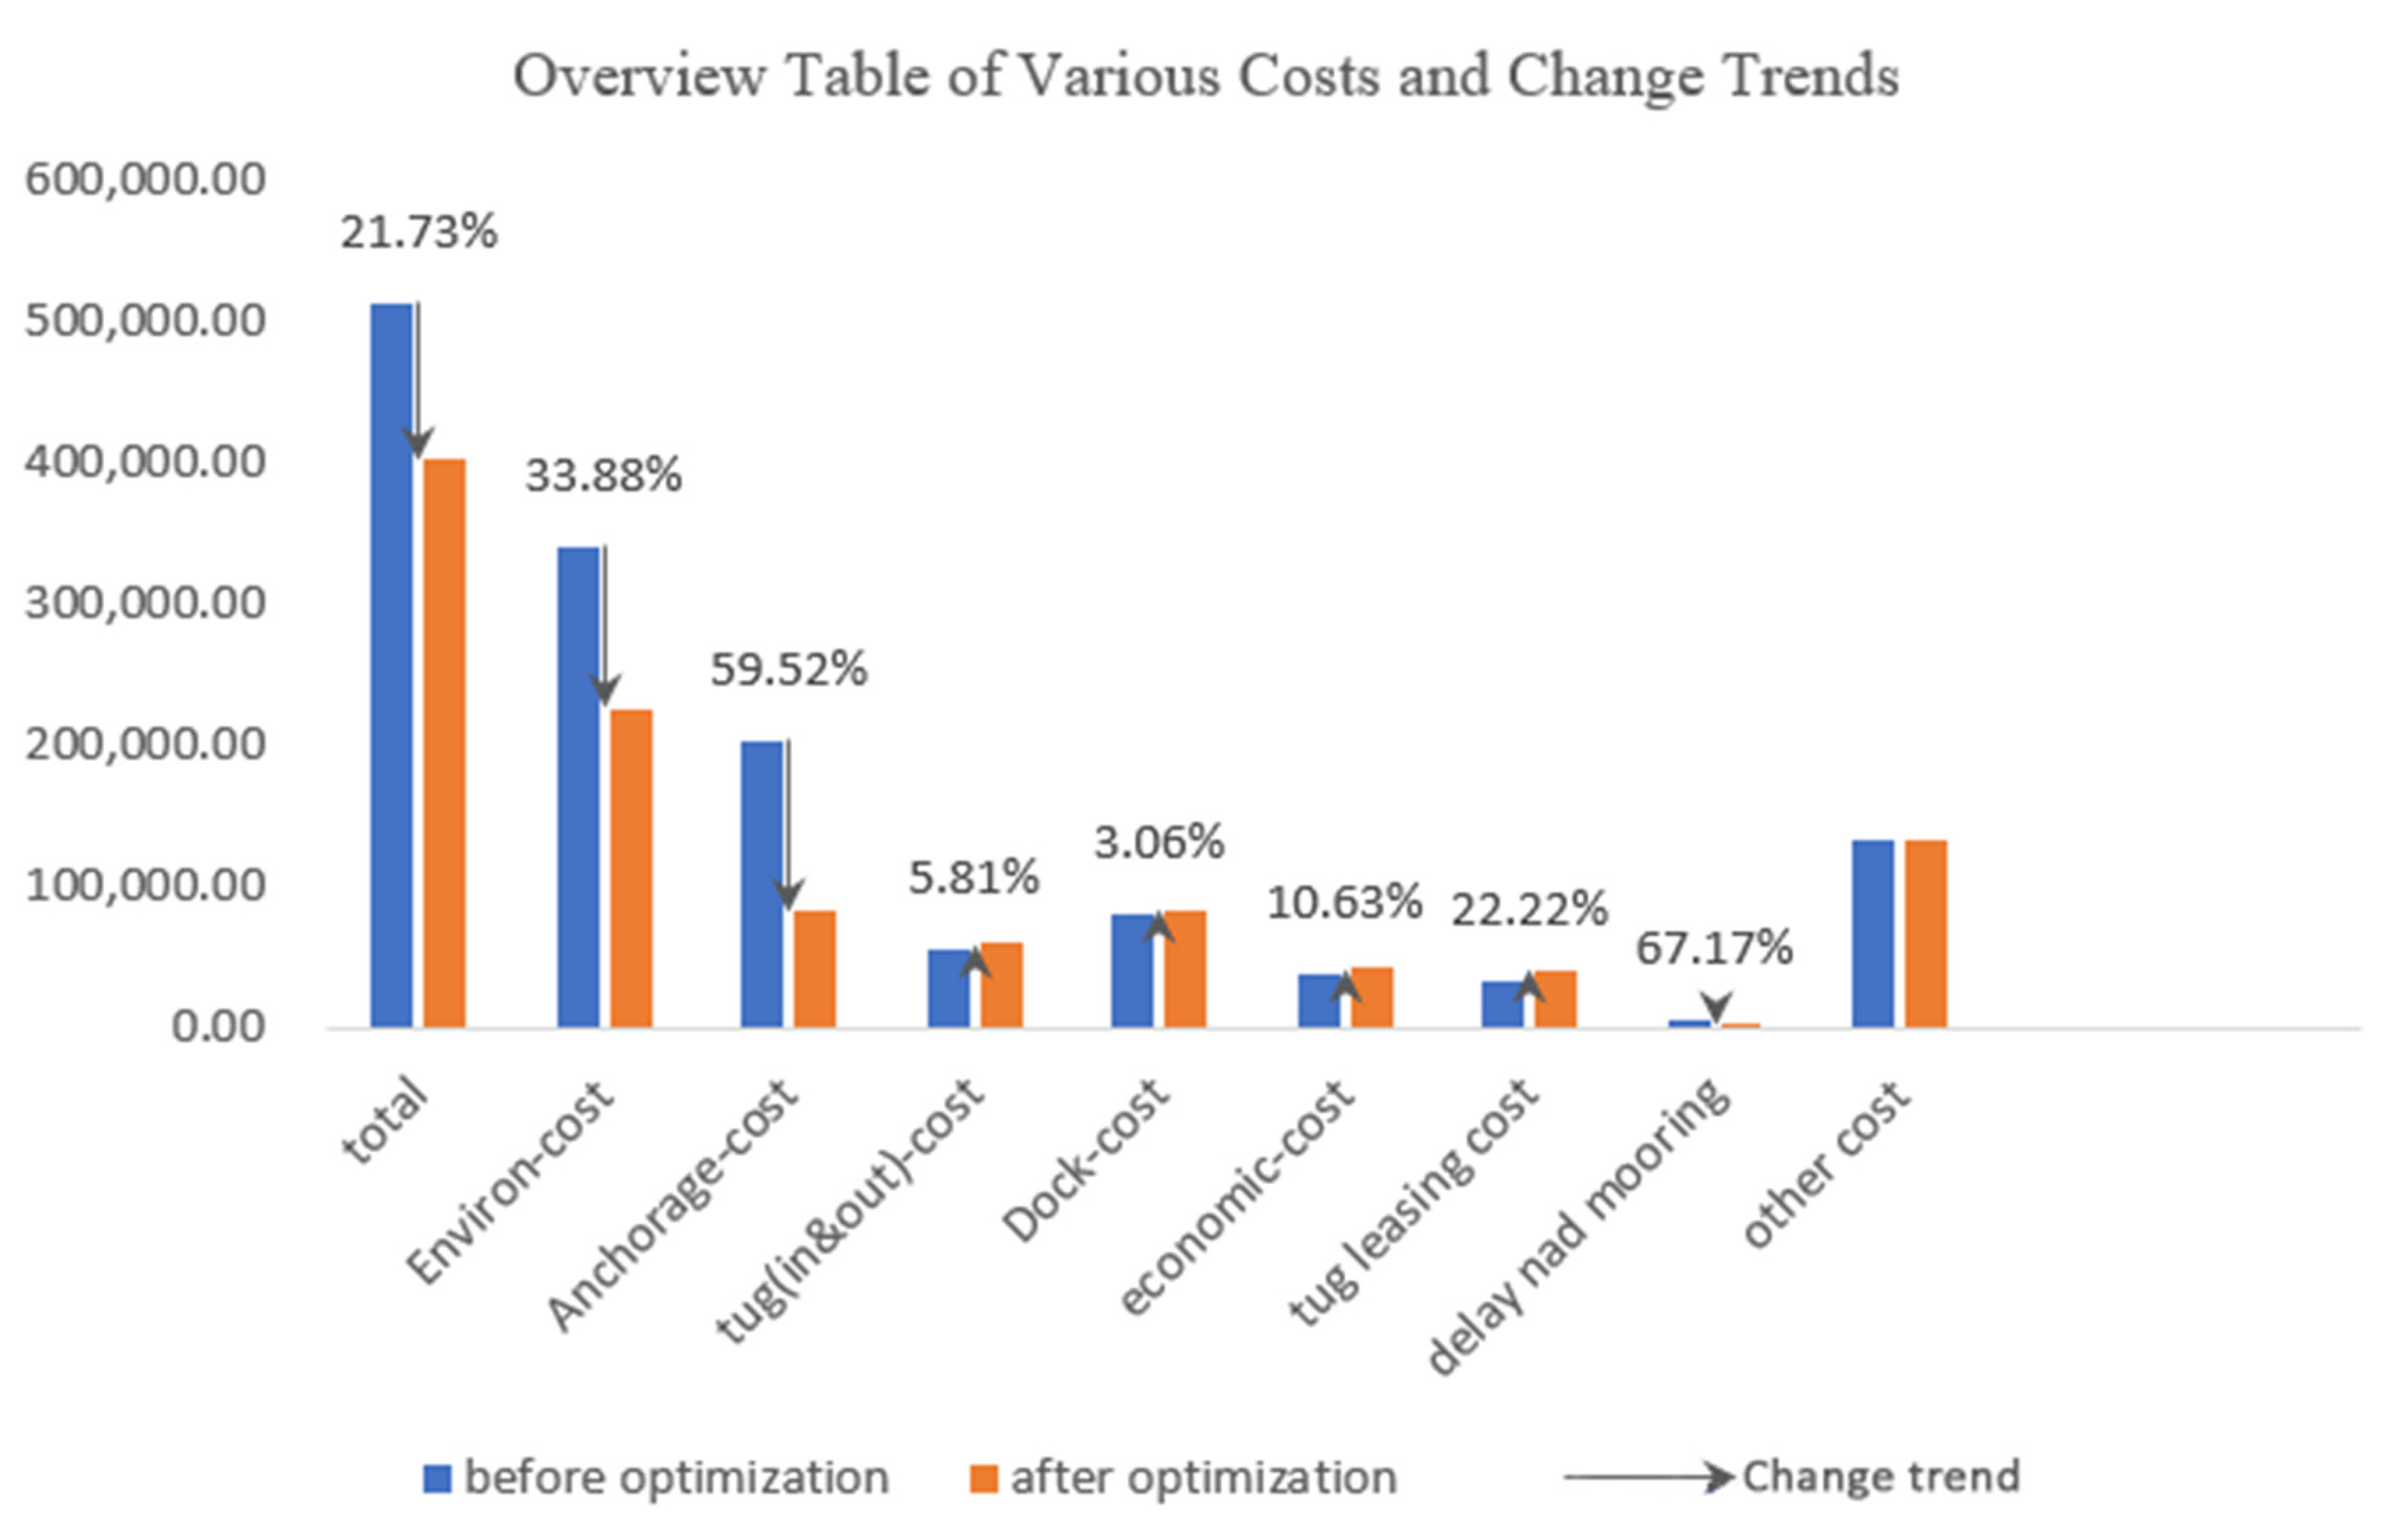
In comparison with the scheduling solution proposed in this paper, the traditional scheduling approach incurs an additional simulation duration of 15 h, resulting in a total cost increase of CMB 869,278.39, representing a 21.73% increase. Analyzing various cost data (Table 6) and the proportions, as well as the trends in changes (Figure 6), the following observations can be made: before and after optimization, environmental costs account for a significant proportion of the total costs, specifically 66.51% before optimization and 56.19% after optimization. Additionally, the post-optimization environmental cost decreases by 33.88%, attributed to a 59.52% reduction in emissions during the vessels’ anchorage waiting period. Simultaneously, the increase in task density due to the shortened vessel stay at the port results in an additional leasing of 2 tugs, and the extra environmental cost incurred by the dual-base return to meet task requirements rises by 5.81%. However, overall, the pollution cost increase in this segment is much smaller than the environmental cost savings.
In order to further validate the effectiveness of the proposed solution for different characteristics of arriving vessels, several random scenarios are presented, while considering the following parameters as the baseline: ① vessel length uniformly distributed in the range of [100, 400]; ② electrical equipment installation rate of 70%; ③ linear correlation between the berth operation duration, auxiliary engine power, and vessel length (as per the linear relationship in Table 3); ④ constant values for shore power quantity, shore length, and tugboat type. With these parameters as a reference, variations are introduced to the corresponding parameters of arriving vessels, and several random scenarios are generated. These scenarios are then compared with the first-come-first-serve (FCFS) scheme, yielding the results presented in Table 7.
In cases where the electrical equipment installation rate is increased (Case 1), the optimization rate of the proposed solution is significantly enhanced. This is because rational allocation of shore power equipment maximizes its utilization. When the berth operation duration is reduced (Case 2) or the distribution of vessel lengths of arriving ships is decreased (Case 5), resulting in reduced congestion at the berth, the total cost of the proposed solution approaches that of the FCFS scheme. The main optimization is evident in the reduction in unnecessary tug travel distance and the decrease in redundant leasing.
Conversely, when the berth operation duration is increased (Case 3), indicating scarce shore resources and increased congestion, the optimization rate of the proposed solution rises. If the shore is congested and the electrical equipment installation rate is increased (Case 4), the optimization rate of the proposed solution is even higher. In summary, the proposed solution exhibits more advantages in situations where port shore resources are scarcer and the electrical equipment installation rate is higher.
6. Conclusions
This paper addresses the container terminal berth allocation and tugboat cooperative scheduling problem under the dual-carbon background for shore power usage. In order to better couple vessel berth allocation with tugboat dispatching, the paper employs task sequencing for coordination. It constructs a dual-layer mixed-integer linear programming model aimed at minimizing environmental and economic costs. The exact solution of the first-layer berth allocation is incorporated into generating heuristic solutions for the second-layer tugboat scheduling, enhancing the precision of the coupling process. Due to the task mapping method, the scale of the second-layer problem expands to twice that of the first layer. Hence, an improved immune particle swarm optimization (IPSO) algorithm is utilized for solving it, drawing parallels with exact solutions and traditional PSO- and bio-inspired algorithms such as the whale algorithm, demonstrating its superiority in balancing accuracy and solving speed.
The specific conclusions are as follows:
- Based on the actual case of the fourth phase of Guangzhou Port, it is found that the cooperative scheduling scheme can optimize 21.73% of the cost compared with the traditional first-come-first-served scheme, and the environmental cost can be reduced by 33.88%, which is mainly due to the full utilization of berth resources. From the data point of view, the cooperative scheduling model achieves the goal of reducing environmental costs through three means, respectively. The first is to reduce the waiting time of arriving ships and reduce their waiting time at anchorage, so as to alleviate pollution; The second is the decision of priority distribution of shore power to high-power ships. Third, larger ships tend to prefer to dock closer to the first section of the shoreline, because larger ships need more tugs, which effectively reduces unnecessary emissions from port tug.
- Through intensive scheduling tasks, the port can reduce the time of ships in port to reduce environmental costs. However, after the tasks become intensive, the port needs to lease additional tugs to meet the task requirements; otherwise, ships will arrive at port but fail to berth according to the plan, resulting in port chaos. It is calculated that the number of tugs adapted for more intensive task leasing can significantly reduce environmental costs at the expense of a small number of tugboat leasing costs. In this case, the port needs to weigh the two costs according to the regulations of the regional environmental protection department and decide whether to use the optimal number of tugs leased or the number of tugs in a relatively redundant state. At the same time, as the number of tugs increases, the work intensity of the tugboat skipper and pilot on board will also increase, which is also something that the port side needs to consider.
- The cooperative scheduling scheme considering both the cost of tugboat leasing and the optimization of the whole system has the lowest optimal cost. Through the sensitivity analysis, it can be seen that when the coastal water resources are scarce, the proposed scheduling scheme brings more environmental benefits. In addition, the installation rate of ship electric equipment will greatly reduce port pollutant emissions. Therefore, relevant authorities should not only consider increasing the number of shore power facilities in port terminals but also encourage the installation of power supply equipment on ships, along with the use of new scheduling schemes, to better reduce port pollutant emissions. Consequently, subsidies from environmental protection agencies for the installation of power supply equipment on ships are also necessary.
Future research directions can be focused on two main areas, which are also limitations of this study. Firstly, they could involve conducting more detailed power tests on the engine equipment of tugboats in different operational states (such as towing, sailing without cargo, and idle), in order to obtain more accurate data on pollutant emissions. Integrating this aspect into the model proposed in this paper could enhance the accuracy of environmental cost measurement, thus affecting the applicability and scientific nature of scheduling. Secondly, they could involve studying the uncertainty of arriving vessels. Arriving vessels could follow a distribution that satisfies a certain statistical law, and subsequently, deterministic planning could be transformed into fuzzy planning. This research would make the problem and model more aligned with engineering reality, ultimately improving port operational efficiency.
Author Contributions
Conceptualization, T.Z. and Y.W.; methodology, T.Z. and Y.W.; software, T.Z. and Y.W.; validation, T.Z. and Y.W.; formal analysis, T.Z. and Y.W.; investigation, T.Z.; resources, Y.W.; data curation, T.Z. and Y.W.; writing—original draft preparation, T.Z. and Y.W.; writing—review and editing, T.Z. and Y.W.; visualization, T.Z.; supervision, Y.W.; project administration, Y.W.; funding acquisition, Y.W. All authors have read and agreed to the published version of the manuscript.
Funding
This work is funded by the Social Science Foundation of Liaoning Province of China (Grant No. L22BGL011) and the State Key Laboratory of Ocean Engineering of China (Shanghai Jiao Tong University) (Grant No. GKZD10084).
Institutional Review Board Statement
Not applicable.
Informed Consent Statement
Not applicable.
Data Availability Statement
Data are contained within the article.
Conflicts of Interest
The authors declare no conflict of interest.
Glossary
| Symbols | Descriptions |
| Set | |
| Set of tug basements, | |
| Parameters | |
| demurrage cost of (EUR/h) | |
| environment cost of pollutant (EUR/kg) | |
| The cost of SP cable per unit distance (EUR/shore line distance) | |
| The emission coefficient of pollutant when using diesel | |
| The actual power of ship auxiliary engines (kw) | |
| The diesel consumption rate of ship auxiliary engine.(kg/kwh) | |
| The required loading and unloading time for ship . | |
| The anticipated departure time of ship | |
| Length of ship | |
| Length of ship have the SP equipment, it is 1, else is 0 | |
| The arrival time of ship | |
| The average time spent towing ships in and out of the port | |
| The average time spent assisting ships during berthing and unberthing | |
| Actual power of the tugboat’s main engine (in kW) | |
| need tug numbers | |
| Speed of tug boats | |
| Cost of sailing one unit distance for a fixed speed of tugboats, including fuel cost and environmental cost | |
| The distance between tug in base with the task | |
| The distance between tug in base with the task finishing position | |
| Position of task | |
| Task start time | |
| Task finish time | |
| initial stage, the Base tugboat stay | |
| Infinity | |
| Variables | |
| The time ship start in dock | |
| The time ship start leave dock | |
| Actual departure time of ship | |
| The time ship start in port | |
| The time ship start out port | |
| If ship = 1 | |
| The SP number which ship is using | |
| If ship use the SP = 1 | |
| If ship select time berthing, = 1, else = 0 | |
| specific berthing time of ship | |
| If ship select time unberthing, = 1, else = 0 | |
| specific unberthing time of ship | |
| If ship select time = 1, else = 0 | |
| If ship select time leaving port, = 1, else = 0 | |
| If ship select = 1, else = 0 | |
| the milepost of the bow of ship | |
| The environmental cost generated by auxiliary engine emissions during anchorage waiting period. | |
| The environmental cost incurred by the operation of auxiliary engines during the berthing operation. | |
| The sum of vessel delay costs and shore power cable service costs. | |
| If tug choose task ,else = 0 | |
| if tug finishes task and stays in base , else = 0 | |
| If previous task was completed by tugboat and currently at base = 1, else = 0 | |
| if tug n, finishes task and returns to base , else = 0 | |
| when task has been done, the start being idle time belongs to tug |
References
- Corbett, J.J.; Winebrake, J.J.; Green, E.H.; Kasibhatla, P.; Eyring, V.; Lauer, A. Mortality from ship emissions: A global assessment. Environ. Sci. Technol. 2007, 41, 8512–8518. [Google Scholar] [CrossRef] [PubMed]
- Eyring, V.; Isaksen, I.S.; Berntsen, T.; Collins, W.J.; Corbett, J.J.; Endresen, O.; Grainger, R.G.; Moldanova, J.; Schlager, H.; Stevenson, D.S. Transport impacts on atmosphere and climate: Shipping. Atmos. Environ. 2010, 44, 4735–4771. [Google Scholar] [CrossRef]
- Tang, L.; Ramacher, M.O.; Moldanová, J.; Matthias, V.; Karl, M.; Johansson, L.; Jalkanen, J.P.; Yaramenka, K.; Aulinger, A.; Gustafsson, M. The impact of ship emissions on air quality and human health in the Gothenburg area–Part 1: 2012 emissions. Atmos. Chem. Phys. 2020, 20, 7509–7530. [Google Scholar] [CrossRef]
- Kang, L.; Meng, Q.; Tan, K.C. Tugboat scheduling under ship arrival and tugging process time uncertainty. Transp. Res. Part E Logist. Transp. Rev. 2020, 144, 102125. [Google Scholar] [CrossRef]
- Paulauskas, V.; Simutis, M.; Plačiene, B.; Barzdžiukas, R.; Jonkus, M.; Paulauskas, D. The Influence of Port Tugs on Improving the Navigational Safety of the Port. J. Mar. Sci. Eng. 2021, 9, 342. [Google Scholar] [CrossRef]
- Deniz, C.; Durmuşoğlu, Y. Estimating shipping emissions in the region of the Sea of Marmara, Turkey. Sci. Total Environ. 2008, 390, 255–261. [Google Scholar] [CrossRef] [PubMed]
- Zis, T.; North, R.J.; Angeloudis, P.; Ochieng, W.Y.; Harrison Bell, M.G. Evaluation of cold ironing and speed reduction policies to reduce ship emissions near and at ports. Marit. Econ. Logist. 2014, 16, 371–398. [Google Scholar] [CrossRef]
- Tseng, P.-H.; Pilcher, N. A study of the potential of shore power for the port of Kaohsiung, Taiwan: To introduce or not to introduce? Res. Transp. Bus. Manag. 2015, 17, 83–91. [Google Scholar] [CrossRef]
- Winkel, R.; Weddige, U.; Johnsen, D.; Hoen, V.; Papaefthimiou, S. Shore Side Electricity in Europe: Potential and environmental benefits. Energy Policy 2016, 88, 584–593. [Google Scholar] [CrossRef]
- Zis, T.; Psaraftis, H.N. The implications of the new sulphur limits on the European Ro-Ro sector. Transp. Res. Part D Transp. Environ. 2017, 52 Pt A, 185–201. [Google Scholar] [CrossRef]
- Arduino, G.; Carrillo, D.; Ferrari, C. Key factors and barriers to the adoption of cold ironing in Europe. In Proceedings of the Società Italiana di Economia dei Trasporti e della Logistica-XIII Riunione Scientifica, Messina, Italy, 16–17 June 2011; pp. 16–17. [Google Scholar]
- Innes, A.; Monios, J. Identifying the unique challenges of installing cold ironing at small and medium ports—The case of Aberdeen. Transp. Res. Part D Transp. Environ. 2018, 62, 298–313. [Google Scholar] [CrossRef]
- Imai, A.; Sun, X.; Nishimura, E.; Papadimitriou, S. Berth allocation in a container port: Using a continuous location space approach. Transp. Res. Part B Methodol. 2005, 39, 199–221. [Google Scholar] [CrossRef]
- Lee, Y.; Chen, C.-Y. An optimization heuristic for the berth scheduling problem. Eur. J. Oper. Res. 2009, 196, 500–508. [Google Scholar] [CrossRef]
- Lee, D.-H.; Chen, J.H.; Cao, J.X. The continuous Berth Allocation Problem: A Greedy Randomized Adaptive Search Solution. Transp. Res. Part E Logist. Transp. Rev. 2010, 46, 1017–1029. [Google Scholar] [CrossRef]
- Zhang, X.; Chen, X.; Ji, M.; Yao, S. Vessel scheduling model of a one-way port channel. J. Waterw. Port Coast. Ocean. Eng. 2017, 143, 04017009. [Google Scholar] [CrossRef]
- Zhang, B.; Zheng, Z. Model and algorithm for vessel scheduling through a one-way tidal channel. J. Waterw. Port Coast. Ocean. Eng. 2020, 146, 04019032. [Google Scholar] [CrossRef]
- Zhang, B.; Zheng, Z.; Wang, D. A model and algorithm for vessel scheduling through a two-way tidal channel. Marit. Policy Manag. 2020, 47, 188–202. [Google Scholar] [CrossRef]
- Liu, B.; Li, Z.C.; Wang, Y.; Sheng, D. Short-term berth planning and ship scheduling for a busy seaport with channel restrictions. Transp. Res. Part E 2021, 154, 102467. [Google Scholar] [CrossRef]
- Song, Y.-T.; Wang, N. A Simulation-based Optimization Approach to Container Terminal Berth Planning Under Time Uncertainty. J. Transp. Syst. Eng. Inf. Technol. 2020, 20, 224. [Google Scholar]
- Li, J.; Liu, Z.X.; Zhang, Y. Continuous berth scheduling and yard allocation of cargo terminal. Transp. Syst. Eng. Inf. 2020, 20, 175–182. [Google Scholar] [CrossRef]
- Jiang, X.; Zhong, M.; Shi, G.; Li, W.; Sui, Y. Vessel scheduling model with resource restriction considerations for restricted channel in ports. Comput. Ind. Eng. 2023, 177, 109034. [Google Scholar] [CrossRef]
- Peng, Y.; Dong, M.; Li, X.; Liu, H.; Wang, W. Cooperative optimization of shore power allocation and berth allocation: A balance between cost and environmental benefit. J. Clean. Prod. 2021, 279, 123816. [Google Scholar] [CrossRef]
- Min, D.Q.; Zhang, Z.D.; Zhang, W.H. Optimization study on joint allocation of shore power and berths based on port environmental benefits. J. Chongqing Jiaotong Univ. (Nat. Sci. Ed.) 2023, 42, 83–90. [Google Scholar]
- Wei, X.; Jia, S.; Meng, Q.; Tan, K.C. Tugboat scheduling for container ports. Transp. Res. Part E Logist. Transp. Rev. 2020, 142, 102071. [Google Scholar] [CrossRef]
- Wang, S.; Zheng, K.; Zheng, J.; Hu, W. An improved discrete particle swarm optimization for tugboat scheduling problem in container terminal. In Proceedings of the 2010 3rd International Conference on Information Management, Innovation Management and Industrial Engineering, Kunming, China, 26–28 November 2010; IEEE: Piscataway, NJ, USA, 2010; Volume 3. [Google Scholar] [CrossRef]
- Wang, S.; Kaku, I.; Chen, G.Y.; Zhu, M. Research on the modeling of tugboat assignment problem in container terminal. Adv. Mater. Res. 2012, 433, 1957–1961. [Google Scholar] [CrossRef]
- Sun, C.; Li, M.; Chen, L.; Chen, P. Dynamic Tugboat Scheduling for Large Seaports with Multiple Terminals. J. Mar. Sci. Eng. 2024, 12, 170. [Google Scholar] [CrossRef]
- Li, B.; Wang, Z.; Zhou, H. Fuzzy Programming Optimization Model and Algorithm for Port Tug Scheduling. Comput. Integr. Manuf. Syst. 2021, 27, 1518–1530. [Google Scholar]
- Lou, D.-M.; Bao, S.-J.; Hu, Z.-Y.; Tan, P.-Q. Cruise speed optimization of tugboat based on real fuel consumption and emission. J. Traffic Transp. Eng. 2017, 17, 93–100. [Google Scholar]
- Dong, L.C.; Xu, Z.Q.; Mi, W.J. The dynamic tugboat schedule based on particle swarm algorithm combined with genetic operators. Math. Pract. Theory 2012, 42, 122–133. [Google Scholar]
- Zhong, H.; Zhang, Y.; Gu, Y. A Bi-objective green tugboat scheduling problem with the tidal port time windows. Transp. Res. Part D Transp. Environ. 2022, 110, 103409. [Google Scholar] [CrossRef]
- Chen, S.; Meng, Q.; Jia, P.; Kuang, H. An operational-mode-based method for estimating ship emissions in port waters. Transp. Res. Part D Transp. Environ. 2021, 101, 103080. [Google Scholar] [CrossRef]
- Zhu, S.; Gao, J.; He, X.; Zhang, S.; Jin, Y.; Tan, Z. Green logistics oriented tug scheduling for inland waterway logistics. Adv. Eng. Inform. 2021, 49, 101323. [Google Scholar] [CrossRef]
- Zhong, H.; Zhang, Y.; Gu, Y. Research on Tugboat Multi-objective Optimal Scheduling Considering Time and Fuel Consumption. Oper. Res. Manag. Sci. 2023, 32, 56. [Google Scholar]
- Li, B.; Chen, Q.; Lau, Y.-Y.; Dulebenets, M.A. Tugboat Scheduling with Multiple Berthing Bases under Uncertainty. J. Mar. Sci. Eng. 2023, 11, 2180. [Google Scholar] [CrossRef]
- Ilati, G.; Sheikholeslami, A.; Hassannayebi, E. A simulation-based optimization approach for integrated port resource allocation problem. PROMET-Traffic Transp. 2014, 26, 243–255. [Google Scholar] [CrossRef]
- Abou Kasm, O.; Diabat, A.; Bierlaire, M. Vessel scheduling with pilotage and tugging considerations. Transp. Res. Part E Logist. Transp. Rev. 2021, 148, 102231. [Google Scholar] [CrossRef]
- Zis, T.P.V. Prospects of cold ironing as an emissions reduction option. Transp. Res. Part A Policy Pract. 2019, 119, 82–95. [Google Scholar] [CrossRef]
- Peng, Y.; Li, X.; Wang, W.; Wei, Z.; Bing, X.; Song, X. A method for determining the allocation strategy of on-shore power supply from a green container terminal perspective. Ocean. Coast. Manag. 2019, 167, 158–175. [Google Scholar] [CrossRef]
Figure 1.
Tugboat operation model example.

Figure 2.
Berth allocation plan, Gantt chart.

Figure 3.
Longitudinal comparison between IAPSO and traditional PSO &SPWOGA.

Figure 4.
Scheduling scheme under optimal number of tugs leased.

Figure 5.
(a) Optimal tug-berth cooperative scheduling scheme. (b) Traditional scheduling scheme.

Figure 6.
Trends before and after optimization of each cost.


Table 1.
Overview of related works.
| Related Works | Extra Consideration | Model Type | Calculation Mode | Reference Number | ||
|---|---|---|---|---|---|---|
| Deterministic | Uncertainty | Exact | Heuristic | |||
| Berth allocation | Traditional | √ | √ | [13,14,15] | ||
| One-way channel | √ | √ | [16,17] | |||
| Tide in and out | √ | √ | [18] | |||
| One/two-way switch | √ | √ | [19] | |||
| Arrival ship uncertain | √ | √ | [20] | |||
| Engine emission | √ | √ | [21,22] | |||
| shorepower | √ | √ | [23,24] | |||
| Tug scheduling | Model improvement | √ | √ | [25,26] | ||
| Algorithm optimization | √ | √ | [27] | |||
| Large-scale | √ | √ | [28] | |||
| Arrival ship uncertain | √ | √ | [29] | |||
| Pollutant discharge | √ | √ | [30,31,32,33] | |||
| River–sea transport | √ | √ | [34] | |||
| Uncertain & Pollutant | √ | √ | [35,36] | |||
| Combination | Time & Pollution | √ | √ | [37,38] | ||
Table 2.
Example of a tugboat scheduling encoding program.
| TASK | Tug1 | Tug 2 | Tug 3 | Tug 4 | Tug 5 | Tug 6 | Tug 7 | Tug 8 | Tug 9 | Selection |
|---|---|---|---|---|---|---|---|---|---|---|
| task 1 (0) | 0 | 0 | 0 | 0 | 1 | 1 | 0 | 0 | 0 | 5,6 |
| task 2 (0) | 1 | 0 | 1 | 1 | 1 | 1 | 0 | 0 | 0 | 1,3,4 |
| task 3 (0) | 1 | 1 | 1 | 1 | 1 | 1 | 0 | 0 | 0 | 2 |
| task 4 (1) | 0 | 0 | 1 | 1 | 1 | 1 | 0 | 0 | 0 | 1,2 |
| task 5 (1) | 0 | 0 | 0 | 0 | 0 | 1 | 0 | 0 | 0 | 3,4,5 |
| task 6 (1) | 0 | 0 | 0 | 0 | 0 | 0 | 0 | 0 | 0 | 6 |
Table 3.
Table of data on ships expected to call at ports.
| Ship Num. | Length (m) | Able (1) or Not (0) to SP? | Rated Auxiliary Engine Power (kW) | ETA | Tug Needs | ETD | Load Time | Demurrage Cost (EUR/h) |
|---|---|---|---|---|---|---|---|---|
| 1 | 129.00 | 1 | 1440 kW | 1 | 2 | 22 | 15 | 44.6 |
| 2 | 136.00 | 1 | 1060 kW | 9 | 2 | 35 | 20 | 44.6 |
| 3 | 175.00 | 1 | 3300 kW | 15 | 2 | 44 | 23 | 57.3 |
| 4 | 183.00 | 1 | 3840 kW | 18 | 2 | 46 | 22 | 57.3 |
| 5 | 157.00 | 0 | 3180 kW | 22 | 2 | 43 | 16 | 51.0 |
| 6 | 90.00 | 0 | 970 kW | 26 | 1 | 42 | 10 | 25.5 |
| 7 | 205.00 | 0 | 9700 kW | 31 | 2 | 65 | 28 | 82.8 |
| 8 | 202.00 | 1 | 6800 kW | 36 | 3 | 74 | 32 | 82.8 |
| 9 | 298.00 | 1 | 28,400 kW | 42 | 3 | 83 | 35 | 102.0 |
| 10 | 310.00 | 1 | 30,000 kW | 50 | 3 | 96 | 40 | 102.0 |
Table 4.
Port of entry/exit tasking sequence.
| Task Num | In/Out (0/1) | Start Position/m (Distance from Base A) | Start Position/m (Distance from B) | Task Start Time | Finish Position/m (Distance from A) | Finish Position/m (Distance from Base B) | Tug Needs |
|---|---|---|---|---|---|---|---|
| 1 | 0 | 0 | 5000 | 1 | 3200 | 1800 | 2 |
| 2 | 0 | 0 | 5000 | 9 | 3000 | 2000 | 2 |
| 3 | 0 | 0 | 5000 | 15 | 3395 | 1605 | 2 |
| 4 | 0 | 0 | 5000 | 18 | 3600 | 1400 | 2 |
| 5 | 1 | 3200 | 1800 | 19 | 0 | 5000 | 2 |
| 6 | 0 | 0 | 5000 | 25 | 3813 | 1187 | 2 |
| 7 | 0 | 0 | 5000 | 26 | 3236 | 1764 | 1 |
| 8 | 0 | 0 | 5000 | 31 | 3000 | 2000 | 2 |
| 9 | 1 | 3000 | 2000 | 32 | 0 | 5000 | 2 |
| 10 | 0 | 0 | 5000 | 39 | 3368 | 1632 | 3 |
| 11 | 1 | 3236 | 1764 | 39 | 0 | 5000 | 1 |
| 12 | 1 | 3395 | 1605 | 41 | 0 | 5000 | 2 |
| 13 | 0 | 0 | 5000 | 42 | 3600 | 1400 | 3 |
| 14 | 1 | 3600 | 1400 | 43 | 0 | 5000 | 2 |
| 15 | 1 | 3813 | 1187 | 44 | 0 | 5000 | 2 |
| 16 | 0 | 0 | 5000 | 60 | 3000 | 2000 | 3 |
| 17 | 1 | 3000 | 2000 | 62 | 0 | 5000 | 2 |
| 18 | 1 | 3368 | 1632 | 74 | 0 | 5000 | 3 |
| 19 | 1 | 3600 | 1400 | 80 | 0 | 5000 | 3 |
| 20 | 1 | 3000 | 2000 | 103 | 0 | 5000 | 3 |
Table 5.
Economic costing accounting.
| Tugs | CPLEX Solution | IAPSO Solution | Distance Error | ||||
|---|---|---|---|---|---|---|---|
| Total Travel Distance (m) | Cost (EUR) | Calculation Time (s) | Total Travel Distance (m) | Cost (EUR) | Calculation Time (s) | ||
| 15 | 220,000 | 112,106.54 | 4.32 | 220,000 | 112,106.54 | 2.5646 | 0% |
| 14 | 220,000 | 108,389.62 | 4.12 | 222,000 | 108,901.92 | 2.3300 | 0.91% |
| 13 | 222,000 | 105,185.00 | 99.28 | 224,000 | 105,697.30 | 2.4441 | 0.90% |
| 12 | 224,000 | 101,980.38 | 324.51 | 226,472 | 102,613.58 | 2.1050 | 1.10% |
| 11 | 229,390 | 99,644.10 | >1000 | 232,790 | 100,515.01 | 2.0454 | 1.48% |
| 10 | No solution | - | - | inf | - | - | - |
Table 6.
Individual cost data (Unit: EUR).
| Total | Environ—Cost | Anchorage—Cost | Tug (In and Out)—Cost | Dock—Cost | Economic Cost | Tug Leasing Cost | Delay and Mooring | Other Cost | |
|---|---|---|---|---|---|---|---|---|---|
| before optimization | 509,771 | 339,065 | 202,598 | 56,353 | 80,115 | 38,439 | 33,452 | 4,987 | 132,267 |
| after optimization | 398,992 | 224,203 | 82,009 | 59,628 | 82,565 | 42,523 | 40,886 | 1,637 | 132,267 |
Table 7.
Random case study.
| Case | Boat Number | Character | Best (Traditional) Tug Needs | FCFS Cost (EUR) | Scheduling Cost in This Paper (EUR) | Average Optimization Rate | ||
|---|---|---|---|---|---|---|---|---|
| Length | Indock Time | SP Installation Rate | ||||||
| 1 | 8 | +0% | +0% | +15% | 5 (10) | 465,870.35 | 316,001.92 | 32.17% |
| 2 | 9 | +0% | −15% | +0% | 7 (9) | 249,713.59 | 234,529.52 | 6.08% |
| 3 | 10 | +0% | +15% | +0% | 8 (11) | 775,304.27 | 506,019.45 | 34.73% |
| 4 | 11 | +0% | +15% | +15% | 10 (12) | 645,045.71 | 377,727.53 | 41.44% |
| 5 | 12 | −15% | +0% | +0% | 7 (14) | 530,784.76 | 453,920.53 | 14.48% |
Disclaimer/Publisher’s Note: The statements, opinions and data contained in all publications are solely those of the individual author(s) and contributor(s) and not of MDPI and/or the editor(s). MDPI and/or the editor(s) disclaim responsibility for any injury to people or property resulting from any ideas, methods, instructions or products referred to in the content. |
© 2024 by the authors. Licensee MDPI, Basel, Switzerland. This article is an open access article distributed under the terms and conditions of the Creative Commons Attribution (CC BY) license (https://creativecommons.org/licenses/by/4.0/).
Share and Cite
MDPI and ACS Style
Wang, Y.; Zou, T. Optimization of Berth-Tug Co-Scheduling in Container Terminals under Dual-Carbon Contexts. J. Mar. Sci. Eng. 2024, 12, 684. https://doi.org/10.3390/jmse12040684
AMA Style
Wang Y, Zou T. Optimization of Berth-Tug Co-Scheduling in Container Terminals under Dual-Carbon Contexts. Journal of Marine Science and Engineering. 2024; 12(4):684. https://doi.org/10.3390/jmse12040684
Chicago/Turabian StyleWang, Yan, and Tianyu Zou. 2024. "Optimization of Berth-Tug Co-Scheduling in Container Terminals under Dual-Carbon Contexts" Journal of Marine Science and Engineering 12, no. 4: 684. https://doi.org/10.3390/jmse12040684
Note that from the first issue of 2016, this journal uses article numbers instead of page numbers. See further details here.