
Tidal Flat Erosion Processes and Their Dynamic Mechanisms on the South Side of Sheyang River Estuary, Jiangsu Province
 , , ,
, , ,
Abstract
:1. Introduction
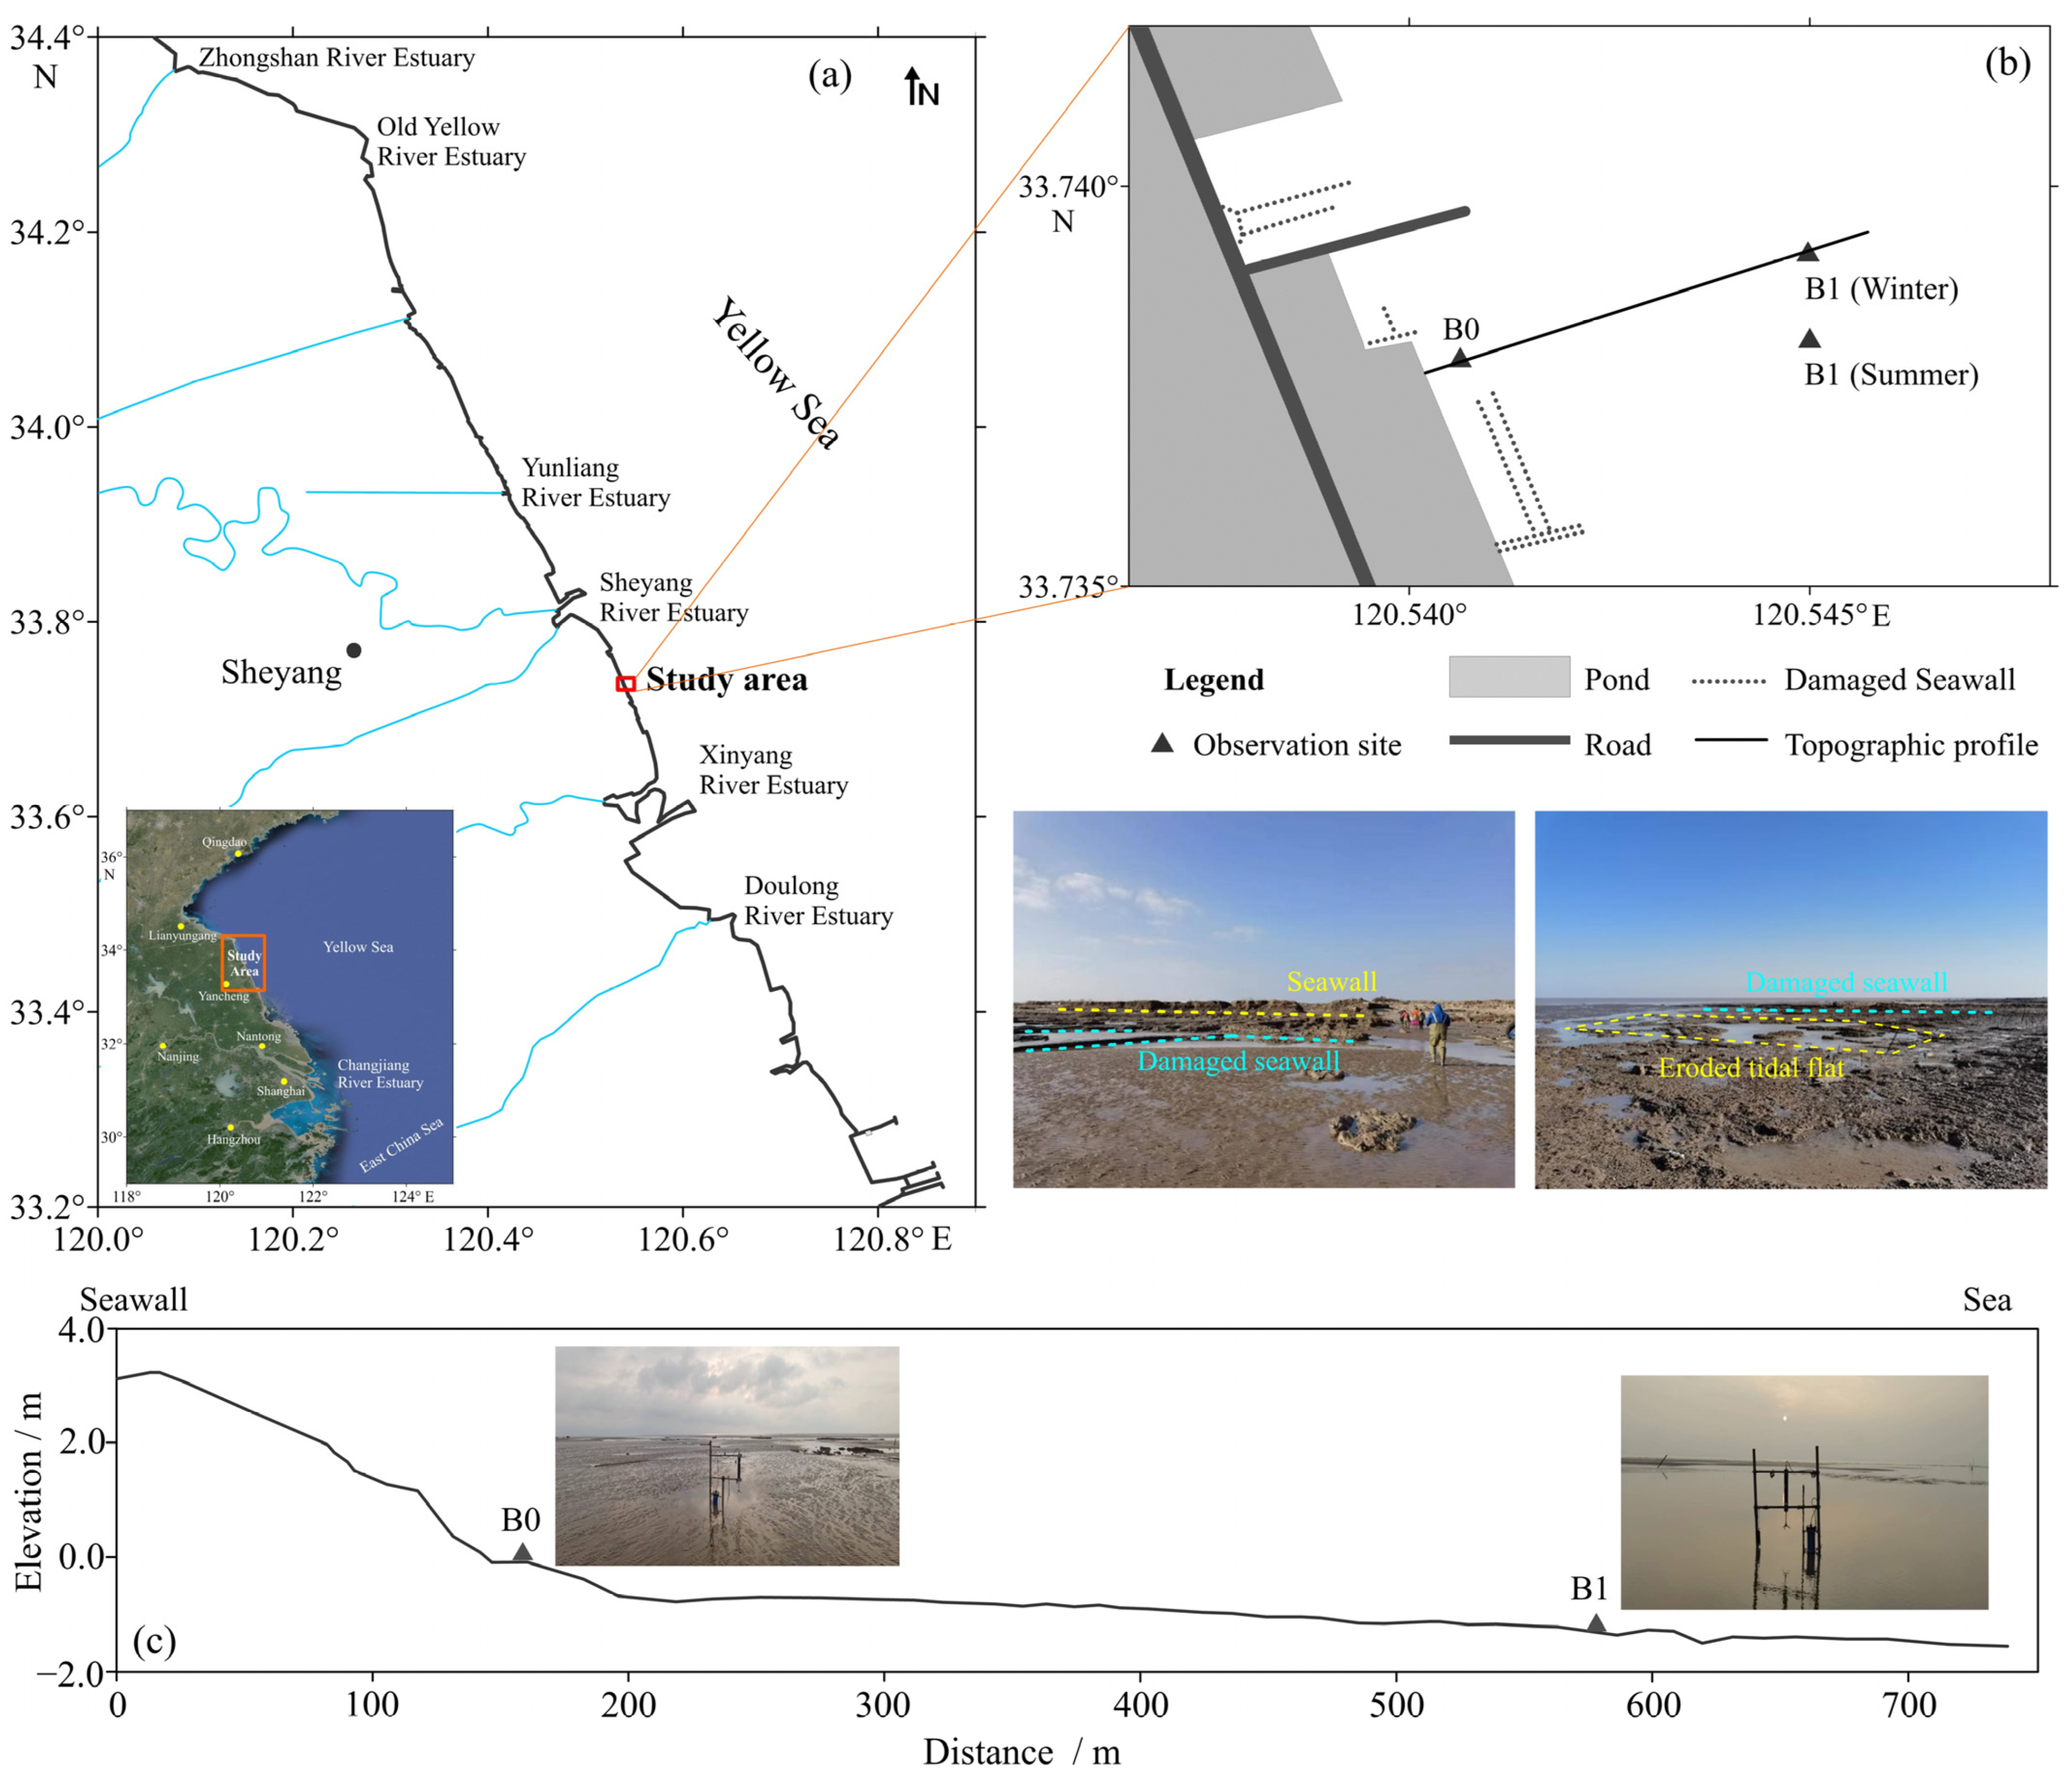
2. Study Area
3. Methods
3.1. Field Observation
3.2. Calculation of Suspended Sediment Concentration
3.3. Calculation of Sediment Dynamic Parameters
3.3.1. Calculation of Bottom Shear Stress
3.3.2. Calculation of Erosion and Deposition Fluxes
3.3.3. Calculation of Suspended Sediment and Bedload Transport
4. Results
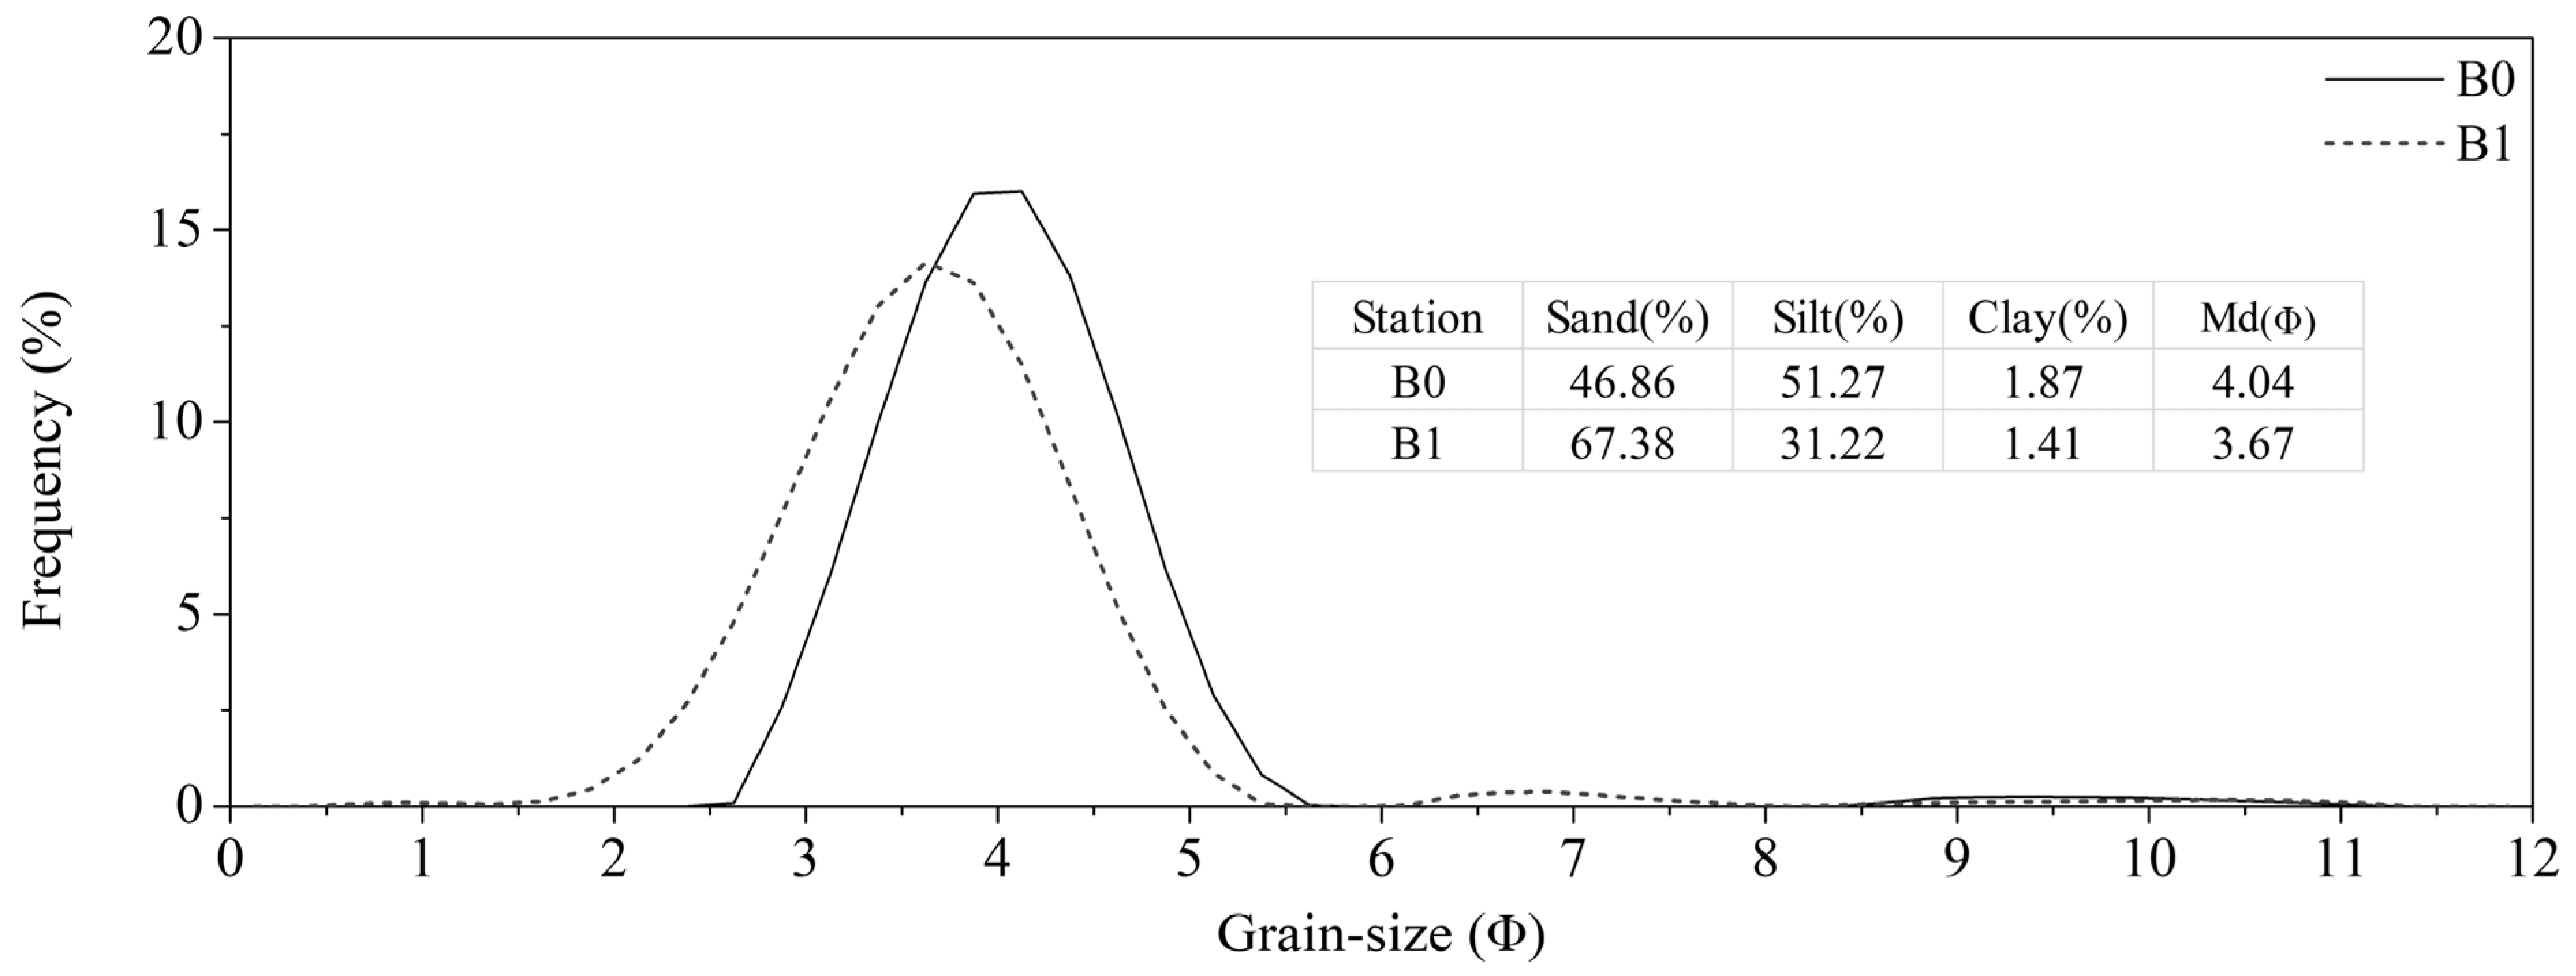
4.1. Surface Sediment Characters
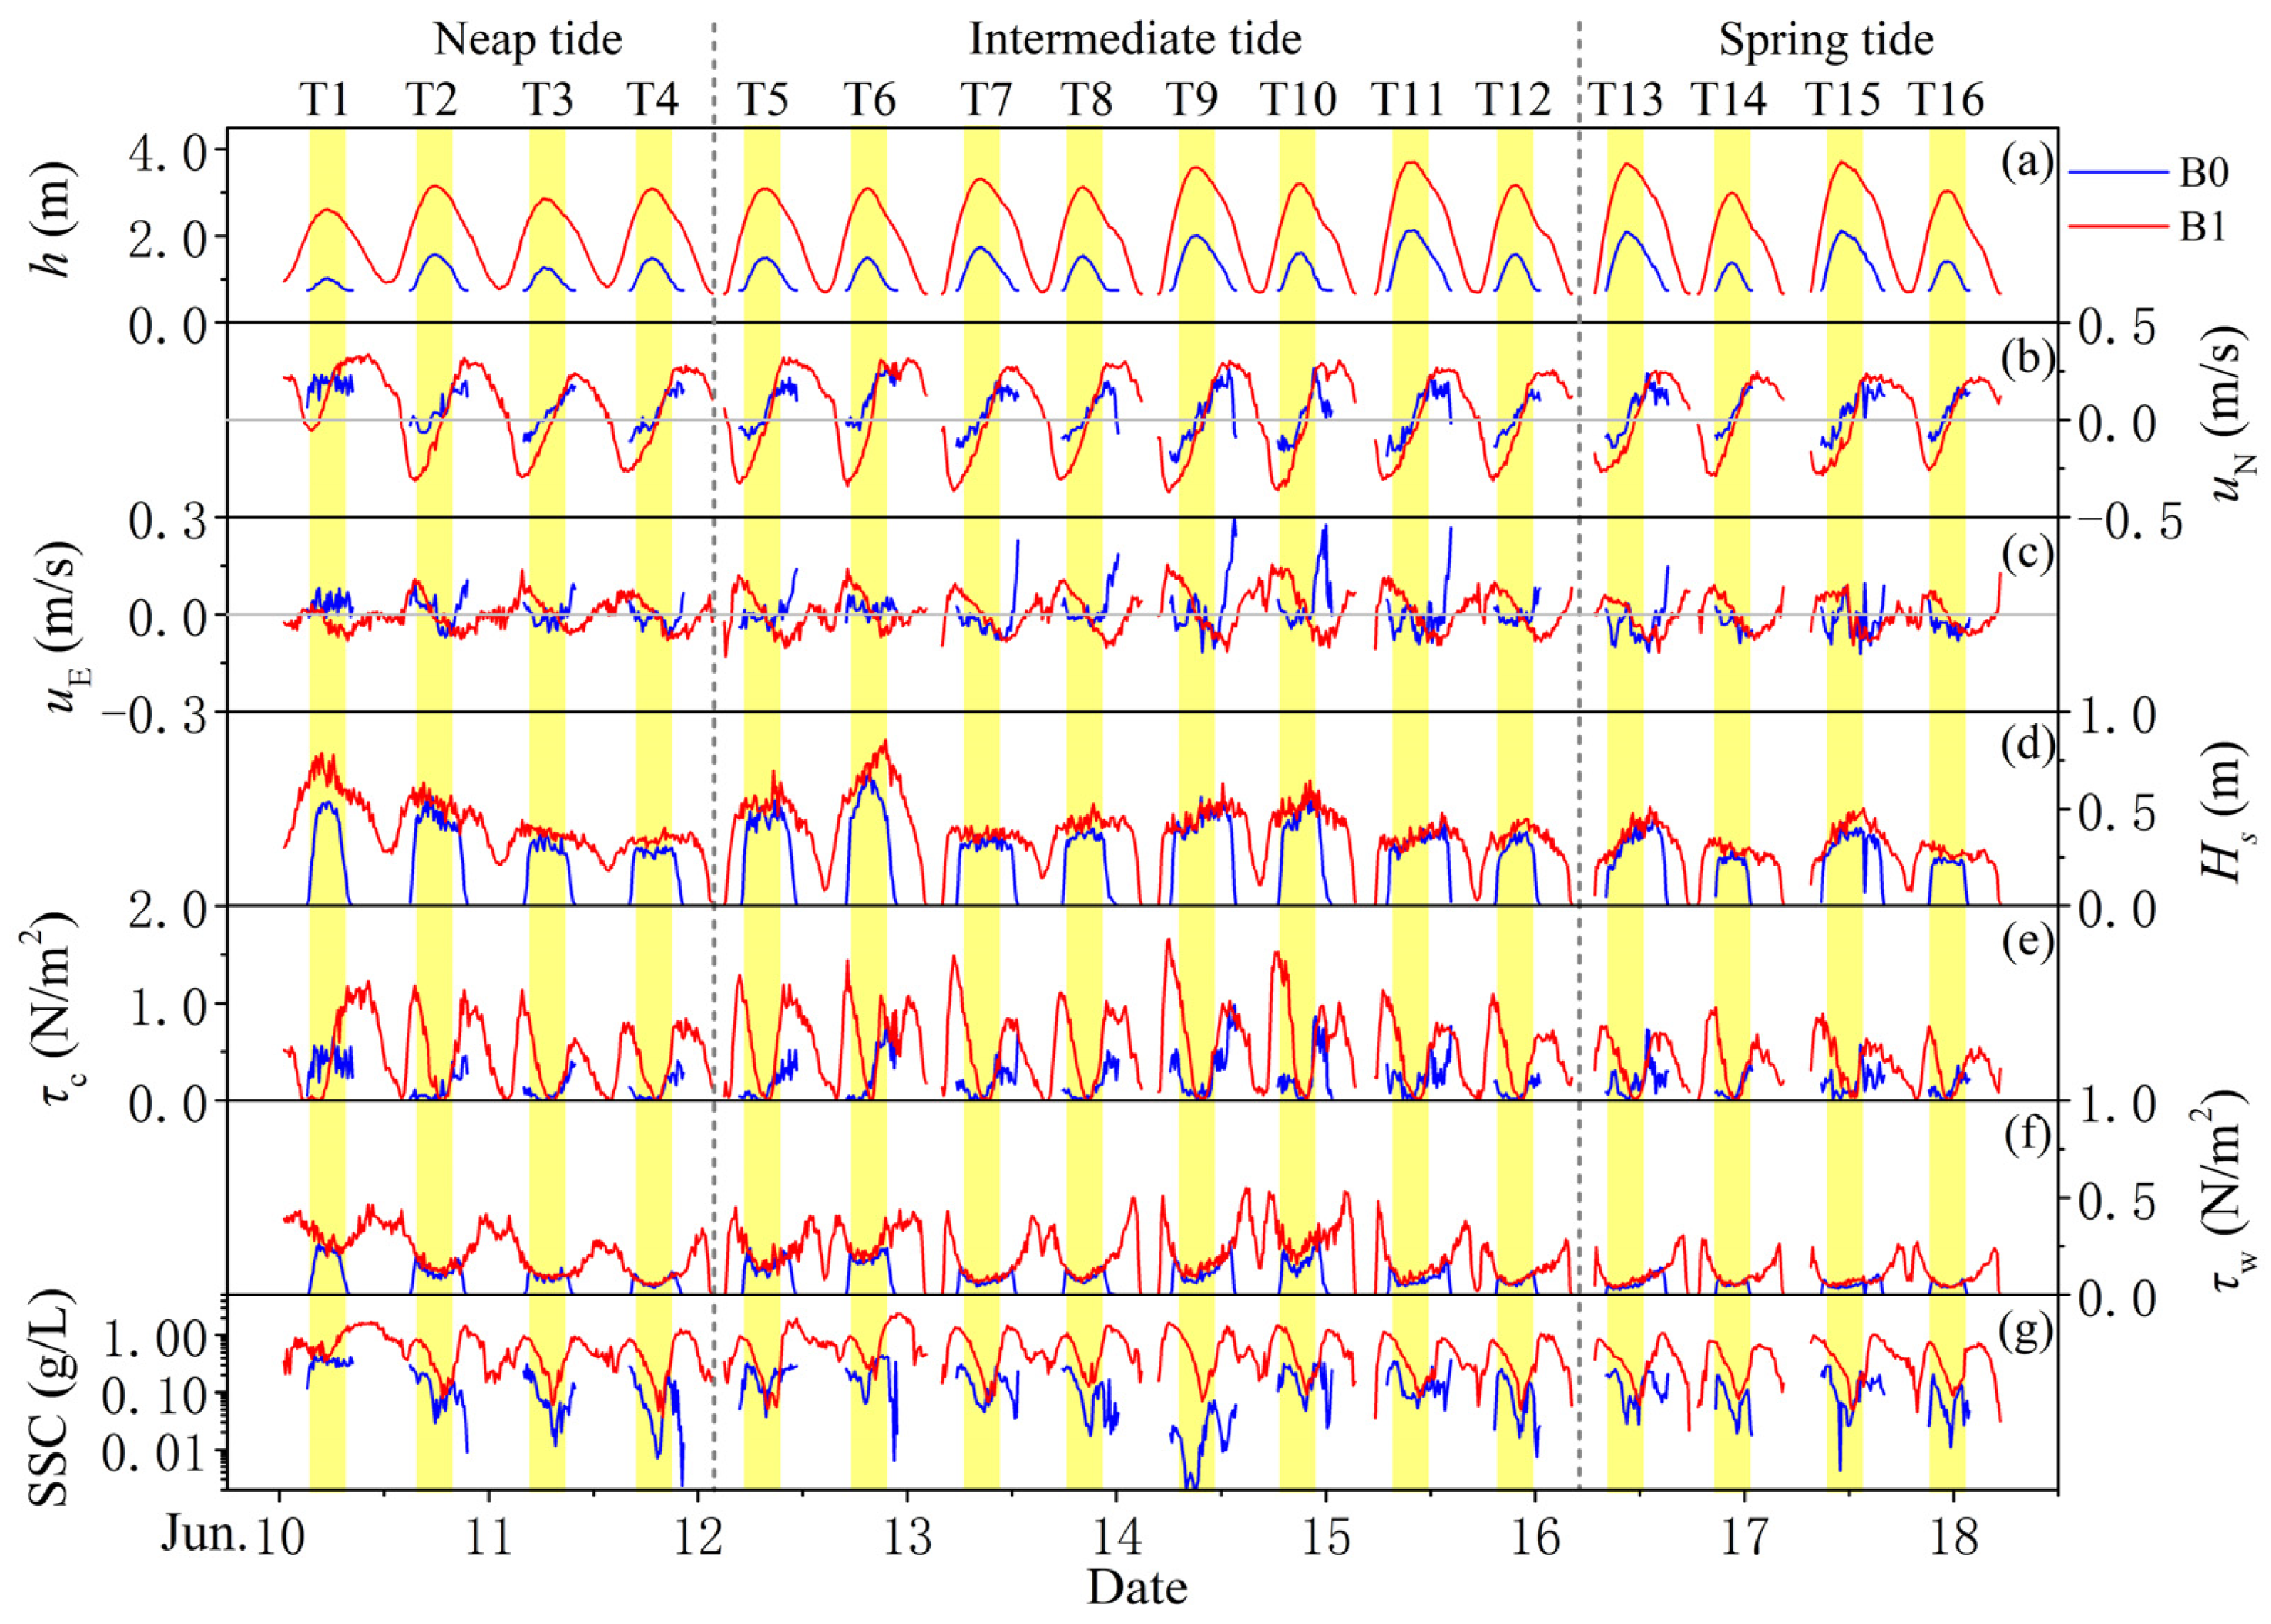
4.2. Hydrodynamic Characteristics
4.3. Suspended Sediment Concentration
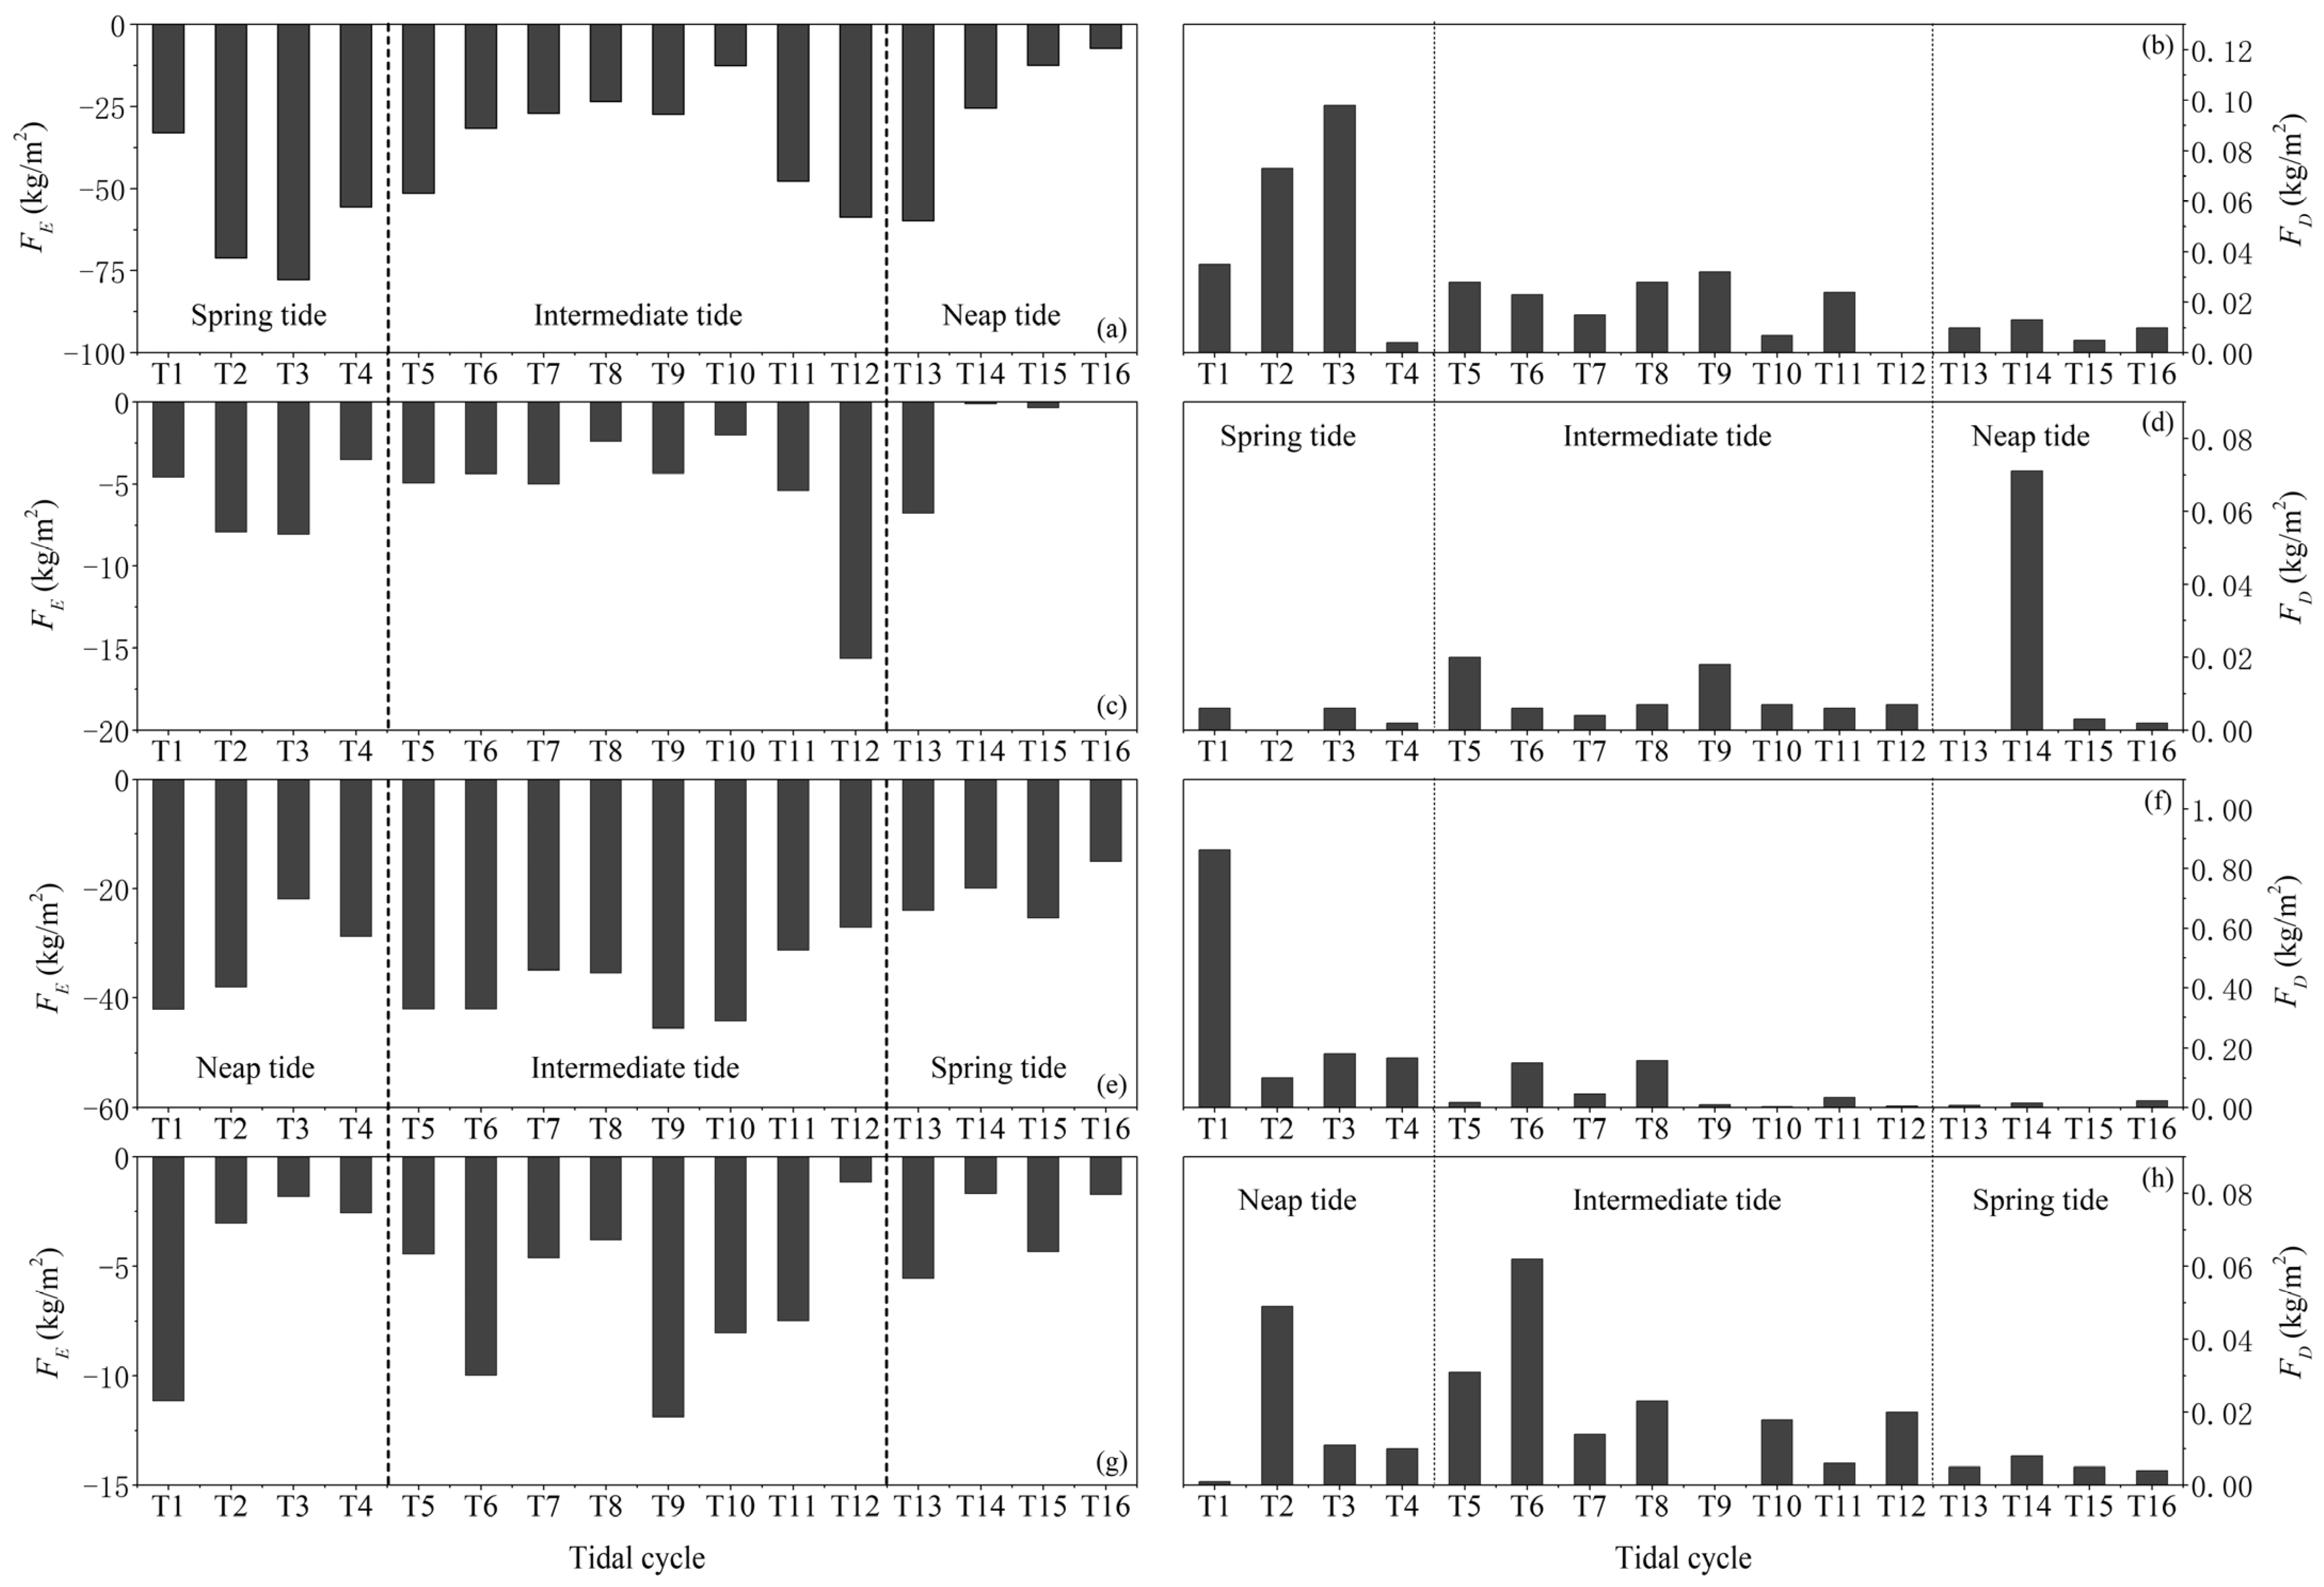
4.4. Erosion–Sedimentation Fluxes
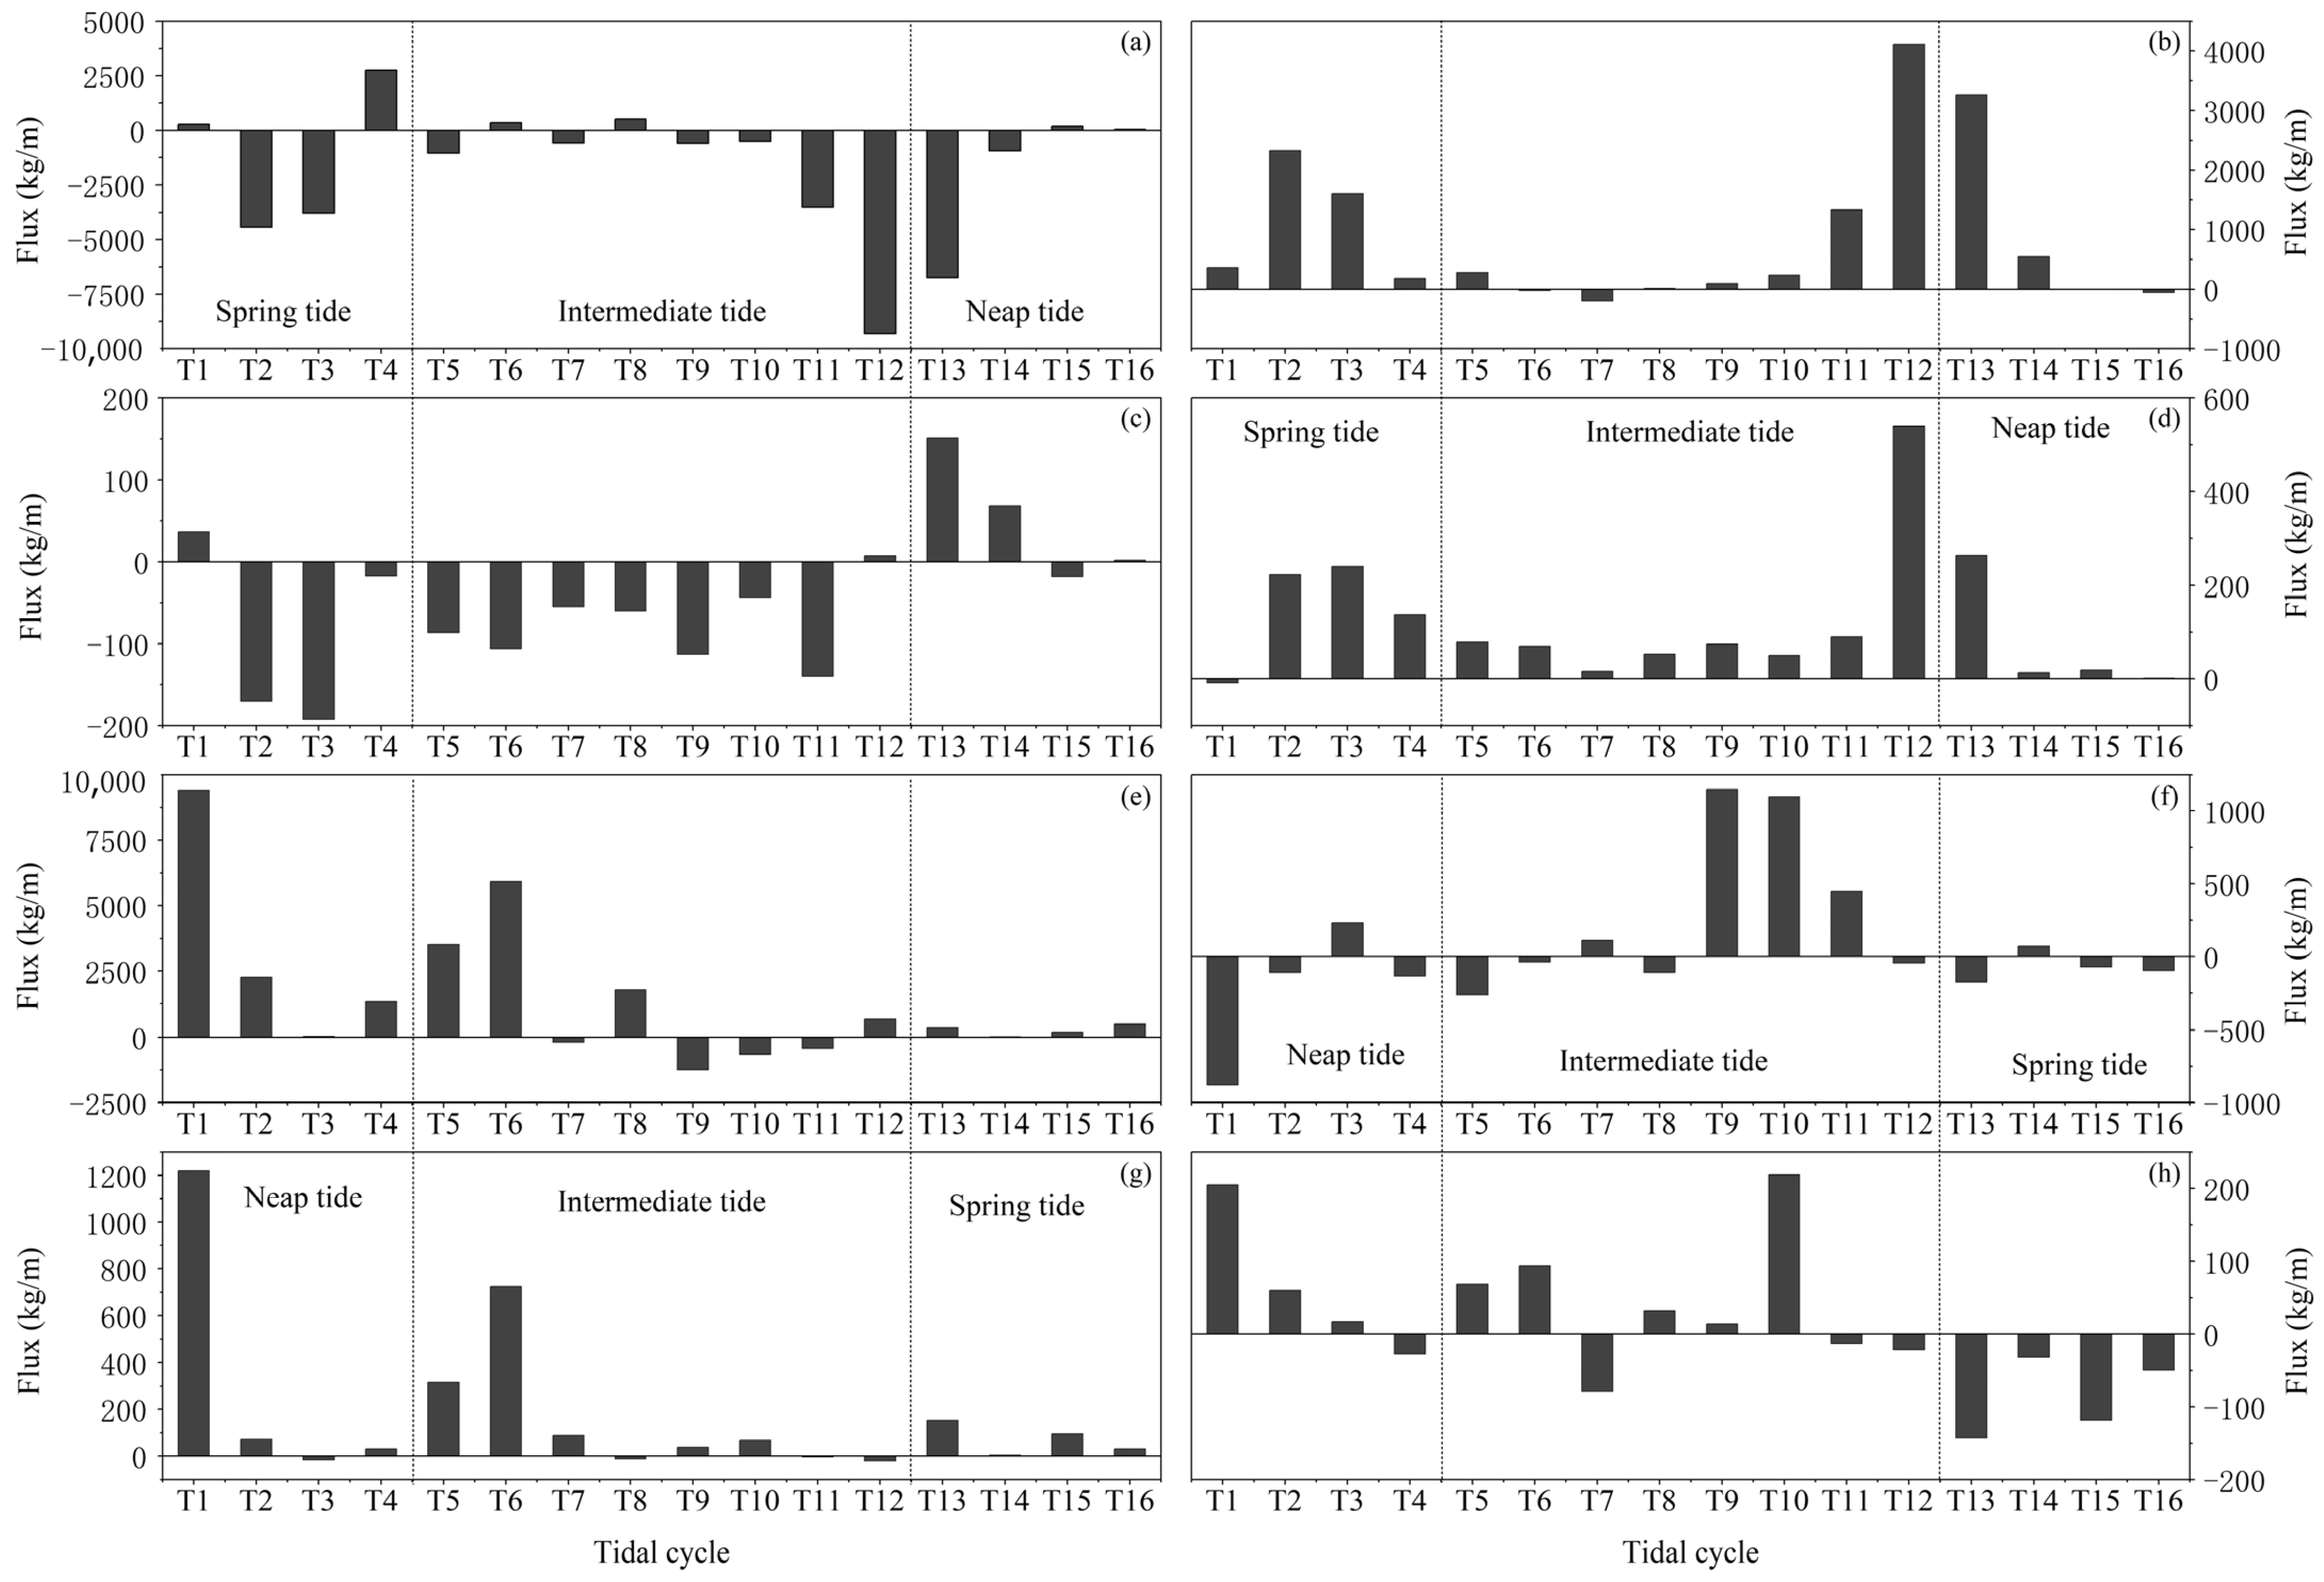
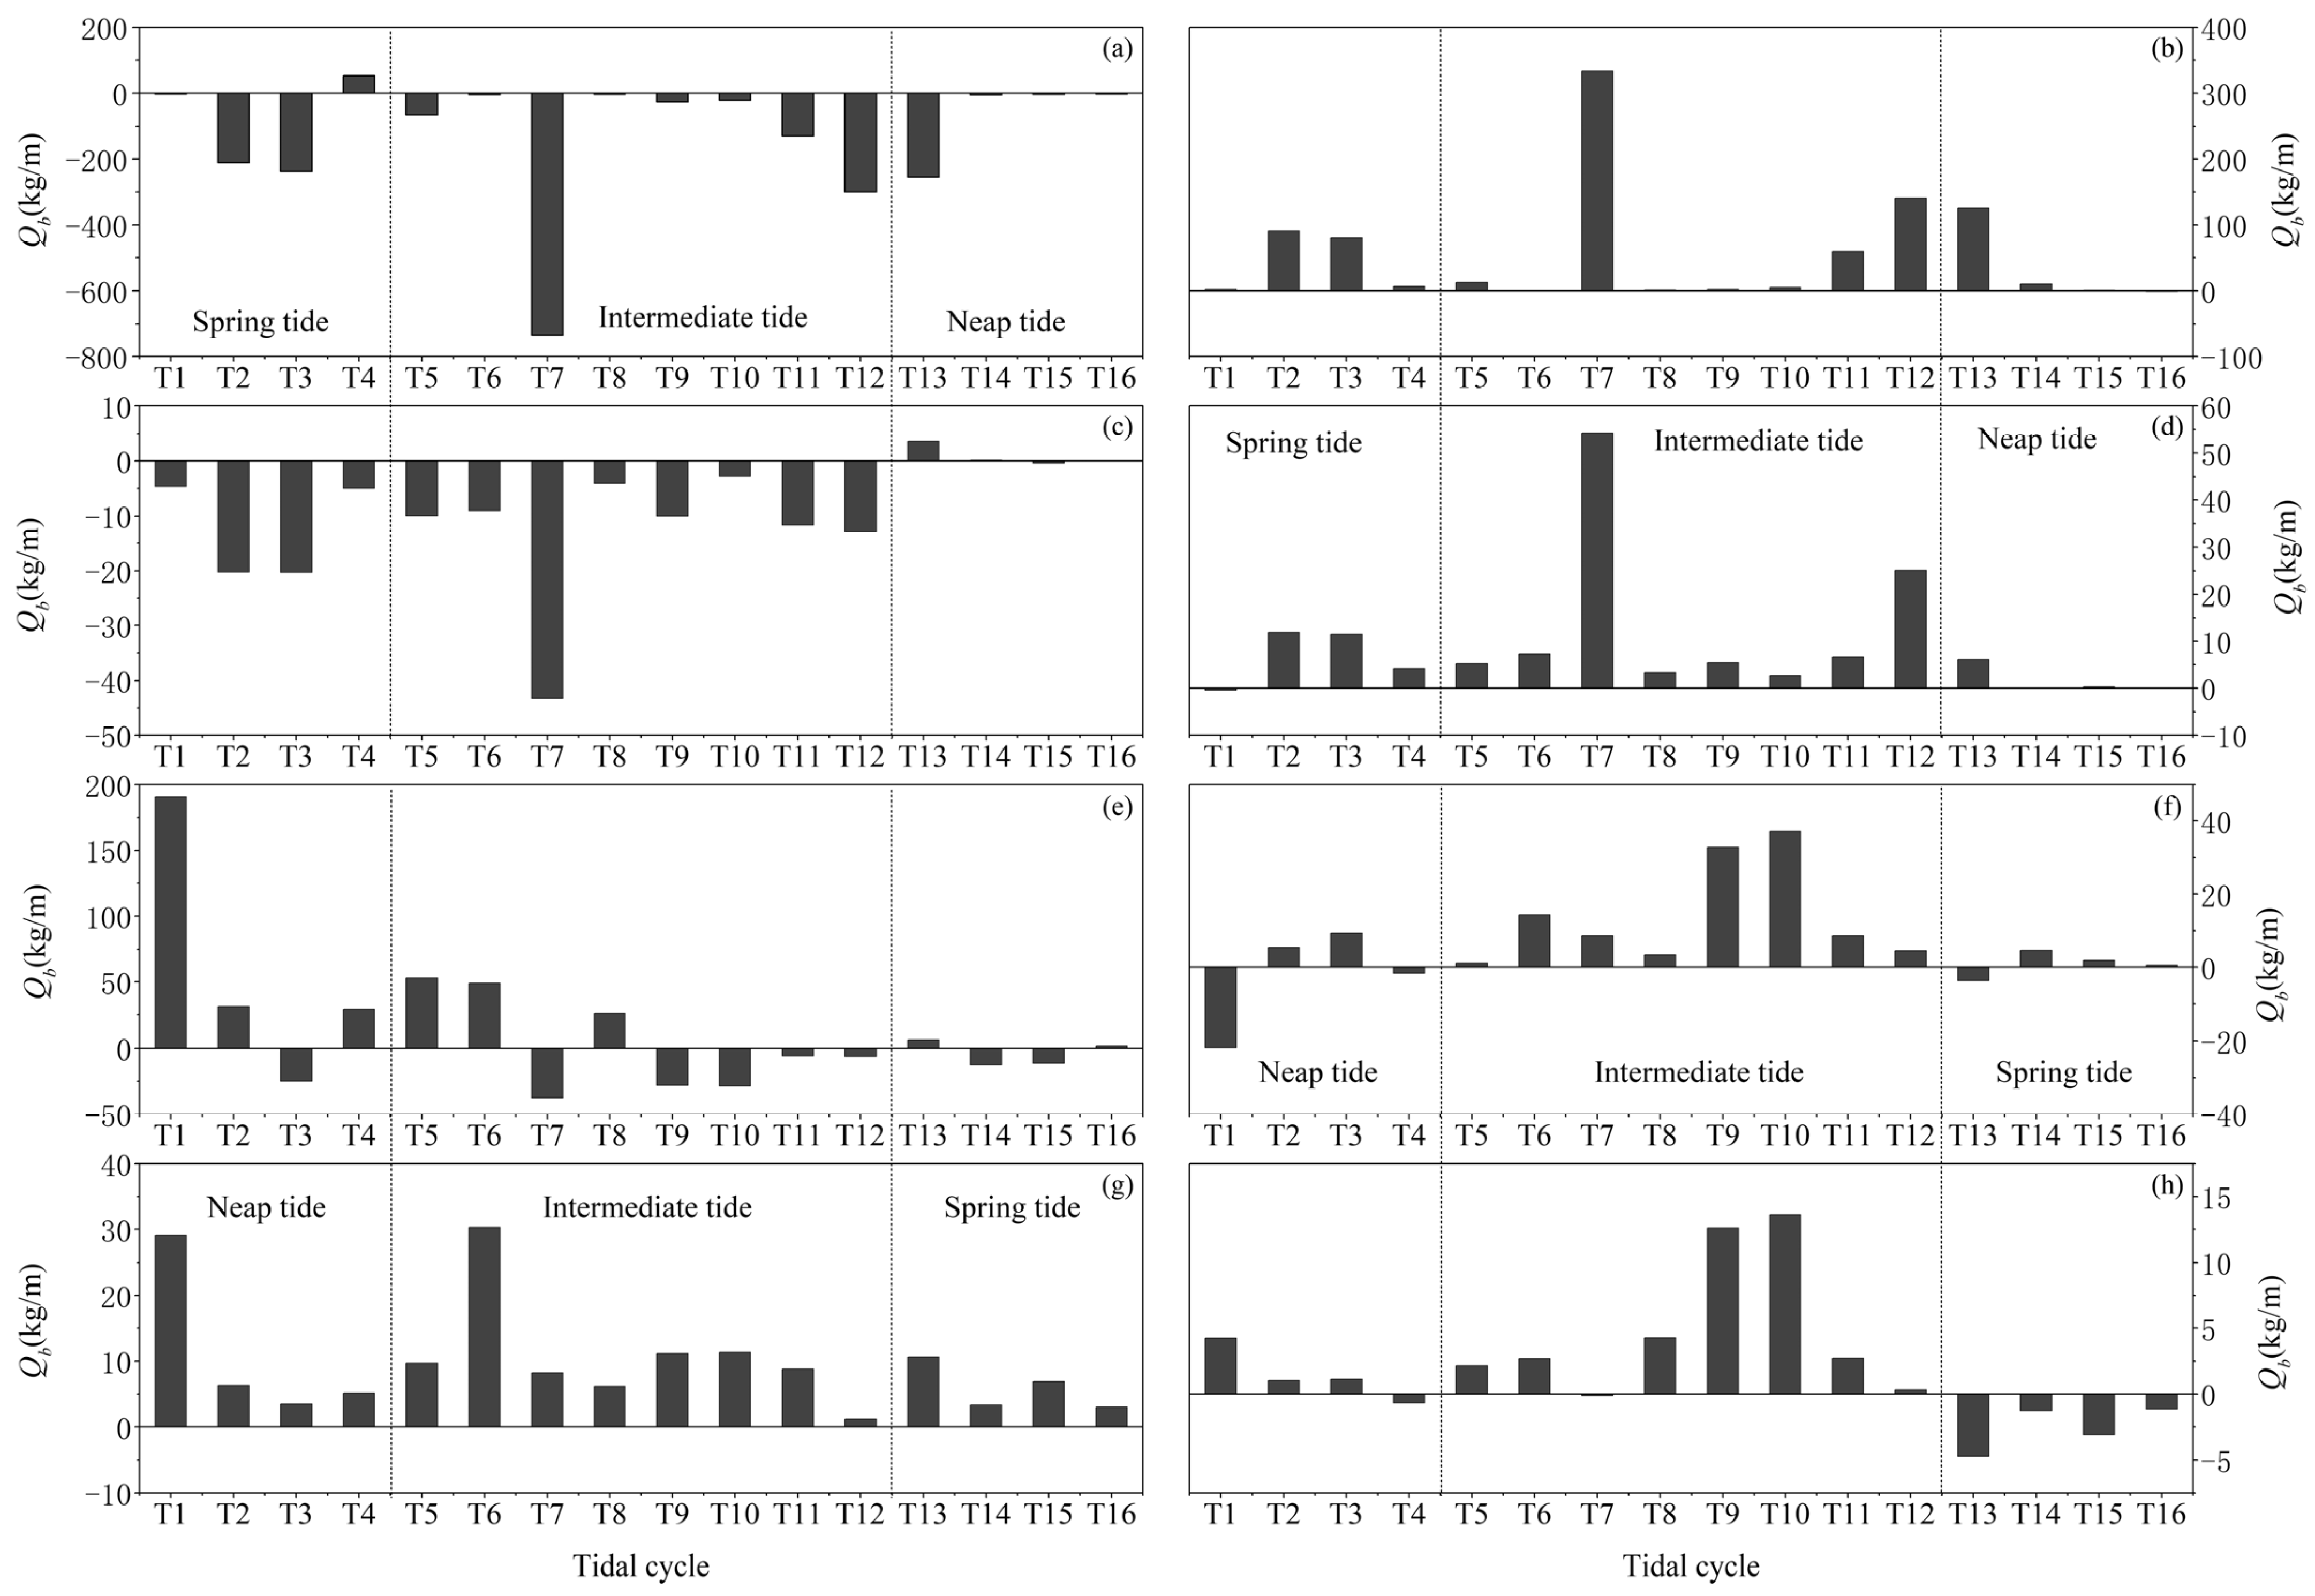
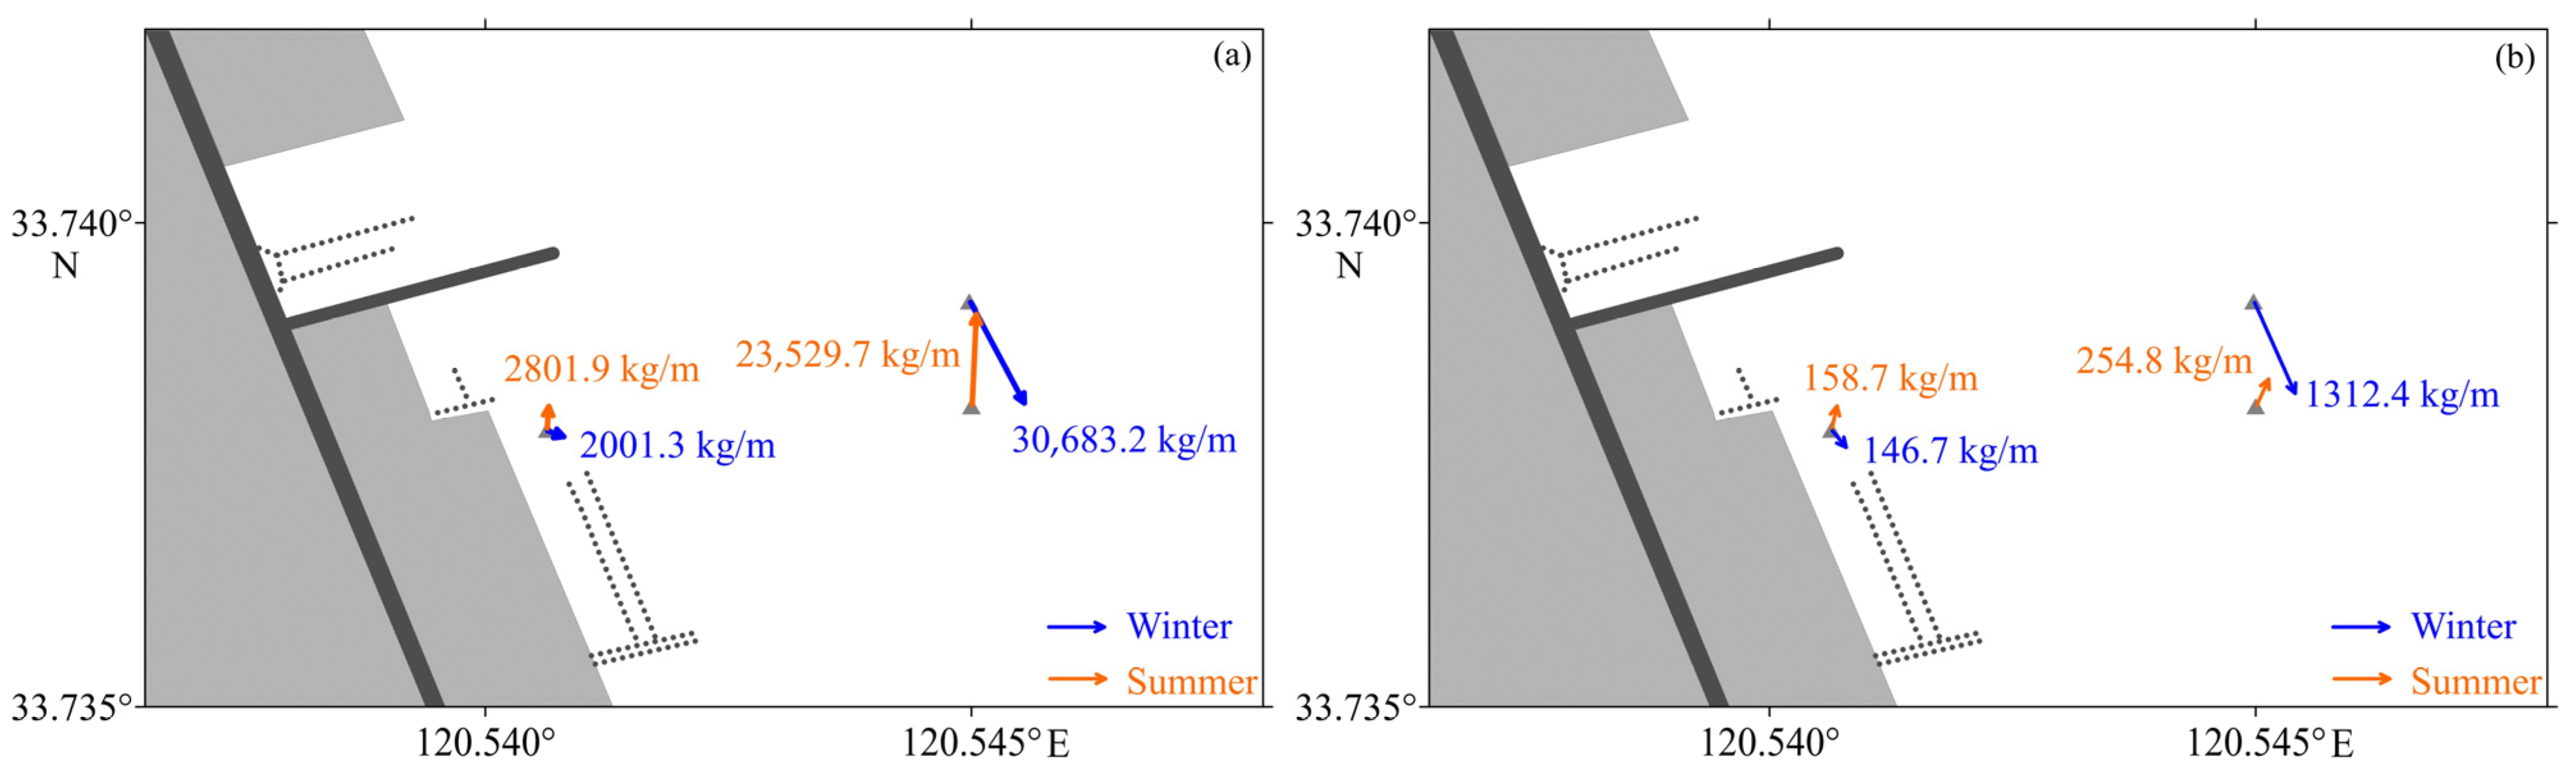
4.5. Suspended Sediment and Bedload Transport Fluxes
5. Discussion
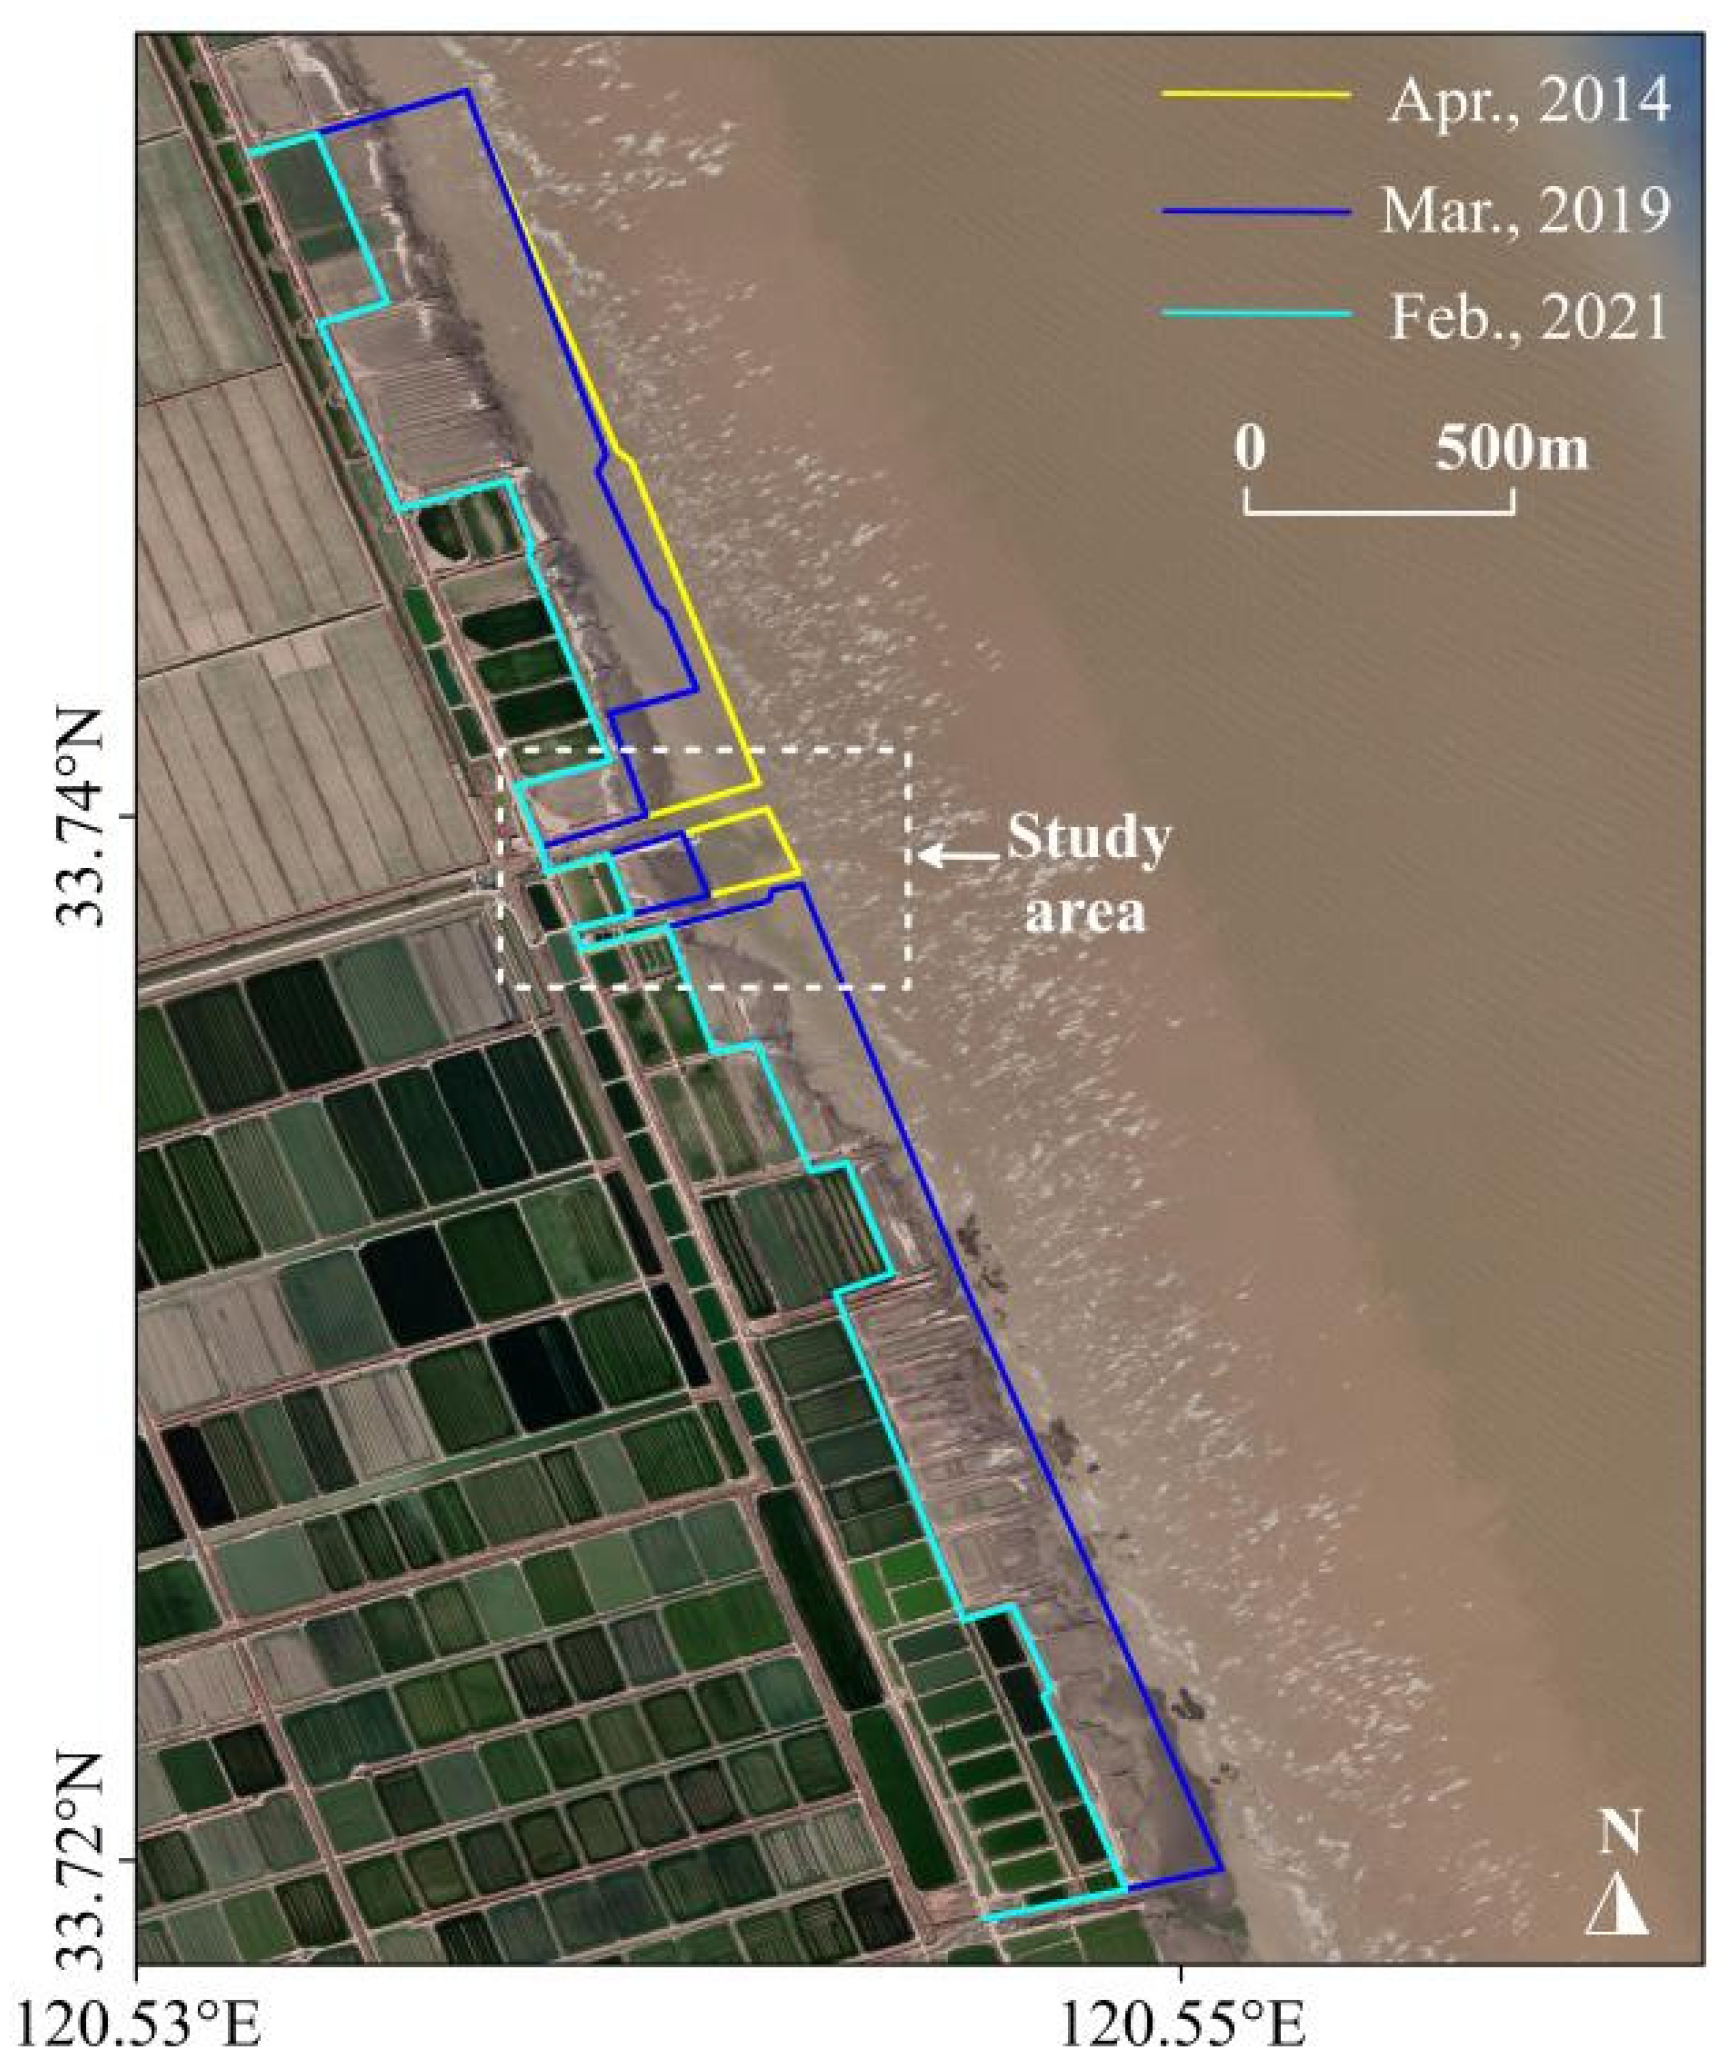
5.1. Spatiotemporal Variations in Tidal Flat Erosion–Accretion near the Sheyang River Estuary
5.2. Mechanisms of Tidal Flat Erosion on the South Side of the Sheyang River Estuary
6. Conclusions
Author Contributions
Funding
Institutional Review Board Statement
Informed Consent Statement
Data Availability Statement
Conflicts of Interest
References
- Gao, S. Geomorphology and sedimentology of tidal flats. In Coastal Wetlands: An Ecosystem Integrated Approach, 2nd ed.; Perillo, G.M.E., Wolanski, E., Cahoon, D., Hopkinson, C., Eds.; Elsevier: Amsterdam, The Netherlands, 2019; pp. 359–381. [Google Scholar]
- Eisma, D. Intertidal Deposits: River Mouths, Tidal Flats, and Coastal Lagoons; CRC Press: Boca Raton, FL, USA, 1997; p. 525. [Google Scholar]
- Murray, N.J.; Phinn, S.R.; DeWitt, M.; Ferrari, R.; Johnston, R.; Lyons, M.B.; Clinton, N.; Thau, D.; Fuller, R.A. The global distribution and trajectory of tidal flats. Nature 2019, 565, 222–225. [Google Scholar] [CrossRef] [PubMed]
- Reineck, H.-E.; Singh, I.B. Depositional Sedimentary Environments, 2nd ed.; Springer: Berlin/Heidelberg, Germany, 1980; p. 549. [Google Scholar]
- Evans, G.; Collins, B.M. The transportation and deposition of suspended sediment over the intertidal flats of the Wash. In Nearshore Sediment Dynamics and Sedimentation; Hails, J., Carr, A., Eds.; John Wiley & Sons: Chichester, UK, 1975; pp. 273–306. [Google Scholar]
- Amos, C.L.; Mosher, D.C. Erosion and deposition of fine-grained sediments from the Bay of Fundy. Sedimentology 1985, 32, 815–832. [Google Scholar] [CrossRef]
- Wang, Y. The mudflat system of China. Can. J. Fish. Aquat. Sci. 1983, 40 (Suppl. S1), 160–171. [Google Scholar] [CrossRef]
- Ren, M.E. Tidal mud flat. In Modern Sedimentation in the Coastal and Nearshore Zones of China; Ren, M.E., Ed.; China Ocean Press: Beijing, China, 1986; p. 517. (In Chinese) [Google Scholar]
- Schuerch, M.; Spencer, T.; Temmerman, S.; Kirwan, M.L.; Wolff, C.; Lincke, D.; McOwen, C.J.; Pickering, M.D.; Reef, R.; Vafeidis, A.T.; et al. Future response of global coastal wetlands to sea-level rise. Nature 2018, 561, 231–234. [Google Scholar] [CrossRef] [PubMed]
- Li, X.; Bellerby, R.; Craft, C.; Widney, S.E. Coastal wetland loss, consequences, and challenges for restoration. Anthr. Coasts 2018, 1, 1–15. [Google Scholar] [CrossRef]
- Walter, R.K.; O’Leary, J.K.; Vitousek, S.; Kitajima, A. Large-scale erosion driven by intertidal eelgrass loss in an estuarine environment. Estuar. Coast. Shelf Sci. 2020, 243, 106910. [Google Scholar] [CrossRef]
- Hulskamp, R.; Luijendijk, A.; van Maren, B.; Moreno-Rodenas, A.; Calkoen, F.; Kras, E.; Lhermitte, S.; Aarninkhof, S. Global distribution and dynamics of muddy coasts. Nat. Commun. 2023, 14, 8259. [Google Scholar] [CrossRef] [PubMed]
- Zhang, R.S.; Lu, L.Y.; Wang, Y.H. The mechanism and trend of coastal erosion of Jiangsu Province in China. Geogr. Res. 2002, 21, 469–478, (In Chinese with English abstract). [Google Scholar]
- Zhu, D.K.; Xu, T.G. The coast development and exploit of middle Jiangsu. J. Nanjing Univ. Nat. Sci. Ed. 1982, 18, 799–818, (In Chinese with English abstract). [Google Scholar]
- Gao, S.; Zhu, D.K. The profile of Jiangsu’s mud coast. J. Nanjing Univ. Nat. Sci. Ed. 1988, 24, 75–84, (In Chinese with English abstract). [Google Scholar]
- Chen, C.J. Development of depositional tidal flat in Jiangsu Province. Oceanol. Limnol. Sin. 1991, 22, 360–368, (In Chinese with English abstract). [Google Scholar]
- Yan, Q.S.; Liu, R.J.; Ma, Y. Remote sensing analysis of shoreline changes along the coast near the Sheyang River Estuary of Jiangsu Province since 1973. Mar. Sci. 2015, 39, 94–100, (In Chinese with English abstract). [Google Scholar]
- Cui, D.D.; Lyu, L.; Zhou, Y.; Deng, H.L.; Zhang, H.M.; Zhang, D.; Shen, Y.M. Remote sensing monitoring and preventive countermeasures of coastal erosion in Jiangsu Province. Ocean. Dev. Manag. 2021, 38, 84–89, (In Chinese with English abstract). [Google Scholar]
- He, J.; Fu, C.L.; Shu, L.Y.; Zhang, G.; Wan, K.C. Analysis on the status quo and cause of erosion and deposition of Yancheng coastline in Jiangsu Province. J. Geol. 2021, 45, 189–196, (In Chinese with English abstract). [Google Scholar]
- Huang, L.; Zhao, C.; Jiao, C.; Zheng, G.; Zhu, J. Quantitative Analysis of Rapid Siltation and Erosion Caused Coastline Evolution in the Coastal Mudflat Areas of Jiangsu. Water 2023, 15, 1679. [Google Scholar] [CrossRef]
- Wang, K.; Li, H.; Zhang, N.; Zhang, J.; Zhang, X.; Gong, Z. Study on the Erosion and Deposition Changes of Tidal Flat in Jiangsu Province Using ICESat-2 and Sentinel-2 Data. Remote Sens. 2023, 15, 3598. [Google Scholar] [CrossRef]
- Wang, A.J.; Ye, X. Erosion and deposition processes of cohesive sediment in Spartina alterniflora marsh, Luoyuan Bay in the north of Fujian coast, China. Quat. Sci. 2013, 33, 582–593, (In Chinese with English abstract). [Google Scholar]
- Shi, B.W.; Cooper, J.R.; Li, J.S.; Yang, Y.; Yang, S.L.; Luo, F.; Yu, Z.X.; Wang, Y.P. Hydrodynamics, erosion and accretion of intertidal mudflats in extremely shallow waters. J. Hydrol. 2019, 573, 31–39. [Google Scholar] [CrossRef]
- Chen, D.Z.; Tang, J.P.; Xing, F.; Cheng, J.; Li, M.L.; Zhang, Y.Y.; Shi, B.W.; Shi, L.Q.; Wang, Y.P. Erosion and accretion of salt marsh in extremely shallow water stages. Front. Mar. Sci. 2023, 10, 1198536. [Google Scholar] [CrossRef]
- Xing, F.; Wang, Y.P.; Jia, J.J. Hydrodynamic and sediment transport patterns on intertidal flats along middle Jiangsu coast. Anthorpocene Coasts 2022, 5, 12. [Google Scholar] [CrossRef]
- Xing, F.; Wang, Y.P.; Wang, H.V. Tidal hydrodynamics and fine-grained sediment transport on the radial sand ridge system in the suthern Yellow Sea. Mar. Geol. 2012, 291–294, 192–210. [Google Scholar] [CrossRef]
- Wang, J. Coastal Mudflat in Jiangsu Province and Their Utilization Potential; China Ocean Press: Beijing, China, 2012; p. 564. (In Chinese) [Google Scholar]
- Fugate, D.C.; Friedrichs, C.T. Determining concentration and fall velocity of estuarine particle populations using ADV, OBS and LISST. Cont. Shelf Res. 2002, 22, 1867–1886. [Google Scholar] [CrossRef]
- Voulgaris, G.; Meyers, S.T. Temporal variability of hydrodynamics, sediment concentration and sediment settling velocity in a tidal creek. Cont. Shelf Res. 2004, 24, 1659–1683. [Google Scholar] [CrossRef]
- Collins, M.B.; Ke, X.; Gao, S. Tidally-induced flow structure over intertidal flats. Estuar. Coast. Shelf Sci. 1998, 46, 233–250. [Google Scholar] [CrossRef]
- Dyer, K.R. Coastal and Estuarine Sediment Dynamics; John Wiley & Sons: Chichester, UK, 1986; p. 341. [Google Scholar]
- Pope, N.D.; Widdows, J.; Brinsley, M.D. Estimation of bed shear stress using the turbulent kinetic energy approach-A comparison of annular flume and field data. Cont. Shelf Res. 2006, 26, 959–970. [Google Scholar] [CrossRef]
- Soulsby, R. Dynamics of Marine Sands: A Manual for Practical Applications; Thomas Telford: London, UK, 1997; p. 249. [Google Scholar]
- Longuet-Higgins, M.S. On the statistical distribution of the height of sea waves. J. Mar. Res. 1952, 11, 245–266. [Google Scholar]
- Karimpour, A.; Chen, Q. Wind wave analysis in depth limited water using OCEANLYZ, A MATLAB toolbox. Comput. Geosci. 2017, 106, 181–189. [Google Scholar] [CrossRef]
- Fredsoe, J.; Deigaard, R. Mechanics of Coastal Sediment Transport; World Scientific: Singapore, 1992; p. 369. [Google Scholar]
- Krone, R.B. Flume studies of the transport of sediment in estuarine shoaling processes. In Final Report to San Francisco District; U.S. Army Corps of Engineers: Washington, DC, USA, 1962. [Google Scholar]
- Partheniades, E. Erosion and deposition of cohesive soils. J. Hydraul. Div. Proc. ASCE 1965, 91, 105–139. [Google Scholar] [CrossRef]
- Robert, W.; Whitehouse, R.J.S. Predicting the profile of intertidal mudflats formed by crossshore tidal currents. In Coastal and Estuarine Fine Sediment Processes; McAnally, W.H., Mehta, A.J., Eds.; Elsevier Science: Amsterdam, The Netherlands, 2001; pp. 263–285. [Google Scholar]
- Whitehouse, R.J.S.; Soulsby, R.L.; Roberts, W.; Mitchener, H.J. Dynamics of Estuarine Muds: A Manual for Practical Applications; Thomas Telford: London, UK, 2000; pp. 42–186. [Google Scholar]
- Bagnold, R.A. Mechanics of marine sedimentation. In The Sea: Ideas and Observations; Hill, M.N., Ed.; Wiley-Interscience: New York, NY, USA, 1963; pp. 507–528. [Google Scholar]
- Cai, F.; Su, X.Z.; Liu, J.H.; Li, B.; Lei, G. Coastal erosion in China under the condition of global climate change and measures for its prevention. Prog. Nat. Sci. 2009, 19, 415–426. [Google Scholar] [CrossRef]
- Fan, D.D. Open-Coast Tidal Flats. In Principles of Tidal Sedimentology; Davis, R.A., Dalrymple, R.W., Eds.; Springer Science: New York, NY, USA, 2012; pp. 187–229. [Google Scholar]
- Zhong, Z.; Hu, Z. The Impact of Reclamation on Tidal Flat Morphological Equilibrium. Front. Mar. Sci. 2021, 8, 769077. [Google Scholar] [CrossRef]
- Woodroffe, C.D. Coasts: Form, Process and Evolution; Cambridge University Press: Cambridge, UK, 2002; p. 620. [Google Scholar]
- Gao, S.; Jia, J.J.; Yu, Q. Theoretical framework for coastal accretion-erosion analysis: Material budgeting, profile morphology, shoreline change. Mar. Geol. Quat. Geol. 2023, 43, 1–17, (In Chinese with English abstract). [Google Scholar]
- Jiang, B.X. Dynamic status of erosion and deposition along Yancheng Coast, Jiangsu Province. Acta Oceanol. Sin. 1993, 15, 57–62. (In Chinese) [Google Scholar]
- Yu, Z.Y.; Chen, D.C.; Jin, L. The formation and erosion transformation of the old Yellow River subaqueous delta in northern Jiangsu province. Acta Oceanol. Sin. 1986, 8, 197–206. (In Chinese) [Google Scholar]
- Chen, W.T.; Zhang, D.; Shi, S.J.; Zhou, J.; Kang, M. Research on monitoring coastline changes by remote sensing in muddy coast, central Jiangsu coast. Haiyang Xuebao 2017, 39, 138–148, (In Chinese with English abstract). [Google Scholar]
- Chen, K.F.; Wang, Y.H.; Lu, P.D.; Yu, L.L. Research on the abandoned Huanghe River Delta erosion process and impact on tidal current characteristics of the Huanghai Sea off the coast of North Jiangsu, China. Acta Oceanol. Sin. 2013, 35, 189–196, (In Chinese with English abstract). [Google Scholar]
- He, X.Y.; Wang, Y.P.; Zhu, Q.G.; Zhang, Y.; Zhang, D.; Zhang, J.C.; Yang, Y.; Gao, J.H. Simulation of sedimentary dynamics in a small-scale estuary: The role of human activities. Environ. Earth Sci. 2015, 74, 869–878. [Google Scholar] [CrossRef]
- Liu, Q.; Zhang, G.; Xiang, L.H.; Zhang, X.F. Characteristics and genesis of erosion and deposition in Sheyang Port before and after double-dyke construction. Mar. Sci. Bull. 2017, 36, 561–567, (In Chinese with English abstract). [Google Scholar]
- Li, M.L.; Wu, S.L.; Gong, X.L.; Yang, L.; Gou, F.G.; Li, J. Characteristics of coastline change under the influence of human activities in central Jiangsu Province from 1989 to 2019. Mar. Sci. 2022, 46, 60–68, (In Chinese with English abstract). [Google Scholar]
- Lim, B.J.; Chang, Y.S.; Cho, Y.K. Effects of stepwise tidal flat reclamation on tidal evolution in the East China and Yellow Sea. Environ. Res. Lett. 2023, 18, 104041. [Google Scholar] [CrossRef]
- Wang, Y.P.; Gao, S.; Jia, J.J.; Thompson, C.E.L.; Gao, J.H.; Yang, Y. Sediment transport over an accretional intertidal flat with influence of reclamation, Jiangsu coast, China. Mar. Geol. 2012, 291–294, 147–161. [Google Scholar] [CrossRef]
- Postma, H. Transport and accumulation of suspended matter in the Dutch Wadden Sea. Neth. J. Sea Res. 1961, 1, 148–190. [Google Scholar] [CrossRef]
- Shi, B.W.; Yang, S.L.; Wang, Y.P.; Bouma, T.J.; Zhu, Q. Relating accretion and erosion at an exposed tidal wetland to the bottom shear stress of combined current-wave action. Geomorphology 2012, 138, 380–389. [Google Scholar] [CrossRef]
- Colosimo, I.; de Vet, P.L.M.; van Maren, D.S.; Reniers, A.J.H.M.; Winterwerp, J.C.; van Prooijen, B.C. The impact of wind on flow and sediment transport over intertidal flats. J. Mar. Sci. Eng. 2020, 8, 910. [Google Scholar] [CrossRef]
- Jia, Y.G.; Zheng, J.W.; Yue, Z.; Liu, X.L.; Shan, H.X. Tidal flat erosion of the Huanghe River Delta due to local changes in hydrodynamic conditions. Acta Oceanol. Sin. 2014, 33, 116–124. [Google Scholar] [CrossRef]
- Hu, Z.; Yao, P.; van der Wal, D.; Bouma, T.J. Patterns and drivers of daily bed level dynamics on two tidal flats with contrasting wave exposure. Sci. Rep. 2017, 7, 7088. [Google Scholar] [CrossRef]
- Belliard, J.P.; Silinski, A.; Meire, D.; Kolokythas, G.; Levy, Y.; Van Braeckel, A.; Bouma, T.J.; Temmerman, S. High-resolution bed level changes in relation to tidal and wave forcing on a narrow fringing macrotidal flat: Bridging intra-tidal, daily and seasonal sediment dynamics. Mar. Geol. 2019, 412, 123–138. [Google Scholar] [CrossRef]
- Xie, W.; Sun, J.; Guo, L.; Xu, F.; Wang, X.; Ji, H.; Fan, Y.; Wang, Z.B.; He, Q. Distinctive sedimentary processes on two contrasting tidal flats of the Yellow River Delta. Front. Mar. Sci. 2023, 10, 1259081. [Google Scholar] [CrossRef]
- Zhao, Y.Y.; Yu, Q.; Wang, D.D.; Wang, Y.P.; Wang, Y.W.; Gao, S. Rapid formation of marsh-edge cliffs, Jiangsu coast, China. Mar. Geol. 2017, 385, 260–273. [Google Scholar] [CrossRef]
- Yu, K.; Tao, J.F.; Zhou, Z.Y.; Aarninkhof, S.; Wang, Z.B. Sediment characteristics and intertidal beach slopes along the Jiangsu coast, China. J. Mar. Sci. Eng. 2021, 9, 347. [Google Scholar] [CrossRef]
- Paarlberg, A.J.; Knaapen, M.A.F.; de Vries, M.B.; Hulscher, S.J.M.H.; Wang, Z.B. Biological influences on morphology and bed composition of an intertidal flat. Estuar. Coast. Shelf Sci. 2005, 64, 577–590. [Google Scholar] [CrossRef]
- Shi, B.W.; Pratolongo, P.D.; Du, Y.F.; Li, J.S.; Yang, S.L.; Wu, J.H.; Xu, K.H.; Wang, Y.P. Influence of macrobenthos (Meretrix meretrix Linnaeus) on erosion-accretion processes in intertidal flats: A case study from a cultivation zone. J. Geophys. Res. Biogeosciences 2020, 125, e2019JG005345. [Google Scholar] [CrossRef]


| Station | Season | Statistical Value | h (m) | Hs (m) | T (s) | ua (m/s) | SSC (g/L) | τc (N/m2) | τw (N/m2) | τcw (N/m2) |
|---|---|---|---|---|---|---|---|---|---|---|
| B0 | Winter | Maximum | 1.690 | 0.716 | 6.130 | 0.238 | 0.412 | 1.174 | 0.361 | 1.177 |
| Mean | 0.877 | 0.294 | 4.181 | 0.083 | 0.145 | 0.196 | 0.132 | 0.211 | ||
| Deviation | 0.356 | 0.177 | 0.630 | 0.052 | 0.103 | 0.237 | 0.091 | 0.234 | ||
| Summer | Maximum | 2.130 | 0.677 | 5.897 | 0.302 | 0.469 | 0.980 | 0.287 | 0.980 | |
| Mean | 1.224 | 0.312 | 4.049 | 0.120 | 0.136 | 0.197 | 0.091 | 0.205 | ||
| Deviation | 0.393 | 0.148 | 0.572 | 0.063 | 0.103 | 0.186 | 0.062 | 0.184 | ||
| B1 | Winter | Maximum | 3.313 | 0.979 | 5.757 | 0.621 | 1.968 | 3.392 | 0.751 | 3.394 |
| Mean | 1.860 | 0.389 | 3.800 | 0.232 | 0.507 | 0.606 | 0.243 | 0.627 | ||
| Deviation | 0.747 | 0.183 | 0.497 | 0.123 | 0.428 | 0.604 | 0.168 | 0.599 | ||
| Summer | Maximum | 3.725 | 0.856 | 6.047 | 0.394 | 2.400 | 1.662 | 0.550 | 1.665 | |
| Mean | 2.123 | 0.378 | 3.877 | 0.196 | 0.589 | 0.495 | 0.195 | 0.509 | ||
| Deviation | 0.868 | 0.142 | 0.571 | 0.089 | 0.417 | 0.360 | 0.117 | 0.356 |
| Station | Season | Statistical Value | Erosion Rate (×10−3 kg/m2∙s) | Deposition Rate (×10−5 kg/m2∙s) | ||||
|---|---|---|---|---|---|---|---|---|
| FE-c | FE-w | FE-cw | FD-c | FD-w | FD-cw | |||
| B0 | Winter | Maximum | −2.111 | −0.486 | −2.118 | 2.848 | 6.136 | 2.840 |
| Mean | −0.505 | −0.176 | −0.494 | 0.233 | 0.864 | 0.148 | ||
| Summer | Maximum | −1.724 | −0.338 | −1.724 | 2.625 | 7.043 | 2.624 | |
| Mean | −0.404 | −0.107 | −0.400 | 0.288 | 0.388 | 0.213 | ||
| B1 | Winter | Maximum | −6.522 | −1.239 | −6.525 | 6.832 | 18.070 | 3.959 |
| Mean | −1.220 | −0.383 | −1.205 | 0.718 | 1.025 | 0.594 | ||
| Summer | Maximum | −3.061 | −0.837 | −3.069 | 21.721 | 9.565 | 17.338 | |
| Mean | −0.959 | −0.269 | −0.959 | 2.536 | 1.179 | 2.079 | ||
| Station | Season | Net Erosion Flux (kg/m2) | Net Transport of Near-Bed Suspended Sediment | Net Transport of Bedload | ||
|---|---|---|---|---|---|---|
| Flux (kg/m) | Direction (°) | Flux (kg/m) | Direction (°) | |||
| B0 | Winter | −75.4 | 2001.3 | 111.5 | 146.7 | 140.1 |
| Summer | −83.0 | 2801.9 | 4.6 | 158.7 | 12.3 | |
| B1 | Winter | −622.3 | 30,683.2 | 152.7 | 1312.4 | 156.3 |
| Summer | −516.5 | 23,529.7 | 2.9 | 254.8 | 24.6 | |
Disclaimer/Publisher’s Note: The statements, opinions and data contained in all publications are solely those of the individual author(s) and contributor(s) and not of MDPI and/or the editor(s). MDPI and/or the editor(s) disclaim responsibility for any injury to people or property resulting from any ideas, methods, instructions or products referred to in the content. |
© 2024 by the authors. Licensee MDPI, Basel, Switzerland. This article is an open access article distributed under the terms and conditions of the Creative Commons Attribution (CC BY) license (https://creativecommons.org/licenses/by/4.0/).
Share and Cite
Zhang, W.; Ouyang, K.; Zhang, X.; Wang, A.; Yu, Q.; Ye, X.; Yao, C. Tidal Flat Erosion Processes and Their Dynamic Mechanisms on the South Side of Sheyang River Estuary, Jiangsu Province. J. Mar. Sci. Eng. 2024, 12, 687. https://doi.org/10.3390/jmse12040687
Zhang W, Ouyang K, Zhang X, Wang A, Yu Q, Ye X, Yao C. Tidal Flat Erosion Processes and Their Dynamic Mechanisms on the South Side of Sheyang River Estuary, Jiangsu Province. Journal of Marine Science and Engineering. 2024; 12(4):687. https://doi.org/10.3390/jmse12040687
Chicago/Turabian StyleZhang, Wangze, Kai Ouyang, Xiaofei Zhang, Aijun Wang, Qian Yu, Xiang Ye, and Caihua Yao. 2024. "Tidal Flat Erosion Processes and Their Dynamic Mechanisms on the South Side of Sheyang River Estuary, Jiangsu Province" Journal of Marine Science and Engineering 12, no. 4: 687. https://doi.org/10.3390/jmse12040687