
Numerical Simulation and Analysis of Added Mass for the Underwater Variable Speed Motion of Small Objects

1
School of Optics and Photonics, Beijing Institute of Technology, Beijing 100081, China
2
Yangtze Delta Region Academy, Beijing Institute of Technology, Jiaxing 314003, China
3
Rubber Research Institute, Chinese Academy of Tropical Agricultural Sciences, Haikou 570216, China
4
Beijing Aerospace Automatic Control Institute, Beijing 100854, China
5
College of Intelligent Manufacturing, Yangzhou Polytechnic Institute, Yangzhou 225127, China
*
Author to whom correspondence should be addressed.
J. Mar. Sci. Eng. 2024, 12(4), 686; https://doi.org/10.3390/jmse12040686
Submission received: 29 March 2024
/
Revised: 15 April 2024
/
Accepted: 16 April 2024
/
Published: 22 April 2024
(This article belongs to the Special Issue Application of CFD Simulations to Marine Hydrodynamic Problems)
Abstract
:Unlike uniform motion, when an object moves underwater with variable speed, it experiences additional resistance from the water, commonly referred to as added mass force. At present, several methods exist to solve this force, including theoretical, experimental, and simulation approaches. This paper addresses the challenge of determining the added mass force for irregularly shaped small objects undergoing variable speed motion underwater, proposing a method to obtain the added mass force through numerical simulation. It employs regression analysis and parameter separation analysis to solve the added mass force, added mass, viscous drag coefficient, and pressure drag coefficient. The results indicate that an added mass force exists during both the acceleration and deceleration of the object, with little difference between them. Under the same velocity conditions, significant differences exist in pressure drag forces, while differences in viscous drag forces are not significant. This suggests that the primary source of added mass force is pressure drag, with viscous drag having little effect on it. During acceleration, the surrounding fluid accelerates with the object, increasing the pressure drag with a high-pressure area concentrating at the object’s front, forming an added mass force that is directed backward. By contrast, during deceleration, the fluid at the object’s front tends to detach, and the fluid at the rear rushes forward, leading to a smaller high-pressure area at the front and a larger one at the rear, reducing the pressure drag and forming an added mass force that is directed forward. By comparing the added mass of a standard ellipsoid obtained from numerical simulation with theoretical values, the regression analysis method is proven to be highly accurate and entirely applicable for solving the added mass of underwater vehicles.
1. Introduction
When a rigid body accelerates relative to the surrounding fluid, it experiences additional inertial forces. That is, if two rigid bodies are moving at the same speed, the one that is accelerating will be subjected to a greater force from the water. The underlying reason for this is that when the rigid body accelerates, the surrounding fluid will also accelerate, as if additional mass was attached to the rigid body, resulting in an increase in the body’s inertia [1,2]. Added mass, a classical concept in the field of fluids, was proposed by researchers and has been widely studied for many years. The added mass effect was discovered by Du Buat in 1786 and Friedrich Bessel in 1828, independently. Added mass is of fundamental importance in hydrodynamic research [1].
Currently, researchers employ various methods to determine the added mass of objects, including Analytical and Semi-Empirical (ASE), Experimental Fluid Dynamics (EFD), and Computational Fluid Dynamics (CFD) approaches [3]. Analytical methods mainly consist of Strip Theory (ST) and the Equivalent Ellipsoid Method (EMM), which calculate the added mass based on the object’s geometry. These methods solve for velocity potential using boundary conditions and determine the pressure distribution around the object using Bernoulli’s equation, thus solving for the hydrodynamic forces and moments acting on the object. ST divides the object into a finite number of transverse two-dimensional slices, solving for the added mass by integrating slice values along the length of the object [4]. In EMM, different parts of the object are assumed to be equivalent ellipsoids, and the velocity potential is solved using the Laplace equation, thereby obtaining the added mass of each equivalent ellipsoid. By integrating the added mass of different parts in a specific direction, the added mass in that direction can be solved [5]. Overall, ASE methods are only suitable for objects with simple shapes, as increased complexity can reduce accuracy. These methods require sufficient experimental data and must consider the complexity of the object’s shape [6,7].
In EFD methods, researchers have developed numerous experimental techniques to study added mass, such as free oscillation [8,9,10,11] and forced oscillation [12,13,14,15,16]; these inertia methods, with extensive experimental setups like the Rotating Arm (RA) and Planar Motion Mechanism (PMM), are being developed [17,18]. Most added masses are currently analyzed from the hydrodynamic characteristics of oscillation, but new methods for solving added mass, such as PIV testing and trajectory tracking, have emerged [19,20,21], which can solve the added mass of deformable objects. EFD methods are the most direct way to solve added mass, with relatively mature related technologies. However, they are not suitable for very large or small objects. On one hand, large sizes can affect the implementation of related experiments; on the other hand, small sizes can lead to significant errors, affecting the resulting accuracy. Moreover, due to the need for special facilities and equipment (e.g., PMM) to generate an object’s acceleration, these methods are not only costly but also time-consuming.
CFD includes two methods for estimating added mass: the first is based on potential flow assumptions, including the Panel Method (PM), Boundary Element Method (BEM), and Finite Element Method (FEM). Many researchers have used PM [22,23,24,25], BEM [26,27,28,29,30], and FEM [31,32] to predict the added mass coefficients of objects. In practice, the viscosity of the fluid around the object can reduce the accuracy of the results obtained from these assumptions. The second approach uses commercial CFD software (https://link.springer.com/article/10.1007/s11804-010-9009-9, accessed on 28 March 2024) to simulate dynamic testing processes like PMM and RA. In these simulation methods, the RANS equations are solved in the computational domain, considering the effect of fluid viscosity. With the continuous development of commercial CFD software, numerous related studies have emerged [33,34,35,36,37,38,39], making this method a supplementary approach to experimental testing.
In recent years, the added mass effect has received increasing attention and research [40,41,42,43,44]. With the continuous development of marine technology, underwater vehicles are evolving toward miniaturization, possessing advantages such as compact size, agile movement, low resistance, good concealment, and low noise. They play an important role in intelligence gathering, target tracking and striking, monitoring enemy actions, and cluster warfare, with a very broad prospect for military applications [45,46,47,48,49,50,51]. Due to the flexible and variable movement of miniature underwater robots, with constantly changing directions and speeds, the added mass effect becomes more significant and is an important factor that cannot be ignored. On the other hand, with the continuous exploitation of marine resources and advancements in underwater visual capabilities, underwater robots equipped with multi-degree-of-freedom manipulators will continue to emerge. They can perform targeted collection and exploration of marine resources, and the irregular motion of the manipulators and underwater robots will also generate significant added mass forces. Therefore, there is an urgent need to find a simple, quick, and convenient method to solve for added mass. With the continuous advancement of numerical simulation technology, several studies have applied this technique to complex fluid dynamics analysis [52,53,54]. This paper employs numerical simulation as a means, combined with effective data analysis methods, to analyze and study the added mass of objects in variable speed motion underwater. Compared to existing methods, the approach proposed in this paper does not require complex theoretical derivations and assumptions. It relies on the dependency relationship between fluid resistance and motion variables, utilizing a large number of data samples to solve mechanical parameters. This method is not only simple, understandable, and easy to operate, but it also maintains good analytical precision under the premise of ensuring the accuracy of simulation results. All of these indicate that this method is applicable to the actual mechanical analysis of underwater vehicles, simplifying the analysis process and significantly shortening the analysis cycle.
2. Methods
As previously mentioned, when a rigid body moves underwater linearly with variable speed, it experiences an additional force known as added mass force. In laminar flow conditions, an object moving underwater at a constant speed is subject only to viscous drag and pressure drag. Therefore, the water resistance experienced by an object in variable speed motion can be decomposed into the viscous drag and pressure drag corresponding to the current speed of motion, in addition to the extra added mass force. Pressure drag is caused by the difference in fluid pressure between the front and back surfaces of the rigid body. Viscous drag, also referred to as wall shear stress, is induced by the viscosity of the fluid. When a rigid body moves underwater, the viscous fluid rubs against the surface of the body, hindering its movement and forming viscous drag. Generally, for small objects moving at low speeds, the viscous drag is dominant, while for large objects moving at high speeds, the pressure drag predominates. The viscous drag is approximately proportional to the first power of the relative speed between the object and the fluid, whereas the pressure drag is approximately proportional to the square of their relative speed. These two types of drag exist during the motion of the rigid body, regardless of whether the motion is uniform.
The third type of force, the added mass force, is an additional force that arises due to the variable speed motion of the object in the fluid. When two identical objects move through a fluid at the same speed, the one accelerating experiences greater fluid resistance. The difference between the two is referred to as the added mass force. This phenomenon occurs because, when an object accelerates in a fluid, the surrounding fluid will also accelerate due to frictional forces. The inertial force of this portion of the fluid acts back on the object, making it more difficult for the object to accelerate. This effect appears as if the mass of the object has increased, and this additional mass is referred to as added mass. Figure 1 demonstrates the drags acting on a rigid body under three distinct motion conditions. From the figure, it is evident that pressure drag and viscous drag consistently act in opposition to the direction of motion. Conversely, the added mass force opposes the direction of the rigid body’s acceleration. The computational formula for fluid resistance is provided in Equation (1), while Equation (2) delineates the relationship between the added mass force and the added mass itself.
where Fdw represents the total resistance experienced by an object moving underwater (N); Fdp denotes the pressure drag on the object during uniform motion (N); Fdv is the viscous drag on the object during uniform motion (N); Fam indicates the added mass force acting on the object (N).
where m* represents the added mass (kg); a is the acceleration of the object (m·s−2), with the constraint that the fluid is either stationary or moving at a constant speed.
Currently, numerous papers have introduced methods for determining added mass from both experimental and simulation perspectives. For regular objects, added mass can be obtained through theoretical derivation. However, for smaller, irregularly shaped objects, which also tend to have less mass, it is challenging to ascertain their added mass during underwater motion through experimental and theoretical derivation methods. The numerical simulation methods available at present are also somewhat cumbersome.
To address the challenges encountered in the solution process mentioned above, this paper proposes a solution based on CFD simulation methods for determining the added mass of irregularly shaped small objects. The methodological schematic is shown in Figure 2, with the specific steps outlined as follows:
- (1)
- Based on three-dimensional models of a standard ellipsoid and an irregular object, the fluid domain mesh is partitioned. The Fluent 19.2 software is utilized to simulate the process of a standard ellipsoid and an irregular object undergoing variable acceleration movement underwater.
- (2)
- The fluid resistance curve is fitted using the least squares method, with the model’s speed and acceleration (v, a) as independent variables, and the total water resistance (Fdw) as the dependent variable. The specific fitting function is shown in Equation (3). This method is primarily based on the components of Fdw, by utilizing a large set of sample data to solve the three parameters , , and .where Fdw represents the total water resistance experienced by the model during its motion (N); Fdb denotes the water resistance acting on the model during motion, excluding the added mass force (N); Fam is the added mass force (N); , , and are constants to be determined through fitting; v is the speed of the model (m·s−1); a represents the acceleration of the model (m·s−2).
- (3)
- Based on the components of Fdb and the relationship between Fam and m*, the values of C1, C2, and m* can be determined, as shown in Equations (4)–(6).where C1 and C2 are the coefficients for the viscous drag and pressure drag, respectively, and can be considered constants within a certain range of Reynolds numbers; μ is the dynamic viscosity of water (Pa·s); L is the characteristic length scale; ρ is the density of water (kg·m−3); SW is the model’s maximum cross-sectional area facing the flow (m2).
- (4)
- As a method of verification in contrast to process (2), this step employs the parameter separation method to solve for the three parameters , , and . Seven sets of uniform motion simulations are added. According to the cause of the added mass force, by comparing the water resistance of each group with that of the same speed during the acceleration process, the added mass force under the accelerated state can be obtained. From the relationship graph between the seven sets of added mass forces and acceleration, the parameter , which represents the added mass of both the standard ellipsoid and irregular object, can be obtained. Similarly, during the simulation process, viscous drag and pressure drag data at different speeds are extracted. By understanding the relationship between the viscous drag or pressure drag and the speed, parameters and can be solved.
- (5)
- By comparing the differences between the added mass of the standard ellipsoid and its theoretical values, the accuracy of the methods used in processes (2) and (3) can be assessed, thereby obtaining a reasonable approach to solving for added mass.
3. Numerical Simulation Methodology
3.1. Governing Equation
This numerical simulation, targeting the process of the underwater variable speed motion of objects, is classified as viscous incompressible single-phase flow, adhering to the laws of mass conservation and momentum conservation. The fluid control equations can be provided by the mass conservation of Equation (7) and the momentum conservation of Equation (8).
where ρ represents the fluid density (kg·m−3); μ is the dynamic viscosity of the fluid (Pa·s); p denotes pressure (pa); , , are the components of the velocity vector (m·s−1); , , are the components of the volume force’s unit vector.
In this numerical simulation, the fluid medium water is considered incompressible, with ρ being constant. Thus, the continuity equation can be obtained as shown in Equation (9).
3.2. Solution Model Selection
When an object moves underwater, the resistance acting on it typically depends on numerous factors, including the density and dynamic viscosity of the fluid, as well as the object’s own geometric shape, surface characteristics, and velocity. The Reynolds number (Re) plays a crucial role in determining fluid flow characteristics and resistance [55], as shown in Equation (10). The values of density and dynamic viscosity of liquid water at different temperatures are presented [56], as shown in Table 1.
where ρ represents the density of the fluid (kg·m−3); v is the relative velocity of the object with respect to the fluid (m·s−1); μ is the dynamic viscosity of the fluid (Pa·s); L denotes the characteristic length of the object (m).
In this numerical simulation, the minimum and maximum velocities of the model moving underwater are 0.04 m/s and 1.4 m/s, respectively, with the characteristic length of the model being 36 mm. Assuming the temperature of the water is at room temperature, 25 °C, the range of Reynolds numbers (Re) during the model’s motion is from 1613 to 56,445. This indicates that both laminar and turbulent flow states exist during the model’s movement.
In Fluent software, five main categories of turbulence models are provided, including the Spalart–Allmaras model, k-ε models (further divided into the standard k-ε model, RNG k-ε model, and k-ε model with turbulence correction), k-ω models (further divided into the standard k-ω model and pressure-corrected k-ω model), the Reynolds Stress Model (RSM), and Large Eddy Simulation (LES). The first four methods obtain flow field data by solving the Reynolds-averaged Navier–Stokes (RANS) equations, a method that averages over time to eliminate the effects of vortices, known as the RANS method. LES is an intermediate method based on Direct Numerical Simulation (DNS) and RANS. In LES, coarse large-scale vortices are simulated using DNS, while smaller-scale vortices are modeled using RANS, requiring a relatively high mesh quality. DNS is a numerical solution method based on the Navier–Stokes equations that fully resolves every vortex in the fluid. This method is the most accurate in terms of computation but also the most resource-intensive.
In this numerical simulation, due to the relatively small size of the model and the moderate Reynolds number, the RANS method was chosen. Within the RANS methodologies, the Spalart–Allmaras model is designed for aviation applications, primarily focusing on wall-bounded flows. Among the k-ε models, the standard k-ε model is intended for high Reynolds number flows. The RNG k-ε model offers an analytical formula that accounts for low Reynolds number flow viscosity. Both the turbulence-corrected k-ε model and the RNG k-ε model exhibit better performance than the standard k-ε model in conditions of strong streamline curvature, vortices, and rotation. In the k-ω models, the standard k-ω model is based on the Wilcox k-ω model, modified for low Reynolds numbers, compressibility, and shear flow propagation. The SST k-ω model integrates cross-diffusion from the ω equation and takes into account the turbulent shear stress propagation, offering higher accuracy and reliability than the standard k-ω model. The RSM model rigorously accounts for streamline bend, vortices, rotation, and rapid changes in tension, providing higher accuracy for complex flows. However, pressure tension and dissipation rates are the main factors that can reduce the prediction accuracy of the RSM model. It is necessary to use the RSM model when considering the anisotropy of Reynolds stresses, such as in hurricane flows, secondary flows in pipes, etc. Consequently, for this numerical simulation, the RNG k-ε model was selected.
3.3. Mesh Division of Fluid Computational Domain
The smaller the mesh size, the finer the calculation domain will be divided, and the more accurate the simulation results will be. However, an excessive number of meshes can significantly extend computation time, resulting in the wastage of computational resources. By densifying the mesh in areas where the flow changes abruptly and appropriately and increasing the mesh size in areas with less significant changes, accurate simulation results will also be achieved. The computational domain in this numerical simulation is divided into four fluid regions: Fluid 1, Fluid 2, Fluid 3, and Fluid 4, as illustrated in Figure 3.
The entire fluid domain is cylindrical, and the hybrid mesh is employed, with unstructured mesh used to densify the surrounding area of the model, while structured mesh is used in other areas. Among these, the cylindrical fluid domain around the model is Fluid 4, which is designated as a dynamic mesh area using unstructured tetrahedral meshes. The fluid domain behind Fluid 4 is Fluid 1, and the fluid domain in front of it is Fluid 2. Dynamic layering is used to update the mesh in these areas. During the model’s motion, the mesh in the Fluid 1 area will stretch, and the mesh in the Fluid 2 area will compress. When stretching or compression reaches a set value, the mesh in that area will be updated and reorganized. The peripheral fluid domain of Fluid 1, Fluid 2, and Fluid 4 is Fluid 3, which serves to connect the wall and the inner fluid areas. Fluid 1, Fluid 2, and Fluid 3 all utilize hexahedral meshes. To ensure the accuracy of the numerical simulation, the mesh of the cylindrical fluid domain Fluid 4 is densified around the model, while the meshes in other fluid domains are relatively sparse, which can somewhat shorten the computation time. The mesh parameters for each fluid domain are shown in Table 2. The data in the table indicate that the mesh quality exceeds 0.2 for all cases, meeting the computational requirements.
3.4. Solution Method
In this simulation, the numerical discrete method adopted a pressure-based incompressible PISO algorithm, the transient time dispersion method adopted the Euler implicit format, the gradient term dispersion method adopted the Green–Gauss node-based format, and the pressure dispersion method adopted the body force weighted format. The fixed time step length is set according to the maximum speed of the object. A User-Defined Function (UDF) is employed to capture instantaneous data on the resistance and coordinates of the object moving underwater at each time step. The viscous drag and pressure drag are extracted every 10 time steps through defined Commands and Macros. To achieve the underwater variable speed motion of the model, the simulation process uses UDFs to assign velocities to the model, with the movement speeds of the standard ellipsoid and irregular model presented in Table 3. Additionally, the fluid surrounding the model is stationary.
4. Result Analysis and Discussion
4.1. Fluid Resistance Change Characteristics during Variable Speed Process
As depicted in Figure 4a, within the acceleration phase, the object starts with a velocity of nearly zero, and the initial acceleration is at its maximum positive value. As the acceleration continues, the velocity of the object reaches its peak, while the acceleration gradually decreases to zero. Upon entering the deceleration phase, the object’s velocity gradually reduces, eventually nearing zero, as the negative value of the acceleration increases, reaching its maximum negative value by the end of the deceleration phase. Overall, the curve of the velocity is symmetrical about the t = 0.5 s axis, and the acceleration change curve is symmetrical around the coordinate point (0.5, 0).
As shown in Figure 4b, the relationship between acceleration and velocity can be approximately described as follows: the greater the absolute value of the acceleration, the lower the object’s velocity, and conversely, the smaller the absolute value of the acceleration, the higher the object’s velocity. This facilitates the distinction between pressure drag, viscous drag, and added mass force during the object’s variable speed movement.
From Figure 4c, it is evident that during the acceleration phase, the standard ellipsoid’s pressure drag is significantly higher than its viscous drag, and the maximum difference approaches 6 mN, which is approximately 50% of the viscous drag. However, upon entering the deceleration phase, the pressure drag decreases rapidly, whereas the reduction in the viscous drag is relatively slow; at around 0.75 s, the pressure drag equals the viscous drag, after which the pressure drag further decreases, resulting in the pressure drag being 3 mN less than the viscous drag during the later stages of the deceleration phase. By the end of the deceleration phase, the pressure drag turns positive, indicating that it has transitioned from resistance to propulsion. During the deceleration phase, the pressure drag changes by approximately 22 mN, while the viscous drag changes by about 15 mN. This reveals that pressure drag is more sensitive to changes in the direction of the acceleration. Similarly, during the initial phase of the acceleration phase, the difference between the pressure drag and viscous drag for an irregular object is minimal. Subsequently, the difference between the two continues to increase; during the later phase of the deceleration phase, the pressure drag is notably less than viscous drag, and the difference reaches its maximum value of 3 mN, further illustrating the pressure drag’s greater sensitivity to acceleration direction changes. Additionally, there are significant differences in the proportion of the pressure drag and viscous drag between different objects, primarily due to the pressure drag being largely influenced by the object’s shape.
As Figure 4d shows, the difference in the viscous drag between the acceleration and deceleration phases is minimal, with only slight variations at lower velocities, whereas pressure drag exhibits more substantial differences. This indicates that under identical velocity conditions, the viscous drag remains essentially unchanged, while differences in acceleration significantly impact the pressure drag.
As shown in Figure 5a, the difference in the pressure drag at the same speed points during the acceleration and deceleration phases for a standard ellipsoid is approximately twice that of the irregular model, where the velocities are identical, but the directions of the acceleration are opposite. Since acceleration is the source of added mass force, this difference is actually caused by the added mass force, indicating that the added mass force of the standard ellipsoid is approximately twice that of the irregular object. At the end of the deceleration process, the pressure drag for both the irregular object and the standard ellipsoid is greater than zero, indicating that the pressure drag is now acting as a propulsive force. Despite the forward motion of the object, the direction of pressure drag has shifted from pointing backward to forward. The differences in the pressure fields during the motion process will be compared and analyzed in later sections.
According to Figure 5b, during the acceleration and deceleration phases, the maximum difference in viscous drag for the irregular object and the standard ellipsoid does not exceed 1.5 mN. After the speed exceeds 0.6 m/s, this difference essentially approaches 0. This indicates that changes in the direction of the acceleration do not significantly affect viscous drag, given the same velocity. Since the change in the acceleration direction is a source of added mass force, it can be inferred that the added mass force is primarily caused by changes in pressure drag.
Figure 5c reveals that the total resistance curves of both the irregular object and the standard ellipsoid under uniform motion are positioned approximately midway between the total resistance curves for the acceleration and deceleration phases. This suggests that the added mass forces for an irregular object and a standard ellipsoid are basically equal in value but in opposite directions during acceleration and deceleration processes. The total resistance during acceleration is greater than that during uniform motion, whereas the total resistance during deceleration is less than that during uniform motion. This indicates that the added mass force during acceleration points backward relative to the motion, while the added mass force during deceleration aligns with the direction of motion.
As shown in Figure 5d, the added mass force for the standard ellipsoid and the irregular object during the acceleration and deceleration processes demonstrates excellent consistency, indicating that the added mass remains essentially constant between the two variable speed processes. However, at the initial stage of the acceleration, the added mass force for both the standard ellipsoid and the irregular object is higher. The reason may be that, when the acceleration begins, the surrounding fluid is stationary, and the object must overcome the fluid’s inertia to accelerate forward together. This results in greater resistance faced by the object, which is then added to the added mass force, leading to a higher added mass force at this stage. Upon entering a stable period during the acceleration phase, the added mass force exhibits good consistency.
4.2. Comparison of Pressure and Velocity Fields during Acceleration and Deceleration Phases
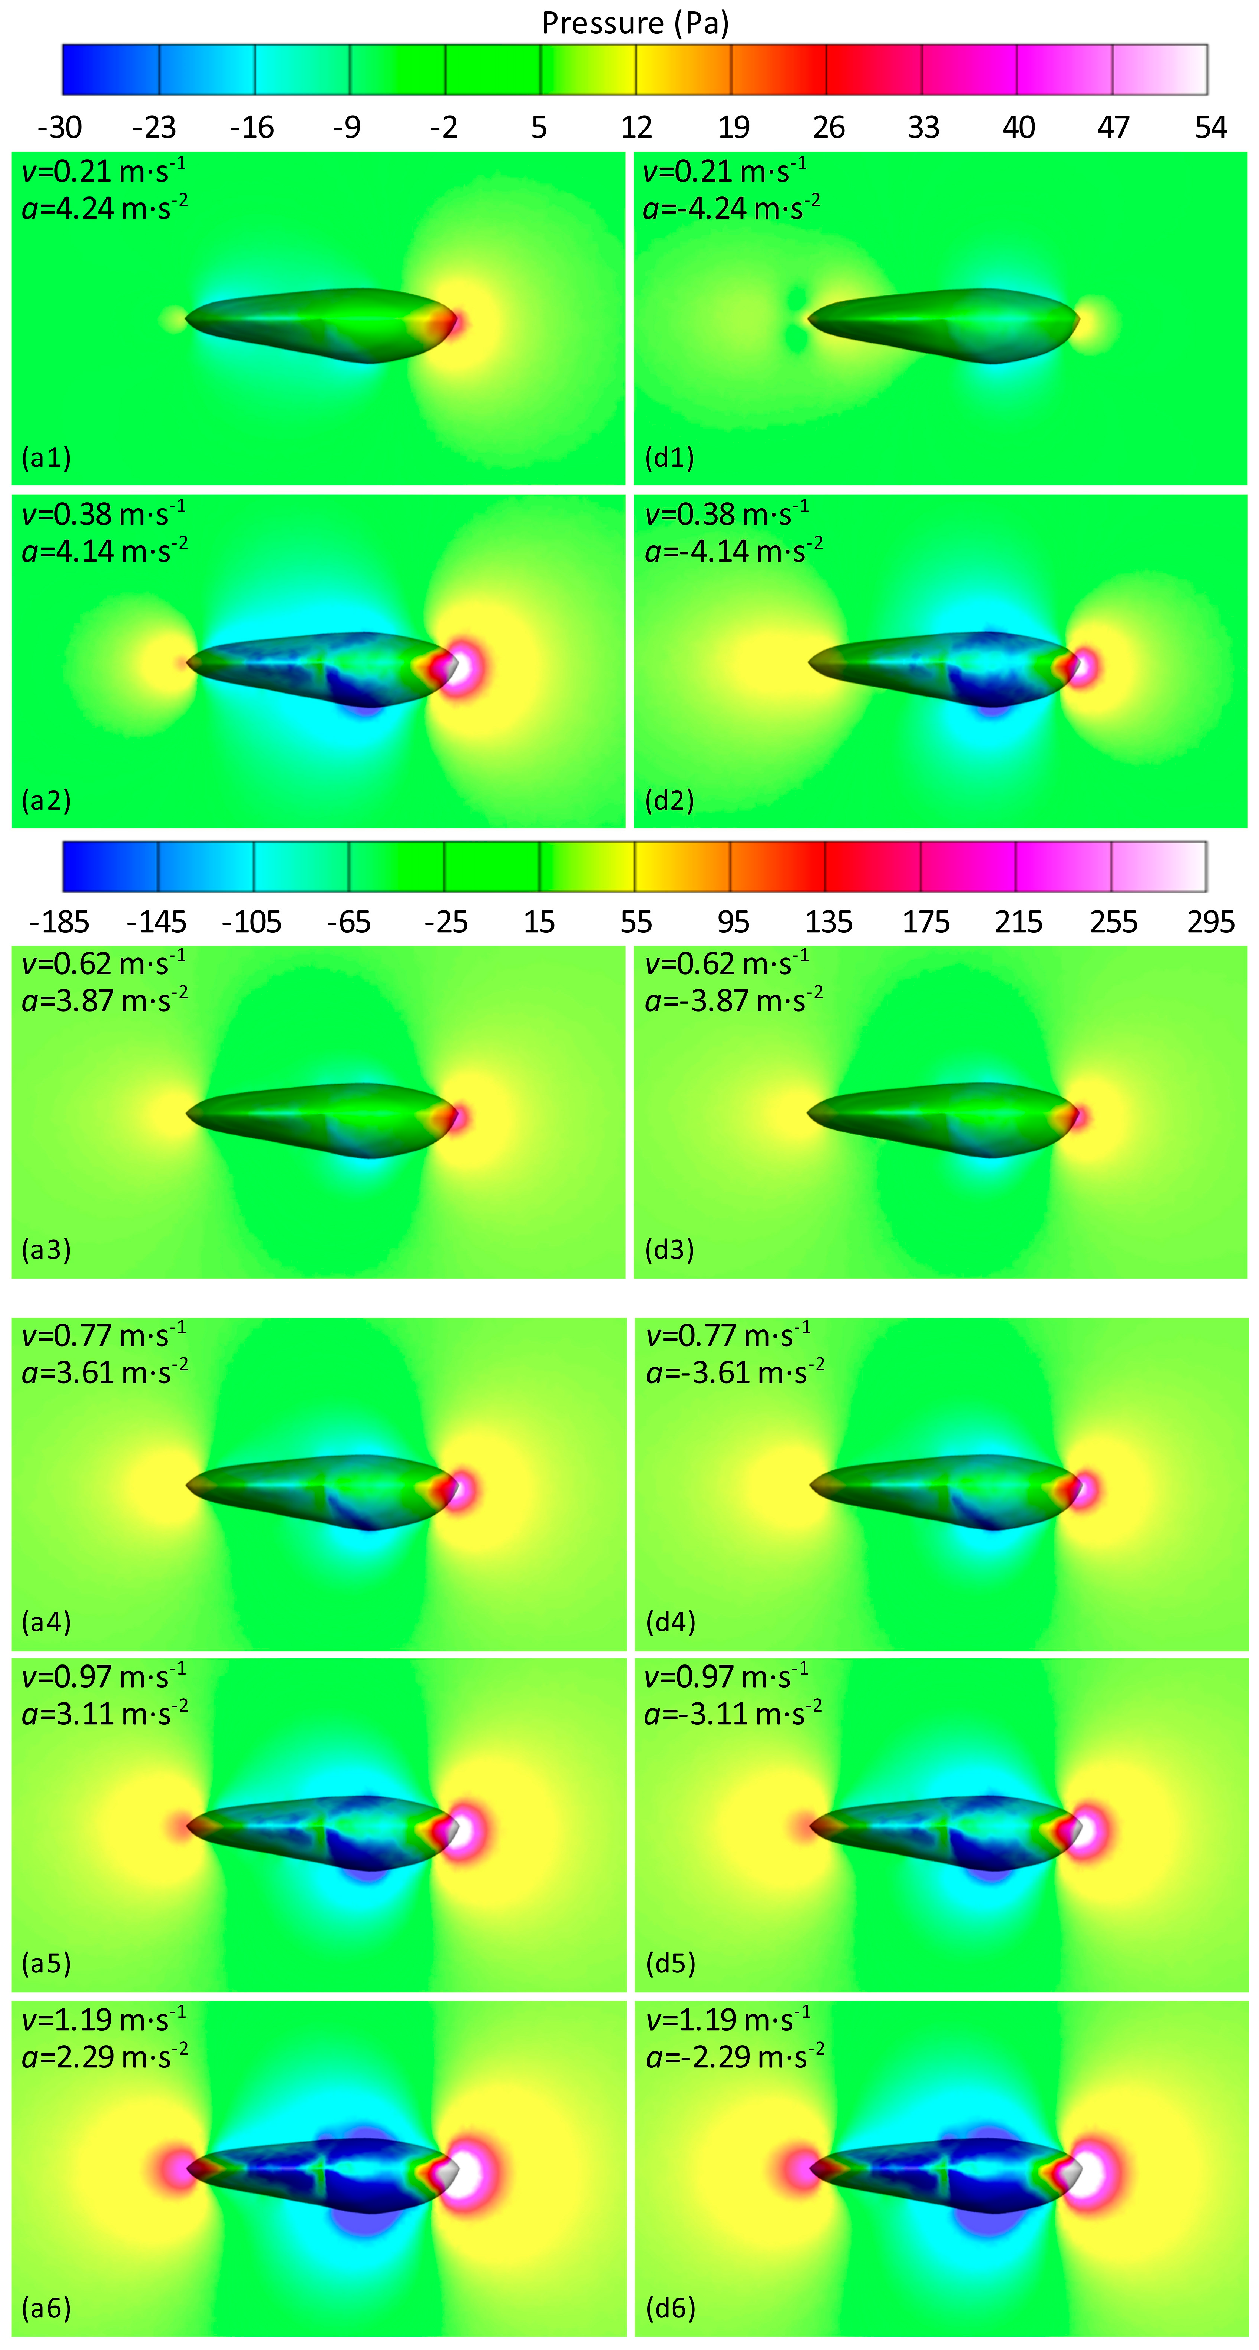
As shown in Figure 6, a1 to a6 represent the pressure contours of a standard ellipsoid during the acceleration phase, while d1 to d6 are those during the deceleration phase. Both the ellipsoids in Figure 6(a1,d1) have the same velocity, with the directions of the velocity pointing to the right. The directions of the acceleration are opposite, with rightward pointing considered positive and leftward negative. This condition also applies to other figures with the same numbering. As the sequence number increases, the velocity of the ellipsoid continuously increases, while the absolute value of the acceleration decreases.
From Figure 6(a1,d1), it can be observed that under conditions of a lower velocity and a higher absolute acceleration value, the accelerating ellipsoid exhibits a large high-pressure area at the front, with no significant positive pressure area at the rear. Conversely, the decelerating ellipsoid shows no prominent high-pressure area at the front but forms negative pressure areas on both shoulders. This indicates that due to the ellipsoid’s deceleration, the fluid acting on the front maintains a certain velocity due to inertia, leading to fluid detachment from the ellipsoid’s head, thus reducing the pressure there. A significant high-pressure area forms at the rear of the ellipsoid, suggesting that fluid continuously flows toward the ellipsoid from behind, creating a high-pressure area at the rear and generating vortices on both sides of the tail.
With an increasing velocity and a decreasing absolute acceleration, the difference in the high-pressure area at the front of the ellipsoid becomes less noticeable, indicating that the increase in velocity significantly reduces the impact of the acceleration on the front high-pressure area. For the ellipsoid in deceleration, the high-pressure area at the rear is larger, highlighting a more pronounced effect of the acceleration on the rear high-pressure area.
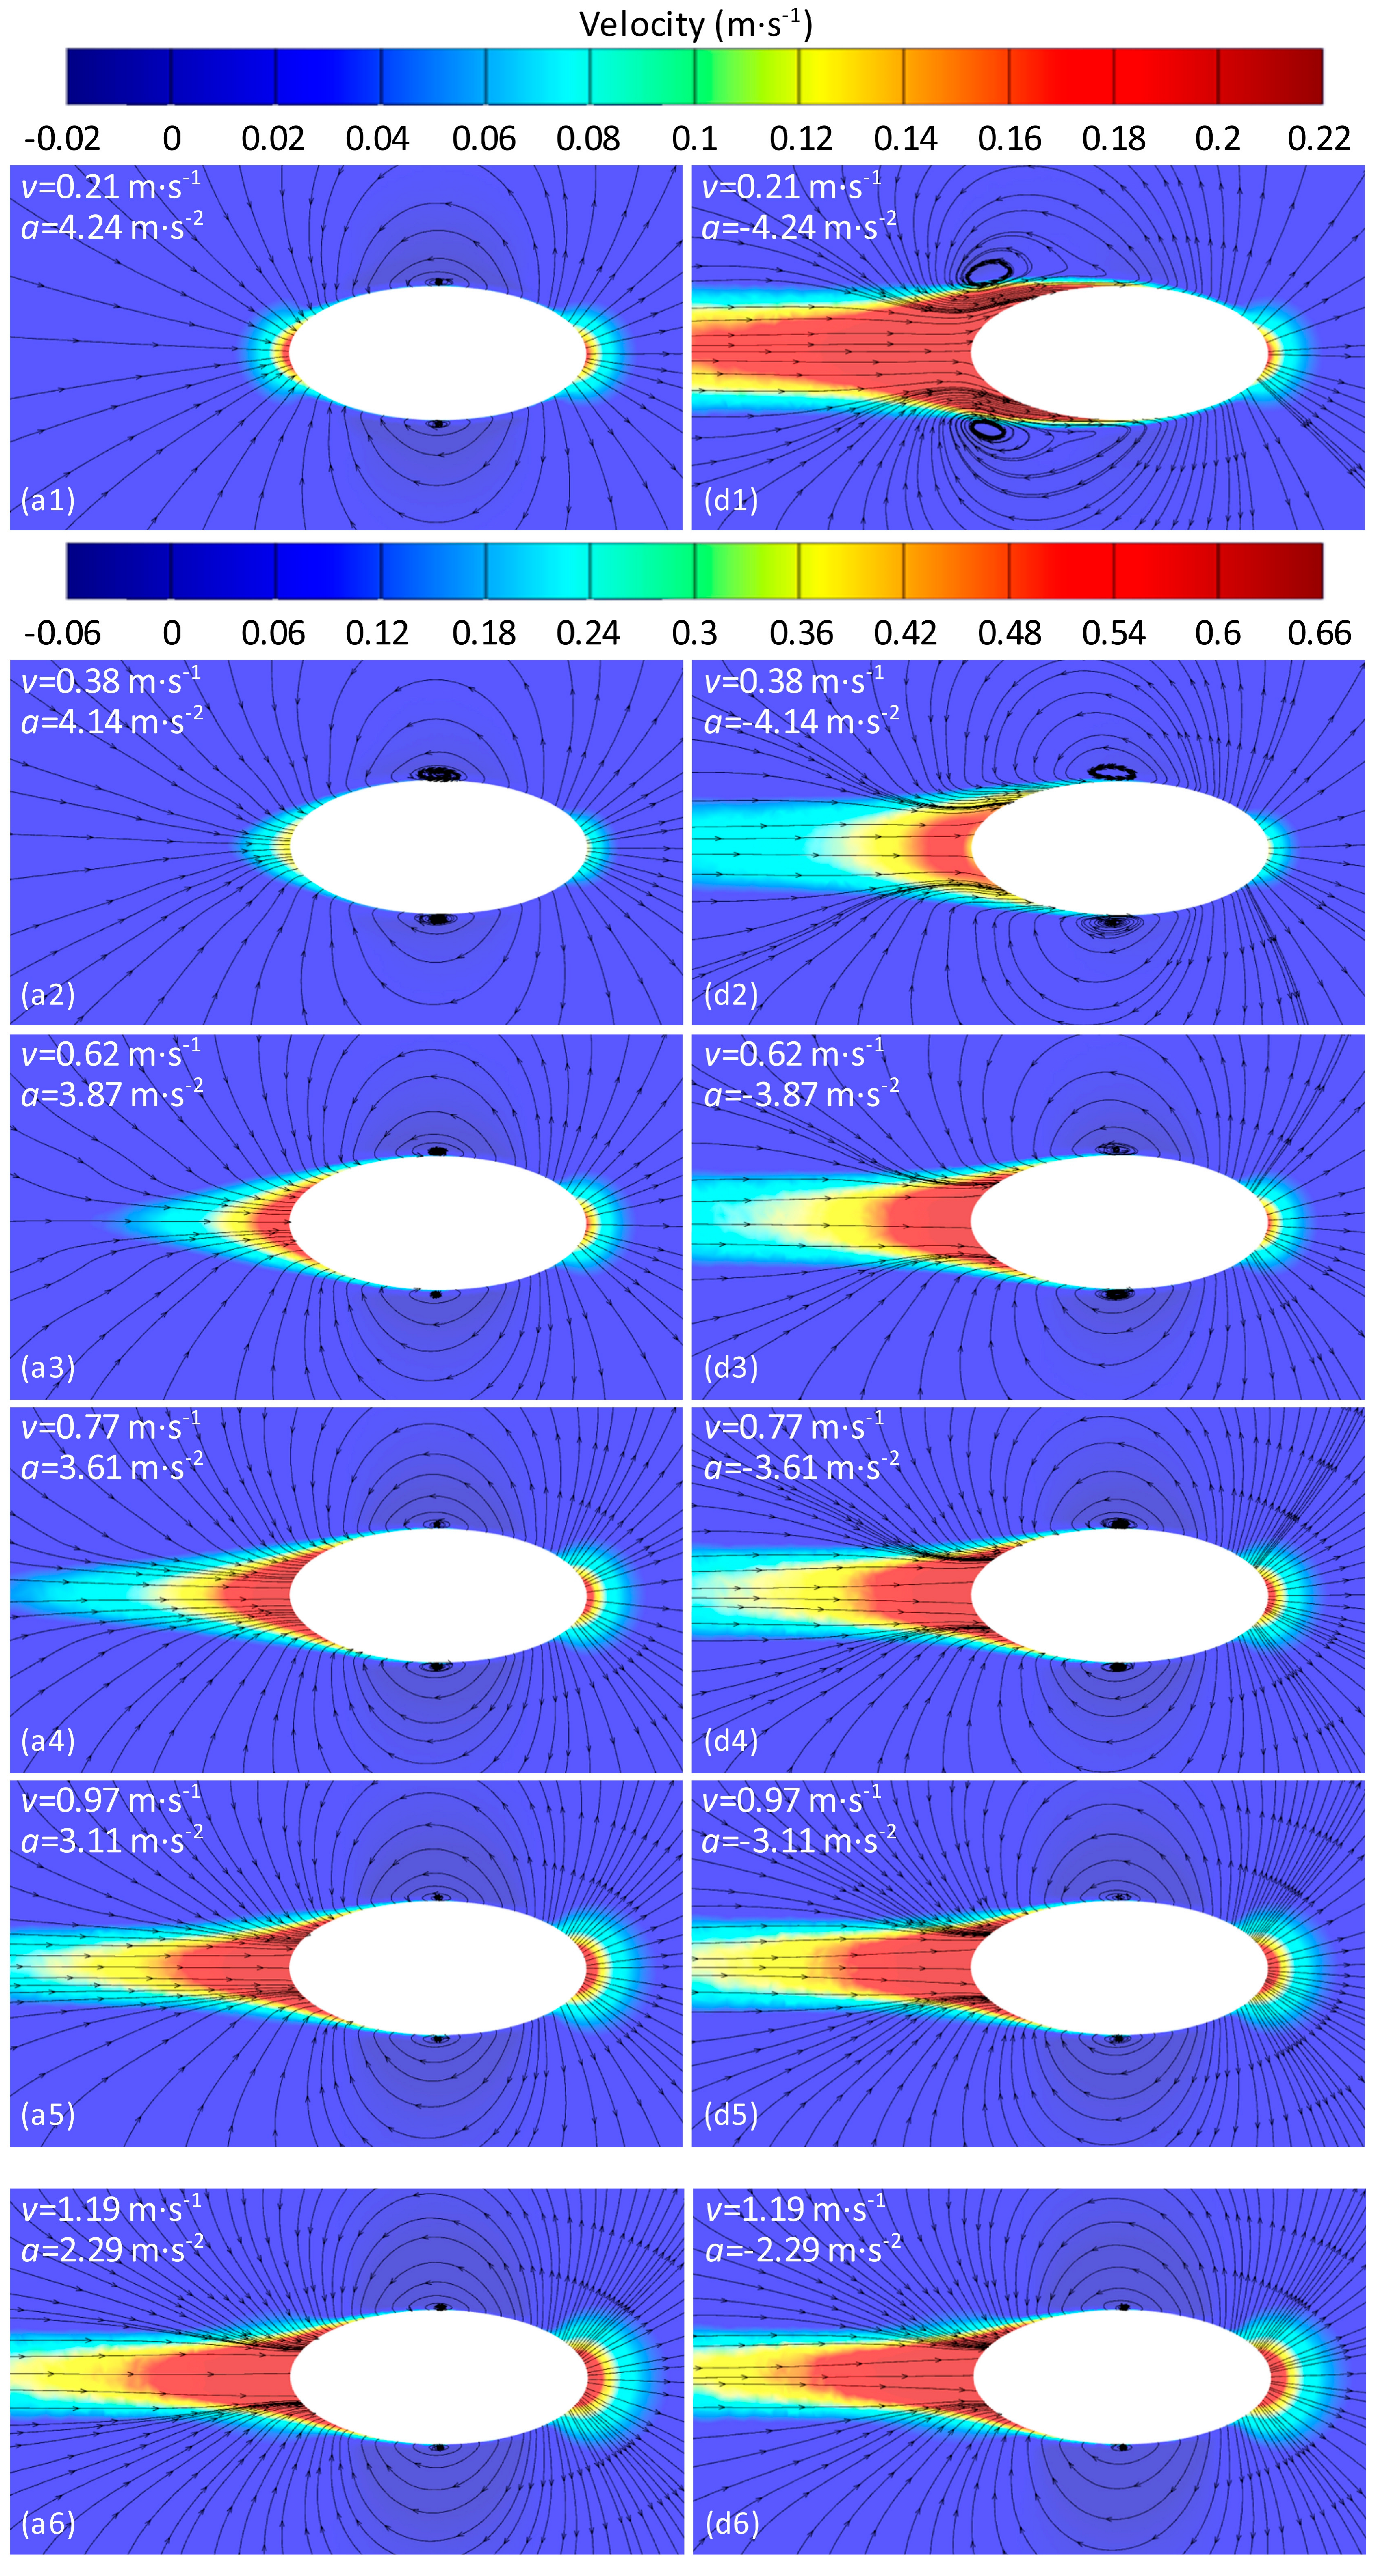
As shown in Figure 7, a1 to a6 are the velocity contours of a standard ellipsoid during the acceleration phase, and d1 to d6 are for the deceleration phase. In Figure 7(a1,d1), the ellipsoids have the same velocity, with the directions of the velocity pointing to the right. The directions of the acceleration are opposite, with rightward pointing considered a positive value and leftward a negative value. This condition applies similarly to other figures with matching sequence numbers. As the sequence number increases, the velocity of the ellipsoid continuously rises, and the absolute value of acceleration decreases.
Figure 7(a1) reveals that at lower speeds, for the ellipsoid in acceleration motion, the fluid at its front is squeezed away and flows toward the rear, forming a subtle velocity vortex in the middle and reconverging at the tail. Figure 7(d1) shows that at lower speeds, for the ellipsoid in deceleration motion, there is a significant difference in the velocity field compared to during the acceleration, with a large area of high-speed fluid at the tail continuously converging on both sides of the tail and merging with the fluid flowing from the front to form a velocity vortex. The high-speed fluid rushing forward extends to the middle of the ellipsoid. This rushing fluid is precisely the primary source of added mass force during deceleration, while the difference in the velocity field at the front is less noticeable, indicating that the change in the acceleration direction has a more pronounced impact on the flow field at the rear of the object.
As the velocity increases and the absolute value of the acceleration decreases, the decelerating ellipsoid no longer forms a velocity circulation at the tail but forms a small-scale velocity circulation at the waist, and the velocity circulation becomes increasingly smaller. The difference in the velocity field at the tail of the ellipsoids between acceleration and deceleration motions becomes less noticeable, suggesting that the increase in velocity and the decrease in the absolute value of the acceleration reduce the impact of the acceleration direction change on the rear velocity field.
As depicted in Figure 8, the characteristics of the pressure distribution at the head and tail of an irregular object are similar to those of ellipsoids. At lower velocities and greater absolute values of acceleration, the irregular object undergoing acceleration has a larger high-pressure area at its head and a smaller one at its tail, which is the opposite of the pressure distribution during the deceleration, and the reason is as previously described. With the increase in the velocity and the decrease in the absolute value of the acceleration, this difference in the flow field gradually becomes less pronounced. A distinction from the pressure distribution of ellipsoids is the asymmetrical pressure distribution on both shoulders caused by a geometric asymmetry.
As illustrated in Figure 9, due to the geometric asymmetry of an irregular object, when the velocity is low and the absolute value of the acceleration is high, the velocity distribution is noticeably asymmetrical. Fluid on both sides of the irregular object’s tail tends to converge more easily on the side with a gentler slope, forming a velocity recirculation with the outwardly retreating fluid, while no velocity recirculation is formed on the side with a steeper slope, indicating that there is less forward-moving fluid on that side. As the velocity increases and the absolute value of acceleration decreases, the forward-moving fluid continuously diminishes, causing this asymmetrical distribution of the velocity field to gradually become more similar.
4.3. Least Squares Method for Fluid Resistance Regression Analysis
From the previous text, it is known that viscous drag is approximately proportional to the first power of velocity, pressure drag is approximately proportional to the square of velocity, and added mass force is approximately proportional to acceleration. Based on the proportional relationships between these three forces and their respective motion variables, the total resistance curve shown in Figure 4c was analyzed using the least squares regression analysis, as demonstrated by the calculation formula in Equation (3). The regression analysis was conducted for the total resistance during the acceleration cycle (Acc. cycle), the deceleration cycle (Dec. cycle), and the entire variable speed cycle (En. cycle). The fitting results are shown in Figure 10, and the diagram indicates that there are significant differences between the fitting curves at point A for the acceleration cycle and the entire variable speed cycle. Additionally, there are connectivity issues between the fitting curves for the acceleration and deceleration cycles at points B and C. The corresponding coefficients , , and are shown in Table 4. The data in the table reveal some discrepancies in the total resistance regression analysis results for the acceleration phase compared to the other two groups, characterized by larger values for and and a smaller value for . This is mainly due to the fact that at the initial stage of acceleration, the surrounding fluid is stationary, and the object experiences greater pressure drag, while the viscous drag remains relatively low, leading to differences in the parameters. Subsequently, the coefficient regression analysis results in the table will be compared and analyzed with the results obtained from the parameter separation method to verify the accuracy of solving parameters using the least squares regression analysis.
4.4. Parameter Separation Method for Fluid Resistance Regression Analysis
To verify the accuracy of the parameters solved by least squares regression analysis, this study utilizes data on viscous drag and pressure drag from a standard ellipsoid and an irregular object during uniform motion, along with total resistance data from both uniform and variable speed motions. The parameter separation method is then applied to conduct regression analysis on coefficients , , and .
As shown in Figure 11a, the change curves of the pressure drag Fdp with respect to v2 for both the standard ellipsoid and the irregular object exhibit good linearity, indicating that the pressure drag is proportional to the square of the velocity, i.e., Fdp = kdpv2, where kdp is the slope of the curve. From the components of the total resistance Fdw, it is known that = kdp. The linearity of the viscous drag Fdv with respect to v for the standard ellipsoid and the irregular object is slightly poorer, containing nonlinear components. However, since the pressure drag of the standard ellipsoid is significantly greater than its viscous drag, the nonlinear components of Fdv with respect to v can be disregarded. In contrast, for the irregular object, the difference between the viscous drag and pressure drag is not significant, so the nonlinear components of Fdv with respect to v cannot be ignored. Therefore, when conducting the regression analysis using the parameter separation method, the nonlinear components were retained, as shown in Table 5.
Since the added mass force is generated by the variable speed motion of an object, a body in uniform motion is not affected by an added mass force. Therefore, to separate the added mass force, we just subtract the total resistance during uniform motion from the total resistance during variable speed motion. As shown in Figure 11b, the change curves of the added mass force Fam with respect to the acceleration a for both the standard ellipsoid and the irregular object exhibit good linearity, with larger deviations only in areas of higher acceleration. As indicated by Figure 4b, this corresponds to the initial stages of the acceleration phase, and the reasons for the increased added mass force have been explained previously. Thus, it can be considered that the added mass force is proportional to the acceleration, i.e., |Fam| = kam|a|, where kam is the slope of the curve. From the components of the total resistance Fdw and the direction of the added mass force, it is known that = −kam. This allows for the separation and solving of the three parameters , , and , and the results are presented in Table 5.
By comparing the values of parameters , , and in Table 4 and Table 5, it can be observed that the values of , , and obtained through the parameter separation method are closer to the data in groups 3 and 6 of Table 4, especially with very small errors in . This indicates that performing regression analysis on the total resistance data for the entire variable speed cycle using the least squares method can yield fairly accurate values for the added mass, with certain errors present in and . Specifically, the discrepancy between for the irregular object in Table 5 and in Table 4 is significant, mainly due to the nonlinear term of the velocity v in the viscous drag Fdv and the closeness of the viscous drag to the pressure drag. If the nonlinear term is taken into account, then the regression parameter for the pressure drag of the irregular object in Table 5 should be equal to , and finally, the values are no longer significantly different. This shows that performing regression analysis on the resistance data for the entire variable speed cycle using the least squares method can achieve a certain degree of accuracy for the coefficients of pressure drag and viscous drag. In practical engineering applications, the least squares method can be used for rapid preliminary regression analysis of the total resistance data throughout the entire variable speed cycle. Subsequent validation with several sets of resistance data under uniform motion conditions can then provide accurate coefficients for pressure drag, viscous drag, and added mass.
4.5. Theoretical Comparison
To verify the accuracy of the two analytical methods, the theoretical added mass of the ellipsoid was calculated. According to reference [57], when the ellipsoid accelerates along its major axis, its added mass can be calculated using Equation (11).
where m* represents the added mass of the ellipsoid; ρ is the density of water; a and b are the major and minor axes of the ellipsoid, respectively; e is the eccentricity of the ellipsoid cross-section through the axis of symmetry.
The results of regression analysis using the least squares method and the parameter separation method indicate that the added mass of the ellipsoid is 0.8759 g and 0.8556 g, respectively. Meanwhile, the theoretical value of the ellipsoid’s added mass calculated through the formula is 0.8679 g. The relative errors of the two calculated added masses are 0.92% and −1.42%, respectively. This demonstrates that the added mass obtained through both methods exhibits good accuracy.
5. Conclusions
This paper conducted numerical simulations on both standard ellipsoid and irregular objects undergoing variable and uniform motion underwater. The changing characteristics of the various drags were analyzed, and the least squares method was proposed for calculating the added mass. The accuracy of this method was verified using parameter separation regression analysis and theoretical solutions.
The analysis of fluid resistance change characteristics during the variable speed process reveals that changes in the direction of acceleration significantly affect the pressure drag but have a negligible impact on the viscous drag. This indicates that the source of added mass force is primarily the changes in the pressure drag. During the deceleration process, the direction of the added mass force aligns with the direction of motion, acting as a propulsive force.
The analysis of differences in the pressure fields during acceleration and deceleration processes shows that the distribution of high pressure at the head and tail of the ellipsoid presents opposite phenomena. This is because, during the deceleration process, the surrounding fluid continues to flow forward due to inertia, leading to a tendency for the fluid at the head to detach, while the fluid at the tail has a tendency to surge forward. As the velocity increases and the absolute value of acceleration decreases, this difference in the pressure field becomes less pronounced.
The analysis of differences in velocity fields during acceleration and deceleration processes indicates that, at lower speeds, for the ellipsoid undergoing deceleration, there is a significant presence of high-speed fluid at the tail, which continuously converges toward both sides of the tail and merges with the fluid flowing from the front to form a velocity vortex. These forward-moving fluids are precisely the primary sources of the added mass force during deceleration, while the difference in the velocity field at the head is less pronounced. This demonstrates that changes in the direction of acceleration have a more noticeable impact on the flow field at the rear of the object.
The regression analysis using both the least squares method and the parameter separation method indicates that conducting a least squares regression analysis on the total resistance throughout the entire variable speed cycle can yield relatively accurate added mass values, consistent with the results of the parameter separation method. By comparing these values with the theoretical value of the added mass for the ellipsoid, the relative errors of the added mass solved by these two methods are only 0.92% and −1.42%. This demonstrates that utilizing the least squares method for parameter analysis can achieve relatively accurate results.
Author Contributions
X.W. (Xuanquan Wang): methodology, writing—original draft. S.X.: resources, funding acquisition, supervision. X.W. (Xinchun Wang): software, investigation. D.Q.: writing—review and editing, data curation. All authors have read and agreed to the published version of the manuscript.
Funding
This research was supported by the Hainan Provincial Natural Science Foundation of China, grant number No: 323MS074.
Institutional Review Board Statement
Not applicable.
Informed Consent Statement
Not applicable.
Data Availability Statement
The data that support the findings of this study are available from the corresponding author upon reasonable request.
Conflicts of Interest
The authors declare no conflicts of interest.
References
- Li, J.; Lu, C.J.; Huang, X. Calculation of added mass of a vehicle running with cavity. J. Hydrodyn. 2010, 3, 312–318. [Google Scholar] [CrossRef]
- Raza, N.; Mehmood, I.; Rafiuddin, H.; Rafique, M. Numerical simulation of added mass determination of standard ellipsoids. In Proceedings of the 2012 9th International Bhurban Conference on Applied Sciences and Technology (IBCAST), Islamabad, Pakistan, 9–12 January 2012; pp. 270–274. [Google Scholar]
- Javanmard, E.; Mansoorzadeh, S.; Mehr, J.A. A new CFD method for determination of translational added mass coefficients of an underwater vehicle. Ocean Eng. 2020, 215, 107857. [Google Scholar] [CrossRef]
- Sen, D.T.; Vinh, T.C. Determination of added mass and inertia moment of marine ships moving in 6 degrees of freedom. Int. J. Transp. Eng. Technol. 2016, 2, 8–14. [Google Scholar]
- Korotkin, A.I. Added Masses of Ship Structures; Krylov Shipbuilding Research Institute: St. Petersburg, Russia; Springer: St. Petersburg, Russia, 2009. [Google Scholar]
- Pan, Y.-C.; Zhang, H.-X.; Zhou, Q.-D. Numerical prediction of submarine hydrodynamic coefficients using CFD simulation. J. Hydrodyn. 2012, 24, 840–847. [Google Scholar] [CrossRef]
- Go, G.; Ahn, H.T. Hydrodynamic derivative determination based on CFD and motion simulation for a tow-fish. Appl. Ocean Res. 2018, 82, 191–209. [Google Scholar] [CrossRef]
- Kuwabara, S.S.; Okamoto, K. Experimental investigation of added mass coefficient with a free oscillating circular cylinder. JPN. Soc. Mech. Eng. 2008, 74, 1396–1401. [Google Scholar] [CrossRef]
- Hsieh, W.M. An experimental method for determining the frequency-dependent added mass and added mass moment of inertia for a floating body in heave and pitch motions. Ocean Eng. 2001, 28, 417–438. [Google Scholar]
- Rodriguez, C.; Egusquiza, E.; Escaler, X.; Liang, Q.; Avellan, F. Experimental investigation of added mass effects on a Francis turbine runner in still water. J. Fluids Struct. 2006, 22, 699–712. [Google Scholar] [CrossRef]
- Sedlar, D.; Lozina, Z.; Vucina, D. Experimental investigation of the added mass of the cantilever beam partially submerged in water. Tech. Gaz. 2011, 4, 589–594. [Google Scholar]
- Pan, G.; Wei, G.; Du, X.X. Whole scheme of added mass’s forced oscillatory mechanism. Meas. Control Technol. 2007, 26, 35–37. [Google Scholar]
- De La Torre, O.; Escaler, X.; Egusquiza, E.; Farhat, M. Experimental investigation of added mass effects on a hydrofoil under cavitation conditions. J. Fluids Struct. 2013, 39, 173–187. [Google Scholar] [CrossRef]
- Fanning, P.J.; Carden, E.P. Experimentally validated added mass identification algorithm based on frequency response functions. J. Eng. Mech. 2004, 130, 1045–1051. [Google Scholar] [CrossRef]
- Caspersen, C.; A Berthelsen, P.; Eik, M.; Pâkozdi, C.; Kjendlie, P.-L. Added mass in human swimmers: Age and gender differences. J. Biomech. 2010, 43, 2369–2373. [Google Scholar] [CrossRef] [PubMed]
- Wang, Z.; Fan, D.; Triantafyllou, M.S. Illuminating the complex role of the added mass during vortex induced vibration. Phys. Fluids 2021, 33, 085120. [Google Scholar] [CrossRef]
- Lee, S.K.; Cheon, S.J.; Jang, T.S.; Lee, J.H.; Joung, T.H. Evaluation of the Added Mass for a Spheroid-type UUV by VPMM Test. In Proceedings of the International Offshore and Polar Engineering Conference, Osaka, Japan, 21–26 June 2009. [Google Scholar]
- Ueno, M.; Yukawa, K.; Nimura, T.; Asanuma, T.; Ohmatsu, S.; Takai, R. PMM test analysis for added mass coefficients of asymmetric bodies. IFAC Proc. Vol. 2003, 36, 31–36. [Google Scholar] [CrossRef]
- Corkery, S.J.; Babinsky, H.; Graham, W.R. Quantification of added-mass effects using particle image velocimetry data for a translating and rotating flat plate. J. Fluid Mech. 2019, 870, 492–518. [Google Scholar] [CrossRef]
- Salibindla, A.K.; Masuk, A.U.M.; Ni, R. Experimental investigation of the acceleration statistics and added-mass force of deformable bubbles in intense turbulence. J. Fluid Mech. 2021, 912, A5. [Google Scholar] [CrossRef]
- Pantaleone, J.; Messer, J. The added mass of a spherical projectile. Am. J. Phys. 2011, 79, 1202–1210. [Google Scholar] [CrossRef]
- Sahin, I.; Crane, J.; Watson, K. Added Mass Coefficients for Submerged Bodies by a Low-Order Panel Method. J. Fluids Eng. 1993, 115, 452–456. [Google Scholar] [CrossRef]
- Sahin, I.; Crane, J.W.; Watson, K.P. Application of a panel method to hydrodynamics of underwater vehicles. Ocean Eng. 1997, 24, 501–512. [Google Scholar] [CrossRef]
- Zhang, M.; Wang, X.; Duan, D. Panel method predictions of added mass for flexible airship. Aeronaut. J. 2013, 117, 519–531. [Google Scholar] [CrossRef]
- Liu, L.; Sun, M. The added mass forces in insect flapping wings. J. Theor. Biol. 2018, 437, 45–50. [Google Scholar] [CrossRef] [PubMed]
- Lin, Z.; Liao, S. Calculation of added mass coefficients of 3D complicated underwater bodies by FMBEM. Commun. Nonlinear Sci. Numer. Simul. 2011, 16, 187–194. [Google Scholar] [CrossRef]
- Qi, Z.; Jiang, M.; Jia, L.; Zou, B.; Zhai, J. The effect of mass ratio and damping coefficient on the propulsion performance of the semi-active flapping foil of the wave glider. J. Mar. Sci. Eng. 2020, 8, 303. [Google Scholar] [CrossRef]
- Gardano, P.; Dabnichki, P. Application of Boundary Element Method to modelling of added mass and its effect on hydrodynamic forces. Comput. Model. Eng. Sci. 2006, 15, 87–98. [Google Scholar]
- Lin, C.Y.; Zhu, J. Numerical computation of added mass of submarine maneuvering with small clearance to sea-bottom. Ship Eng. 2003, 5, 26–29. [Google Scholar]
- Ghassemi, H.; Yari, E. The added mass coefficient computation of sphere, ellipsoid and marine propellers using boundary element method. Pol. Marit. Res. 2011, 18, 17–26. [Google Scholar] [CrossRef]
- Leung, A.Y.T.; Fok, A.S.; Dai, H.; Su, R.K.L. The fractal finite element method for added-mass-type problems. Int. J. Numer. Meth. Eng. 2008, 75, 1194–1213. [Google Scholar] [CrossRef]
- Levy, S.; Wilkinson, J.P.D. Calculation of added water mass effects for reactor system components. In Structural Mechanics in Reactor Technology; IASMiRT: London, UK, 1975; Volume F2/5, pp. 1–14. [Google Scholar]
- Phillips, A.; Furlong, M.; Turnock, S.R. The use of computational fluid dynamics to determine the dynamic stability of an autonomous underwater vehicle. In Proceedings of the 10th Numerical Towing Tank Symposium (NuTTS’07), Hamburg, Germany, 23–25 September 2007; pp. 6–11. [Google Scholar]
- Sakamoto, N. URANS, DES Simulations of Static and Dynamic Manoeuvring for Surface Combatant. Ph.D. Thesis, University of Iowa, Iowa City, IA, USA, 2009. [Google Scholar]
- Tang, S.; Ura, T.; Nakatani, T.; Thornton, B.; Jiang, T. Estimation of the hydrodynamic coefficients of the complex-shaped autonomous underwater vehicle TUNA-SAND. J. Mar. Sci. Technol. 2009, 14, 373–386. [Google Scholar] [CrossRef]
- Zhang, H.; Xu, Y.-R.; Cai, H.-P. Using CFD software to calculate hydrodynamic coefficients. J. Mar. Sci. Appl. 2010, 9, 149–155. [Google Scholar] [CrossRef]
- Kim, H.; Akimoto, H.; Islam, H. Estimation of the hydrodynamic derivatives by RaNS simulation of planar motion mechanism test. Ocean Eng. 2015, 108, 129–139. [Google Scholar] [CrossRef]
- Song, L. Calculation of added mass for underwater vehicles based on FVM. In Proceedings of the International Conference on Advances in Mechanical Engineering and Industrial Informatics, Hangzhou, China, 9–10 April 2016. [Google Scholar]
- Zakaria, M.S.; Abdullah, H.; Ahmad, K.A. Fluid structure interaction simulation of large deformation and added-mass effect using OpenFOAM. In Proceedings of the Mechanical Engineering Research Day, Malang, Indonesia, 23–25 October 2018; pp. 79–80. [Google Scholar]
- Perrault, D.; Bose, N.; O’young, S.; Williams, C.D. Sensitivity of AUV added mass coefficients to variations in hull and control plane geometry. Ocean Eng. 2003, 30, 645–671. [Google Scholar] [CrossRef]
- Vu, V.H.; Thomas, M.; Lakis, A.A.; Marcouiller, L. Effect of added mass on submerged vibrated plates. In Proceedings of the 25th Seminar on Machinery Vibration, Canadian Machinery Vibration Association CMVA, St. John, NL, Canada, 25 June 2021. [Google Scholar]
- Paniccia, D.; Graziani, G.; Lugni, C.; Piva, R. On the role of added mass and vorticity release for self-propelled aquatic locomotion. J. Fluid Mech. 2021, 918, 645–671. [Google Scholar] [CrossRef]
- Zhou, Y.; Li, Y.; Yoshida, A. Effect of added mass on wind-induced vibration of a circular flat membrane by wind tunnel tests. Int. J. Struct. Stab. Dyn. 2018, 18, 1850156. [Google Scholar] [CrossRef]
- Mohaghegh, F.; Udaykumar, H. Comparison of sharp and smoothed interface methods for simulation of particulate flows II: Inertial and added mass effects. Comput. Fluids 2017, 143, 103–119. [Google Scholar] [CrossRef]
- Chu, Z.; Zhu, D.; Sun, B.; Nie, J.; Xue, D. Design of a dead reckoning based motion control system for small autonomous underwater vehicle. In Proceedings of the IEEE 28th Canadian Conference on Electrical and Computer Engineering (CCECE), Halifax, NS, Canada, 3–6 May 2015; pp. 728–733. [Google Scholar]
- Zhang, T.; Zhou, H.; Wang, J.; Liu, Z.; Xin, J.; Pang, Y. Optimum design of a small intelligent ocean exploration underwater vehicle. Ocean Eng. 2019, 184, 40–58. [Google Scholar] [CrossRef]
- Zhang, H. Research on key technologies of small underwater robots. Int. J. Simul. Syst. Sci. Technol. 2016, 17, 14.1–14.7. [Google Scholar]
- Ba, X.; Luo, X.H.; Shi, Z.C.; Zhu, Y.Q. A vectored water jet propulsion method for autonomous underwater vehicles. Ocean Eng. 2013, 74, 133–140. [Google Scholar]
- Jiao, W.; Cheng, L.; Zhang, D.; Zhang, B.; Su, Y.; Wang, C. Optimal design of inlet passage for waterjet propulsion system based on flow and geometric parameters. Adv. Mater. Sci. Eng. 2019, 2019, 2320981. [Google Scholar] [CrossRef]
- Fish, F.E. Advantages of aquatic animals as models for bio-inspired drones over present AUV technology. Bioinspiration Biomim. 2020, 15, 025001. [Google Scholar] [CrossRef]
- Raj, A.; Thakur, A. Fish-inspired robots: Design, sensing, actuation, and autonomy—A review of research. Bioinspiration Biomim. 2016, 11, 031001. [Google Scholar] [CrossRef] [PubMed]
- Ding, D.; Ouahsine, A.; Xiao, W.; Du, P. CFD/DEM coupled approach for the stability of caisson-type breakwater subjected to violent wave impact. Ocean Eng. 2021, 223, 108651. [Google Scholar] [CrossRef]
- Huang, Z.; Ouahsine, A.; Du, P.; Ding, D. Computational fluid dynamics predictions of critical hydrodynamics thresholds in the erodibility of inland waterway bank by ship-induced waves. Ocean Eng. 2022, 266, 112825. [Google Scholar] [CrossRef]
- Du, P.; Ouahsine, A.; Sergent, P.; Hoarau, Y.; Hu, H. Investigation on resistance, squat and ship-generated waves of inland convoy passing bridge piers in a confined waterway. J. Mar. Sci. Eng. 2021, 9, 1125. [Google Scholar] [CrossRef]
- Long, L.N.; Weiss, H. The velocity dependence of aerodynamic drag: A primer for mathematicians. Am. Math. Mon. 1999, 106, 127–135. [Google Scholar] [CrossRef]
- Kestin, J.; Sokolov, M.; Wakeham, W.A. Viscosity of liquid water in the range −8 °C to 150 °C. J. Phys. Chem. Ref. Data. 1978, 7, 941–948. [Google Scholar] [CrossRef]
- Brennen, C.E. A Review of Added Mass and Fluid Inertial Forces; Technical Report–CR82.010; Naval Civil Engineering Laboratory: Port Hueneme, CA, USA, 1982. [Google Scholar]
Figure 1.
Resistance encountered by an object during underwater motion. (a) Accelerating motion; (b) decelerating motion; (c) uniform motion.
Figure 1.
Resistance encountered by an object during underwater motion. (a) Accelerating motion; (b) decelerating motion; (c) uniform motion.

Figure 2.
Schematic diagram of the method for solving added mass.

Figure 3.
Division of mesh in the fluid computational domain.

Figure 4.
Numerical simulation results of the variable speed process for standard ellipsoid and irregular model. (a) Velocity and acceleration change curves over time; (b) relationship diagram between acceleration and velocity; (c) change curves of various resistances over time; (d) change curves of various resistances with velocity for the standard ellipsoid.

Figure 5.
Comparison of various resistance forces for standard ellipsoid and irregular model. (a) Change curve of pressure drag with velocity during uniform and variable speed motion; (b) change curve of viscous drag with velocity during uniform and variable speed motion; (c) change curve of total resistance with velocity during uniform and variable speed motion; (d) change curve of added mass force with velocity during variable speed motion process.

Figure 6.
Pressure contours for the standard ellipsoid during acceleration and deceleration movements. (a1–a6) are the pressure contours for acceleration; (d1–d6) are the pressure contours for deceleration.
Figure 6.
Pressure contours for the standard ellipsoid during acceleration and deceleration movements. (a1–a6) are the pressure contours for acceleration; (d1–d6) are the pressure contours for deceleration.

Figure 7.
Velocity contours for the standard ellipsoid during acceleration and deceleration movements. (a1–a6) are the velocity contours for acceleration; (d1–d6) are the velocity contours for deceleration.
Figure 7.
Velocity contours for the standard ellipsoid during acceleration and deceleration movements. (a1–a6) are the velocity contours for acceleration; (d1–d6) are the velocity contours for deceleration.

Figure 8.
Pressure contours for irregular object during acceleration and deceleration movements. (a1–a6) are the pressure contours during acceleration; (d1–d6) are the pressure contours during deceleration.
Figure 8.
Pressure contours for irregular object during acceleration and deceleration movements. (a1–a6) are the pressure contours during acceleration; (d1–d6) are the pressure contours during deceleration.

Figure 9.
Velocity contours for irregular object during acceleration and deceleration movements. (a1–a6) are the velocity contours during acceleration; (d1–d6) are the velocity contours during deceleration.
Figure 9.
Velocity contours for irregular object during acceleration and deceleration movements. (a1–a6) are the velocity contours during acceleration; (d1–d6) are the velocity contours during deceleration.

Figure 10.
Fitting results of the curve of water drag.

Figure 11.
Relationships between various resistances and motion variables for standard ellipsoid and irregular model. (a) Relationships between viscous drag or pressure drag and velocity; (b) relationship between added mass force and acceleration.
Figure 11.
Relationships between various resistances and motion variables for standard ellipsoid and irregular model. (a) Relationships between viscous drag or pressure drag and velocity; (b) relationship between added mass force and acceleration.


Table 1.
Values of the density and dynamic viscosity of liquid water at different temperatures.
| Temperature/°C | Density ρ/kg·m−3 | Dynamic Viscosity μ/10−6 Pa·s |
|---|---|---|
| 20 | 998.2336 | 1002.0 |
| 25 | 997.0751 | 890.3 |
| 30 | 995.6783 | 797.5 |
| 35 | 994.0635 | 719.5 |
Table 2.
Detailed mesh parameters.
| Region | Mesh Size/mm | Number of Elements | Mesh Quality |
|---|---|---|---|
| Ellipsoid Surface | 0.3–0.5 | 10,866 | >0.58 |
| Fluid 4 | 0.5–4 | 2,783,156 | >0.65 |
| Fluid 1 | 4–10 | 5152 | >0.75 |
| Fluid 2 | 4–10 | 64,400 | >0.75 |
| Fluid 3 | 10–14 | 14,560 | >0.9 |
Table 3.
Movement speeds of the standard ellipsoid and irregular model.
| Model | Variable Acceleration Process Velocity/m·s−1 | Uniform Motion Process Velocity/m·s−1 |
|---|---|---|
| standard ellipsoid | v = 0.2, 0.4, 0.6, 0.8, 1, 1.2, 1.4 | |
| irregular model | v = 0.2, 0.4, 0.6, 0.8, 1, 1.2, 1.4 |
Table 4.
Fitting results of the fluid resistance curve during variable speed motion.
| Number i | Model | Time Range (s) | (mN) | R2 | RMSE 10−4 | ||
|---|---|---|---|---|---|---|---|
| 1 | Standard ellipsoid | [0.004, 0.5] | −12.40 | −5.713 | −1.0440 | 0.9997 | 1.608 |
| 2 | [0.5, 1] | −10.29 | −8.808 | −0.9502 | 0.9999 | 1.226 | |
| 3 | [0.004, 1] | −10.94 | −7.835 | −0.8759 | 0.9997 | 1.991 | |
| 4 | Irregular model | [0.004, 0.5] | −8.749 | −2.270 | −0.5463 | 0.9994 | 1.478 |
| 5 | [0.5, 1] | −7.229 | −4.531 | −0.4084 | 0.9997 | 1.275 | |
| 6 | [0.004, 1] | −7.397 | −4.240 | −0.3860 | 0.9993 | 1.820 | |
| Model | Curve Number | Mechanical Variable (mN) | Functional Equation | Parameter Value |
|---|---|---|---|---|
| Standard ellipsoid | l1 | |||
| l3 | ||||
| l5 | ||||
| Irregular model | l2 | |||
| l4 | ||||
| l6 |
Disclaimer/Publisher’s Note: The statements, opinions and data contained in all publications are solely those of the individual author(s) and contributor(s) and not of MDPI and/or the editor(s). MDPI and/or the editor(s) disclaim responsibility for any injury to people or property resulting from any ideas, methods, instructions or products referred to in the content. |
© 2024 by the authors. Licensee MDPI, Basel, Switzerland. This article is an open access article distributed under the terms and conditions of the Creative Commons Attribution (CC BY) license (https://creativecommons.org/licenses/by/4.0/).
Share and Cite
MDPI and ACS Style
Wang, X.; Xiao, S.; Wang, X.; Qi, D. Numerical Simulation and Analysis of Added Mass for the Underwater Variable Speed Motion of Small Objects. J. Mar. Sci. Eng. 2024, 12, 686. https://doi.org/10.3390/jmse12040686
AMA Style
Wang X, Xiao S, Wang X, Qi D. Numerical Simulation and Analysis of Added Mass for the Underwater Variable Speed Motion of Small Objects. Journal of Marine Science and Engineering. 2024; 12(4):686. https://doi.org/10.3390/jmse12040686
Chicago/Turabian StyleWang, Xuanquan, Suwei Xiao, Xinchun Wang, and Debo Qi. 2024. "Numerical Simulation and Analysis of Added Mass for the Underwater Variable Speed Motion of Small Objects" Journal of Marine Science and Engineering 12, no. 4: 686. https://doi.org/10.3390/jmse12040686
Note that from the first issue of 2016, this journal uses article numbers instead of page numbers. See further details here.