Article

Towing Analysis and Validation of a Fully Assembled Floating Offshore Wind Turbine Based on an Experimental Study

by
Rahul Chitteth Ramachandran
1,*,
Jorrit-Jan Serraris
1,
Jaume Hernandez Montfort
1,
Erik-Jan De Ridder
1,
Cian Desmond
2 and
Jimmy Murphy
3
1
Maritime Research Institute Netherlands (MARIN), Haagsteeg 2, 6708 PM Wageningen, The Netherlands
2
ESB Ireland, One Dublin Airport Central, Dublin Airport, Cloghran, K67 XF72 Dublin, Ireland
3
MaREI, Beaufort Building, Environmental Research Institute, University College Cork, Ringaskiddy, P43 C573 Cork, Ireland
*
Author to whom correspondence should be addressed.
J. Mar. Sci. Eng. 2024, 12(4), 689; https://doi.org/10.3390/jmse12040689
Submission received: 2 January 2024 / Revised: 25 March 2024 / Accepted: 8 April 2024 / Published: 22 April 2024
(This article belongs to the Section Marine Energy)

Abstract

:
The offshore wind sector is moving into deep waters and using floating platforms to harness the higher wind speeds in exposed locations. There are various floating platform types currently in development, but semi-submersibles are considered the most prominent early movers. Such floaters need to be towed to and from wind farm locations for installation, special cases of repair and decommissioning. As with any other offshore activity, metocean limits exist for towing operations which can impact the development of a wind farm. It is important to calculate the motion and loads of the platform before commencing the towing operations and to check whether they exceed the defined limits to enable safe execution. In this paper, two approaches using two different numerical tools to predict the motion of a fully assembled floating wind platform under tow are presented and compared. A potential flow-based method derived from a low forward speed approach and a hybrid approach combining potential flow and Morison equation methods are investigated, and the numerical predictions are compared and validated against experimental results. Both methods demonstrate accurate predictions, depending on the wave condition and towing speed, albeit differing in execution time and the simplicity of the simulation setup. The first method was found to provide good predictions of the motion in low-speed (0.514–1.543 m/s) towing conditions. The second method provides better results for all the towing speeds and wave heights. As the wave height and towing speed increase, deviations from experiments were observed, signifying non-linear phenomena that are difficult to analyse using the mentioned potential-flow-based methods.

1. Introduction

The harnessing of wind energy from deepwater sites is the next stage of the commercialisation of offshore wind. Several pilot-scale floating wind farms are already operational worldwide, with larger-scale deployments in planning. Floating Offshore Wind Turbines (FOWTs) are specifically engineered to harness higher wind speeds in deep waters, presenting unique challenges compared to fixed-bottom wind turbines. Numerous investigations focusing on the development of floating wind turbine designs, operation conditions and numerical analysis methodologies have been developing in recent years [1]. A significant challenge involves the installation of these structures, typically accomplished by towing the FOWTs to their designated farm locations using large ocean-going vessels. The FOWT system is susceptible to various metocean factors, including wind, waves and currents, which significantly influence towing operations. As wind farms venture into deeper waters, environmental conditions generally become more extreme, amplifying the complexity of the marine operations necessary for installation, operation, maintenance and decommissioning. It is imperative to thoroughly investigate the impact of these environmental factors on an FOWT when planning the construction of large wind farms. This comprehensive understanding will facilitate the identification of optimal weather windows and enable more reliable year-round planning for floating wind farm construction.
The installation methodology employed varies, based on the type of floater utilised to support the wind turbine. FOWTs offer a distinctive opportunity for complete construction and assembly in sheltered waters or at quaysides. Irrespective of the floater type, the installation process necessitates a crucial marine operation—towing. Following construction, the primary challenge entails transporting the fully assembled FOWT system to the designated installation site, where it is connected to preinstalled mooring lines. This task is typically accomplished using towing tugs capable of towing the system from the quayside to the wind farm site. This marine operation poses notable challenges due to often adverse sea conditions, which may subject the turbine to significant loading due to platform motion.
Semi-submersible FOWTs, which can be fully constructed at quaysides and subsequently towed to the farm location, are a popular choice for platform technology developers. As these platforms are susceptible to significant wave-induced motion [2], it is imperative to analyse the motion characteristics of fully assembled semi-submersible FOWTs under tow. This will allow an assessment of vessel requirements, turbine loading, weather windows, safety and ultimately the viability of towing these significant structures in deep waters, far from shore, where weather conditions can change rapidly. Given the sensitive nature of wind turbine structures to motion, maintaining acceptable values of motion and acceleration is essential to prevent damage to components and to maintain the high standards of Safety of Life at Sea (SOLAS).
It is worth noting that all the existing floating wind farms across the globe have utilised towing operations during their installation phases. The Windfloat Atlantic, Hywind Scotland, Kincardine and Hywind Tampen projects utilised towing vessels and operations during their construction [3,4]. Tow-to-port and tow-to-shallow operations are planned for major maintenance activities for Kincardine and Hywind Scotland wind farms, respectively [5]. During a heavy maintenance campaign at the Kincardine wind farm, one of the platforms was detached from the mooring system and towed to a maintenance port and subsequently towed back to the wind farm location after necessary repairs [6].
Thus, towing operations remain crucial for significant repairs and decommissioning processes also, reinforcing their status as one of the most vital marine operations throughout the entire life cycle of a floating wind farm.
Numerous factors influence the towing operation of an FOWT system. Some of these concern the motion that affects the survivability and course-keeping of the platform, whilst others deal with the forces and acceleration limits on the structure. These factors collectively ensure the secure, safe and efficient transit of the fully assembled FOWT system to its wind farm destination. Throughout the towing process, the platform contends with various metocean elements such as wind, waves and currents. It is important to avoid severe motion and acceleration and phenomena like fishtailing while towing. While FOWTs are engineered for stability at high draughts with mooring lines in place, the towing phase often necessitates the transportation of deballasted platforms at lower draughts and without the support of mooring lines. Consequently, dedicated research into platform motion during towing is imperative to facilitate safe towing operations.
Towing operations have been the subject of research in the context of Oil and Gas platforms over the past few decades, primarily during the exploration phase. Existing ocean towing practices are guided by established general rules and guidelines for marine operations [2,7,8]. In recent years, there have been emerging efforts to analyse towing operations specific to FOWTs. A critical aspect contributing to the safety of towing operations is the stability of the platform during transit. While dedicated rules and guidelines for assessing the intact stability of FOWT systems are currently lacking, certain principles can be adapted from the extensively developed standards within the oil and gas industry, which have been in use for an extended period. Collu et al. [9] conducted research in this area, proposing stability guidelines for fully assembled FOWTs during the transportation and installation phases. Furthermore, there has been a growing interest in investigating the motion dynamics of platforms during towing operations. Ding et al. [10] conducted a numerical analysis of the towing operation involving a submerged Tension Leg Platform (TLP) wind turbine, employing a multi-body approach to examine the impact of environmental factors (e.g., wind and waves), bollard pull and towing point height on the towing process. Their study involved modelling and analysing a multi-body system comprising a tug, a towing line and an FOWT, encompassing various environmental conditions and identifying limiting factors. It showed that the platform exhibited stability up to significant wave heights of 5 m and wind speeds of 17 m/s while being towed at speeds of up to 2.8 m/s.
Buttner et al. [11] conducted an experimental investigation to examine the towing process of the Orthospar platform while subjecting it to waves propagating from different directions. Concurrently, they assessed the loading experienced due to the towing line during these experiments. In a separate study, Mas-Soler et al. [12] carried out experiments involving a Tension Leg Platform (TLP) to determine the platform’s towing characteristics across various towing configurations, both in calm waters and under diverse wave conditions. Le et al. [13] analysed the towing performance of two submerged floating offshore wind turbines, evaluating platform motion under varying sea conditions. The study involved calculating maximum values for the heave, pitch and roll and using these to establish limits for towing these platforms based on significant wave height. Additionally, the study derived the bollard pull requirements for different towing scenarios. In another study, Hyland et al. [14] conducted towing tests, assessing the drag prerequisites of the GICON TLP under various operational and towing conditions, and they observed Vortex-Induced Motion (VIM) while towing in calm water.
Many of the mentioned investigations focused on towing in specific metocean conditions, depending on the type of floater and installation sites. Previous experimental investigations outlined the observations and motion characteristics recorded during the experiments, but numerical analysis methodologies have rarely been mentioned. FOWTs are usually planned for farm-scale deployments with multiple repeated towing operations compared to the towing of an oil and gas floating platform, which is usually a one-off process. Finding the optimised towing speed and ascertaining the metocean limits is crucial to enabling safe, efficient and cost-effective towing operations [3]. A comprehensive, systematic study focusing on various towing speeds and wave heights and their effects on FOWT motion and towing loads is lacking. This paper aims to fill this gap in knowledge, and it provides an ’industry-ready’ approach to understanding and analysing FOWT towing operations. It also aims to create an experimental database for studying semi-submersible towing operations and fuelling further research.
This paper presents and analyses an experimental investigation conducted to understand the towing characteristics of a semi-submersible platform under various conditions, including different speeds, physical configurations and wave conditions. The study placed particular emphasis on the hydrodynamic drag and motion that the platform exhibited during the towing operation. The motion was simulated numerically using two distinct approaches. In the first approach, the platform was represented as a body in motion at a small forward speed, and the motion was simulated using potential-flow-based approaches. This is an analysis methodology commonly used for the hydrodynamic analysis of ships moving with a small forward speed. The forward speed can have a considerable impact on the wave forces acting on a body, especially the second-order drift forces [15]. Grue et al. [16] studied this problem and found that a forward speed of 1 m/s can increase the drift forces by up to 50% compared to a body at zero speed. Later, Grue et al. [17] extended the numerical approach to analysing bodies in waters of a restricted depth also. This paper presents a novel investigation into the applicability of this approach across a large range of speeds and wave heights, attempting to predict the dynamic response of a towed semi-submersible FOWT by incorporating quadratic damping coefficients, derived from decay tests, to accurately ascertain the impact of viscosity. The second approach involves modelling the platform under zero-speed conditions, with towing simulated by restraining the platform using towing lines and applying a current equivalent to the towing speed. Second-order drift forces play a major role here, and a similar problem was analysed by Emmerhoff et al. [18] to understand the slow-drift motion of vertical cylinders moving with a low speed (or a slow current). An explicit solution for the analysis of a single cylinder was derived and extended to analyse a rectangular arrangement of cylinders. Negative damping was observed over frequency intervals in which the wave interactions were significant. Kinoshita et al. [19] developed a semi-analytical solution to analyse cylindrical bodies oscillating in the presence of waves and a slight current. The effects of draughts and water depth were also studied. This solution worked well for cylinders moored to the sea bottom but was lacking while analysing freely oscillating cylinders. In the presented study, the motion was simulated using a hybrid approach, i.e., a combination of potential flow and Morison-equation-based methods. The obtained results were subjected to a comprehensive analysis, allowing for a comparative assessment of the advantages and disadvantages inherent to both methods.
While designing new floaters, it is crucial to investigate and establish installation methodologies that align with the specific requirements and operational demands of the floaters [3]. If wet towing is imperative, the methodologies discussed in this paper offer designers and developers an opportunity to assess the seaworthiness and towability of forthcoming FOWTs, thereby enabling them to refine their decision-making process during the project’s initial phases itself. These methods are applicable to any floater design and can be employed to calculate the motion and towing loads of the platform, and depending on the availability of resources, a suitable method can be chosen. The paper stimulates further innovation and refinement in analysis techniques, including various non-linear phenomena, flexible platforms, additional limiting factors, etc., leading to improved methodologies in the future.
In Section 2, the details of the experimental campaign are discussed. The geometric details of the platform, the model and the towing line are outlined in this section. The measurements, dimensions, speeds and numerical simulation results provided in the paper are presented at full-scale, and the corresponding model-scale values can be derived by applying the appropriate scaling factors. Section 3 discusses the numerical approaches used for the calculations. The results obtained from the numerical simulations are validated against the experimental results. Some of these comparisons are shown in this section, and the rest are presented in Appendices Appendix B and Appendix C. Subsequently, the following section critically analyses and interprets the obtained results from the experiments and the numerical simulations presented in the previous section. In the following section, the major insights and informed conclusions from the presented study are presented The potential avenues for future research, highlighting areas where further exploration and investigation could enhance our understanding of the subject matter, are also discussed there.

2. Platform Configuration and Characteristics

2.1. The DeepCwind Semi-Submersible Platform

In this research, the DeepCwind semi-submersible platform [20] was used. The platform consists of a central column and three outer columns arranged in a triangular configuration (see Figure 1). The platform is designed to support a 5 MW wind turbine. The original design of the platform had an installation draught of 20 m. This draught is impractical for towing because, as the draught increases, it leads to a rise in the fluid drag acting on the platform, consequently necessitating a higher bollard pull to tow the FOWT. It is important to calculate the towing draught accurately in order to reduce the drag while towing. As the draught decreases, the drag reduces, but the motion of the body may become severe. The optimum towing draught is a balance between stability and the motion of the platform [3]. The geometry of the platform also plays a role in deciding the towing draught of the platform. For platforms like DeepCwind with large heave plates, care should be taken to ensure that the heave plates do not emerge out of the water during towing in order to avoid non-linear phenomena like slamming and green water loads. Similarly, for platforms featuring large pontoons for buoyancy, attention must also be paid to these phenomena.

2.2. Determination of Towing Draught

The draught was determined using a basic intact stability study. The GM (metacentric height) values which influence the stability of the platform were calculated at different draughts. The righting arm (GZ) at various draughts (T) was calculated using an open-source tool called BEMRosetta [21,22]. These values are plotted in Figure 2. As mentioned before, the stability rules applicable to FOWTs are still not fully developed, and in the presented study, stability checks were performed using the general IMO stability criteria [8,23] and the MODU (Mobile Offshore Drilling Units) rules [9,24]. The wind turbine was assumed to be kept in a parked–feathered condition to minimise the wind loads on the structure [25]. Even in this turbine configuration, the wind loads could be significant, depending on the wind speed, but it takes dedicated research to understand the effect of wind, which is beyond the scope of this paper.
The stability criteria were provided by [8,9,23,24] as follows:
  • The initial GM or metacentric height should not be less than 1 m.
  • The righting moment curve is to be positive over the entire range of angles from upright to the second intercept (if a wind heeling moment is included in the stability analysis).
  • The maximum inclination under the total heeling moment should not exceed 15°.
  • The righting lever GZ should be at least 0.2 m, and the angle of heel θ 30°.
  • The maximum righting lever should occur at the heel, θ > 30° preferably, but not less than 25°.
  • The area of the GZ curve should be at least as follows:
    0.055 m radian up to θ = 30°.
    0.090 m radian up to θ = 40°.
    0.03 m radian between 30 and 40 or between 30 and the angle of the down flooding.
  • The maximum righting arm should occur at an angle of heel preferably exceeding 30° but not less than 25°.
  • The static range of stability should not be less than 15° at the draught during towing.
For the selected draughts mentioned in Figure 2, 3.072 m (zero-ballast) and 5 m did not pass the stability tests and were, hence, considered unsuitable for towing. All the other draughts (see Figure 2) satisfied the criteria for stability. While planning towing operations in rough seas, the draught should be high enough so that the heave plates or pontoons remain sufficiently immersed and, hence, green water and slamming loads can be avoided. The immersion is determined via various factors like the wave steepness and the significant wave height, etc., of the waves expected along the towing route [26]. Increasing the draught reduces the air gap in the case of platforms with a deck. This may lead to increased wet-deck slamming, and care should be taken to avoid green-water loads on the top of the cylindrical columns. The thickness of the heave plate of the DeepCwind platform is 6 m, and choosing a draught of 7.5 m corresponds to a distance of 1.5 m between the water surface and the top of the heave plate, while opting for a 10 m draught provides a distance of 4 m. A higher draught reduces the probability of the heave plate surfacing during the towing process [25], but it also increases the fluid drag on the hull. Consequently, the draught was chosen at 10 m for the experiments. Further refinements in the calculation of the towing draught are possible, but they are beyond the scope of the presented study.

3. Experimental Configuration

3.1. Test Facility

The tests were conducted in the freshwater Concept Basin at the Maritime Research Institute Netherlands (MARIN). The Concept Basin has a length of 220 m, a width of 4 m and a depth of 3.6 m. The basin is equipped with a stiff carriage which has a maximum speed of 10 m/s. The details of the model can be found in Figure 3. Waves were generated from a wave generator on one end of the basin, and the other end employed a beach to absorb the waves.

3.2. Platform Model, Towing Setup and Configurations

A 1:50 scale model of the DeepCwind semi-submersible platform was used for the tests. The model represents the towed FOWT system (platform + NREL 5 MW wind turbine), and its geometry and characteristics can be found in Figure 4 and Table 1, respectively. The Froude number and Reynolds number are presented in Table 2. The diameter of the outer column was taken as the characteristic length for the calculation [27,28].
The platform was placed in the basin, and the towing lines with/without a bridle were attached to the platform. The other end of the main towing cable was attached to a spring which represented the stiffness of the towing line (ref. Table 3). The towing line was then attached to a stiff rod which was connected to the carriage. A load cell was connected to the towing line to record the tension on the towing line. The motion of the platform was recorded using an optical tracking camera. Wave measurements at various towing speeds were performed prior to the tests to obtain the calibration data required for calculations. Figure 5 shows the test setup used for the experiments.
Two configurations/towing setups were tested during the experiments. In configuration 1, a bridle was used for towing. The angle formed at the apex of the bridle, as specified in reference [25], could range between 45 and 60 degrees. For this configuration, a selection of 60 degrees was made. In configuration 2, the towing line was directly connected to the platform. The towing configurations tested during the campaign are shown in Figure 6 and Figure 7. In both configurations, the towing point/points were at the same level as the centre of gravity of the platform, as this was essential to avoid unbalanced moments due to the towline pull.

3.3. Towing Line

The towing line was selected according to the Maritime Safety Committee-MSC/Circular 884-Guidelines for Safe Ocean Towing [8]. The length of the towing line is determined using the following formula:
T o w l i n e   L e n g t h = ( B P / B L ) 1800
When the Bollard Pull (BP) is higher than 883 KN (90 tons), the Breaking Load (BL) is approximately half of the bollard pull [7]. The stiffness of the towing line is determined based on DNV-RP-H103 [7]:
T o w l i n e   S t i f f n e s s = ( E A / L r ) 1800
where E is the modulus of elasticity, A is the cross-sectional area and Lr is the length of the rope. The rope diameter and elasticity are determined according to ISO 2307:2010 [29]. The calculated towline properties are shown in Table 3.
An available spring with the nearest stiffness value, K = 718.23 KN/m, was used for the towing tests. The tow line length of 900 m would scale to 17 m in the basin. For practical purposes in the basin, the tow line length was reduced to 135 m.

3.4. Test Campaign

Towing tests were performed for both configurations with various towing speeds and wave conditions. The model was placed in the basin, and the measurement devices were connected to the carriage. Comprehensive checks were performed to ensure the model’s unobstructed movement. The initial stage involved conducting decay tests to determine the natural frequencies of motion, specifically in heave, roll and pitch. The calm water towing tests for speeds ranging from 0.514 m/s to 3.086 m/s were performed for both configurations then to ascertain the drag and, thereby, the bollard pull required for towing in calm water. Fewer tests were carried out for configuration 2, primarily because configuration 1, which employs a bridle, is the most widely employed and recommended towing setup in the offshore industry [25].
Following the calm water tests, towing tests were conducted under various regular wave conditions. The primary objective was to determine the platform’s motion responses and the associated drag, which are vital for calculating added resistance in waves of varying frequencies. Detailed test specifications are provided in Table 4, encompassing tests at speeds of 1.029, 2.058 and 2.572 m/s with seven wave periods spanning from 6.26 s to 20.94 s. Given the focus on assessing the performance with high waves, the majority of the tests were conducted under high wave conditions.
Subsequent to the assessments under regular wave conditions, tests were conducted involving white noise waves, with the primary aim being the determination of the platform’s Response Amplitude Operators (RAOs) for motion. Refer to Table 5 for detailed information. The tests covered a range of towing speeds—0.514, 1.543, 2.572 and 3.086 m/s—and encompassed significant wave heights of 1, 2, 4 and 6 m. For higher speeds, tests were conducted for significant wave heights of 1, 2 and 4 m only.

3.5. Observations

The platform motion was checked and observed throughout the experimental campaign for interesting and unexpected phenomena. Since the motion of the platform was of interest, it was measured during towing. The roll motion was found to be very minimal during the towing process, which was expected because only head waves were used in the experiment. Sprays and splashes were also observed during many of the tests (Figure 8). As the significant wave height increased, the motion became severe compared to the lesser wave heights.
An additional significant observation pertained to the Fluid-Induced Motion (FIM) of the platform during the towing process. A comparative analysis of the platform’s motion in configurations 1 and 2 was conducted, and the outcomes are examined in the next section. It was evident that configuration 1, involving the use of a bridle, exhibited reduced FIM.

3.5.1. Fluid-Induced Motion (FIM)

As mentioned before, some oscillatory motion was observed during towing in calm water. To check for VIM, which is a special kind of FIM, the nominal A/D values which represent the amplitude of the motion [30] were calculated and plotted (Figure 9) for both configurations. The nominal A/D value is determined as follows:
( A / D ) nom = 2 σ y D
where D is the projected column diameter, and σ y is the standard deviation of the motion in the direction perpendicular to the incoming flow (sway). It was shown that configuration 1 exhibits a lower nominal A/D value at the tested speeds, which indicates better course-keeping.

3.5.2. Drag and Bollard Pull

The recorded tension on the towing line during calm water tests is presented and analysed here. This measurement shows the required bollard pull to tow the system at different speeds, and it shows that this value fluctuates according to the speed of towing. The maximum, minimum and mean towing forces were calculated, and they are presented in Table 6. As the speed increased, it was observed that the variation of the towing force also increased. The statistical properties of the values are plotted (Figure 10).

4. Numerical Validation

Two distinct methods were employed to conduct a comparative analysis of the results. In the first method, the platform was presumed to be in forward motion at a speed equivalent to the platform’s towing speed. Utilising SEACAL [31], in-house seakeeping software developed at MARIN, based on 3D potential flow methods, the platform’s motion was simulated in the frequency domain. An inherent challenge in this method lies in accurately determining the damping coefficients governing heave, roll and pitch motion, which is influenced by various types of nonlinearities. The precise calculation of these damping coefficients is crucial to accurately simulate this motion. The damping values were derived from the decay tests, which yielded damping values at the natural frequency. This value was then incorporated as additional damping, and simulations were executed to calculate the Response Amplitude Operators (RAOs).
In the second method, the platform was modelled in OrcaFlex [32] as a stationary body (zero-speed), while a current matching the towing speed was imposed on the body. The platform was constrained using towing lines, and its motion in various wave conditions and current speeds was simulated. Firstly, the platform was modelled as a 3D panel mesh, and a frequency-domain hydrodynamic analysis was executed utilising Orcawave [
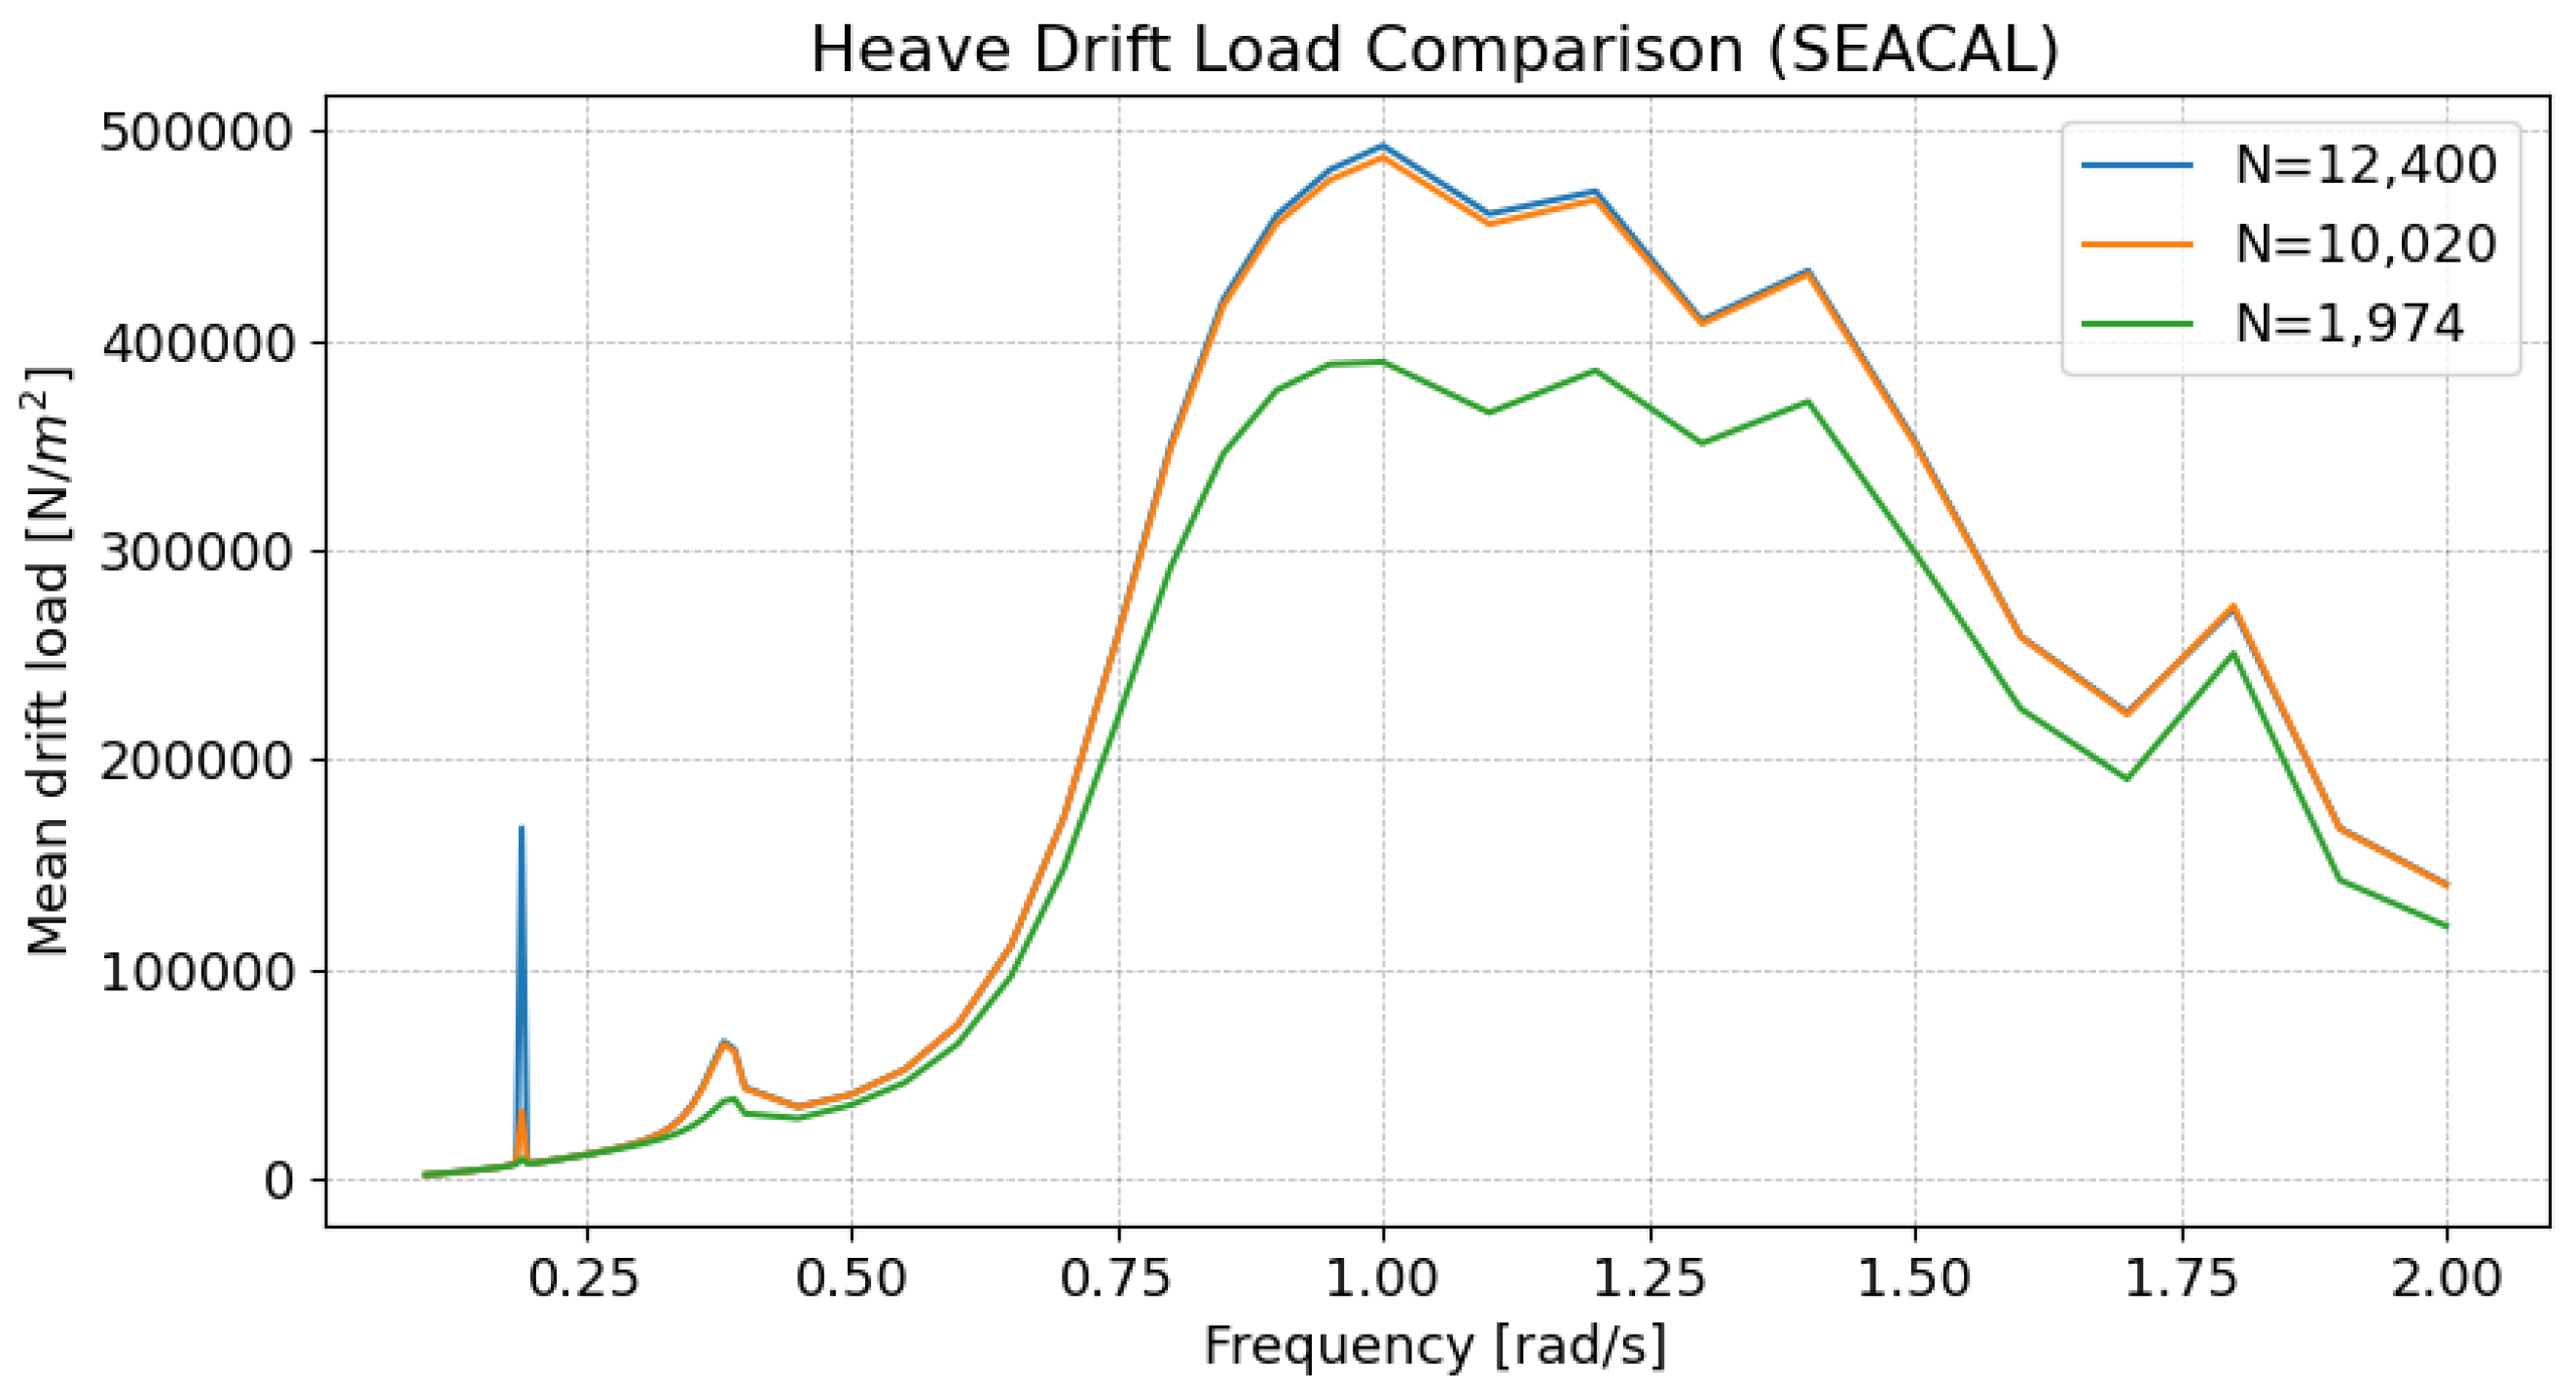
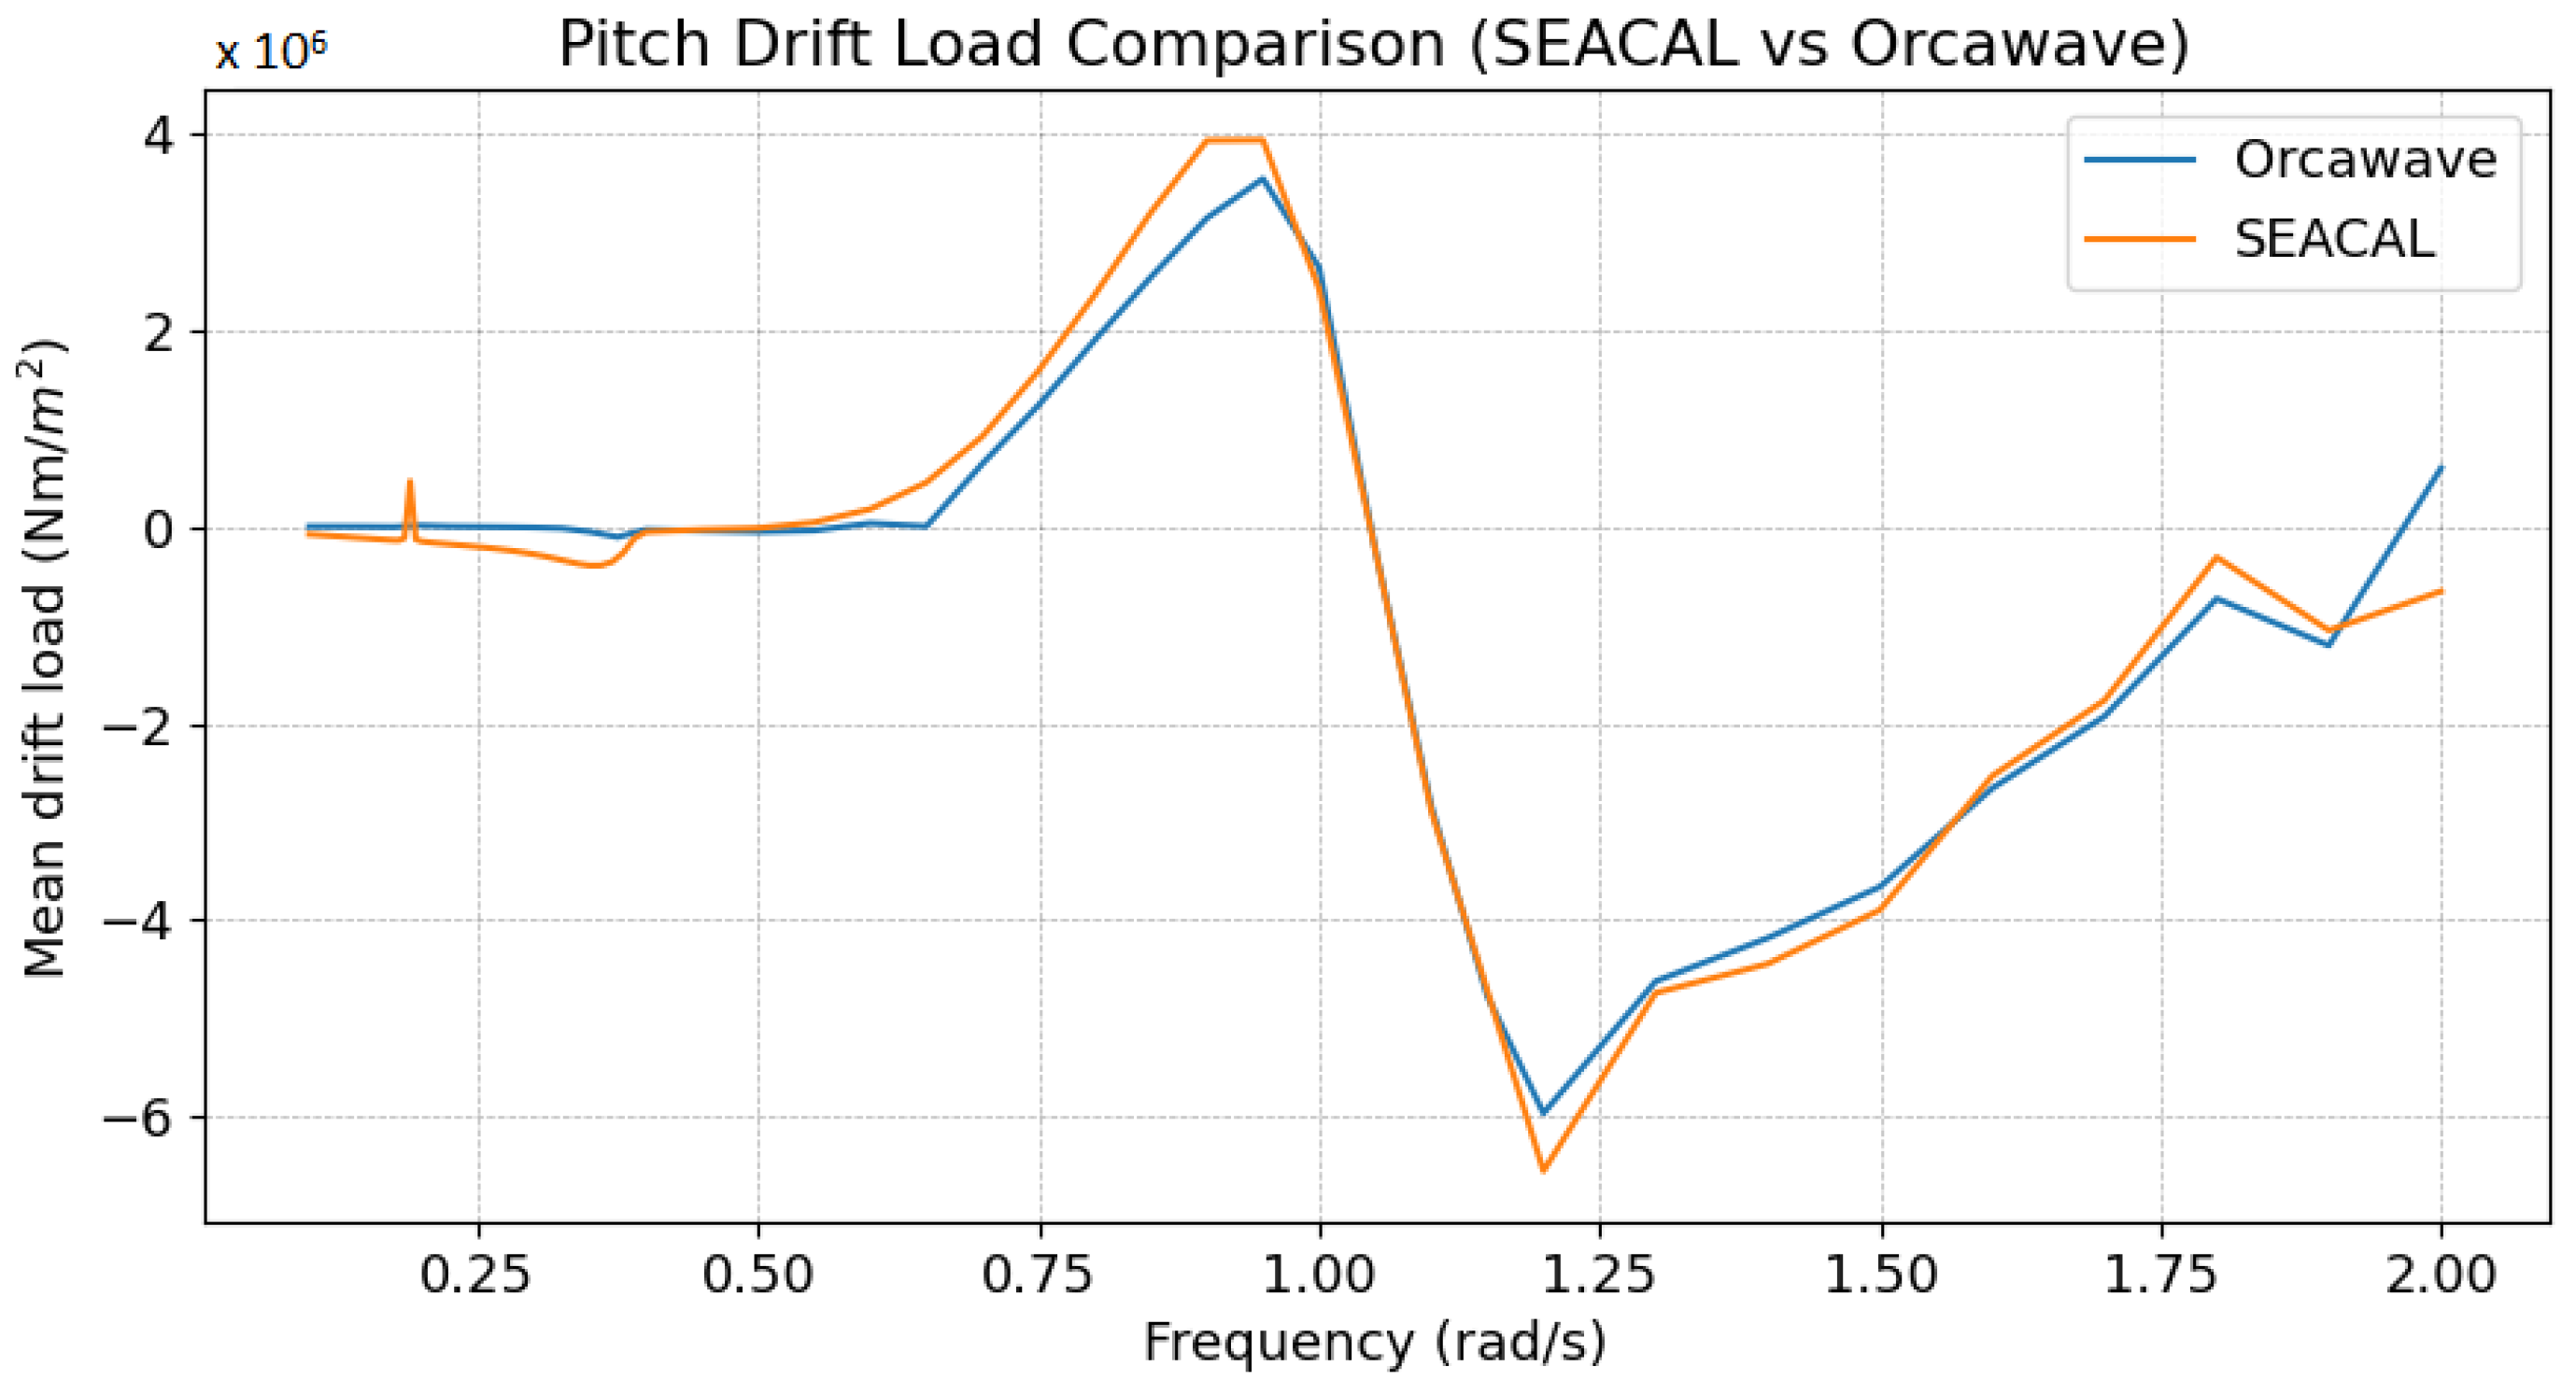
33]. The second-order drift forces play a major role in the motion of bodies moving with a slow speed (or small current velocities), and it is important to calculate them accurately. A mesh convergence study based on the second-order heave and pitch drift loads was performed, and it is presented in Appendix A. No additional damping was used here for the frequency-domain analysis. Subsequently, this model and its associated hydrodynamic properties were imported into OrcaFlex for the purpose of performing time-domain simulations. The towing system modelling and following analyses were conducted within the OrcaFlex environment. To account for viscous effects, Morison elements were integrated into the model along the columns, braces and pontoons of the platform. The details of the Morison elements were obtained from the example cases provided by Orcina [34], and they are listed in Table 7. Only drag was considered while using the Morison elements in the version of OrcaFlex used for the analyses. In this approach, motion was simulated in the time domain, and RAOs were determined through subsequent analysis. The RAOs obtained from both calculations were then compared with the results obtained from the experiment, facilitating a comprehensive evaluation of the simulated and observed behaviours of the platform. The details of the numerical tools and the setup used for the simulations are outlined in Appendix A.
SEACAL is based on zero-speed green functions with a correction for forward speed, depending on the encounter frequency. Low-speed approximations were used while modelling the hydrodynamic motion of the platform. It was assumed that the flow was uniform and equal to the platform’s speed everywhere around the platform. The radiated and diffracted waves were calculated independently of the forward speed; i.e., for all speeds, they were propagating in circles around the platform at zero speed. This method generally gives good predictions for small forward speeds (Fn < 0.25). However, a forward speed of 3.086 m/s (Fn = 0.284) was also investigated, given its slight Froude number proximity to 0.25, to explore the code’s performance at a higher speed. The low-speed approximations hold true only for low values (<0.25) of the Strouhal number (also known as the Brard number), τ , determined via τ = ω e U/g [15,35]. While modelling waves and the current together, Orcaflex employs the conventional super-positioning of waves and the current, and it does not take the wave–current interaction into consideration [36]. The effect of the current on a structure is similar to the effect of the forward speed on a vessel [16,35], but in practice, this applies to conditions under which Strouhal numbers are sufficiently low ( τ < 0.25). This is a limiting condition that applies to both the methods employed in this study. A Strouhal number check was performed to ascertain the frequencies and forward speeds at which the limiting value was exceeded ( τ > 0.25). This threshold was surpassed when the encountering frequencies were greater than or equal to 1.2 rad/s, 1 rad/s and 0.8 rad/s for forward speeds of 2.056 m/s, 2.572 m/s and 3.082 m/s, respectively. This signifies that the simulation results using these methods may not be accurate for analysing these towing conditions. However, the results are presented from a curiosity perspective and to check how much they deviate from the experimental results.

4.1. Decay Tests

Decay tests play a vital role in discerning the natural frequencies and facilitating the computation of damping coefficients. In this context, specific decay tests were executed to ascertain the natural frequencies of heave, roll and pitch motion while simultaneously allowing for the calculation of damping coefficients required for the simulations. The damping values are quadratic in nature and are dependent on the motion amplitudes, and these values were calculated and are listed in Table 8. These values were provided as an input for SEACAL, and the damping values at various motion amplitudes were interpolated via the software during the simulations.
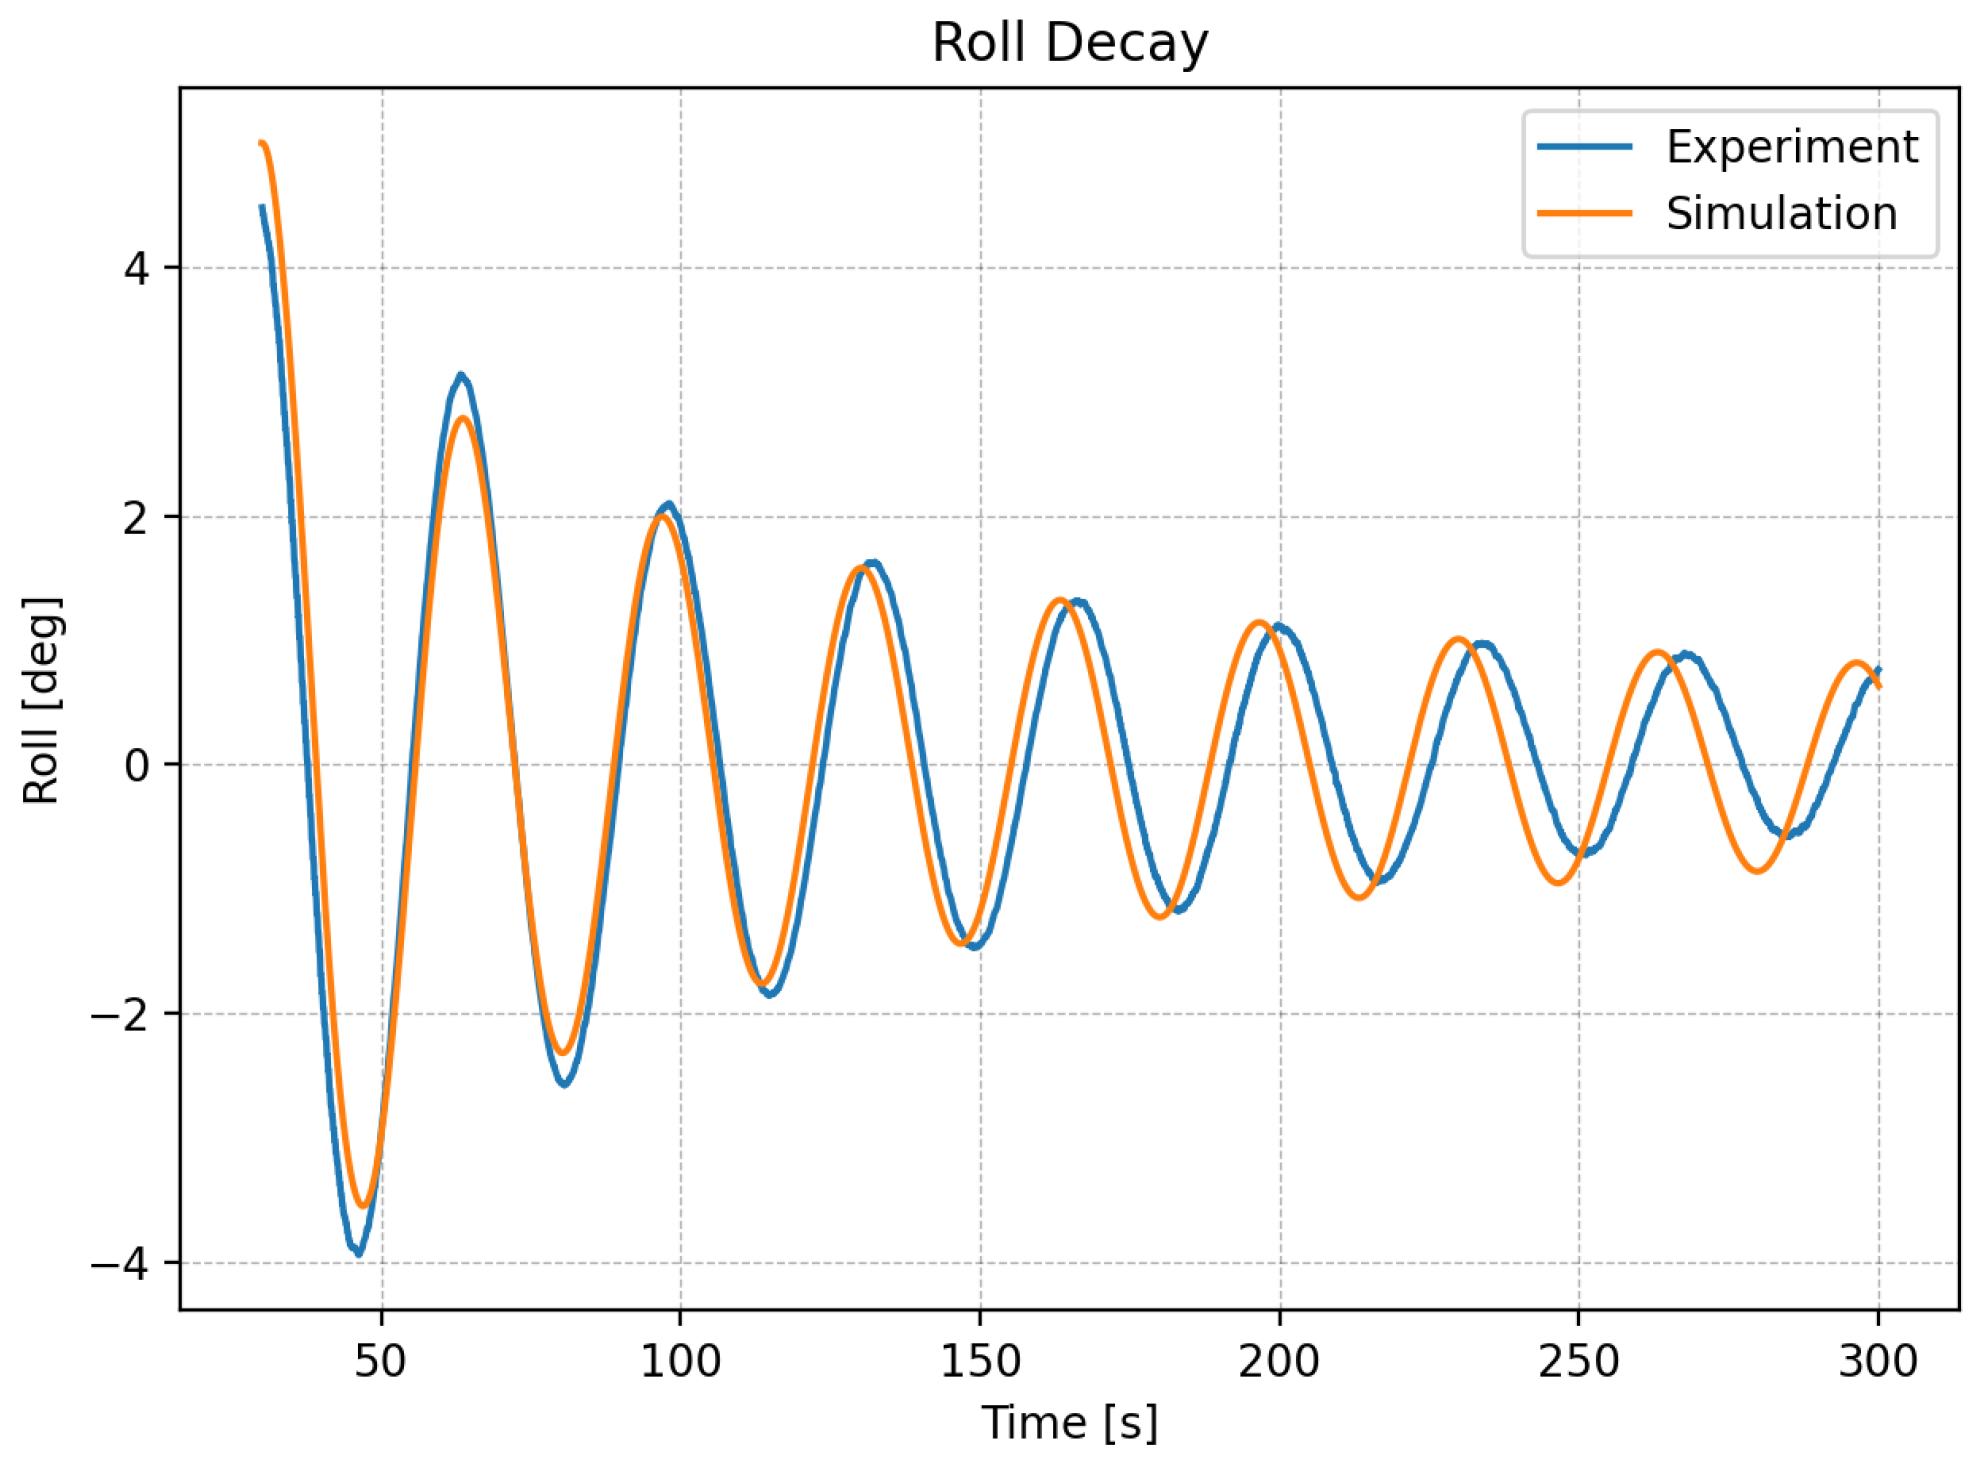
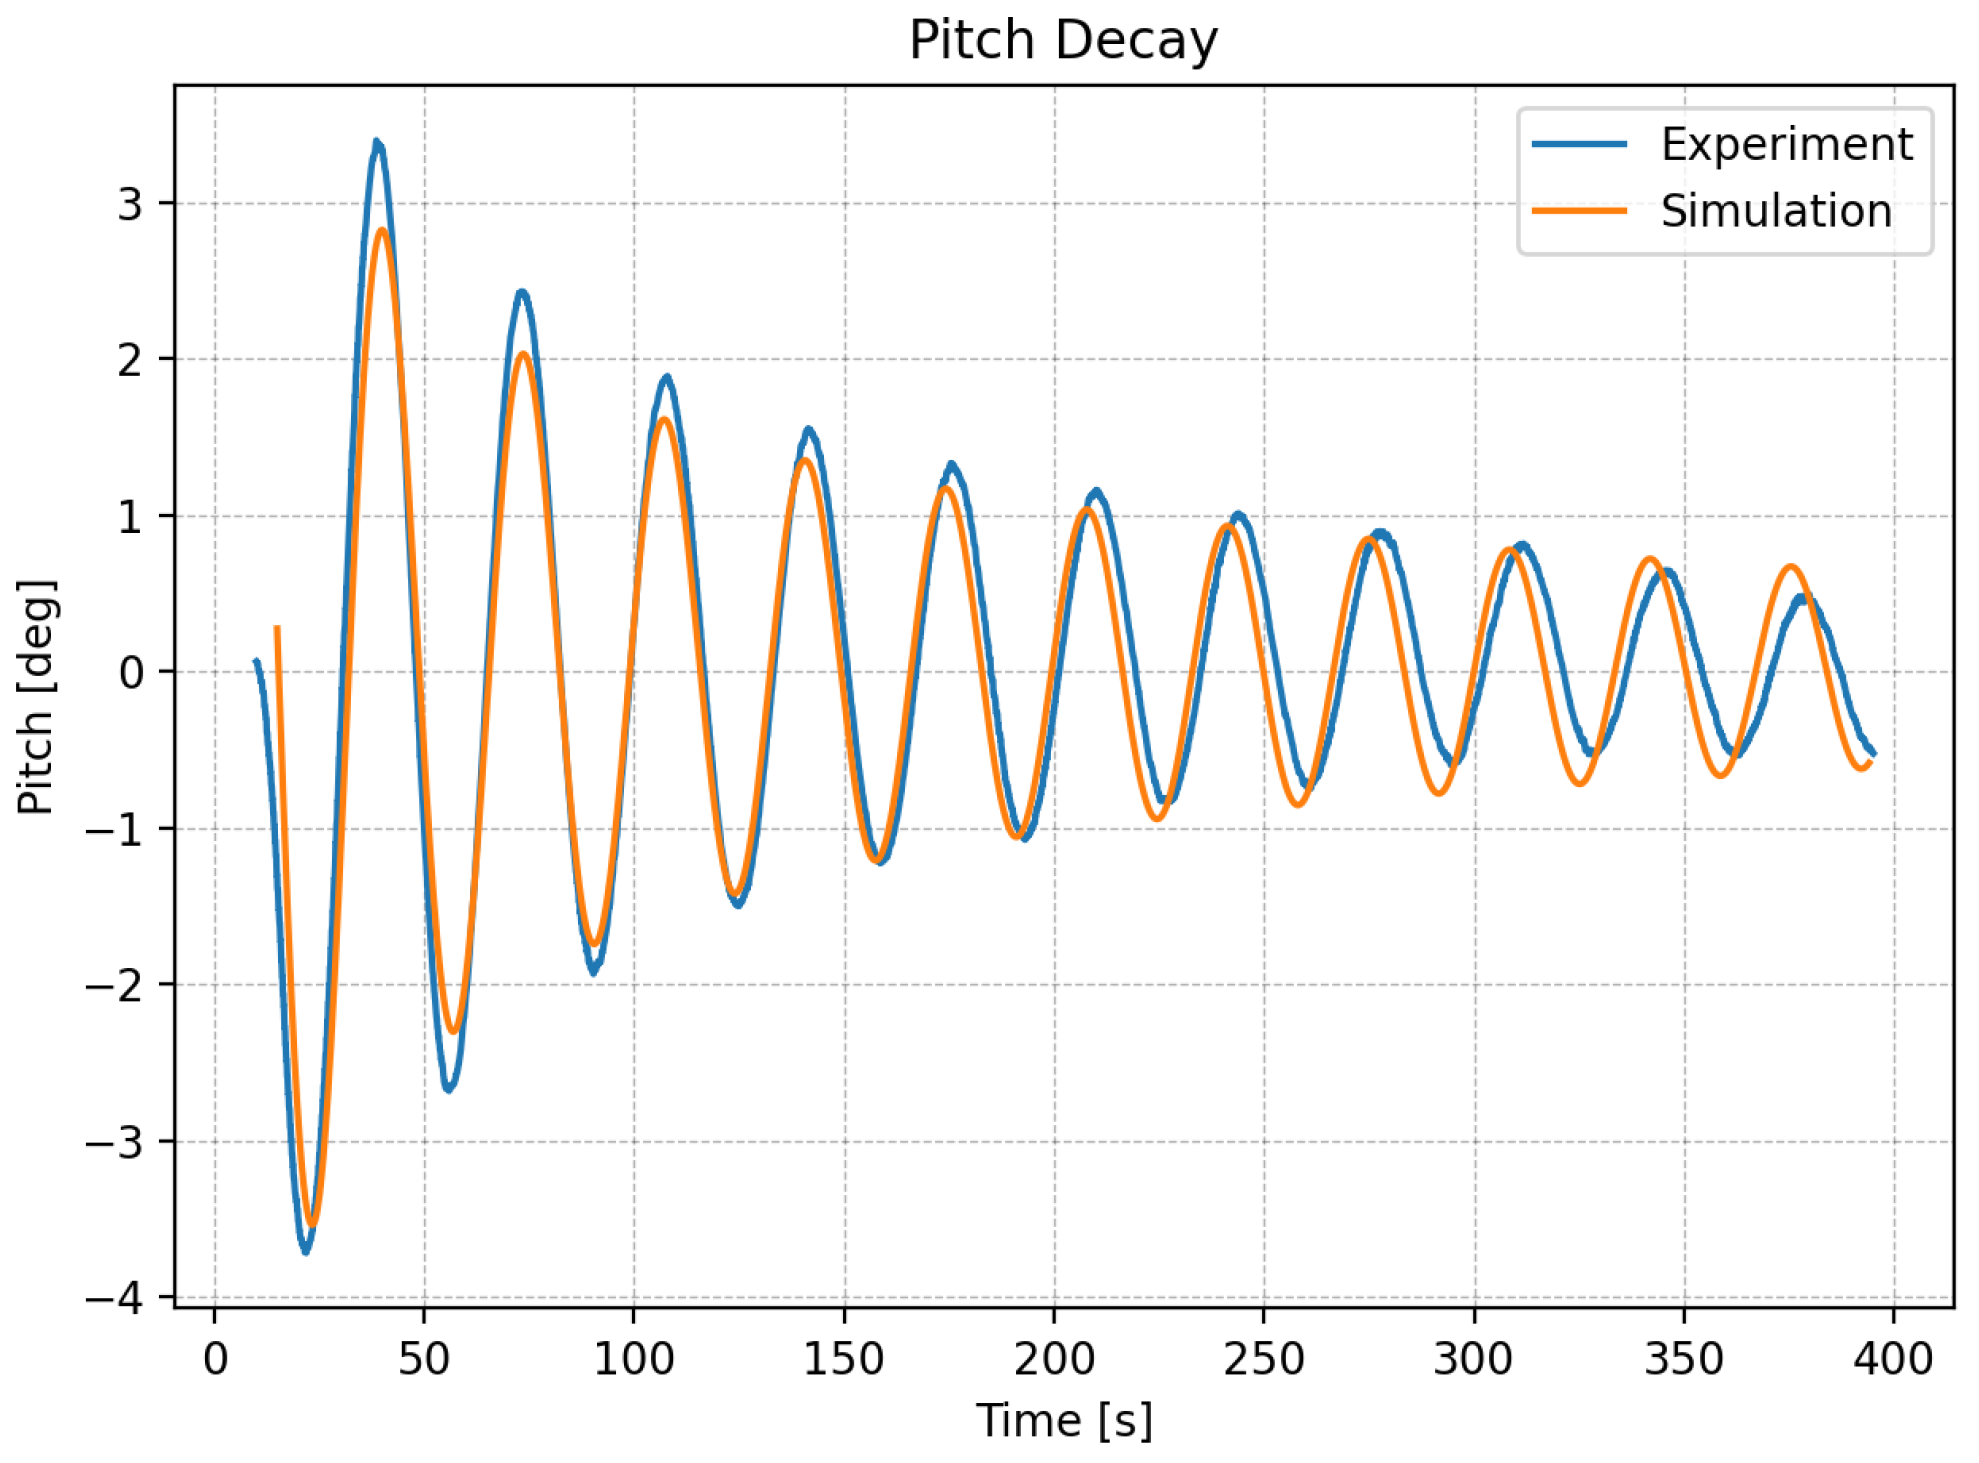
The decay tests themselves were simulated using OrcaFlex, with the resulting outcomes subjected to a thorough comparative analysis. The time-domain simulation results exhibited a strong alignment with the experimental findings for heave and pitch motion, though they marginally underestimated the results for roll motion (see Appendix A, Figure A7, Figure A8 and Figure A9). The natural frequencies were also derived from the RAO simulations performed using SEACAL. A comparative analysis of the natural periods, derived from both the experimental measurements and simulations, is presented in Table 9.

4.2. Towing in Regular Waves

FOWTs are usually towed from ports which have calm sea conditions into more exposed open seas. Depending on the location of the wind farm, the sea conditions get harsher, and the FOWT system starts to encounter waves of varying physical properties. In order to quantify the maximum allowable limits, it is vital to understand the response of the FOWT system in regular waves. In this section, the response of the platform during towing operations under various wave conditions is studied. Its motion and the added resistance that the system encountered are the main focus.

4.2.1. Towing Forces and Added Resistance in Waves

It is crucial to calculate the total towing force required to tow the system in different wave systems in order to find the required bollard pull and a suitable tug for towing. One phenomenon is the added resistance in waves experienced by the floater in regular waves. Added resistance is a second-order phenomenon, and it contributes to the bollard pull requirements of tugs to tow a fully assembled platform in various sea conditions. Once the added resistance in waves is obtained for different wave conditions, the mean added resistance in an irregular seaway can be obtained using the following formula [37]:
R AW = 2 0 S ( ω e ) R aw ( ω e ) ζ 2 d ω e
Here, ω e represents the wave encounter frequency, S( ω e) is the energy spectrum of the irregular sea, and ζ is the wave amplitude.
The added resistance was calculated for various speeds from the experimental data by subtracting the mean towing force in calm water from the mean towing force in the wave system. Since the added resistance is proportional to the square of the wave amplitude, the obtained added resistance values were normalised by the square of the corresponding wave amplitude. The mean towing force and mean added resistance in waves were simulated using OrcaFlex and compared with the experiments in Figure 11, Figure 12 and Figure 13. The mean added resistance in waves for various speeds is plotted against the λ /L, where λ is the wavelength and L is the length of the floater (see Figure 11, Figure 12 and Figure 13).

4.2.2. Motion of the Platform

The primary motion of interest here was heave and pitch, with the roll motion observed to be negligible when towing against head waves. The same model employed to conduct decay tests was also utilised in the towing simulation. Additionally, the modelling process incorporated the towing lines, including the bridle configuration, within the OrcaFlex framework (Figure 14). For wave modelling, the wave encounter frequency was utilised, while the effect of forward speed was introduced by applying a current matching the towing speed. This approach allowed for the calculation of the platform’s time-domain response in the presence of waves, with the simulation results subsequently subjected to validation against experimental data (see Appendix C, Figure A10, Figure A11 and Figure A12 for examples). The modelling of the bridle system was done while ensuring that the overall stiffness of the system equated to the stiffness of the spring. OrcaFlex was employed to compute the tension in the main towing line, consequently yielding the total towing force required to tow the system in various wave conditions directly. The RAOs were also calculated using SEACAL for comparison.
The time-domain comparison was performed as shown in Appendix B. OrcaFlex was able to simulate the results with reasonable accuracy, and it agreed with the experimental results in most cases. The heave and pitch amplitude was calculated for all the test cases mentioned in Table 4. The simulation results demonstrate a commendable alignment with the experimental data. The mean amplitude of the heave and pitch motion calculated from all the test cases was compared against the simulations (see Figure 15, Figure 16 and Figure 17).

4.3. Towing in Irregular Waves

The platform was towed in the white-noise wave conditions shown in 
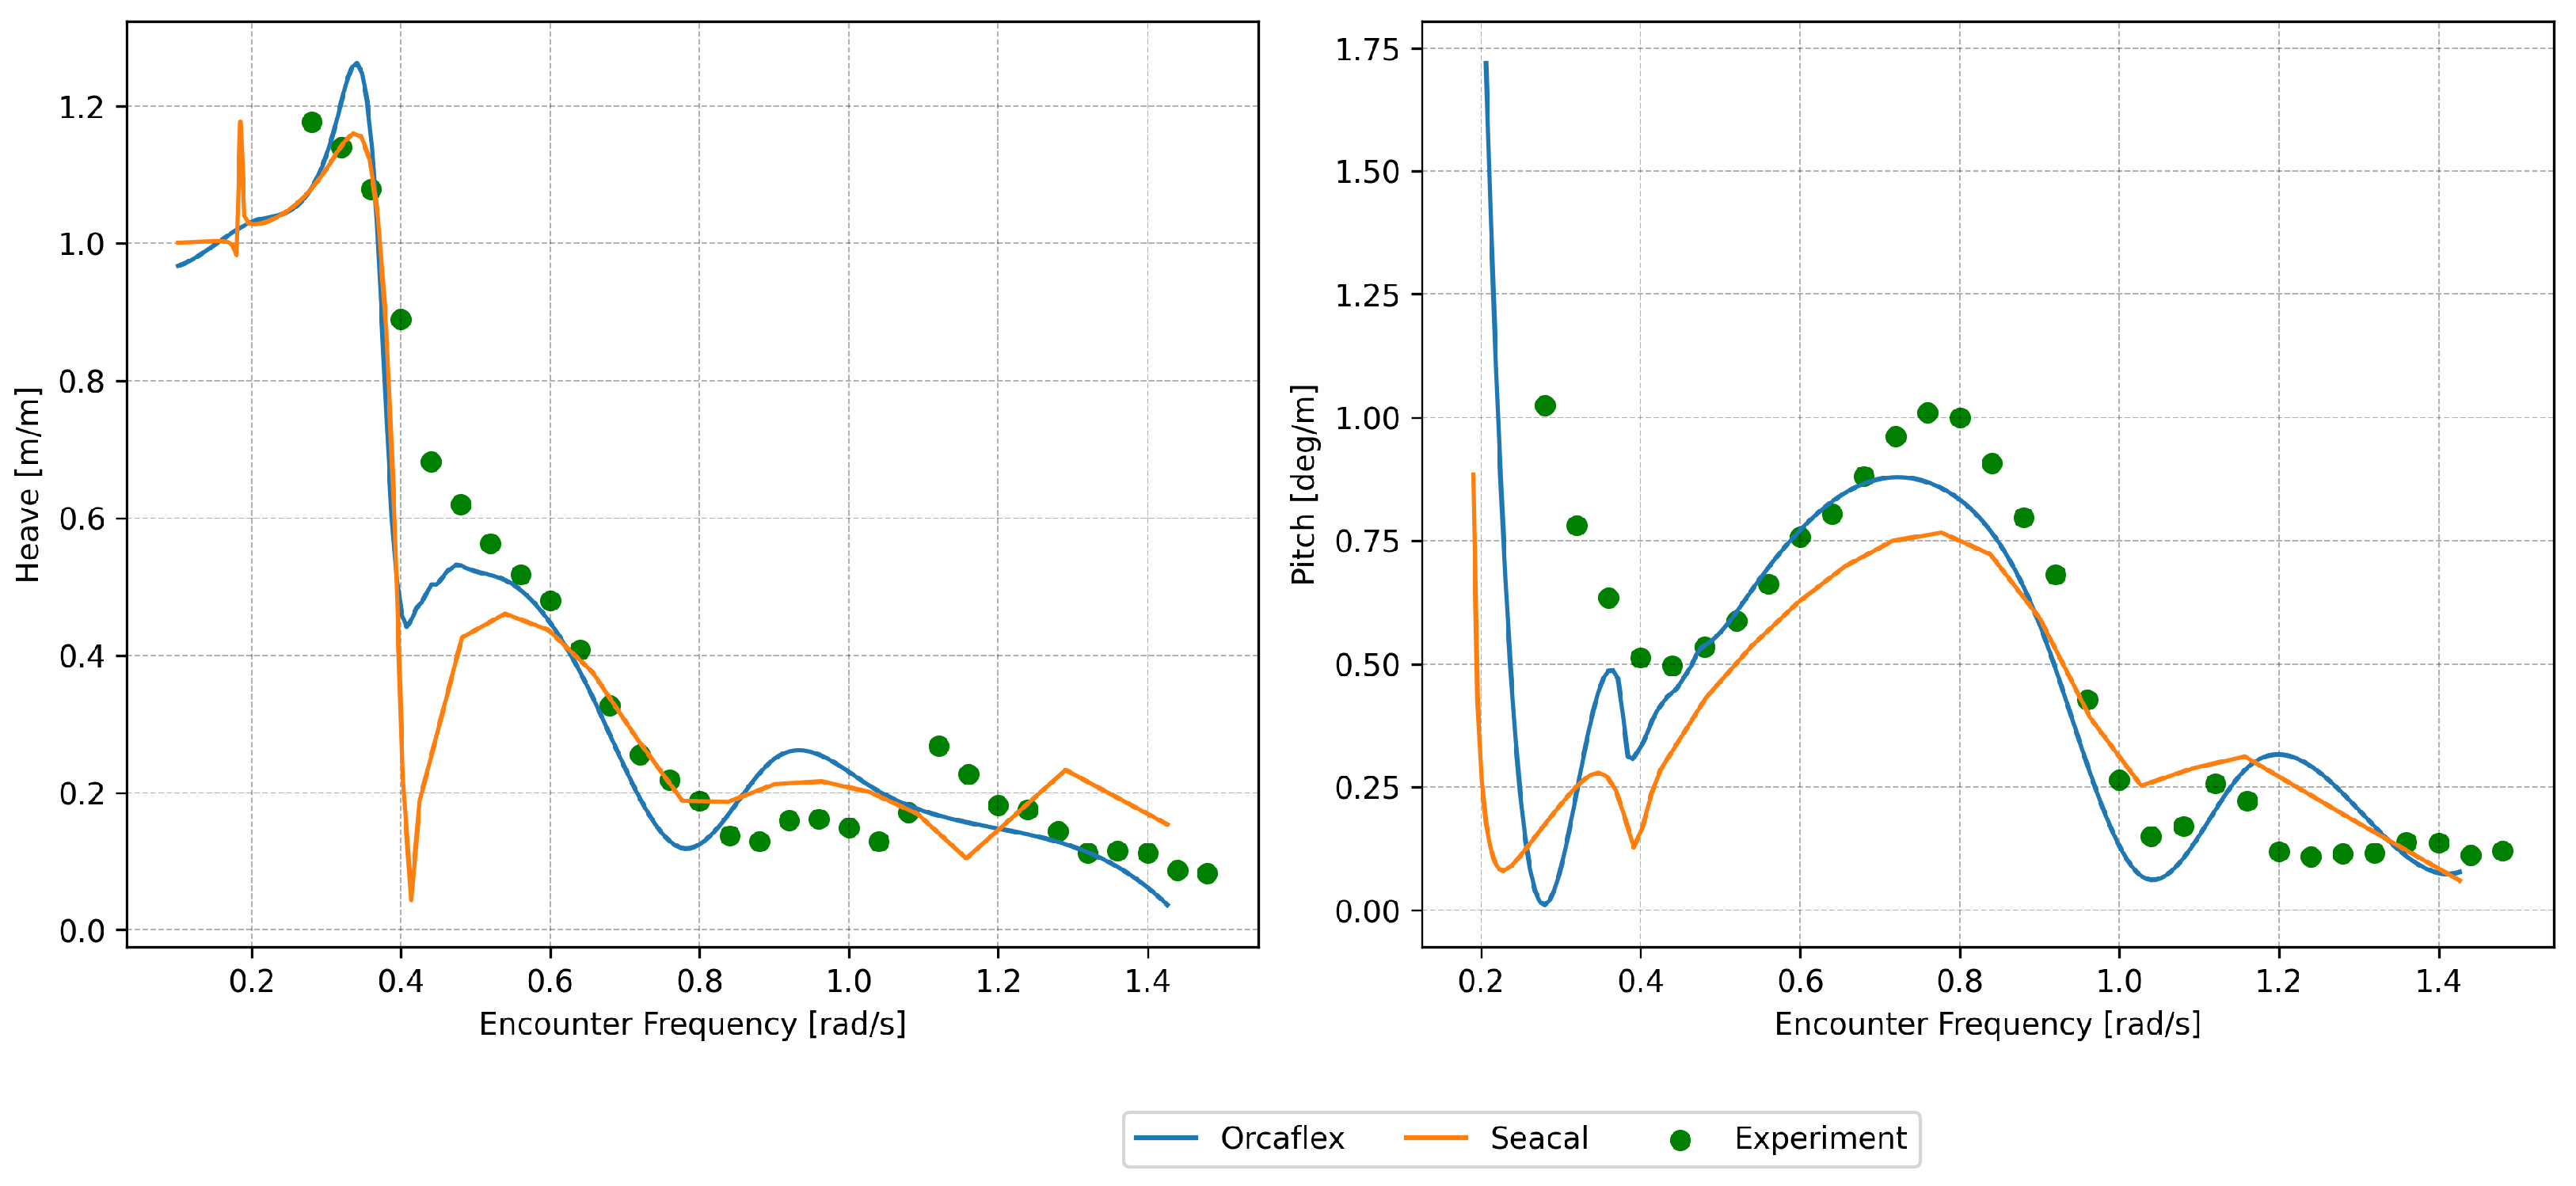
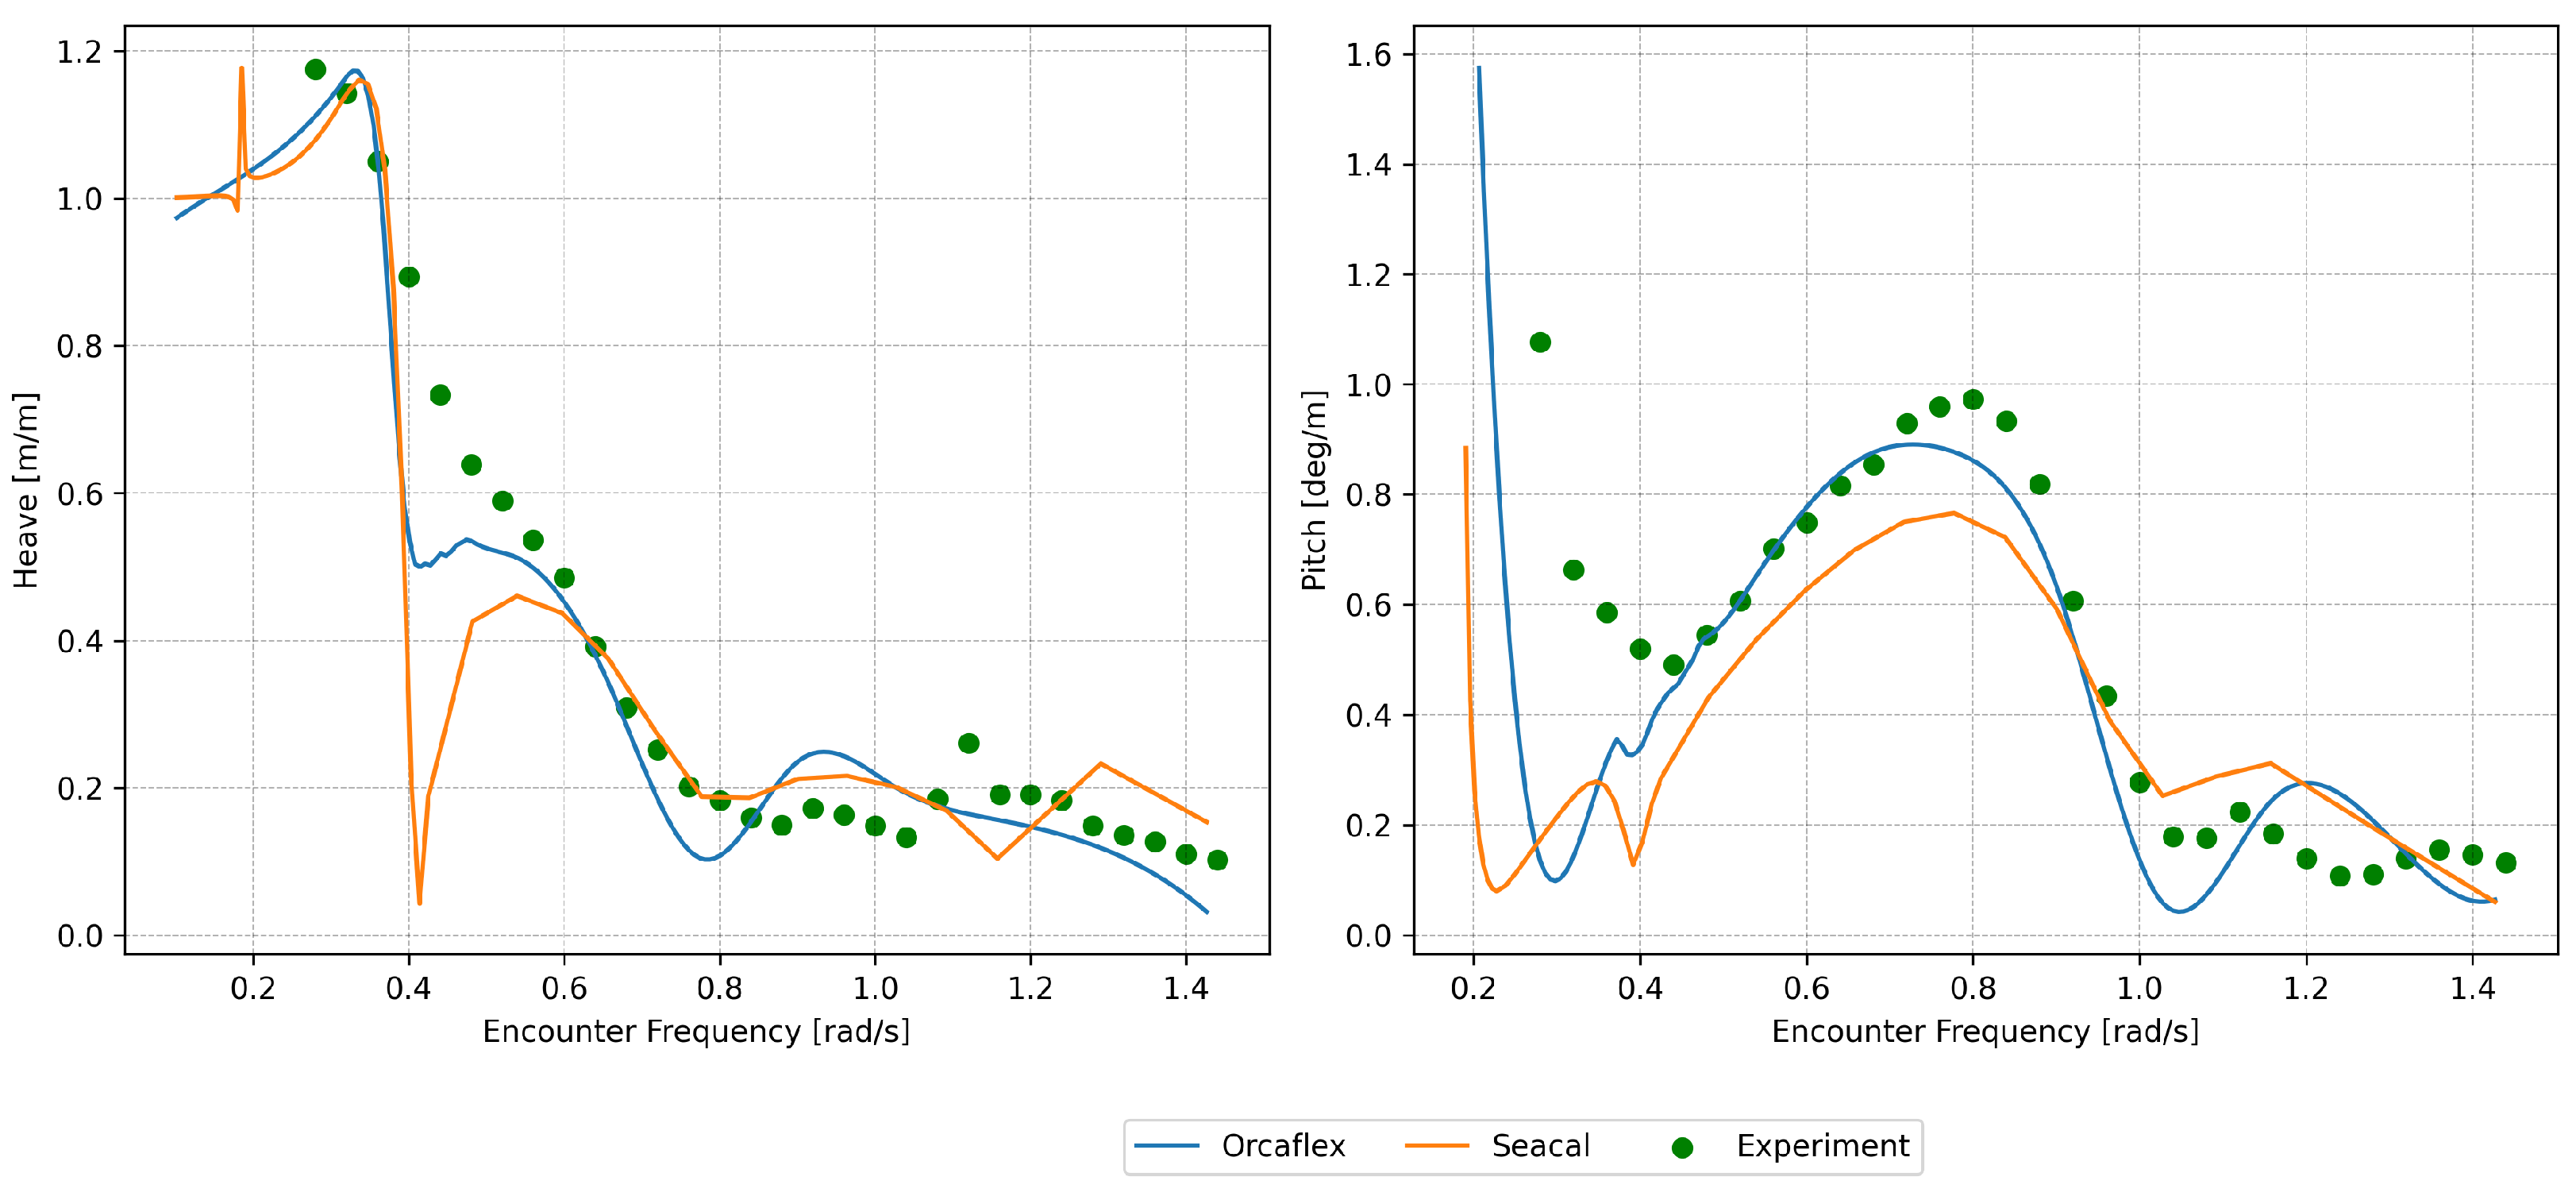
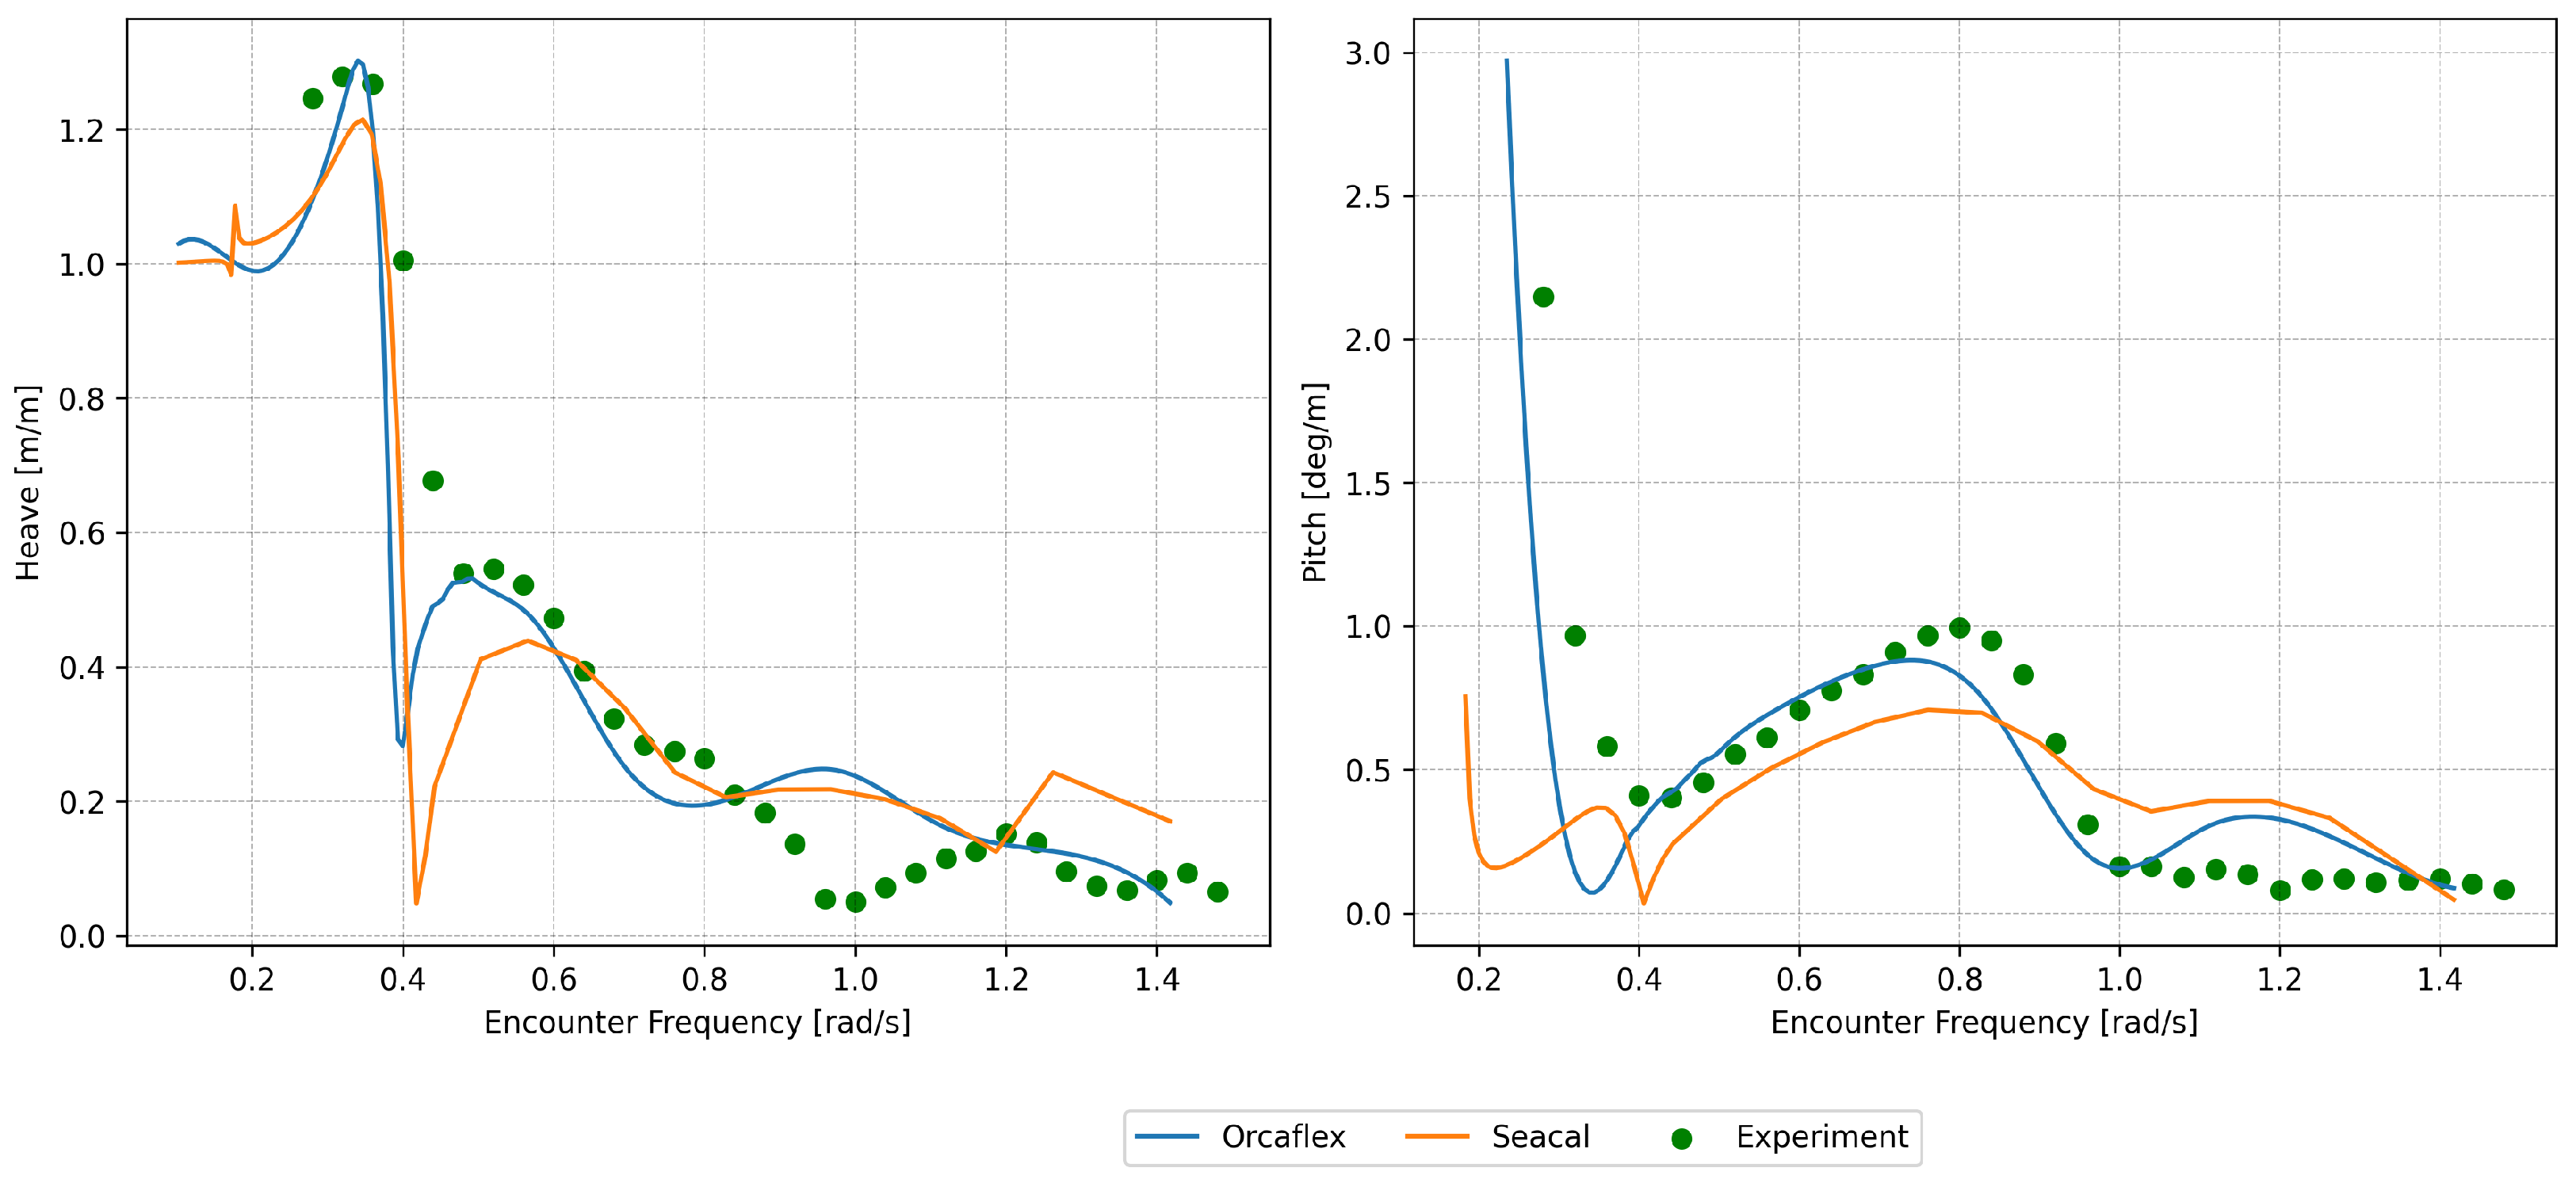
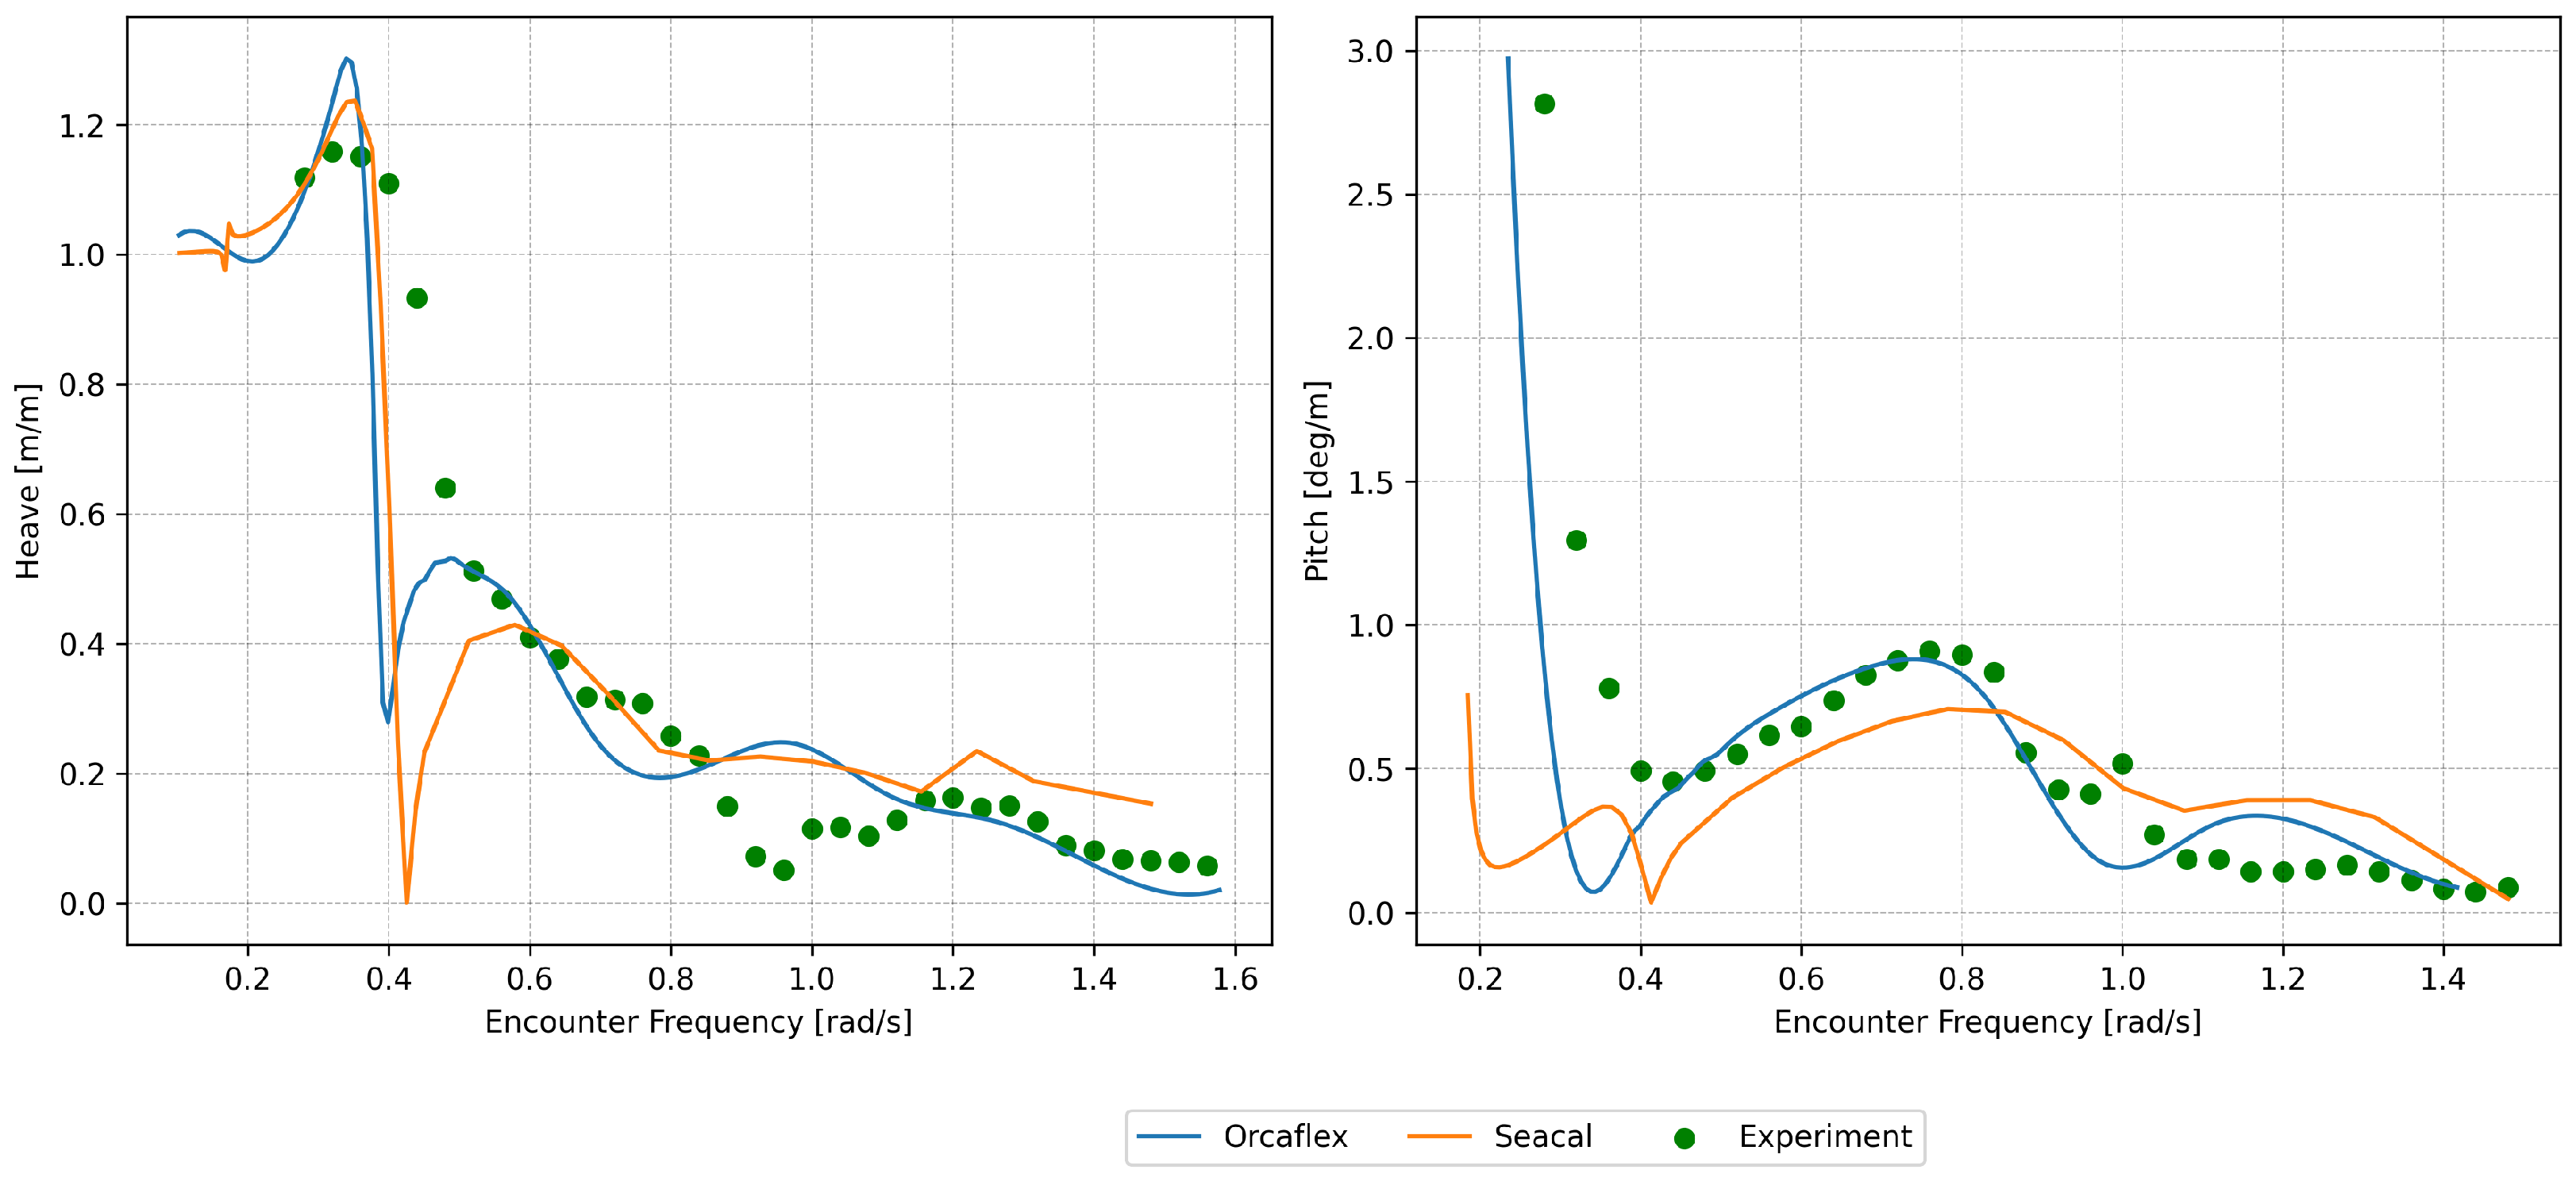
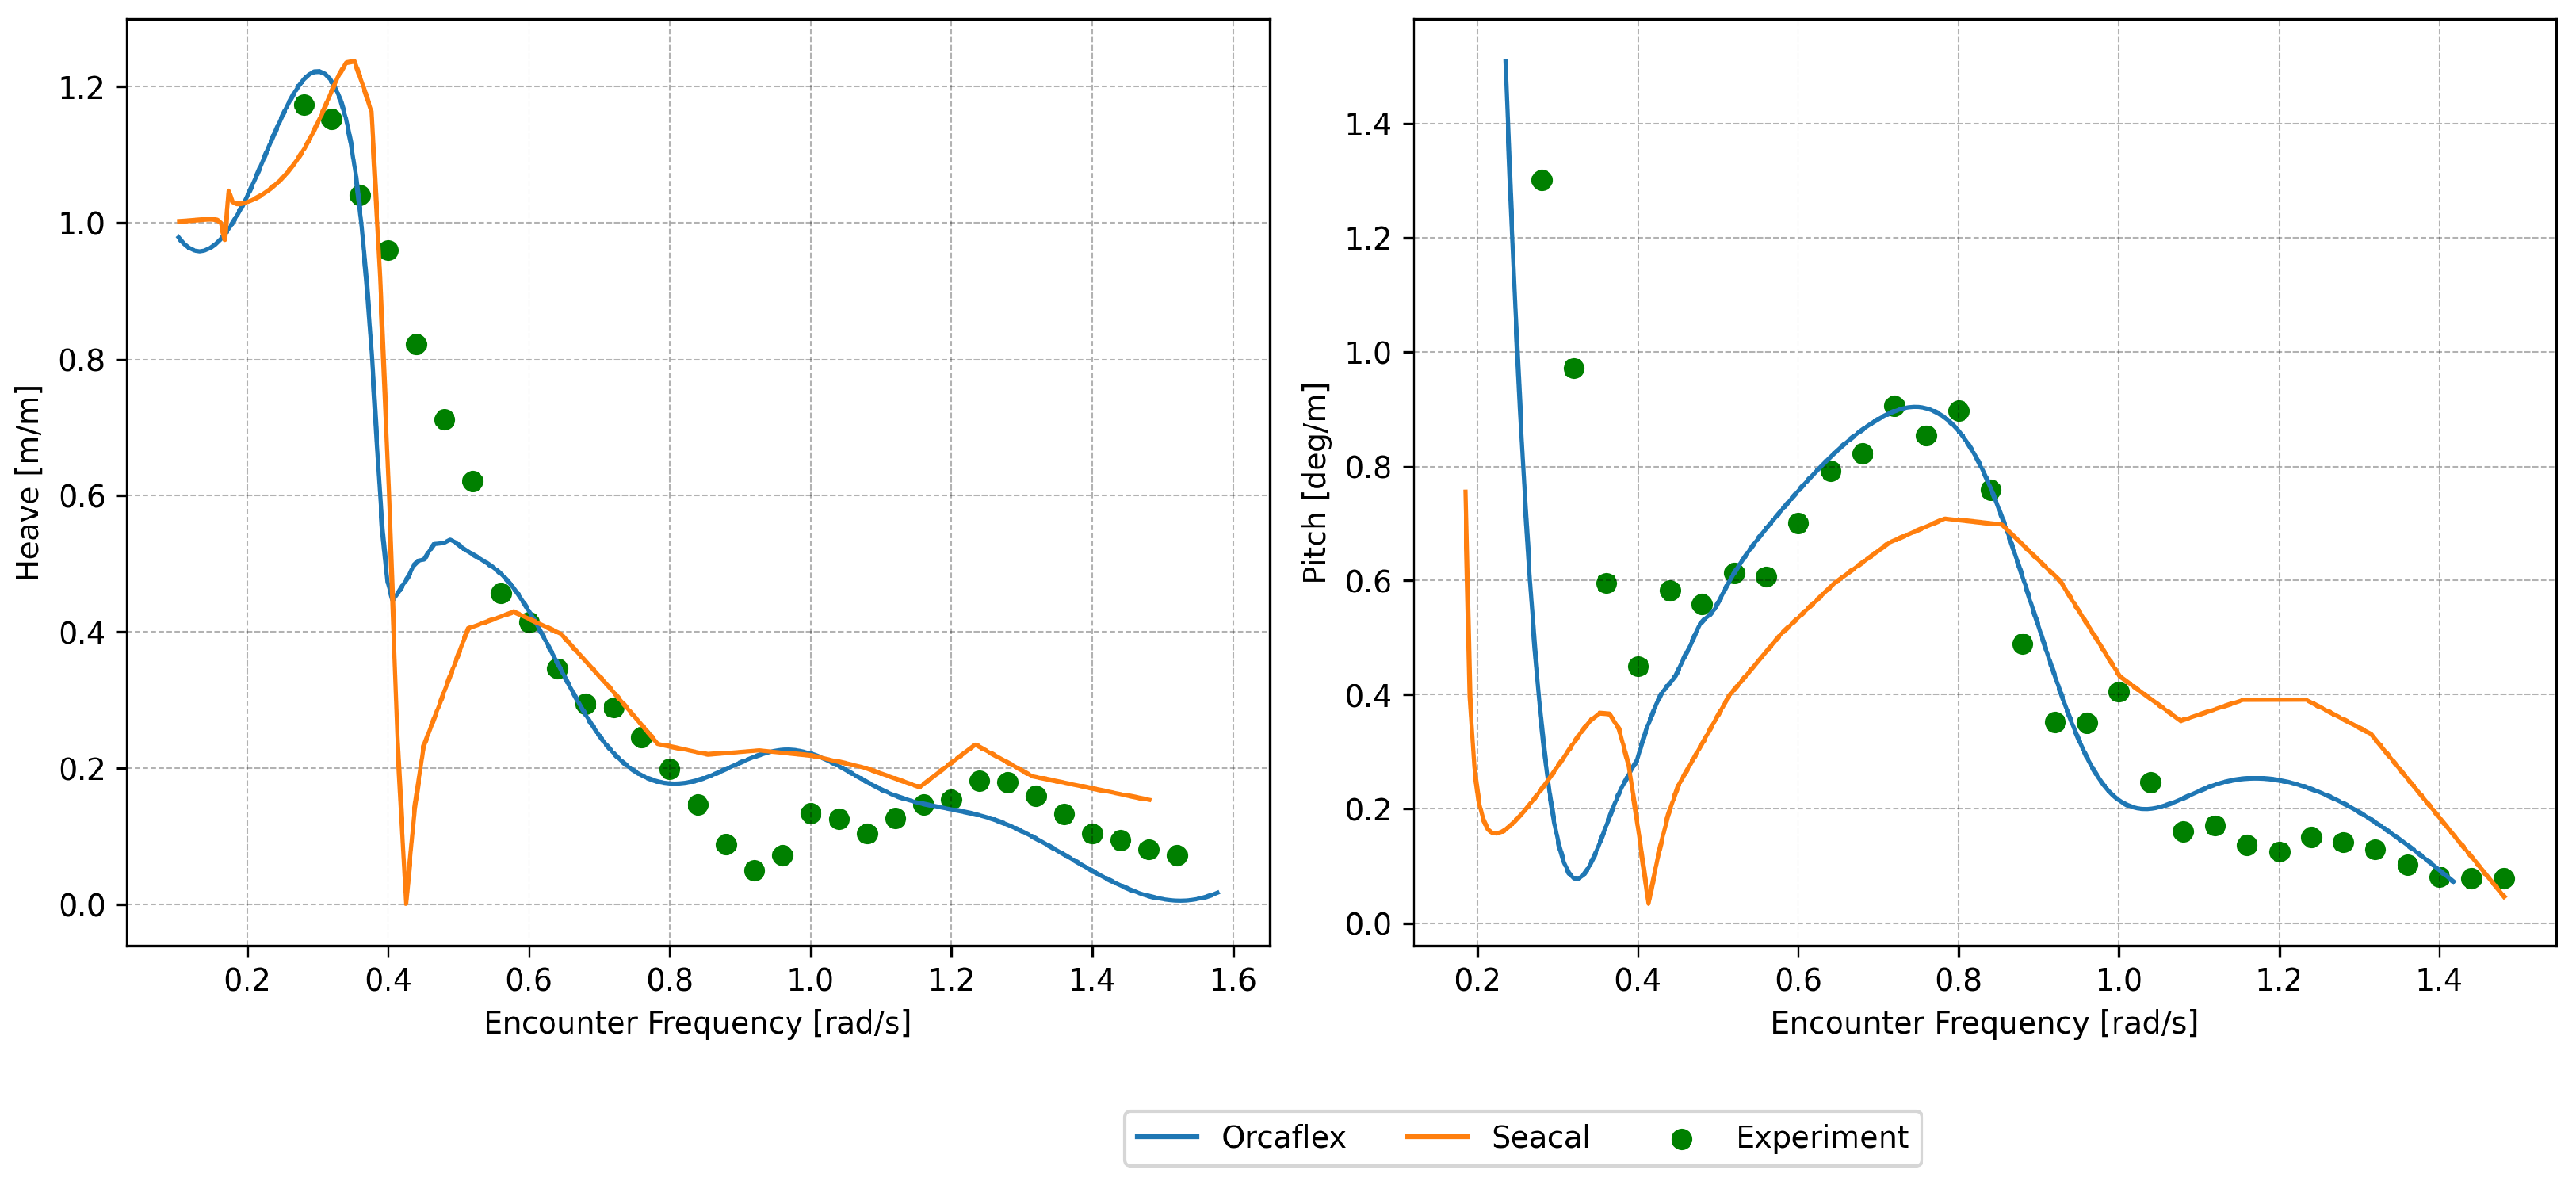
Table 5, and RAOs were calculated using spectral approaches. The RAOs were simulated using SEACAL at the tested towing speeds. These calculations incorporated the determined damping values to enhance the accuracy of the platform’s motion predictions. Using OrcaFlex, time-domain simulations were performed for numerous wave frequencies for all the tested regular wave conditions. From these simulations, the RAOs were obtained by calculating the amplitudes of the pitch and heave motion. Subsequently, RAOs for heave and pitch are graphically presented in the next section (Figure 18, Figure 19, Figure 20 and Figure 21 and Appendix C). The outcomes from both approaches are plotted in Appendix C, facilitating a comprehensive comparison between the two sets of results.

Motion of the Platform

Figure 18, Figure 19, Figure 20 and Figure 21 show the calculated RAOs for a towing speed of 0.514 m/s and its comparison with the simulations performed using both approaches (OrcaFlex and SEACAL). The RAOs corresponding to the other tested towing speeds are presented in Appendix C, arranged according to the towing speed.

5. Discussion

This study presents a comprehensive towing analysis of a semi-submersible FOWT system with various wave conditions, towing speeds and towing configurations. Determining the ideal towing draught plays an important role when planning towing operations. The optimum towing draught is often set as a balancing point between the intact stability and hydrodynamic motion of the floating body. However, it is equally important to exercise caution and account for various non-linear phenomena like FIMs, green water shipping and wave run-ups on the columns, as observed in towing tests, while determining the towing draught.
In 
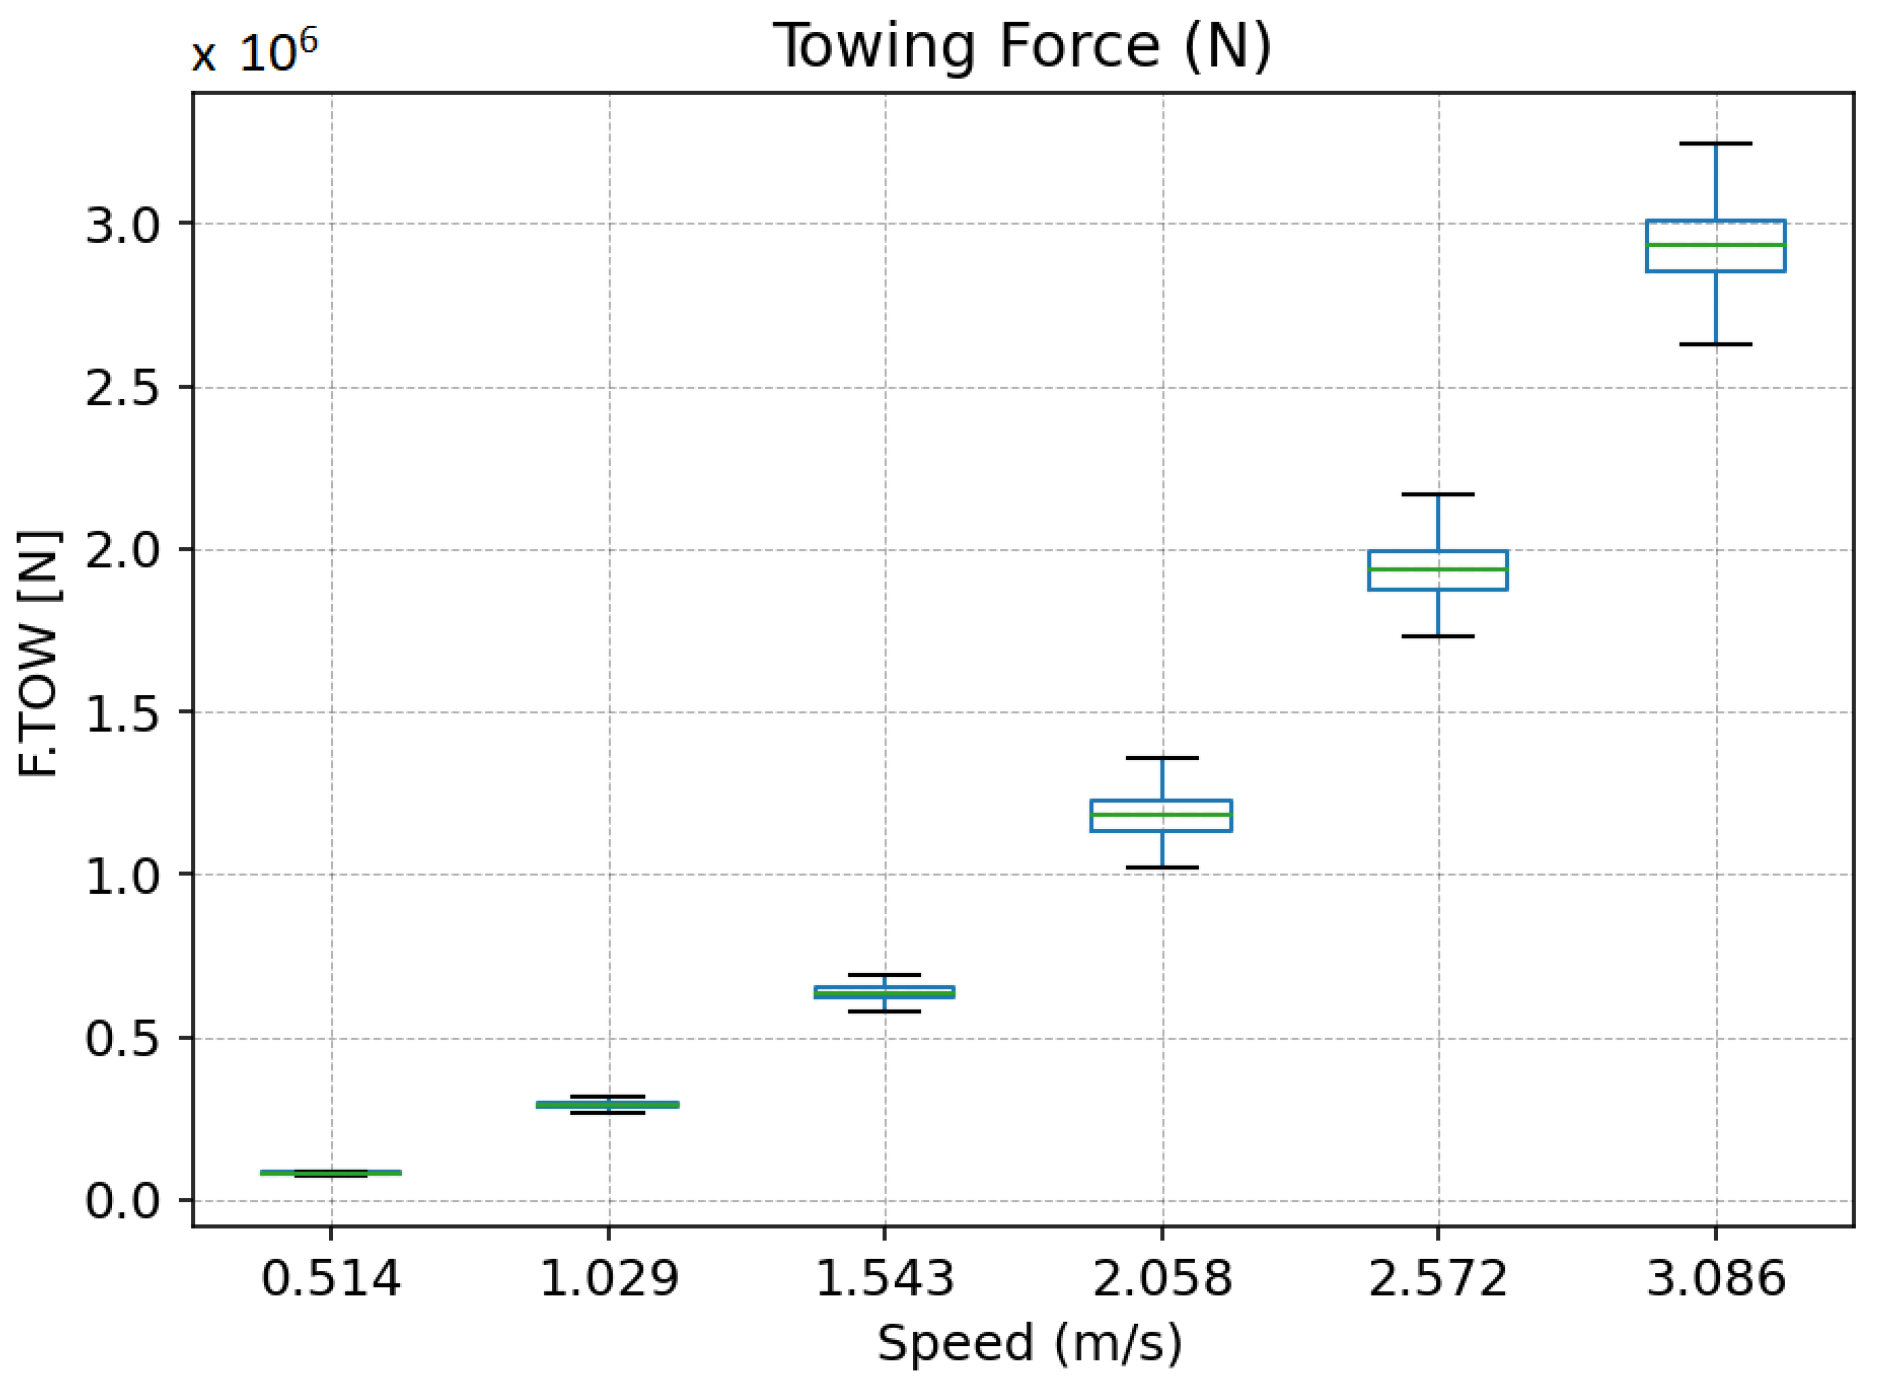
Figure 10, it can be observed that the drag on the platform varies quadratically with respect to the towing speed. This agrees with the observations from previous towing experiments using the INNWIND semi-submersible platform [3]. This is important, as this value provides an idea about the towing in calm water or calm sea states. This plays an important role in calculating the bollard pull and the selection of the tugs for towing. Tug vessels with a maximum bollard pull of around 228 tons and 336 tons are required to tow the platform at 2.57 m/s (5 knots) and 3.09 m/s (6 knots), respectively. Some large tug vessels with bollard pulls of 300 tons exist but are rare [25]. During a major repair campaign of the Kincardine wind farm, tug vessels with a bollard pull higher than 200 tons were chartered at record-high rates for over a decade [6]. These elevated rates were due to the construction of the Hywind Tampen project, which was taking place at the same period in Norway. This signifies that, for towing at high speeds, vessels with high bollard pulls are required, which can have a direct impact on costs.
The precise prediction of the FOWT motion and towing loads in a seaway is a challenging task. Two numerical approaches were applied: a frequency-domain potential flow approach (SEACAL), including a slow forward speed and linearised damping, and a hybrid time-domain approach (OrcaFlex), employing potential-flow calculations and Morison elements to account for viscous effects. The hybrid approach slightly under-predicted the mean towing force but was able to predict it with a mean absolute percentage error of 5.9%, 8.4% and 9.5% for test cases with towing speeds of 1.029 m/s, 2.058 m/s and 2.572 m/s, respectively. The added resistance was not properly predicted, but a rough prediction was possible, and it requires further investigation to improve the predictions. The highest added resistance occurs when λ /L is close to 1, i.e., when the length of the encountering wave is equal to the length of the platform, and this was properly captured using the model.
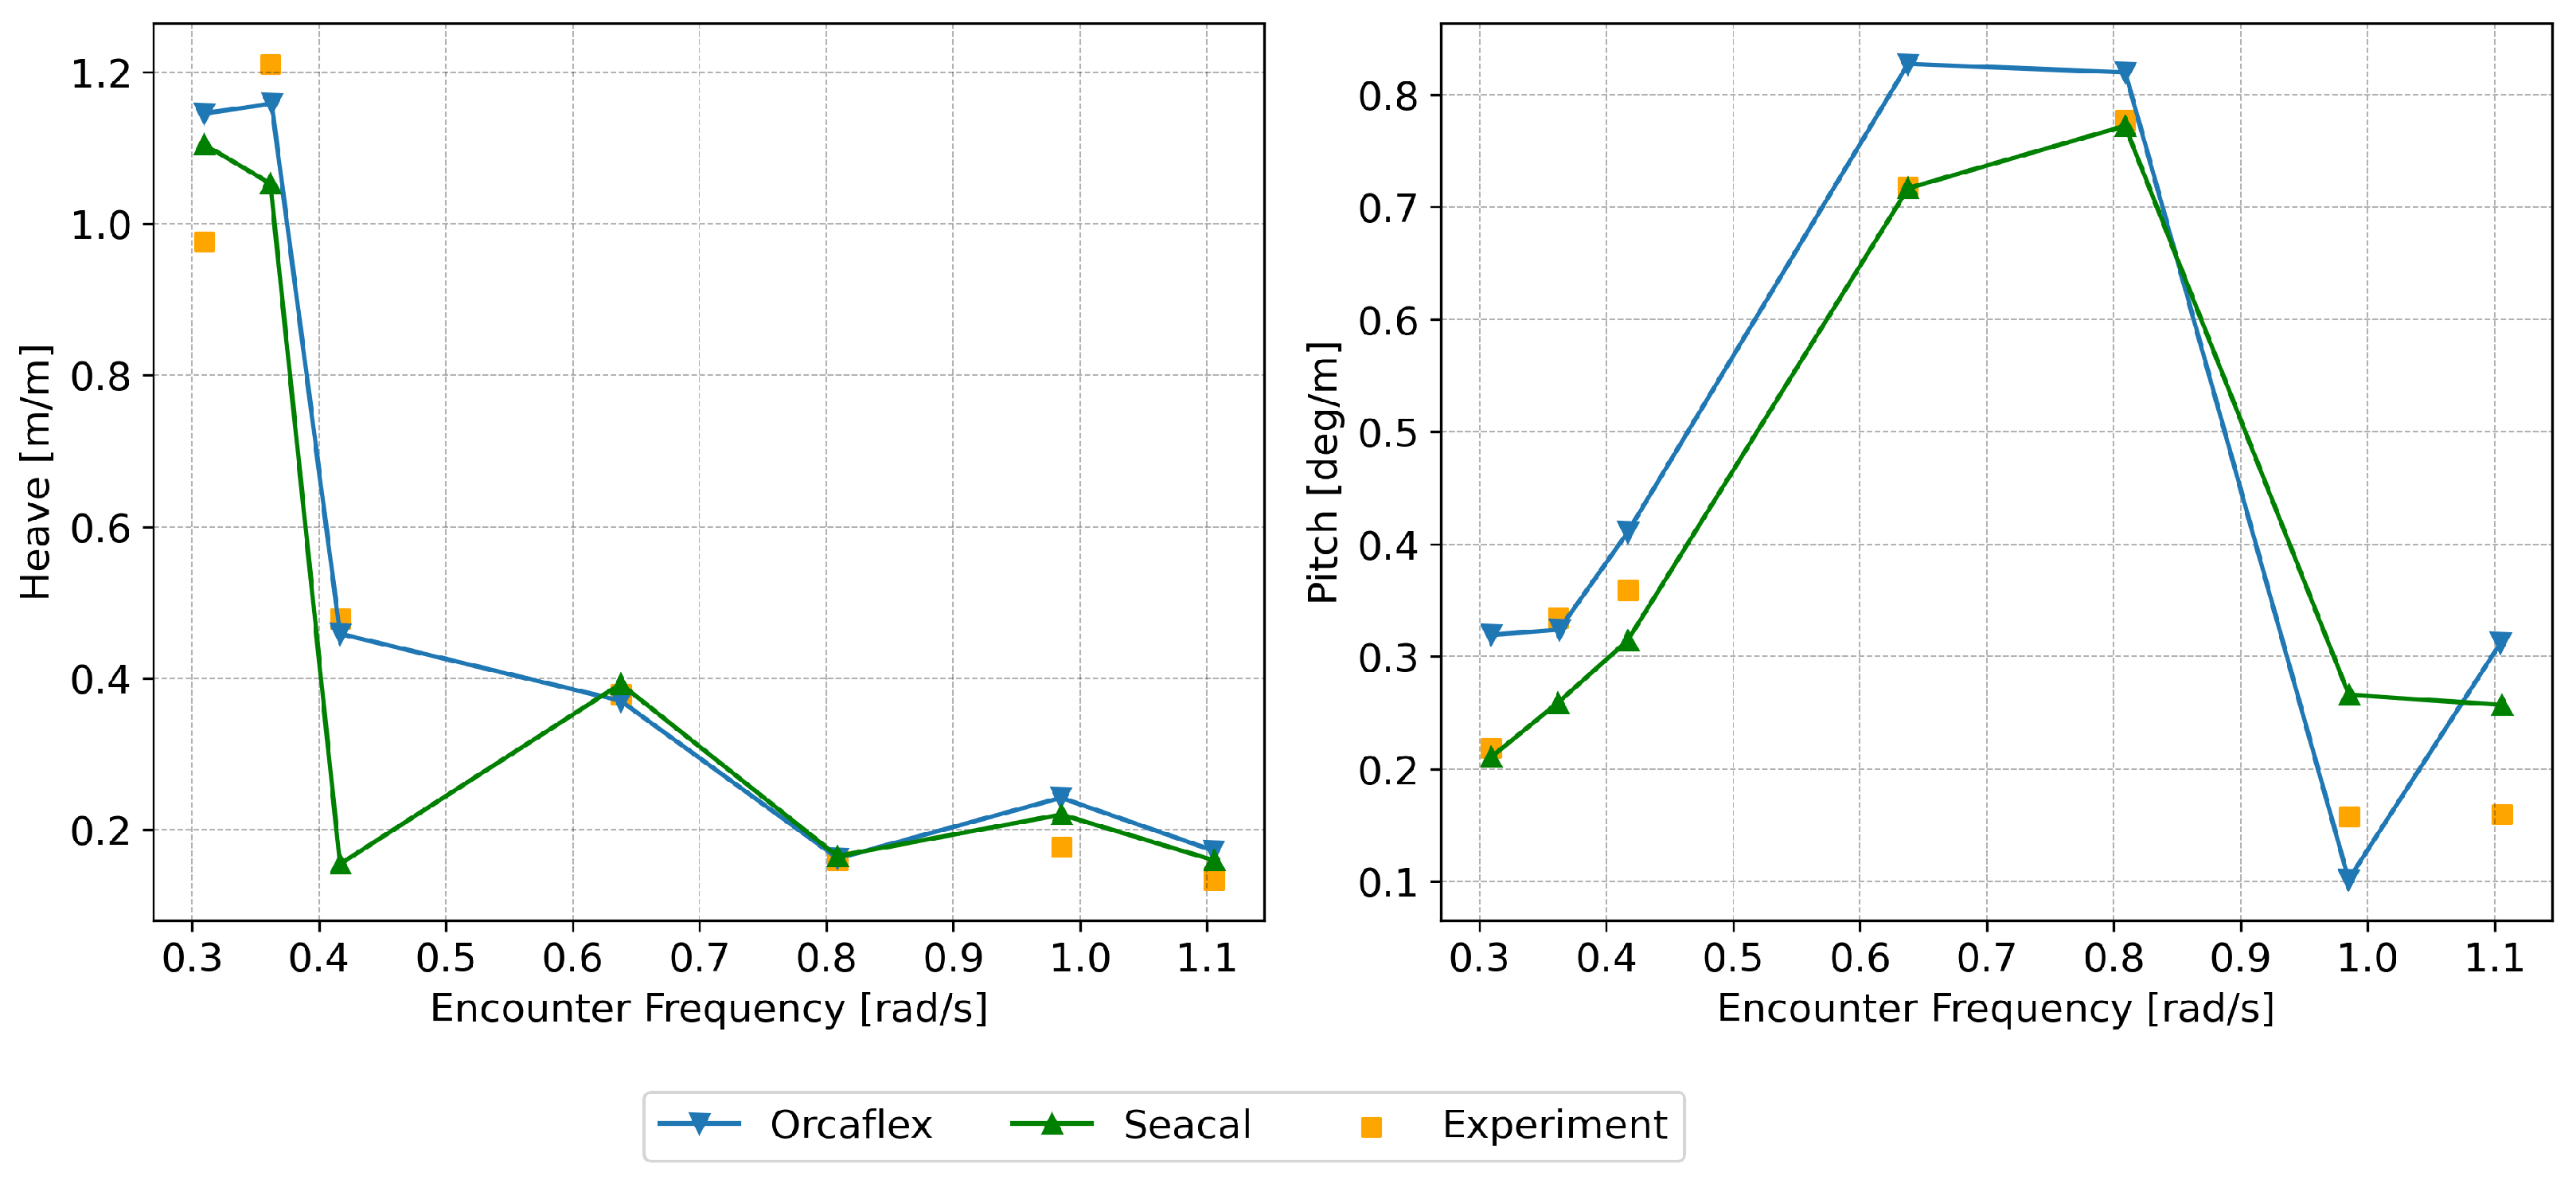
The heave RAOs calculated using the hybrid approach are in good agreement with the experimental results for all significant wave heights (Figure 18, Figure 19, Figure 20 and Figure 21 and Appendix C). In the case of pitch motion, the predictions are in good agreement with the experiments at a low significant wave height of 1 m but show deviation from the experimental results as the significant wave height increases. The deviation occurs at encounter frequencies (0.2–0.4 rad/s) close to the natural frequency of the pitch (0.18 rad/s) for which viscous effects dominate. This shows the presence of highly non-linear damping or other physical phenomena which cannot be predicted using potential-flow-based methods. At higher encounter frequencies (0.4–1.5 rad/s), the simulations are in good agreement with the experimental results. This method enables the modelling of different towing line configurations, encompassing both bridle and non-bridle setups, facilitating an analysis of the tension experienced by the main line, the bridle and the bridle legs. Even though reasonable predictions are possible, this method is very time-consuming and laborious, as it involves simulations of various combinations of different wave frequencies, wave heights and towing speeds in the time domain and their post-processing.
It can be observed that the simple potential-flow-based method with a correction for viscous effects is effective for low-speed (0.514–1.543 m/s) towing simulations. Heave RAOs were observed to be under-predicted at encounter frequencies close to the natural frequency of the heave (0.37 rad/s) in all test conditions. The prediction of the pitch was reasonable only in low speeds (0.514–1.543 m/s) with an error up to 35% for encounter frequencies higher than the natural frequency (0.4–1.5 rad/s) of the pitch (0.18 rad/s) (see Appendix C, Figure A13, Figure A14, Figure A15 and Figure A16). As the towing speed increases, the pitch motion predictions deviate considerably from the experiments (see Figure A17, Figure A18, Figure A19, Figure A20, Figure A21 and Figure A22). This may occur due to the inaccuracy of the damping coefficient values used for the correction or other non-linear phenomena. With accurate calculations of damping coefficients for various speeds and wave heights, better simulations may be feasible, but it is a challenging task. This method is faster, as it involves the direct calculation of frequency-domain RAOs in a single simulation compared to the calculation of RAOs from the time-domain results using the previous method. At higher speeds (2.572 m/s and 3.086 m/s), the Strouhal number threshold is exceeded as the encounter frequency increases, and a deviation from the experimental results is observed. This is expected, and better numerical tools (e.g., the Rankine source method [38]) are required to improve both heave and pitch predictions.

6. Conclusions and Further Work

Accurate predictions of the motion of an FOWT system hinge upon a thorough understanding and estimation of the various non-linearities inherent to the fluid dynamics concerning the platform motion. Among these factors, damping assumes a pivotal role, particularly in forecasting the pitch, roll and heave motion of the platform. The precise determination of damping coefficients is imperative to ensure the accuracy of system motion predictions. A hybrid approach, combining potential flow principles and the Morison equation, offers a reasonably accurate means of estimating platform motion. However, it is important to note that this method may not be fast, as it demands substantial time to simulate time-domain results and derive RAOs from them. When relying solely on potential flow methodologies, accurate damping calculations become crucial. This might be challenging, given the necessity of estimating damping across a range of frequencies and wave amplitudes—a task that can prove difficult to execute. Damping estimation at natural frequencies, as obtained from decay tests, can offer reliable predictions, particularly in scenarios where damping is primarily influenced due to viscous effects.
During the experiments, significant pitch and heave motion was observed, with the heave plates emerging from the water at specific wave frequencies near the natural frequencies of heave and pitch motion. This phenomenon is highly nonlinear, and its impact on the platform’s motion cannot be adequately analysed using potential-flow-based methods. Additionally, phenomena like vortex shedding can influence motion and warrant dedicated research. It was observed that the Reynolds number exceeded a value of 1 × 10⁵ (see Table 2 as the towing speed increased to 0.436 m/s (6 kn) and entered the sub-critical flow regime [39] characterised by the slow transition of laminar vortices into turbulent vortex shedding. Similar phenomena are expected during towing in waves, affecting the platform’s motion and potentially contributing to the observed deviations between the OrcaFlex and SEACAL simulations and the experimental results under high-wave, high-speed and low-frequency conditions. Addressing these phenomena requires dedicated research using high-fidelity methods such as Computational Fluid Dynamics (CFD) or Smooth Particle Hydrodynamics (SPH). Investigations by Rongé et al. [40] have demonstrated that CFD methods can provide better predictions of second-order and third-order wave loads compared to strip-theory methods and potential-flow methods. This could potentially enhance predictions of Response Amplitude Operators (RAOs) and towing loads, warranting further investigation. SEACAL can also use the Rankine source method to analyse higher towing speeds and improve the results ( τ > 0.25). This approach necessitates discretizing both the hull and the water surface to accurately calculate the waves generated from the floating body. However, it is computationally demanding and requires further optimisation to be applicable to the analysis of semi-submersible platforms.
In the presented study, the focus was solely on headseas. The emphasis was placed on heave and pitch motion, as well as the corresponding assessment of damping coefficients, which are of primary importance. However, in different heading conditions, roll motion can also become significant, necessitating the estimation of roll damping for precise motion predictions. It is safe to assume that roll predictions could also be possible using the approaches mentioned in the paper. The accuracy of these motion predictions is paramount due to the established motion limits during towing stipulated by classification societies. The estimation of viscous damping is crucial during numerical simulations because, in its absence, motion limits are surpassed even in calmer sea conditions, subsequently shrinking the available weather windows for towing operations.
Another important factor is the drag on the platform that influences the selection of tugs and towing lines for towing operations. In certain wave conditions, the added resistance in waves increases dramatically, hence the bollard pull requirement for towing. The mean added resistance in waves should be estimated before commencing towing operations. This also plays a role in the selection of towing ropes/cables. Towing using a bridle is advantageous over towing without a bridle, as it reduces the chances of fluid-induced motion.
The further assessment of non-linear effects such as VIM/fishtailing, galloping and pitch-induced wave run-up are some of the non-linear phenomena expected while towing, and some of them were observed during the towing tests. These phenomena will lead to downtime and should be avoided either via a better understanding or via mitigation. It requires dedicated research to understand their effects on the towing system and develop numerical models so that precautions can be taken to avoid them. The effects of wind and current on the parked turbine during transit should also be studied to understand and predict the motion and loads on the FOWT system. It is important to analyse the towing route using statistical approaches to perform voyage simulations in order to determine the operability (uptime/downtime) during wet towing.

Author Contributions

The experiments were conducted by R.C.R. under the supervision of J.-J.S. and E.-J.D.R. J.H.M. advised and assisted in the SEACAL calculations. The paper was written by R.C.R. and edited and modified by J.-J.S. C.D. reviewed and edited the paper. E.-J.D.R. and J.M. reviewed the final manuscript. All authors have read and agreed to the published version of the manuscript.

Funding

This project has received funding from the European Union’s Horizon 2020 Industrial Doctorate Programme STEP4WIND, under Marie Skłodowska-Curie grant agreement No. 860737.

Data Availability Statement

The original contributions presented in the study are included in the article and appendices, further inquiries can be directed to the corresponding authors.

Conflicts of Interest

The authors declare no conflicts of interest.

Appendix A. Numerical Validation Tools and Setup

Appendix A.1. OrcaFlex

OrcaFlex (version 11.0) [32] is a software tool designed for the analysis and simulation of offshore systems, particularly those involving flexible structures and marine operations. Developed by Orcina Ltd. (Ulverston, UK).
OrcaFlex offers a comprehensive platform for the modelling and simulation of dynamic behaviour in various marine environments. Its applications extend to the analysis of floating structures, such as offshore wind turbines, floating production systems and moored vessels. OrcaFlex can simulate the complex interactions between structures, environmental forces (waves and currents) and dynamic components like cables and risers.
Towing simulations were performed in OrcaFlex using its capability to model the platform along with the towing cable and bridle. A 3D model of the platform was developed in the Rhinoceros [41] modelling software first. This model was then exported as a .gdf file and provided as an input for Orcawave [33], the diffraction analysis tool provided by Orcina. A diffraction analysis was performed, and the results were exported into OrcaFlex to set up the towing simulations. The Morison elements were incorporated into the model first. Subsequently, the towing lines were modelled as ’links’ [42], and the bridle was modelled as a ’3D-buoy’ [43]. As mentioned before, towing was simulated by constraining the platform using the towing lines and applying a current equal to the speed of towing. A Python script was developed to create a batch file that contains the simulation conditions combining various wave frequencies, wave heights and current speeds. Using this file, batch simulations were executed in series using OrcaFlex. The results were then post-processed using the Python interface of OrcaFlex, and the motion and towing loads were generated. Mesh convergence checks were performed, and the simulations were performed on a normal desktop. See Table A1 for mesh details and simulation conditions.
Table A1. Numerical simulation setup.
Numerical ToolNumber of ElementsRange of Frequencies (Steps)
OrcaFlex30720.1 (0.01) 0.35
0.355 (0.005) 0.545
0.55 (0.05) 1.5
SEACAL10,0200.1 (0.005) 0.22
0.23 (0.01) 0.4
0.45 (0.05) 1
1.1 (0.1) 1.5

Appendix A.2. SEACAL

SEACAL (version 7.2.0) is an in-house potential 3D panel code developed at MARIN for the calculation of ship behaviour in waves. It can be used to calculate the response to waves for various vessels at arbitrary speeds and headings. SEACAL consists of three main programs:
  • HYDMES divides the hull into a number of quadrilateral panels, up to the undisturbed free-surface. Hydrostatic calculations are performed, and the flexural modes are determined.
  • HYDCAL solves the linearised boundary value problem and uses a simplified, zero-speed, free-surface condition. The forward speed is included by means of the wave encounter frequency according to the following equation:
    ω e 2 ϕ + g ϕ z = 0
  • RESCAL computes the dynamic response of the vessel. Since viscous damping may be of importance in determining the magnitude of the resonant response, empirical formulas based on experimental results are used in addition to those determined from linearised potential flow theory. After the equations of motion are solved, internal loads and RAOs are calculated.
The 3D geometry of the platform was modelled in Rhinoceros [41] and exported into SEACAL as a .vtk file. Only the underwater surface was modelled for the calculations. Lid meshes were used to close the open surfaces at the waterplane to suppress the irregular frequencies during the simulations. The simulations were performed on an HPC (High-Performance Cluster).
As mentioned before, an accurate determination of the second-order drift loads is required for the precise calculations of motion and wave loads on large marine structures. A mesh convergence study based on the heave and pitch mean second-order drift loads is presented here. The zero-speed cases used in SEACAL and Orcawave were analysed to find the optimum mesh count. A cross-comparison of the drift load calculated in SEACAL and Orcawave was also performed. For Orcawave, since both medium and fine meshes yielded comparable results, the medium mesh (N = 3072) was chosen because the Orcaflex simulations were faster compared to simulations using the fine mesh, which often made the computer freeze and took too long. SEACAL simulations can be performed on an HPC; hence, a high mesh count (N = 10,020) was chosen. See Table A1 for the final mesh details and simulation conditions.
Figure A1. SEACAL mesh convergence—mean heave drift loads.
Jmse 12 00689 g0a1
Figure A2. SEACAL mesh convergence—mean pitch drift loads.
Jmse 12 00689 g0a2
Figure A3. Orcawave mesh convergence—mean heave drift loads.
Jmse 12 00689 g0a3
Figure A4. Orcawave mesh convergence—mean pitch drift loads.
Jmse 12 00689 g0a4
Figure A5. Mean heave drift loads—Orcawave vs. SEACAL.
Jmse 12 00689 g0a5
Figure A6. Mean pitch drift loads—Orcawave vs. SEACAL.
Jmse 12 00689 g0a6

Appendix B. Validation of Decay Tests and Examples of Motion in Regular Waves Using the Hybrid Approach (Orcaflex)

Figure A7. Heave decay.
Jmse 12 00689 g0a7
Figure A8. Roll decay.
Jmse 12 00689 g0a8
Figure A9. Pitch decay.
Jmse 12 00689 g0a9
Figure A10. Configuration 1: speed = 1.029 m/s, H = 4 m, period = 8.38 s.
Jmse 12 00689 g0a10
Figure A11. Configuration 1: speed = 2.058 m/s, H = 4 m, period = 8.38 s.
Jmse 12 00689 g0a11
Figure A12. Configuration 1: speed = 1.029 m/s, H = 4 m, period = 15.71 s.
Jmse 12 00689 g0a12

Appendix C. Validation of RAOs Calculated from White-Noise Waves Using SEACAL and OrcaFlex

Figure A13. RAOs: towing speed = 1.543 m/s, Hs = 1 m.
Jmse 12 00689 g0a13
Figure A14. RAOs: towing speed = 1.543 m/s, Hs = 2 m.
Jmse 12 00689 g0a14
Figure A15. RAOs: towing speed = 1.543 m/s, Hs = 4 m.
Jmse 12 00689 g0a15
Figure A16. RAOs: towing speed = 1.543 m/s, Hs = 6 m.
Jmse 12 00689 g0a16
Figure A17. RAOs: towing speed = 2.572 m/s, Hs = 1 m.
Jmse 12 00689 g0a17
Figure A18. RAOs: towing speed = 2.572 m/s, Hs = 2 m.
Jmse 12 00689 g0a18
Figure A19. RAOs: towing speed = 2.572 m/s, Hs = 4 m.
Jmse 12 00689 g0a19
Figure A20. RAOs: towing speed = 3.086 m/s, Hs = 1 m.
Jmse 12 00689 g0a20
Figure A21. RAOs: towing speed = 3.086 m/s, Hs = 2 m.
Jmse 12 00689 g0a21
Figure A22. RAOs: towing speed = 3.086 m/s, Hs = 4 m.
Jmse 12 00689 g0a22

References

  1. Cioni, S.; Papi, F.; Pagamonci, L.; Bianchini, A.; Ramos-García, N.; Pirrung, G.; Corniglion, R.; Lovera, A.; Galván, J.; Boisard, R.; et al. On the characteristics of the wake of a wind turbine undergoing large motions caused by a floating structure: An insight based on experiments and multi-fidelity simulations from the OC6 project Phase III. Wind Energy Sci. 2023, 7, 1–37. [Google Scholar] [CrossRef]
  2. Ramachandran, R.C.; Desmond, C.; Judge, F.; Serraris, J.J.; Murphy, J. Floating wind turbines: Marine operations challenges and opportunities. Wind Energy Sci. 2022, 7, 903–924. [Google Scholar] [CrossRef]
  3. Ramachandran, R.C.; Otter, A.; Desmond, C.; Judge, F.; Serraris, J.J.; Murphy, J. A study of the towing characteristics of a semi-submersible floating offshore wind platform. J. Phys. Conf. Ser. 2023, 2626, 012043. [Google Scholar] [CrossRef]
  4. World’s Largest Floating Offshore Wind Farm under Tow. 2022. Available online: https://ocean-energyresources.com/2022/04/19/worlds-largest-floating-offshore-wind-farm-under-tow/ (accessed on 29 November 2023).
  5. Avanessova, N.; Land, J.; Lee, A.; Lazakis, I.; Thomson, C. Comparison of Operation and Maintenance of Floating 14 MW Turbines and Twin 10 MW Turbines. ASME Open J. Eng. 2023, 2, 021031. [Google Scholar] [CrossRef]
  6. Lessons Learned from Heavy Maintenance at the World’s First Commercial Floating Wind Farm. 2023. Available online: https://www.spinergie.com/blog/lessons-learned-from-heavy-maintenance-at-the-worlds-first-commercial-floating-wind-farm (accessed on 26 January 2024).
  7. DNV-RP-H103; Modelling and Analysis of Marine Operations, Recommended Practice. Det Norske Veritas: Oslo, Norway, 2011.
  8. International Maritime Organisation. MSC/Circular.884–Guidelines for Safe Ocean Towing; International Maritime Organisation: London, UK, 1998. [Google Scholar]
  9. Collu, M.; Maggi, A.; Gualeni, P.; Rizzo, C.M.; Brennan, F. Stability requirements for floating offshore wind turbine (FOWT) during assembly and temporary phases: Overview and application. Ocean Eng. 2014, 84, 164–175. [Google Scholar] [CrossRef]
  10. Ding, H.; Han, Y.; Le, C.; Zhang, P. Dynamic analysis of a floating wind turbine in wet tows based on multi-body dynamics. J. Renew. Sustain. Energy 2017, 9, 033301. [Google Scholar] [CrossRef]
  11. Büttner, T.; Pérez-Collazo, C.; Abanades, J.; Hann, M.; Harper, P.; Greaves, D.; Stiesdal, H. OrthoSpar, a novel substructure concept for floating offshore wind turbines: Physical model tests under towing conditions. Ocean Eng. 2022, 245, 110508. [Google Scholar] [CrossRef]
  12. Mas-Soler, J.; Uzunoglu, E.; Bulian, G.; Soares, C.G.; Souto-Iglesias, A. An experimental study on transporting a free-float capable tension leg platform for a 10 MW wind turbine in waves. Renew. Energ. 2021, 179, 2158–2173. [Google Scholar] [CrossRef]
  13. Le, C.; Ren, J.; Wang, K.; Zhang, P.; Ding, H. Towing Performance of the Submerged Floating Offshore Wind Turbine under Different Wave Conditions. J. Mar. Sci. Eng. 2021, 9, 633. [Google Scholar] [CrossRef]
  14. Hyland, T.; Adam, F.; Dahlias, F.; Großmann, J. Towing tests with the GICON®-TLP for wind turbines. In Proceedings of the ISOPE International Ocean and Polar Engineering Conference, Busan, Republic of Korea, 15–20 June 2014. [Google Scholar]
  15. Nossen, J.; Grue, J.; Palm, E. Wave forces on three-dimensional floating bodies with small forward speed. J. Fluid Mech. 1991, 227, 135–160. [Google Scholar] [CrossRef]
  16. Grue, J.; Palm, E. The mean drift force and yaw moment on marine structures in waves and current. J. Fluid Mech. 1993, 250, 121–142. [Google Scholar] [CrossRef]
  17. Grue, J.; Biberg, D. Wave forces on marine structures with small speed in water of restricted depth. Appl. Ocean Res. 1993, 15, 121–135. [Google Scholar] [CrossRef]
  18. Emmerhoff, O.J.; Sclavounos, P.D. The slow-drift motion of arrays of vertical cylinders. J. Fluid Mech. 1992, 242, 31–50. [Google Scholar] [CrossRef]
  19. Kinoshita, T.; Bao, W. Hydrodynamic forces acting on a circular cylinder oscillating in waves and a small current. J. Mar. Sci. Technol. 1996, 1, 155–173. [Google Scholar] [CrossRef]
  20. Robertson, A.; Jonkman, J.; Masciola, M.; Song, H.; Goupee, A.; Coulling, A.; Luan, C. Definition of the Semisubmersible Floating System for Phase II of OC4; National Renewable Energy Lab. (NREL): Golden, CO, USA, 2014.
  21. BEMRosetta. Available online: https://github.com/BEMRosetta/BEMRosetta (accessed on 24 January 2024).
  22. Zabala, I.; Pena-Sanchez, Y.; Kelly, T.; Henriques, J.; Penalba, M.; Faedo, N.; Ringwood, J.; Blanco, J. BEMRosetta: An open-source hydrodynamic coefficients converter and viewer integrated with Nemoh and FOAMM. In Proceedings of the 14th European Wave and Tidal Energy Conference, Plymouth, UK, 5–9 September 2021. [Google Scholar]
  23. International Maritime Organisation. General Intact Stability Criteria for All Ships. Available online: https://imorules.com/GUID-E451298C-6D7E-4FBD-8E47-0B07FCC6F784.html (accessed on 29 January 2024).
  24. Modu Code, 2009-Code for the Construction and Equipment of Mobile Offshore Drilling Units, 2009 (2009 MODU CODE) (Resolution A.1023(26)); International Maritime Organization: London, UK, 2009.
  25. Crowle, A.P.; Thies, P.R. Tow Out Calculations for Floating Wind Turbines. In Proceedings of the International Conference on Offshore Mechanics and Arctic Engineering, Hamburg, Germany, 5–10 June 2022; p. V008T09A013. [Google Scholar] [CrossRef]
  26. Journee, J.M.J.; Massie, W.W. Offshore Hydromechanics; Delft University of Technology: Delft, The Netherlands, 2001. [Google Scholar]
  27. Gonçalves, R.T.; Chame, M.E.F.; Silva, L.S.P.; Koop, A.; Hirabayashi, S.; Suzuki, H. Experimental Study on Flow-Induced Motions (FIM) of a Floating Offshore Wind Turbine Semi-Submersible Type (OC4 Phase II Floater). In Proceedings of the International Offshore Wind Technical Conference, St. Julian’s, Malta, 3–6 November 2019; p. V001T01A017. [Google Scholar] [CrossRef]
  28. Jiang, F.; Yin, D.; Califano, A.; Berthelsen, P.A. Application of CFD on VIM of semi-submersible FOWT: A Case Study. J. Phys. Conf. Ser. 2023, 2626, 012041. [Google Scholar] [CrossRef]
  29. ISO 2307:2010; Fibre Ropes—Determination of Certain Physical and Mechanical Properties. ISO-International Organization for Standardization: Geneva, Switzerland, 2010.
  30. Koop, A.; Rijken, O.; Vaz, G.; Maximiano, A.; Rosetti, G. CFD Investigation on Scale and Damping Effects for Vortex Induced Motions of a Semi-Submersible Floater. In Proceedings of the Offshore Technology Conference, Houston, TX, USA, 2–5 May 2016. [Google Scholar] [CrossRef]
  31. Ruponen, P.; van Basten Batenburg, R.; van’t Veer, R.; Braidotti, L.; Bu, S.; Dankowski, H.; Lee, G.J.; Mauro, F.; Ruth, E.; Tompuri, M. International benchmark study on numerical simulation of flooding and motions of a damaged cruise ship. Appl. Ocean Res. 2022, 129, 103403. [Google Scholar] [CrossRef]
  32. OrcaFlex Documentation. Available online: https://www.orcina.com/resources/documentation/ (accessed on 7 November 2023).
  33. Orcawave Documentation. Available online: https://www.orcina.com/webhelp/OrcaWave/Default.htm (accessed on 7 November 2023).
  34. OrcaFlex Examples. Available online: https://www.orcina.com/resources/examples/?key=l (accessed on 5 November 2023).
  35. Faltinsen, O.M. Numerical methods for linear wave-induced motions and loads. In Sea Loads on Ships and Offshore Structures; Cambridge University Press: Cambridge, UK, 1990; pp. 122–127. [Google Scholar]
  36. Elobeid, M.; Pillai, A.C.; Tao, L.; Ingram, D.; Hanssen, J.E.; Mayorga, P. Implications of wave–current interaction on the dynamic responses of a floating offshore wind turbine. Ocean Eng. 2024, 292, 116571. [Google Scholar] [CrossRef]
  37. Arribas, F.P. Some methods to obtain the added resistance of a ship advancing in waves. Ocean Eng. 2007, 34, 946–955. [Google Scholar] [CrossRef]
  38. Bertram, V. A Rankine Source Method for the Forward-Speed Diffraction Problem; Technische Universität Hamburg: Bericht, Germany, 1990. [Google Scholar]
  39. Stringer, R.M.; Zang, J.; Hillis, A.J. Unsteady RANS computations of flow around a circular cylinder for a wide range of Reynolds numbers. Ocean Eng. 2014, 87, 1–9. [Google Scholar] [CrossRef]
  40. Rongé, É.; Peyrard, C.; Venugopal, V.; Xiao, Q.; Johanning, L.; Benoit, M. Evaluation of second and third-order numerical wave-loading models for floating offshore wind TLPs. Ocean Eng. 2023, 288, 116064. [Google Scholar] [CrossRef]
  41. Rhinoceros. Available online: https://www.rhino3d.com/ (accessed on 28 January 2024).
  42. OrcaFlex ‘Links’. Available online: https://www.orcina.com/webhelp/OrcaFlex/Content/html/Links.htm (accessed on 28 January 2024).
  43. OrcaFlex ‘3D buoys’. Available online: https://www.orcina.com/webhelp/OrcaFlex/Content/html/3Dbuoys.htm (accessed on 28 January 2024).
Figure 1. Platform geometry.
Jmse 12 00689 g001
Figure 2. Righting lever (GZ) curve for various platform draughts.
Jmse 12 00689 g002
Figure 3. Concept Basin.
Jmse 12 00689 g003
Figure 4. Platform model.
Jmse 12 00689 g004
Figure 5. Towing test setup.
Jmse 12 00689 g005
Figure 6. Towing test configuration 1.
Jmse 12 00689 g006
Figure 7. Towing test configuration 2.
Jmse 12 00689 g007
Figure 8. Platform motion during towing.
Jmse 12 00689 g008
Figure 9. Nominal A/D values for both configurations.
Jmse 12 00689 g009
Figure 10. Variation in towing force.
Jmse 12 00689 g010
Figure 11. Towing forces (left) and added resistance in waves (right), Towing speed = 1.029 m/s, experiment vs. simulation.
Jmse 12 00689 g011
Figure 12. Towing forces (left) and added resistance in waves (right), Towing speed = 2.058 m/s, experiment vs. simulation.
Jmse 12 00689 g012
Figure 13. Towing forces (left) and added resistance in waves (right), Towing speed = 2.572 m/s, experiment vs. simulation.
Jmse 12 00689 g013
Figure 14. Towing setup in OrcaFlex.
Jmse 12 00689 g014
Figure 15. RAOs: Towing speed = 1.029 m/s, experiment vs. simulation.
Jmse 12 00689 g015
Figure 16. RAOs: Towing speed = 2.058 m/s, experiment vs. simulation.
Jmse 12 00689 g016
Figure 17. RAOs: Towing speed = 2.572 m/s, experiment vs. simulation.
Jmse 12 00689 g017
Figure 18. RAOs: towing speed = 0.514 m/s, Hs = 1 m.
Jmse 12 00689 g018
Figure 19. RAOs: towing speed = 0.514 m/s, Hs = 2 m.
Jmse 12 00689 g019
Figure 20. RAOs: towing speed = 0.514 m/s, Hs = 4 m.
Jmse 12 00689 g020
Figure 21. RAOs: towing speed = 0.514 m/s, Hs = 6 m.
Jmse 12 00689 g021
Table 1. Comparison of platform and model properties.
PropertyUnitTargetRealised
Mass[ton]10,357.110,410.3
L[m]67.367.3
LCG[m]−0.009−0.01
TCG[m]0.0170.02
VCG[m]12.15912.09
Kxx about COG[m]33.85430.54
Kyy about COG[m]34.07331.01
Kzz about COG[m]36.32631.13
Ixx about COG[tm2]1.19 × 1079.71 × 106
Iyy about COG[tm2]1.20 × 1071.00 × 107
Izz about COG[tm2]1.37 × 1071.01 × 107
Table 2. Towing speeds and corresponding Froude and Reynolds numbers of the model (model-scale).
Speed (m/s)Speed (m/s) (Full-Scale)Froude NumberReynolds Number
0.0730.5140.0471.75 × 104
0.1451.0290.0953.49 × 104
0.2181.5430.1425.24 × 104
0.2912.0580.1906.98 × 104
0.3642.5720.2378.73 × 104
0.4363.0860.2841.05 × 105
Table 3. Towing line properties.
PropertyValue
Length900 m
Modulus of elasticity9.16 × 1010 Pa
Rope diameter0.09 m
Stiffness647.5 KN/m
Table 4. Test cases—regular waves.
ConfigurationSpeed (m/s)Wave Height (m)Wave Period (s)Case
Configuration 11.02916.281
26.982
48.38, 10.47, 15.71, 18, 20.943–7
2.05816.288
26.989
48.38, 10.47, 15.71, 18, 20.9410–14
2.57216.2815
26.9816
48.38, 10.47, 15.71, 18, 20.9417–21
Configuration 21.02916.2822
26.9823
48.38, 10.47, 15.71, 18, 20.9424–28
2.05816.2829
26.9830
48.38, 10.47, 15.71, 18, 20.9431–35
Table 5. Test cases—irregular waves.
ConfigurationSpeed (m/s)Wave Height (m)Wave Period (s)
Configuration 10.51415–25
25–25
45–25
65–25
1.54315–25
25–25
45–25
65–25
2.57215–25
25–25
45–25
3.08615–25
25–25
45–25
Configuration 20.51415–25
25–25
1.54315–25
25–25
2.57215–25
25–25
Table 6. Towing force (N) and bollard pull (tons) (in brackets).
Speed (m/s)Minimum (N)Maximum (N)Mean (N)
0.5147.56 × 104 (8)8.85 × 10⁴ (9)8.17 × 10⁴ (8)
1.0292.67 × 105 (27)3.14 × 10⁵ (32)2.90 × 10⁵ (30)
1.5435.75 × 105 (59)6.93 × 10⁵ (71)6.37 × 10⁵ (65)
2.0581.02 × 106 (104)1.35 × 10⁶ (138)1.18 × 10⁶ (120)
2.5721.73 × 106 (176)2.23 × 10⁶ (228)1.93 × 10⁶ (197)
3.0862.63 × 106 (268)3.29 × 10⁶ (336)2.93 × 10⁶ (299)
Table 7. Morison element details.
MemberDiameter (m)Drag Coefficients (Cd)
XYZ
Upper columns120.6100
Lower column240.6804.8
Central column6.50.5600
Braces and pontoons1.60.6300
Table 8. Damping coefficients calculated from decay test.
Total Damping at 0 m, degTotal Damping at 20 m, deg
Heave0.3 kNs/m3.24 × 107 kNs/m
Roll3.55 × 104 kNs/rad8.80 × 106 kNs/rad
Pitch3.03 × 104 kNs/rad7.61 × 106 kNs/rad
Table 9. Natural periods.
ExperimentOrcaFlexSEACAL
Heave17.11 s17.13 s19.04 s
Roll34.53 s32.86 s33.07 s
Pitch35.08 s34.81 s33.14 s
Disclaimer/Publisher’s Note: The statements, opinions and data contained in all publications are solely those of the individual author(s) and contributor(s) and not of MDPI and/or the editor(s). MDPI and/or the editor(s) disclaim responsibility for any injury to people or property resulting from any ideas, methods, instructions or products referred to in the content.

