
State of the Art on Fe Precipitation in Porous Media: Hydrogeochemical Processes and Evolving Parameters


1
School of Civil Engineering, University of Queensland, St. Lucia, QLD 4072, Australia
2
School of the Environment, University of Queensland, St. Lucia, QLD 4072, Australia
3
Environment, Commonwealth Scientific and Industrial Research Organisation (CSIRO), Dutton Park, QLD 4102, Australia
*
Authors to whom correspondence should be addressed.
J. Mar. Sci. Eng. 2024, 12(4), 690; https://doi.org/10.3390/jmse12040690
Submission received: 2 April 2024
/
Revised: 14 April 2024
/
Accepted: 17 April 2024
/
Published: 22 April 2024
(This article belongs to the Special Issue Coastal Environments: Recent Advances in Conservation and Sustainable Development)
Abstract
:The mixing of terrestrial groundwater and seawater creates dynamic reaction zones in intertidal areas, where land-derived Fe(II) is oxidized to Fe(III) and then precipitates as Fe hydroxides at the groundwater–seawater interface. These hydrogeochemical processes contribute to the formation of iron bands at the saltwater wedge (SW) and beneath the upper saline plume (USP). This study provides a comprehensive review of physical and geochemical processes at field scale in coastal areas, explores the impact of mineral precipitation on pore structure at pore scale, and synthesizes reactive transport modeling (RTM) approaches for illustrating continuum-scale soil physio-chemical parameters during the evolution of porous media. Upon this review, knowledge gaps and research needs are identified. Additionally, challenges and opportunities are presented. Therefore, we reach the conclusion that the incorporation of observational data into a comprehensive physico-mathematical model becomes imperative for capturing the pore-scale processes in porous media and their influence on groundwater flow and solute transport at large scales. Additionally, a synergistic approach, integrating pore-scale modeling and non-invasive imaging, is equally essential for providing detailed insights into intricate fluid–pore–solid interactions for future studies, as well as facilitating the development of regional engineering-scale models and physio-chemical coupled models with diverse applications in marine science and engineering.
1. Introduction
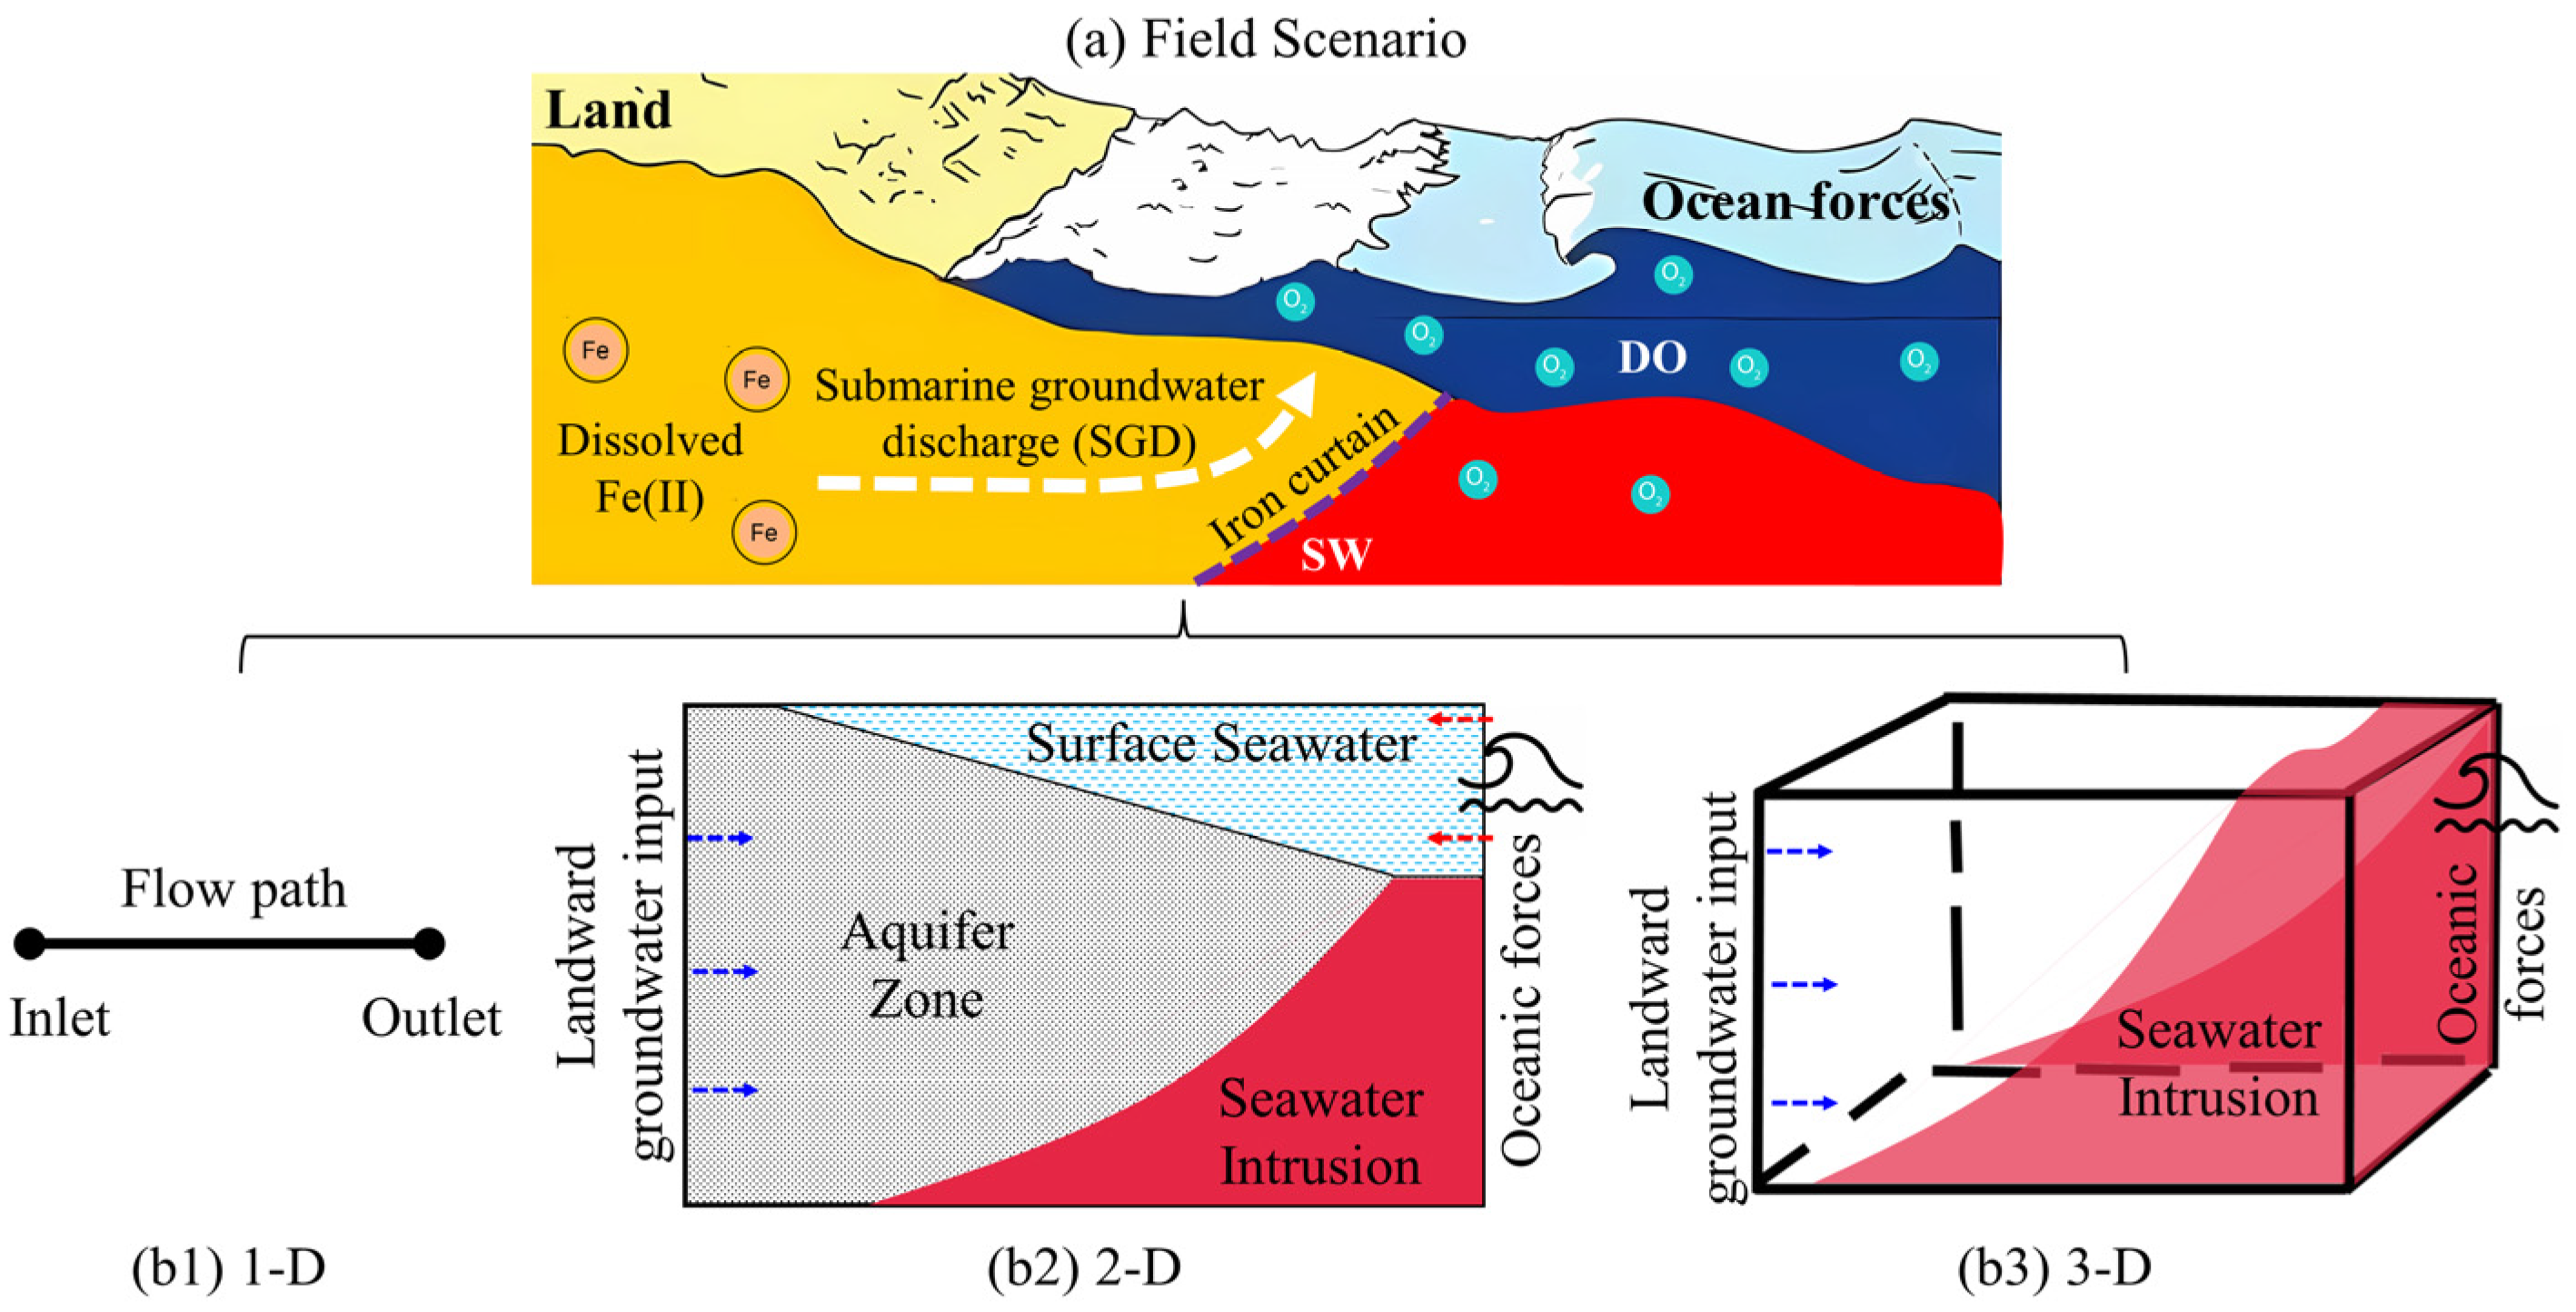
Iron (Fe) is fourth in abundance among the elements in the Earth’s crust [1], and Australia has the largest reserves of Fe ore in the world [2]. Consequently, Fe-containing minerals, such as hematite, magnetite, and goethite, are omnipresent in sedimentary rocks, weathering rinds, mine drainage, and oceanic sands [3]. Fe ions can easily find their way into local groundwater systems either naturally (e.g., by dissolution of Fe-bearing minerals) or via human activities (e.g., industrial effluent and landfill leachate) [4]. In water, Fe is typically present as divalent Fe(II) (i.e., Fe2+ ions) and trivalent Fe(III) (i.e., Fe3+ ions) [5]. As illustrated in Figure 1, when the water also contains dissolved oxygen (DO), Fe(II) is swiftly oxidized to Fe(III) with consecutive precipitation, as iron oxides in aquifers. The precipitation of mineral phases can significantly affect the hydraulic characteristics of the porous media [6]; for example, by changing seepage parameters, including porosity, permeability, or tortuosity. These changes subsequently influence solute transport and chemical reactions within the pore matrix. Therefore, determining the evolution of these parameters and their dependencies is crucial for various environmental, agricultural, and industrial applications [7,8,9,10].
With a focus on coastal aquifers, the mixing of submarine groundwater and seawater creates two dynamic zones [11]: saltwater wedge (SW) and upper saline plume (USP) (see Figure 2). A confined groundwater discharge tube (GDT) between these zones intersects the beach near the low tide (LT) mark. Around this GDT, there is a geochemical transition from a reduced to an oxygenated condition, which produces an oxidizing environment for dissolved Fe(II) and leads to the oxidative precipitation of Fe(II) at the groundwater–seawater interface. Such zones with Fe precipitates were observed in the intertidal area of Waquoit Bay, Massachusetts, USA [12], and additional research revealed that the accumulation of these precipitates can act as a geochemical barrier to retain dissolved chemicals transported from inland to the ocean [13,14,15,16,17]. Thenceforth, the term “iron curtain” was proposed and has since gained widespread use to describe these environmental functionalities in coastal groundwater systems. While numerous studies have focused on the response of groundwater to physical processes, such as inland hydraulic gradient [18,19], sea level rise [20,21], and waves and tides [22,23,24,25], there has been limited attention directed toward geochemical processes associated with redox-sensitive Fe and iron-curtain-like features. Despite significant research efforts providing valuable insights into Fe speciation, phosphate (PO43−) removal, and sulfate (SO42−) reduction in intertidal areas [11,17,21,26,27,28,29,30], our understanding of hydrogeochemical processes and spatiotemporal variations of the “iron curtain” remains incomplete. Additionally, the scarcity of field and experimental datasets has left many challenges to the representativeness of numerical model results. These result in a restricted comprehension of how an “iron curtain” forms and its influence on subsurface flow.
In subsurface groundwater–seawater mixing zones, such hydrogeochemical processes, i.e., the reactive transport and oxidative precipitation of Fe(II), are significantly influenced by groundwater flow, solute transport, and geochemical reactions. Several parameters can dynamically respond to these processes, particularly porosity (n), permeability (k), tortuosity (τ), and specific surface area (S). Figure 3 illustrates the interactive mechanisms between the flow, transport, and reaction domains. Notably, permeability is a vital seepage property governing the reactive flow transmission through porous media [32,33]. During the oxidative precipitation of Fe(II) within the pore matrix, the precipitated solid phase occupies interstitial spaces between particles, leading to a decrease in porosity, a subsequent reduction in permeability, and a corresponding increase in tortuosity at Darcy scale [34]. Moreover, Fe precipitates can reshape the surface of solid particles at pore scale, which provides a direct response to the reaction rates and progress [35,36]. These changes thereby slow down groundwater flow and solute transport through the subsurface [37]. Through this analysis, it becomes evident that hydrogeochemical processes have the potential to induce multiple interactive mechanisms in reactive flow and transport. However, in most studies, some parameters (e.g., τ and S) have often been treated as constant over time because hydrogeochemical reactions typically occur at pore scale, and Fe precipitation can modify the pore structure in multiple ways, such as by narrowing existing flow channels and reducing the size of pore throats. Due to the inherent complexity and heterogeneity of pore structure, it remains difficult to couple all these effects in a precipitation-dominated regime, thereby making it challenging to achieve a representative evolution of the continuum-scale properties of porous media when the pore matrix evolves—for example, determining how permeability varies at any given instant [38,39]. To predict the variations of these parameters at continuum scale, it is essential to gain a more profound understanding of how hydrogeochemical processes control the evolution of the porous matrix at pore scale.
2. Hydrogeochemical Processes in Coastal Aquifers
The existing literature on hydrogeochemical processes in coastal aquifers was analyzed and categorized based on the applied methodology. These methodologies include (1) field investigations that study the porewater and sediment chemistry influenced by oceanic forces; (2) laboratory experiments that investigate the oxidative precipitation of Fe(II) or the interface between groundwater and seawater; and (3) numerical simulations that combine groundwater flow and solute transport in field or laboratory scale.
2.1. Field Investigations
As illustrated in Figure 4, early research revealed the elevated concentration of dissolved Fe(II) in the streams flowing into Deception Bay (northwest end of Moreton Bay), Queensland, Australia [40]. It has been identified as a key factor contributing to the occurrence of Lynbya blooms in the coastal area [41]. Subsequent field studies on the Deception Bay catchment and Caboolture River sub-catchment (Queensland, Australia) discovered that the outcropping sediments contained ironstone and Fe minerals (up to 8.5%). Moreover, discrepancies in the chemical compositions of leachate and shallow groundwater indicated that the groundwater flowing through this region had a source other than surface waters [42,43]. Meanwhile, the report on samples from the intertidal area off Sandstone Point, Queensland, Australia, showed that the soil had an acidic pH level ranging from 4.6 to 5.2 at a depth of 0.2 m and was highly acidic, with a pH below 3.4 at depths between 1 m and 1.2 m [42,44]. These findings indicate the presence of acid sulfate soils (ASS), which are widespread in the coastal regions of Queensland. When these soils undergo hydromechanical disturbances, such as from agriculture and construction, the exposed sulfides react with oxygen in the air to form sulfuric acid, which leads to the decomposition of Fe minerals [43] and the subsequent release of Fe(II) into groundwater systems (see Figure 2) [4]. As a result, soil samples from the top layer (up to 0.3 m) contained a moderate content of extractable Fe, with levels reaching 91 mg/kg, while the groundwater had a high Fe(II) concentration of up to 1.6 mg/L. This implies that significant amounts of groundwater at depth delivered Fe(II) through the soil to the neighboring intertidal area of Deception Bay [44]. Furthermore, detailed measurements of Fe(II) concentrations obtained by incubating sediment cores from northern Deception Bay provided evidence of the benthic release of Fe(II) at the sediment–seawater interface in an intertidal area [45]. In comparison, on the east side of Moreton Bay, field measurements of porewater salinity and DO profiles on the west coast of Moreton Island (Mulgumpin) presented a conceptual model of the coastal unconfined aquifer (CUA) driven by oceanic oscillations, particularly tides and waves [23,46]. The results revealed significant geochemical zonation, that strongly influenced the fate and distribution of reactive chemicals at the groundwater–seawater interface, as well as their subsequent discharge to coastal waters. Furthermore, chemical analysis of porewater samples from an offshore site of Eastern Banks in North Stradbroke Island (Minjerribah) indicated that dissolved Fe in groundwater primarily existed in the form of Fe(II), and it also demonstrated the presence of a higher Fe(II) concentration compared to that in seawater [47]. As a supplement, an in-depth assessment of phosphorus (P) cycling in the sediments of the Peel–Harvey Estuary, Western Australia, suggested that P was adsorbed onto micro-scale enrichments of Fe(III) oxyhydroxide due to Fe redox chemistry [48].
On a global scale, shown in Figure 4, zones with Fe precipitation or Fe-oxide-coated sand have been discovered in many field-based studies, for instance, in the tidal groundwater marshes of Chickahomiy River in Virginia, USA [49], and on the beaches of the North Sea, Germany [50]. Sediment cores collected from the intertidal zone of Waquoit Bay, Massachusetts, USA, revealed Fe-oxide-coated sand with dark red–yellow and orange colors [12]. In addition, porewater samples extracted from this area showed a high concentration of dissolved Fe(II), and more than 95% of the total Fe was in ferrous form, which could be traced to the Fe(II) in the submarine groundwater. Subsequently, the findings from the study of Patos Lagoon Barrie, Brazil, indicated that phosphate was immobilized as a result of Fe precipitation, and there was also an enrichment of Fe in coastal surface waters [51,52]. Moreover, porewater and sediment samples from the groundwater discharge zone of the Indian River Lagoon in Florida, USA, substantiated the Fe release into surface waters along coastlines [21]. Additionally, McAllister et al. [53] observed that seasonal variations in groundwater gradients induced the iron curtain to contract and expand at Cape Shores, Lewes, Delaware. Specifically, the iron curtain moves toward the ocean in summer and toward land in winter. Sawyer et al. [54] summarized that the configuration of an “iron curtain” could be significantly influenced by hydrodynamic variability across several timescales related to waves, tides, storms, sea-level rise, seasons, annual precipitation patterns, and climate change. Furthermore, Trezzi et al. [30] observed that Fe ions in groundwater underwent chemical reactions upon contact with seawater in the Mediterranean. Also, chemical analysis of dissolved Fe in beach porewaters on Spiekeroog Island, Germany, provided further evidence that Fe oxides form in the transition zone between anaerobic groundwater and aerobic seawater [15,28]. Meanwhile, intensive measurements of nutrient content at Tolo Harbour, Hong Kong, China, successfully captured the temporal variation of nutrients at a sandy beach. The results exhibited the absorption of PO43− onto Fe oxides in the deep transition zone [55]. Subsequently, the field study on the Baltic Sea revealed that the physio-chemical variables could be modified as a result of Fe precipitation and PO43− adsorption. This resulted in the formation of an iron curtain, serving as a temporal sink for P in coastal sediments [56].
2.2. Laboratory Experiments
Since the 1990s, research into Fe transformation in aqueous systems has begun to receive much attention. Organic substances, e.g., dissolved organic matter (DOM) or dissolved organic carbon (DOC), have been reported to accelerate, retard, or have no effect on the rate of Fe(II) oxidation under a variety of pH and DO conditions [57,58,59]. Rose and Waite [60,61] initially constructed a kinetic model to describe the redox cycling of Fe in seawater. This model specifically focused on the oxidation of Fe(II) in the presence and absence of natural organic substances obtained from Moreton Bay, Australia. The experimental results showed that the processes of Fe oxidation and precipitation were mainly accelerated by DO concentration and were significantly influenced by the presence of DOM. Furthermore, the hydrolysis of Fe(III) occurred rapidly in seawater, and the corresponding solid precipitates were initially labile. Subsequently, research by Spiteri et al. [13] illustrated how pH and redox transitions determine geochemical zonation in the intertidal area. This zonation has a substantial impact on the distribution of metals, as well as their discharge into the ocean. Further research by Garg et al. [62] investigated the effect of water pH on pathways that contributed to Fe transformation in groundwater systems with natural organic matter (NOM). The findings revealed that the Fe(II) oxidation rate is controlled by its interaction with DO. The steady state of Fe(II) concentrations was greatly affected by pH changes, whereas the Fe(II) concentration in surface waters may not be significantly impacted.
In addition to such studies concerning chemical reactions, flow tank or sand flume experiments (see Figure 5a) are commonly employed to investigate pathways and mechanisms under various predetermined forcing circumstances, such as different tidal ranges and net groundwater flow rates. For example, with a focus on the effects of a saltwater diffusion zone and tidal fluctuation, a laboratory-scale investigation on the contaminant transport was conducted in a flow tank (1.65 m long, 0.6 m high, and 0.1 m wide) with glass beads, which served as a porous media in a CUA [63]. Their results indicated that the contaminant source traveled seaward with groundwater flow and exited as a concentrated plume in a restricted discharge area at the simulated coastline. The saltwater interface substantially affected the migration pattern of contaminant plumes. In recent years, a combination of sand flume (3.5 m long, 0.8 m high, and 0.02 m wide) experiments and field-scale numerical simulations was successfully conducted to investigate porewater dynamics across the aquifer–ocean interface in response to tidal fluctuations and different inland hydraulic heads [64]. One of the new findings was that tides can create shallow circulations and enhance density-driven circulations, thereby increasing the seasonal exchange of aquifer–sea porewater under varying inland groundwater input. Subsequently, a further experiment was undertaken in conjunction with laboratory-scale modeling to study the combined impact of inland groundwater and tidal oscillations on the subsurface flow of a coastal reservoir and adjacent aquifer. The findings revealed a considerable impact of tides on porewater exchange between the reservoir and aquifer. The resulting increase in density-driven flow and tide-induced flow was identified as the major source of solutes in the coastal reservoir [65]. Nevertheless, there is still limited availability of such laboratory research that specifically investigates hydrogeochemical processes in coastal aquifers.
Column experiments (see Figure 5b) are typically utilized to explore the migration of certain compounds in a particular substrate [66]. A wide range of applications can be implemented to effectively tackle more specialized research issues, for example, the impact of varying water tables on redox conditions [67], preferential flow affecting solute transport [68], pharmaceutical substance transport under saturated conditions [69], pesticides leaching under unsaturated conditions [70], the remediation of acidic mine drainage [71], or the mobility of nanoparticles for soil remediation [72]. The basic concept of a column experiment is to pump water containing a desired solute through a column filled with substrates of interest. Such column tests generally employ three experimental setups: (a) a column with a downward flow to replicate percolation across unsaturated zones [73], (b) a column with an upward flow to simulate saturated conditions [69], and (c) a series of columns to analyze the changes of hydrochemical parameters along the flow path [74]. In published studies, columns are often built of stainless steel to avoid solute interactions [75,76,77], acrylic glass for better visualization of wetting front and dye tracer migration [78,79,80], and other materials such as aluminum [81], glass [82], polyvinyl chloride (PVC) [83], and polyethylene [84]. Although the slenderness ratio (i.e., height to diameter) has a profound impact on hydraulic conditions and solute transport in the column, broad research has reported a wide range of column dimensions, with heights ranging from 0.5 m [85] to 2.4 m [86], and diameters from 0.02 m [85] to 0.36 m [84]. However, Lewis and Sjöstrom [87] suggested an appropriate ratio of 4.0 to minimize scaling effects. Additionally, peristaltic pumps are widely used in researching fluid transport in saturated columns due to their ability to provide uniform flow rates [88,89,90], and other pumps include syringe pumps [91], pulsating pumps [92], piston pumps [93], gear pumps [75], and suction pumps [94]. Furthermore, a wide variety of substrates have been reported as column infill, e.g., site-specific aquifer sediment [75], natural or artificial soils [88,95], model quartz sand [96], and Fe-coated sand [79].
While laboratory-scale experiments have offered valuable insights into the impact of oceanic and groundwater conditions on solute transport under controlled settings, as well as the Fe kinetics influenced by factors such as pH and DO, there has been relatively limited research addressing how an “iron curtain” forms and its implications for subsurface flow dynamics. This research gap contributes to an incomplete understanding of the driving mechanisms and spatiotemporal variations of an “iron curtain” near the groundwater–seawater interface.
2.3. Numerical Simulations
Conducting field-scale tests is challenging because of restricted access to the groundwater–seawater interface and spatiotemporal scale, both of which are required to observe an in situ iron curtain. Hence, numerical models offer an efficient way to quantify the hydrogeochemical process of Fe(II) and its driving mechanisms in real-world scenarios (see Figure 6a). For example, by implementing a simple reaction network in a one-dimensional (1-D) reactive transport model (RTM) (see Figure 6(b1)), Spiteri et al. [13] discovered that the pH gradient, instead of the DO gradient, was the primary factor influencing the oxidative precipitation of land-derived Fe(II) in the mixing zone, and determining the location and the amount of Fe oxides in Waquoit Bay, USA. Later, based on a two-dimensional (2-D) RTM (Figure 6(b2)) coupled groundwater flow and biogeochemical reactions, the findings further indicated an important link between the accumulation of Fe oxides and the binding of P compounds [97]. Coincidentally, Pham et al. [98] successfully calculated the precipitation rate throughout a pH range that could be predicted in laboratory conditions. This study concluded that the kinetics of water exchange may govern the kinetics of Fe precipitation. Subsequently, Roy et al. [21] developed an RTM to study the diagenesis of Fe linked to DOC under field conditions in Florida, USA, and the findings revealed that the dissolution of Fe was influenced by both the evolving reactivity of DOC and the reduced velocity of groundwater flow as the distance from the shore increased. Furthermore, by integrating SEAWAT and PHT3D programs, Anwar et al. [26] numerically studied the formation of Fe(OH)3 in an intertidal zone and presented the accumulation of Fe(OH)3 over a simulation period of 300 days. However, the spatial distribution along the SW did not stabilize, and the amount of Fe(OH)3 did not reach a quasi-steady state after 300 days. Additionally, Zhang et al. [99] combined field investigations and three-dimensional (3-D) numerical modeling to analyze how alongshore morphology impacted nearshore porewater flow and chemical input to the coastal sea. However, the use of 3-D models (Figure 6(b3)) is still rare in published studies to date. Recently, Wang et al. [100] employed TOUGHREACT to investigate the formation and distribution of iron curtains due to groundwater–seawater mixing. Their results indicated that Fe(OH)3 tended to accumulate on the groundwater side of the mixing zone, which extended from surface layers to deeper layers. The amount of Fe(OH)3 was influenced by the groundwater flux and the ratio of DO to Fe(II) concentrations.
3. Impact of Fe Precipitation on Pore Structure
3.1. Evolution of Pore Structure at Pore Scale
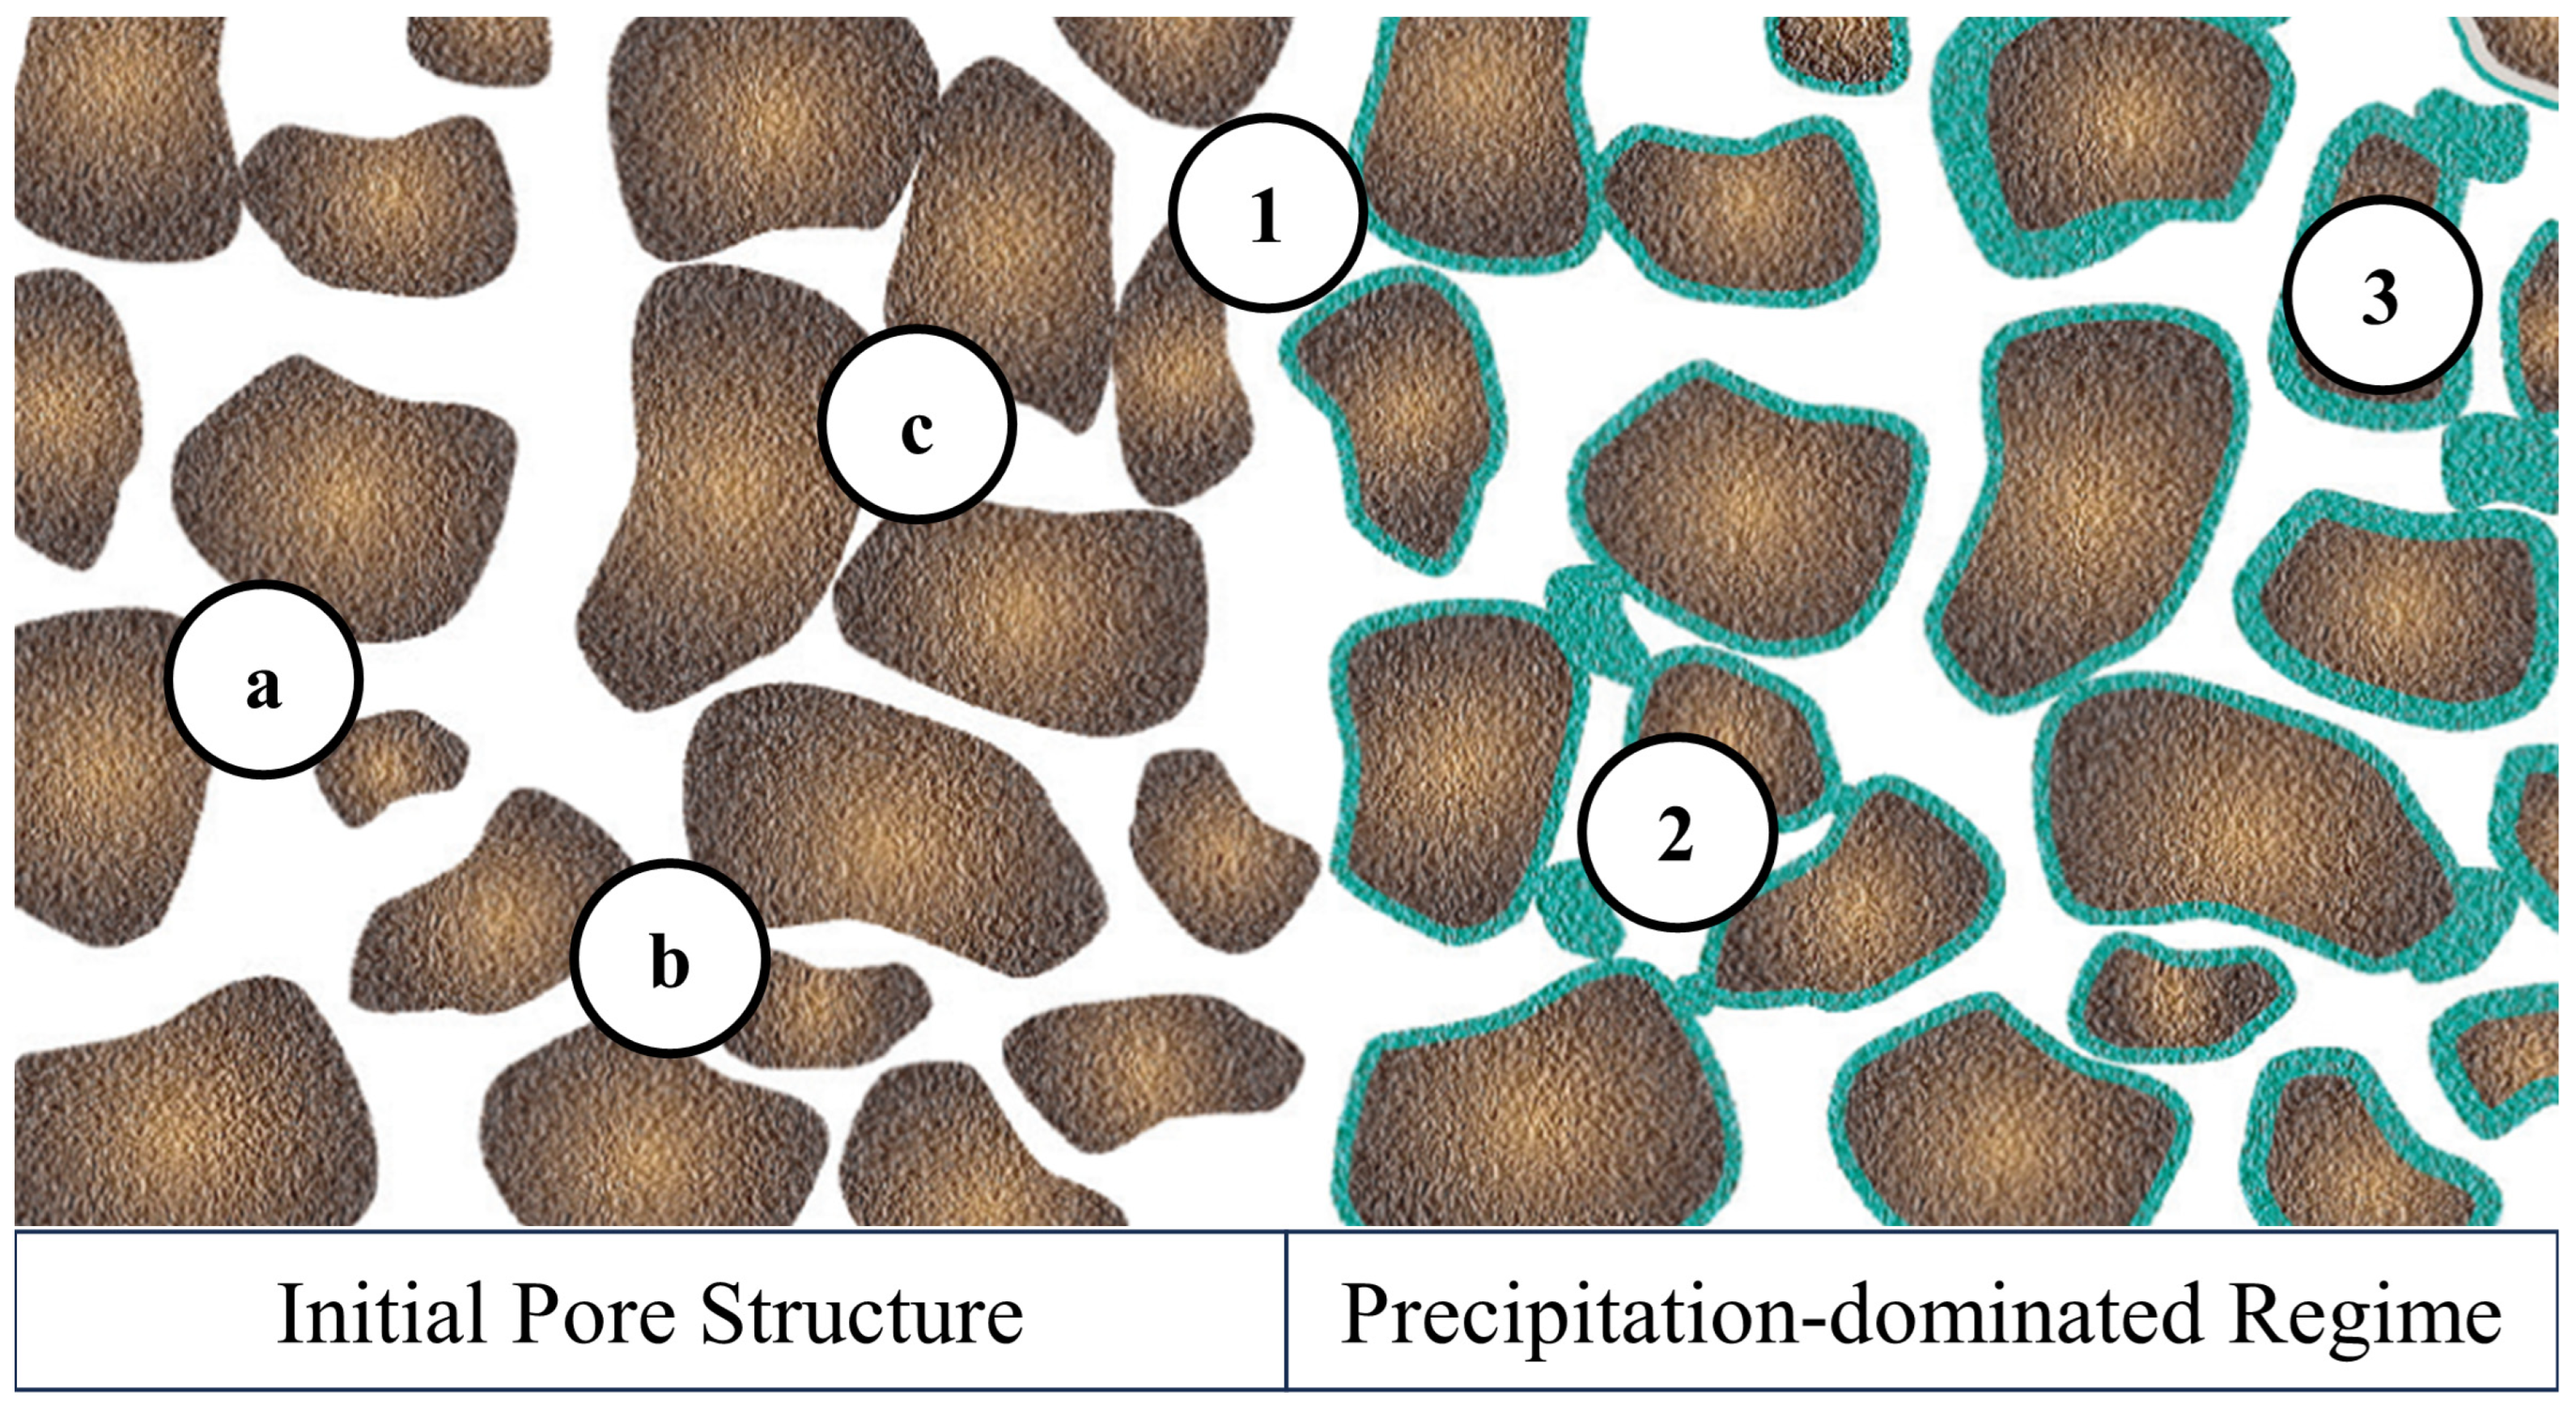
The oxidative precipitation of Fe(II) can modify the pore structure of porous media, thereby influencing the connectivity between pores. Under such a precipitation process, Figure 7 provides a visual representation illustrating the evolution of a porous media at pore scale. The initial pore structure has three different zones: (a), (b), and (c). Zone (a) is significant because of its good connectivity, which serves as a key channel for fluid and solute transport. Zone (b) shows a tortuous pathway for advection and diffusion. Zone (c) is defined by large pores with restricted connections to the major channel. With a focus on the regime dominated by precipitation, Fe precipitation can (1) reduce the size of pore throats, (2) clog the initial pore space, and (3) increase the solid surface area, henceforth increasing hydraulic energy loss by friction between seeping fluid and surface of soil particles. In any of these scenarios, the accumulation of Fe precipitates at pore scale has a major impact on the seepage properties of porous media at the continuum scale.
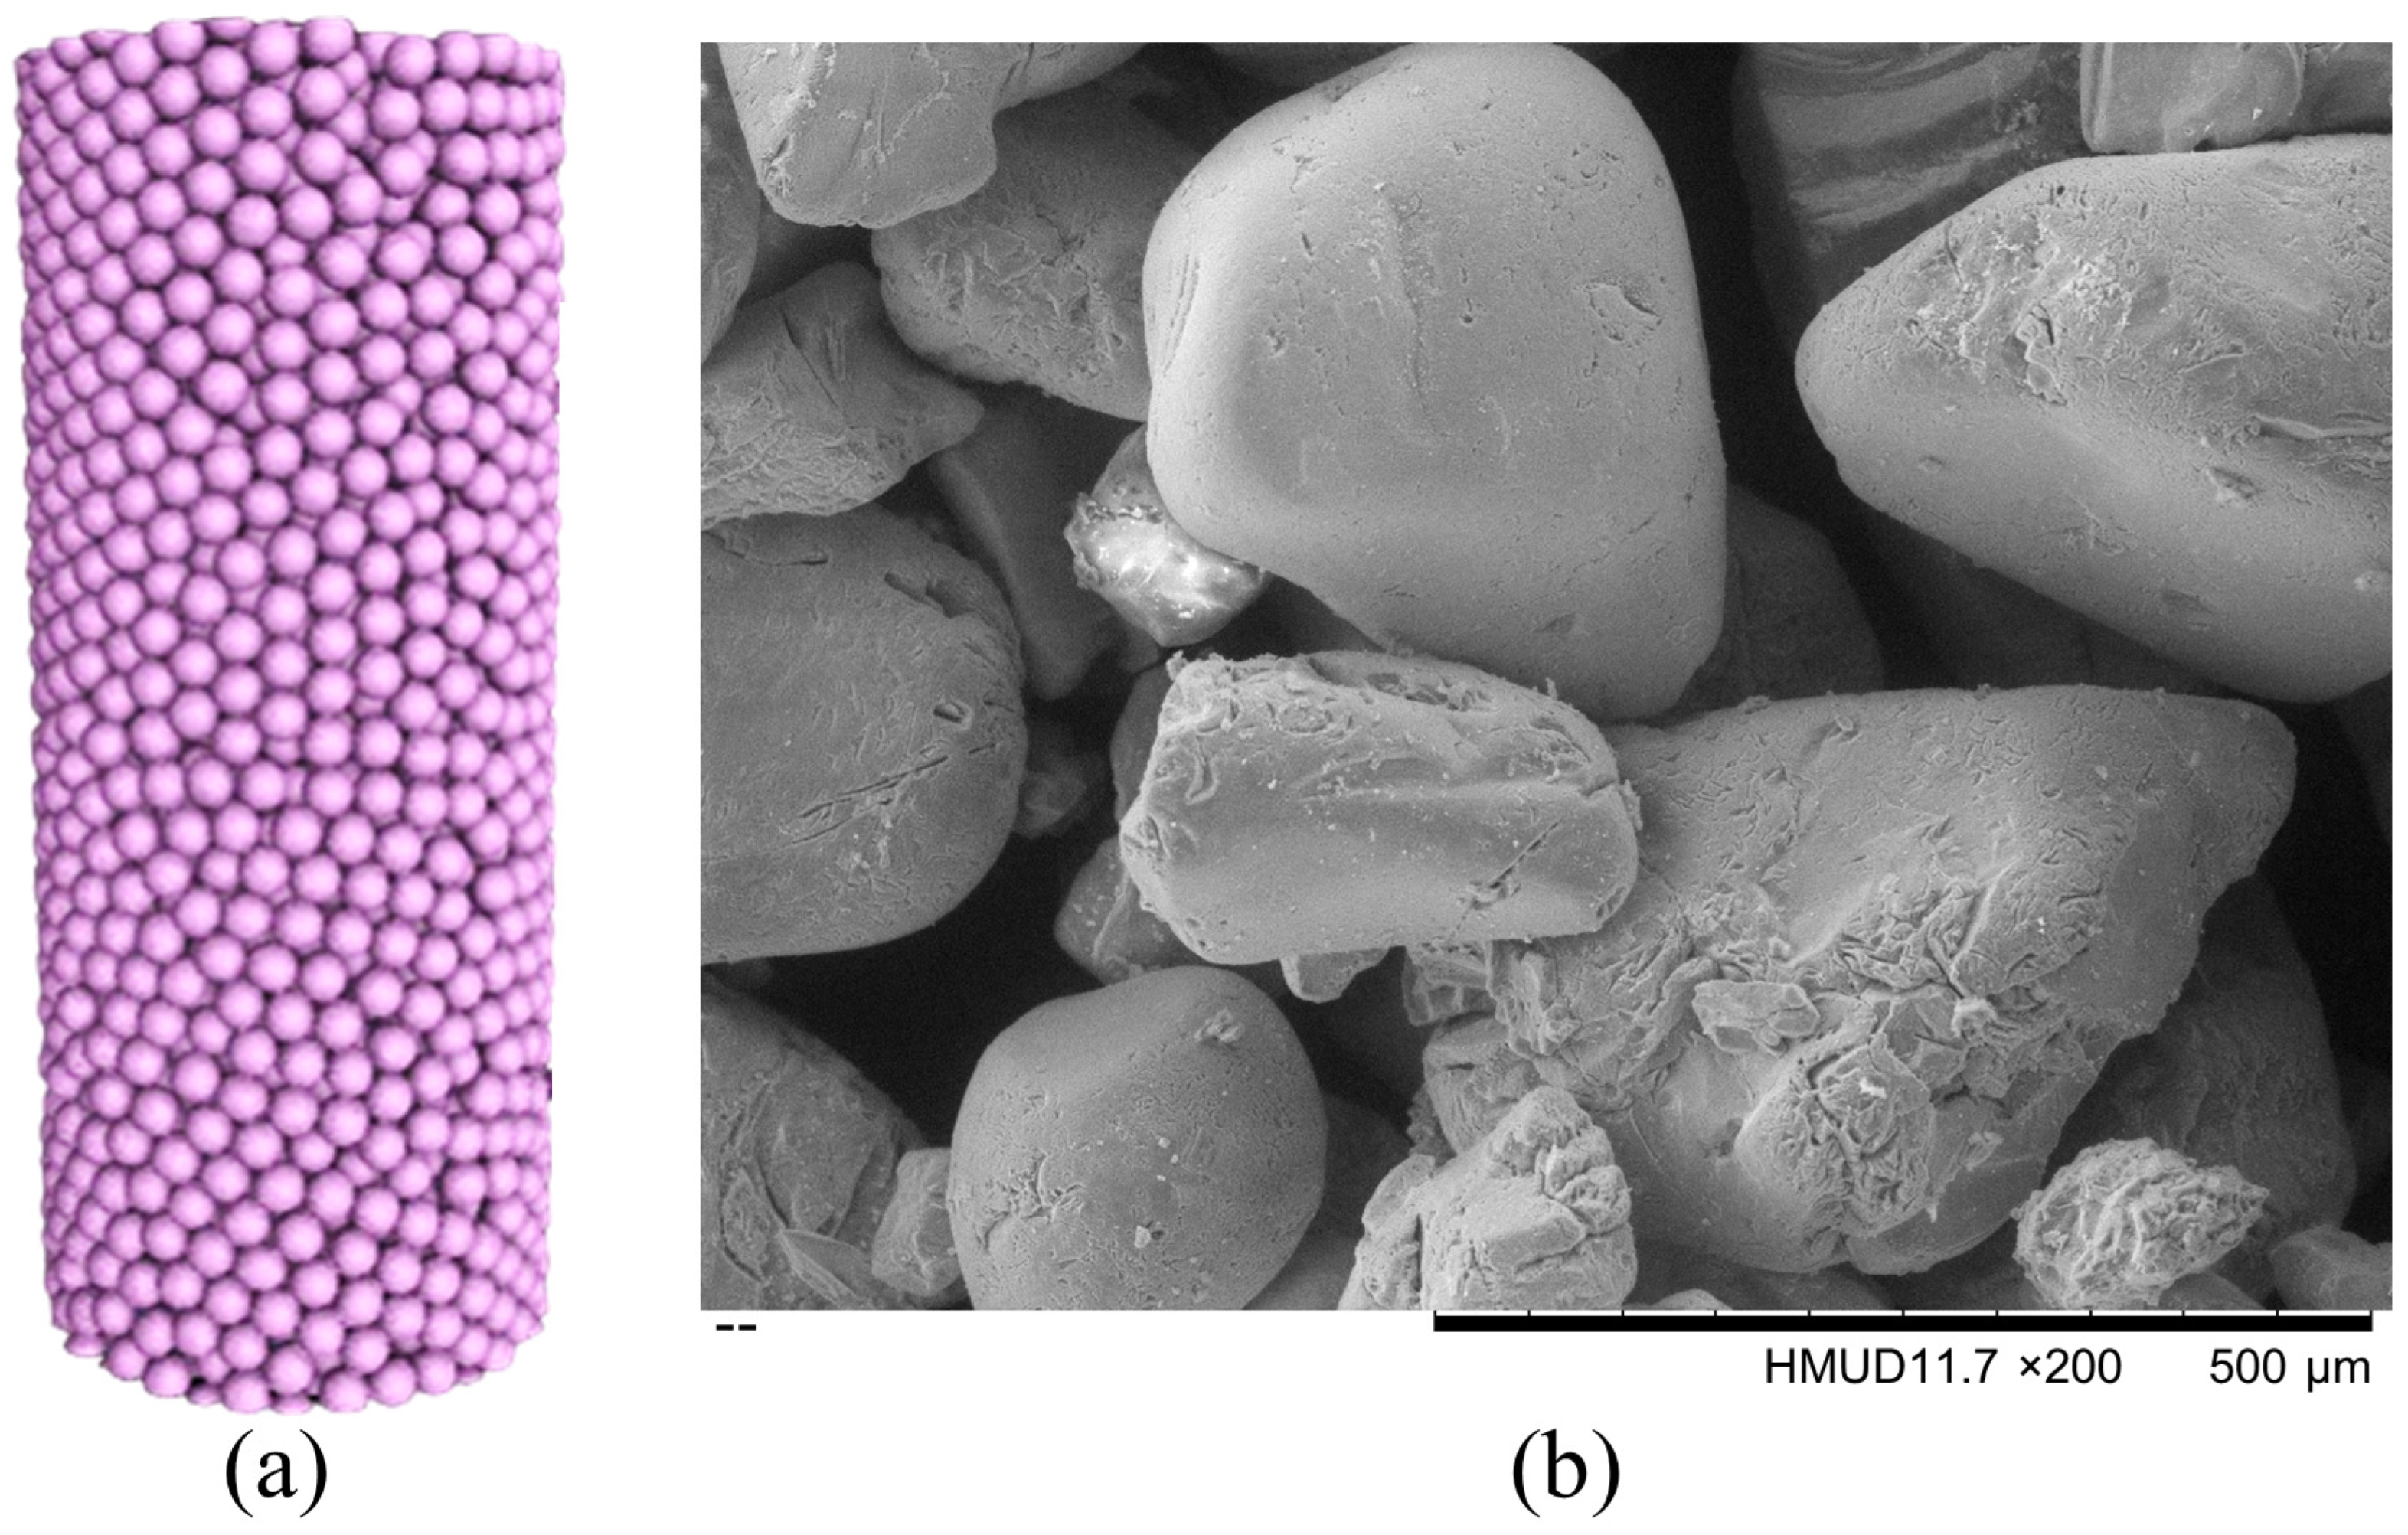
With the utilization of non-invasive imaging techniques, it has become a reality to visualize the pore structure in high resolutions, which provides an in-depth insight into the complex nature of porous media. Werth et al. [101] summarized the pros and cons of four non-invasive imaging techniques, including optical imaging using UV or visible light, dual-energy gamma radiation, X-ray microtomography, and magnetic resonance imaging (MRI). In particular, the X-ray approach was recommended in the field of hydrogeology and geochemistry because of its great resolution and flexibility for the three-dimensional (3-D) characterization of natural porous media. Theoretically, it is possible to numerically investigate reactive transport and develop predictive models based on 2-D or 3-D images of pore geometry. Figure 8a illustrates a 3-D micro-computed tomography (micro-CT) image of a sample porous media with interconnected pores, facilitating the construction of a pore network model (PNM) by representing pores as spheres and pore throats as cylinders [102]. An analysis of the PNM indicates that the fluid flow through this media is considerably affected by the size of pores, the width of the pore throats, and the connection between pores. The decrease in pore size and pore throats, as well as limited connectivity in three dimensions, suggests a high value of tortuosity, which makes both advective and diffusive transport challenging.
Furthermore, a recent study by Zhao et al. [103] provided several images of Fe-oxide-coated sand samples under a scanning electron microscope (SEM) and optic microscopes. Figure 8b exhibits the alternations in pore space caused by Fe precipitation in sand, where Fe precipitates can either increase the size of existing particles or form new structures. Based on such observations, Fe precipitation has a minor effect on the connectivity between pores if precipitated Fe coats particles without clogging pore throats. However, accumulated precipitation can reshape existing pathways for seepage flow and solute transport, thereby leading to changes in tortuosity and permeability. Additionally, the reaction rates of oxidation and precipitation processes are generally controlled by surface area, which is determined by several factors, such as particle size [104], surface roughness, and the presence of imperfections or etch-pits [105]. Also, fluid dynamics can result in the formation of extra reactive zones, which could be the explanation for the observed discrepancies between reactive and geometric surface areas [34]. Consequently, the combination of these factors determines the effective surface area during hydrogeochemical processes [106]. However, any of these factors can temporally evolve as a porous matrix undergoes chemical reactions.
3.2. Distribution of Precipitation in Pore Matrix
The precipitation regime is dependent on the characteristic timescales associated with advection, diffusion, and reaction processes. Parameters such as pore flow velocity, diffusion coefficient, and reaction rate can dynamically evolve in response to pore matrix changes induced by precipitated Fe. Numerous studies indicate that the relationships between transport and reaction processes can be characterized by the Péclet (Pe) number and the Damköhler (Da) number, which determines the transport regime based on timescales of advection, diffusion, and reaction. The Pe number reveals the significance of advective and diffusive transport [107], while the Da number reflects the relationship between reaction rate and transport rate [108]. They are defined as follows:
where v is the flow velocity, L is the characteristic length of porous media, and D is the diffusion coefficient in response to Fe precipitation.
The precipitation of solid-phase minerals (e.g., Fe oxides) can cause an extreme case of pore-clogging, which changes the groundwater flow and solute transport through porous media. Hence, it is of significance to understand how hydrogeochemical reactions influence transport properties and to include the evolution of these parameters in modeling studies. Kang et al. [109] numerically studied the impact of Pe and diffusive Da numbers on mineral precipitation and the resulting decrease in permeability. The simulation results revealed that Da determined the time duration to clog the pore space when Pe was kept constant at a high value. Increasing Da (with a constant Pe) led to a more concentrated precipitation zone and more efficient pore-clogging near the inlet, whereas increasing Pe (with a constant Da) yielded a wider precipitation front, requiring more time and reactants to clog all the pores. It was concluded that the combination of moderate Da (3.24 < Da < 32.4) and small Pe numbers (Pe < 0.628) can contribute to rapid pore-clogging, resulting in impermeable pore structures even with a small amount of precipitation. Further research by Tartakovsky et al. [110,111] presented consistent findings on mixing-induced precipitation with various solutes. Precipitation occurred throughout porous media in the case of high Pe (Pe > 6) and low Da numbers (Da < 0.4), while precipitation formed along the main flow pathway (i.e., in a dendrite-like pattern) in the case of low Pe (Pe < 1) and high Da numbers (Da > 17). In addition, low Pe (Pe < 1) and high Da (Da > 17) numbers led to localized precipitation near the inlet, resulting in rapid pore-clogging and a substantial reduction in flow rates. In summary, high Da numbers (Da > 17) produce a narrow precipitation zone near the inlet where reactants contact, whereas low Da numbers (Da < 0.4) cause a wide zone due to diffusion dominance. While these studies provided a detailed insight into the coupling of physical and geochemical processes, it is difficult to predict the temporal changes of transport parameters because they are determined by the spatial distribution of precipitates rather than their total amount, particularly in the pore-clogging case.
A few studies indicated other factors influencing the distribution of mineral precipitation. For example, Chagneau et al. [8] studied celestite precipitation in a diffusion–reaction cell and observed that precipitates primarily presented in large pores as a result of the differential transport of anions and cations. Further research has shown that spatial heterogeneities play an important role in determining how precipitation is distributed, subsequently governing the evolution of continuum-scale parameters such as the tortuosity, permeability, and reactivity of porous media [112,113]. Additionally, Rajyaguru et al. [114] compared the precipitation patterns between barite and gypsum in chalk samples, and micro-CT images revealed that barite precipitation showed a thin continuous disk, while gypsum precipitation appeared as large isolated spheres. Moreover, barite had a more profound effect on diffusivity, despite a comparable 2% decrease in total porosity when compared to gypsum. The outcome suggested that barite precipitated through uniform and non-uniform nucleation, while the precipitation pattern of gypsum was dominated by heterogeneities of the local pore structure. These experiments highlighted that even, when the flow and solute transport are only subject to diffusion, mineral precipitation in pore structures remains highly complicated.
4. Parameterization of Evolving Porous Media
4.1. Evolution of Porosity at REV Scale
As previously discussed, the oxidative precipitation of Fe(II) results in changes in porosity. As porous media containing Fe precipitates exhibit significant heterogeneity, the concept of a representative elementary volume (REV) can be statistically utilized to determine stable packing conditions (such as void ratio and porosity) in a matrix of solid particles and void spaces. For Figure 9, the porosity at REV scale is defined as
where Vt is the total volume of porous media, Vv is the void volume which equals the water volume Vw under fully saturated conditions, and Vs is the volume of solid particles including precipitated minerals (i.e., Fe).
Even though the concept of total porosity is straightforward, it is difficult to obtain the value of n directly. Some laboratory methods can be used to achieve the accurate n. Using the volumetric saturation method, Missimer and Lopez [115] investigated a total of 100 well-sorted beach and dune sands and conducted five separate measurements to evaluate the accuracy. The results revealed that the standard deviation for this method approached 0.004 (viz., ±0.4%). In addition, 91 out of 100 samples were within the highest allowable error of ±3%, and the average deviation was ±0.064%, proving that the volumetric saturation method is quite reliable.
During the oxidative precipitation of Fe(II) in porous media, solid-phase Fe occupies void spaces and reduces the porosity. The change in porosity can be derived by considering the volume fraction of Fe precipitates in a porous matrix. It is expressed as
where n0 is the initial porosity, and φi is the volume fraction of precipitated Fe.
As a result, the temporal evolution of porosity can be calculated by defining the mass balance equations for reactive minerals [116] using
where Vi is the molar volume fraction of the mineral (i.e., Fe) i, and Ri is the precipitation rate of precipitated Fe.
4.2. Permeability–Porosity Relationships
Permeability is a REV-scale seepage property that reflects the ability of fluid to transport through porous media [32,33]. As illustrated in Figure 10, the intrinsic permeability k of precipitation-dominated porous media can be calculated using Darcy’s Law (see Equation (6)), which quantifies a linear relationship between discharge rate and hydraulic gradient in a porous-media-filled column during constant laminar flow [117]:
where Q is the volume flux, A is the cross-sectional area, ΔL is the length between inlet and outlet, Δh is the height difference between inlet and outlet, µ is the fluid viscosity, ρ is the fluid density, and g is the gravitational acceleration.
Based on factors such as void ratio, saturation, and heterogeneities, the permeability of geomaterials greatly varies, ranging from coarse to very fine-grained soils by up to ten orders of magnitude. The statistics reveal that the k values of clean sand range from 10−9 to 10−12 m2, while marine clay has a k range from 10−16 to 10−19 m2 [118]. Accurate permeability can be determined by analyzing pore geometry obtained from pore-scale imaging, which is regarded as the only reliable way [36]. However, most studies have employed seepage tests to investigate permeability under various conditions [119]. For example, Sandoval et al. [120] studied the measuring accuracies of constant-head and falling-head methods and found that the constant-head method is more effective for distinguishing the permeabilities of different materials.
From a theoretical perspective, a wide range of equations have been proposed and validated independently from the field of reactive transport [121,122]. These equations facilitate the prediction of permeability evolution based on experimentally obtained parameters such as particle size and porosity affected by Fe precipitation. One of the early attempts is the Hazen–Williams (H–W) equation (see Equation (7)), which was established in the 1890s and remains a significant empirical relationship in America and the Middle East. This equation is frequently used to calculate the pressure drop of water flow within a pipe. Additionally, it finds application in predicting the permeability of uniform sand, provided that the uniformity coefficient is below 5.0 and the effective particle size ranges from 0.1 mm to 3 mm [123]. In other cases, it presents substantial discrepancies, as this equation is only valid for water [124].
Here, d10 is the effective particle diameter that represents the 10% of particles smaller than this size, and cH is a coefficient from 1 to 1000 [125].
One of the most renowned equations is the Kozeny–Carman (K–C) equation, which was initially proposed by Kozeny in 1927 and later modified by Carman in 1937. The equation facilitates the estimation of permeability of porous media, such as homogeneously packed glass beads, sand, and gravel, through porosity and effective diameter [119,126]. Typically, it is expressed as follows:
where ck is a shape factor ranging from 180 to 270 (e.g., 180 corresponding to perfectly spherical particles) [127].
Extensive research indicated that the K–C equation provides accurate results for coarse soils when d10 is less than 3 mm. However, it cannot be reliably applied to clay soils [128]. Additionally, research by Pomès et al. [129] suggested the disparity between the permeability predicted by the K–C equation and that obtained from volume averaging can increase with the injection rate. Mostaghimi et al. [130] also demonstrated that the K–C equation can lead to considerable overestimation of permeability for heterogeneous or poorly connected porous media.
Furthermore, there are several semi-analytical equations, such as the Terzaghi equation (see Equation (9)), the Breyer equation (see Equation (10)), and the Slitcher equation (see Equation (11)),
where Cu is the uniformity coefficient defined as the ratio of d60 to d10.
In the Terzaghi equation, the particular value of 0.0084 represents a classification coefficient from 0.0061 to 0.00107. Although the applicability of the Breyer equation is limited by specific porosities, it is considered most useful for granular materials with heterogeneous distributions and poorly sorted grains, particularly when Cu ranges from 1 to 20, and d10 is 0.06–0.6 mm [131]. Moreover, Marschalko et al. [132] demonstrated a good agreement between the permeability calculated by the Slitcher equation and that obtained from the constant-head method for various sand. This equation is most suitable when soil particles are uniformly distributed within a range of 0.01–5 mm in particle size [133].
When the pore matrix evolves with the oxidative precipitation of Fe(II), it becomes challenging to determine how its permeability varies at any given instant during this hydrogeochemical process [38,39]. Under such conditions, seepage flow and solute transport are not only dependent on changes in permeability and porosity but also affected by changes in other parameters related to pore geometry, such as tortuosity and specific surface area [37,134].
4.3. Tortuosity-Porosity Relationships
Due to the complex pore space morphology, the flow channel often has a longer length than a straight pathway between the source and destination [135], particularly when precipitated Fe clogs some of the initial pore throats. Hence, Carman [136] proposed the concept of tortuosity to match the estimated permeability with the experimental data. As illustrated in Figure 11, tortuosity is defined as the ratio of the effective length of a flow channel (Le) to the straight-line distance (Ls) through a porous media:
However, it is frequently used as a variable in practical applications [137], suggesting a lack of understanding of its physical characteristics. Consequently, multiple forms of tortuosity have been identified and utilized in the literature on porous media. For instance, tortuosity was defined as Ls/Le, which is the inverse of Equation (12) [138]. Bear [139] introduced tortuosity as (Ls/Le)2, the square of the inversed Equation (12), while Holzer et al. [140] documented it as (Le/Ls)2, the square of Equation (12). Precisely, the concept of tortuosity shall be restricted to its geometric meaning related to flow channels. For this purpose, this study adopts Equation (12).
Similar to the relationships between permeability and porosity, diverse tortuosity–porosity relationships are commonly utilized in the study of evolving porous media, and they may apply to the porous media considering the oxidative precipitation of Fe(II). For example, Koponen et al. [141] used a lattice-gas approach to model the tortuosity of incompressible fluid flow in 2-D porous media with a critical porosity of 0.33 (nt = 0.33). Upon this, Equation (13) was proposed to define tortuosity as a function of porosity:
Subsequently, Mota et al. [142] presented a semi-analytical relationship between tortuosity and porosity, particularly for spherical particles:
where β is an exponent to be determined experimentally or numerically. The proposed value was 0.4, while Millington and Quirk [143] suggested 4/3 for saturated soils.
Another popular equation is a logarithmic function of porosity, given as:
where P is a constant with specific values, e.g., 0.49 for highly porous beds [144], 0.41 for monosized and polydisperse spheres [145], and 0.77 for laminar fluid flow in 2-D porous media consisting of freely overlapping solid squares [146].
In addition, Li and Yu [147] also developed a tortuosity model for flow paths in a Sierpinski Carpet, a pore fractal model composed of particles of various sizes and uniform pores. The model takes this form:
Meanwhile, Ahmadi et al. [148] provided an analytical derivation of tortuosity for monosized spheres using a volume-averaging method:
where B is a fixed value of 1.209 for cubic packings, and 1.108 for tetrahedral. Equation (17) becomes infinite when n reaches 0.248 and 0.143, respectively.
Figure 12 compares tortuosity predictions as a porosity function based on Equations (13)–(17) for saturated porous media. Under theoretical conditions, tortuosity is 1 when porosity is 1, and it approaches infinite when porosity is zero. It can be observed that tortuosities obtained from these equations yield 1.0 for a porosity of 1.0, and all display similar results for porosities over 0.4, except for Equation (14). However, they exhibit substantial differences for porosities lower than 0.3. In particular, for porosities below 0.1, the calculated tortuosities can differ by several orders of magnitude. This implies that these tortuosity–porosity relationships are unique to porous materials and may become invalid as the pores approach complete clogging. The fact could be that these studies started with an initial porosity and tortuosity specific to investigated materials and relied on semi-theoretical laws to estimate how tortuosity temporally evolved using early-time data. As a result, reasonable agreements with observational data were achieved by specifying different fitting factors or exponents. Furthermore, these relationships indicate that various materials can be influenced in distinct ways, mainly linked to their original pore structure. A porous media with high initial tortuosity and narrow pore throats is more sensitive to the impact of precipitation processes, as observed in both experimental and numerical studies [34].
Moreover, in a solute-mixing-induced precipitation regime, hydrodynamic dispersion typically has a more significant effect than molecular diffusion when the fluid travels through porous media at a low velocity (e.g., v < 1.0 × 10⁻⁵ m/s), causing the accumulation of Fe precipitation rather than its transport. In such cases, pore geometry can play a dramatic role. Specifically, tortuosity can decelerate the solute spreading, while dispersion can elongate the solute band in the flow direction. As a consequence of materials and conditions, it is not straightforward to illustrate the evolving tortuosity as a function of changing porosity. Additionally, obtaining a more accurate representation of changes in diffusion and dispersion presents challenges in reproducing observed mineral precipitation patterns. Thus, recent research proposed an effective diffusion D* to represent these combined effects [149,150]. It is calculated using a linear dispersion model:
where D is the molecular diffusion coefficient, and αL is the lateral dispersion coefficient.
4.4. Evolving Reactivity and Surface Area
Characterizing the evolving reactivity in porous media is also important when porous media evolves with the oxidative precipitation of Fe(II), and reactivity is often quantified based on the surface area. The simplest assumption is that mineral precipitates uniformly coat solid particles. Hence, the specific surface area of a spherical particle (see Figure 13) is only related to its radius r:
As a result, a power-law function can be developed to describe how surface area changes with the volume fraction of solid-phase Fe. The mineral dissolution–precipitation reactions are defined as surface-controlled reactions:
where S0 is a reference surface area, and define the volume fraction of mineral i at the initial stage (t = 0) and the instant time t, respectively, and w is a fitting exponent. Steefel and Lichtner [151] proposed a constant value of 2/3, which was validated by subsequent research conducted by Xie et al. [152]. However, Andreani et al. [153] and Luhmann et al. [154] specified a value of 1 to accurately match the breakthrough curves in their experiments, which was supported by recent hydrogeochemical simulations by Pavuluri et al. [149].
However, later minerals precipitating on the surface of earlier minerals can cause surface passivation by heterogeneous nucleation [155]. Thenceforth, the reactivity of earlier minerals is related to the volume fraction of later minerals [34]. Therefore, Jeen et al. [156] employed an exponential model to illustrate the evolving reactivity of Fe in a permeable reactive barrier, and the results showed an improved agreement with observed data compared to that predicted by Equation (20).
Here, a is an empirical constant linking Fe reactivity loss to mineral accumulation.
Moreover, Noiriel et al. [36] investigated the evolving surface area during carbonate precipitation through a combination of imaging techniques, Brunauer–Emmett–Teller (BET) analysis, and numerical modeling. The study showed that the local increase in surface area due to mineral precipitation notably influenced mineral concentrations. The corresponding model with a constant surface area failed to match the observed data, indicating the importance of accounting for the changes in surface area throughout precipitation processes. Further research has also revealed that mineralogical heterogeneity and surface area change significantly impacted the overall reactivity of rocks and the release of solutes [157,158].
5. Approach for Reactive Transport Modeling
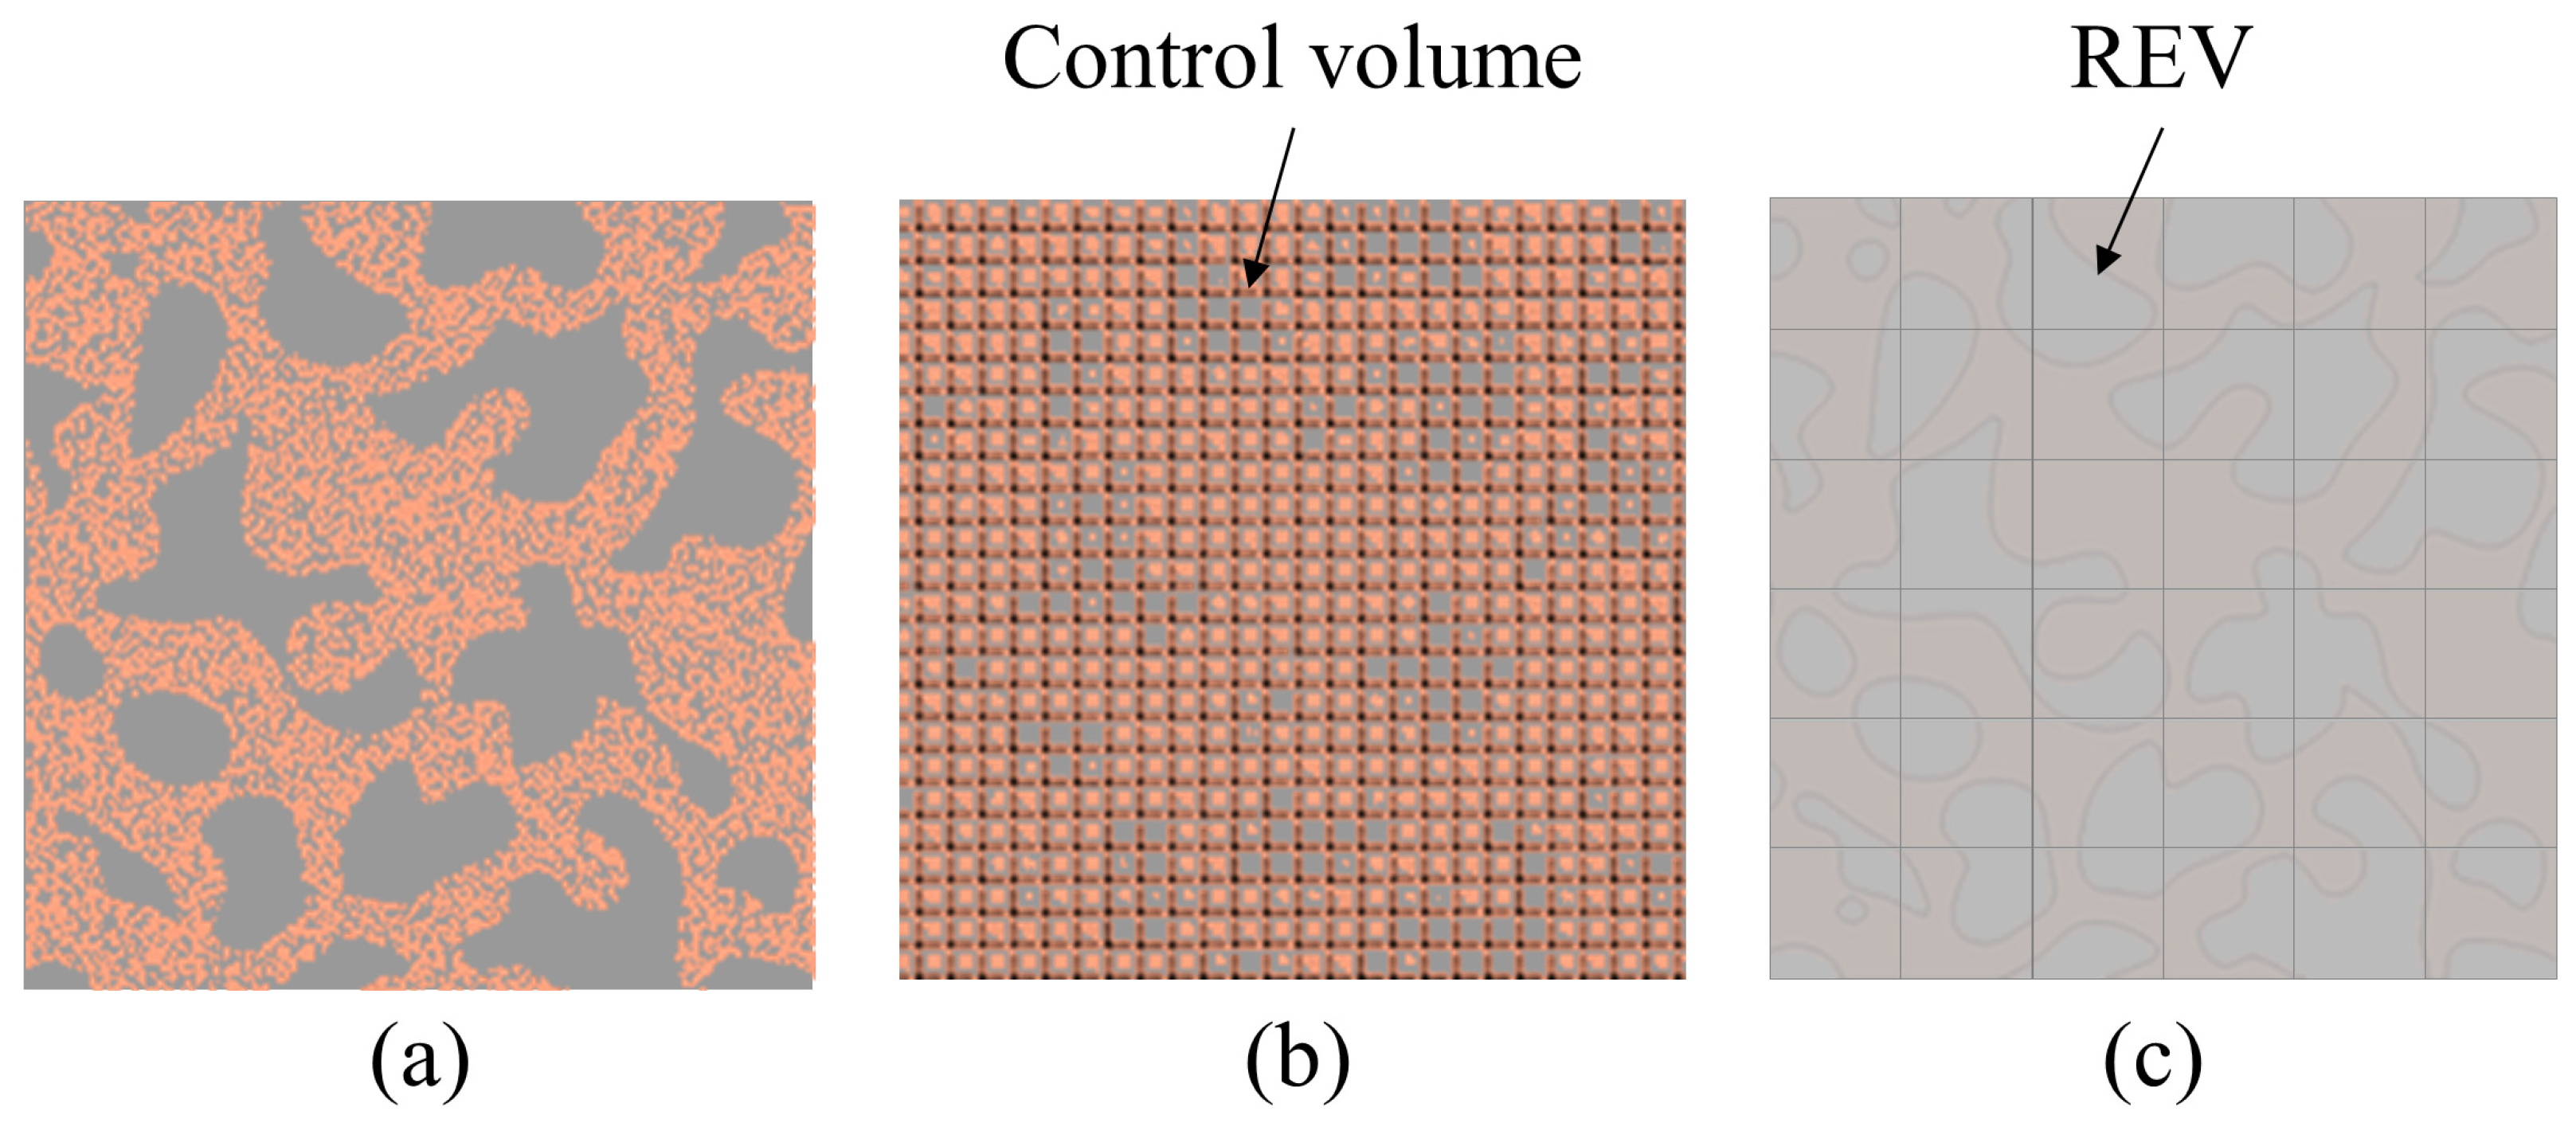
In recent decades, subsurface processes, including groundwater flow, solute transport, and geochemical reactions, have been extensively studied using Reactive Transport Modeling (RTM). According to Li et al. [159], the RTM approach allows for the coupling of physical and geochemical processes in spatiotemporal scales, bridging the fields of hydrogeology and geochemistry in porous media. As described in Figure 14, reactive transport in such porous media can be characterized using three distinct models: pore-scale, continuum-scale, and a hybrid-scale that integrates pore and continuum scales.
As a conventional approach, the continuum model (see Figure 14c) considers porous media as an averaged REV, and the pore structure is characterized by REVs [139]. From this approach, a few software solutions have been developed to address reactive transport within the pore matrix at REV scale [160], which includes MIN3P [161], TOUGHREACT [162], HP1 [163], CrunchFlow [116], and PFlotran [164]. In these solutions, the equations describing fluid flow and mass transport are formulated using REV averages and coupled with geochemical reactions [116]. Henceforth, Darcy’s Law has frequently been used to simulate the groundwater flow, and advection–diffusion–reaction (ADR) equations are used to model the transport of dissolved solutes in groundwater. Furthermore, geochemical processes such as Fe precipitation can have an effect on the flow field and REV-scale properties (e.g., tortuosity, permeability, and specific surface area) by reducing pore space [165]. As a result, changes in these parameters are typically considered constant or presented as a function of porosity in response to hydrogeochemical reactions. For example, most research works at continuum scale utilize Equations (8), (14) and (20) to define the relationships between porosity and evolving parameters [152]. However, the combination of advection, molecular diffusion, hydrodynamic dispersion, and geochemical reactions can produce high heterogeneity. Using equations containing empirical constants, it is difficult to accurately present the combined effects, as these constants often lack a robust theoretical foundation and typically remain unchanged with the progress of hydrochemical processes [166]. Additionally, the REV-averaging method assumes the disregard of fluctuations in governing variables, making it unable to identify those areas in a computational domain when the continuum model is inadequate [167]. To overcome these difficulties, numerous recent studies have focused on using high computational resources to develop numerical models at pore scale [168,169,170,171].
In pore-scale models described in Figure 14a, each point in the pore space is occupied by either a fluid or solid phase [150], and the fluid–mineral interface moves with the surface reaction of mineral precipitation [172]. So far, pore-scale models have proven to be a mature tool for studying flow patterns, and the evolution of hydraulic properties during biogeochemical processes in the pores has also been simulated. For example, Liu et al. [173] and Yan et al. [174] conducted pore-scale simulations to investigate how porous media heterogeneity affected immiscible fluid displacement patterns. Xie et al. [168] developed an improved pore-scale model that incorporated viscous coupling to improve the prediction of relative permeability. Dashtian et al. [169] performed a pore-scale study on reactive transport in porous materials, and demonstrated the impact of Pe and Da numbers on dissolution and porosity. Molins et al. [175] conducted a pioneering study that focused on a first-order kinetic reaction between a single solute and a single mineral. The results demonstrated the capability of existing models to accurately predict mineral dissolution at the pore scale. Among these pore-scale models, a wide range of particle tracking approaches have been implemented, in addition to the Lattice Boltzmann method (LBM) (see Figure 15), and the smoothed particle hydrodynamics (SPH) method [175]. These methods typically necessitate high computational resources with parallel computation to accelerate pore-scale modeling and simulations. However, the continuum-scale concept is not directly applicable at pore scale. Therefore, REV-scale properties can be acquired from an average of pore-scale simulation results if the domain is sufficiently large to achieve a REV size [176]. To date, the majority of research in this field has been focused on solving the Navier–Stokes equations in single and two-phase flow conditions to calculate seepage properties [177,178]. Nevertheless, further efforts are still needed to improve and validate pore-scale modeling of multiphase solutions reacting with multiple minerals within heterogeneous pore networks [150].
Although the oxidative precipitation of Fe(II) occurs at the pore scale, the oxidation and precipitation processes have distinct time and length scales. Specifically, the oxidation of Fe(II) to Fe(III) is nearly instantaneous in an aqueous environment, while the formation of Fe precipitates is at significantly different rates. Consequently, the evolving porous media exhibits a variety of spatial scales in response to hydrogeochemical processes. To the author’s knowledge, continuum-scale models employ homogenizing flow, averaged parameters at a REV scale, and empirical equations based on specific experiments. Therefore, uncertainties may present when applying these to other cases. In contrast, pore-scale models have been proven reliable in providing accurate predictions of coupled physical–geochemical processes in the pore space and enhancing an in-depth understanding of continuum-scale transport properties by allowing variations in the parameters of pore structure. However, they require substantial computational resources and are typically applicable to computational domains smaller than 0.1 m. To address these concerns, hybrid-scale models have been suggested by combining pore-scale modeling for specific areas with continuum-scale modeling for others (see Figure 14b). Based on a root-finding method coupling the pore and continuum scales, such models comprise domain decomposition, selection and execution of different governing equations for each subdomain, and continuity verification at the interface of sub-domains [179]. On one hand, they do not require extra parameters except for REV-scale properties of porous media, and physio-chemical properties of specified fluid and solute, as well as pore geometry. On the other hand, they succeed in addressing highly localized heterogeneities, providing a high level of accuracy in representing physics at the pore scale. Furthermore, these models have been valuable in distinguishing microscale features that are smaller than the resolution of imaging systems in image-based simulations [180,181]. The benchmarks by Pavuluri et al. [149] presented a groundbreaking study that demonstrates the feasibility of hybrid-scale modeling for 2-D advective–diffusive systems with complex interactions of geochemical reactions and porosity on permeability.
6. Knowledge Gaps and Research Needs
Hydrogeochemical reactions in porous media, such as the oxidative precipitation of Fe(II) commonly observed in Australia, can induce substantial changes in pore structure and dramatically alter soil properties in various natural and engineered systems. RTM is a valuable approach for analyzing these coupled nonlinear effects. Yet, achieving an accurate illustration of phenomena like iron curtains necessitates an in-depth comprehension of their dynamics and kinetics at the pore scale. Over the past three decades, pore-scale imaging has seen dramatic improvements, enabling the visualization of detailed pore geometry and its response to chemical reactions. Additionally, pore-scale simulations using 3-D images offer valuable datasets to enhance our comprehension of how a porous media evolves under multiple mineral reactions. Despite these significant research efforts, there are still major limitations regarding the pore-clogging phenomenon. Therefore, the following knowledge gaps and research needs were identified:
- (1)
- Driving mechanism for Fe transformation in coastal groundwater systems
The conceptual model of CUA systems has been in existence for 20 years, with the FDT recognized as an important pathway for delivering land-derived chemicals (e.g., N, P, Fe, and DOM) to nearshore environments [11]. This potentially contributes to coastal pollution, as Lyngbya blooms were reported in many parts of Queensland, Australia [41], which threaten coral populations and marine ecosystems. To date, most research efforts have been devoted to addressing physical processes in intertidal areas, with little emphasis on their coupling with geochemical processes (e.g., oxidative precipitation of Fe(II)). As these processes are of the utmost importance for indicating the role of FDT in determining the chemical speciation and solubility of elements along the flow path, it is essential to conduct field measurements of these coupling processes together and subsequently combine these collected data with field-scale RTM for calibration and validation, which may require a strong multi-disciplinary background in hydrogeology and geochemistry. Furthermore, many field studies employ the methodology of transient distributions of physio-chemical variables and chemical concentrations in the intertidal area, which may result in uncertainties regarding the effects of historical conditions. Note that coastal geochemical zonation is affected by present oceanic forces and chemical behaviors and regulated by historic driving mechanisms. Despite the challenge of acquiring initial and past conditions in the field, there is a pressing need to include temporal effects by collecting field data over more extended monitoring periods. Upon such investigation, the outcomes may assist in establishing a useful database and a unique opportunity to unravel the driving mechanisms behind Lyngbya blooms and their link with Fe(II) in coastal waters, as well as iron curtains and their environmental functionalities in coastal aquifers.
- (2)
- Physico-mathematical model linking porosity, tortuosity, and permeability
Multiple interactive mechanisms have indicated intrinsic correlations between seepage properties and porosity. When the pore matrix evolves with the oxidative precipitation of Fe(II), solid-phase precipitation can slowly reshape the pore structure and reduce the pore volume. Such change in porosity can decrease permeability and increase tortuosity, thereby slowing down groundwater flow and solute transport through porous media [37]. However, the relationships between these parameters are commonly considered independent [141], and empirical relationships (such as the best-known K–C equation) have proven valuable in interpreting observational data under unique evolving conditions. Due to hydrogeochemical reactions at the pore scale and the non-uniform distribution of minerals in pore space, these equations are inadequate for physically representing these pore-scale processes. In addition, it is not practical to rely on these equations for a process-oriented evaluation of experimental data. Taking the K–C equation as an example, its ability to predict the evolution of porosity, tortuosity, and permeability is restricted in a precipitation-dominated regime. First, its derivation was intended for a solid media with hydraulic conduits rather than natural geomaterials [34]. Second, the consideration of geometric tortuosity is not completely resolved when it evolves with porosity changes [141]. Third, it remains uncertain whether the shape factor, with its relatively wide range, is suitable for predicting the permeability of evolving porous media [158]. Because of these limitations in addressing the evolution of porous media corresponding to hydrogeochemical processes [134,182], there is an urgent need to develop a theoretical model for accurately characterizing the permeability–tortuosity–porosity relationship in a form that is both straightforward and petrophysically meaningful.
- (3)
- Integrated numerical approach for complete pore-clogging phenomena
The accumulation of Fe precipitation can induce complete pore-clogging in porous media, leading to a porosity value of zero and a complete disappearance of the aqueous phase. Such extreme cases are challenging to resolve in numerical simulations because most RTM codes set a specific porosity threshold value, below which fluid flow and solute transport are assumed not to exist [34]. In the published literature, Xie et al. [152] successfully implemented the K–C equation and Archie’s Law to address clogging-dominated problems associated with mineral dissolution–precipitation using RTM codes CrunchFlow, HP1, Pflotran, and TOUGHREACT, in which groundwater flow and reactive transport are sequentially solved. Such decoupled treatment demands minimal steps to prevent any mass balance errors at each time step. Furthermore, Pavuluri et al. [149] and Soulaine et al. [150] developed a coupled OpenFOAM-PHREEQC platform to model hydrogeochemical processes in evolving porous media at both pore scale and Darcy scale. Simulation results were compared with those obtained from MIN3P and TOUGHREACT, demonstrating the feasibility of combining multiphase flow and reactive transport with evolving porosity through a hybrid-scale method.
Simulations of cement carbonation clogging revealed a failure to replicate the outcomes observed experimentally, highlighting the necessity for a more integrated approach to refine evolving parameters [34]. Although accurate mathematical models for such phenomena are yet to be determined, it is reasonable that a methodology based on porosity alone is inadequate for fully capturing the complexities of processes occurring at both pore and continuum scales. Alternatively, it may be more appropriate to consider the surface area at pore scale. On one hand, there exists an inherent correlation between reactivity and surface area, with the latter dictating how solid particles interact with the fluid and solute [178]. On the other hand, Saripalli et al. [183] have revealed that a higher surface area results in more tortuous pathways with reduced transport properties. These factors emphasize the importance of integrating surface area onto models, rather than depending on porosity alone, to achieve improved agreement between simulation results and experimental findings.
- (4)
- Opportunities associated with non-invasive imaging techniques
In the last decade, non-invasive imaging techniques such as micro-CT and SEM have provided detailed images of pore structures without invading samples, which allows researchers to capture the intricate details of pore networks in various materials. With high-performance computing (HPC) resources, these images can serve as valuable input data for pore-scale modeling and simulation studies and can be analyzed to extract quantitative information about pore size distribution, pore connectivity, tortuosity, and other important parameters that influence fluid flow and transport processes. For example, Blunt et al. [102] illustrated the potential of pore-scale modeling based on the PNM derived from micro-CT images. Pereira Nunes et al. [184] introduced a particle-based approach for simulating the dissolution of carbonate at pore scale using micro-CT image voxels. Roslin et al. [185] implemented micro-CT and SEM techniques for structure analysis and permeability estimation of coal samples. Wang et al. [186] conducted steady-state multiphase flow experiments on continuum-scale samples with a pore-scale resolution using micro-CT. The insights gained from these studies not only contribute to a scientific understanding of porous media at the pore scale but also provide practical solutions for addressing limitations in the continuum scale, particularly when applied to evolving porous media [34]. However, present imaging techniques lack the resolution needed to adequately visualize the pore structure of fine-grained materials, particularly clays and cement with nanometric pores. Moreover, hydrogeochemical processes in porous media occur at small scales (nm~μm), while engineered RTMs are generally at large scales (m~km). As a result, continuum approaches remain promising for engineering applications in the study of groundwater flow and solute transport. Shortly, a strategy integrating micro-scale imaging and hybrid-scale modeling will offer high-resolution insights into pore-scale processes in porous media.
7. Summary and Prospects
Despite extensive research on the dynamic reaction zone caused by groundwater–seawater mixing in the intertidal area, there has been a distinct lack of research on the spatial and temporal variations of Fe precipitates by subsurface processes, which limits our understanding of iron-curtain-like features in coastal sediments. This study summarized key findings from field, laboratory, and numerical studies on the physical and geochemical processes in coastal aquifers, explored the impact of mineral precipitations on pore structure, reviewed general approaches used to describe evolving parameters (such as porosity, permeability, tortuosity, and specific surface area), and provided an outlook on opportunities to improve modeling approaches for reactive transport through porous media. Upon this review, this study addressed the challenges associated with bridging knowledge gaps between pore scale and continuum scale.
From a theoretical perspective, the oxidative precipitation of Fe(II) can indeed trigger multiple interactive mechanisms at pore scale, which in turn increases the interdependencies of parameters governing groundwater flow and solute transport at continuum scale. This complexity highlights the importance of constraining a physico-mathematical model that effectively links porosity, tortuosity, and permeability while incorporating observational data from both field and laboratory studies. Such an integrated physico-mathematical model can facilitate predictive capabilities of the behavior of porous media under different conditions, and this is essential for researchers and engineers to make informed decisions in various applications ranging from environmental remediation to subsurface energy resource management.
Additionally, hydrogeochemical processes in coastal aquifers have revealed the spatiotemporal variability of these systems corresponding to oceanic oscillations and geochemical transitions at field scale. The analysis of Fe(II) precipitation within a pore matrix has provided an instructive review of how hydrogeochemical reactions at pore scale govern the evolution of porous media, which illustrates the challenges of parametrizing evolving porous media at continuum scale. Hence, RTM can act as a valuable tool for bridging the gap between local observations and regional-scale phenomena, so that it enables the extrapolation of specific and discrete measurements onto large scales. Nevertheless, combining the pore-scale modeling approach with non-invasive imaging techniques has offered a powerful and versatile strategy for studying the processes in porous media. This synergistic approach can provide detailed insights into complicated fluid–pore–solid interactions for future studies, as well as facilitate the development of regional engineering-scale models and physio-chemical coupled models with diverse applications in science and engineering, particularly in disciplines involving complex systems like porous media, fluid dynamics, and environmental science.
Author Contributions
Conceptualization, W.C. and H.H.; methodology, W.C., H.H. and A.S.; formal analysis, W.C. and G.Y.; visualization, W.C. and G.Y.; writing—original draft preparation, W.C.; writing—review and editing, G.Y., H.H. and A.S.; supervision, H.H. and A.S.; project administration, H.H. and A.S. All authors have read and agreed to the published version of the manuscript.
Funding
This research was funded by the Australian Research Council through its Discovery Project (grant number: DP190103782).
Institutional Review Board Statement
Not applicable.
Informed Consent Statement
Not applicable.
Data Availability Statement
The original contributions presented in the study are included in the article. Further inquiries can be directed to the corresponding author.
Acknowledgments
The authors thank the School of Civil Engineering, the School of the Environment, and the Center for Advanced Imaging at the University of Queensland for their support, and the reviewers and editor for constructive comments on this paper.
Conflicts of Interest
The authors declare no conflicts of interest.
References
- LePan, N.; Venditti, B. Visualizing the Abundance of Elements in the Earth’s Crust. Elements, 6 December 2021. [Google Scholar]
- Cornell, R.; Schwertmann, U. The Iron Oxides: Structure, Properties, Reactions, Occurrences and Uses; Wiley-VCH Verlag GmbH & Co. KGaA: Weinheim, Germany, 2003; ISBN 978-3-527-30274-1. [Google Scholar]
- Banfield, J.F.; Zhang, H. Nanoparticles in the Environment. Rev. Mineral. Geochem. 2001, 44, 1–58. [Google Scholar] [CrossRef]
- Larrahondo, J.M.; Burns, S.E. Laboratory-Prepared Iron Oxide Coatings on Sands: Surface Characterization and Strength Parameters. J. Geotech. Geoenviron. Eng. 2014, 140, 4013052. [Google Scholar] [CrossRef]
- Viscarra Rossel, R.A.; Bui, E.N.; de Caritat, P.; McKenzie, N.J. Mapping Iron Oxides and the Color of Australian Soil Using Visible–near-Infrared Reflectance Spectra. J. Geophys. Res. 2010, 115, F04031. [Google Scholar] [CrossRef]
- Tenthorey, E.; Fitzgerald, J. Feedbacks between Deformation, Hydrothermal Reaction and Permeability Evolution in the Crust: Experimental Insights. Earth Planet. Sci. Lett. 2006, 247, 117–129. [Google Scholar] [CrossRef]
- Brovelli, A.; Malaguerra, F.; Barry, D.A. Bioclogging in Porous Media: Model Development and Sensitivity to Initial Conditions. Environ. Model. Softw. 2009, 24, 611–626. [Google Scholar] [CrossRef]
- Chagneau, A.; Claret, F.; Enzmann, F.; Kersten, M.; Heck, S.; Madé, B.; Schäfer, T. Mineral Precipitation-Induced Porosity Reduction and Its Effect on Transport Parameters in Diffusion-Controlled Porous Media. Geochem. Trans. 2015, 16, 13. [Google Scholar] [CrossRef] [PubMed]
- Gaucher, E.C.; Blanc, P. Cement/Clay Interactions—A Review: Experiments, Natural Analogues, and Modeling. Waste Manag. 2006, 26, 776–788. [Google Scholar] [CrossRef]
- Seigneur, N.; Lagneau, V.; Corvisier, J.; Dauzères, A. Recoupling Flow and Chemistry in Variably Saturated Reactive Transport Modelling—An Algorithm to Accurately Couple the Feedback of Chemistry on Water Consumption, Variable Porosity and Flow. Adv. Water Resour. 2018, 122, 355–366. [Google Scholar] [CrossRef]
- Robinson, C.E.; Xin, P.; Santos, I.R.; Charette, M.A.; Li, L.; Barry, D.A. Groundwater Dynamics in Subterranean Estuaries of Coastal Unconfined Aquifers: Controls on Submarine Groundwater Discharge and Chemical Inputs to the Ocean. Adv. Water Resour. 2018, 115, 315–331. [Google Scholar] [CrossRef]
- Charette, M.A.; Sholkovitz, E.R. Oxidative Precipitation of Groundwater-Derived Ferrous Iron in the Subterranean Estuary of a Coastal Bay. Geophys. Res. Lett. 2002, 29, 85-1–85-4. [Google Scholar] [CrossRef]
- Spiteri, C.; Regnier, P.; Slomp, C.P.; Charette, M.A. pH-Dependent Iron Oxide Precipitation in a Subterranean Estuary. J. Geochem. Explor. 2006, 88, 399–403. [Google Scholar] [CrossRef]
- Lalonde, K.; Mucci, A.; Ouellet, A.; Gélinas, Y. Preservation of Organic Matter in Sediments Promoted by Iron. Nature 2012, 483, 198–200. [Google Scholar] [CrossRef] [PubMed]
- Linkhorst, A.; Dittmar, T.; Waska, H. Molecular Fractionation of Dissolved Organic Matter in a Shallow Subterranean Estuary: The Role of the Iron Curtain. Environ. Sci. Technol. 2017, 51, 1312–1320. [Google Scholar] [CrossRef] [PubMed]
- Zhang, D.; Guo, H.; Xiu, W.; Ni, P.; Zheng, H.; Wei, C. In-Situ Mobilization and Transformation of Iron Oxides-Adsorbed Arsenate in Natural Groundwater. J. Hazard. Mater. 2017, 321, 228–237. [Google Scholar] [CrossRef] [PubMed]
- Reckhardt, A.; Beck, M.; Seidel, M.; Riedel, T.; Wehrmann, A.; Bartholomä, A.; Schnetger, B.; Dittmar, T.; Brumsack, H.-J. Carbon, Nutrient and Trace Metal Cycling in Sandy Sediments: A Comparison of High-Energy Beaches and Backbarrier Tidal Flats. Estuar. Coast. Shelf Sci. 2015, 159, 1–14. [Google Scholar] [CrossRef]
- Liu, Y.; Jiao, J.J.; Luo, X. Effects of Inland Water Level Oscillation on Groundwater Dynamics and Land-Sourced Solute Transport in a Coastal Aquifer. Coast. Eng. 2016, 114, 347–360. [Google Scholar] [CrossRef]
- Michael, H.A.; Mulligan, A.E.; Harvey, C.F. Seasonal Oscillations in Water Exchange between Aquifers and the Coastal Ocean. Nature 2005, 436, 1145–1148. [Google Scholar] [CrossRef]
- Gonneea, M.E.; Mulligan, A.E.; Charette, M.A. Climate-driven Sea Level Anomalies Modulate Coastal Groundwater Dynamics and Discharge. Geophys. Res. Lett. 2013, 40, 2701–2706. [Google Scholar] [CrossRef]
- Roy, M.; Martin, J.B.; Cherrier, J.; Cable, J.E.; Smith, C.G. Influence of Sea Level Rise on Iron Diagenesis in an East Florida Subterranean Estuary. Geochim. Cosmochim. Acta 2010, 74, 5560–5573. [Google Scholar] [CrossRef]
- Li, L.; Barry, D.A.; Stagnitti, F.; Parlange, J.-Y. Submarine Groundwater Discharge and Associated Chemical Input to a Coastal Sea. Water Resour. Res. 1999, 35, 3253–3259. [Google Scholar] [CrossRef]
- Robinson, C.; Li, L.; Barry, D.A. Effect of Tidal Forcing on a Subterranean Estuary. Adv. Water Resour. 2007, 30, 851–865. [Google Scholar] [CrossRef]
- Xin, P.; Robinson, C.; Li, L.; Barry, D.A.; Bakhtyar, R. Effects of Wave Forcing on a Subterranean Estuary. Water Resour. Res. 2010, 46, W12505. [Google Scholar] [CrossRef]
- Shen, C.; Zhang, C.; Xin, P.; Kong, J.; Li, L. Salt Dynamics in Coastal Marshes: Formation of Hypersaline Zones. Water Resour. Res. 2018, 54, 3259–3276. [Google Scholar] [CrossRef]
- Anwar, N.; Robinson, C.; Barry, D.A. Influence of Tides and Waves on the Fate of Nutrients in a Nearshore Aquifer: Numerical Simulations. Adv. Water Resour. 2014, 73, 203–213. [Google Scholar] [CrossRef]
- O’Connor, A.E.; Luek, J.L.; McIntosh, H.; Beck, A.J. Geochemistry of Redox-Sensitive Trace Elements in a Shallow Subterranean Estuary. Mar. Chem. 2015, 172, 70–81. [Google Scholar] [CrossRef]
- Paffrath, R.; Pahnke, K.; Behrens, M.K.; Reckhardt, A.; Ehlert, C.; Schnetger, B.; Brumsack, H.-J. Rare Earth Element Behavior in a Sandy Subterranean Estuary of the Southern North Sea. Front. Mar. Sci. 2020, 7, 424. [Google Scholar] [CrossRef]
- Porubsky, W.P.; Weston, N.B.; Moore, W.S.; Ruppel, C.; Joye, S.B. Dynamics of Submarine Groundwater Discharge and Associated Fluxes of Dissolved Nutrients, Carbon, and Trace Gases to the Coastal Zone (Okatee River Estuary, South Carolina). Geochim. Cosmochim. Acta 2014, 131, 81–97. [Google Scholar] [CrossRef]
- Trezzi, G.; Garcia-Orellana, J.; Rodellas, V.; Santos-Echeandia, J.; Tovar-Sánchez, A.; Garcia-Solsona, E.; Masqué, P. Submarine Groundwater Discharge: A Significant Source of Dissolved Trace Metals to the North Western Mediterranean Sea. Mar. Chem. 2016, 186, 90–100. [Google Scholar] [CrossRef]
- Cao, W.; Hofmann, H.; Yan, G.; Scheuermann, A. Porewater Exchange and Iron Transformation in a Coastal Groundwater System: A Field Investigation, Driving Mechanisms Analysis, and Conceptual Model. Front. Mar. Sci.-Sec. Coast. Ocean Process. 2024, 11, 1385517. [Google Scholar] [CrossRef]
- Shokir, E.M.E.-M.; Alsughayer, A.A.; Al-Ateeq, A. Permeability Estimation from Well Log Responses. J. Can. Pet. Technol. 2006, 45, PETSOC-06-11-05. [Google Scholar] [CrossRef]
- Zhao, J.; Kang, Q.; Yao, J.; Viswanathan, H.; Pawar, R.; Zhang, L.; Sun, H. The Effect of Wettability Heterogeneity on Relative Permeability of Two-Phase Flow in Porous Media: A Lattice Boltzmann Study. Water Resour. Res. 2018, 54, 1295–1311. [Google Scholar] [CrossRef]
- Seigneur, N.; Mayer, K.U.; Steefel, C.I. Reactive Transport in Evolving Porous Media. Rev. Mineral. Geochem. 2019, 85, 197–238. [Google Scholar] [CrossRef]
- Noiriel, C.; Luquot, L.; Madé, B.; Raimbault, L.; Gouze, P.; Van Der Lee, J. Changes in Reactive Surface Area during Limestone Dissolution: An Experimental and Modelling Study. Chem. Geol. 2009, 265, 160–170. [Google Scholar] [CrossRef]
- Noiriel, C. Resolving Time-Dependent Evolution of Pore-Scale Structure, Permeability and Reactivity Using X-Ray Microtomography. Rev. Mineral. Geochem. 2015, 80, 247–285. [Google Scholar] [CrossRef]
- Jin, L.; Mathur, R.; Rother, G.; Cole, D.; Bazilevskaya, E.; Williams, J.; Carone, A.; Brantley, S. Evolution of Porosity and Geochemistry in Marcellus Formation Black Shale during Weathering. Chem. Geol. 2013, 356, 50–63. [Google Scholar] [CrossRef]
- Ko, L.T.; Ruppel, S.C.; Loucks, R.G.; Hackley, P.C.; Zhang, T.; Shao, D. Pore-Types and Pore-Network Evolution in Upper Devonian-Lower Mississippian Woodford and Mississippian Barnett Mudstones: Insights from Laboratory Thermal Maturation and Organic Petrology. Int. J. Coal Geol. 2018, 190, 3–28. [Google Scholar] [CrossRef]
- Wang, J.; Sickinger, M.; Ciobota, V.; Herrmann, M.; Rasch, H.; Rösch, P.; Popp, J.; Küsel, K. Revealing the Microbial Community Structure of Clogging Materials in Dewatering Wells Differing in Physico-Chemical Parameters in an Open-Cast Mining Area. Water Res. 2014, 63, 222–233. [Google Scholar] [CrossRef]
- Rose, A.L. Waite Effect of Dissolved Natural Organic Matter on the Kinetics of Ferrous Iron Oxygenation in Seawater. Environ. Sci. Technol. 2003, 37, 4877–4886. [Google Scholar] [CrossRef]
- O’Neil, J.M.; Dennison, W.C. Discerning the Causes of Toxic Cyanobacteria (Lyngbya majuscula) Blooms in Moreton Bay, Australia. In Aquatic Microbial Ecology and Biogeochemistry: A Dual Perspective; Glibert, P.M., Kana, T.M., Eds.; Springer International Publishing: Cham, Switzerland, 2016; pp. 261–272. ISBN 978-3-319-30257-7. [Google Scholar]
- Ahern, K.S.; Udy, J.W.; Pointon, S.M. Investigating the Potential for Groundwater from Different Vegetation, Soil and Landuses to Stimulate Blooms of the Cyanobacterium, Lyngbya majuscula, in Coastal Waters. Mar. Freshw. Res. 2006, 57, 177. [Google Scholar] [CrossRef]
- Manson, F.J.; Loneragan, N.R.; Phinn, S.R. Spatial and Temporal Variation in Distribution of Mangroves in Moreton Bay, Subtropical Australia: A Comparison of Pattern Metrics and Change Detection Analyses Based on Aerial Photographs. Estuar. Coast. Shelf Sci. 2003, 57, 653–666. [Google Scholar] [CrossRef]
- Albert, S.; O’Neil, J.M.; Udy, J.W.; Ahern, K.S.; O’Sullivan, C.M.; Dennison, W.C. Blooms of the Cyanobacterium Lyngbya majuscula in Coastal Queensland, Australia: Disparate Sites, Common Factors. Mar. Pollut. Bull. 2005, 51, 428–437. [Google Scholar] [CrossRef] [PubMed]
- Hanington, P.; Rose, A.; Johnstone, R. The Potential of Benthic Iron and Phosphorus Fluxes to Support the Growth of a Bloom Forming Toxic Cyanobacterium Lyngbya majuscula, Moreton Bay, Australia. Mar. Freshw. Res. 2016, 67, 1918. [Google Scholar] [CrossRef]
- Robinson, C.; Gibbes, B.; Li, L. Driving Mechanisms for Groundwater Flow and Salt Transport in a Subterranean Estuary. Geophys. Res. Lett. 2006, 33, L03402. [Google Scholar] [CrossRef]
- Gibbes, B.; Robinson, C.; Carey, H.; Li, L.; Lockington, D. Tidally Driven Pore Water Exchange in Offshore Intertidal Sandbanks: Part I. Field Measurements. Estuar. Coast. Shelf Sci. 2008, 79, 121–132. [Google Scholar] [CrossRef]
- Kraal, P.; Burton, E.D.; Rose, A.L.; Kocar, B.D.; Lockhart, R.S.; Grice, K.; Bush, R.T.; Tan, E.; Webb, S.M. Sedimentary Iron–Phosphorus Cycling under Contrasting Redox Conditions in a Eutrophic Estuary. Chem. Geol. 2015, 392, 19–31. [Google Scholar] [CrossRef]
- Chambers, R.M.; Odum, W.E. Porewater Oxidation, Dissolved Phosphate and the Iron Curtain: Iron-Phosphorus Relations in Tidal Freshwater Marshes. Biogeochemistry 1990, 10, 37–52. [Google Scholar] [CrossRef]
- Mayer, T.D.; Jarrell, W.M. Formation and Stability of Iron(II) Oxidation Products under Natural Concentrations of Dissolved Silica. Water Res. 1996, 30, 1208–1214. [Google Scholar] [CrossRef]
- Niencheski, L.F.H.; Windom, H.L.; Moore, W.S.; Jahnke, R.A. Submarine Groundwater Discharge of Nutrients to the Ocean along a Coastal Lagoon Barrier, Southern Brazil. Mar. Chem. 2007, 106, 546–561. [Google Scholar] [CrossRef]
- Windom, H.; Niencheski, F. Biogeochemical Processes in a Freshwater–Seawater Mixing Zone in Permeable Sediments along the Coast of Southern Brazil. Mar. Chem. 2003, 83, 121–130. [Google Scholar] [CrossRef]
- McAllister, S.M.; Barnett, J.M.; Heiss, J.W.; Findlay, A.J.; MacDonald, D.J.; Dow, C.L.; Luther, G.W.; Michael, H.A.; Chan, C.S. Dynamic Hydrologic and Biogeochemical Processes Drive Microbially Enhanced Iron and Sulfur Cycling within the Intertidal Mixing Zone of a Beach Aquifer: Fe and S Cycling in a Beach Aquifer. Limnol. Oceanogr. 2015, 60, 329–345. [Google Scholar] [CrossRef]
- Sawyer, A.H.; Michael, H.A.; Schroth, A.W. From Soil to Sea: The Role of Groundwater in Coastal Critical Zone Processes. WIREs Water 2016, 3, 706–726. [Google Scholar] [CrossRef]
- Liu, Y.; Jiao, J.J.; Liang, W.; Kuang, X. Hydrogeochemical Characteristics in Coastal Groundwater Mixing Zone. Appl. Geochem. 2017, 85, 49–60. [Google Scholar] [CrossRef]
- Lipka, M.; Böttcher, M.E.; Wu, Z.; Sültenfuß, J.; Jenner, A.-K.; Westphal, J.; Dellwig, O.; Escher, P.; Schmiedinger, I.; Winde, V.; et al. Ferruginous Groundwaters as a Source of P, Fe, and DIC for Coastal Waters of the Southern Baltic Sea: (Isotope) Hydrobiogeochemistry and the Role of an Iron Curtain. E3S Web Conf. 2018, 54, 19. [Google Scholar] [CrossRef]
- Emmenegger, L.; King, D.W.; Sigg, L.; Sulzberger, B. Oxidation Kinetics of Fe(II) in a Eutrophic Swiss Lake. Environ. Sci. Technol. 1998, 32, 2990–2996. [Google Scholar] [CrossRef]
- Liang, L.; McNabb, J.A.; Paulk, J.M.; Gu, B.; McCarthy, J.F. Kinetics of Iron(II) Oxygenation at Low Partial Pressure of Oxygen in the Presence of Natural Organic Matter. Environ. Sci. Technol. 1993, 27, 1864–1870. [Google Scholar] [CrossRef]
- Santana-Casiano, J.M.; Gonzalez-Davila, M.; Millero, F.J. The Effect of Organic Compounds in the Oxidation Kinetics of FežII. Mar. Chem. 2000, 70, 211–222. [Google Scholar] [CrossRef]
- Rose, A.L.; Waite, T.D. Kinetic Model for Fe(II) Oxidation in Seawater in the Absence and Presence of Natural Organic Matter. Environ. Sci. Technol. 2002, 36, 433–444. [Google Scholar] [CrossRef] [PubMed]
- Rose, A.L.; Waite, T.D. Kinetics of Hydrolysis and Precipitation of Ferric Iron in Seawater. Environ. Sci. Technol. 2003, 37, 3897–3903. [Google Scholar] [CrossRef] [PubMed]
- Garg, S.; Jiang, C.; Waite, T.D. Impact of pH on Iron Redox Transformations in Simulated Freshwaters Containing Natural Organic Matter. Environ. Sci. Technol. 2018, 52, 13184–13194. [Google Scholar] [CrossRef]
- Zhang, Q.; Volker, R.E.; Lockington, D.A. Experimental Investigation of Contaminant Transport in Coastal Groundwater. Adv. Environ. Res. 2002, 6, 229–237. [Google Scholar] [CrossRef]
- Kuan, W.K.; Xin, P.; Jin, G.; Robinson, C.E.; Gibbes, B.; Li, L. Combined Effect of Tides and Varying Inland Groundwater Input on Flow and Salinity Distribution in Unconfined Coastal Aquifers. Water Resour. Res. 2019, 55, 8864–8880. [Google Scholar] [CrossRef]
- Mo, Y.; Jin, G.; Zhang, C.; Xu, J.; Tang, H.; Shen, C.; Scheuermann, A.; Li, L. Combined Effect of Inland Groundwater Input and Tides on Flow and Salinization in the Coastal Reservoir and Adjacent Aquifer. J. Hydrol. 2021, 600, 126575. [Google Scholar] [CrossRef]
- Banzhaf, S.; Hebig, K.H. Use of Column Experiments to Investigate the Fate of Organic Micropollutants—A Review. Hydrol. Earth Syst. Sci. 2016, 20, 3719–3737. [Google Scholar] [CrossRef]
- Sinke, A.J.C.; Dury, O.; Zobrist, J. Effects of a Fluctuating Water Table: Column Study on Redox Dynamics and Fate of Some Organic Pollutants. J. Contam. Hydrol. 1998, 33, 231–246. [Google Scholar] [CrossRef]
- Schoen, R.; Gaudet, J.P.; Bariac, T. Preferential Flow and Solute Transport in a Large Lysimeter, under Controlled Boundary Conditions. J. Hydrol. 1999, 215, 70–81. [Google Scholar] [CrossRef]
- Scheytt, T.; Mersmann, P.; Leidig, M.; Pekdeger, A.; Heberer, T. Transport of Pharmaceutically Active Compounds in Saturated Laboratory Columns. Ground Water 2004, 42, 767–773. [Google Scholar] [CrossRef]
- López-Blanco, M.C.; Cancho-Grande, B.; Simal-Gándara, J.; López-Periago, E.; Arias-Estévez, M. Transport of Commercial Endosulfan through a Column of Aggregated Vineyard Soil by a Water Flux Simulating Field Conditions. J. Agric. Food Chem. 2005, 53, 6738–6743. [Google Scholar] [CrossRef]
- Amos, R.T.; Mayer, K.U.; Blowes, D.W.; Ptacek, C.J. Reactive Transport Modeling of Column Experiments for the Remediation of Acid Mine Drainage. Environ. Sci. Technol. 2004, 38, 3131–3138. [Google Scholar] [CrossRef]
- Bradford, S.A.; Bettahar, M. Concentration Dependent Transport of Colloids in Saturated Porous Media. J. Contam. Hydrol. 2006, 82, 99–117. [Google Scholar] [CrossRef]
- Siemens, J.; Huschek, G.; Walshe, G.; Siebe, C.; Kasteel, R.; Wulf, S.; Clemens, J.; Kaupenjohann, M. Transport of Pharmaceuticals in Columns of a Wastewater-Irrigated Mexican Clay Soil. J. Environ. Qual. 2010, 39, 1201–1210. [Google Scholar] [CrossRef]
- Nay, M.; Snozzi, M.; Zehnder, A.J.B. Fate and Behavior of Organic Compounds in an Artificial Saturated Subsoil under Controlled Redox Conditions: The Sequential Soil Column System. Biodegradation 1999, 10, 75–82. [Google Scholar] [CrossRef] [PubMed]
- Alotaibi, M.D.; Patterson, B.M.; McKinley, A.J.; Reeder, A.Y.; Furness, A.J.; Donn, M.J. Fate of Benzotriazole and 5-Methylbenzotriazole in Recycled Water Recharged into an Anaerobic Aquifer: Column Studies. Water Res. 2015, 70, 184–195. [Google Scholar] [CrossRef] [PubMed]
- Banzhaf, S.; Nödler, K.; Licha, T.; Krein, A.; Scheytt, T. Redox-Sensitivity and Mobility of Selected Pharmaceutical Compounds in a Low Flow Column Experiment. Sci. Total Environ. 2012, 438, 113–121. [Google Scholar] [CrossRef] [PubMed]
- Unold, M.; Kasteel, R.; Groeneweg, J.; Vereecken, H. Transport and Transformation of Sulfadiazine in Soil Columns Packed with a Silty Loam and a Loamy Sand. J. Contam. Hydrol. 2009, 103, 38–47. [Google Scholar] [CrossRef] [PubMed]
- Gruenheid, S.; Huebner, U.; Jekel, M. Impact of Temperature on Biodegradation of Bulk and Trace Organics during Soil Passage in an Indirect Reuse System. Water Sci. Technol. 2008, 57, 987–994. [Google Scholar] [CrossRef] [PubMed]
- Hebig, K.H.; Groza, L.G.; Sabourin, M.J.; Scheytt, T.J.; Ptacek, C.J. Transport Behavior of the Pharmaceutical Compounds Carbamazepine, Sulfamethoxazole, Gemfibrozil, Ibuprofen, and Naproxen, and the Lifestyle Drug Caffeine, in Saturated Laboratory Columns. Sci. Total Environ. 2017, 590–591, 708–719. [Google Scholar] [CrossRef] [PubMed]
- Yao, Y.; Gao, B.; Chen, H.; Jiang, L.; Inyang, M.; Zimmerman, A.R.; Cao, X.; Yang, L.; Xue, Y.; Li, H. Adsorption of Sulfamethoxazole on Biochar and Its Impact on Reclaimed Water Irrigation. J. Hazard. Mater. 2012, 209–210, 408–413. [Google Scholar] [CrossRef]
- Burke, V.; Greskowiak, J.; Asmuß, T.; Bremermann, R.; Taute, T.; Massmann, G. Temperature Dependent Redox Zonation and Attenuation of Wastewater-Derived Organic Micropollutants in the Hyporheic Zone. Sci. Total Environ. 2014, 482–483, 53–61. [Google Scholar] [CrossRef] [PubMed]
- Fan, Z.; Casey, F.X.M.; Hakk, H.; Larsen, G.L.; Khan, E. Sorption, Fate, and Mobility of Sulfonamides in Soils. Water. Air. Soil Pollut. 2011, 218, 49–61. [Google Scholar] [CrossRef]
- Salvia, M.-V.; Experton, J.; Geandel, C.; Cren-Olivé, C.; Vulliet, E. Fate of Pharmaceutical Compounds and Steroid Hormones in Soil: Study of Transfer and Degradation in Soil Columns. Environ. Sci. Pollut. Res. 2014, 21, 10525–10535. [Google Scholar] [CrossRef]
- Bertelkamp, C.; Reungoat, J.; Cornelissen, E.R.; Singhal, N.; Reynisson, J.; Cabo, A.J.; van der Hoek, J.P.; Verliefde, A.R.D. Sorption and Biodegradation of Organic Micropollutants during River Bank Filtration: A Laboratory Column Study. Water Res. 2014, 52, 231–241. [Google Scholar] [CrossRef] [PubMed]
- Teijón, G.; Candela, L.; Šimůnek, J.; Tamoh, K.; Valdes-Abellán, J. Fate and Transport of Naproxen in a Sandy Aquifer Material: Saturated Column Studies and Model Evaluation. Soil Sediment Contam. Int. J. 2014, 23, 736–750. [Google Scholar] [CrossRef]
- Cordy, G.E.; Duran, N.L.; Bouwer, H.; Rice, R.C.; Furlong, E.T.; Zaugg, S.D.; Meyer, M.T.; Barber, L.B.; Kolpin, D.W. Do Pharmaceuticals, Pathogens, and Other Organic Waste Water Compounds Persist When Waste Water Is Used for Recharge? Groundw. Monit. Remediat. 2004, 24, 58–69. [Google Scholar] [CrossRef]
- Lewis, J.; Sjöstrom, J. Optimizing the Experimental Design of Soil Columns in Saturated and Unsaturated Transport Experiments. J. Contam. Hydrol. 2010, 115, 1–13. [Google Scholar] [CrossRef] [PubMed]
- De Wilde, T.; Mertens, J.; Šimunek, J.; Sniegowksi, K.; Ryckeboer, J.; Jaeken, P.; Springael, D.; Spanoghe, P. Characterizing Pesticide Sorption and Degradation in Microscale Biopurification Systems Using Column Displacement Experiments. Environ. Pollut. 2009, 157, 463–473. [Google Scholar] [CrossRef] [PubMed]
- Müller, B.; Scheytt, T.; Grützmacher, G. Transport of Primidone, Carbamazepine, and Sulfamethoxazole in Thermally Treated Sediments—Laboratory Column Experiments. J. Soils Sediments 2013, 13, 953–965. [Google Scholar] [CrossRef]
- Rodríguez-Cruz, M.S.; Sánchez-Martín, M.J.; Andrades, M.S.; Sánchez-Camazano, M. Retention of Pesticides in Soil Columns Modified in Situ and Ex Situ with a Cationic Surfactant. Sci. Total Environ. 2007, 378, 104–108. [Google Scholar] [CrossRef] [PubMed]
- Allred, B.; Brown, G.O.; Brandvold, L.A. Enhanced Animal Waste Management through Application of Surfactants to Soil Material: Laboratory Feasibility Testing. Trans. ASAE 2001, 44, 513–524. [Google Scholar] [CrossRef]
- Massmann, G.; Dünnbier, U.; Heberer, T.; Taute, T. Behaviour and Redox Sensitivity of Pharmaceutical Residues during Bank Filtration–Investigation of Residues of Phenazone-Type Analgesics. Chemosphere 2008, 71, 1476–1485. [Google Scholar] [CrossRef]
- Persson, Y.; Hemström, K.; Öberg, L.; Tysklind, M.; Enell, A. Use of a Column Leaching Test to Study the Mobility of Chlorinated HOCs from a Contaminated Soil and the Distribution of Compounds between Soluble and Colloid Phases. Chemosphere 2008, 71, 1035–1042. [Google Scholar] [CrossRef]
- Salem Attia, T.M.; Hu, X.L.; Yin, D.Q. Synthesized Magnetic Nanoparticles Coated Zeolite for the Adsorption of Pharmaceutical Compounds from Aqueous Solution Using Batch and Column Studies. Chemosphere 2013, 93, 2076–2085. [Google Scholar] [CrossRef] [PubMed]
- Murillo-Torres, R.; Durán-Álvarez, J.C.; Prado, B.; Jiménez-Cisneros, B.E. Sorption and Mobility of Two Micropollutants in Three Agricultural Soils: A Comparative Analysis of Their Behavior in Batch and Column Experiments. Geoderma 2012, 189–190, 462–468. [Google Scholar] [CrossRef]
- Greenhagen, A.M.; Lenczewski, M.E.; Carroll, M. Natural Attenuation of Pharmaceuticals and an Illicit Drug in a Laboratory Column Experiment. Chemosphere 2014, 115, 13–19. [Google Scholar] [CrossRef] [PubMed]
- Spiteri, C.; Slomp, C.P.; Tuncay, K.; Meile, C. Modeling Biogeochemical Processes in Subterranean Estuaries: Effect of Flow Dynamics and Redox Conditions on Submarine Groundwater Discharge of Nutrients: Biochemistry of Subterranean Estuaries. Water Resour. Res. 2008, 44, W02430. [Google Scholar] [CrossRef]
- Pham, A.N.; Rose, A.L.; Feitz, A.J.; Waite, T.D. Kinetics of Fe(III) Precipitation in Aqueous Solutions at pH 6.0–9.5 and 25 °C. Geochim. Cosmochim. Acta 2006, 70, 640–650. [Google Scholar] [CrossRef]
- Zhang, Y.; Li, L.; Erler, D.V.; Santos, I.; Lockington, D. Effects of Alongshore Morphology on Groundwater Flow and Solute Transport in a Nearshore Aquifer. Water Resour. Res. 2016, 52, 990–1008. [Google Scholar] [CrossRef]
- Wang, T.; Zhang, C.; Ma, Y.; Hofmann, H.; Li, C.; Zhao, Z. Numerical Analysis of the Abiotic Formation and Distribution of the “Iron Curtain” in Subterranean Estuaries. Environ. Model. Softw. 2024, 171, 105894. [Google Scholar] [CrossRef]
- Werth, C.J.; Zhang, C.; Brusseau, M.L.; Oostrom, M.; Baumann, T. A Review of Non-Invasive Imaging Methods and Applications in Contaminant Hydrogeology Research. J. Contam. Hydrol. 2010, 113, 1–24. [Google Scholar] [CrossRef] [PubMed]
- Blunt, M.J.; Bijeljic, B.; Dong, H.; Gharbi, O.; Iglauer, S.; Mostaghimi, P.; Paluszny, A.; Pentland, C. Pore-Scale Imaging and Modelling. Adv. Water Resour. 2013, 51, 197–216. [Google Scholar] [CrossRef]
- Zhao, Z.; Zhang, C.; Cao, W.; Hofmann, H.; Wang, T.; Li, L. Oxidative Precipitation of Fe(II) in Porous Media: Laboratory Experiment and Numerical Simulation. ACS EST Water 2023, 3, 963–973. [Google Scholar] [CrossRef]
- Liu, J.; Aruguete, D.M.; Jinschek, J.R.; Donald Rimstidt, J.; Hochella, M.F. The Non-Oxidative Dissolution of Galena Nanocrystals: Insights into Mineral Dissolution Rates as a Function of Grain Size, Shape, and Aggregation State. Geochim. Cosmochim. Acta 2008, 72, 5984–5996. [Google Scholar] [CrossRef]
- Deng, H.; Molins, S.; Trebotich, D.; Steefel, C.; DePaolo, D. Pore-Scale Numerical Investigation of the Impacts of Surface Roughness: Upscaling of Reaction Rates in Rough Fractures. Geochim. Cosmochim. Acta 2018, 239, 374–389. [Google Scholar] [CrossRef]
- Jung, H.; Navarre-Sitchler, A. Physical Heterogeneity Control on Effective Mineral Dissolution Rates. Geochim. Cosmochim. Acta 2018, 227, 246–263. [Google Scholar] [CrossRef]
- Algive, L.; Bekri, S.; Vizika, O. Pore-Network Modeling Dedicated to the Determination of the Petrophysical-Property Changes in the Presence of Reactive Fluid. SPE J. 2010, 15, 618–633. [Google Scholar] [CrossRef]
- Min, T.; Gao, Y.; Chen, L.; Kang, Q.; Tao, W. Changes in Porosity, Permeability and Surface Area during Rock Dissolution: Effects of Mineralogical Heterogeneity. Int. J. Heat Mass Transf. 2016, 103, 900–913. [Google Scholar] [CrossRef]
- Kang, Q.; Tsimpanogiannis, I.N.; Zhang, D.; Lichtner, P.C. Numerical Modeling of Pore-Scale Phenomena during CO2 Sequestration in Oceanic Sediments. Fuel Process. Technol. 2005, 86, 1647–1665. [Google Scholar] [CrossRef]
- Tartakovsky, A.M.; Meakin, P.; Scheibe, T.D.; Wood, B.D. A Smoothed Particle Hydrodynamics Model for Reactive Transport and Mineral Precipitation in Porous and Fractured Porous Media. Water Resour. Res. 2007, 43, 2005WR004770. [Google Scholar] [CrossRef]
- Tartakovsky, A.M.; Redden, G.; Lichtner, P.C.; Scheibe, T.D.; Meakin, P. Mixing-induced Precipitation: Experimental Study and Multiscale Numerical Analysis. Water Resour. Res. 2008, 44, 2006WR005725. [Google Scholar] [CrossRef]
- Fox, D.T.; Guo, L.; Fujita, Y.; Huang, H.; Redden, G. Experimental and Numerical Analysis of Parallel Reactant Flow and Transverse Mixing with Mineral Precipitation in Homogeneous and Heterogeneous Porous Media. Transp. Porous Media 2016, 111, 605–626. [Google Scholar] [CrossRef]
- Garcia-Rios, M.; Luquot, L.; Soler, J.M.; Cama, J. The Role of Mineral Heterogeneity on the Hydrogeochemical Response of Two Fractured Reservoir Rocks in Contact with Dissolved CO2. Appl. Geochem. 2017, 84, 202–217. [Google Scholar] [CrossRef]
- Rajyaguru, A.; L’Hôpital, E.; Savoye, S.; Wittebroodt, C.; Bildstein, O.; Arnoux, P.; Detilleux, V.; Fatnassi, I.; Gouze, P.; Lagneau, V. Experimental Characterization of Coupled Diffusion Reaction Mechanisms in Low Permeability Chalk. Chem. Geol. 2019, 503, 29–39. [Google Scholar] [CrossRef]
- Missimer, T.; Lopez, O. Laboratory Measurement of Total Porosity in Unconsolidated Quartz Sand by Two Integrated Methods. J. Geol. Geophys. 2018, 7, 5. [Google Scholar] [CrossRef]
- Steefel, C.I.; Appelo, C.A.J.; Arora, B.; Jacques, D.; Kalbacher, T.; Kolditz, O.; Lagneau, V.; Lichtner, P.C.; Mayer, K.U.; Meeussen, J.C.L.; et al. Reactive Transport Codes for Subsurface Environmental Simulation. Comput. Geosci. 2015, 19, 445–478. [Google Scholar] [CrossRef]
- Billen, M. Darcy’s Law-Flow in a Porous Medium. 2021. Available online: https://geo.libretexts.org/Courses/University_of_California_Davis/GEL_056%3A_Introduction_to_Geophysics/Geophysics_is_everywhere_in_geology.../02%3A_Diffusion_and_Darcy%27s_Law/2.05%3A_Darcy%27s_Law_-_Flow_in_a_Porous_Medium#title (accessed on 29 March 2024).
- Mitchell, J.K.; Soga, K. Fundamentals of Soil Behavior; John Wiley & Sons, Inc.: Hoboken, NJ, USA, 2005; ISBN 978-0-471-46302-7. [Google Scholar]
- Yan, G.; Ma, Y.; Scheuermann, A.; Li, L. The Hydraulic Properties of Aquabeads Considering Forchheimer Flow and Local Heterogeneity. Geotech. Test. J. 2022, 45, 20210234. [Google Scholar] [CrossRef]
- Sandoval, G.F.B.; Galobardes, I.; Teixeira, R.S.; Toralles, B.M. Comparison between the Falling Head and the Constant Head Permeability Tests to Assess the Permeability Coefficient of Sustainable Pervious Concretes. Case Stud. Constr. Mater. 2017, 7, 317–328. [Google Scholar] [CrossRef]
- Chandrappa, A.K.; Biligiri, K.P. Comprehensive Investigation of Permeability Characteristics of Pervious Concrete: A Hydrodynamic Approach. Constr. Build. Mater. 2016, 123, 627–637. [Google Scholar] [CrossRef]
- Neithalath, N.; Sumanasooriya, M.S.; Deo, O. Characterizing Pore Volume, Sizes, and Connectivity in Pervious Concretes for Permeability Prediction. Mater. Charact. 2010, 61, 802–813. [Google Scholar] [CrossRef]
- Odong, J. Evaluation of Empirical Formulae for Determination of Hydraulic Conductivity Based on Grain-Size Analysis. J. Am. Sci. 2008, 4, 56–60. [Google Scholar]
- Liou, C.P. Limitations and Proper Use of the Hazen-Williams Equation. J. Hydraul. Eng. 1998, 124, 951–954. [Google Scholar] [CrossRef]
- Carrier, W.D. Goodbye, Hazen; Hello, Kozeny-Carman. J. Geotech. Geoenviron. Eng. 2003, 129, 1054–1056. [Google Scholar] [CrossRef]
- Rahman, M.M.; Alim, M.A.; Shahjalal, M. Permeability Measurement of Granular Materials and Development of an Equation. In Proceedings of the International Conference on Planning, Architecture and Civil Engineering, Rajshahi, Bangladesh, 9 February 2017; Rajshahi University of Engineering & Technology: Rajshahi, Bangladesh, 2017; Volume 1, pp. 136–140. [Google Scholar]
- Zheng, W.; Tannant, D.D. Improved Estimate of the Effective Diameter for Use in the Kozeny–Carman Equation for Permeability Prediction. Géotech. Lett. 2017, 7, 1–5. [Google Scholar] [CrossRef]
- Ren, X.; Zhao, Y.; Deng, Q.; Kang, J.; Li, D.; Wang, D. A Relation of Hydraulic Conductivity—Void Ratio for Soils Based on Kozeny-Carman Equation. Eng. Geol. 2016, 213, 89–97. [Google Scholar] [CrossRef]
- Pomès, V.; Bazin, B.; Golfier, F.; Zarcone, C.; Lenormand, R.; Quintard, M. On The Use of Upscaling Methods to Describe Acid Injection in Carbonates. In Proceedings of the SPE Annual Technical Conference and Exhibition, New Orleans, LA, USA, 30 September–3 October 2001. [Google Scholar]
- Mostaghimi, P.; Blunt, M.J.; Bijeljic, B. Computations of Absolute Permeability on Micro-CT Images. Math. Geosci. 2013, 45, 103–125. [Google Scholar] [CrossRef]
- Satyanarayana Reddy, C.N.V.; Muthukkumaran, K.; Satyam, N.; Vaidya, R. (Eds.) Ground Characterization and Foundations: Proceedings of Indian Geotechnical Conference 2020 Volume 1; Lecture Notes in Civil Engineering; Springer: Singapore, 2022; Volume 167, ISBN 9789811633829. [Google Scholar]
- Marschalko, M.; Zięba, Z.; Niemiec, D.; Neuman, D.; Mońka, J.; Dąbrowska, J. Suitability of Engineering-Geological Environment on the Basis of Its Permeability Coefficient: Four Case Studies of Fine-Grained Soils. Materials 2021, 14, 6411. [Google Scholar] [CrossRef] [PubMed]
- Jose, F. Determination of Hydraulic Conductivities through Grain-Size Analysis. Master’s Thesis, Boston College University, Chestnut Hill, MA, USA, 2016; pp. 1–112. [Google Scholar]
- Hommel, J.; Coltman, E.; Class, H. Porosity–Permeability Relations for Evolving Pore Space: A Review with a Focus on (Bio-)Geochemically Altered Porous Media. Transp. Porous Media 2018, 124, 589–629. [Google Scholar] [CrossRef]
- Ehsan Samaei, S.; Berardi, U.; Taban, E.; Soltani, P.; Mohammad Mousavi, S. Natural Fibro-Granular Composite as a Novel Sustainable Sound-Absorbing Material. Appl. Acoust. 2021, 181, 108157. [Google Scholar] [CrossRef]
- Carman, P.C. Fluid Flow through Granular Beds. Chem. Eng. Res. Des. 1937, 75, S32–S48. [Google Scholar] [CrossRef]
- Ghanbarian, B.; Hunt, A.G.; Ewing, R.P.; Sahimi, M. Tortuosity in Porous Media: A Critical Review. Soil Sci. Soc. Am. J. 2013, 77, 1461–1477. [Google Scholar] [CrossRef]
- Hillel, D. Introduction to Environmental Soil Physics; Academic Press: Cambridge, MA, USA, 2003; ISBN 978-0-12-348655-4. [Google Scholar]
- Bear, J. Dynamics of Fluids in Porous Media; American Elsevier Publishing Company: New York, NY, USA, 1972. [Google Scholar]
- Holzer, L.; Marmet, P.; Fingerle, M.; Wiegmann, A.; Neumann, M.; Schmidt, V. Tortuosity and Microstructure Effects in Porous Media: Classical Theories, Empirical Data and Modern Methods; Springer Series in Materials Science; Springer International Publishing: Cham, Switzerland, 2023; Volume 333, ISBN 978-3-031-30476-7. [Google Scholar]
- Koponen, A.; Kataja, M.; Timonen, J. Permeability and Effective Porosity of Porous Media. Phys. Rev. E 1997, 56, 3319–3325. [Google Scholar] [CrossRef]
- Mota, M.; Teixeira, J.A.; Bowen, W.R.; Yelshin, A. Binary Spherical Particle Mixed Beds Porosity and Permeability Relationship Measurement.Pdf. Trans. Filtr. Soc. 2001, 1, 101–106. [Google Scholar]
- Millington, R.J.; Quirk, J.P. Permeability of Porous Solids. Trans. Faraday Soc. 1961, 57, 1200. [Google Scholar] [CrossRef]
- Mauret, E.; Renaud, M. Transport Phenomena in Multi-Particle Systems—l. Limits of Applicability of Capillary Model in High Voidage Beds- Application to Fixed Beds of Fibers and Fluidized Beds of Spheres. Chem. Eng. Sci. 1997, 52, 1807–1817. [Google Scholar] [CrossRef]
- Comiti, J.; Renaud, M. A New Model for Determining Mean Structure Parameters of Fixed Beds from Pressure Drop Measurements: Application to Beds Packed with Parallelepipedal Particles. Chem. Eng. Sci. 1989, 44, 1539–1545. [Google Scholar] [CrossRef]
- Matyka, M.; Khalili, A.; Koza, Z. Tortuosity-Porosity Relation in Porous Media Flow. Phys. Rev. E 2008, 78, 026306. [Google Scholar] [CrossRef]
- Li, J.-H.; Yu, B.-M. Tortuosity of Flow Paths through a Sierpinski Carpet. Chin. Phys. Lett. 2011, 28, 034701. [Google Scholar] [CrossRef]
- Ahmadi, M.M.; Mohammadi, S.; Hayati, A.N. Analytical Derivation of Tortuosity and Permeability of Monosized Spheres: A Volume Averaging Approach. Phys. Rev. E 2011, 83, 26312. [Google Scholar] [CrossRef] [PubMed]
- Pavuluri, S.; Tournassat, C.; Claret, F.; Soulaine, C. Reactive Transport Modeling with a Coupled OpenFOAM®-PHREEQC Platform. Transp. Porous Media 2022, 145, 475–504. [Google Scholar] [CrossRef]
- Soulaine, C.; Pavuluri, S.; Claret, F.; Tournassat, C. porousMedia4Foam: Multi-Scale Open-Source Platform for Hydro-Geochemical Simulations with OpenFOAM®. Environ. Model. Softw. 2021, 145, 105199. [Google Scholar] [CrossRef]
- Steefel, C.I.; Lichtner, P.C. Multicomponent Reactive Transport in Discrete Fractures II: Infiltration of Hyperalkaline Groundwater at Maqarin, Jordan, a Natural Analogue Site. J. Hydrol. 1998, 209, 200–224. [Google Scholar] [CrossRef]
- Xie, M.; Mayer, K.U.; Claret, F.; Alt-Epping, P.; Jacques, D.; Steefel, C.; Chiaberge, C.; Simunek, J. Implementation and Evaluation of Permeability-Porosity and Tortuosity-Porosity Relationships Linked to Mineral Dissolution-Precipitation. Comput. Geosci. 2015, 19, 655–671. [Google Scholar] [CrossRef]
- Andreani, M.; Luquot, L.; Gouze, P.; Godard, M.; Hoisé, E.; Gibert, B. Experimental Study of Carbon Sequestration Reactions Controlled by the Percolation of CO2 -Rich Brine through Peridotites. Environ. Sci. Technol. 2009, 43, 1226–1231. [Google Scholar] [CrossRef] [PubMed]
- Luhmann, A.J.; Kong, X.-Z.; Tutolo, B.M.; Garapati, N.; Bagley, B.C.; Saar, M.O.; Seyfried, W.E. Experimental Dissolution of Dolomite by CO2-Charged Brine at 100 °C and 150 bar: Evolution of Porosity, Permeability, and Reactive Surface Area. Chem. Geol. 2014, 380, 145–160. [Google Scholar] [CrossRef]
- Harrison, A.L.; Dipple, G.M.; Power, I.M.; Mayer, K.U. The Impact of Evolving Mineral–Water–Gas Interfacial Areas on Mineral–Fluid Reaction Rates in Unsaturated Porous Media. Chem. Geol. 2016, 421, 65–80. [Google Scholar] [CrossRef]
- Jeen, S.-W.; Mayer, K.U.; Gillham, R.W.; Blowes, D.W. Reactive Transport Modeling of Trichloroethene Treatment with Declining Reactivity of Iron. Environ. Sci. Technol. 2007, 41, 1432–1438. [Google Scholar] [CrossRef] [PubMed]
- Beckingham, L.E.; Steefel, C.I.; Swift, A.M.; Voltolini, M.; Yang, L.; Anovitz, L.M.; Sheets, J.M.; Cole, D.R.; Kneafsey, T.J.; Mitnick, E.H.; et al. Evaluation of Accessible Mineral Surface Areas for Improved Prediction of Mineral Reaction Rates in Porous Media. Geochim. Cosmochim. Acta 2017, 205, 31–49. [Google Scholar] [CrossRef]
- Sabo, M.S.; Beckingham, L.E. Porosity-Permeability Evolution During Simultaneous Mineral Dissolution and Precipitation. Water Resour. Res. 2021, 57, e2020WR029072. [Google Scholar] [CrossRef]
- Li, L.; Maher, K.; Navarre-Sitchler, A.; Druhan, J.; Meile, C.; Lawrence, C.; Moore, J.; Perdrial, J.; Sullivan, P.; Thompson, A.; et al. Expanding the Role of Reactive Transport Models in Critical Zone Processes. Earth-Sci. Rev. 2017, 165, 280–301. [Google Scholar] [CrossRef]
- Lichtner, P.C. Continuum Model for Simultaneous Chemical Reactions and Mass Transport in Hydrothermal Systems. Geochim. Cosmochim. Acta 1985, 49, 779–800. [Google Scholar] [CrossRef]
- Mayer, K.U.; Frind, E.O.; Blowes, D.W. Multicomponent Reactive Transport Modeling in Variably Saturated Porous Media Using a Generalized Formulation for Kinetically Controlled Reactions: Reactive Transport Modeling in Variably Saturated Media. Water Resour. Res. 2002, 38, 13-1–13-21. [Google Scholar] [CrossRef]
- Xu, T.; Sonnenthal, E.; Spycher, N.; Pruess, K. TOUGHREACT—A Simulation Program for Non-Isothermal Multiphase Reactive Geochemical Transport in Variably Saturated Geologic Media: Applications to Geothermal Injectivity and CO2 Geological Sequestration. Comput. Geosci. 2006, 32, 145–165. [Google Scholar] [CrossRef]
- Jacques, D.; Šimůnek, J.; Mallants, D.; Genuchten, M.T. Modeling Coupled Hydrologic and Chemical Processes: Long-Term Uranium Transport Following Phosphorus Fertilization. Vadose Zone J. 2008, 7, 698–711. [Google Scholar] [CrossRef]
- Lichtner, P.C.; Hammond, G.E.; Lu, C.; Karra, S.; Bisht, G.; Andre, B.; Mills, R.; Kumar, J. PFLOTRAN User Manual: A Massively Parallel Reactive Flow and Transport Model for Describing Surface and Subsurface Processes; Los Alamos National Laboratory: Los Alamos, NM, USA, 2015. [Google Scholar] [CrossRef]
- Poonoosamy, J.; Soulaine, C.; Burmeister, A.; Deissmann, G.; Bosbach, D.; Roman, S. Microfluidic Flow-through Reactor and 3D Raman Imaging for in Situ Assessment of Mineral Reactivity in Porous and Fractured Porous Media. Lab Chip 2020, 20, 2562–2571. [Google Scholar] [CrossRef] [PubMed]
- Garing, C.; Gouze, P.; Kassab, M.; Riva, M.; Guadagnini, A. Anti-Correlated Porosity–Permeability Changes During the Dissolution of Carbonate Rocks: Experimental Evidences and Modeling. Transp. Porous Media 2015, 107, 595–621. [Google Scholar] [CrossRef]
- Baqer, Y.; Chen, X. A Review on Reactive Transport Model and Porosity Evolution in the Porous Media. Environ. Sci. Pollut. Res. 2022, 29, 47873–47901. [Google Scholar] [CrossRef] [PubMed]
- Xie, C.; Raeini, A.Q.; Wang, Y.; Blunt, M.J.; Wang, M. An Improved Pore-Network Model Including Viscous Coupling Effects Using Direct Simulation by the Lattice Boltzmann Method. Adv. Water Resour. 2017, 100, 26–34. [Google Scholar] [CrossRef]
- Dashtian, H.; Bakhshian, S.; Hajirezaie, S.; Nicot, J.-P.; Hosseini, S.A. Convection-Diffusion-Reaction of CO2-Enriched Brine in Porous Media: A Pore-Scale Study. Comput. Geosci. 2019, 125, 19–29. [Google Scholar] [CrossRef]
- Molins, S.; Trebotich, D.; Miller, G.H.; Steefel, C.I. Mineralogical and Transport Controls on the Evolution of Porous Media Texture Using Direct Numerical Simulation: Controls on Texture Evolution. Water Resour. Res. 2017, 53, 3645–3661. [Google Scholar] [CrossRef]
- Noiriel, C.; Soulaine, C. Pore-Scale Imaging and Modelling of Reactive Flow in Evolving Porous Media: Tracking the Dynamics of the Fluid–Rock Interface. Transp. Porous Media 2021, 140, 181–213. [Google Scholar] [CrossRef]
- Deng, H.; Gharasoo, M.; Zhang, L.; Dai, Z.; Hajizadeh, A.; Peters, C.A.; Soulaine, C.; Thullner, M.; Van Cappellen, P. A Perspective on Applied Geochemistry in Porous Media: Reactive Transport Modeling of Geochemical Dynamics and the Interplay with Flow Phenomena and Physical Alteration. Appl. Geochem. 2022, 146, 105445. [Google Scholar] [CrossRef]
- Liu, H.; Zhang, Y.; Valocchi, A.J. Lattice Boltzmann Simulation of Immiscible Fluid Displacement in Porous Media: Homogeneous versus Heterogeneous Pore Network. Phys. Fluids 2015, 27, 052103. [Google Scholar] [CrossRef]
- Yan, G.; Li, Z.; Bore, T.; Galindo Torres, S.A.; Scheuermann, A.; Li, L. A Lattice Boltzmann Exploration of Two-Phase Displacement in 2D Porous Media under Various Pressure Boundary Conditions. J. Rock Mech. Geotech. Eng. 2022, 14, 1782–1798. [Google Scholar] [CrossRef]
- Molins, S.; Soulaine, C.; Prasianakis, N.I.; Abbasi, A.; Poncet, P.; Ladd, A.J.C.; Starchenko, V.; Roman, S.; Trebotich, D.; Tchelepi, H.A.; et al. Simulation of Mineral Dissolution at the Pore Scale with Evolving Fluid-Solid Interfaces: Review of Approaches and Benchmark Problem Set. Comput. Geosci. 2021, 25, 1285–1318. [Google Scholar] [CrossRef]
- Soulaine, C.; Davit, Y.; Quintard, M. A Two-Pressure Model for Slightly Compressible Single Phase Flow in Bi-Structured Porous Media. Chem. Eng. Sci. 2013, 96, 55–70. [Google Scholar] [CrossRef]
- Pavuluri, S.; Maes, J.; Yang, J.; Regaieg, M.; Moncorgé, A.; Doster, F. Towards Pore Network Modelling of Spontaneous Imbibition: Contact Angle Dependent Invasion Patterns and the Occurrence of Dynamic Capillary Barriers. Comput. Geosci. 2020, 24, 951–969. [Google Scholar] [CrossRef]
- Soulaine, C.; Tchelepi, H.A. Micro-Continuum Approach for Pore-Scale Simulation of Subsurface Processes. Transp. Porous Media 2016, 113, 431–456. [Google Scholar] [CrossRef]
- Battiato, I.; Tartakovsky, D.M.; Tartakovsky, A.M.; Scheibe, T.D. Hybrid Models of Reactive Transport in Porous and Fractured Media. Adv. Water Resour. 2011, 34, 1140–1150. [Google Scholar] [CrossRef]
- Scheibe, T.D.; Perkins, W.A.; Richmond, M.C.; McKinley, M.I.; Romero-Gomez, P.D.J.; Oostrom, M.; Wietsma, T.W.; Serkowski, J.A.; Zachara, J.M. Pore-Scale and Multiscale Numerical Simulation of Flow and Transport in a Laboratory-Scale Column. Water Resour. Res. 2015, 51, 1023–1035. [Google Scholar] [CrossRef]
- Soulaine, C.; Creux, P.; Tchelepi, H.A. Micro-Continuum Framework for Pore-Scale Multiphase Fluid Transport in Shale Formations. Transp. Porous Media 2019, 127, 85–112. [Google Scholar] [CrossRef]
- Lai, P.; Krevor, S. Pore Scale Heterogeneity in the Mineral Distribution and Surface Area of Berea Sandstone. Energy Procedia 2014, 63, 3582–3588. [Google Scholar] [CrossRef]
- Saripalli, K.P.; Serne, R.J.; Meyer, P.D.; McGrail, B.P. Prediction of Diffusion Coefficients in Porous Media Using Tortuosity Factors Based on Interfacial Areas. Groundwater 2002, 40, 346–352. [Google Scholar] [CrossRef]
- Pereira Nunes, J.P.; Blunt, M.J.; Bijeljic, B. Pore-scale Simulation of Carbonate Dissolution in micro-CT Images. J. Geophys. Res. Solid Earth 2016, 121, 558–576. [Google Scholar] [CrossRef]
- Roslin, A.; Pokrajac, D.; Zhou, Y. Cleat Structure Analysis and Permeability Simulation of Coal Samples Based on Micro-Computed Tomography (Micro-CT) and Scan Electron Microscopy (SEM) Technology. Fuel 2019, 254, 115579. [Google Scholar] [CrossRef]
- Wang, S.; Spurin, C.; Bultreys, T. Pore-Scale Imaging of Multiphase Flow Fluctuations in Continuum-Scale Samples. Water Resour. Res. 2023, 59, e2023WR034720. [Google Scholar] [CrossRef]
Figure 1.
An overview of the mechanisms of Fe(II) oxidative precipitation, as well as the impact of precipitated Fe on porous media. Large gray circles represent solid particles, small yellow circles represent chemicals, and red arrows indicate the direction of flow in porous media.
Figure 1.
An overview of the mechanisms of Fe(II) oxidative precipitation, as well as the impact of precipitated Fe on porous media. Large gray circles represent solid particles, small yellow circles represent chemicals, and red arrows indicate the direction of flow in porous media.
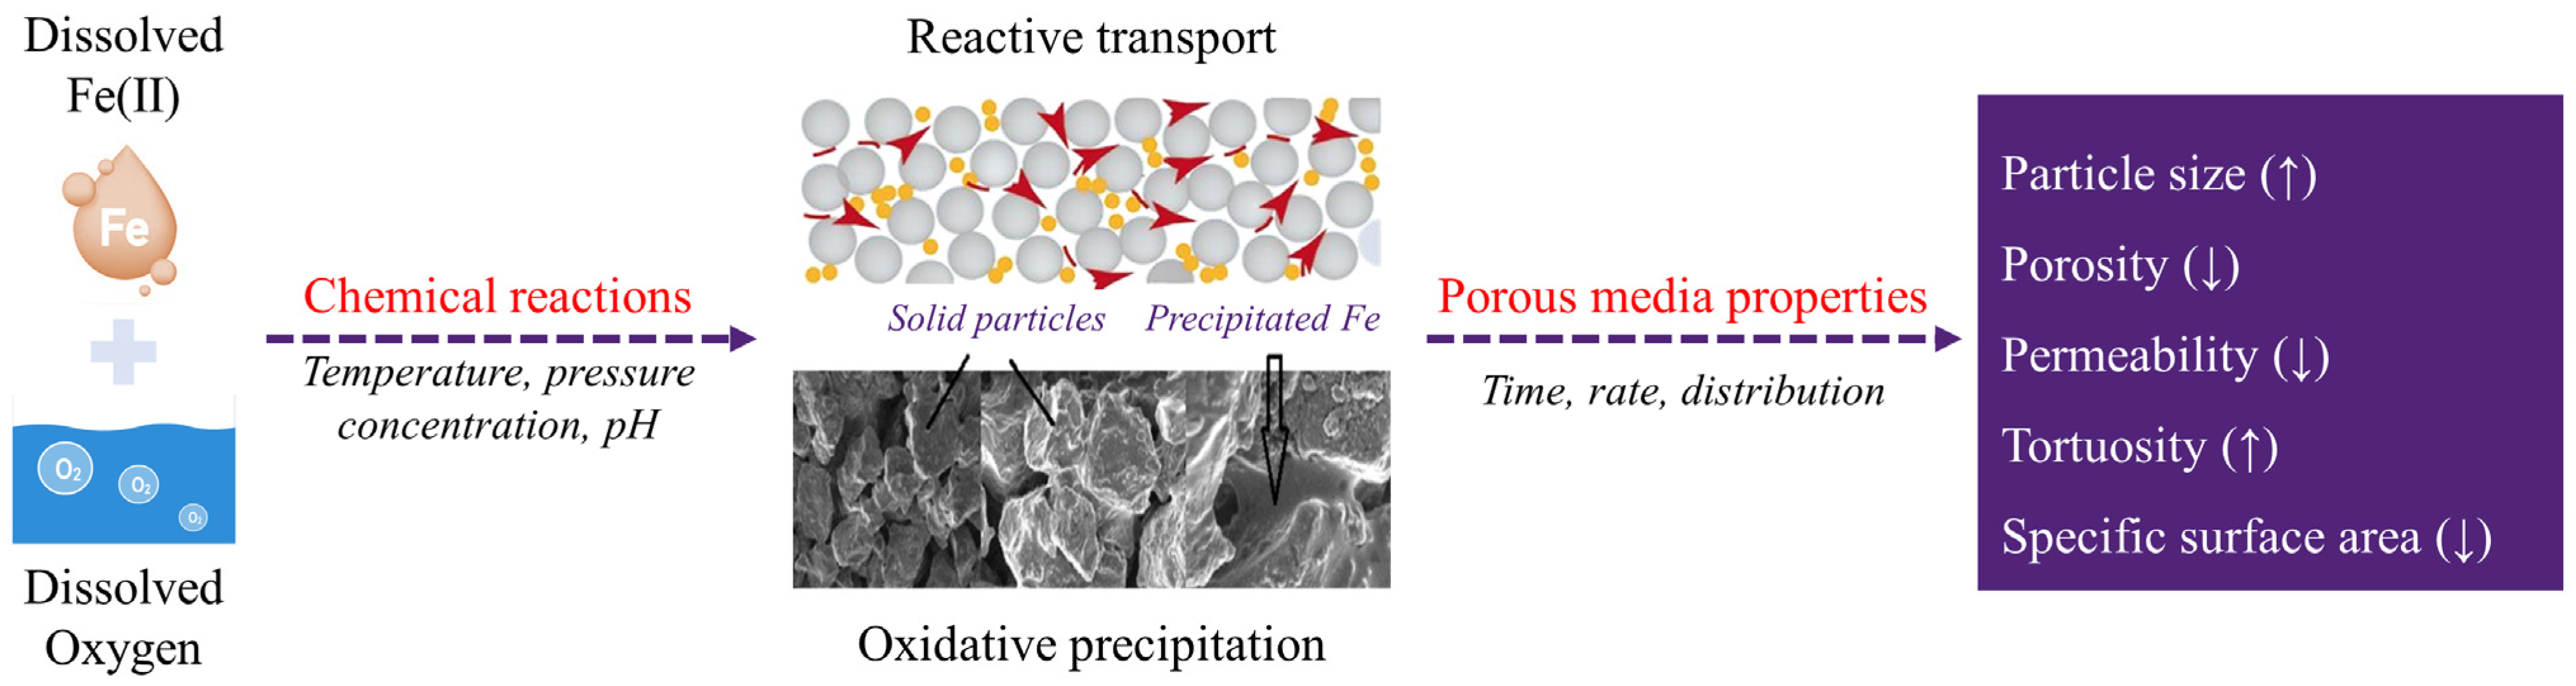
Figure 2.
Conceptual model illustrating the hydrological and geochemical processes in the intertidal area [31]. The orange area represents the aquifer zone dominated by submarine groundwater, while the red area shows the seawater intrusion driven by oceanic forces such as tides. Three major processes include (1) submarine groundwater discharge (SGD) (white dashed lines), (2) density-driven circulation (blue dashed lines), and (3) tide-induced circulation (green dashed lines). Between the saltwater wedge (SW) and the upper saline plume (USP), a groundwater discharge tube (GDT) intersects the beach. Moreover, the decomposition of Fe-bearing minerals can lead to the release of Fe ions into groundwater (e.g., facilitated by rainwater infiltration, in black dashed lines). Fe(II)-rich groundwater can be oxidized by DO-rich seawater, and precipitate Fe oxides at the groundwater–seawater interface. The accumulation of these minerals can form the iron curtain which acts as a geochemical barrier (purple dashed lines) in coastal aquifers.
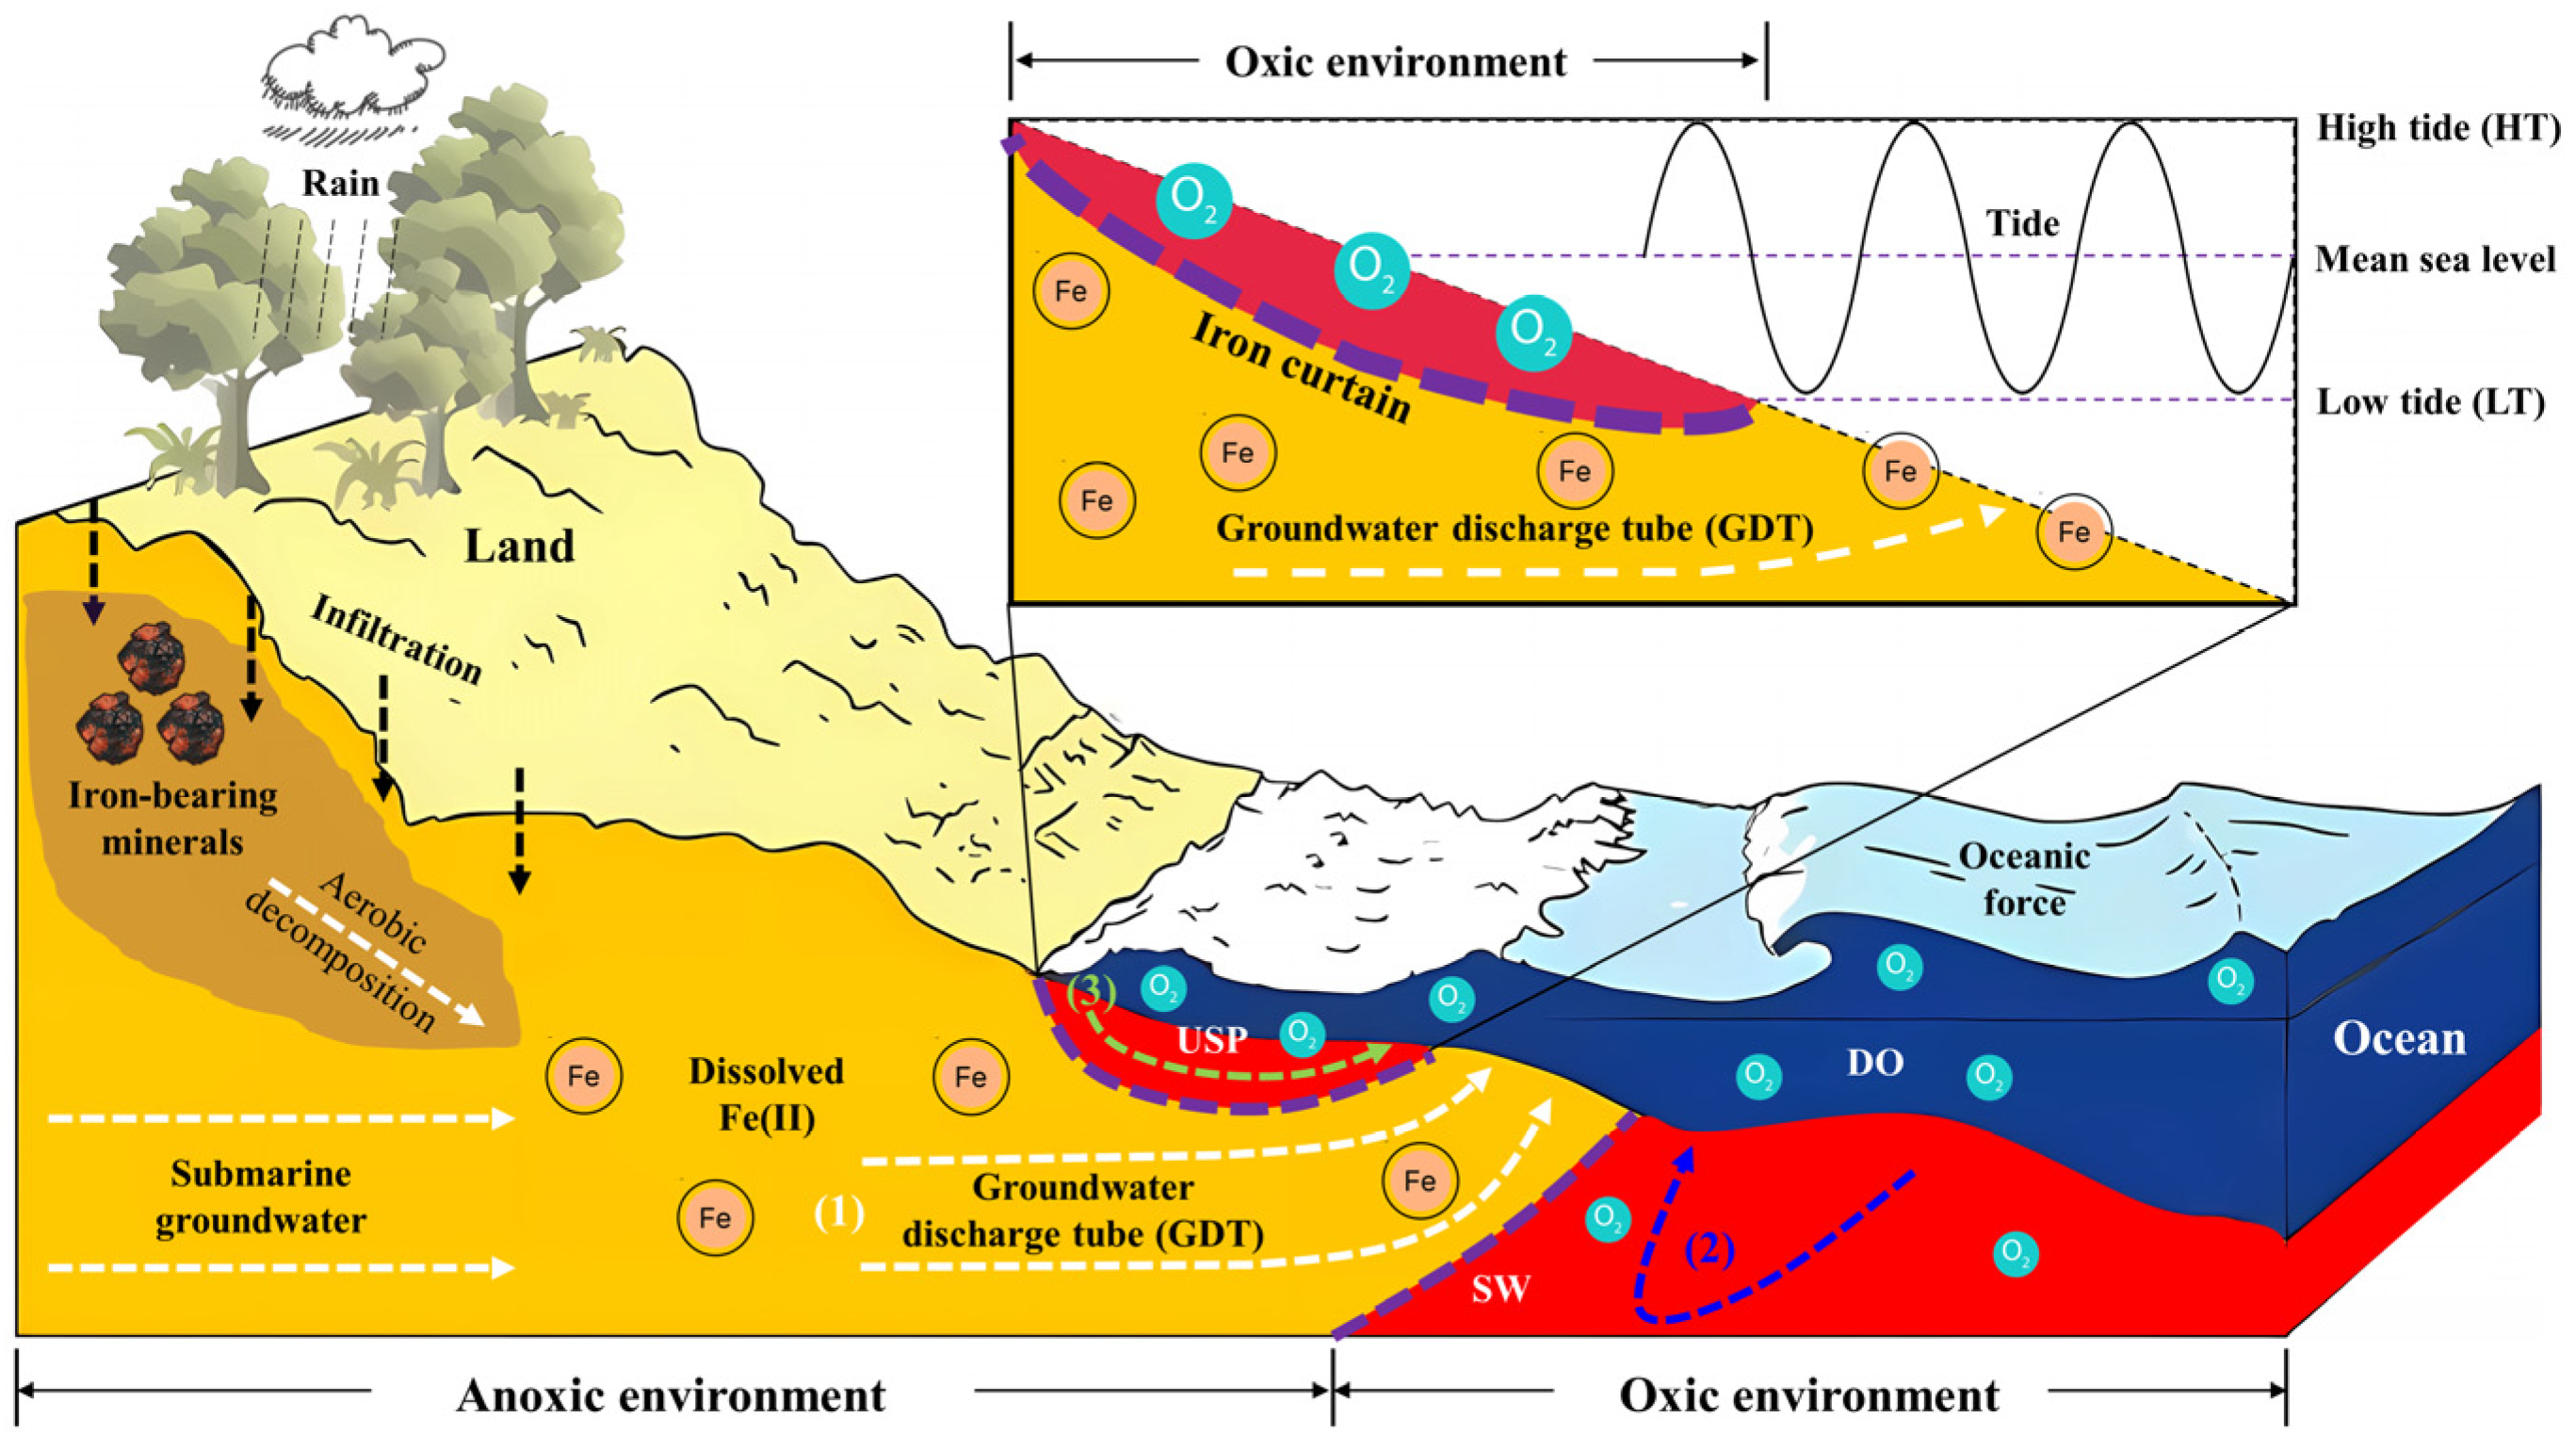
Figure 3.
Schematic diagram illustrating the interactive mechanisms between the flow, transport, and reaction domains, where n is porosity, S is specific surface area, k is permeability, h is hydraulic head, τ is tortuosity, q is volumetric flow rate, and c is molar concentration. All black lines with arrows indicate an essential relationship between parameters.
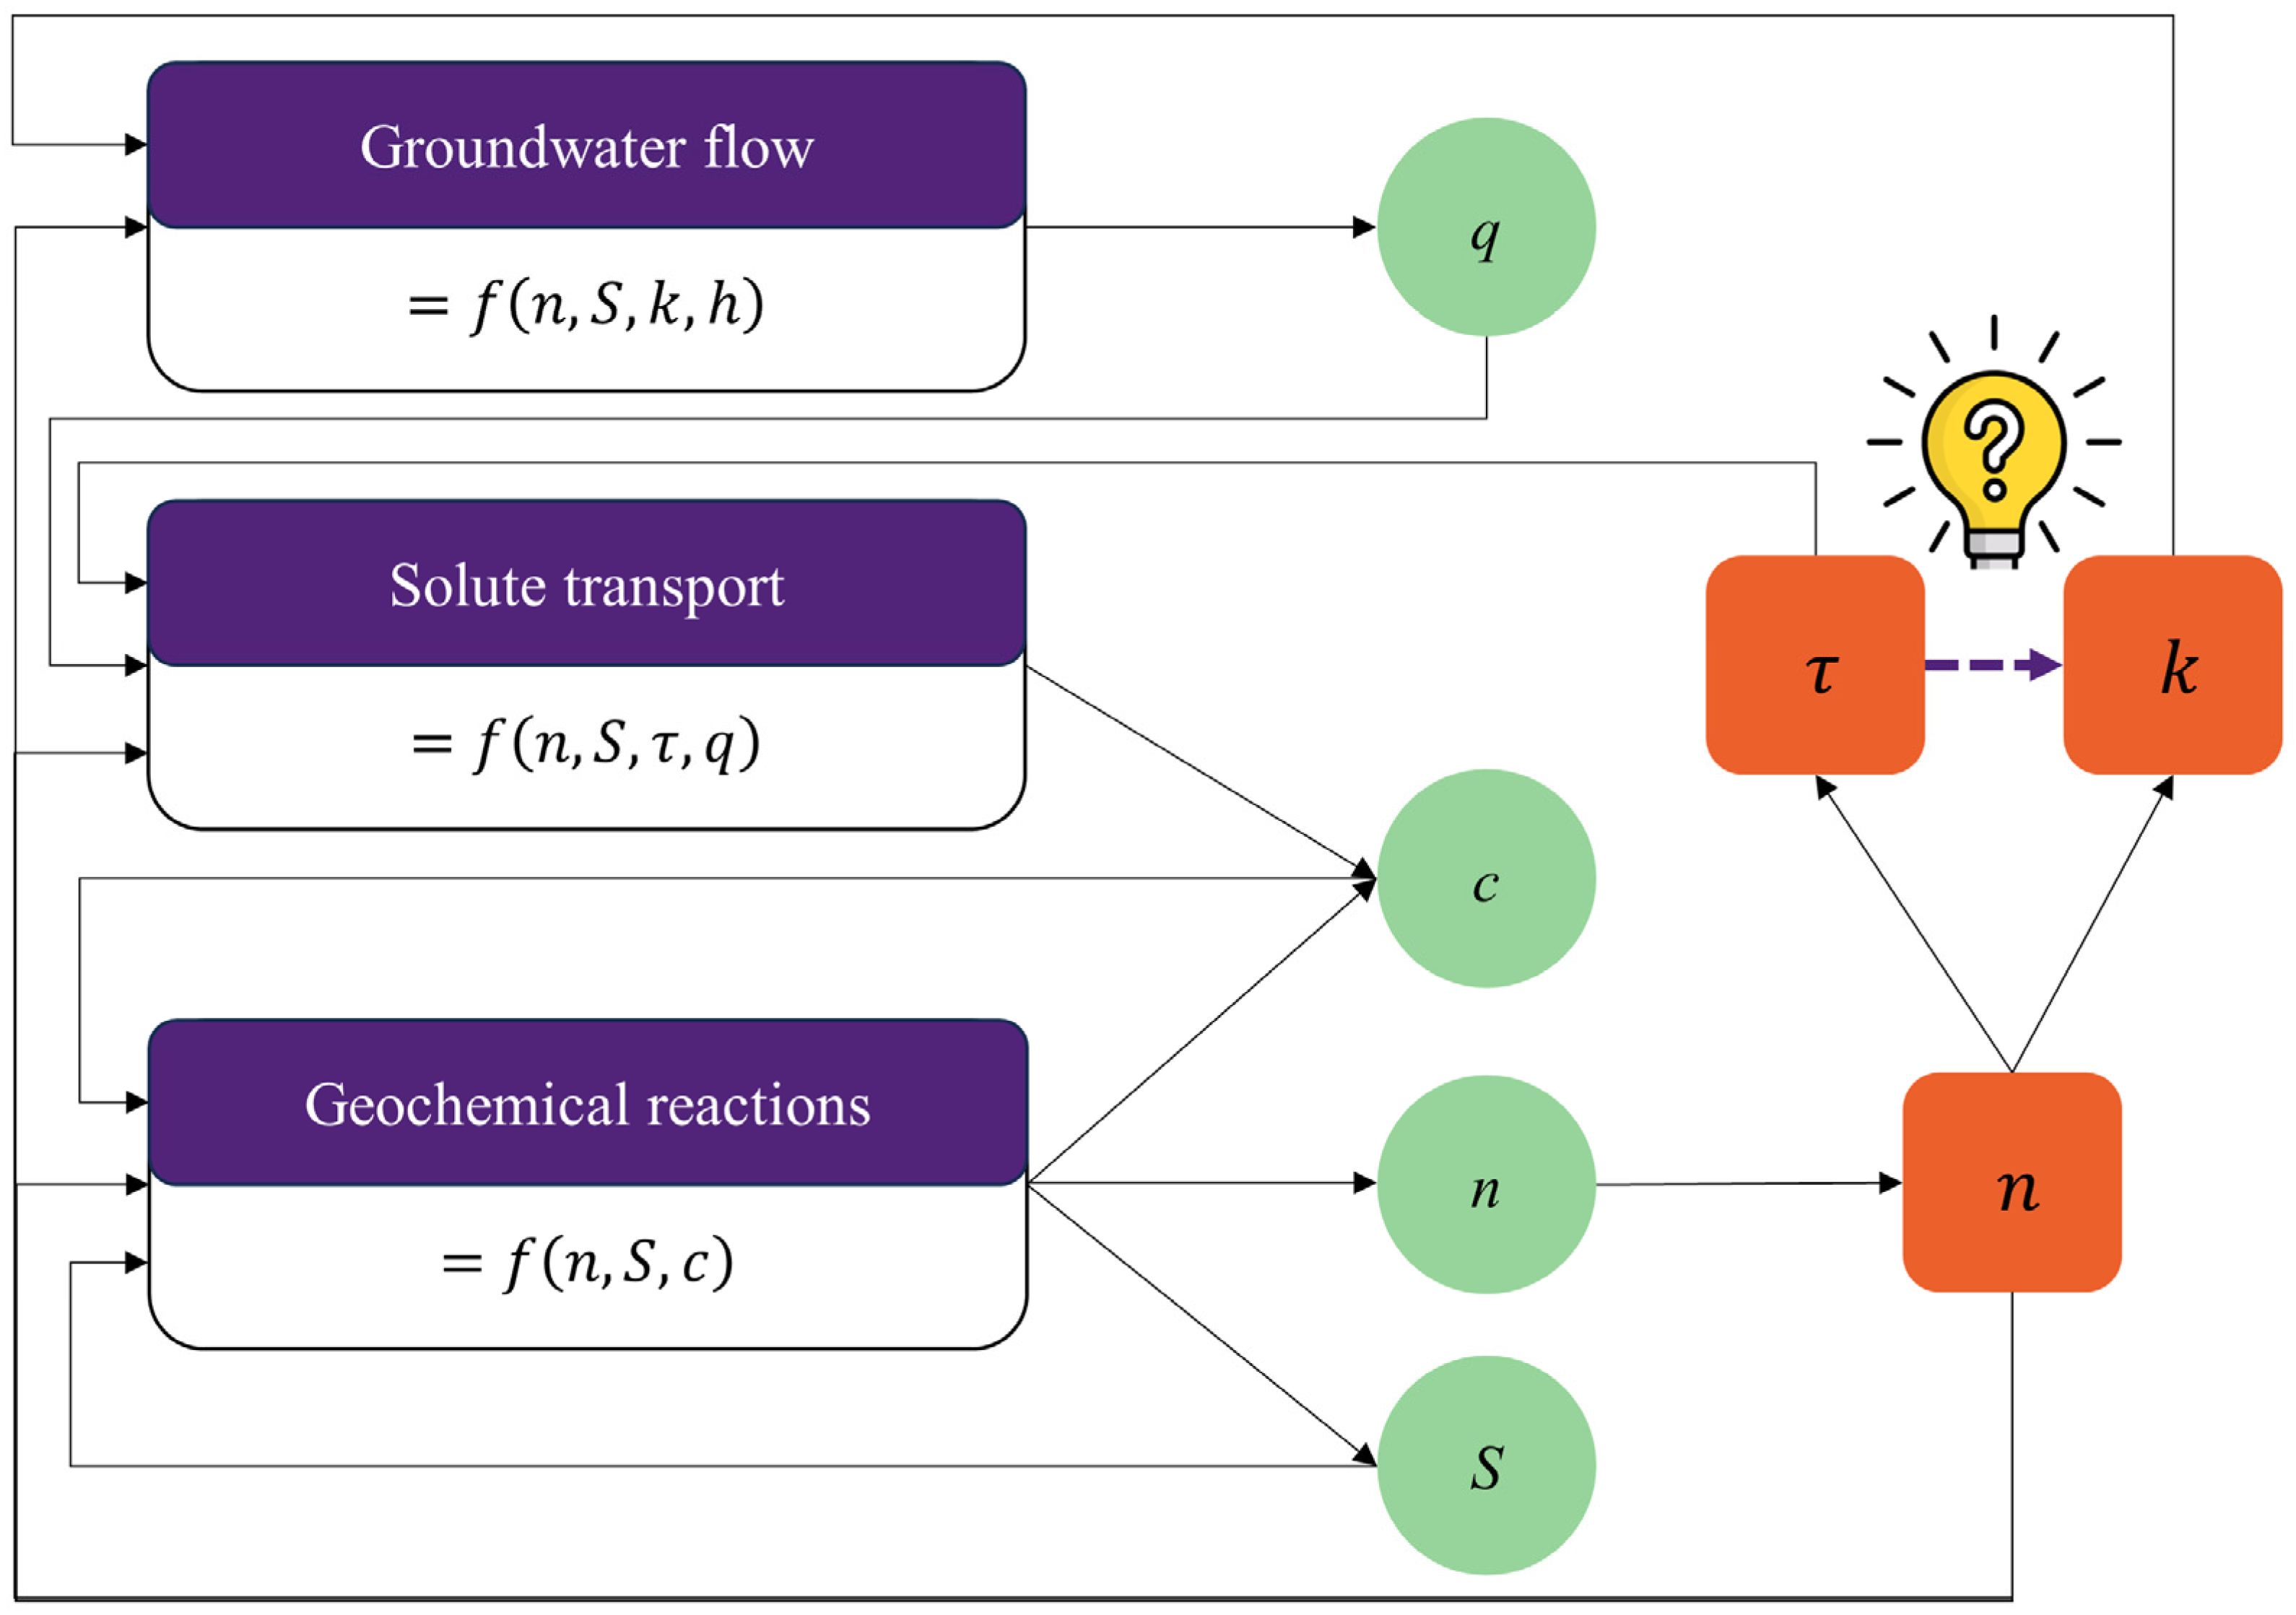
Figure 4.
Illustration of representative field investigation in Australia and worldwide. The red rectangles outline significant research related to Fe speciation and Fe oxides in Australia, with the majority focused on Deception Bay (northwest end of Moreton Bay), Queensland, Australia. The purple rectangles list important field studies in the USA, Germany, China, and Brazil, with a focus on intertidal zones with Fe precipitation or Fe-oxide-coated sand.
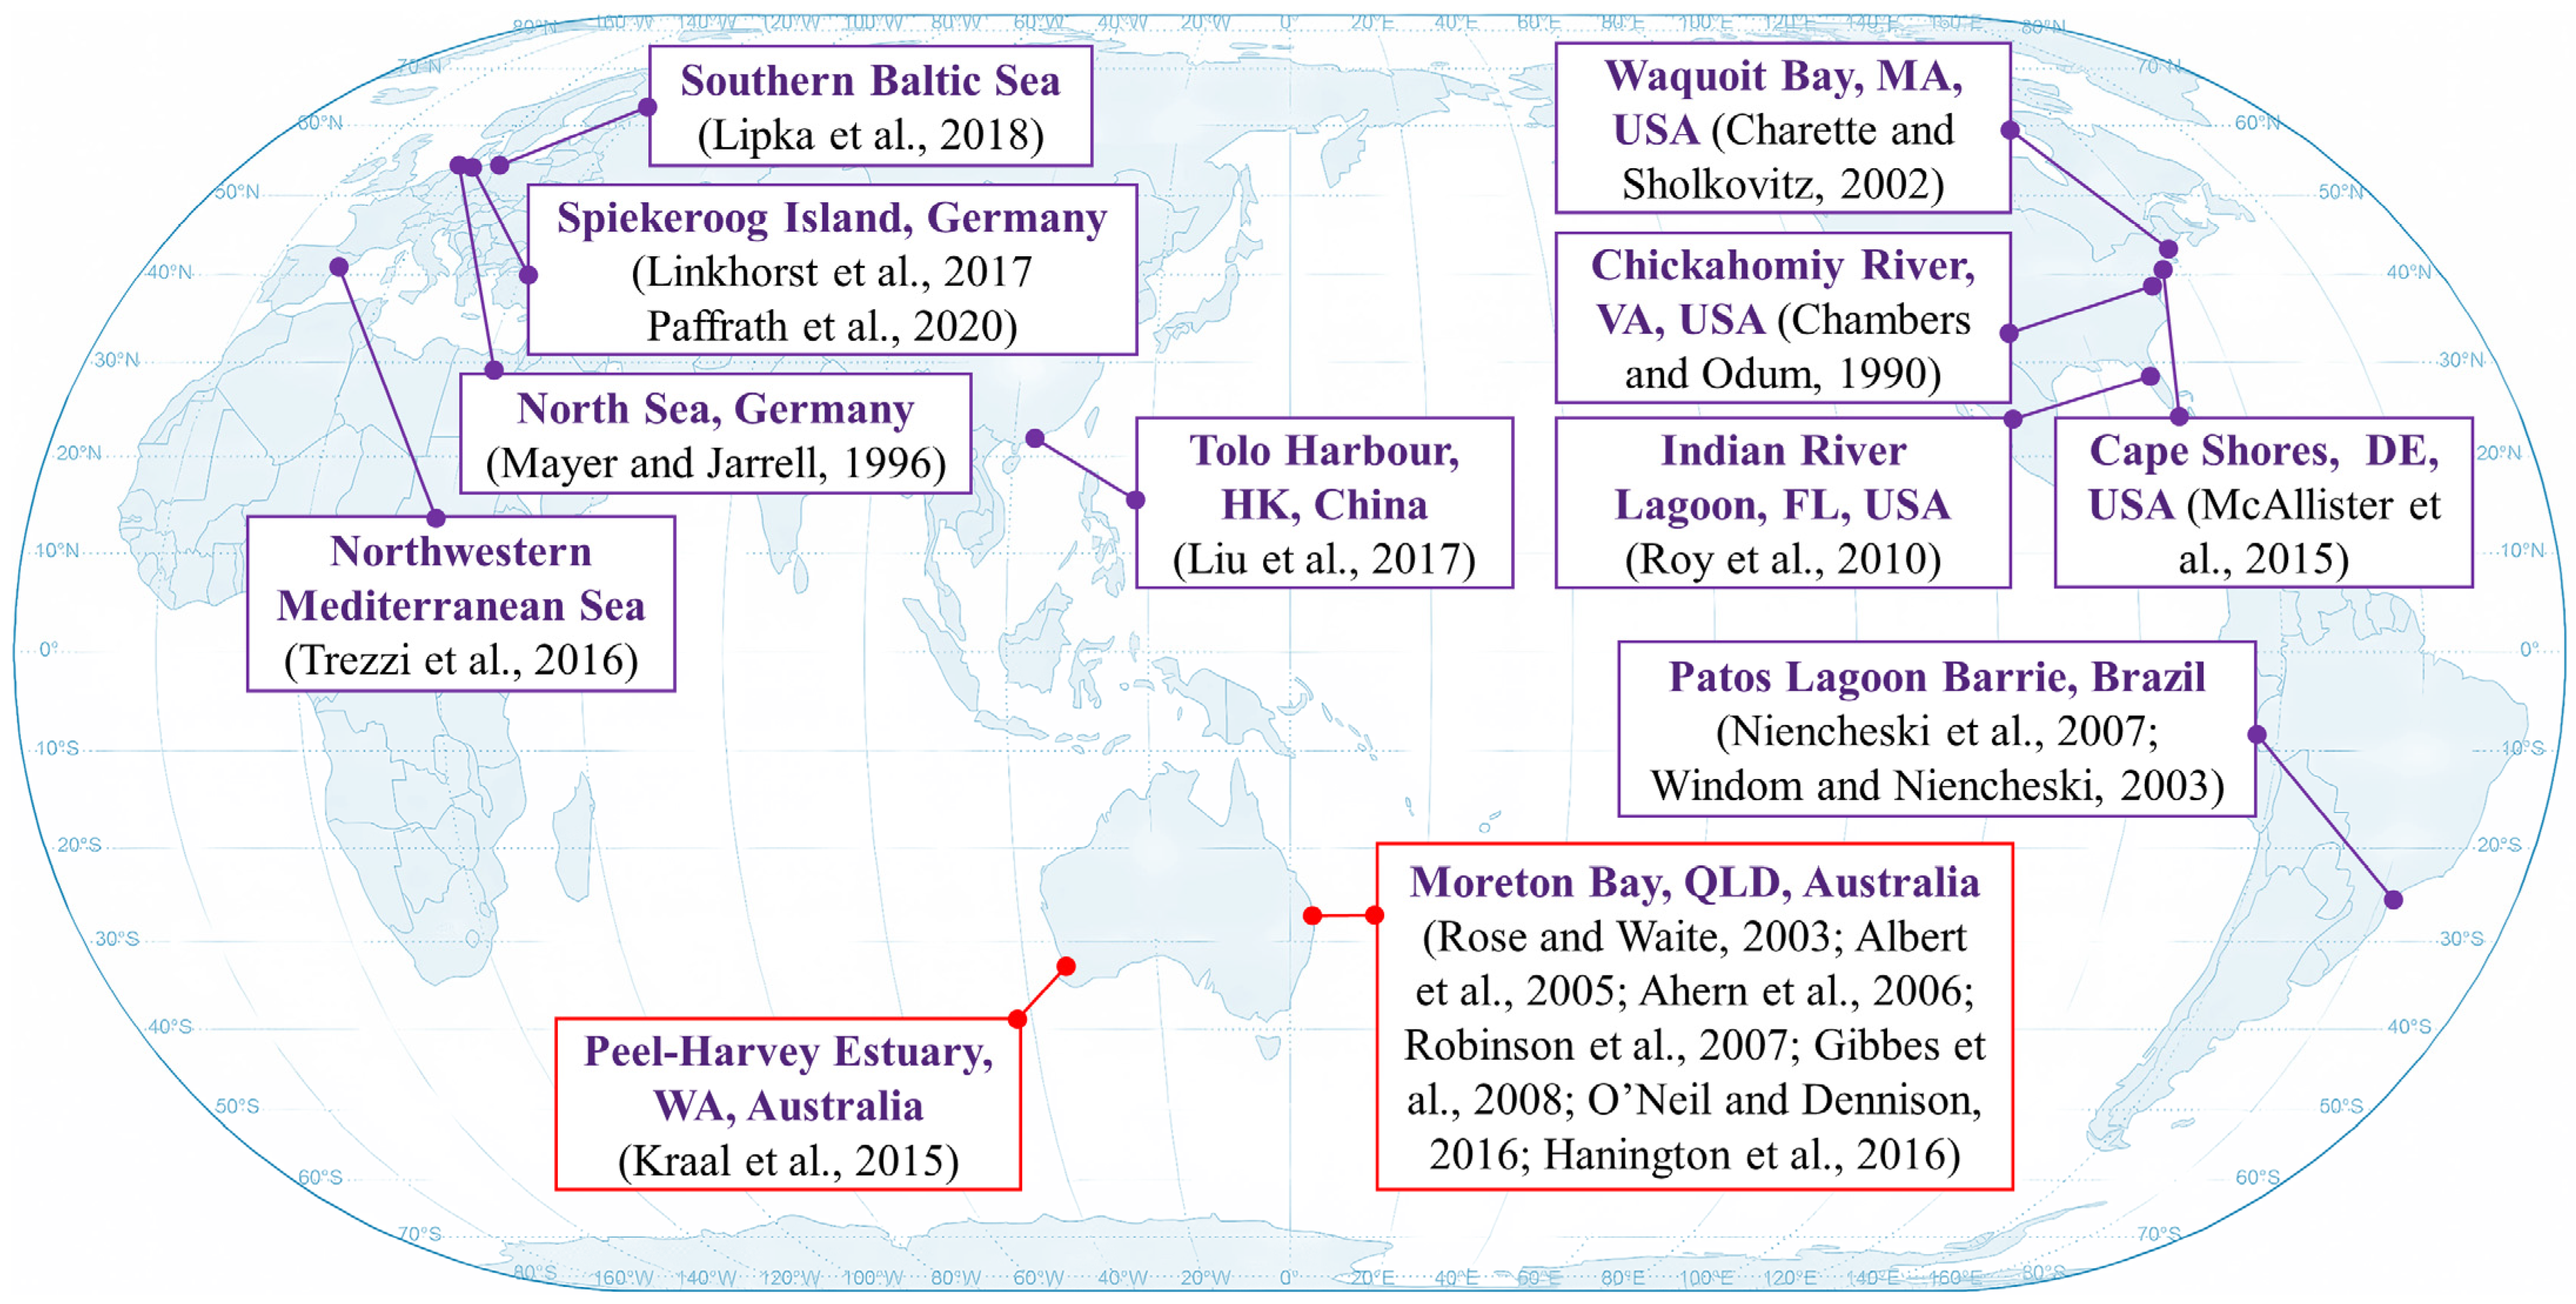
Figure 5.
Schematic illustration of (a) a sand flume and (b) a sand column which were previously used in the Geomechanics Research Laboratory at the University of Queensland (UQ), Queensland, Australia. A sand flume test can be used to investigate pathways and mechanisms under various predetermined forcing circumstances, such as different tidal ranges and net groundwater flow rates, while a sand column test can be typically utilized to explore the migration of certain compounds in a particular substrate. Note that blue arrows show freshwater flow direction, while red arrows represent saltwater flow direction.
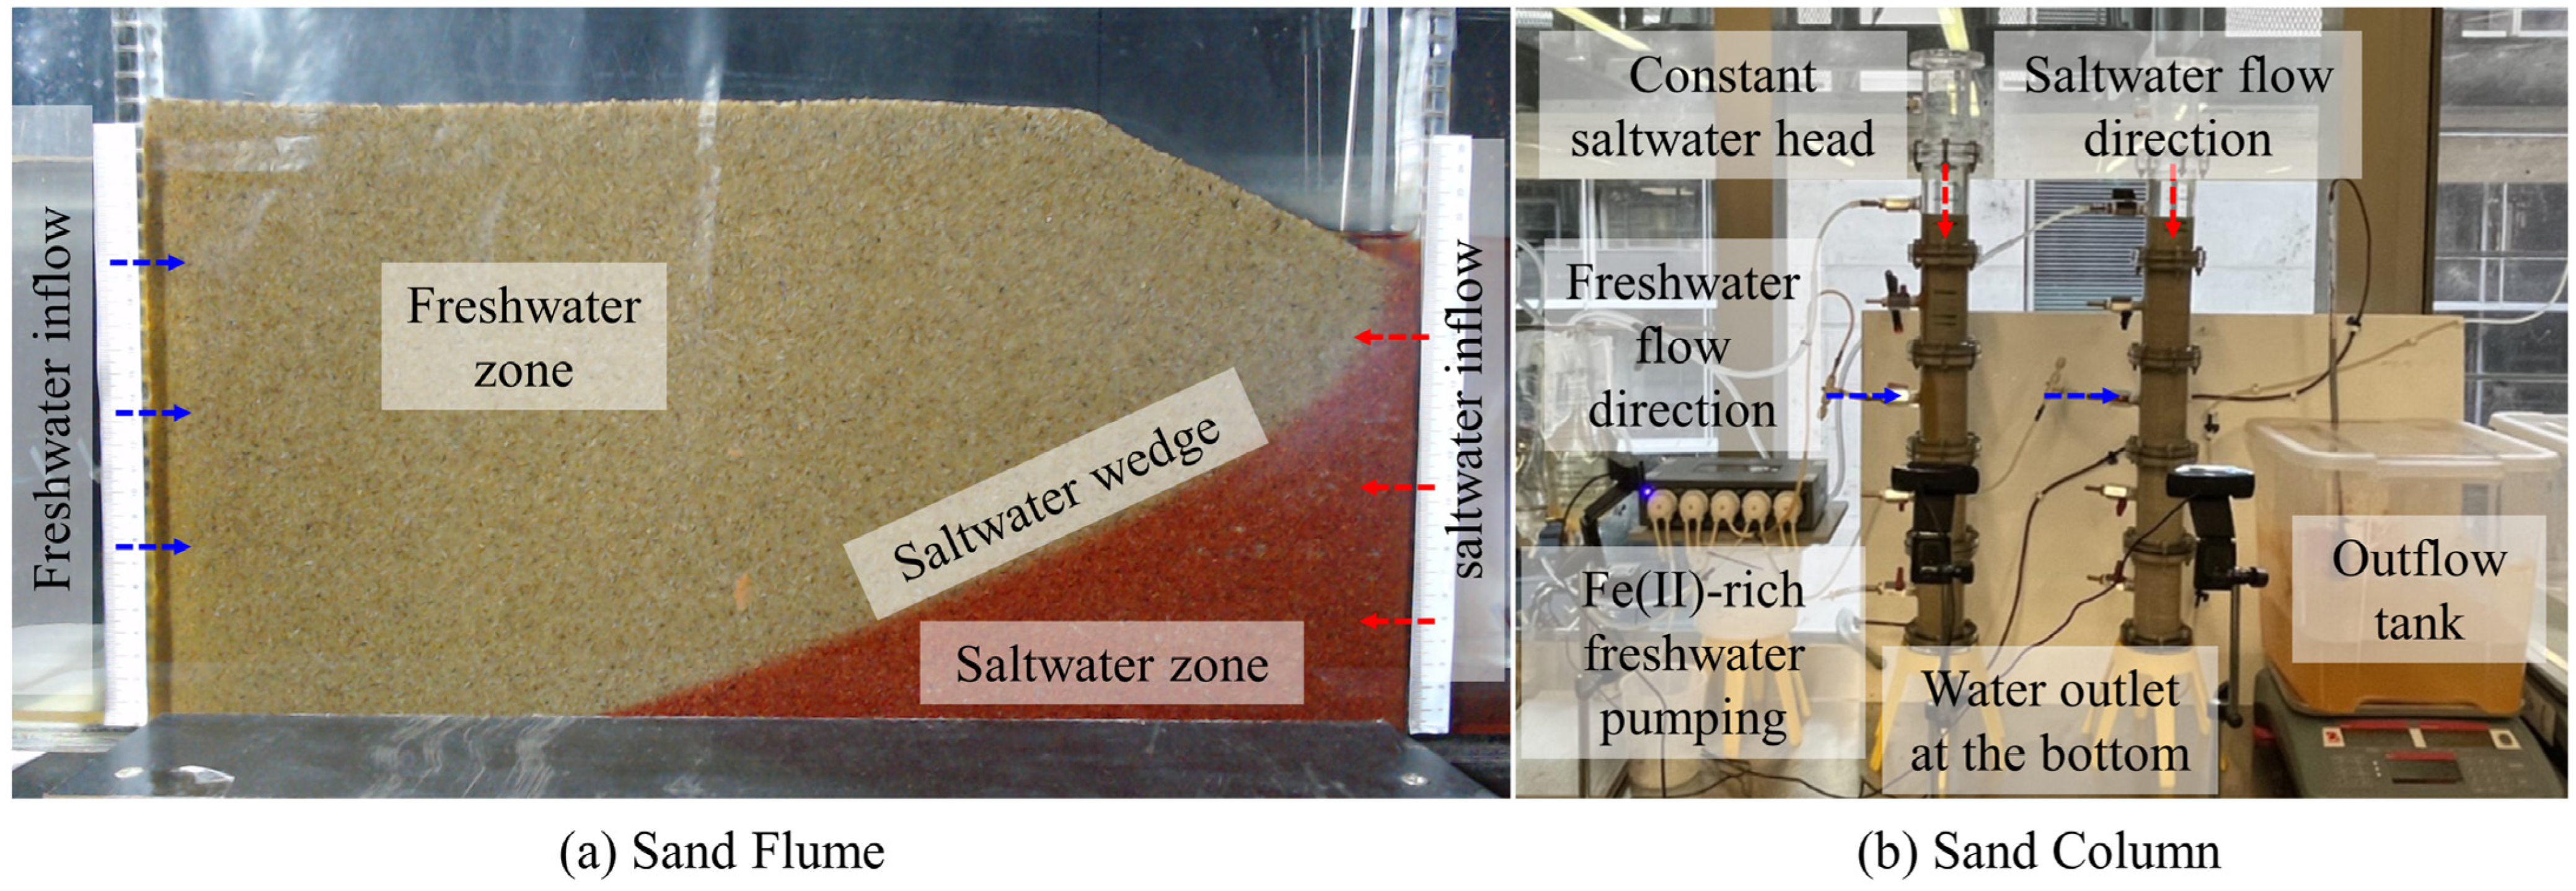
Figure 6.
Illustration of (a) field scenario and corresponding numerical simulations using (b1) 1-D model, (b2) 2-D model, and (b3) 3-D model. In the field scenario, the orange represents the groundwater aquifer zone, while the red represents the seawater intrusion zone. Groundwater-derived Fe(II) can be oxidized by DO and then precipitate as Fe oxides, which creates an iron curtain (purple dashed lines) at the groundwater–seawater interface. The 1-D model features a simple reaction network along the flow path. The 2-D model can be utilized to investigate groundwater flow and biogeochemical reactions in the cross-shore direction of intertidal areas. Meanwhile, the 3-D model is suitable for investigating the variation of groundwater flow and solute transport in the alongshore direction of coastal aquifers. Note that blue arrows show groundwater flow direction, while red arrows represent seawater flow direction.

Figure 7.
Schematic illustration of the effect of the precipitation process on pore structure. The brown area represents solid particles (e.g., quartz sand), while green coatings are solid-phase precipitation.
Figure 7.
Schematic illustration of the effect of the precipitation process on pore structure. The brown area represents solid particles (e.g., quartz sand), while green coatings are solid-phase precipitation.
Figure 8.
(a) A 3-D micro-CT image of solid particles, and (b) a SEM image of sand grains and pore space changes due to Fe precipitation.
Figure 8.
(a) A 3-D micro-CT image of solid particles, and (b) a SEM image of sand grains and pore space changes due to Fe precipitation.
Figure 9.
Phase relationship diagram of a cross-section of REV-scale porous media, where Vt is the total volume, Vv is the void volume which equals the water volume Vw under fully saturated conditions, and Vs is the volume of solid particles and precipitated Fe.
Figure 9.
Phase relationship diagram of a cross-section of REV-scale porous media, where Vt is the total volume, Vv is the void volume which equals the water volume Vw under fully saturated conditions, and Vs is the volume of solid particles and precipitated Fe.
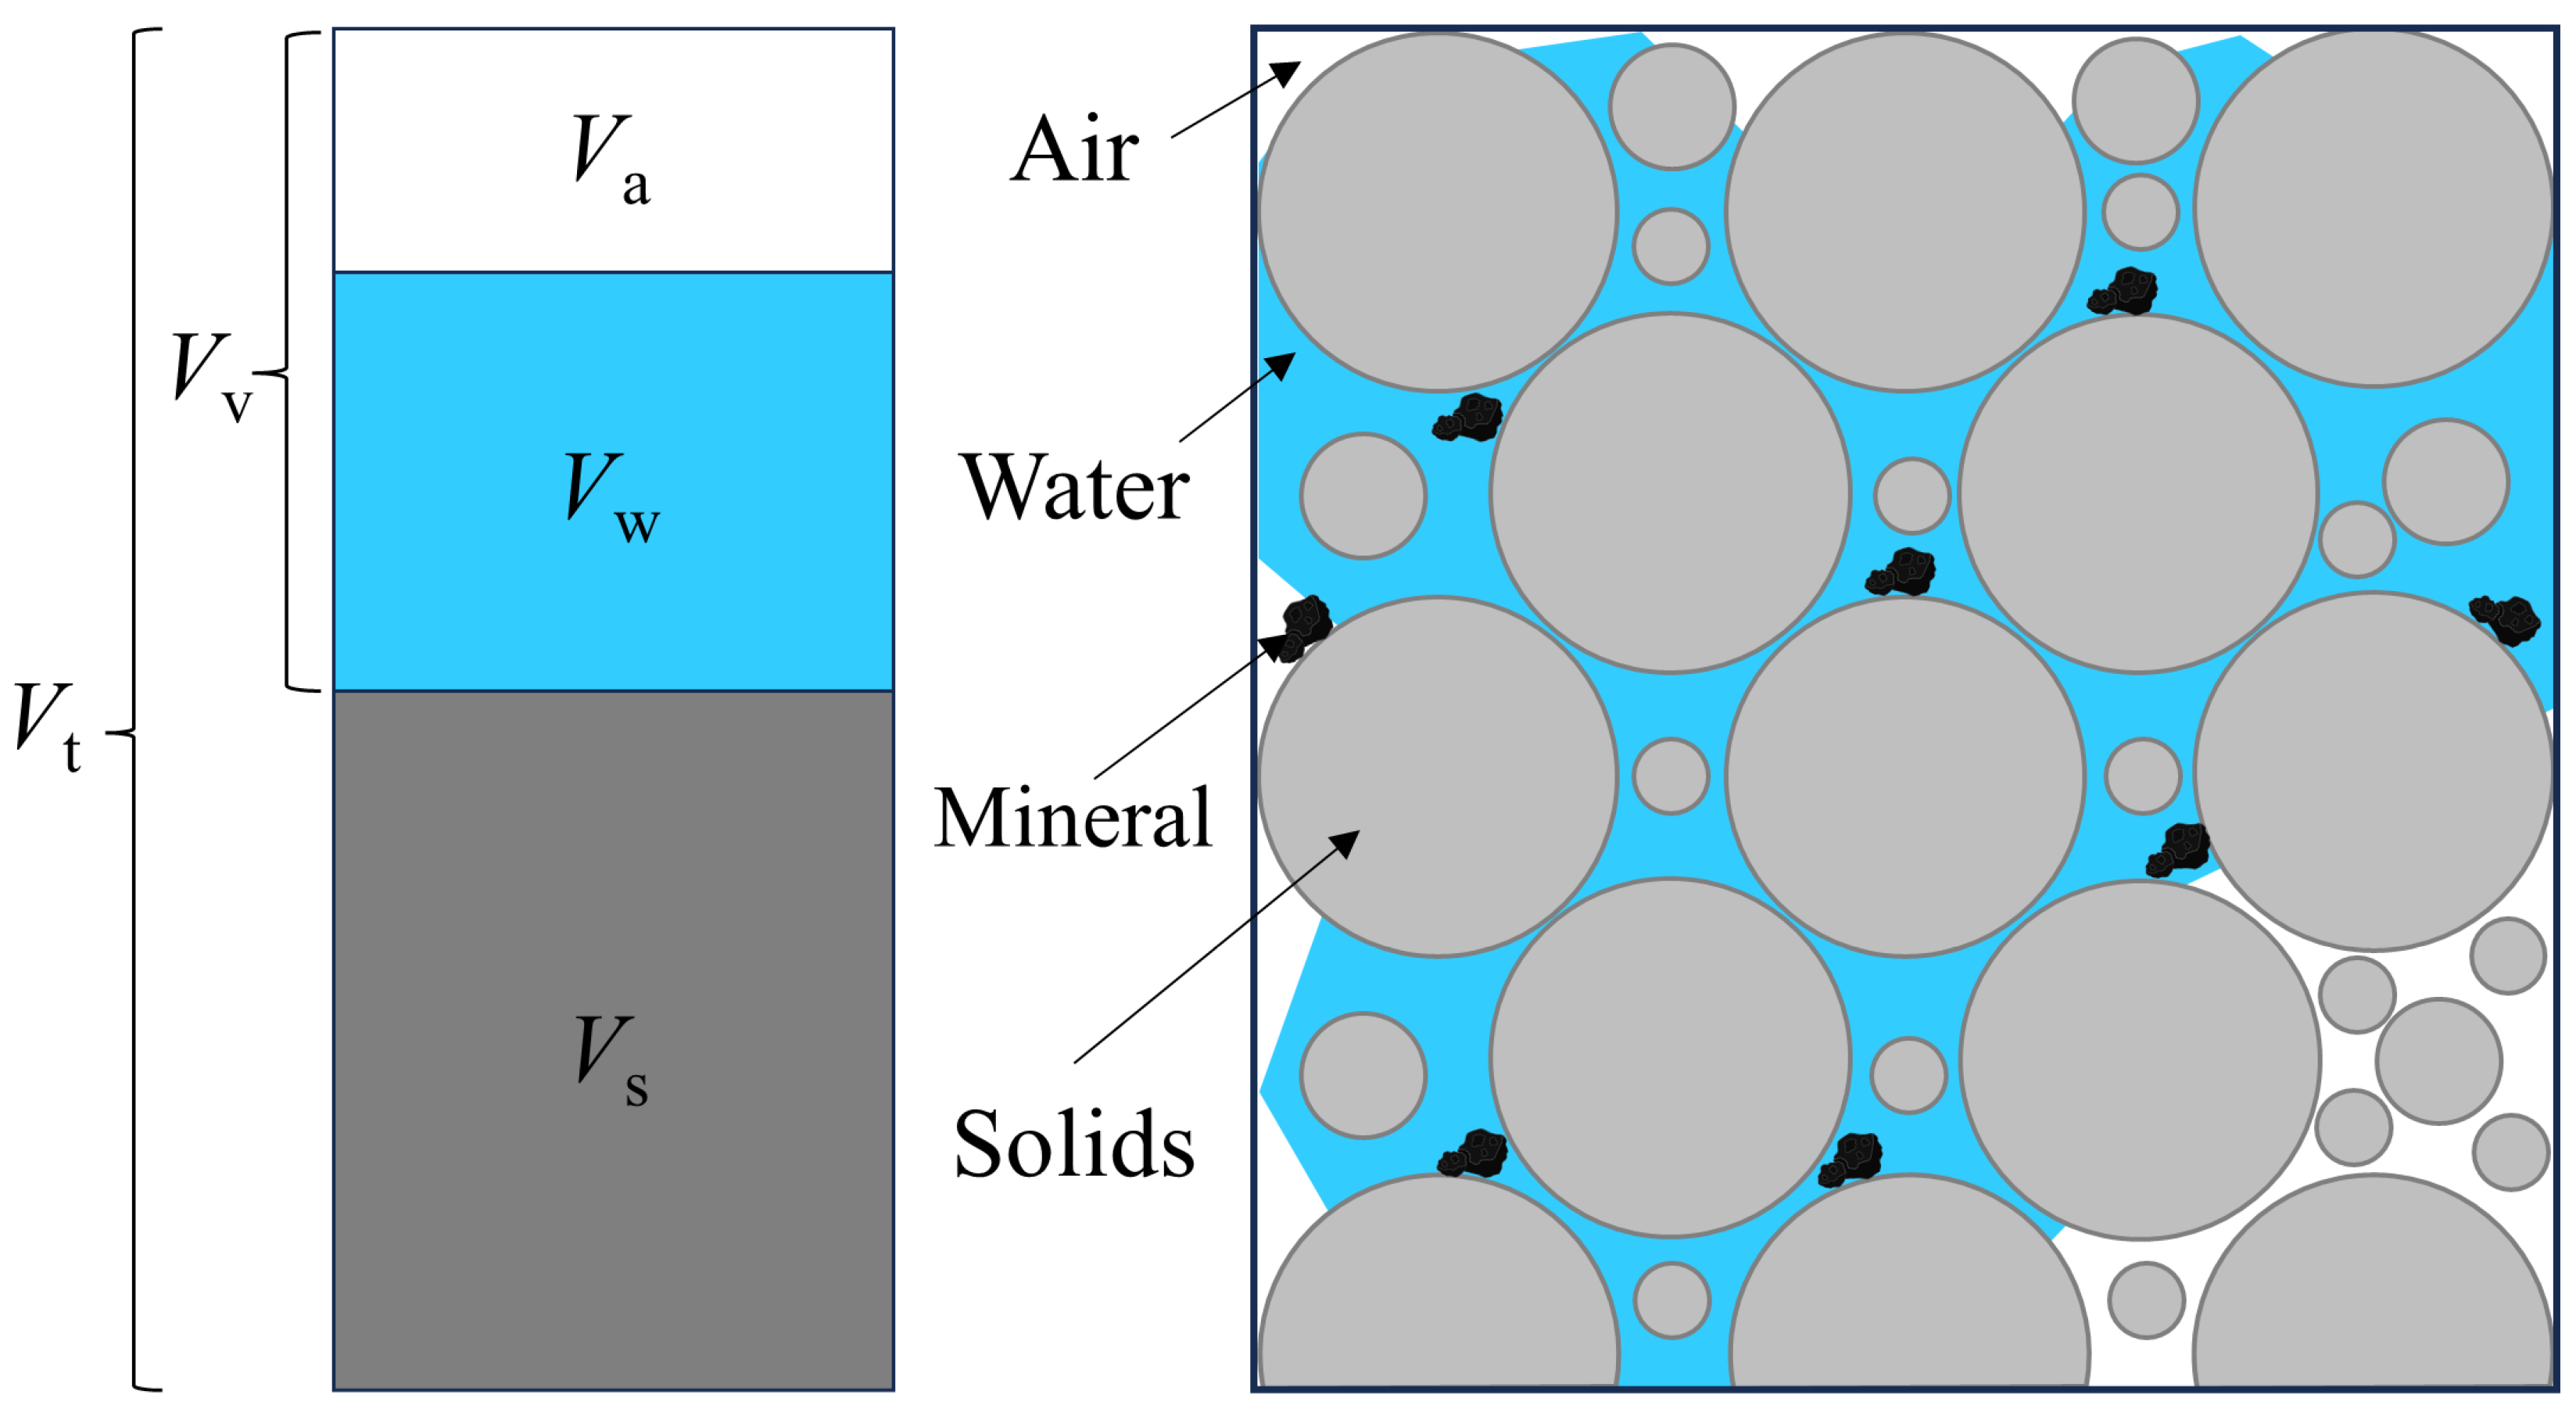
Figure 10.
Diagram of seepage test using a constant-head approach, where the Marriot bottle maintains a constant hydraulic head Δh, allowing for the measurement of water passing through the porous media (total length ΔL) within a specific time interval t.
Figure 10.
Diagram of seepage test using a constant-head approach, where the Marriot bottle maintains a constant hydraulic head Δh, allowing for the measurement of water passing through the porous media (total length ΔL) within a specific time interval t.

Figure 11.
Schematic illustrating the concept of tortuosity in a REV, where Le is the effective length of a flow channel, and Ls is the straight-line distance through a porous media. Note that grey circles represent solid particles in the graphical representation.
Figure 11.
Schematic illustrating the concept of tortuosity in a REV, where Le is the effective length of a flow channel, and Ls is the straight-line distance through a porous media. Note that grey circles represent solid particles in the graphical representation.
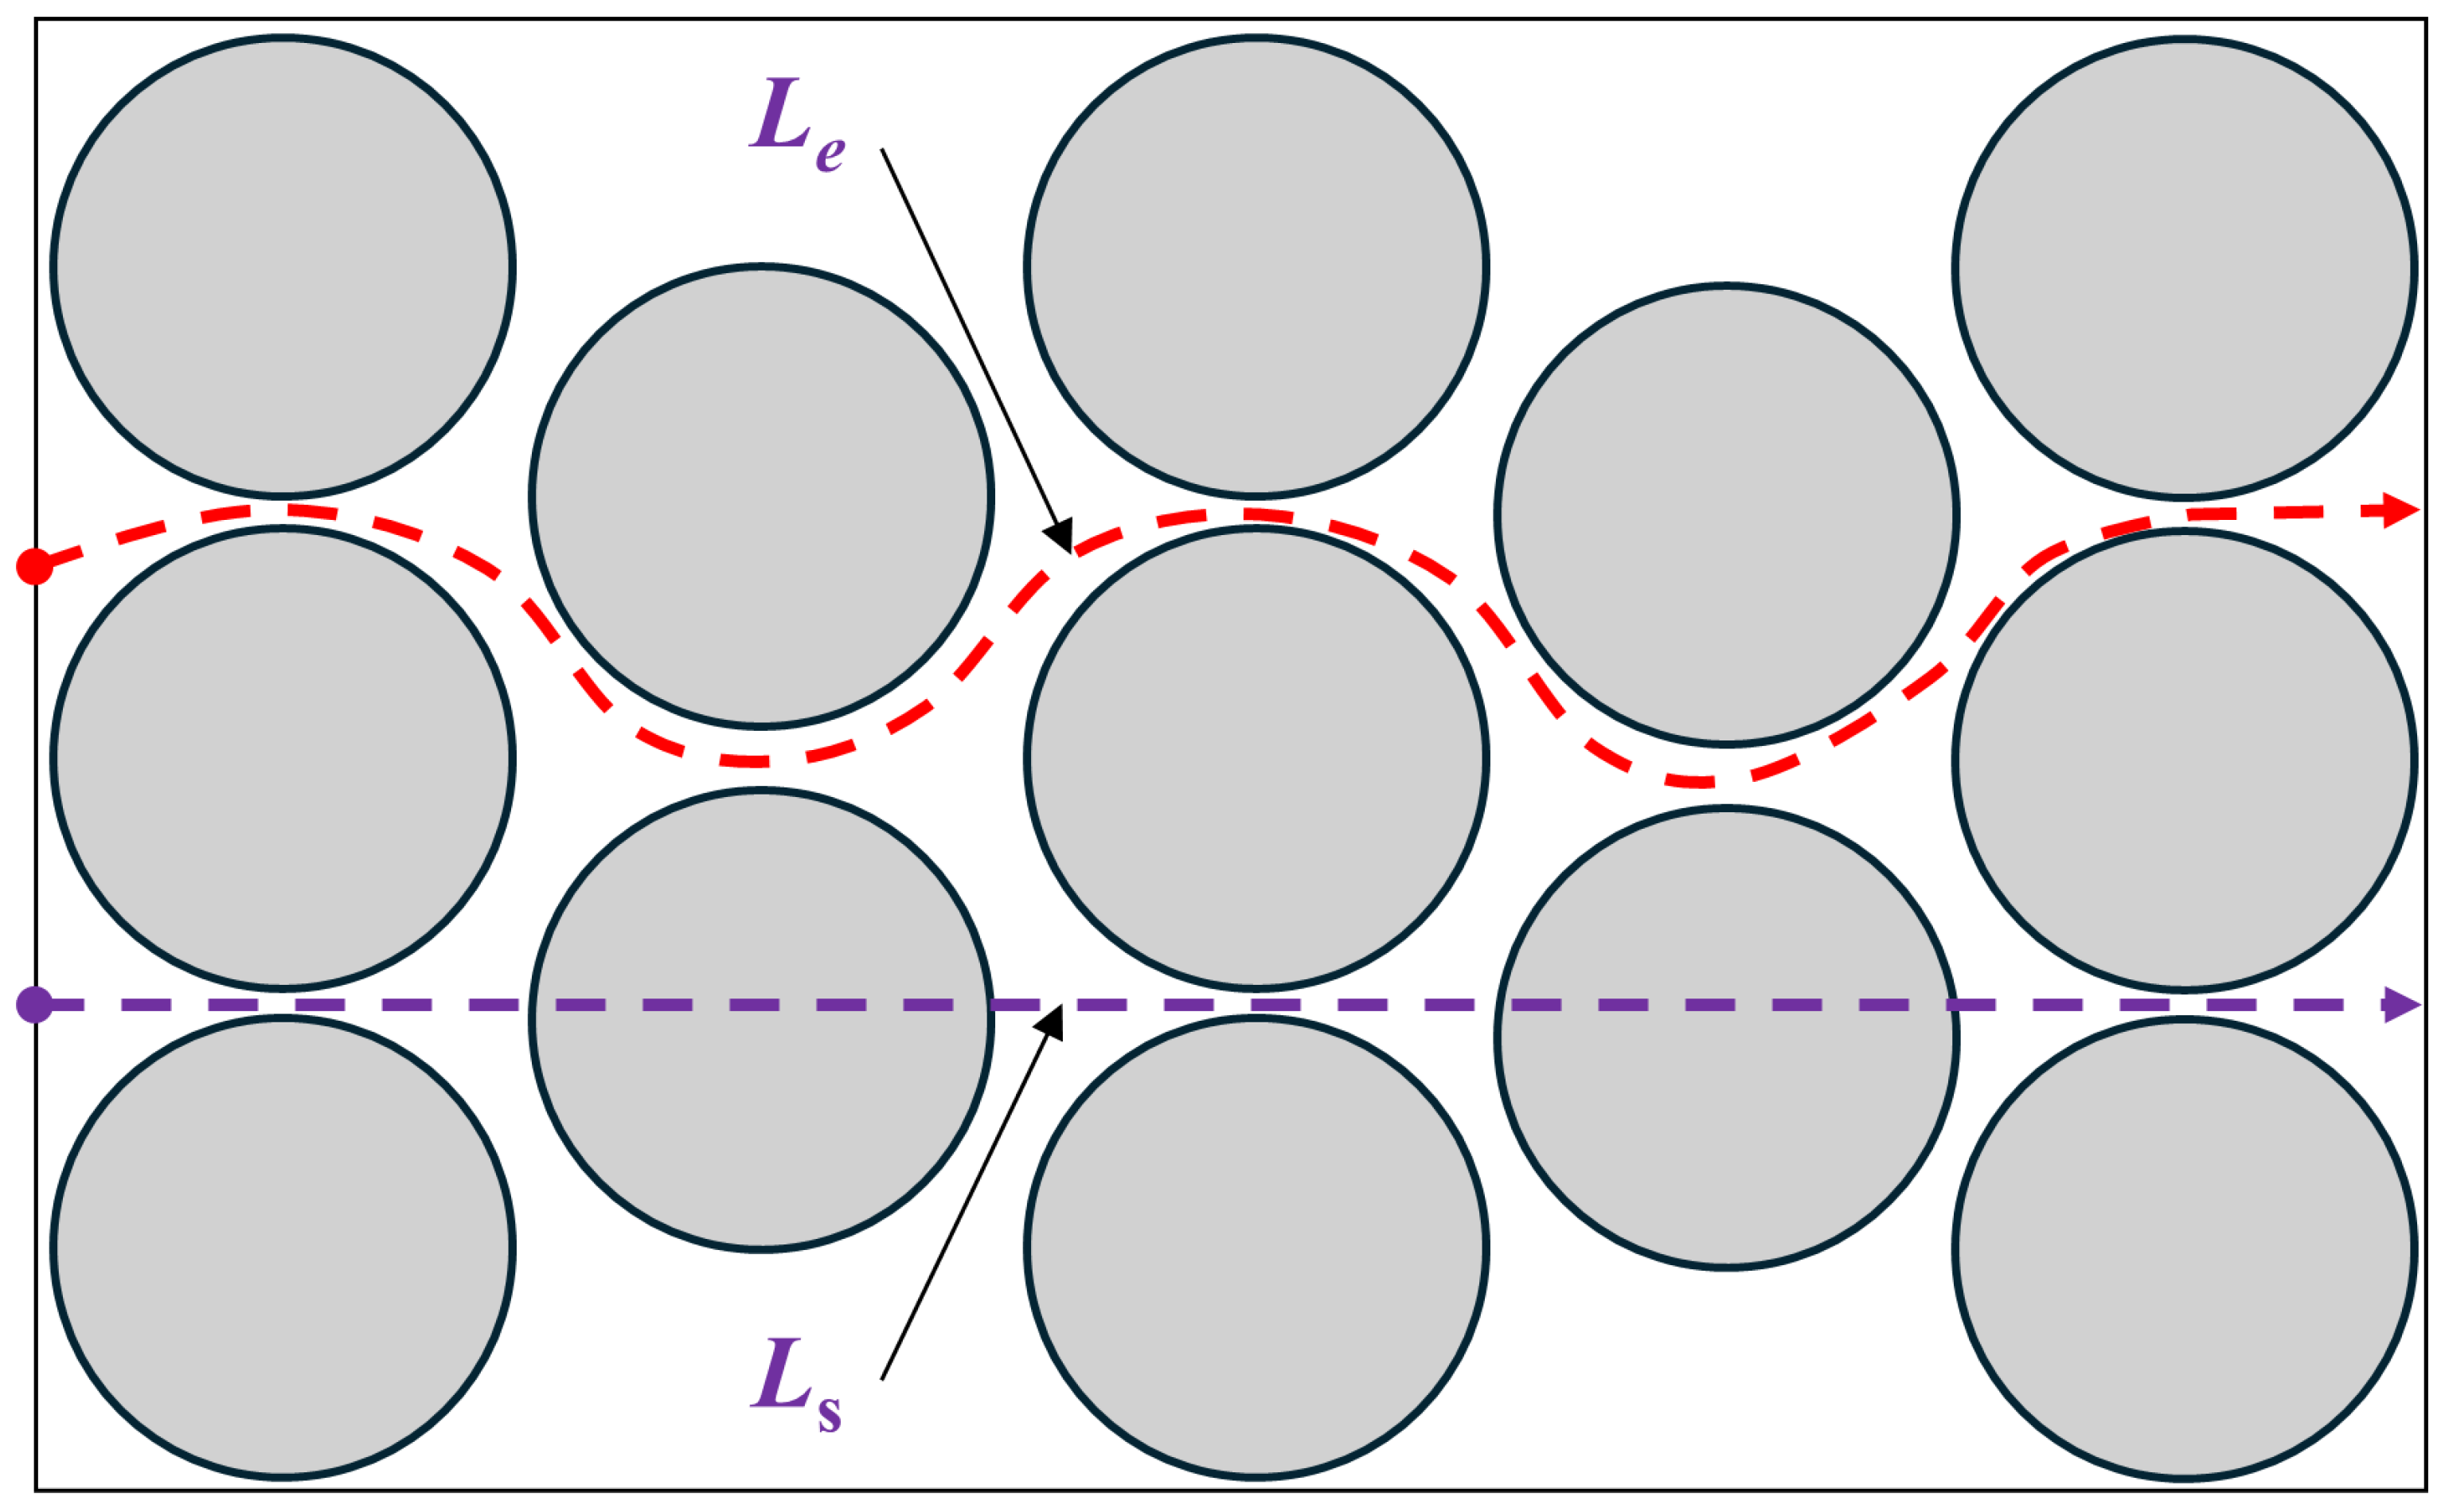
Figure 12.
Comparison of predicted tortuosity as a function of porosity using Equations (13)–(17).
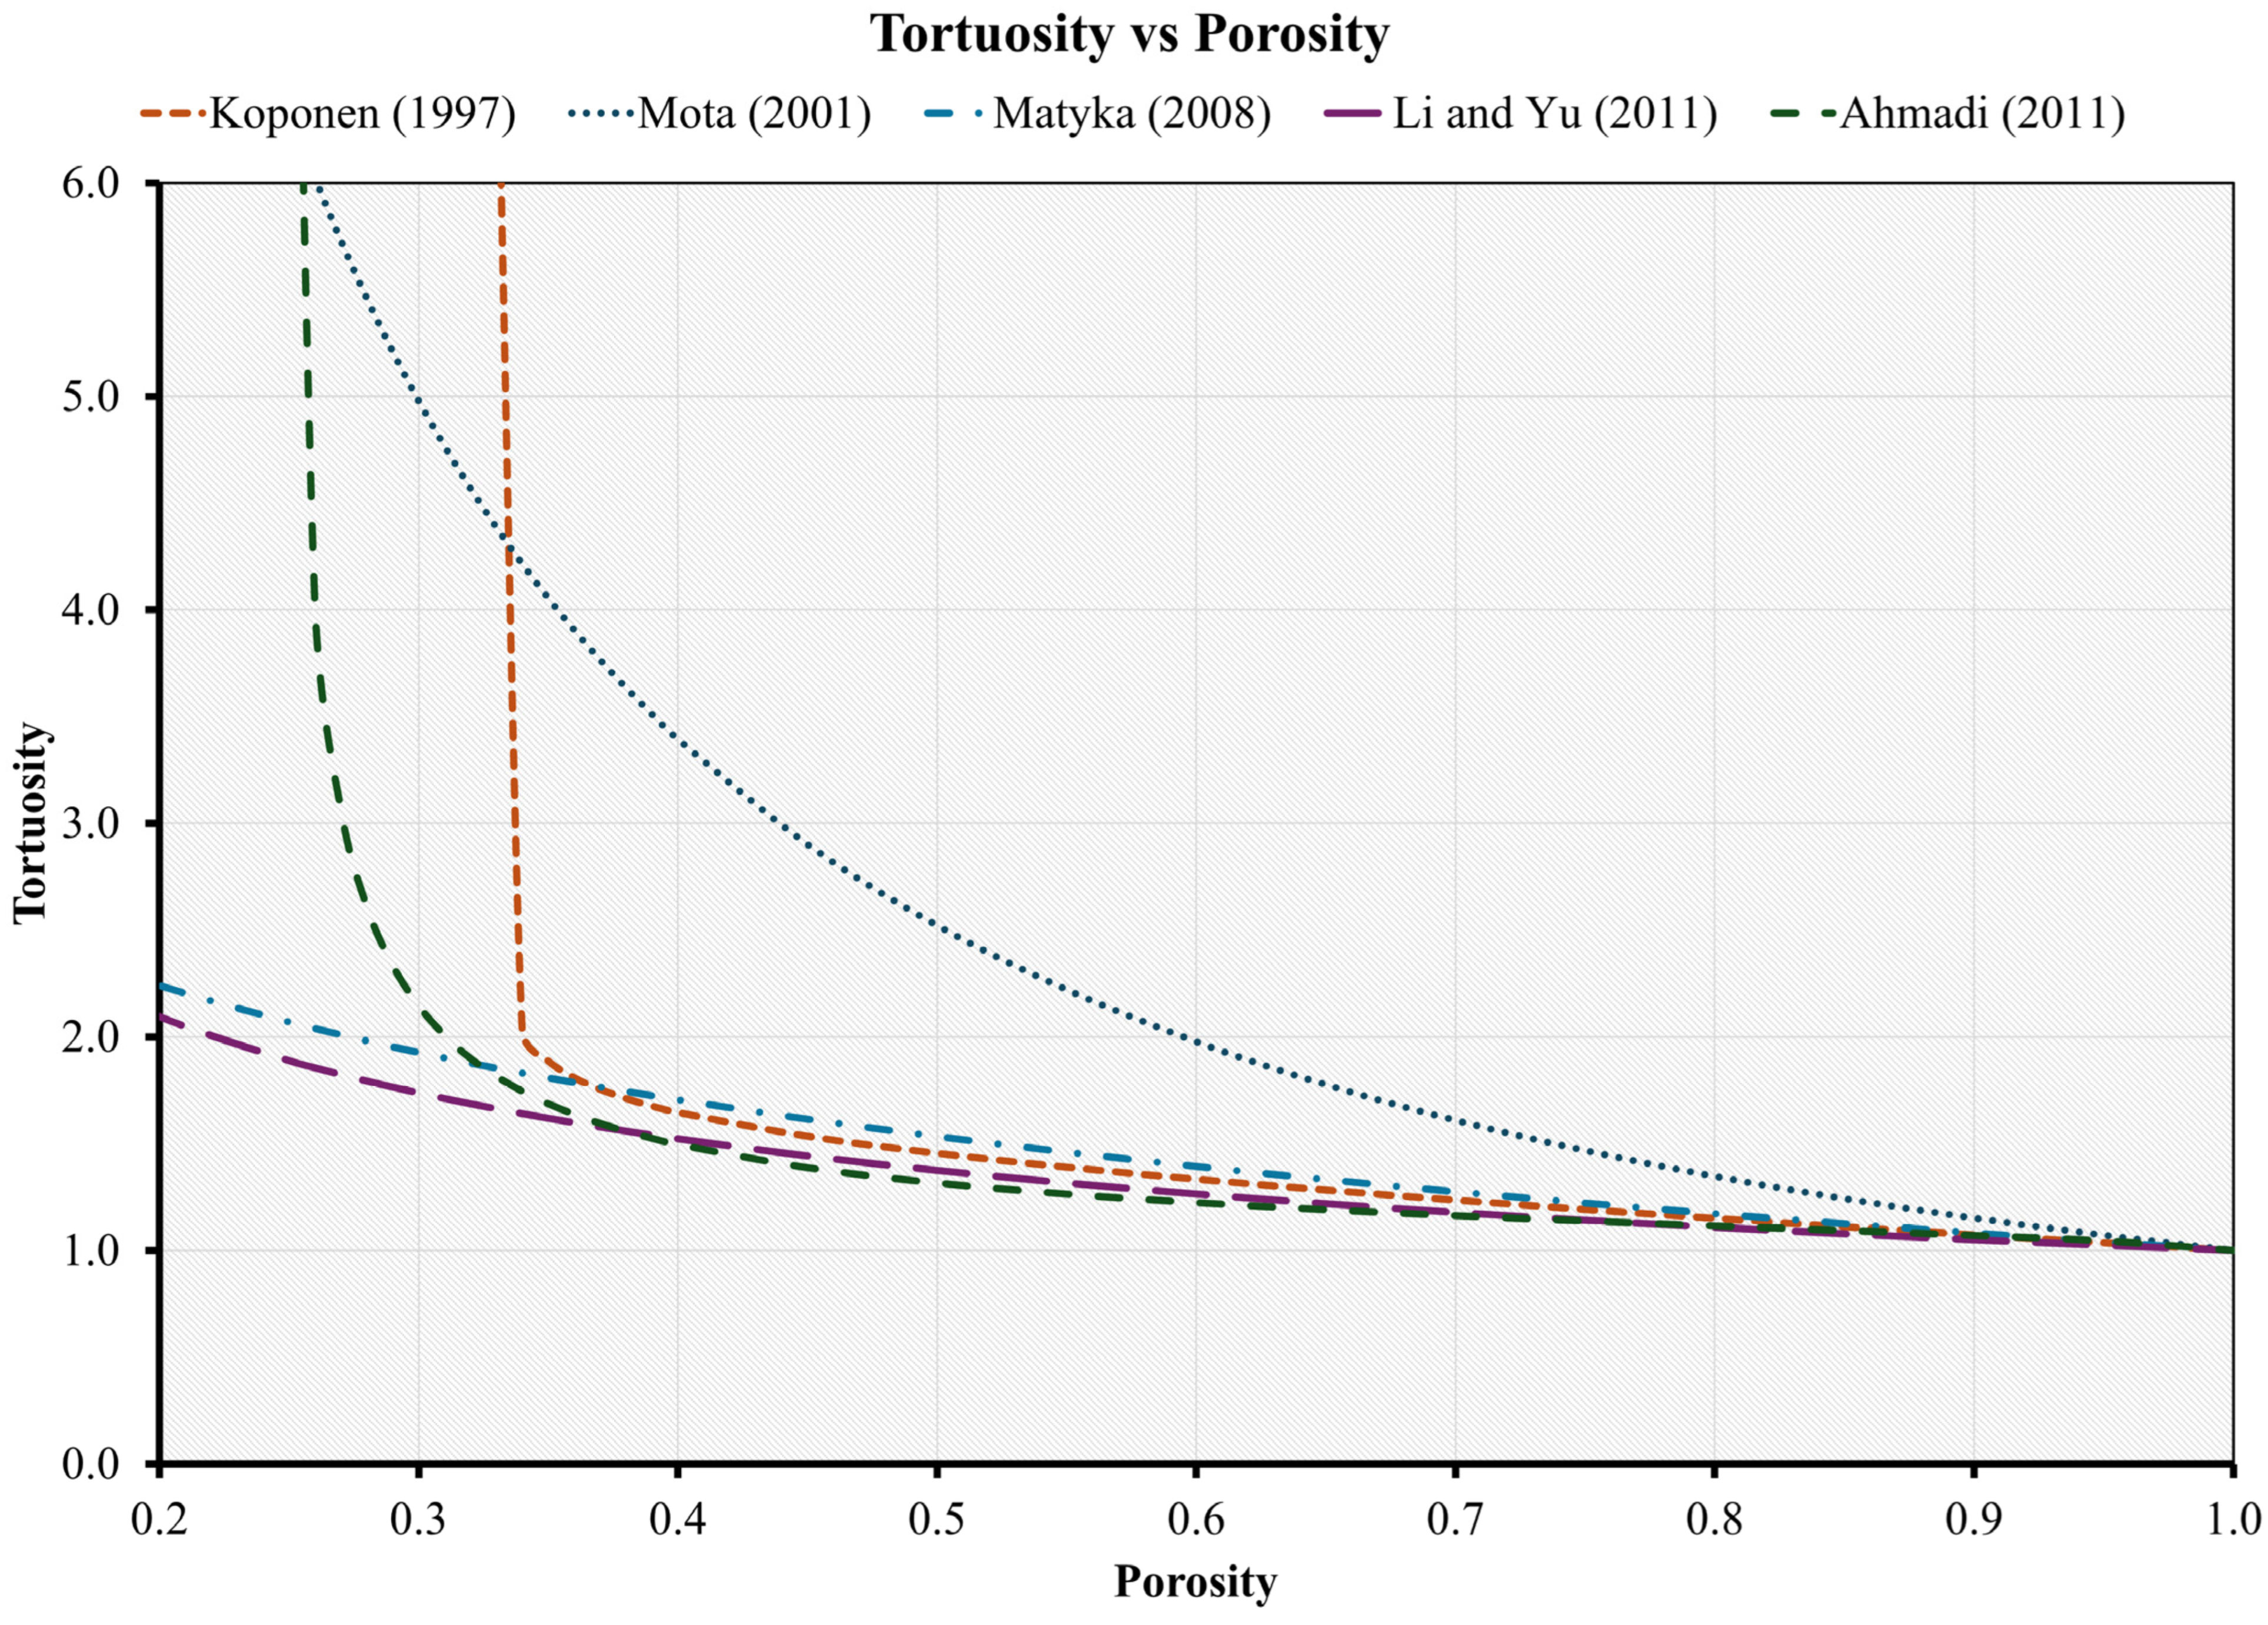
Figure 13.
Diagram illustrating the surface area and volume of an idealized spherical particle, where r is the radius of the particle, and Δr is the increase in radius as a result of Fe precipitation uniformly coating the solid particle.
Figure 13.
Diagram illustrating the surface area and volume of an idealized spherical particle, where r is the radius of the particle, and Δr is the increase in radius as a result of Fe precipitation uniformly coating the solid particle.
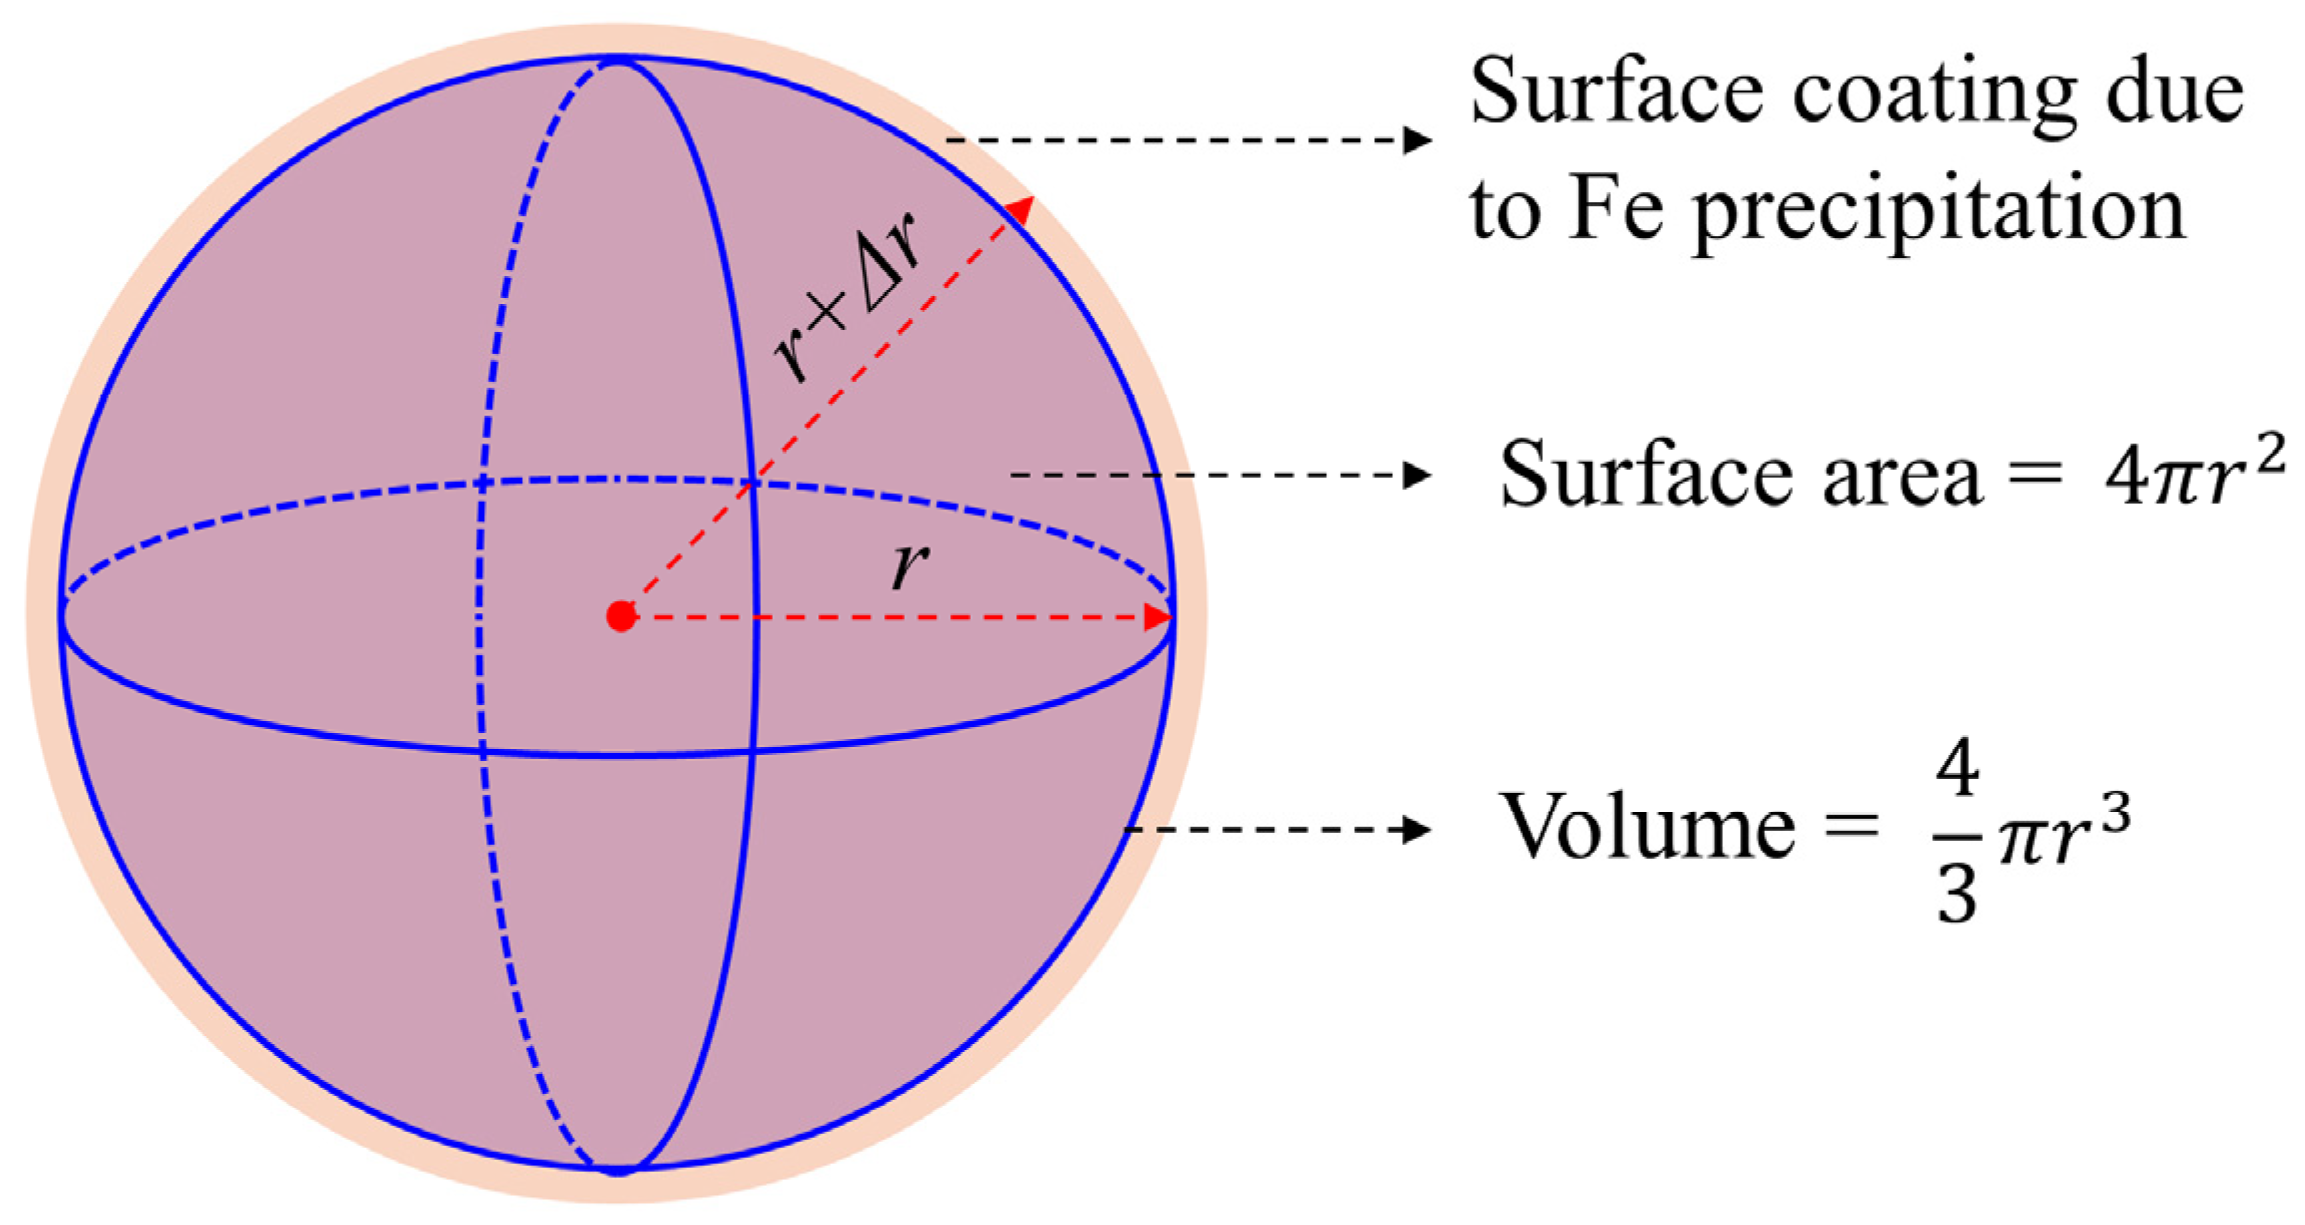
Figure 14.
(a) Pore-scale approach for which porosity is completely addressed. The grey area indicates solid particles, while the orange area indicates pore space. (b) Hybrid-scale approach that manages the solid and porous areas in a framework, and (c) continuum-scale approach for all REVs with a mixture of fluid and solid.

Figure 15.
A demonstration of CFD using LBM coupled with DEM: (a) CFD carried out using LBM and (b) soil particle package set inside a REV using DEM.
Figure 15.
A demonstration of CFD using LBM coupled with DEM: (a) CFD carried out using LBM and (b) soil particle package set inside a REV using DEM.
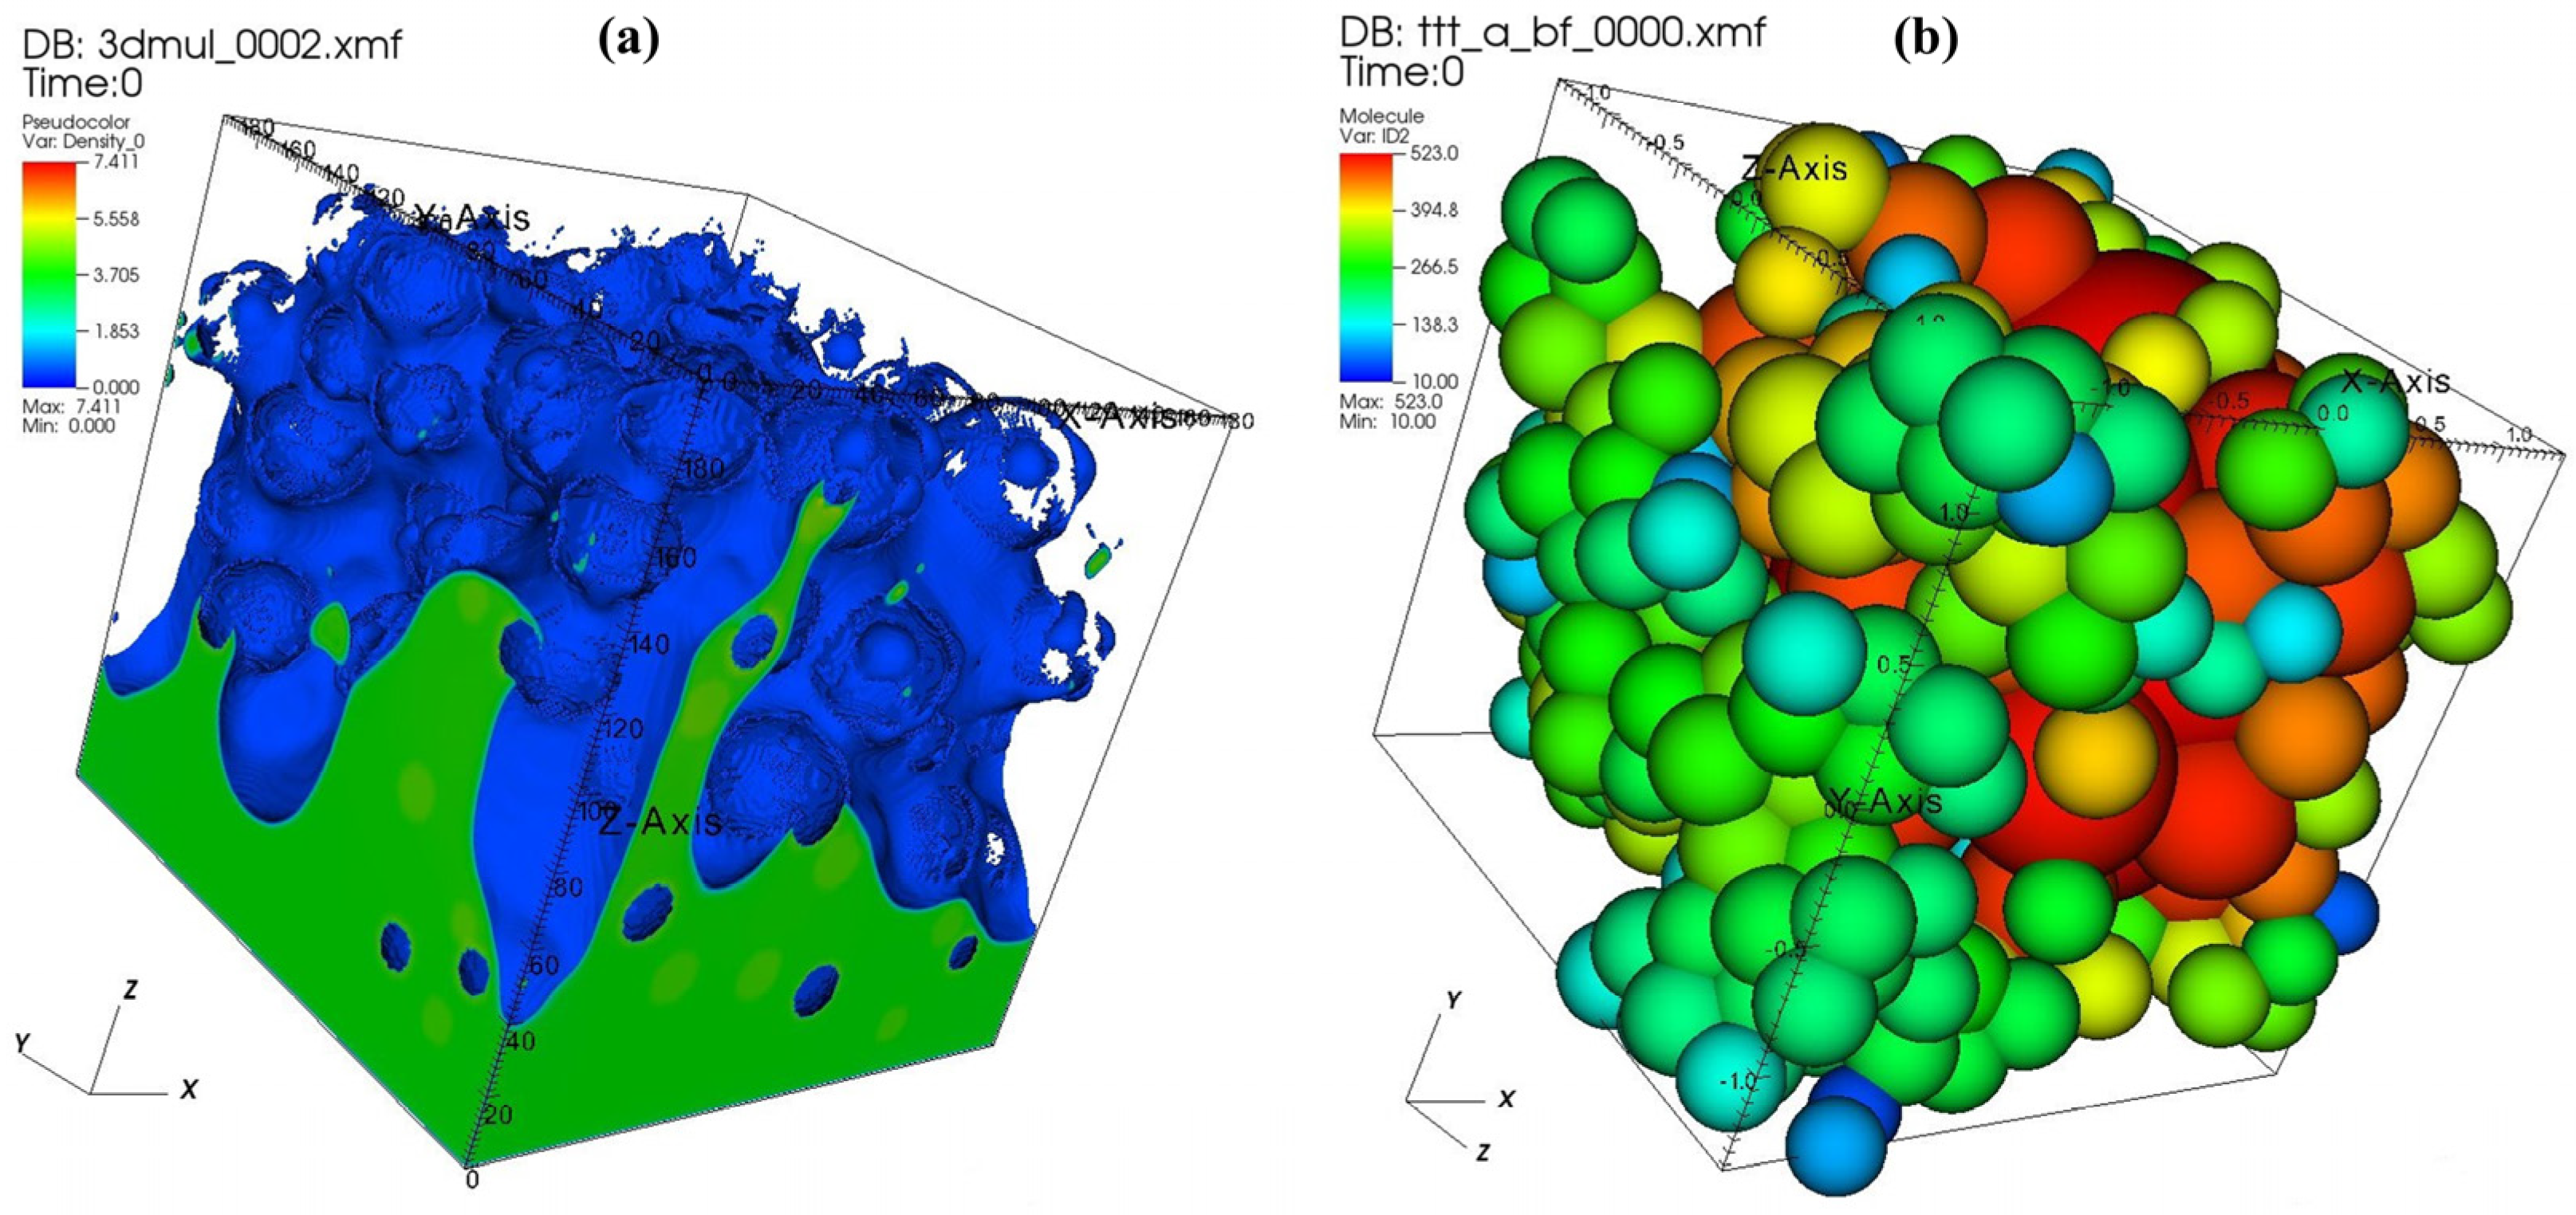
Disclaimer/Publisher’s Note: The statements, opinions and data contained in all publications are solely those of the individual author(s) and contributor(s) and not of MDPI and/or the editor(s). MDPI and/or the editor(s) disclaim responsibility for any injury to people or property resulting from any ideas, methods, instructions or products referred to in the content. |
© 2024 by the authors. Licensee MDPI, Basel, Switzerland. This article is an open access article distributed under the terms and conditions of the Creative Commons Attribution (CC BY) license (https://creativecommons.org/licenses/by/4.0/).
Share and Cite
MDPI and ACS Style
Cao, W.; Yan, G.; Hofmann, H.; Scheuermann, A. State of the Art on Fe Precipitation in Porous Media: Hydrogeochemical Processes and Evolving Parameters. J. Mar. Sci. Eng. 2024, 12, 690. https://doi.org/10.3390/jmse12040690
AMA Style
Cao W, Yan G, Hofmann H, Scheuermann A. State of the Art on Fe Precipitation in Porous Media: Hydrogeochemical Processes and Evolving Parameters. Journal of Marine Science and Engineering. 2024; 12(4):690. https://doi.org/10.3390/jmse12040690
Chicago/Turabian StyleCao, Wenran, Guanxi Yan, Harald Hofmann, and Alexander Scheuermann. 2024. "State of the Art on Fe Precipitation in Porous Media: Hydrogeochemical Processes and Evolving Parameters" Journal of Marine Science and Engineering 12, no. 4: 690. https://doi.org/10.3390/jmse12040690
Note that from the first issue of 2016, this journal uses article numbers instead of page numbers. See further details here.