
On the Sediment Dynamics in a Tidally Energetic Channel: The Inner Sound, Northern Scotland


Abstract
:
1. Introduction
2. Methods
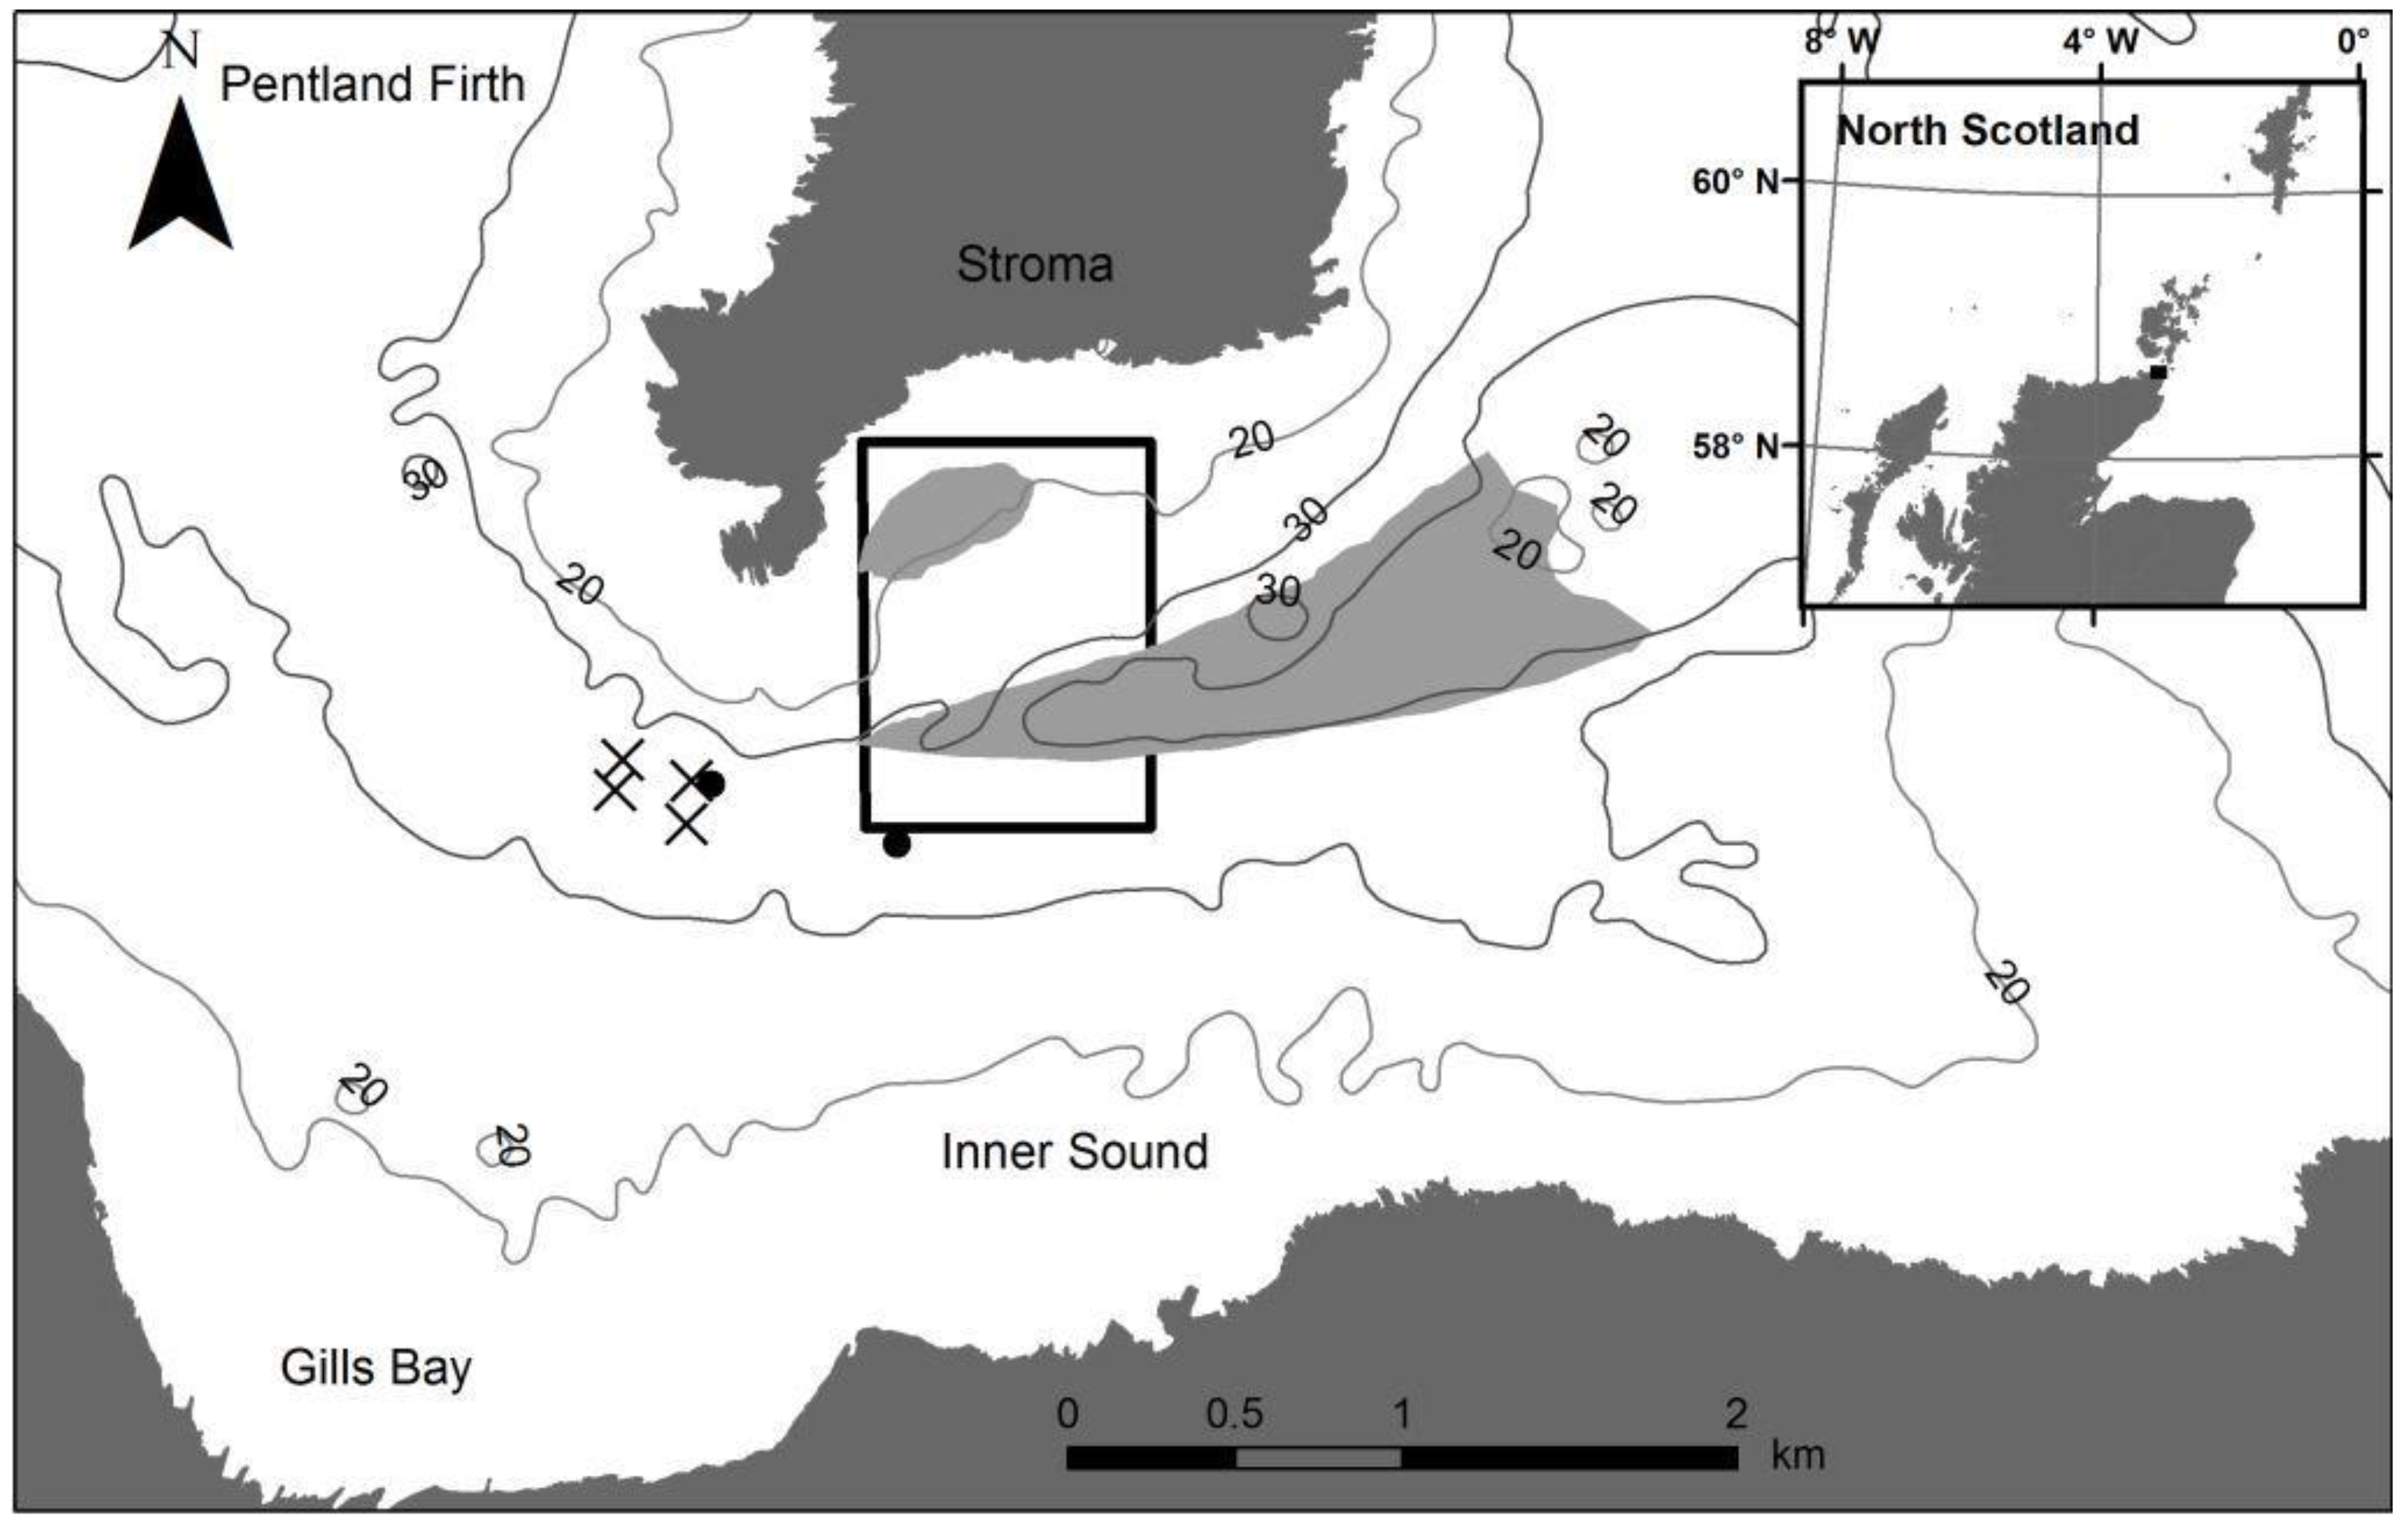
2.1. Study Site
2.2. Remotely Operated Vehicle
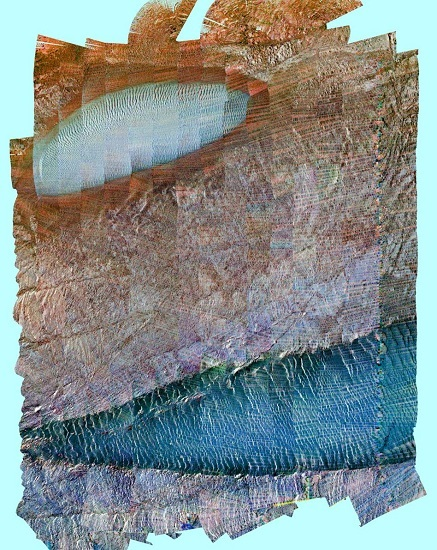
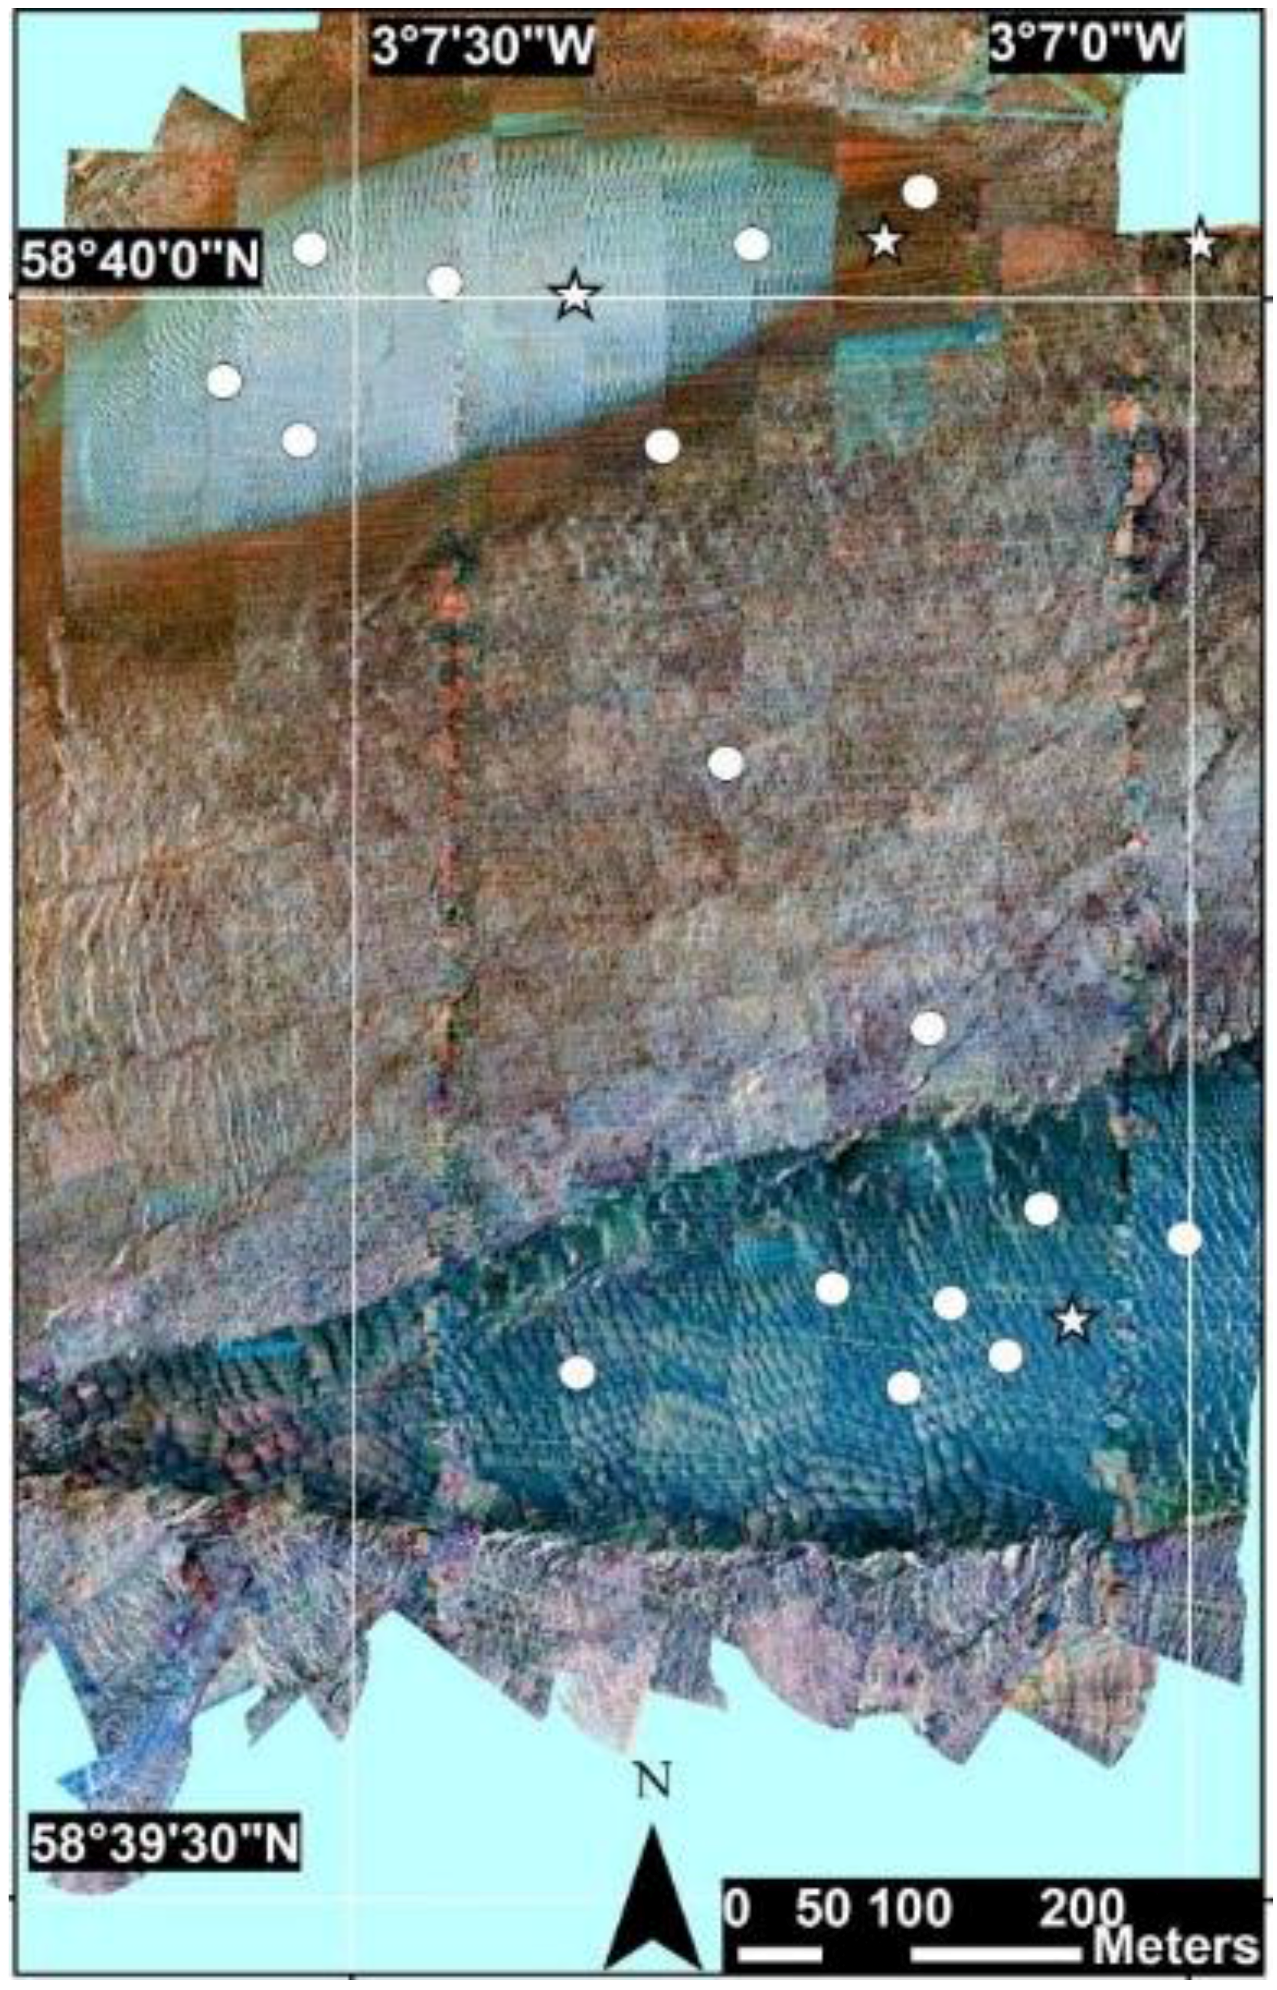
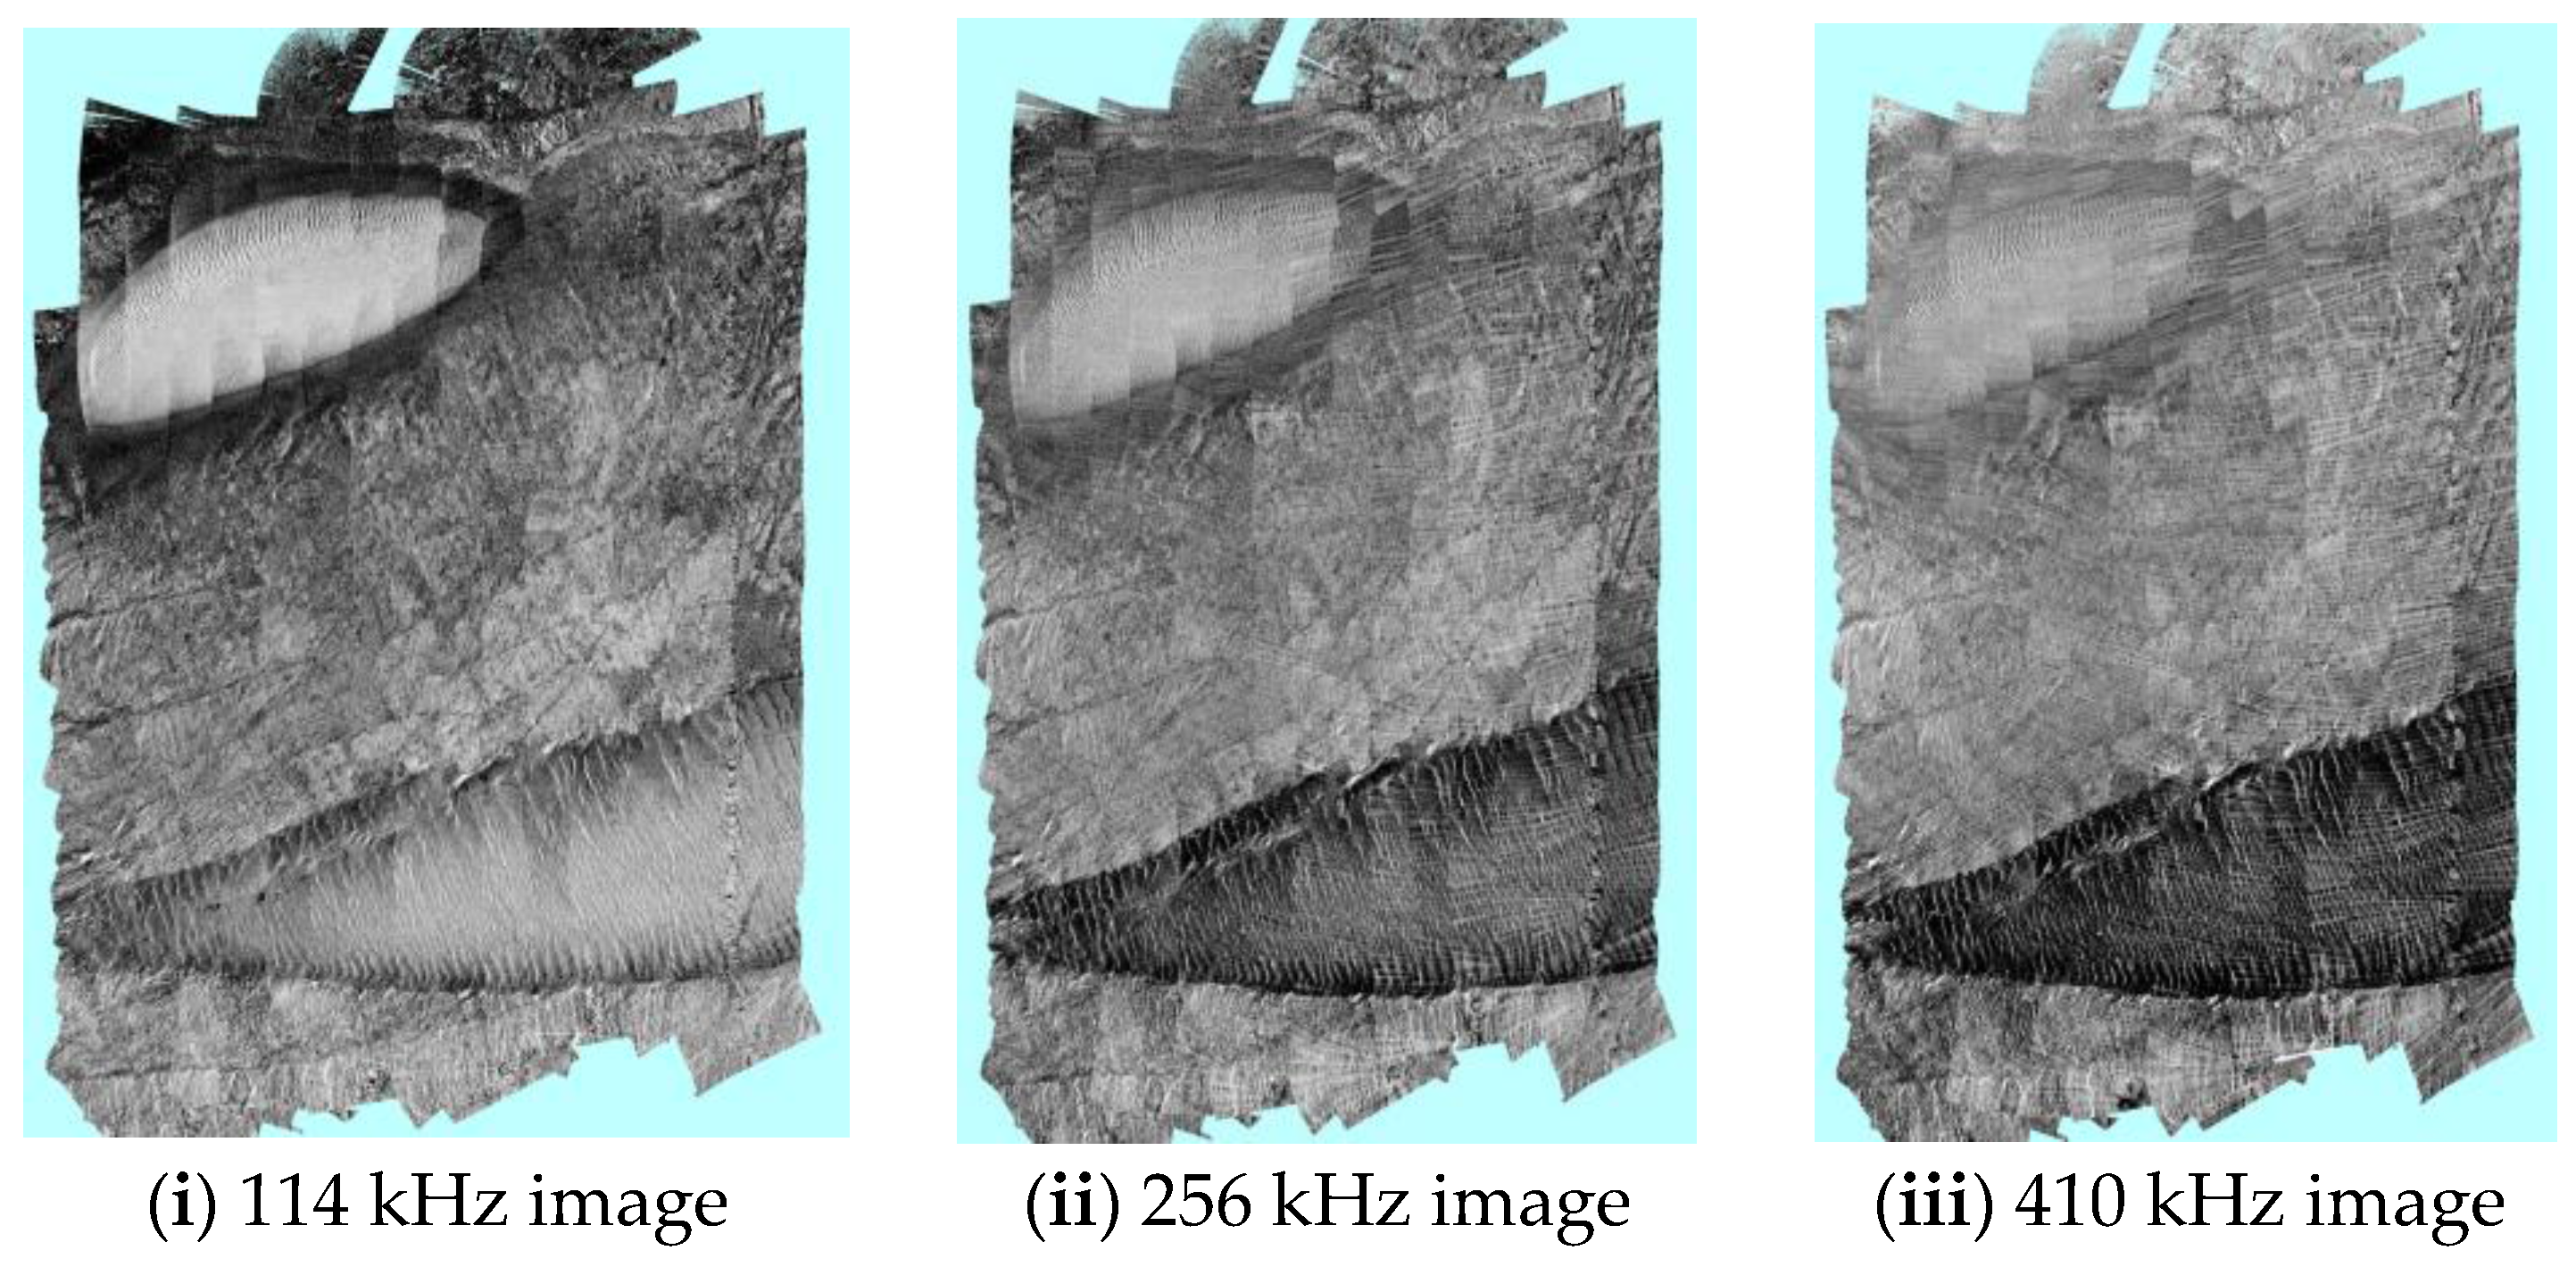
2.3. Side-Scan Sonar
2.4. Acoustic Doppler Current Profiler (ADCP)
2.5. Sea Surface Height Data
2.6. Hydrodynamic Model
3. Results
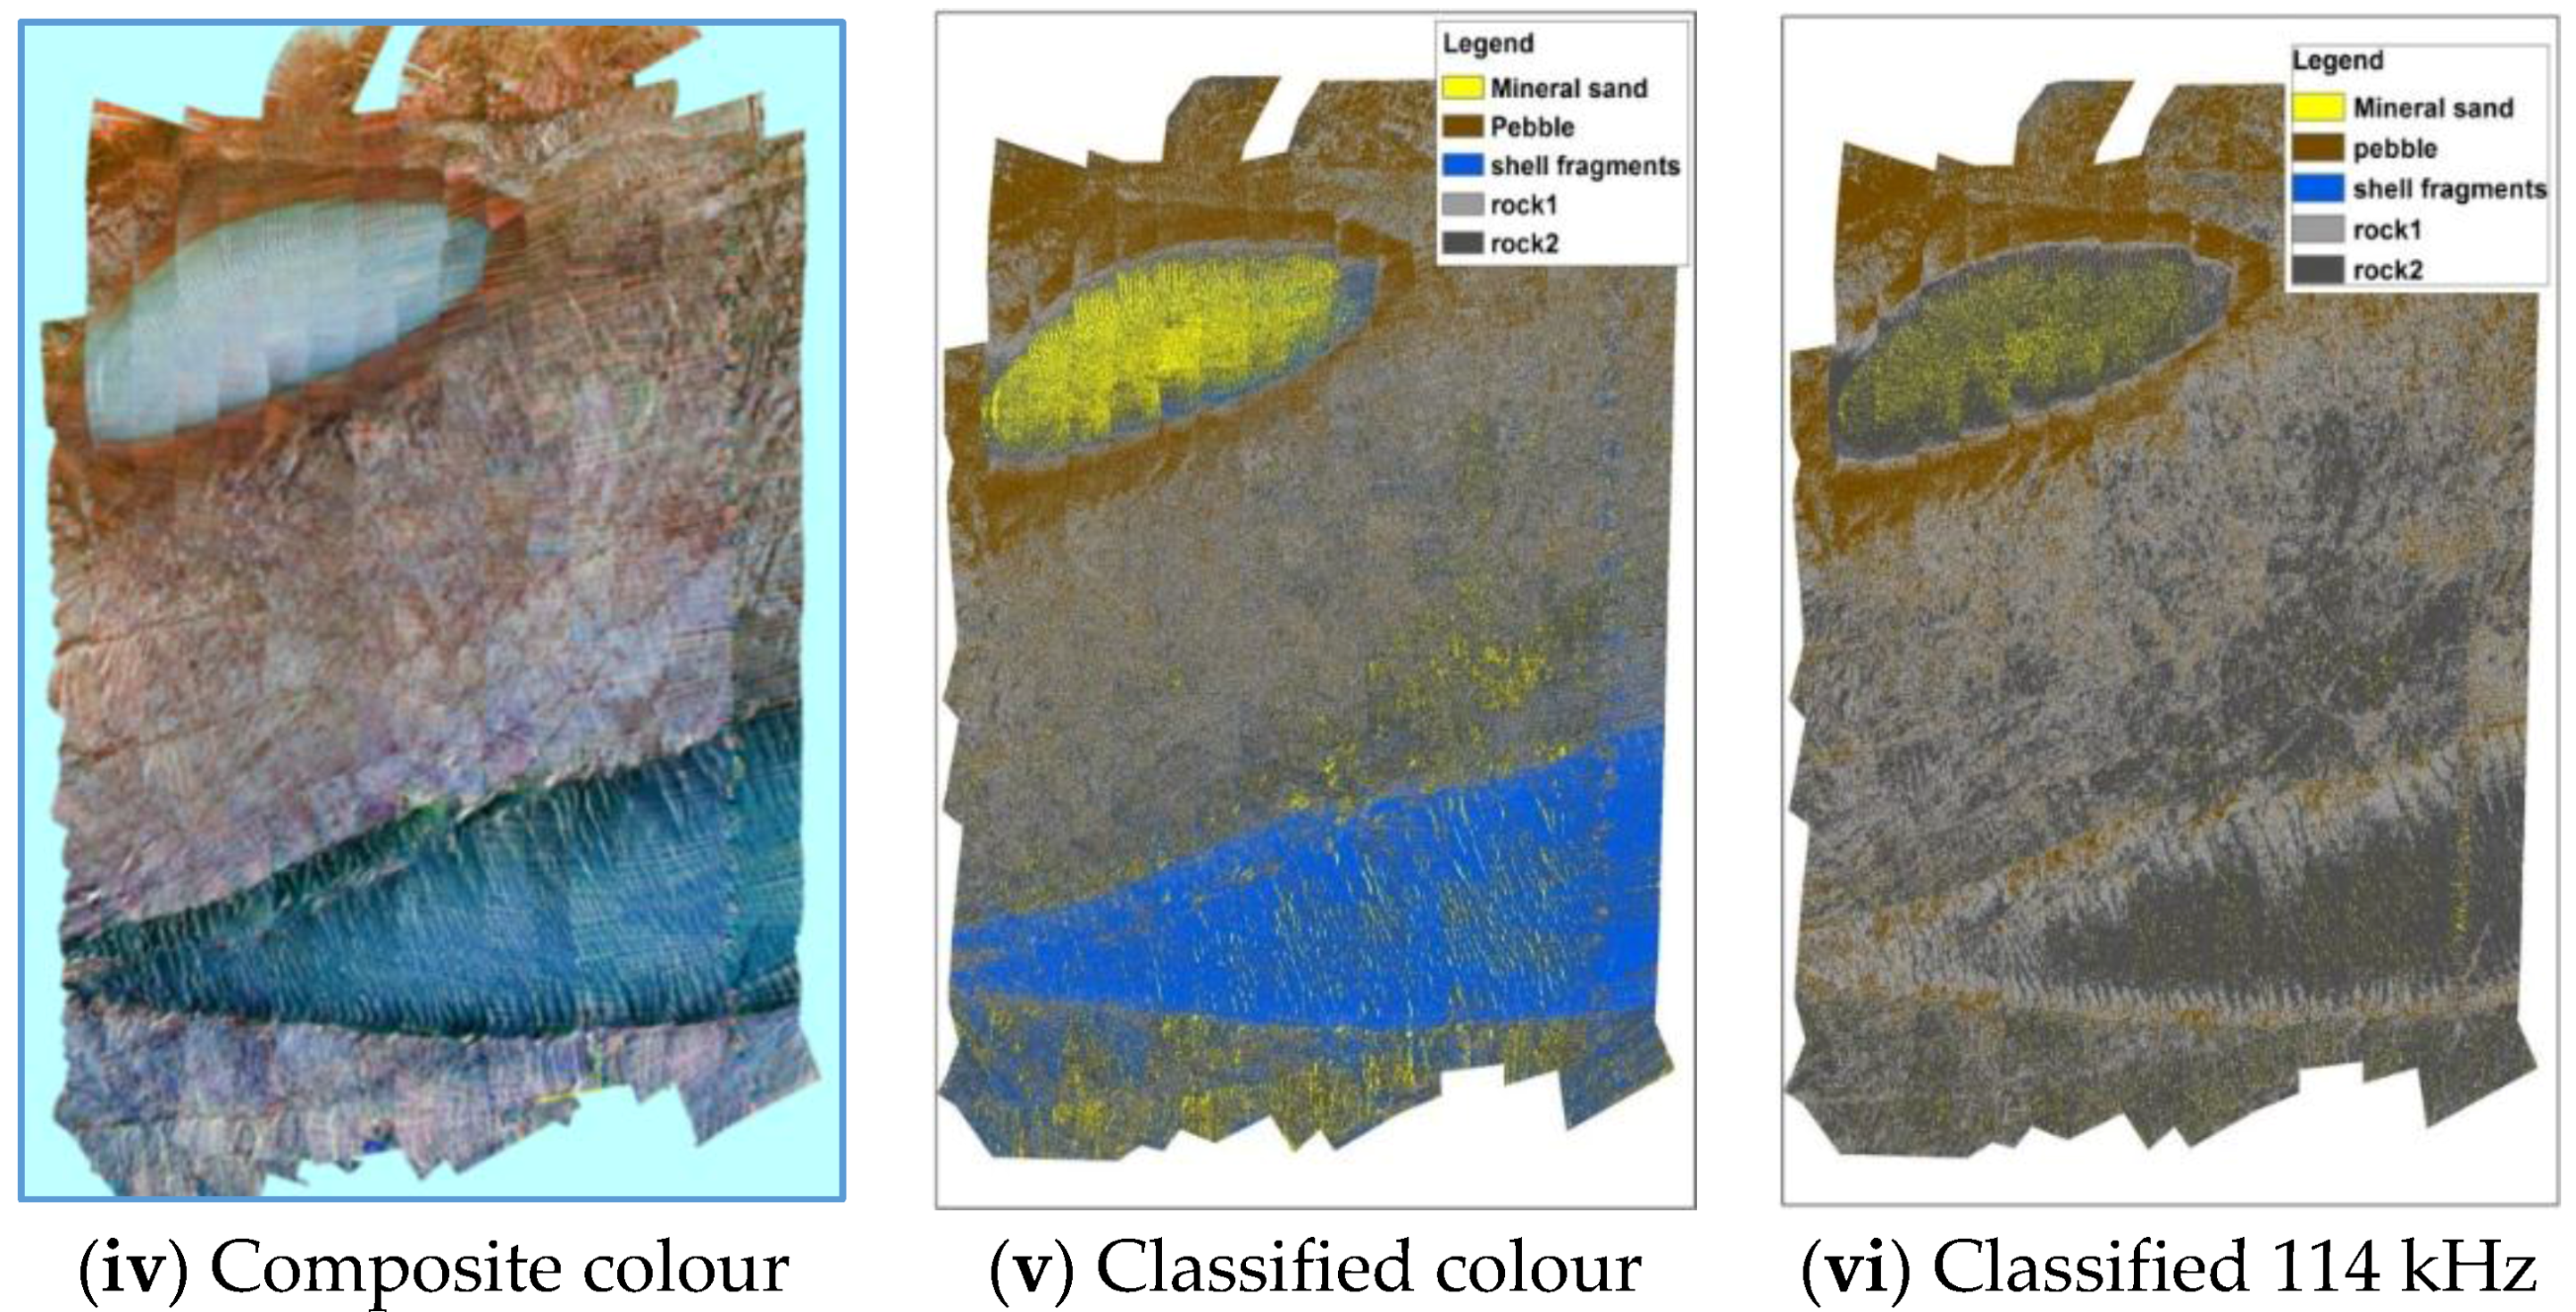
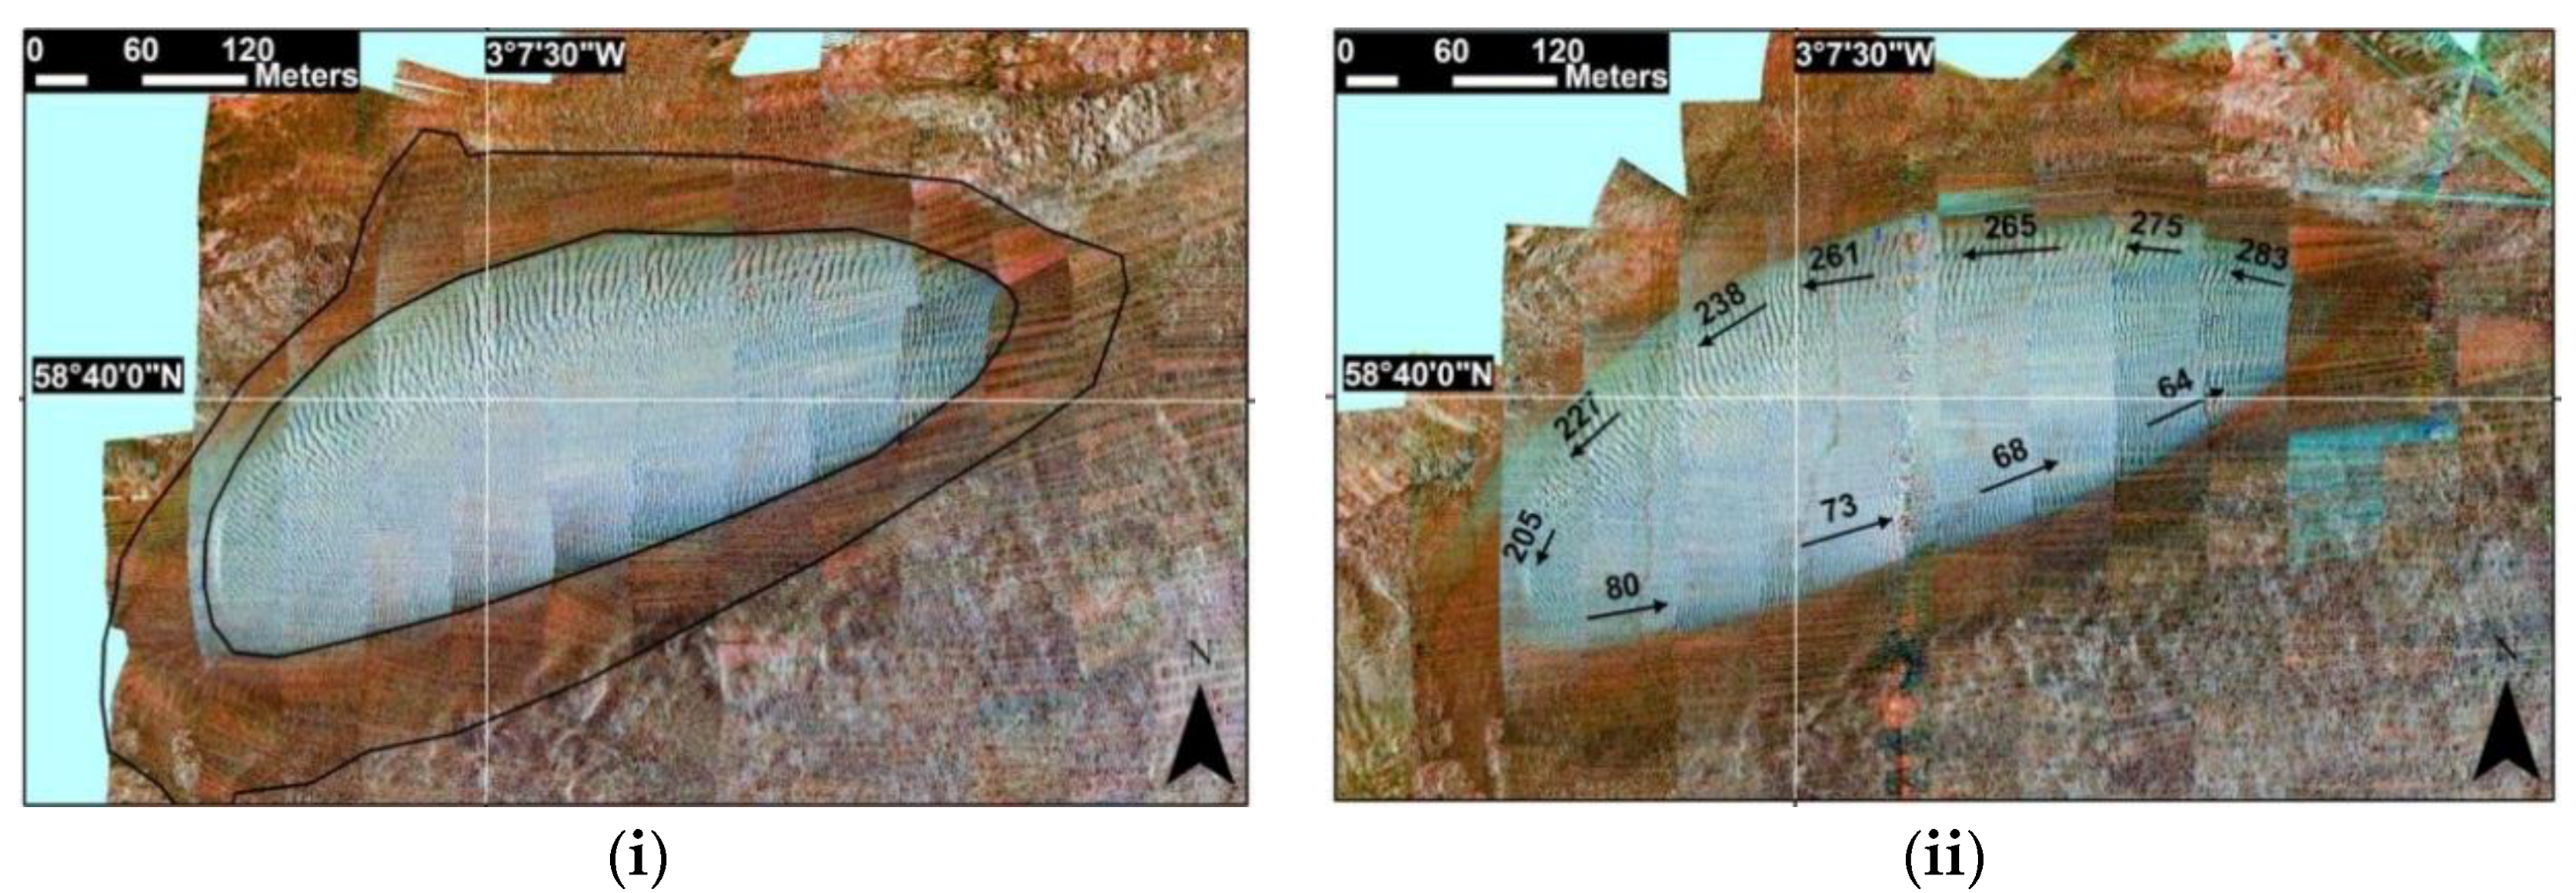
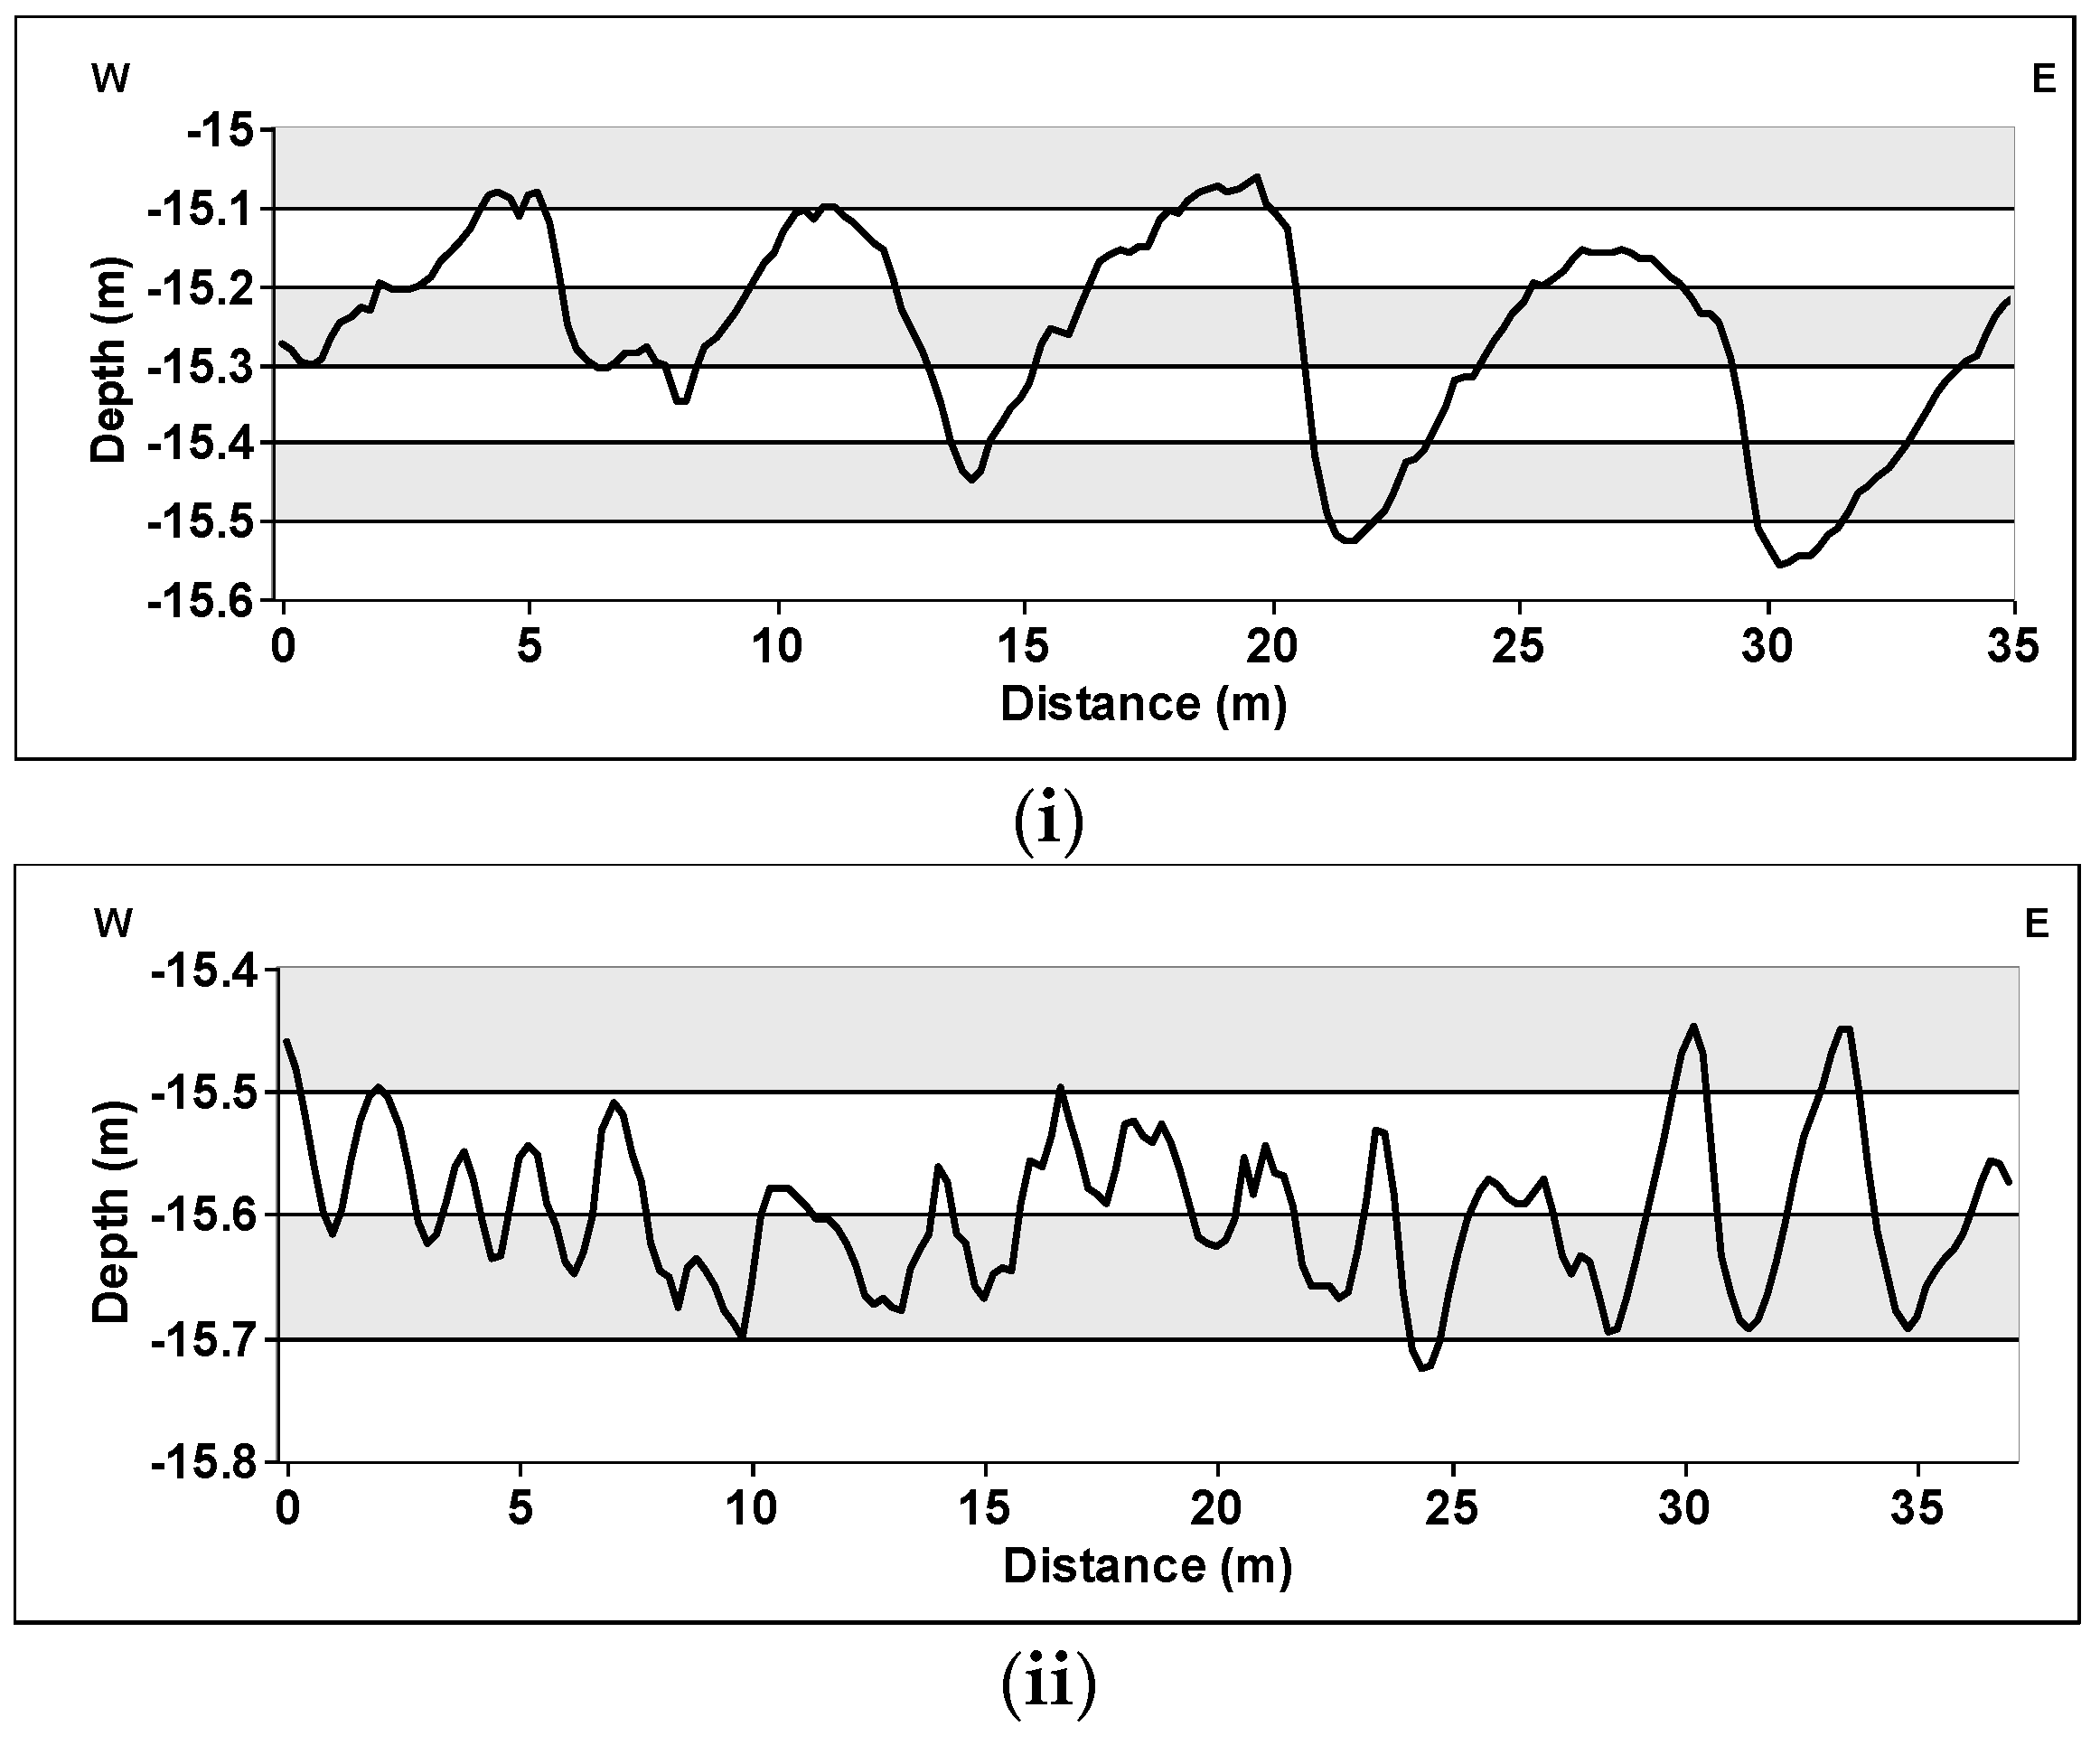
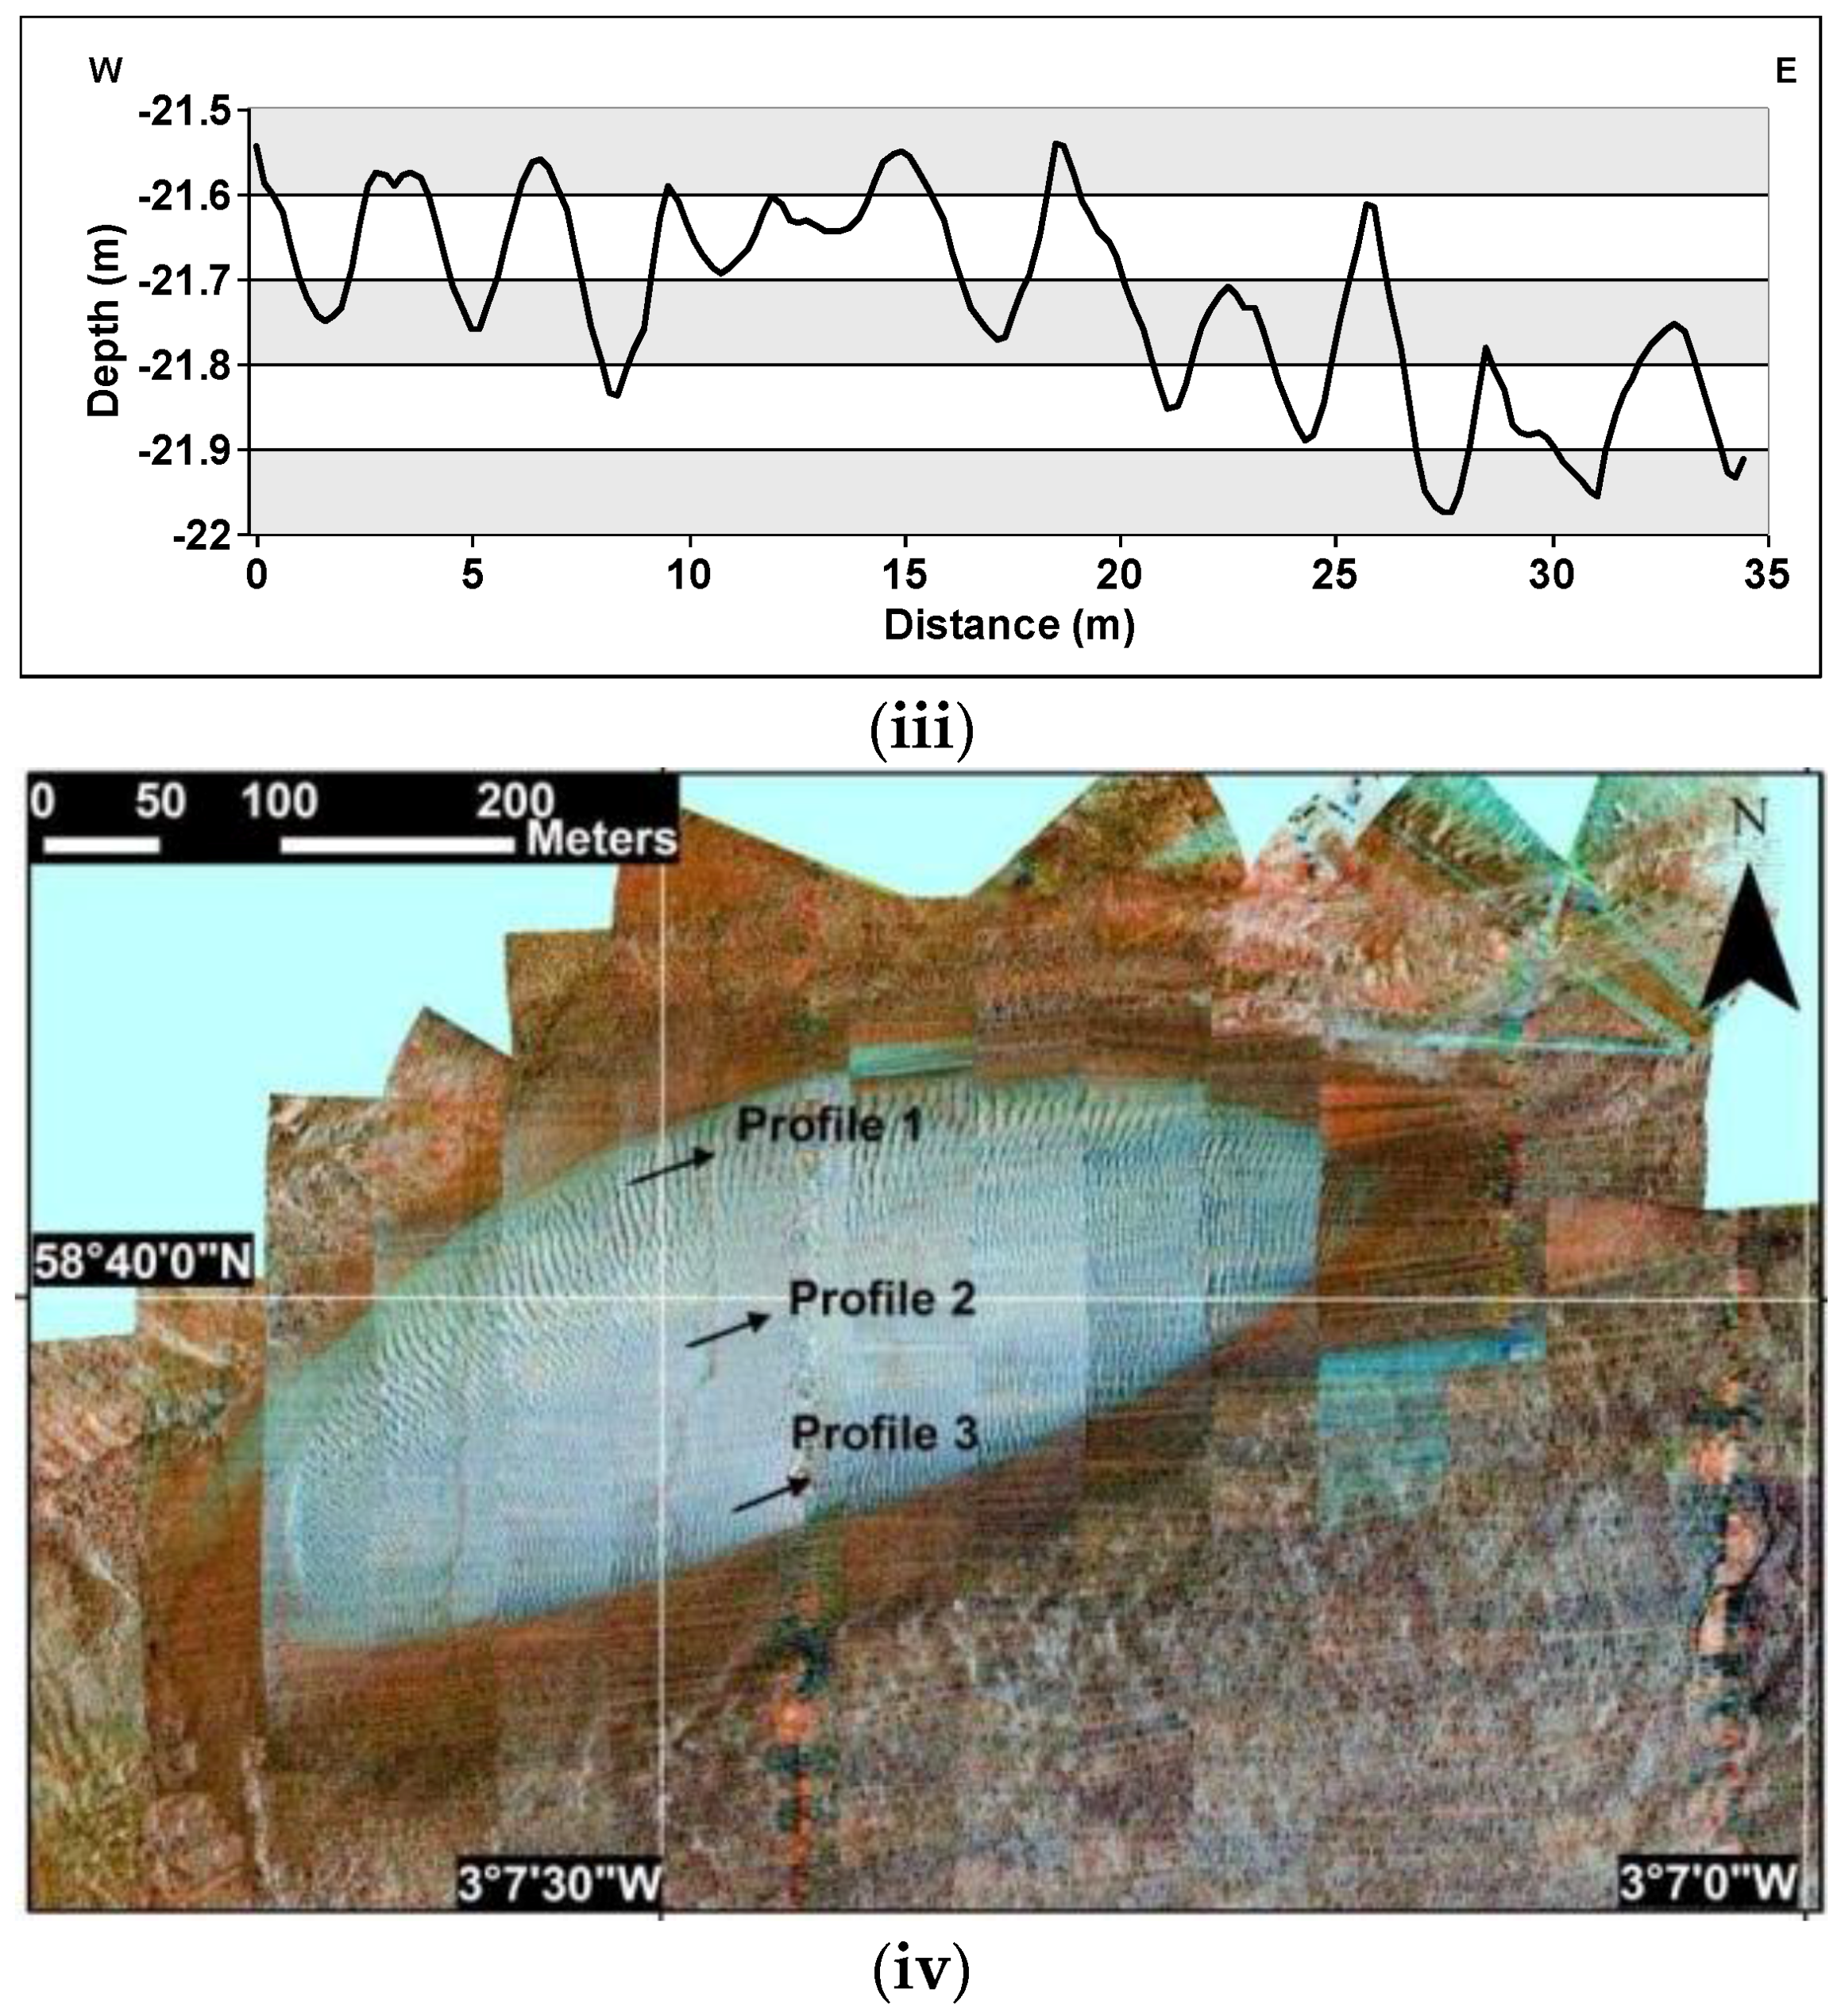
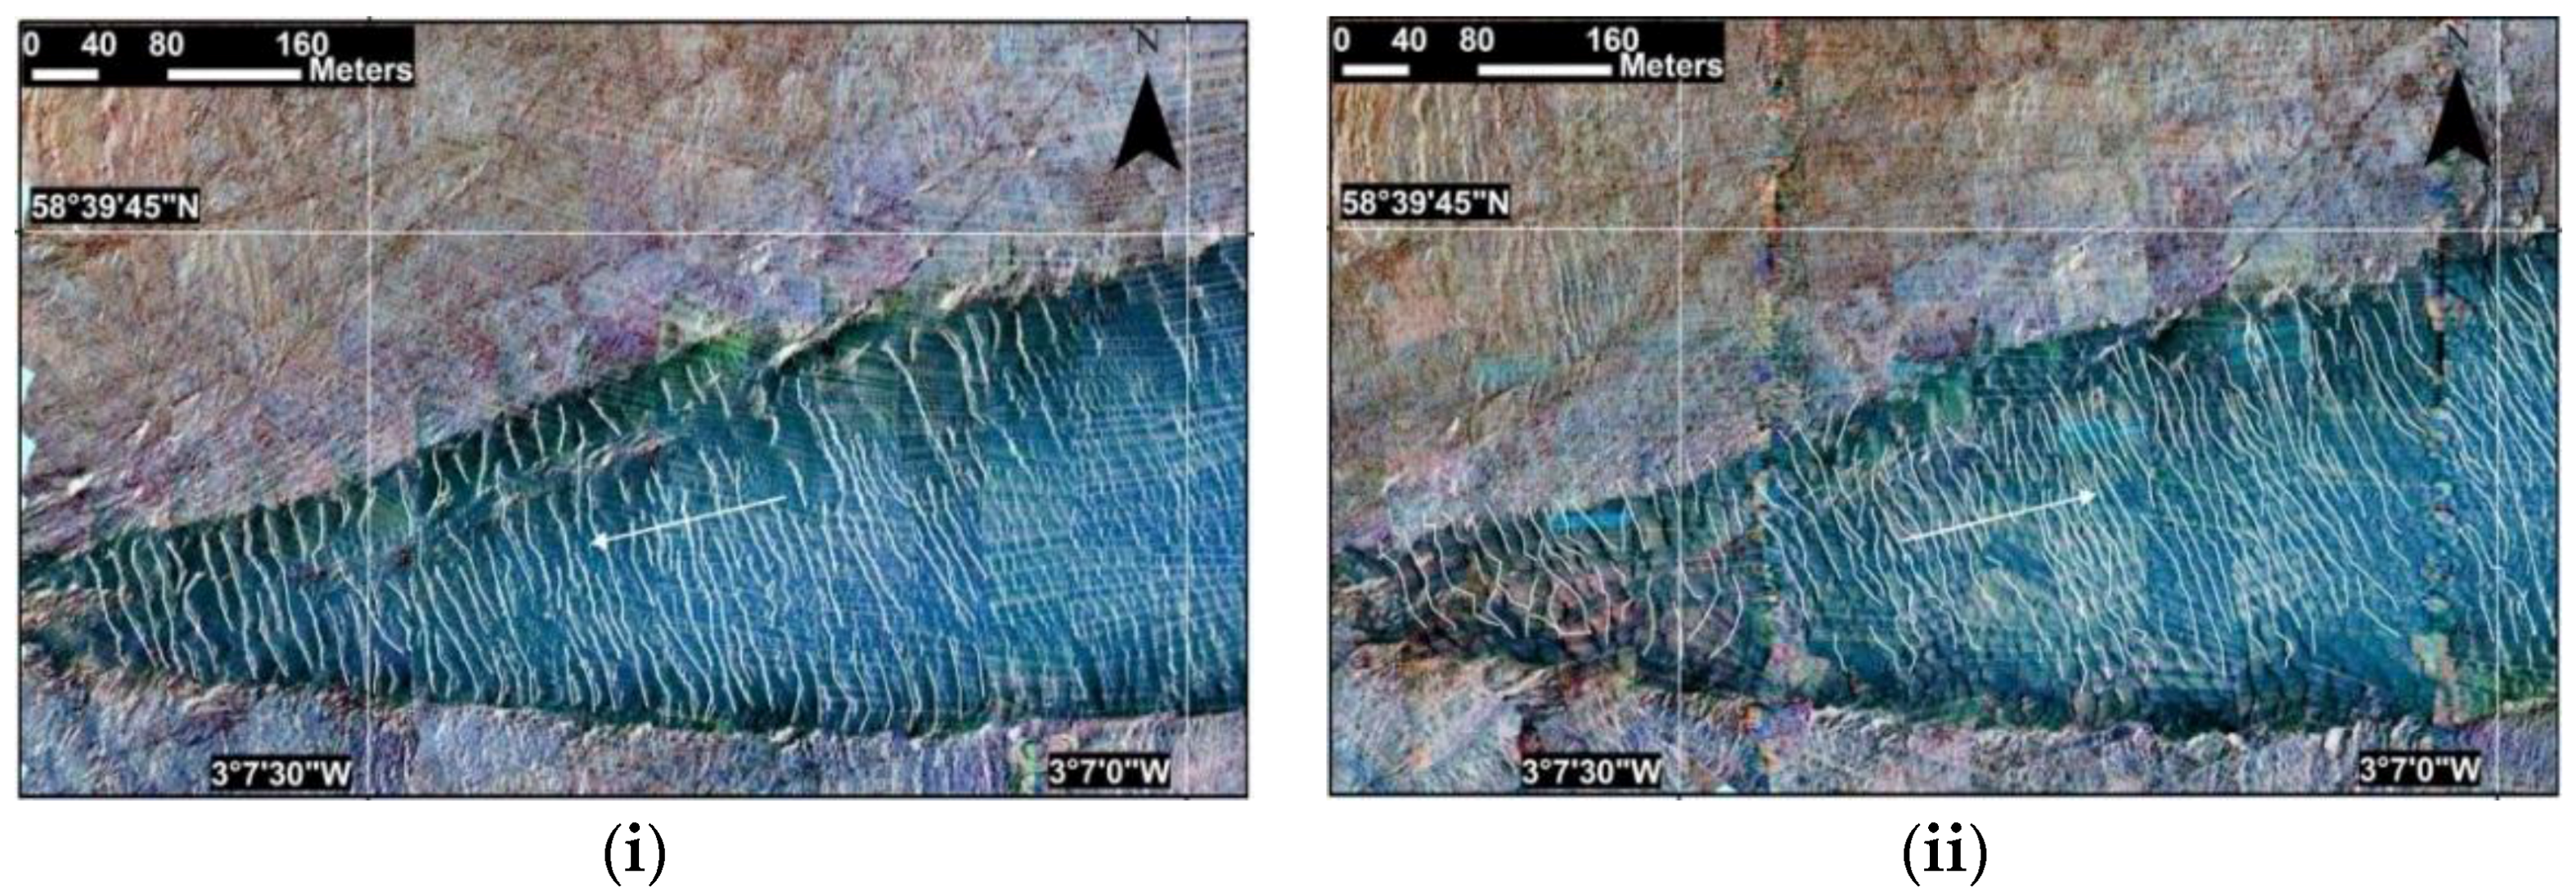
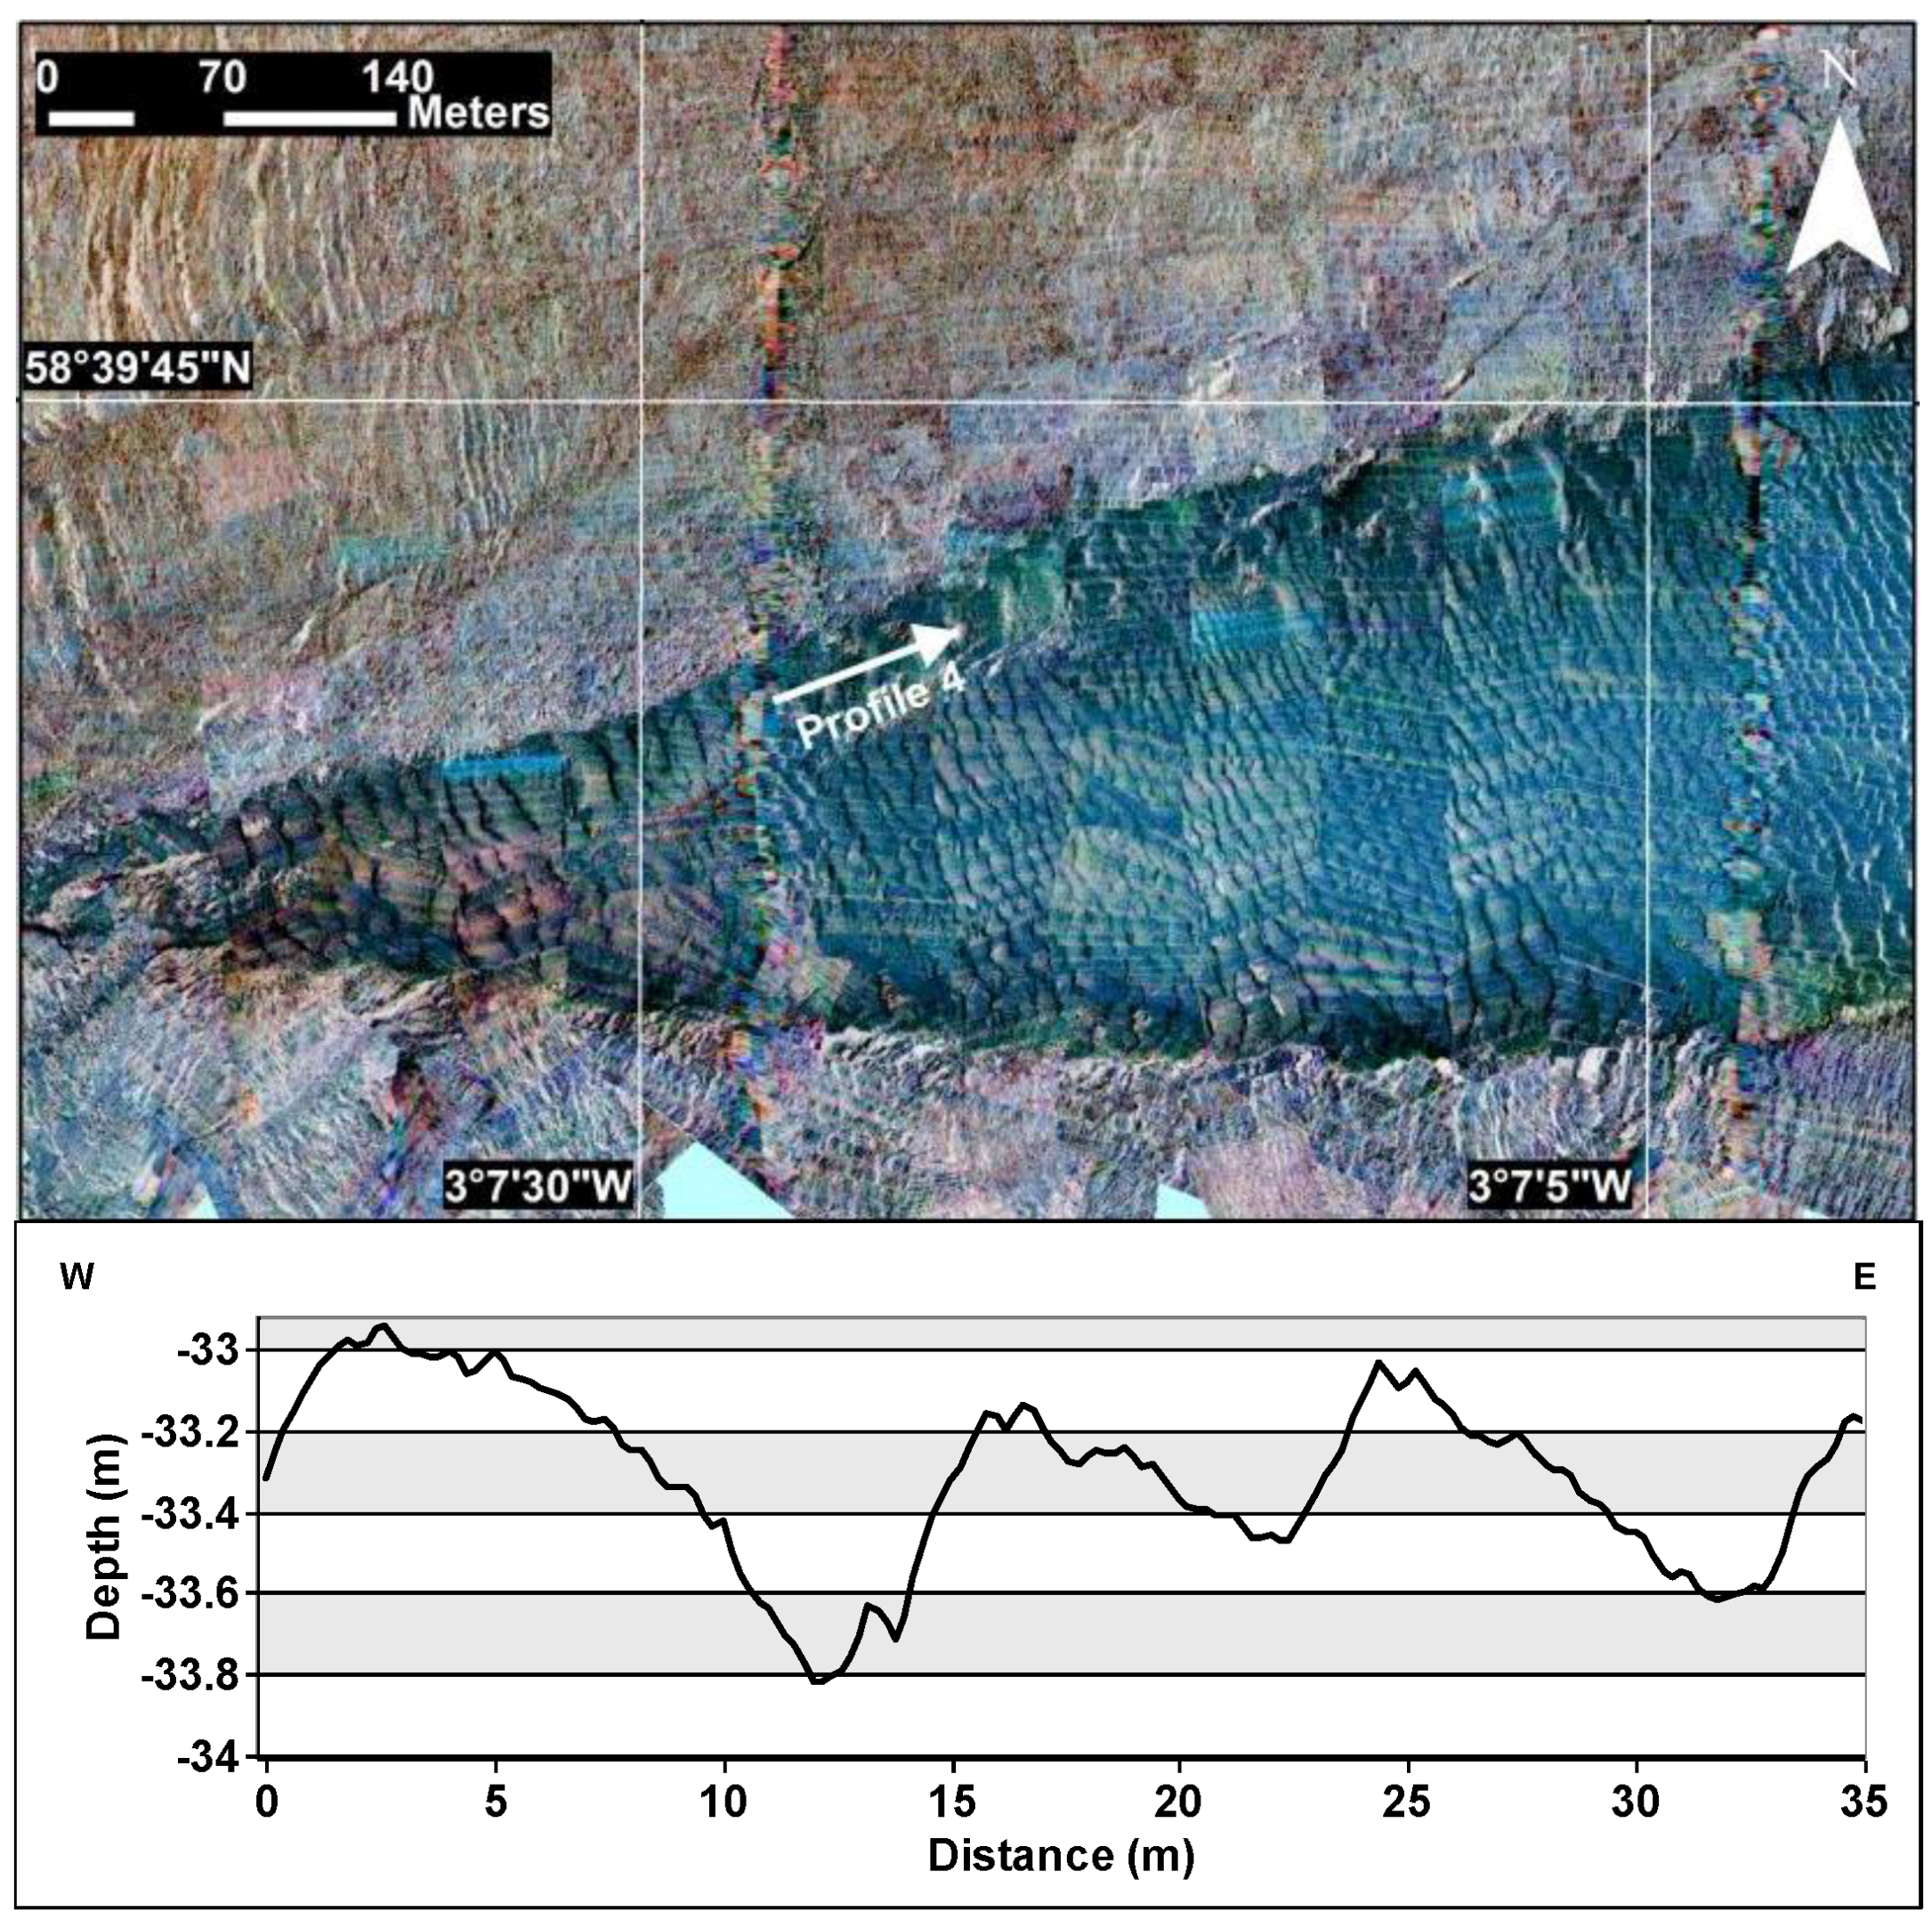
3.1. Side-Scan Sonar
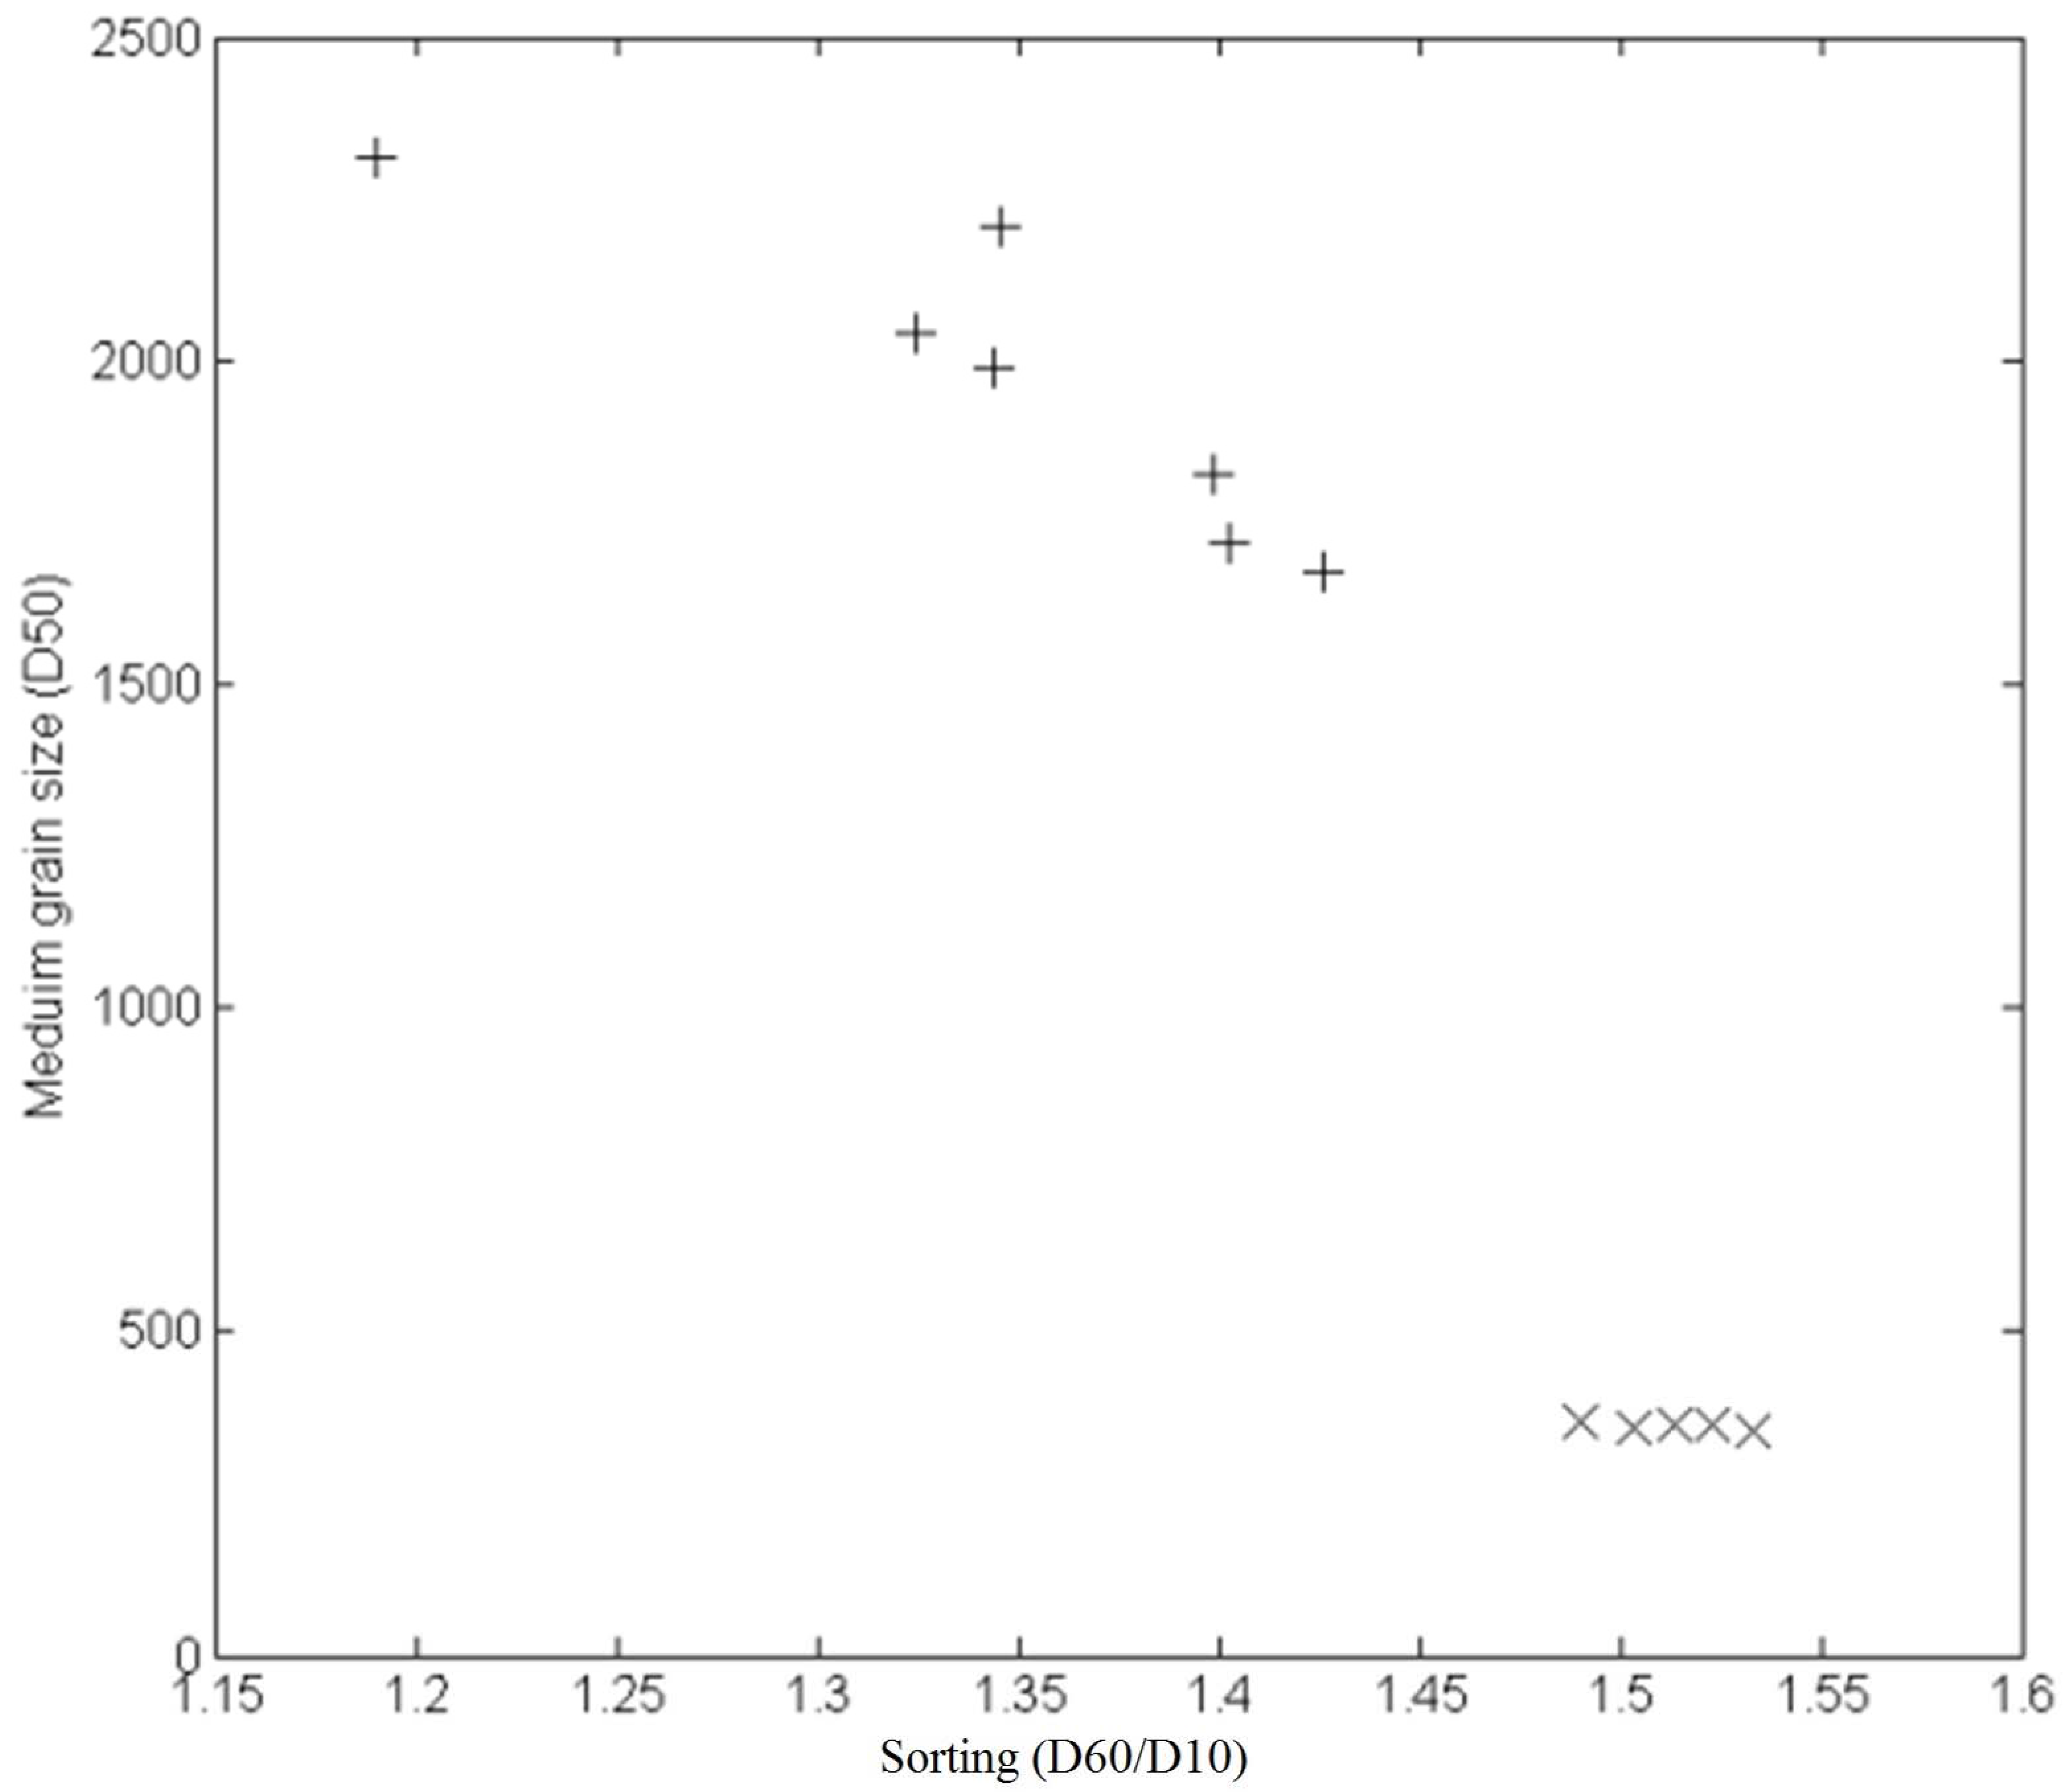
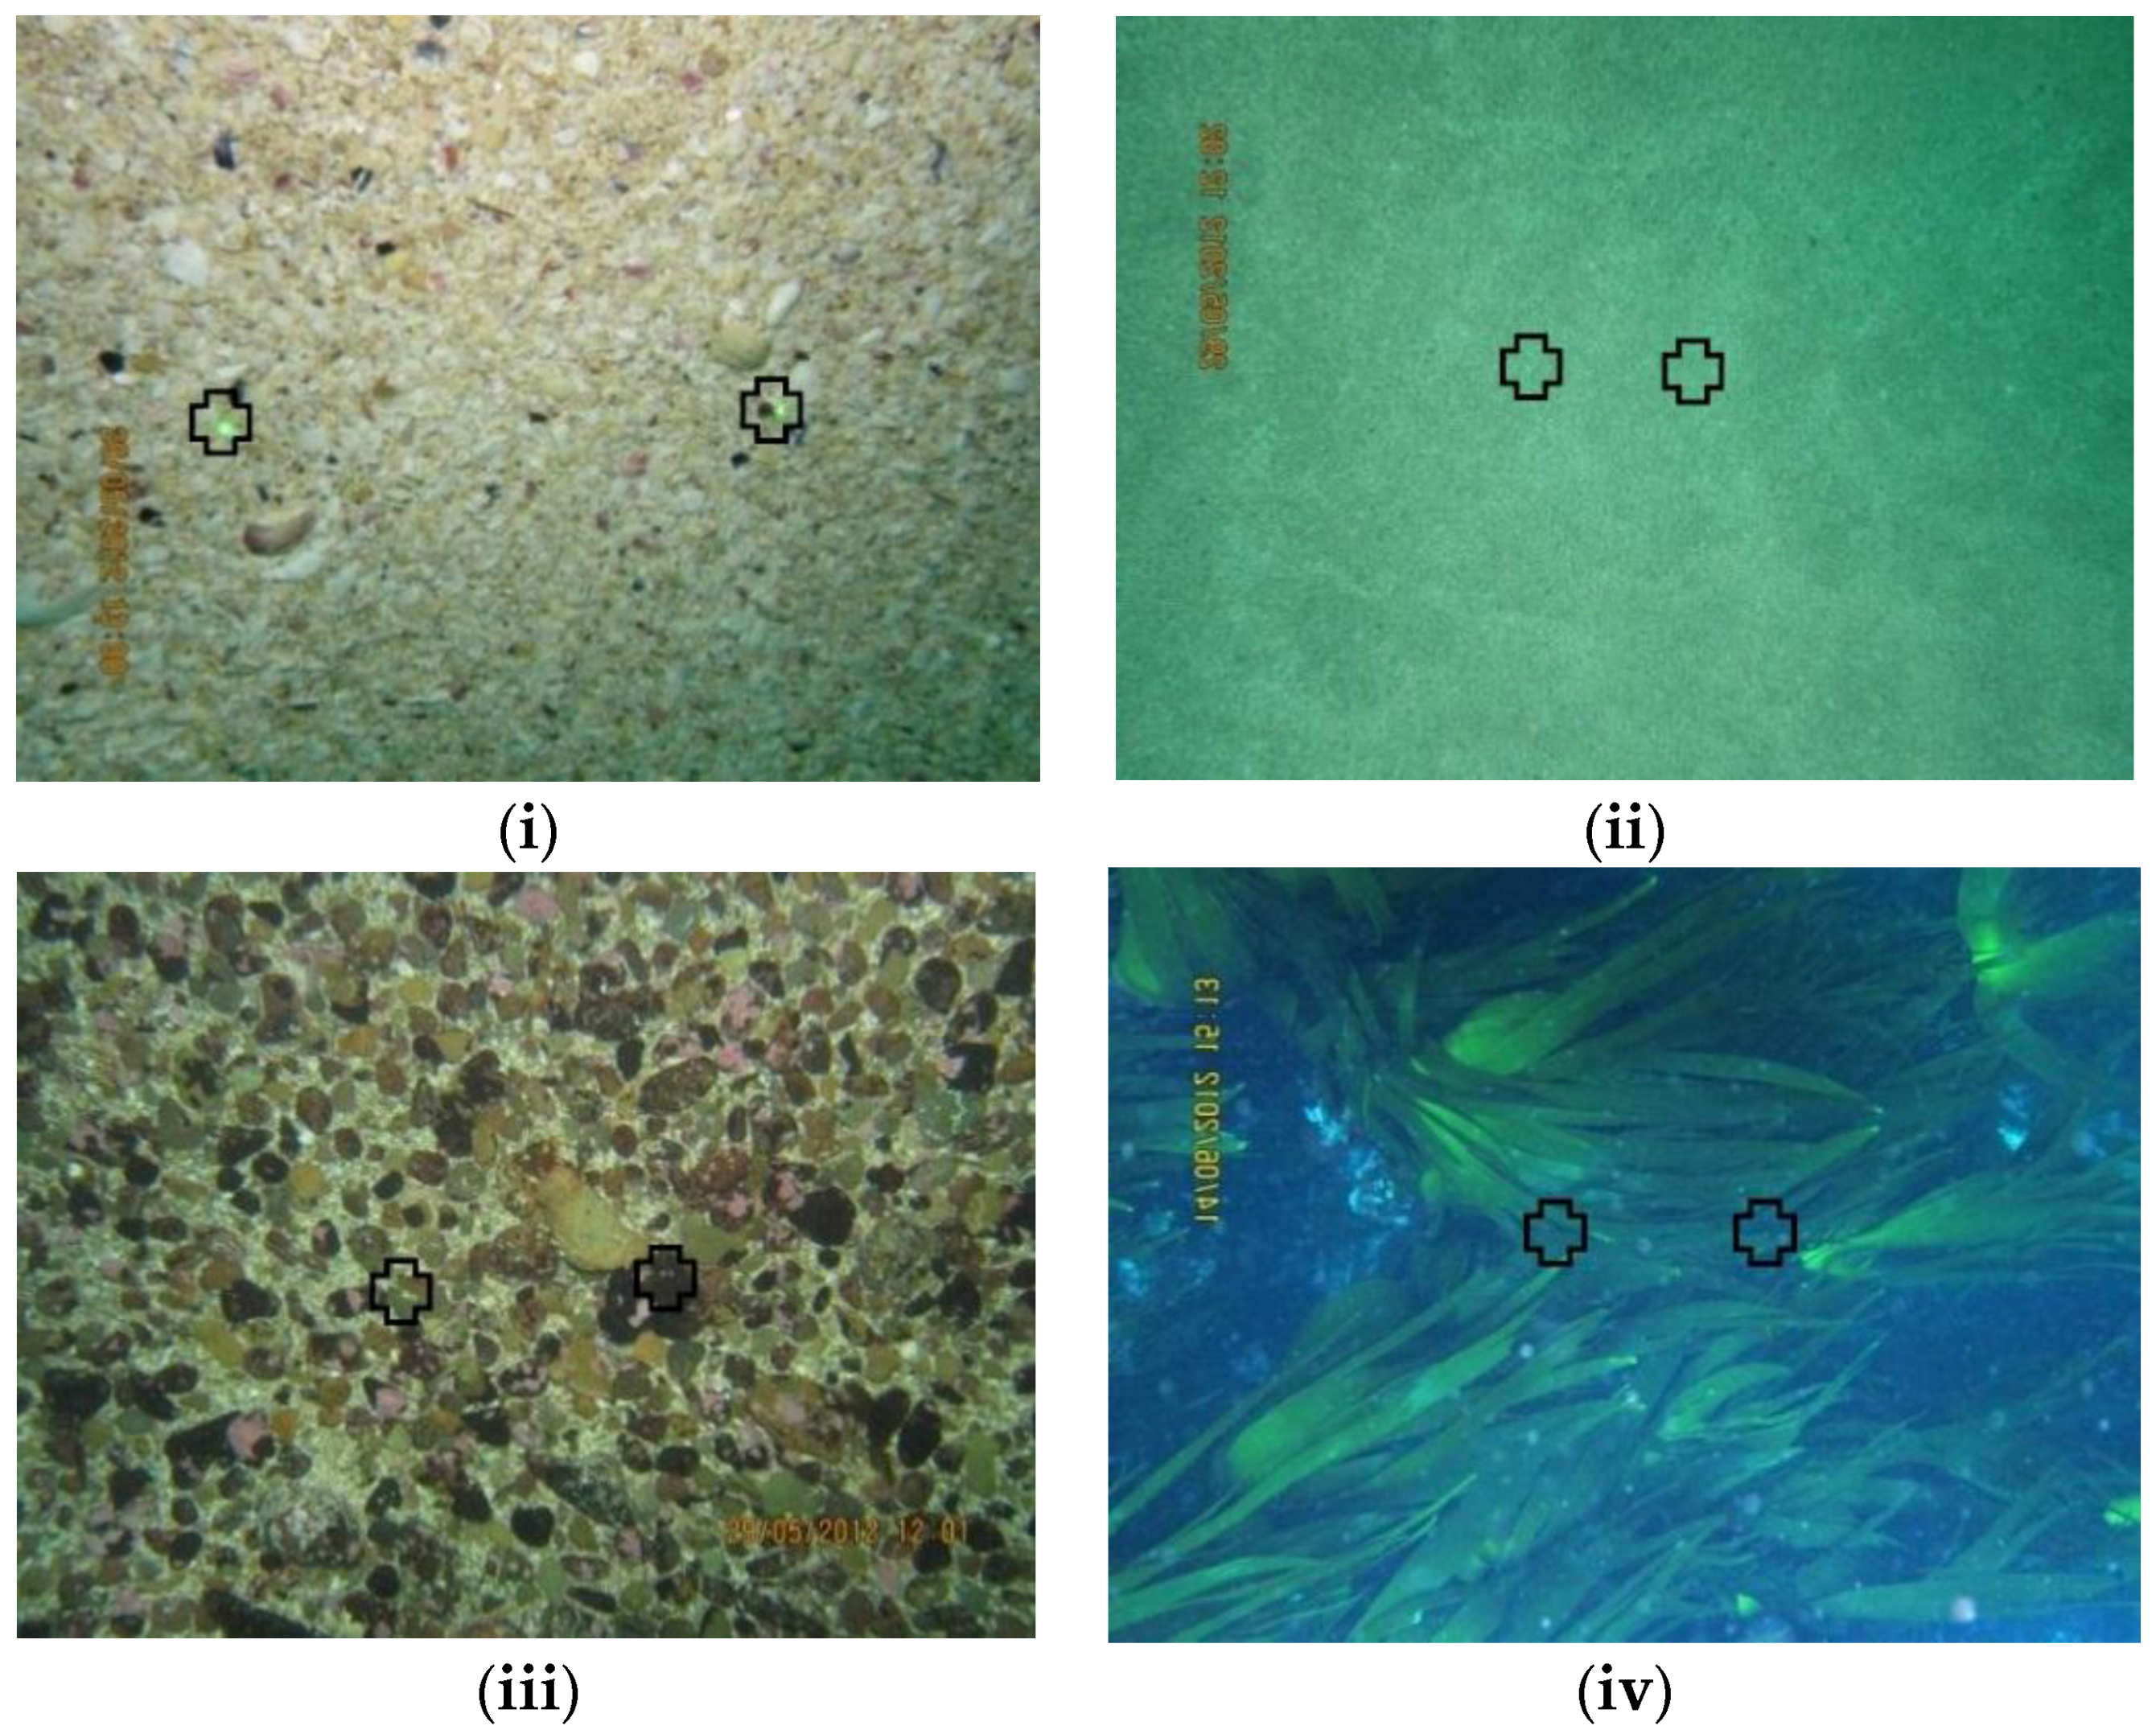
3.2. ROV and Sediment Grabs
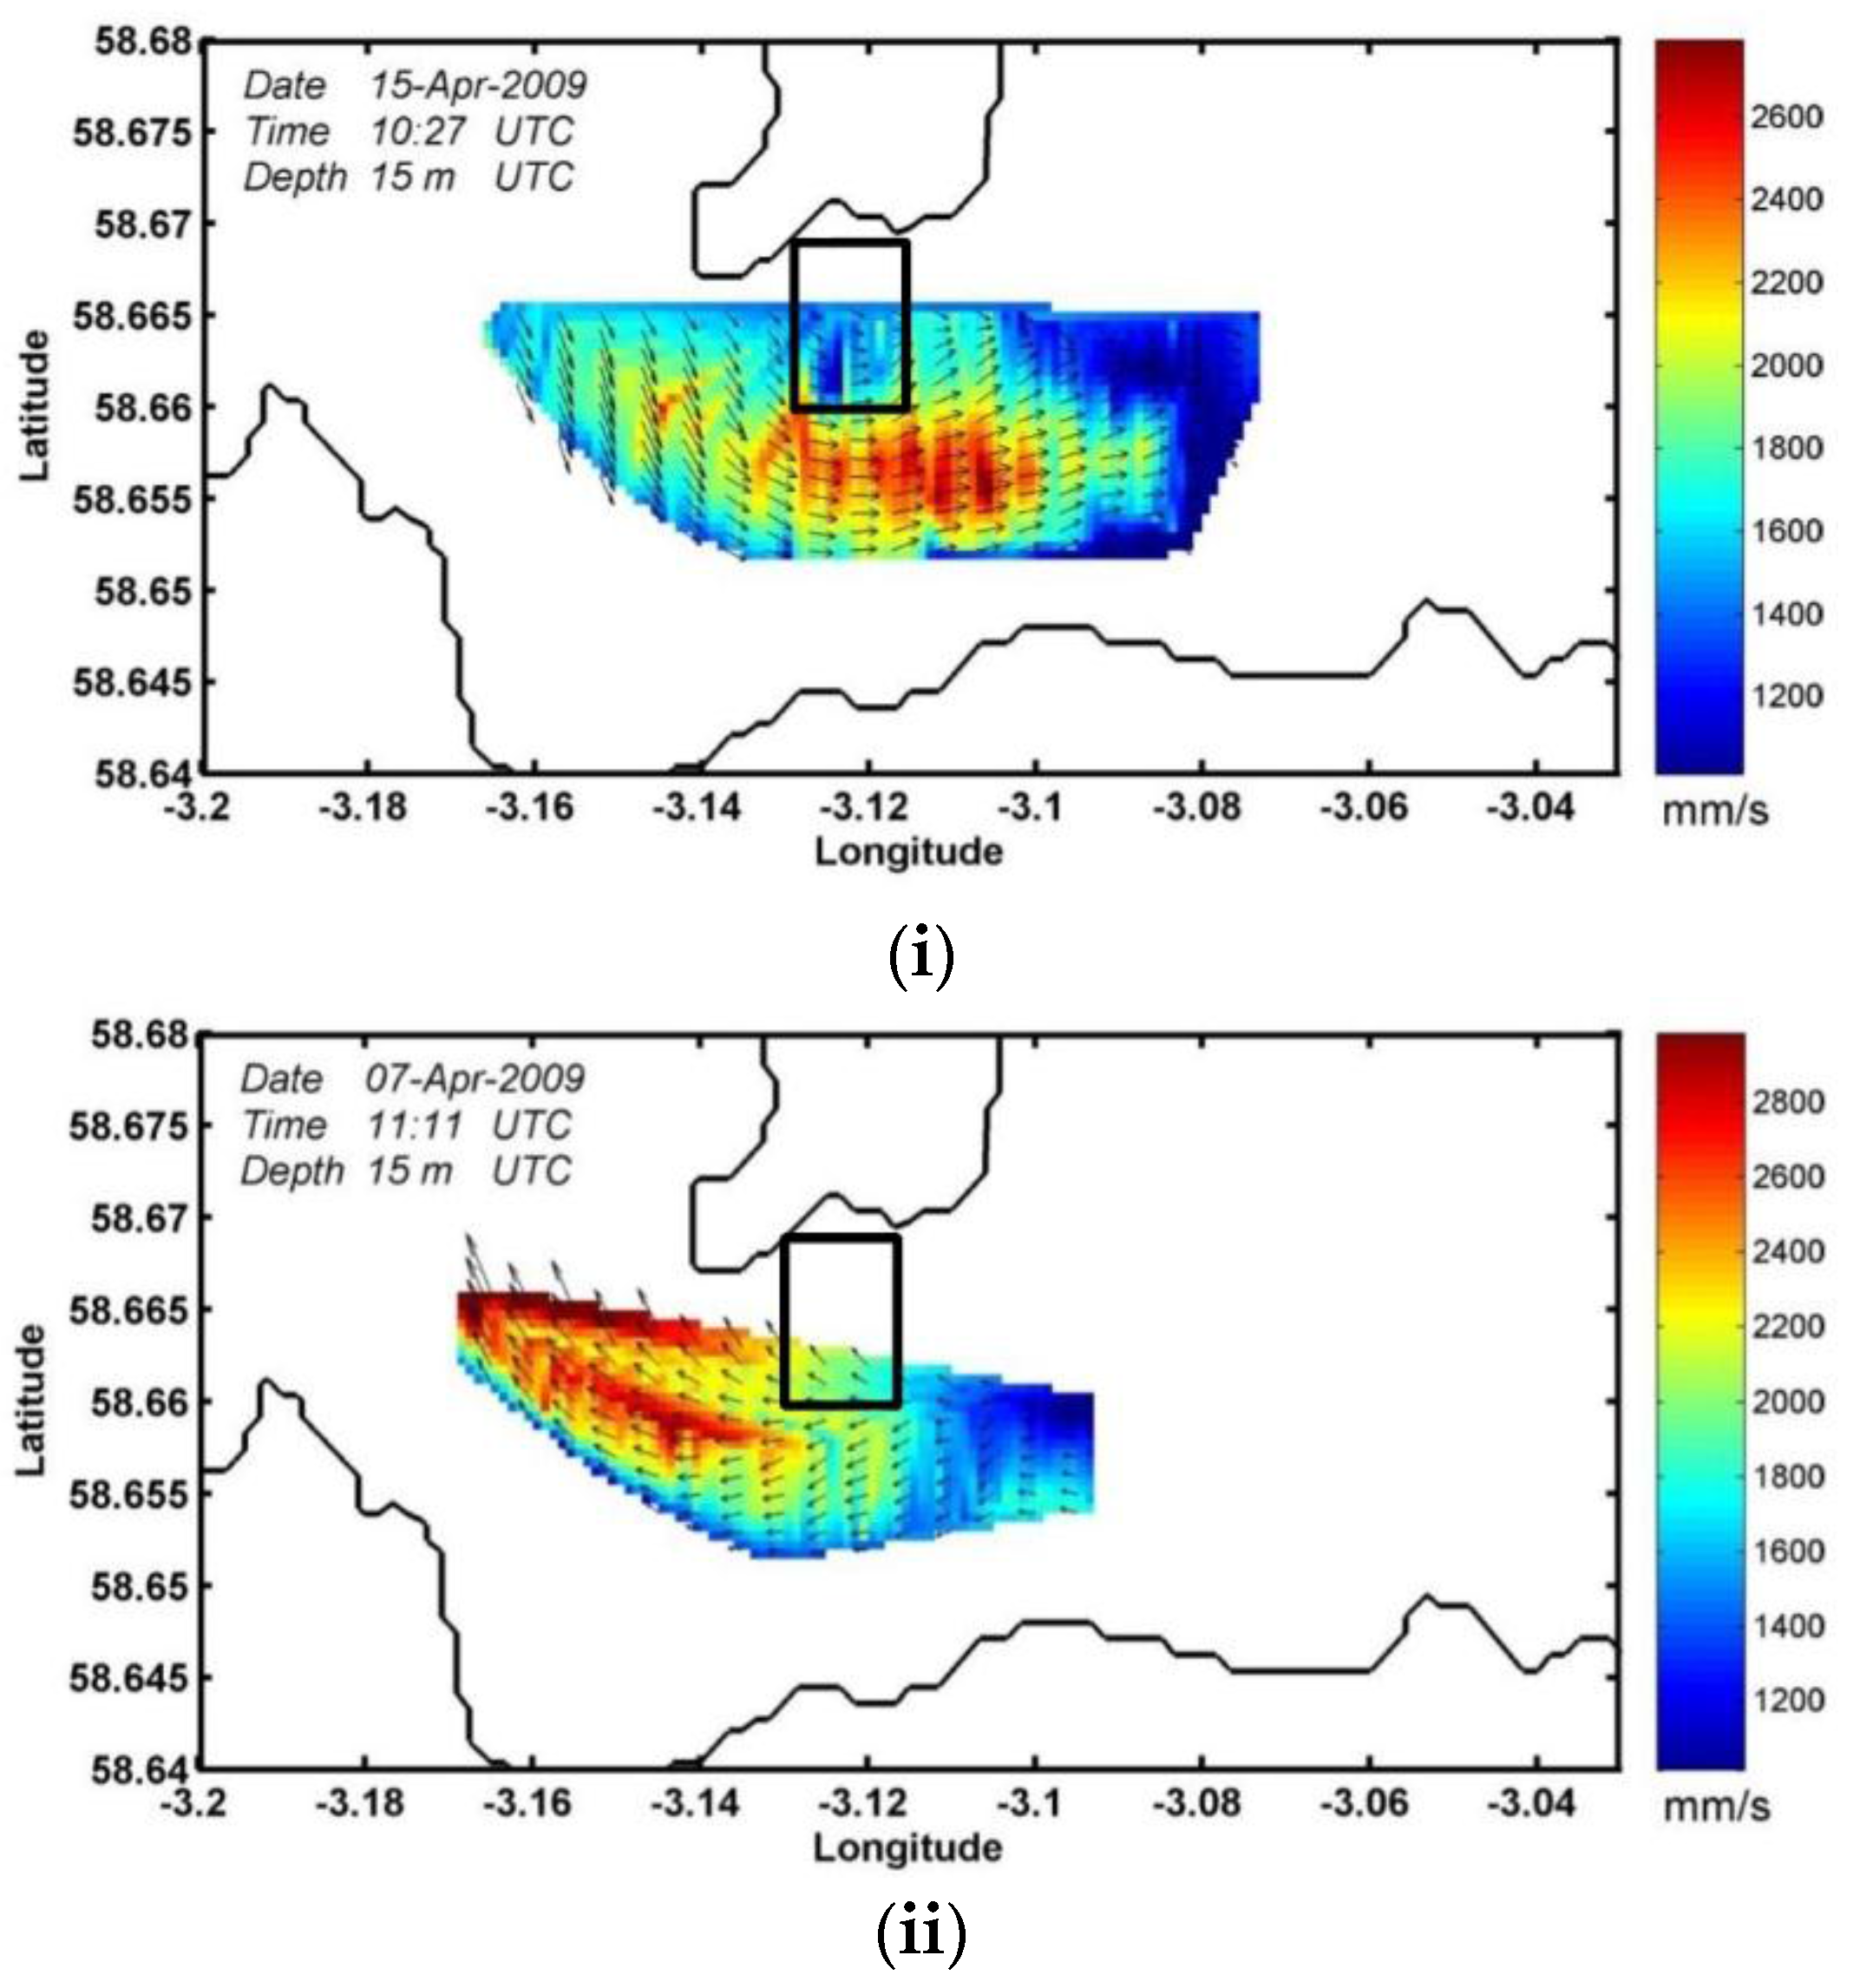
3.3. Acoustic Doppler Current Profiler (ADCP)
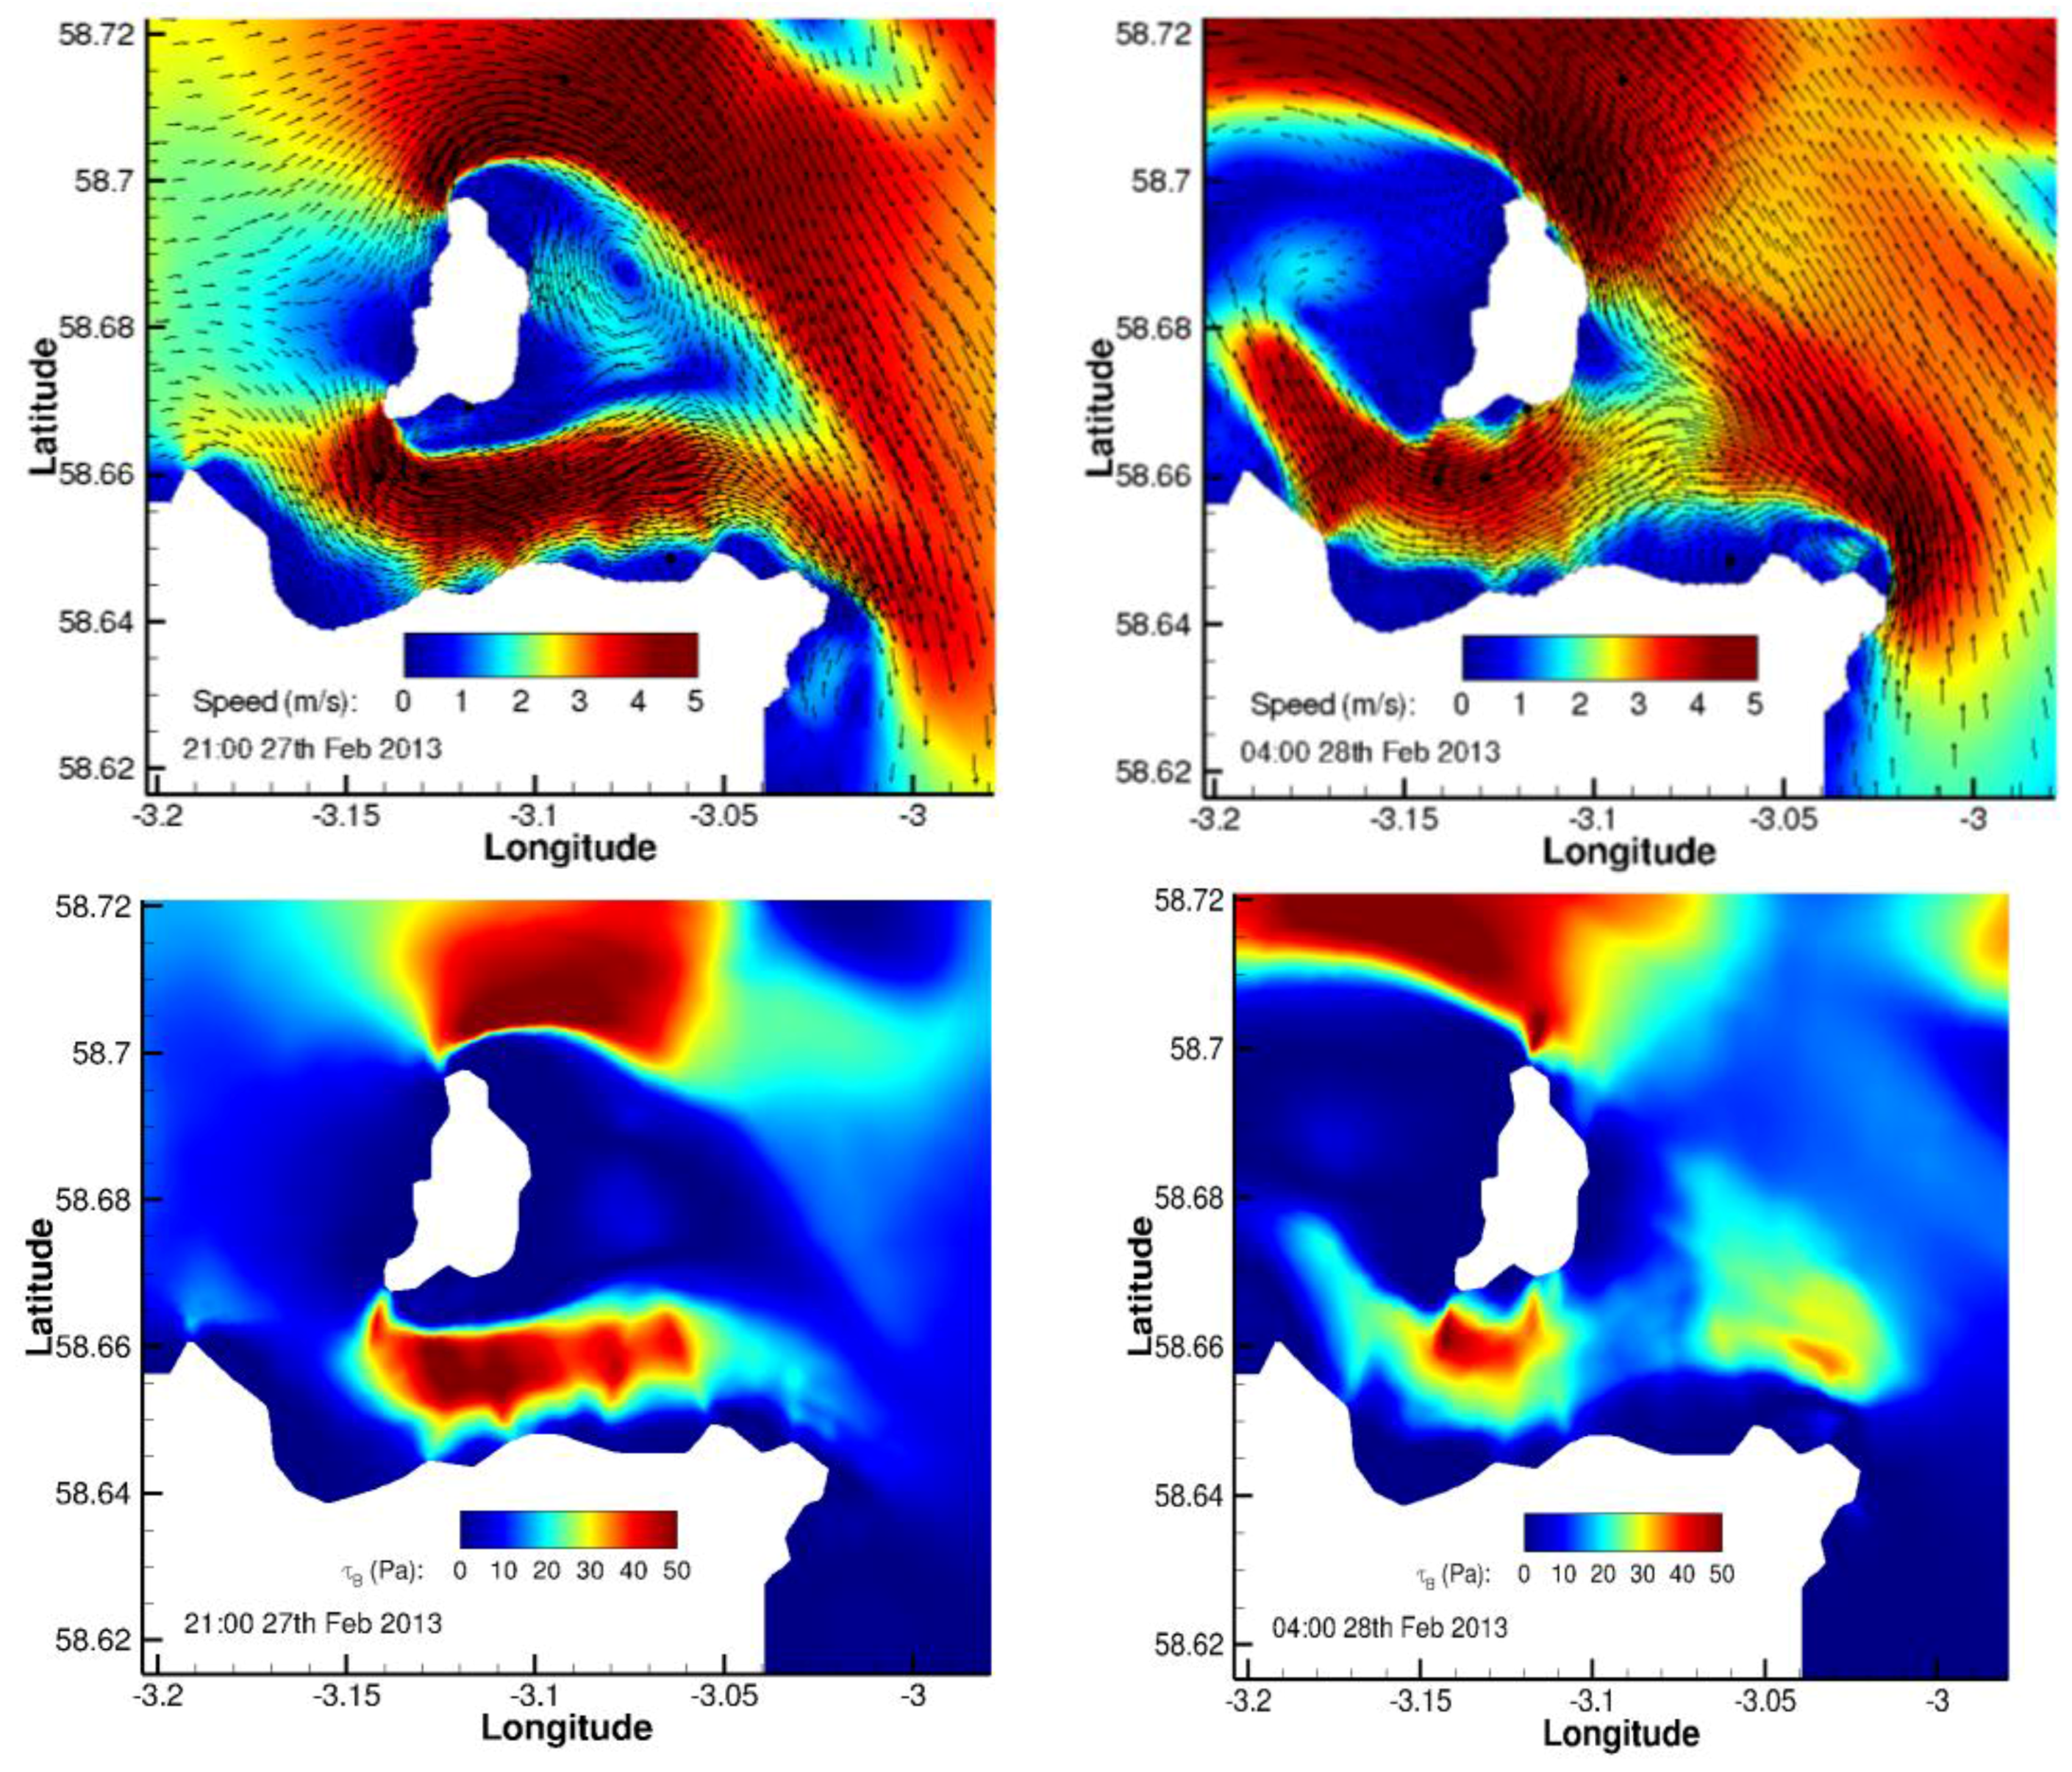
3.4. Hydrodynamic Modelling
4. Discussion
4.1. Hydrodynamics of the Inner Sound
4.2. Grain Settling Velocity and Entrainment
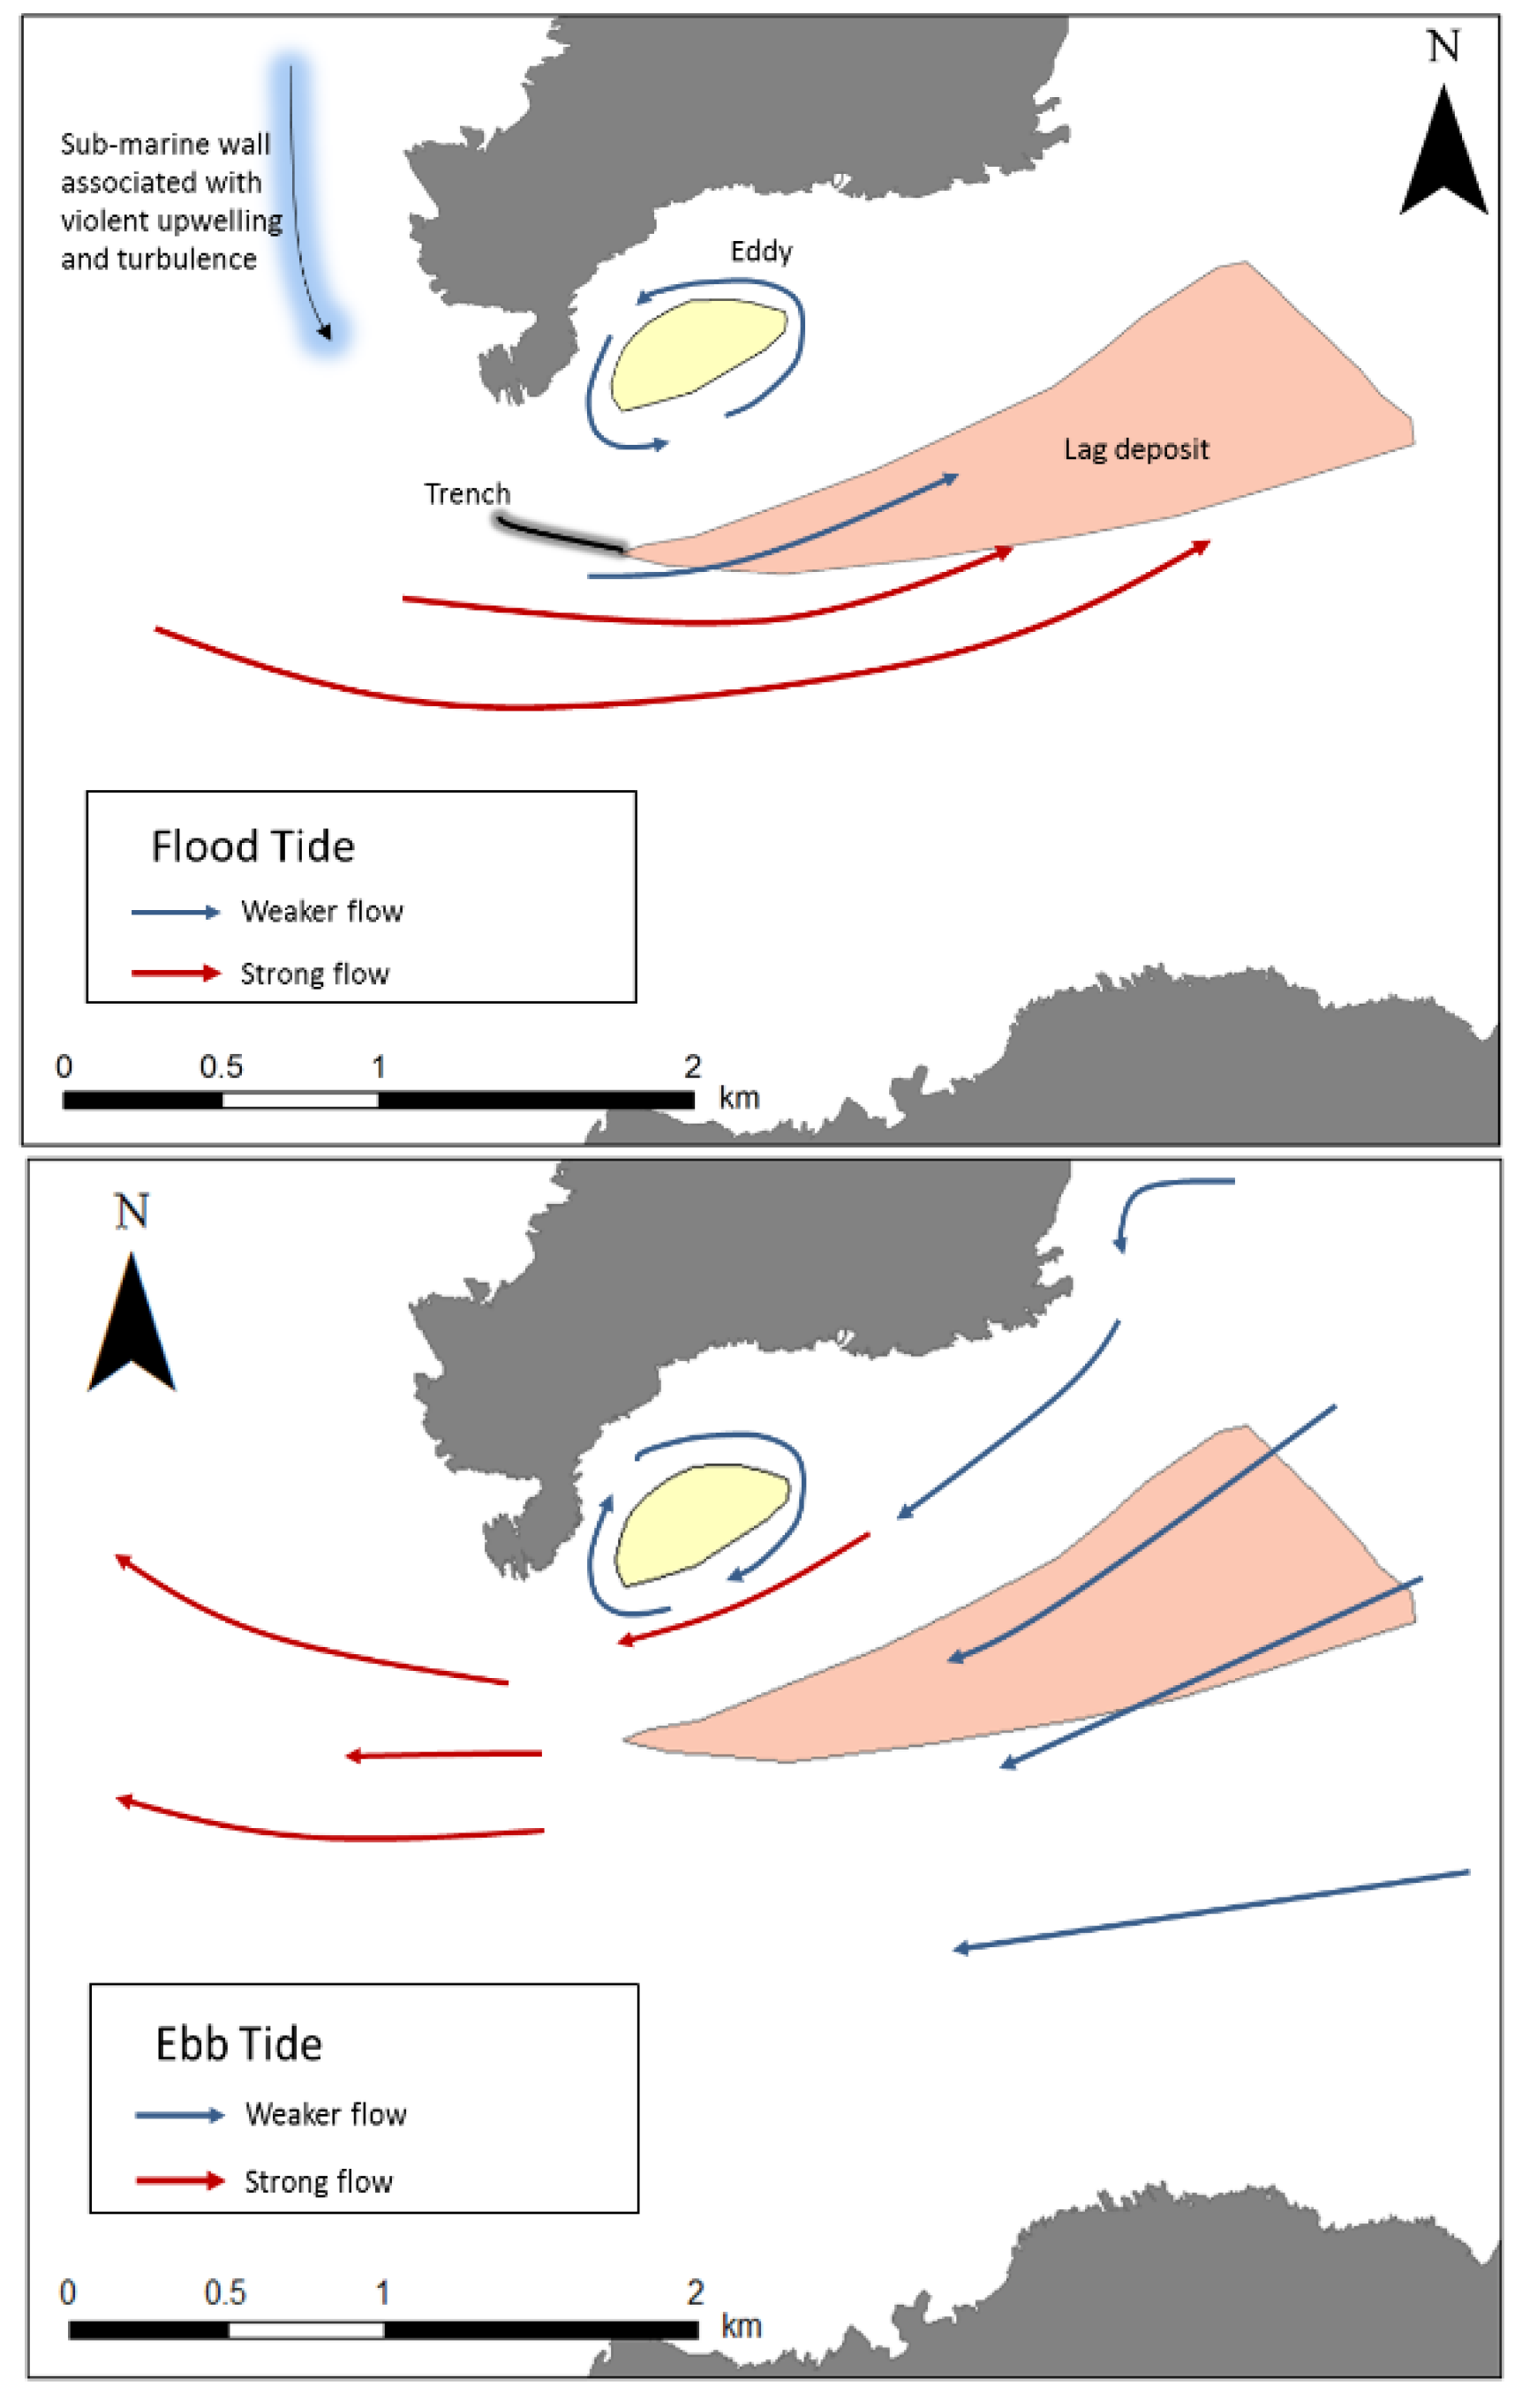
4.3. Inferred Sediment Dynamics
4.4. Implications for Tidal Energy Extraction
5. Conclusions
Acknowledgments
Author Contributions
Conflicts of Interest
References
- Draper, S.; Adcock, T.A.A.; Borthwick, A.G.L.; Houlsby, G.T. Estimate of the tidal stream power resource of the Pentland Firth. Renew. Energy 2014, 63, 650–657. [Google Scholar] [CrossRef]
- Adcock, T.A.A.; Draper, S.; Houlsby, G.T.; Borthwick, A.G.; Serhadlioglu, S. The available power from tidal stream turbines in the Pentland Firth. Proc. R. Soc. A. Math. Phys. Eng. Sci. 2013, 469, 1–21. [Google Scholar] [CrossRef]
- Meygen Ltd. MeyGen Tidal Energy Project Phase 1 Environmental Statement. Available online: http://77.68.107.10/Renewables%20Licensing/MG_Sound_of_Stroma_Offshore_Tidal_Array/ES/Complete%20ES.pdf (accessed on 16 November 2015).
- Shields, M.A.; Dillon, L.J.; Woolf, D.K.; Ford, A.T. Strategic priorities for assessing ecological impacts of marine renewable energy devices in the Pentland Firth (Scotland, UK). Mar. Policy 2011, 33, 635–642. [Google Scholar] [CrossRef]
- Bonar, P.A.; Bryden, I.G.; Borthwick, A.G. Social and ecological impacts of marine energy development. Renew. Sust. Energy Rev. 2015, 47, 486–495. [Google Scholar] [CrossRef]
- Neill, S.P.; Litt, E.J.; Couch, S.J.; Davies, A.G. The impact of tidal stream turbines on large-scale sediment dynamics. Renew. Energy 2009, 34, 2803–2812. [Google Scholar] [CrossRef]
- Neill, S.P.; Jordan, J.R.; Couch, S.J. Impact of tidal energy converter (TEC) arrays on the dynamics of headland sand banks. Renew. Energy 2012, 37, 387–397. [Google Scholar] [CrossRef]
- Martin-Short, R.; Hill, J.; Kramer, S.C.; Avdis, A.; Allison, P.A.; Piggott, M.D. Tidal resource extraction in the Pentland Firth, UK: Potential impacts on flow regime and sediment transport in the Inner Sound of Stroma. Renew. Energy 2015, 76, 596–607. [Google Scholar] [CrossRef]
- Fairley, I.; Masters, I.; Karunarathna, H. The cumulative impact of tidal stream turbine arrays on sediment transport in the Pentland Firth. Renew. Energy 2015, 80, 755–769. [Google Scholar] [CrossRef]
- Harendza, A. Benthic habitats in a tide-swept channel of the Pentland Firth and their potential responses to a tidal energy development. Ph.D. Thesis, University of Aberdeen, Aberdeen, UK, 2014. [Google Scholar]
- Farrow, G.E.; Allen, N.H.; Akapan, E.B. Bioclastic carbonate sedimentation on a high-latitude, tide-dominated shelf. NE Orkney Islands, Scotland. J. Sed. Petrol. 1984, 54, 373–393. [Google Scholar] [CrossRef]
- Kenyon, N.H.; Cooper, W.S. Sand banks, sand transport and offshore wind farms. In DTI Strategic Environmental Assessment Area 6, Irish Sea, Seabed and Surficial Geology and Processes; Report CR/05/057; British Geological Survey: Nottingham, UK, 2004. Available online: https://www.gov.uk/government/publications/strategic-environmental-assessment-6-environmental-report (accessed on 5 April 2016). [Google Scholar]
- Light, J.M.; Wilson, J.B. Cool-water carbonate deposition on the West Shetland shelf: A modern distally steepened ramp. In Carbonate Ramps; Wright, V.P., Burchette, T.P., Eds.; Geological Society Special Publications: London, UK, 1998; Volume 149, pp. 73–105. [Google Scholar]
- Holmes, R.; Bulat, J.; Henni, P.; Holt, J.; James, C.; Kenyon, N.; Leslie, A.; Long, D.; Musson, R.; Pearson, S.; et al. DTI Strategic Environmental Assessment Area 5 (SEA5): Seabed and Superficial Geology and Processes; British Geological Survey Report CR/04/064N; British Geological Survey: Nottingham, UK, 2005. [Google Scholar]
- Easton, M.C.; Woolf, D.K.; Bowyer, P.A. The dynamics of an energetic tidal channel, the Pentland Firth, Scotland. Cont. Shelf Res. 2013, 48, 50–60. [Google Scholar] [CrossRef]
- Goddijn-Murphy, L.; Woolf, D.K.; Easton, M.C. Current Patterns in the Inner Sound (Pentland Firth) from Underway ADCP Data. J. Atmos. Oceanic Technol. 2013, 30, 96–111. [Google Scholar] [CrossRef]
- Tamsett, D.; McIlvenny, J.; Watts, A. Colour sonar: Multi-frequency side-scan sonar images of the seabed in the Inner Sound of the Pentland Firth, Scotland. J. Mar. Sci. Eng. 2016, 4, 1–18. [Google Scholar] [CrossRef]
- Ramsdell, R.C.; Miedema, S.A.; Talmon, A.M. Hydraulic transport of sand/shell mixtures. In Proceedings of the ASME 2011 30th International Conference on Ocean, Offshore and Arctic Engineering OMAE 2011, Rotterdam, The Netherlands, June 19–24 2011.
- Paphitis, D.; Collins, M.B.; Nash, A.I.; Wallbridge, S. Settling velocities and entrainment thresholds of biogenic sands (shell fragments) under unidirectional flow. Sedimentology 2002, 49, 211–225. [Google Scholar] [CrossRef]
- Flemming, B.W.; Schubert, H.; Hertweck, G.; Muller, K. Bioclastic tidal channel lag deposits: A genetic model. Senckenberg. Marit. 1992, 22, 109–129. [Google Scholar]
- Ashley, G.M. Classification of large-scale subaqueous bedforms: A new look at an old problem. J. Sediment. Petrol. 1990, 60, 160–172. [Google Scholar]
- Folk, R.L.; Ward, W.C. Brazos River bar: A study in the significance of grain size parameters. J. Sediment. Petrol. 1957, 27, 3–26. [Google Scholar] [CrossRef]
- Tamsett, D.; Hogarth, P. Side-scan sonar beam function and seabed backscatter functions from trace amplitude and vehicle roll data. IEEE J. Ocean. Eng. 2015, 41, 155–163. [Google Scholar] [CrossRef]
- Pawlowicz, R.; Beardsley, B.; Lentz, S. Classical tidal harmonic analysis including error estimates in MATLAB using T_TIDE. Comput. Geosci. 2002, 28, 929–937. [Google Scholar] [CrossRef]
- Walters, R.A.; Casulli, V. A robust, finite element model for hydrostatic surface water flows. Comm. Numer. Methods Eng. 1998, 14, 931–940. [Google Scholar] [CrossRef]
- Walters, R.A. Coastal ocean models: Two useful finite element methods. Cont. Shelf Res. 2005, 25, 775–793. [Google Scholar] [CrossRef]
- Walters, R.A. A semi-implicit finite element model for non-hydrostatic (dispersive) surface waves. Int. J. Numer. Methods Fluids 2005, 49, 721–737. [Google Scholar] [CrossRef]
- Gillibrand, P.A.; Lane, E.M.; Walters, R.A.; Gorman, R.M. Forecasting extreme sea surface height and coastal inundation from tides, surge and wave setup. Aust. J. Civil Eng. 2011, 9, 99–112. [Google Scholar]
- Lane, E.M.; Gillibrand, P.A.; Arnold, J.R.; Walters, R.A. Tsunami inundation modeling with RiCOM. Aust. J. Civil Eng. 2011, 9, 83–98. [Google Scholar]
- Walters, R.A.; Gillibrand, P.A.; Bell, R.; Lane, E.M. A Study of Tides and Currents in Cook Strait, New Zealand. Ocean Dyn. 2010, 60, 1559–1580. [Google Scholar] [CrossRef]
- Plew, D.R.; Stevens, C.L. Numerical modelling of the effect of turbines on currents in a tidal channel–Tory Channel, New Zealand. Renew. Energy 2013, 57, 269–282. [Google Scholar] [CrossRef]
- Walters, R.A.; Tarbotton, M.R.; Hiles, C.E. Estimation of tidal power potential. Renew. Energy 2013, 51, 255–262. [Google Scholar] [CrossRef]
- Egbert, G.D.; Erofeeva, S.Y. Efficient inverse modelling of barotropic ocean tides. J. Atmos. Ocean. Technol. 2002, 19, 183–204. [Google Scholar] [CrossRef]
- Dyke, P.P.G. Coastal and Shelf Sea Modelling; Springer US: New York, NY, USA, 2001. [Google Scholar]
- Ferguson, R.I.; Church, M. A simple universal equation for grain settling velocity. J. Sediment. Res. 2004, 74, 933–937. [Google Scholar] [CrossRef]
- Durafour, M.; Jarano, A.; Le Bot, S.; Blanpain, O.; Lafite, R.; Marin, F. In-situ study of the influence of size and shape of sediments on bedload transport. In Proceedings of the 7th International Conference on Coastal Dynamics, Bordeaux, France, 24–28 June 2011; pp. 541–552.
- Weill, P.; Mouazé, D.; Tessier, B.; Brun-Cottan, J. Hydrodynamic behaviour of coarse bioclastic sand from shelly cheniers. Earth Surf. Process. Landf. 2010, 35, 1642–1654. [Google Scholar] [CrossRef]
- Shields, A. Anwendung der Aehnlichkeitsmechanik und der Turbulenzforschung auf die Geschiebebewegung [Application of similarity mechanics and turbulence research on shear flow]. Mitt. Preußischen Vers. Wasserbau 1936, 26, 5–24. [Google Scholar]
- Valyrakis, M.; Diplas, P.; Dancey, C.L. Entrainment of coarse grains in turbulent flows: An extreme value theory approach. Water Resour. Res. 2011, 47, 1–17. [Google Scholar] [CrossRef]
- Smith, D.A.; Cheung, K.F. Transport rate of calcareous sand in unidirectional flow. Sedimentology 2005, 52, 1009–1020. [Google Scholar] [CrossRef]


| Site | O1 | K1 | N2 | M2 | S2 | ||||||
|---|---|---|---|---|---|---|---|---|---|---|---|
| Scrabster | Gauge | 0.10 | 351 | 0.14 | 142 | 0.29 | 219 | 1.36 | 244 | 0.51 | 277 |
| Model | 0.09 | 10 | 0.13 | 143 | 0.29 | 218 | 1.36 | 243 | 0.51 | 277 | |
| ADCP 2 (Acoustic Doppler Current Profiler) | Gauge | 0.11 | 7 | 0.09 | 170 | 0.16 | 250 | 0.94 | 279 | 0.43 | 317 |
| Model | 0.10 | 17 | 0.12 | 156 | 0.20 | 250 | 0.97 | 274 | 0.34 | 310 | |
| Stroma | Gauge | 0.11 | 1 | 0.13 | 176 | 0.17 | 249 | 0.89 | 282 | 0.36 | 325 |
| Model | 0.10 | 18 | 0.12 | 157 | 0.18 | 254 | 0.92 | 278 | 0.32 | 314 | |
| John O’Groats | Gauge | 0.10 | 8 | 0.11 | 161 | 0.18 | 257 | 0.83 | 284 | 0.28 | 320 |
| Model | 0.09 | 23 | 0.11 | 161 | 0.18 | 261 | 0.93 | 284 | 0.31 | 321 | |
| Wick | Gauge | 0.11 | 29 | 0.10 | 176 | 0.18 | 298 | 0.96 | 322 | 0.32 | 1 |
| Model | 0.09 | 34 | 0.11 | 173 | 0.19 | 291 | 0.97 | 312 | 0.33 | 351 | |
| Site | O1 | K1 | N2 | M2 | S2 | ||||||
|---|---|---|---|---|---|---|---|---|---|---|---|
| ADCP 1 | Obs | 0.11 | 285 | 0.08 | 130 | 0.44 | 211 | 2.59 | 240 | 1.09 | 278 |
| Model | 0.05 | 324 | 0.11 | 92 | 0.48 | 203 | 2.70 | 239 | 0.85 | 269 | |
| ADCP 2 | Obs | 0.09 | 281 | 0.07 | 111 | 0.48 | 202 | 2.92 | 239 | 1.17 | 274 |
| Model | 0.05 | 322 | 0.11 | 93 | 0.52 | 203 | 2.82 | 238 | 0.91 | 269 | |
| Constant | Smooth Spheres | Natural Grains: Sieve Diameters | Natural Grains: Nominal Diameters |
|---|---|---|---|
| C1 | 18 | 20 | 24 |
| C2 | 0.4 | 1 | 1.1 |
© 2016 by the authors; licensee MDPI, Basel, Switzerland. This article is an open access article distributed under the terms and conditions of the Creative Commons Attribution license ( http://creativecommons.org/licenses/by/4.0/).
Share and Cite
McIlvenny, J.; Tamsett, D.; Gillibrand, P.; Goddijn-Murphy, L. On the Sediment Dynamics in a Tidally Energetic Channel: The Inner Sound, Northern Scotland. J. Mar. Sci. Eng. 2016, 4, 31. https://doi.org/10.3390/jmse4020031
McIlvenny J, Tamsett D, Gillibrand P, Goddijn-Murphy L. On the Sediment Dynamics in a Tidally Energetic Channel: The Inner Sound, Northern Scotland. Journal of Marine Science and Engineering. 2016; 4(2):31. https://doi.org/10.3390/jmse4020031
Chicago/Turabian StyleMcIlvenny, Jason, Duncan Tamsett, Philip Gillibrand, and Lonneke Goddijn-Murphy. 2016. "On the Sediment Dynamics in a Tidally Energetic Channel: The Inner Sound, Northern Scotland" Journal of Marine Science and Engineering 4, no. 2: 31. https://doi.org/10.3390/jmse4020031