Article

Sandbar Migration and Shoreline Change on the Chirihama Coast, Japan

by
Masatoshi Yuhi
1,*,
Masayuki Matsuyama
2 and
Kazuhiro Hayakawa
3
1
School of Environmental Design, Kanazawa University, Kakuma-Machi, Kanazawa 920-1192, Japan
2
Specified Nonprofit Corporation, The Society of Ocean Romantics, 1-18-11-1011 Kanda, Chiyoda-ku, Tokyo 101-0047, Japan
3
Public Works Department, Ishikawa Prefectural Government, 1-1 Kuratsuki, Kanazawa 920-8580, Japan
*
Author to whom correspondence should be addressed.
J. Mar. Sci. Eng. 2016, 4(2), 40; https://doi.org/10.3390/jmse4020040
Submission received: 29 February 2016 / Revised: 28 April 2016 / Accepted: 13 May 2016 / Published: 3 June 2016
(This article belongs to the Special Issue Coastal Morphodynamics)

Abstract

:
Sandy beaches play a key role in regional tourism. It is important to understand the principal morphological processes behind preserving attractive beaches. In this study, morphological variation on the Chirihama Coast, Japan, an important local tourism resource, was investigated using two sets of field surveys. The objective was to analyze and document the multi-scale behaviors of the beach. First, long-term shoreline changes were examined based on shoreline surveys over the last two decades. Then, the middle-term behavior of multiple bar systems was analyzed based on the cross-shore profile surveys from 1998 to 2010. An empirical orthogonal function (EOF) analysis was conducted to capture the principal modes of the systematic bar migration. The shoreline analysis indicated a long-term eroding trend and showed that the seasonal variation has recently tended to increase. The profile analysis demonstrated that net offshore migrations of bars have been repeated with a return period of approximately four years. This general behavior of the bar system is similar to the net offshore migration phenomena observed at other sites in the world. EOF analysis revealed a relationship between bar configuration and middle-term variations in shoreline location; when a new bar is generated near the shoreline and a triple bar configuration is established, the shoreline tends to temporarily retreat, whereas the shoreline experiences an advance when the outer bar has most evolved.

1. Introduction

Many of the sandy beaches in the world have played an important role in regional tourism. The Chirihama Coast in Japan, which is located on the northwestern coast of Honshu (Figure 1), contains such popular beaches [1]. The long sandy beaches consist of very fine sand and are accessed by the 7 km-long ‘Nagisa Driveway’, a marine drive for automobiles on the backshore (Figure 2). More than 800,000 tourists visit the coast every year, mainly from spring to autumn, and enjoy driving automobiles on the beach. To maintain this attractive tourism resource, it is necessary to preserve the wide sandy beaches. However, the beach has recently been suffering from accelerated erosion problems under both direct and indirect influences of human interference in the coastal-river watershed. Historically, the long sandy beach developed in this area as a segment within a large littoral cell stretching approximately 75 km along the Japan Sea coast. Our study area is located at the downdrift (northeast) end of this cell. The principal source of sediment here is the Tedori River, the mouth of which is located approximately 45 km southwest of the study area. In recent decades, however, the sediment discharge from the Tedori River has decreased because of various anthropogenic modifications of the river basin, such as extensive sand mining and dam construction commencing in the 1960s [2,3]. In addition, this area was largely separated from the updrift (southwest) portion of the littoral cell following the construction and extension of the main breakwater at Kanazawa Port (which stretches out to water depths of approximately 13 m with a total length of 3.2 km) after 1970 [4]. The combined effects of a decrease in sediment discharge and the disruption of longshore sediment transport have resulted in an accelerated retreat of the shoreline. The shoreline retreated approximately 50 m during the last two decades when the erosion was most significant.
Morphologically, the beach profile on the Chirihama Coast is characterized by the development of large-scale multiple sandbar systems [1,5,6,7,8]. The evolution of multiple sandbars can be inferred from an aerial photograph taken in 1975 (Figure 1b). Because the configuration of the bar system may indirectly influence morphological variations on the foreshore and backshore, it is essential, for the future preservation and development of the marine drive, to develop a physical understanding of ongoing morphological processes, including shoreline variations and changes in underwater bathymetries.
Longshore bars are known to play an important morphological role in the development of sandy beaches. For example, they dissipate extremely high wave energy during storms and significantly influence dynamic and ecological processes in the surf zone. In the past, a number of scientific and engineering investigations have been performed on the evolution of bars over a wide range of time scales [9,10,11,12]. Among them, the interannual behaviors of bars have recently been analyzed on the basis of long-term survey records at several locations around the world [13,14,15,16,17,18]. It has been reported that multiple bar systems exhibit systematic, cyclic net offshore migration (NOM) on a time scale of one to 20 years.
Although several studies have mentioned the existence and features of large-scale multiple sandbars on the Chirihama Coast [1,5,6,7], existing studies of the characteristics of temporal variation in these bars are very restricted. Recently, the authors have investigated the basic characteristics of bar evolution on the Chirihama Coast and demonstrated that the interannual movements of these bars are significant [8]. The bar system exhibits features that are consistent with previously reported NOM behavior at other sites [13,14,15,16,17,18]. However, the present understanding of the characteristics of temporal and spatial variations on the beach is still limited. Continued and more detailed reexamination is needed to clarify the physical processes and to obtain appropriate insight for planning future beach preservation. In this study, accordingly, the long-term variations of the shoreline and middle-term variation of seabed profiles on the Chirihama Coast are investigated using two sets of field surveys. First, the characteristics of the spatiotemporal variation of shoreline position are examined for the last two decades. The variations of sediment volume and depth contour lines are also discussed at a time scale of years. Then, we further examine the characteristics of systematic bar migration based on a profile record collected over a period of 13 years. Alongshore, as well as cross-shore variations are examined. Finally, the principal modes of bar migration are clarified using empirical orthogonal function (EOF) analysis. The relationship between the transitions in bar configurations and middle-term shoreline variations over several years is also examined.
The principal objective of this study is to analyze and document the morphological behavior of the multiple bar system and related variations on the Chirihama Coast. The results obtained in this study will contribute to an improved scientific understanding of morphologic features on this beach, such as shoreline movements, bar configurations and the relationships between them. In addition, the results will be useful for understanding and comparing the behavior of similar sandy beaches around the world.

2. Field Site

2.1. Location

The Chirihama Coast is located midway along the northwest coast of Honshu, Japan facing the Japan Sea (Figure 1). The coastline is nearly straight and has a general NNE-SSW orientation. The study area includes an approximately 13 km-long stretch of coastline (including Nagisa Driveway in the north part) that is part of a large littoral cell stretching approximately 75 km along the coast. The beach slope is typically in the range of 1/80 to 1/200. The seabed slope becomes more gradual as the alongshore locations move northward. Figure 1b is an aerial photograph of the Chirihama Coast taken in 1975. The evolution of three sandbars is observed along the shoreline. Referring to the morphodynamic classifications of Wright and Short [19], the beach is mainly in the intermediate stage with a longshore bar trough.
From 1984, beach nourishment has been conducted on an irregular basis (i.e., not every year) [1]. The volume, length and location varied with each nourishment exercise. Typically, 3000 to 5000 m3 of sand were placed per year onto the shoreface. The corresponding longshore length of nourishment was several hundred meters. Nourishment locations were determined based on alongshore variations in beach width each year; i.e., the nourishment was conducted where the beach width was expected to be insufficient to maintain the viability of the marine drive. Construction of a submerged breakwater started in 2010 in the middle of the study area. During the period of data analysis (1998 to 2010), however, the coastal stretch under examination was almost free from the direct influences of engineering structures.

2.2. Wave Climate and Coastal Currents

Because the study area is microtidal with a maximum tidal range of 0.4 m, the littoral sediment transport near the shoreline is dominated by seasonal wave actions. The wave climate has been measured at the Tokumitsu observation station (Figure 1a) of the Hokuriku Regional Development Bureau of Japan’s Ministry of Land, Infrastructure, Transport and Tourism (HRDB), which is located approximately 40 km southwest of the study area. The wave height and direction have been measured approximately 1500 m offshore where the water depth is approximately 15 m. According to the observation record from 1995 to 2005, the characteristics of the wave climate are summarized as follows (Figure 3). In the summer, waves are calm, and the significant wave height is usually less than 1 m. The dominant incoming wave direction is from the NNW, although the wave direction is relatively widespread. In the winter season, the dominant wave direction is from the NW to the WNW. High waves with significant heights in excess of 1 m are often observed. Annual maximum significant wave height off the beach is in the range of 5 to 8 m. The annual net longshore sediment transport is considered to be from the NNE to the SSW near the shore. Further offshore, where the water depth is more than approximately 10 m, sand transport is predominantly affected by the Tsushima ocean current, as well as wind-driven currents. The dominant directions of these currents are from the SSW to the NNE, which is opposite that of the wave-induced current near the shoreline. Although sediment transport in this area is relatively weak compared to that of the surf zone, the occurrence of strong currents near the bottom may contribute to the long-term evolution of coastal topography [20,21]. According to previous field observations, the northward current prevails during the passage of low-pressure systems across the sea, and the current velocity at depths of 10 and 15 m could reach 90 and 40 cm/s, respectively [21,22]. Sediments are considered to migrate from the SSW to the NNE by these currents in the offshore area.

2.3. Sediment Characteristics

Sediment grain size in the study area is generally in the fine sand range. Sediment diameters become smaller as the location moves northward. Typical sediment diameters near the shoreline are 0.15 to 0.20 mm. According to a previous field study by the Ishikawa Prefectural Government concerning the sediment size distribution at the location of line H60 (H stands for the Hakui district where the Chirihama Coast is located.) in Figure 1b, sediment size is concentrated in a narrow range between 0.15 and 0.18 mm. Another investigation of the cross-shore variation of the sediment diameter [1] near the northern boundary of the study area (close to line H60 in Figure 1b) also demonstrated that the cross-shore variation in grain size (d60) is small up to water depths of 50 m.

3. Datasets and Methods

3.1. Datasets

Surveys of the shoreline location have been carried out by the public works department of the Ishikawa Prefectural Government. The shoreline location has been measured twice a year, in March and September, over a 15.5-km alongshore stretch. In this study, the data from 1986 to 2006 are used. The long-term and large-scale trends of shoreline change were analyzed based on the shoreline survey.
Cross-shore profile surveys have been carried out since 1998 by HRDB along the four survey lines (H01, H03, H40 and H60) in Figure 1b. The longshore interval of these lines varies between 4000 and 4200 m. The cross-shore stretch of the survey varied each year in the range of 1 to 3.5 km. The strike of the survey lines is 307° (clockwise from north), which is slightly different from the shore normal direction. Subaqueous profiles have been measured using an echo sounder once a year, usually in autumn (from September to November). In this study, field data obtained from 1998 to 2010 were used. In the soundings collected during 2002, the bathymetry of the outer nearshore zone was not resolved on H01, H02 and H60. Bed elevations are described with respect to the Tokyo Peil (T.P.) datum, which is the standard ground elevation in Japan based on the Tokyo Bay mean sea level.

3.2. Quantification of Bar Properties

Variations in the sandbar properties have been examined as follows. First, the shoreline position was defined for each year as the location where the bed elevation is equal to the mean monthly lowest water level (T.P. + 0.01 m). The mean location of the shoreline during the study period was then computed for each line as a reference location. Hereafter, the cross-shore distance is taken as the distance from the mean location of the shoreline during the study period (denoted as X = 0 m), unless otherwise mentioned. The seaward distance of the crest (Xc) and vertical elevation of the crest (Zc) and trough (Zt) of bars were first examined to investigate the geometric features of the bar system (Figure 4). Bar height (Hb) was defined as the difference between the crest elevation and trough elevation. Bars with computed heights below a threshold value of 0.2 m (which corresponds to sounding accuracy) were considered to be unreliable and, hence, were excluded from the datasets. The alongshore variability has then been investigated in detail through a comparison between survey lines.

3.3. EOF Analysis

In the original survey record, the locations of survey points were not fixed during the study period. Accordingly, we first computed the bed elevation at fixed locations with a uniform cross-shore interval (20 m) using a linear interpolation for each transect. The cross-shore range of the analysis lies between a point slightly landward (40 to 100 m) of the mean location of the shoreline and a point located 2400 m offshore, which corresponds to a water depth of 12 to 13 m.
The characteristics of morphological variation on each survey line were then examined using EOF analysis. Formerly, EOF analysis has been used to describe changes within beach profiles (e.g., [23,24,25]). The EOFs correspond to a statistically optimal description of the data with respect to how the variance is concentrated in the eigenmodes, where the variance explained decreases with the mode number. The first eigenfunction (with the largest eigenvalue) explains most of the variation in bed-level changes. Each successively higher eigenfunction explains most of the variation left unexplained by the preceding eigenfunctions. In this study, the non-demeaned bed level Z(x,t) was explained by the summation of various eigenmodes. Each mode was represented by the product of the time coefficient Cn(t) and the spatial function en(x), where the subscript n denotes the n-th mode:
Z ( x , t ) = n c n ( t ) e n ( x )
The forms of eigenfunctions were determined empirically. In the present study, a real type of EOF analysis was carried out.

4. Results and Discussion

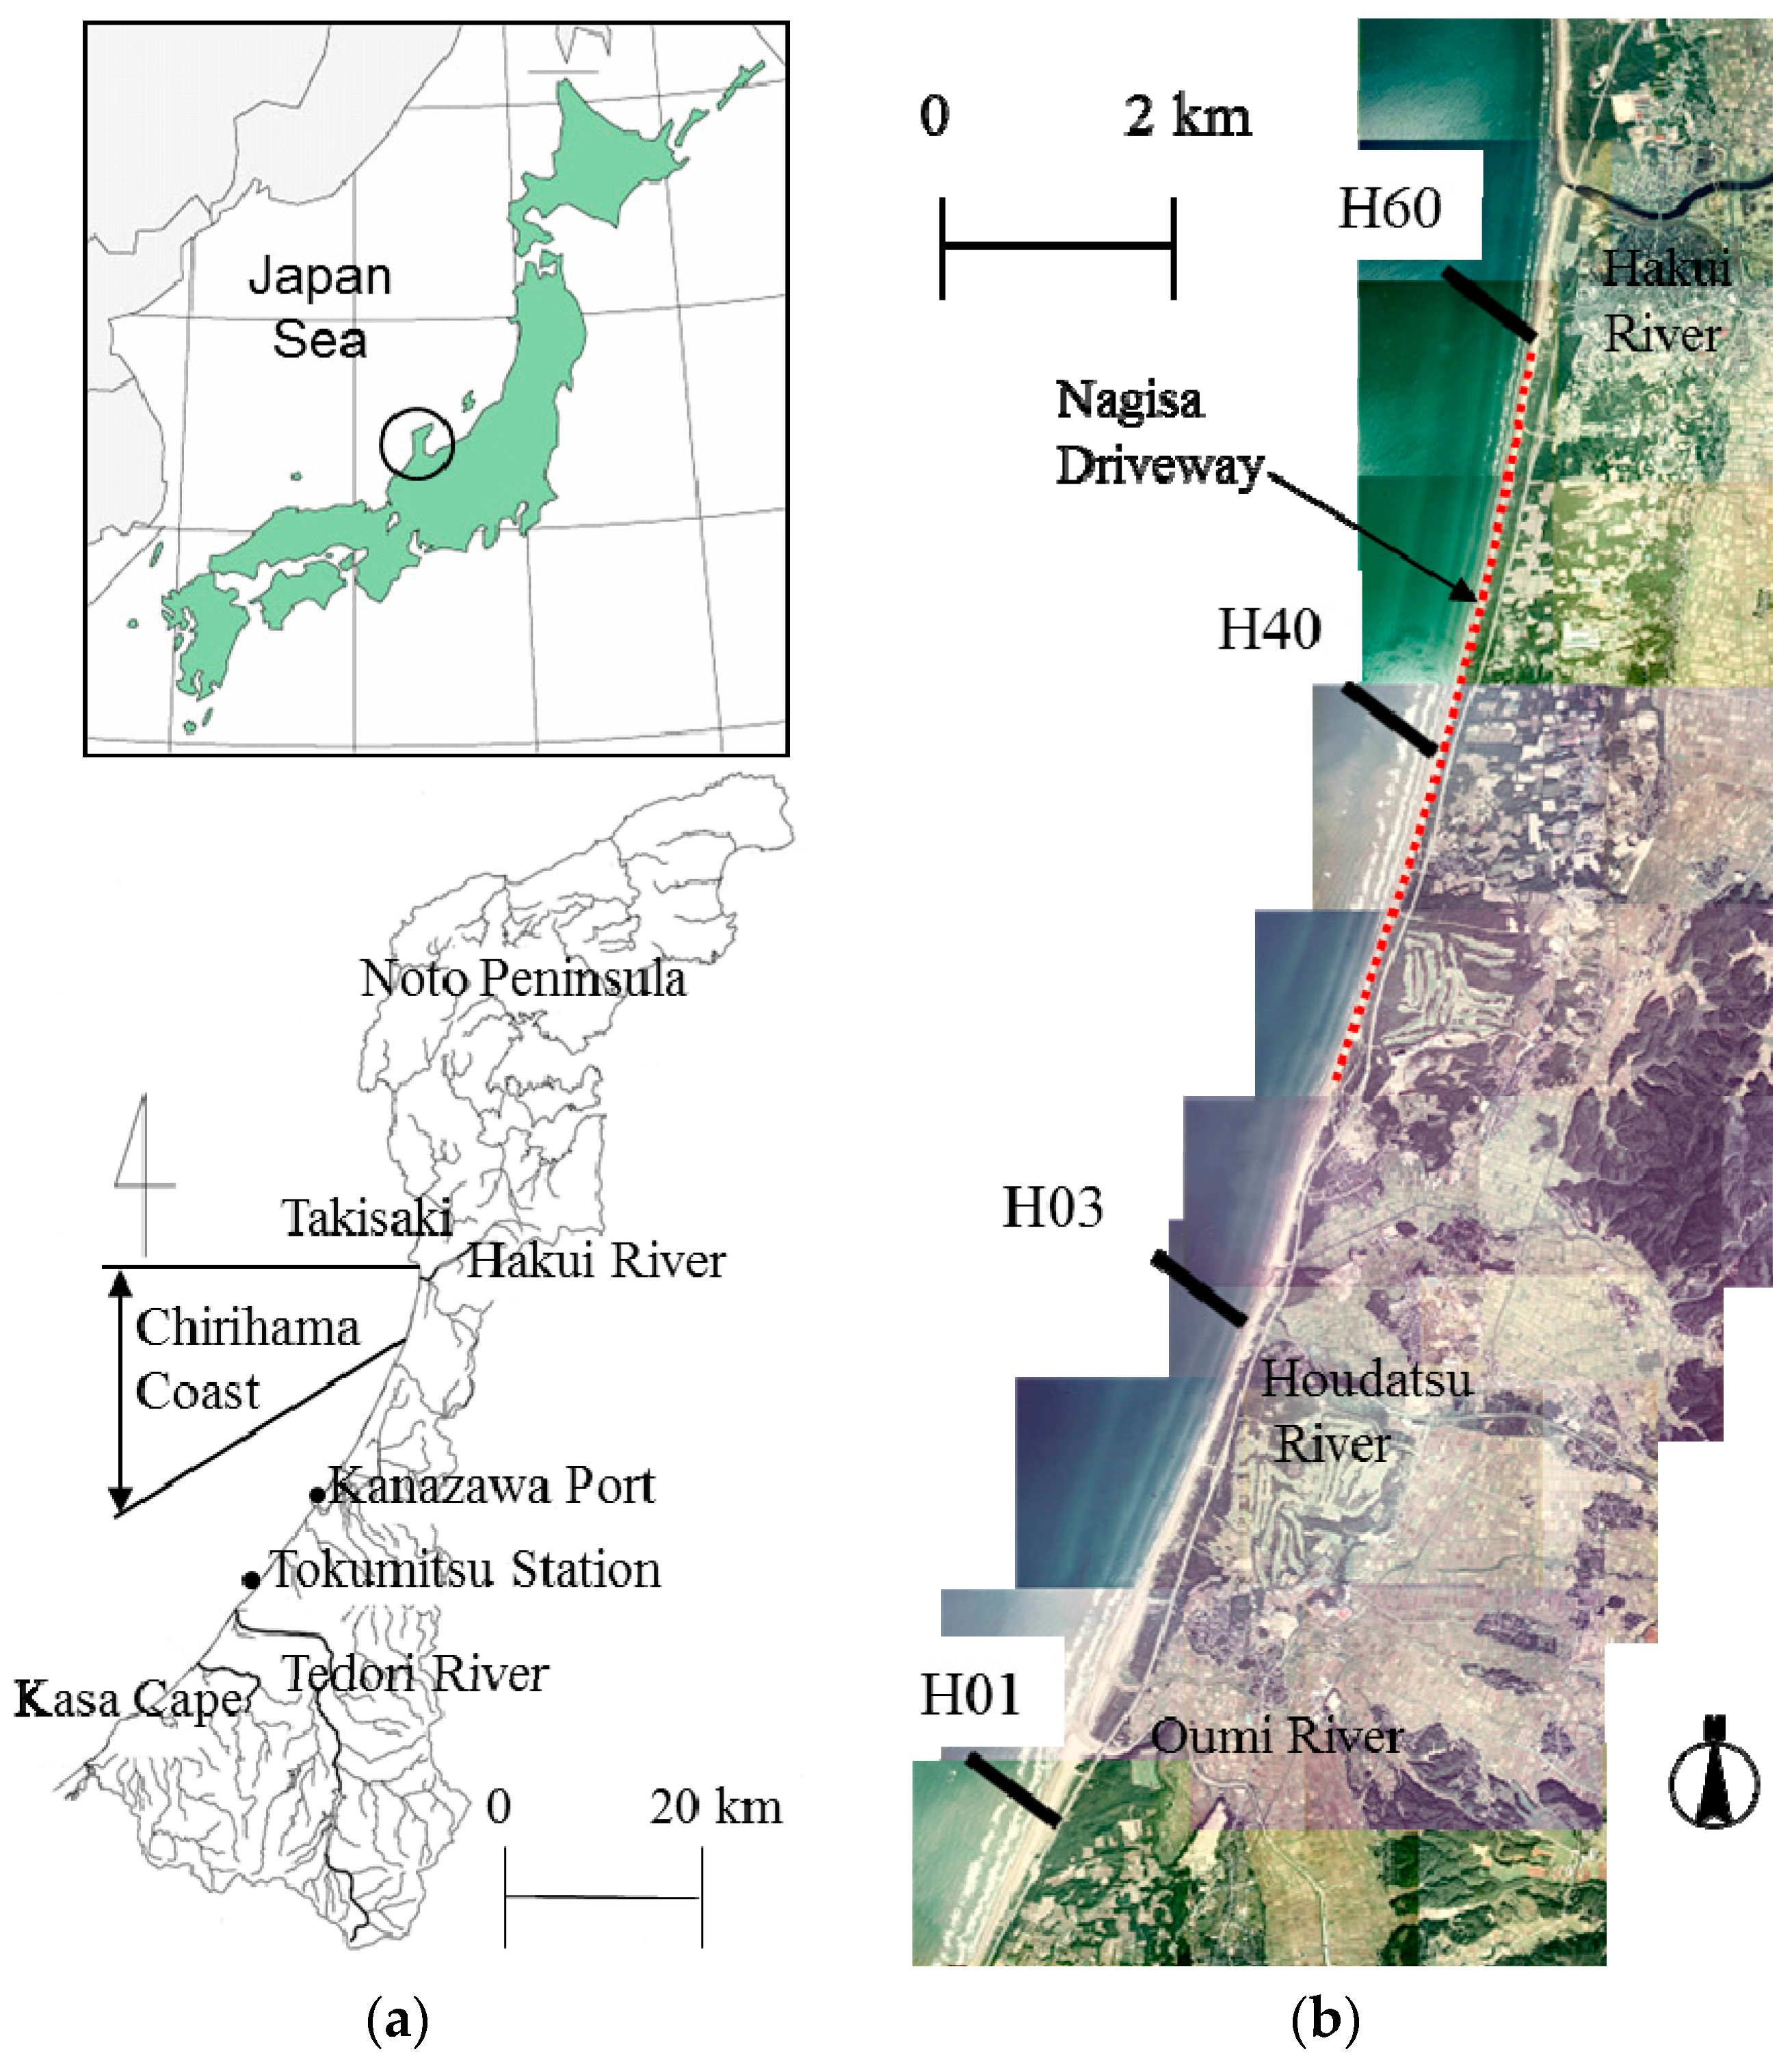
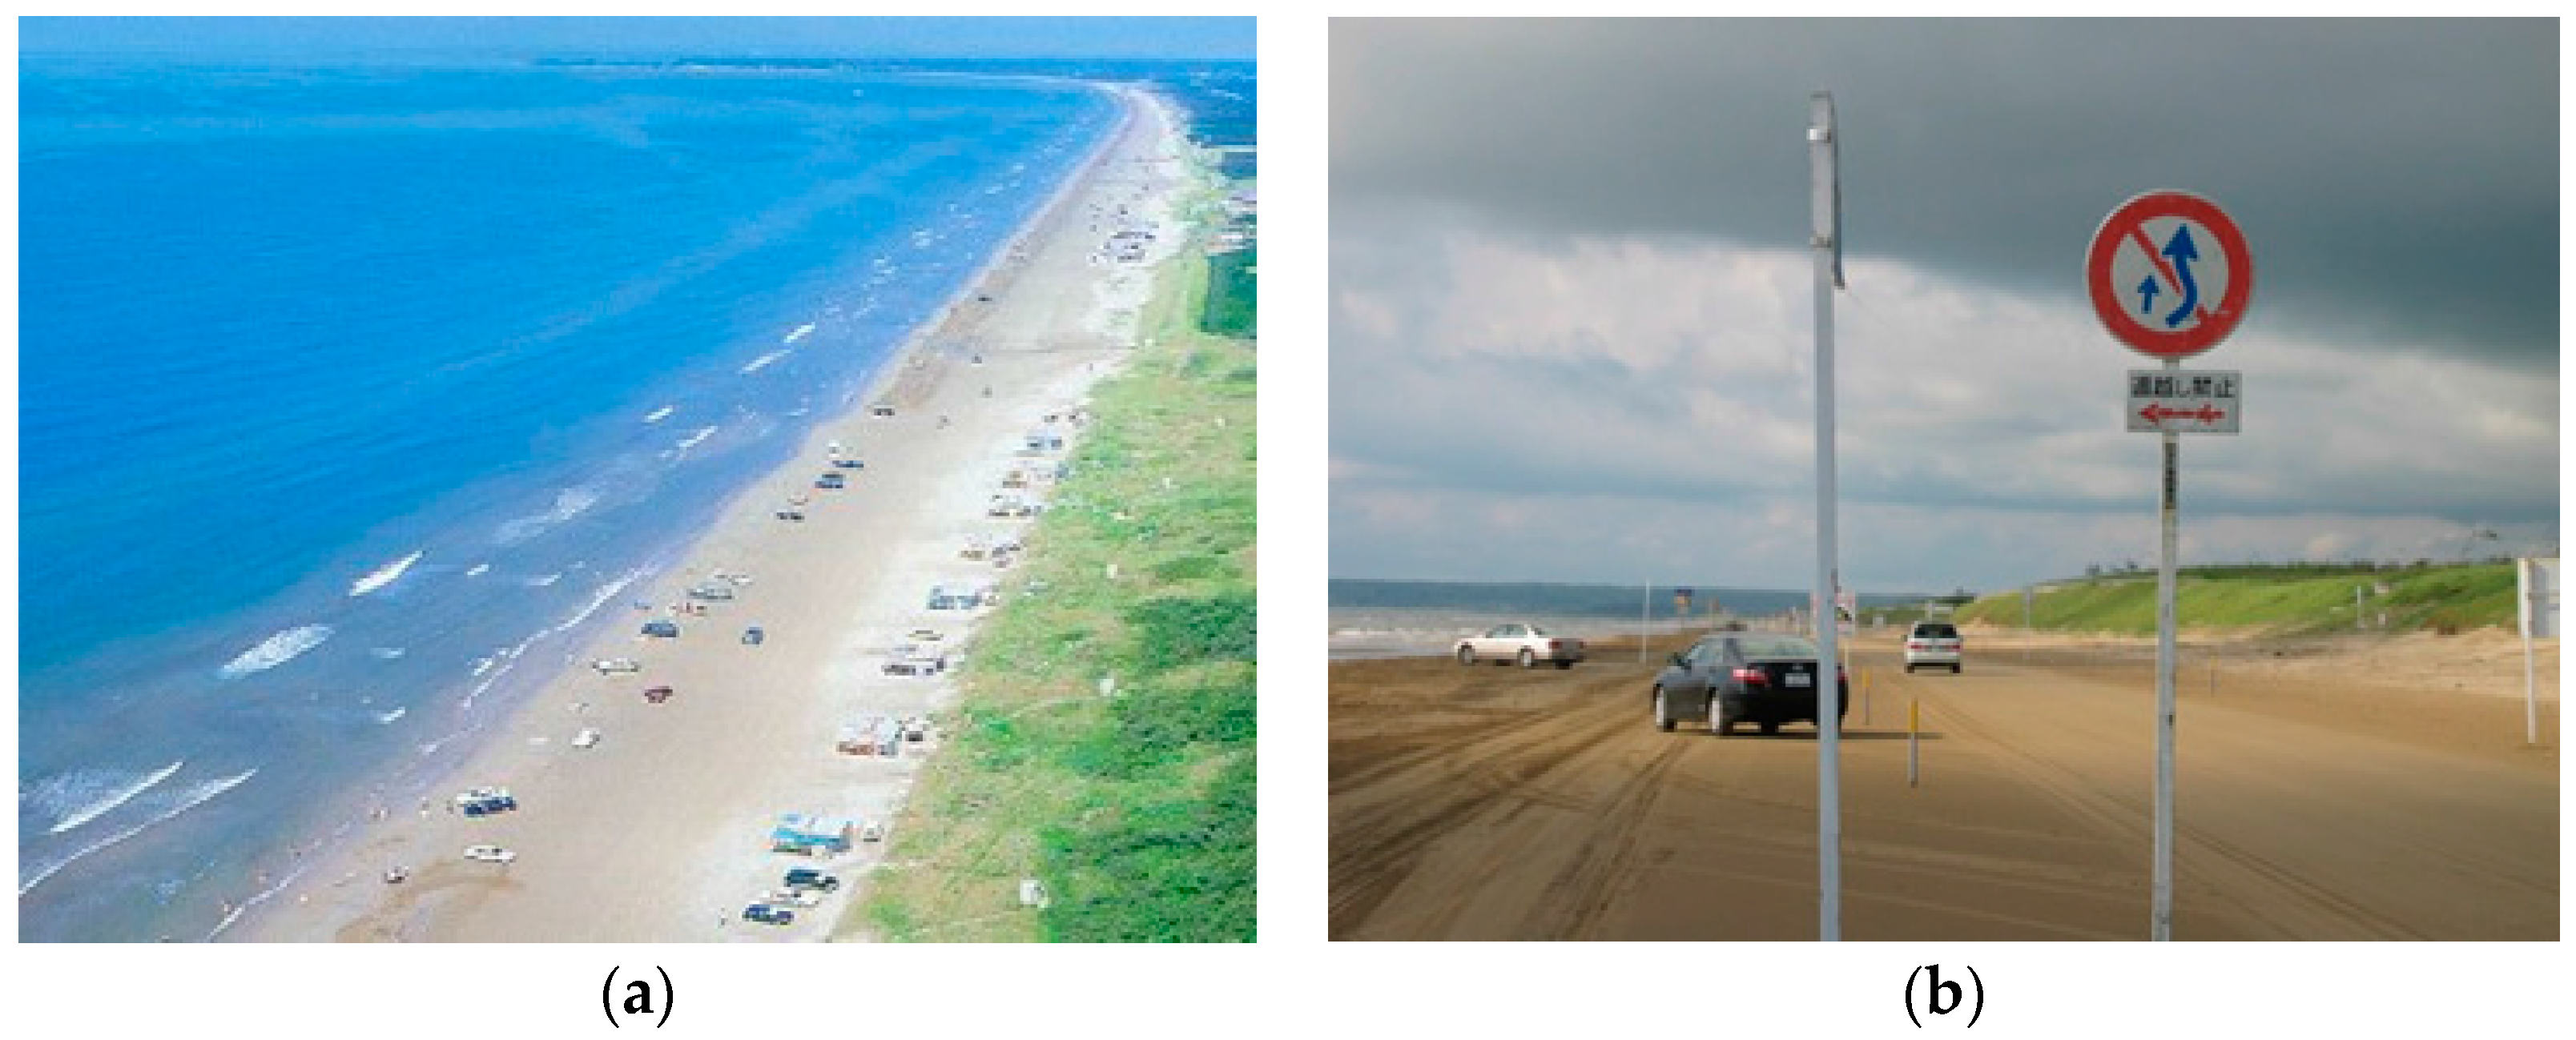
4.1. Characteristics of Shoreline Change

The long-term variation of the shoreline location was examined. 
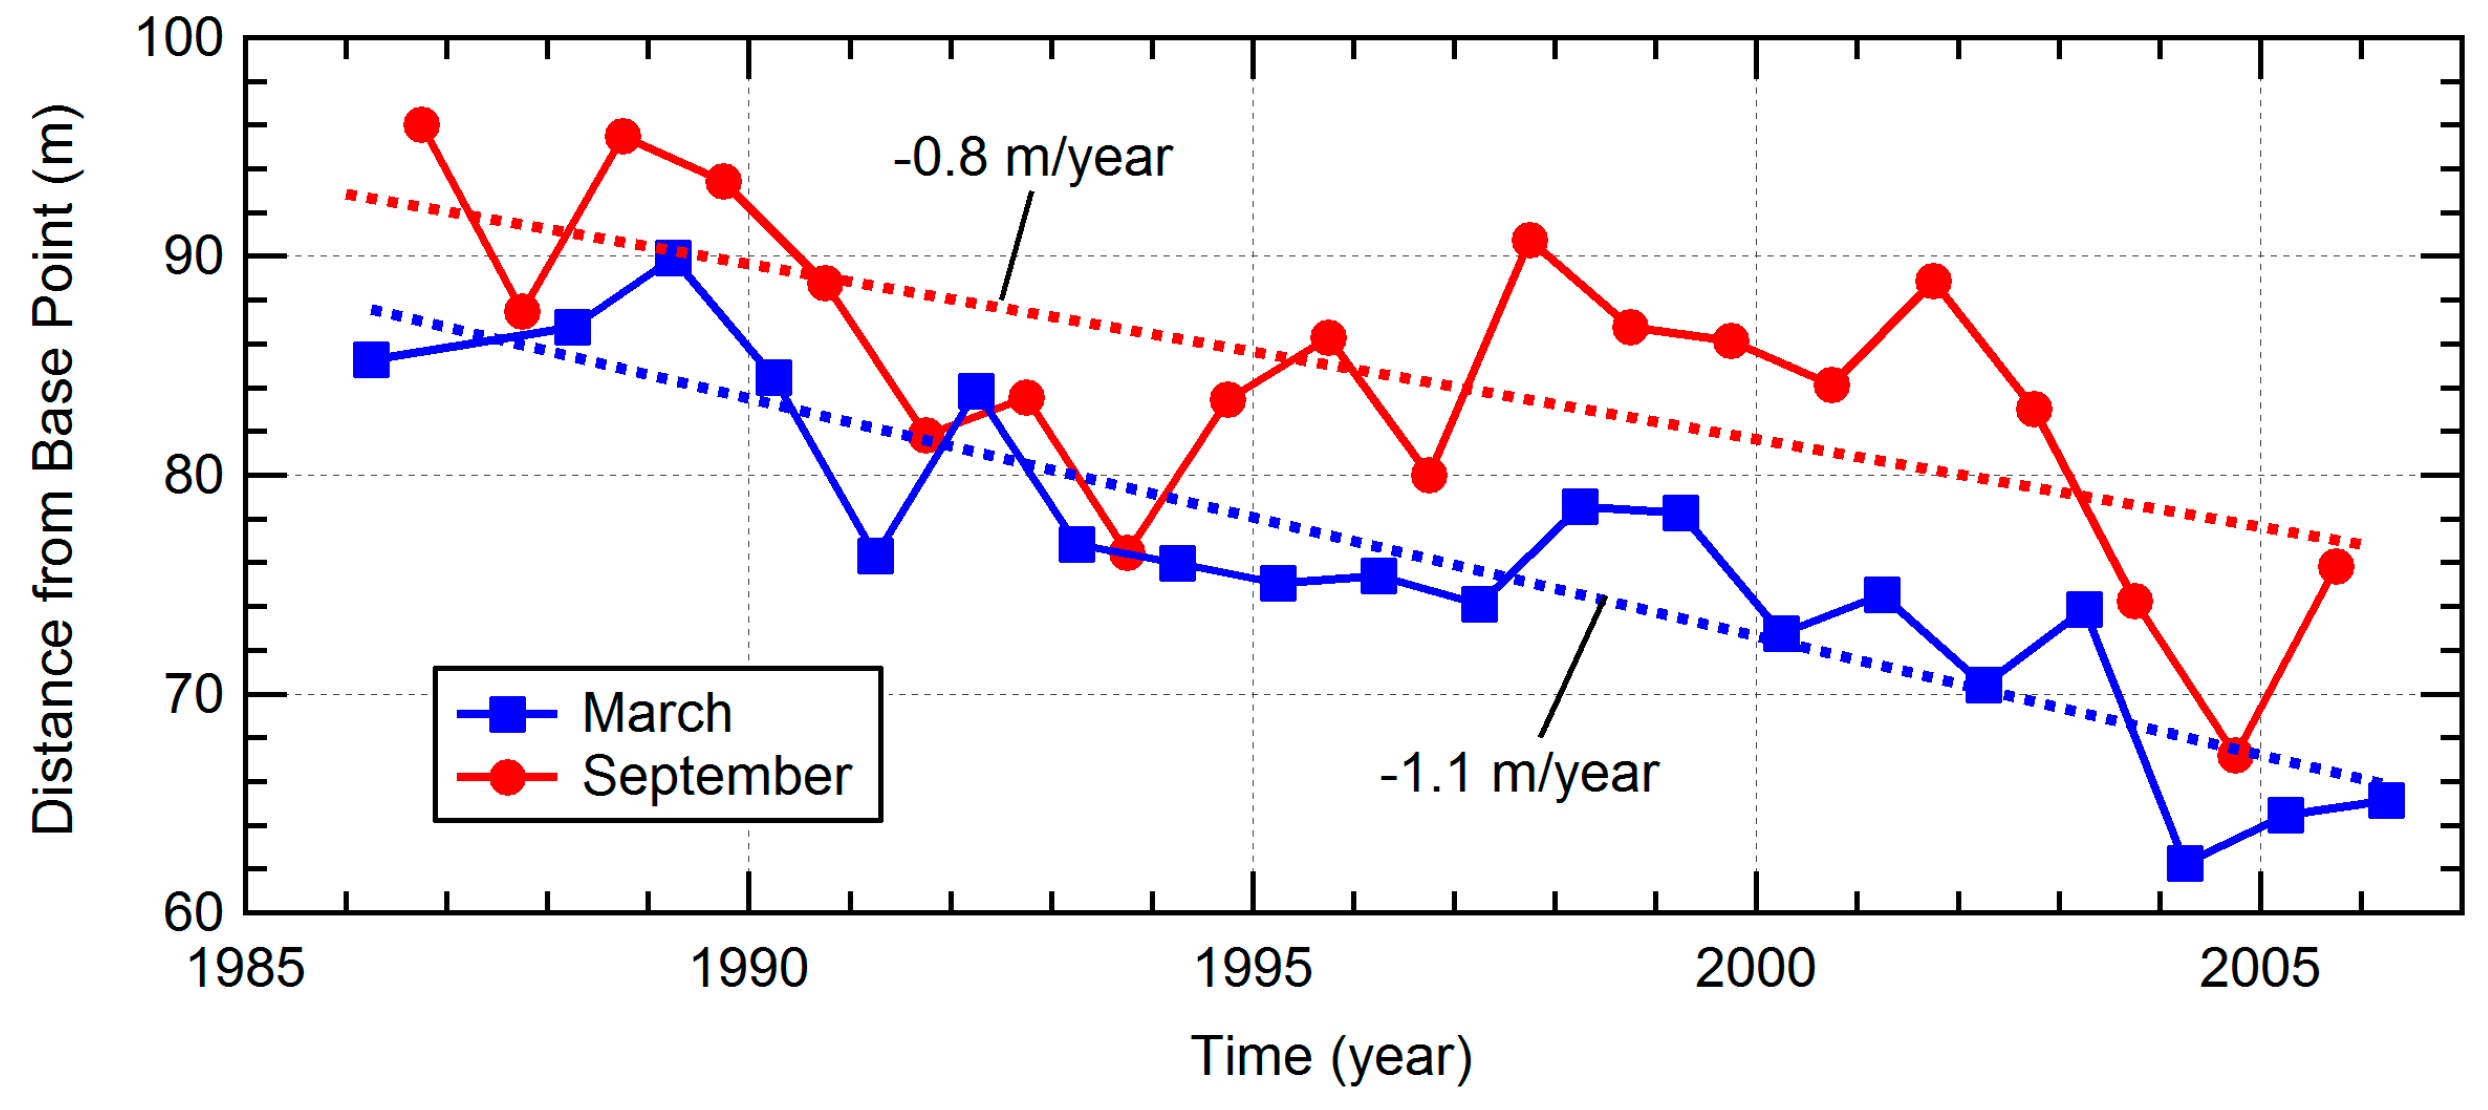
Figure 5 shows the temporal variation of the alongshore-averaged shoreline location along a 7.2-km stretch of the marine drive region from 1986 to 2006. Over that period, the shoreline locations in March and September indicate a retreating trend of 1.1 m/year and 0.8 m/year, respectively. On average, the beach width has decreased approximately 20 m in the last two decades. The overall eroding trend is considered to be related to the construction of Kanazawa Port and the development of the Tedori River basin [2,3,4]. It is quite important to examine the possible causes of accelerated erosion, but such an examination is beyond the scope of the present study. The shoreline retreat was most accelerated during the periods 1988 to 1991 and 2001 to 2004.
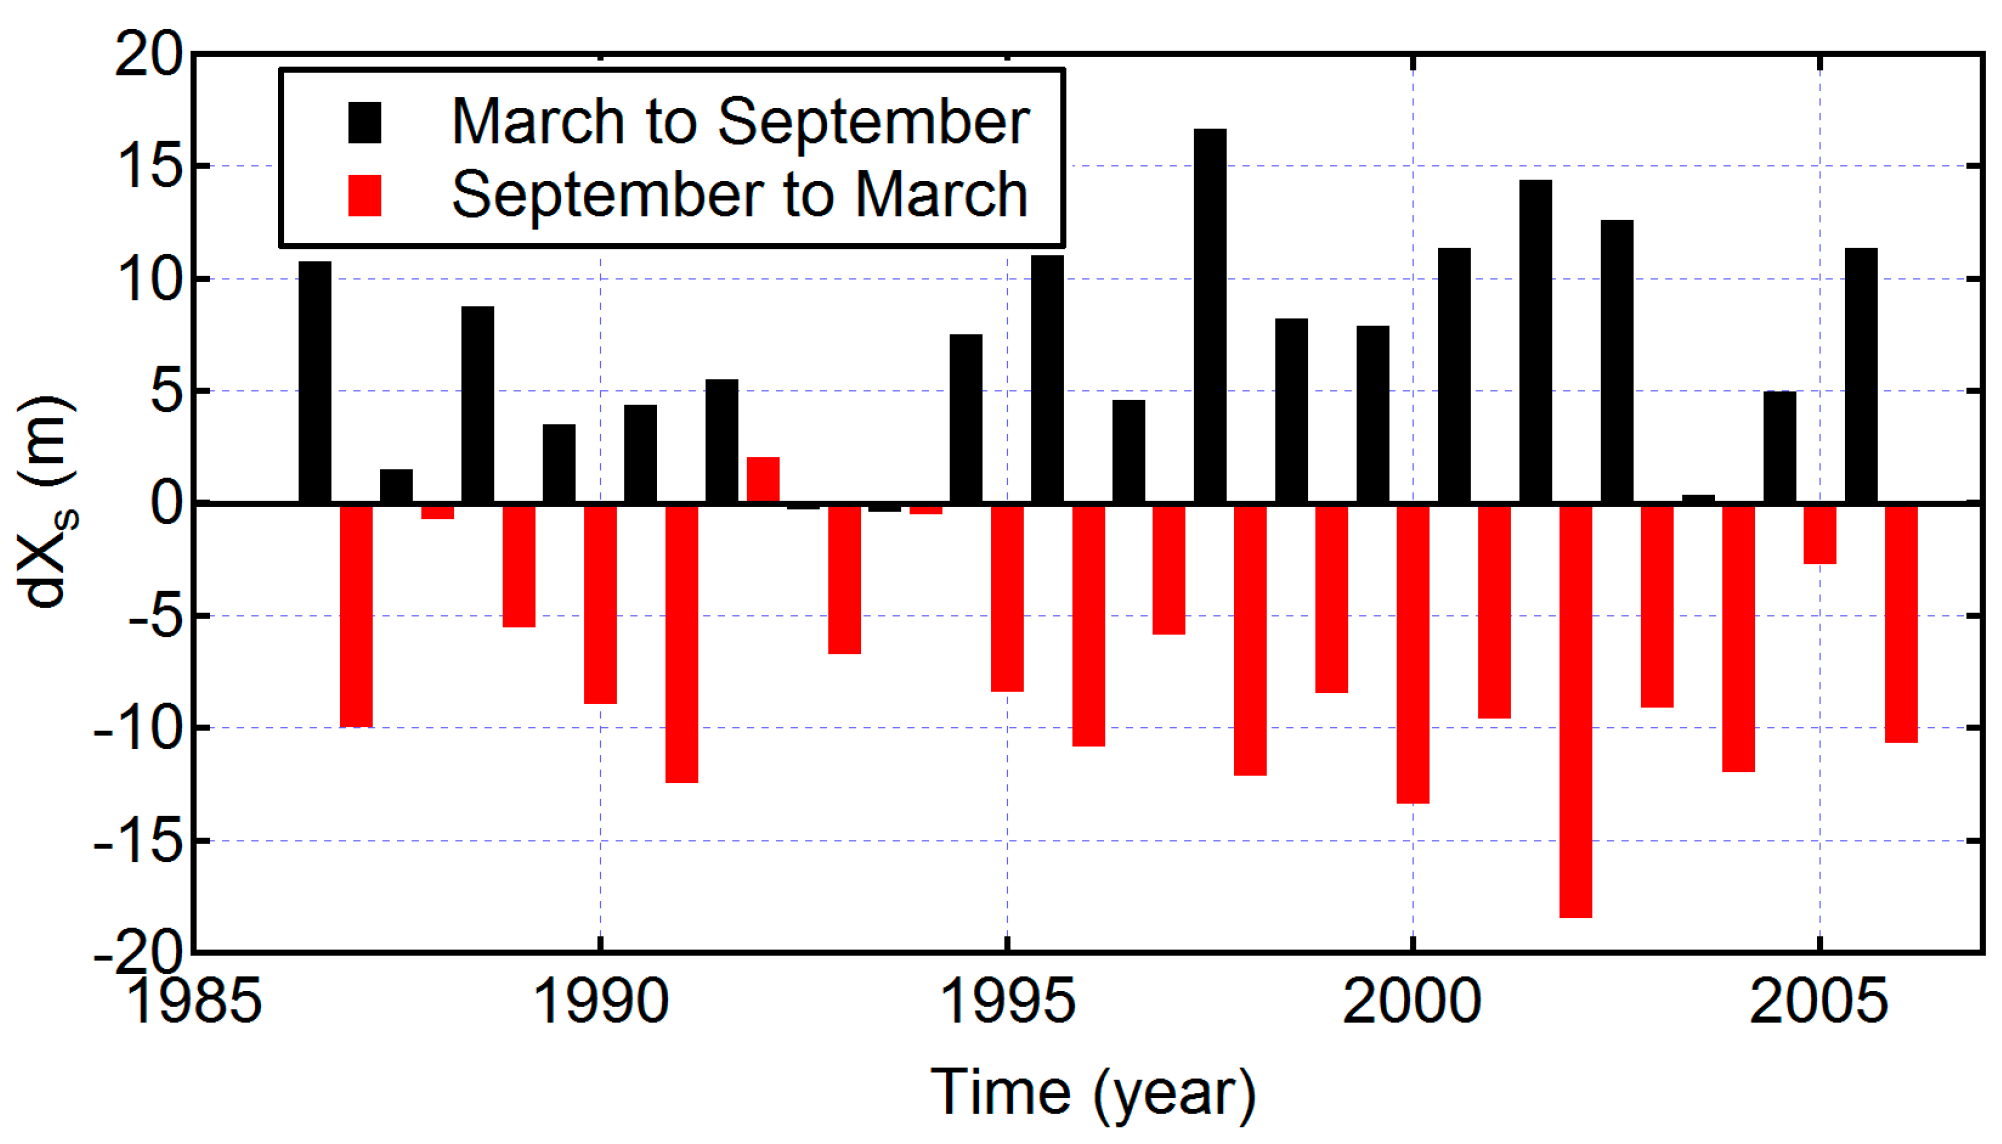
The features of temporal variation are generally similar in spring and autumn surveys. Quantitatively, the year-to-year variation is more significant in September, and the anomaly from the long-term trend reached 10 m in some years. The seasonal variations from September to March and from April to September are plotted in Figure 6. Note that the shoreline retreat during autumn and winter (September to March) is slightly greater than the shoreline advance during spring and summer (April to September), and this difference has increased recently. This is related to the aforementioned difference in the rate of shoreline retreat in March and September. Moreover, the magnitude of shoreline change has been becoming larger recently. 
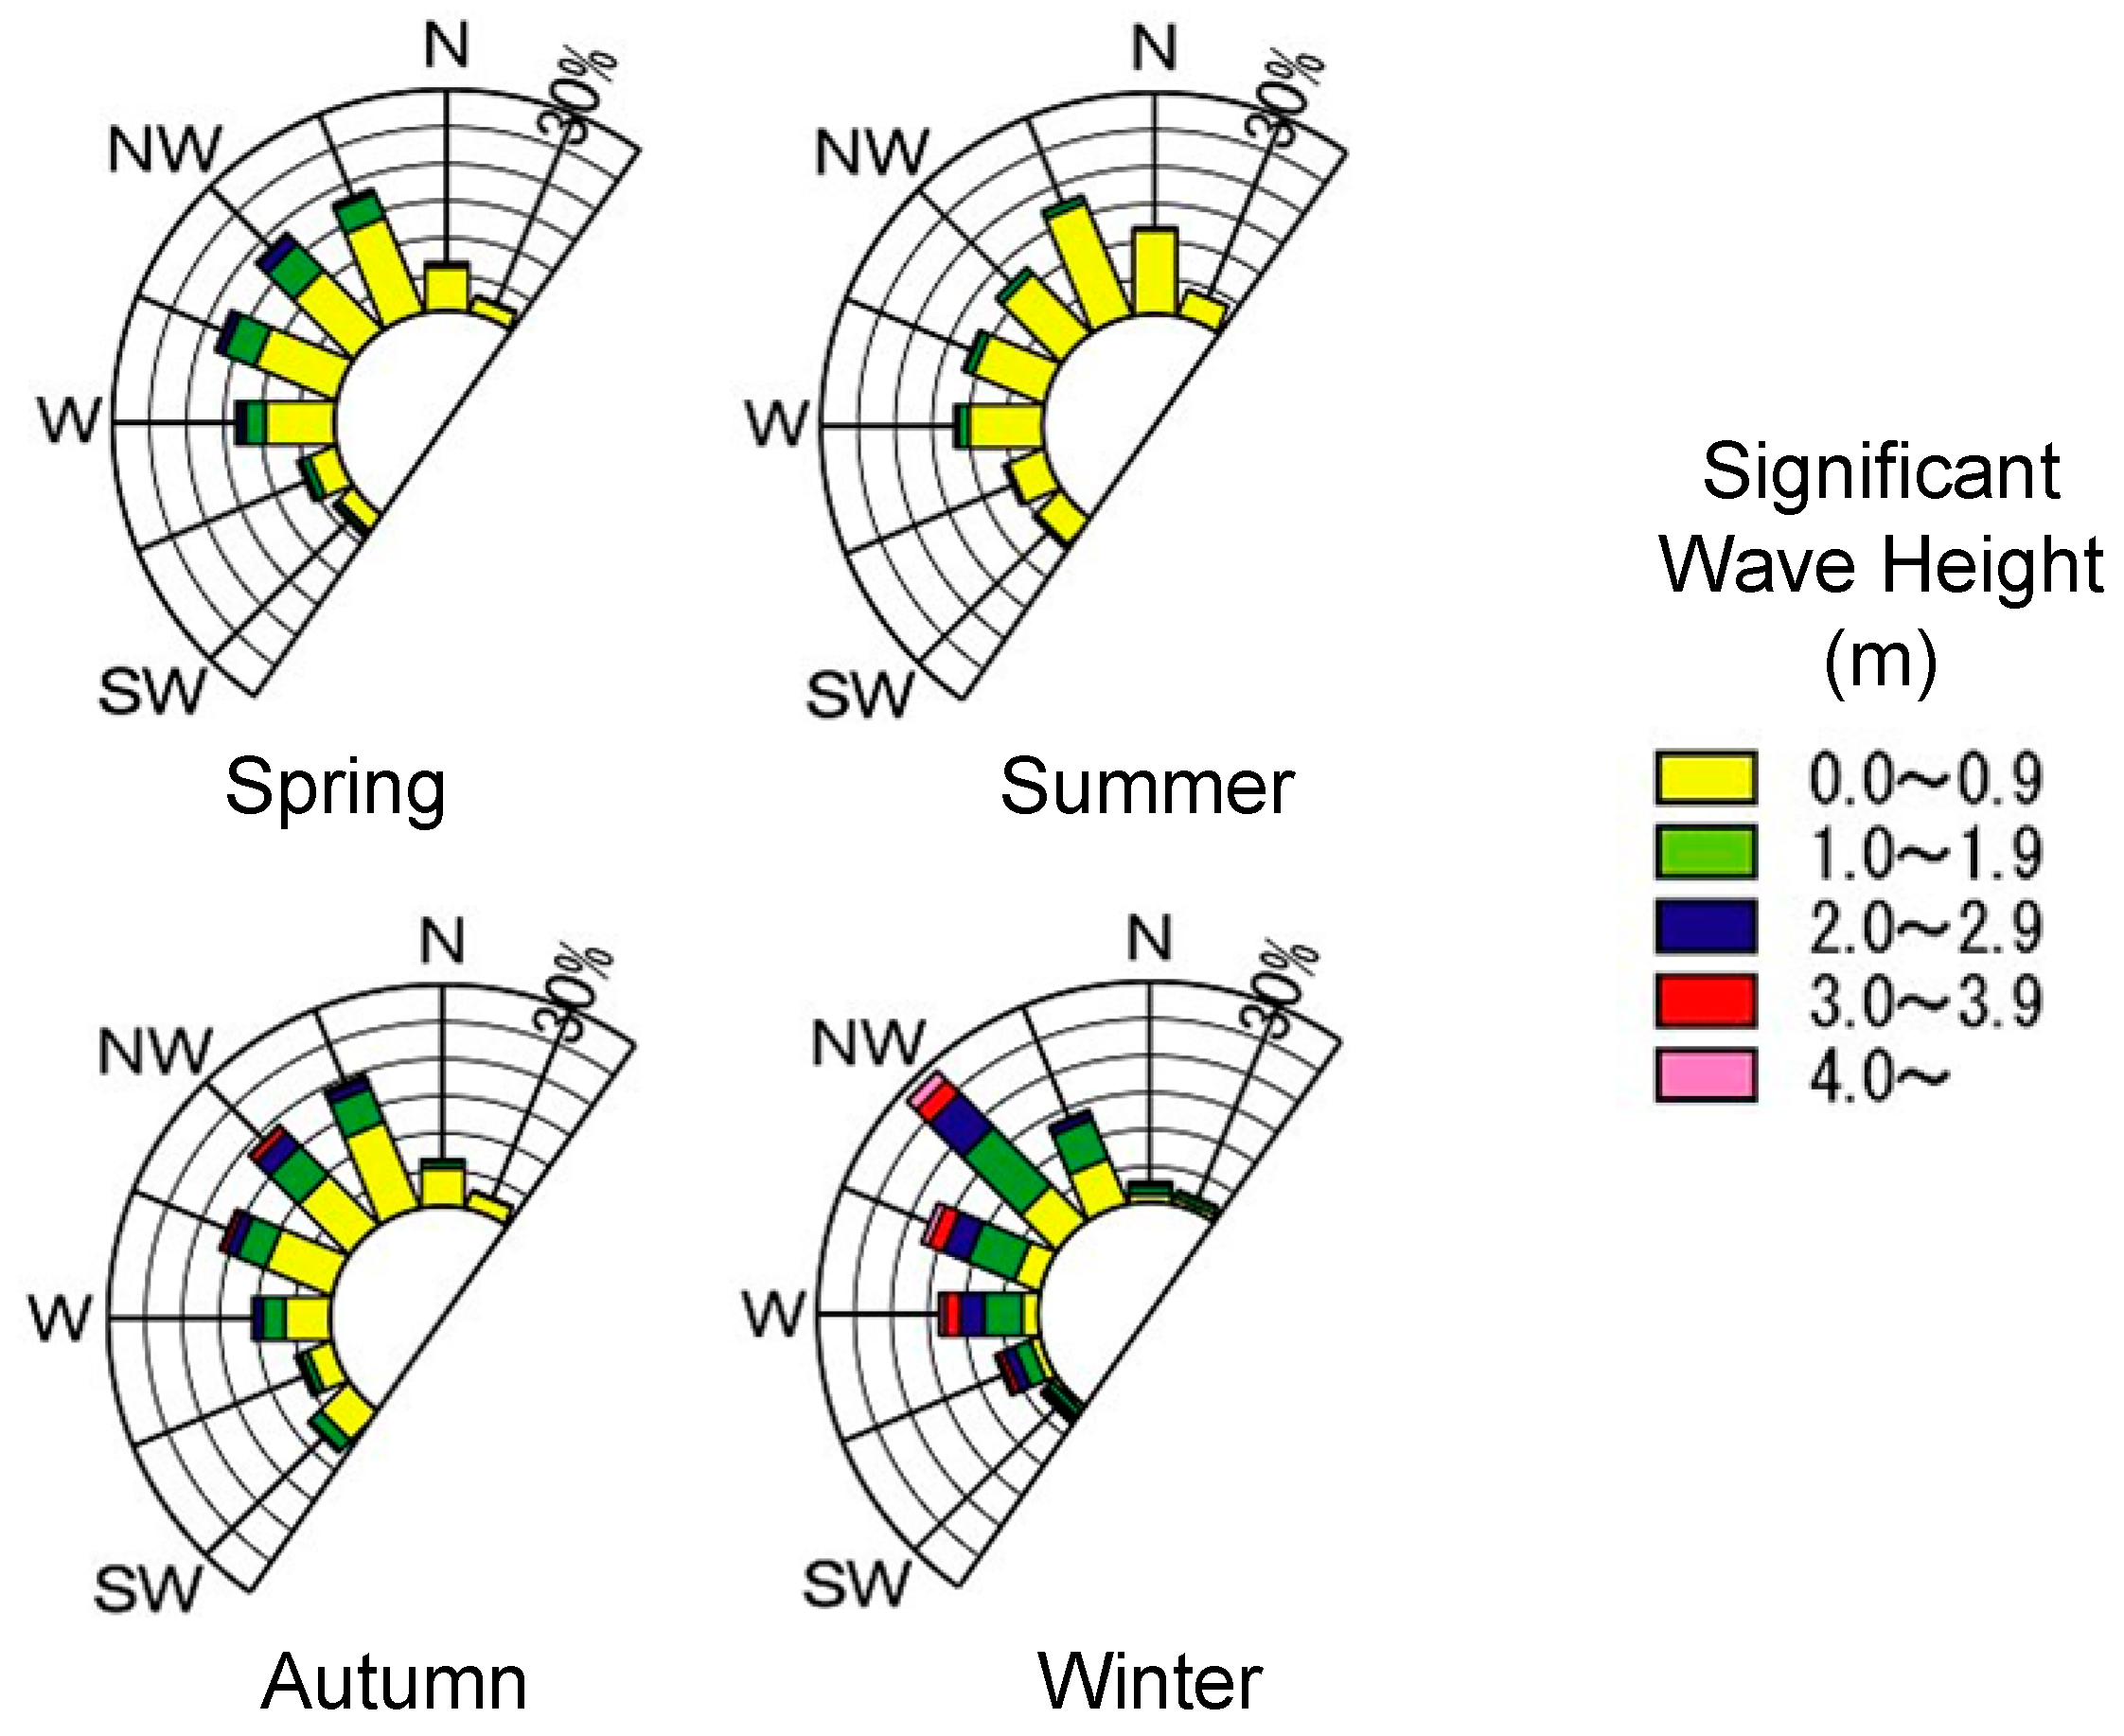
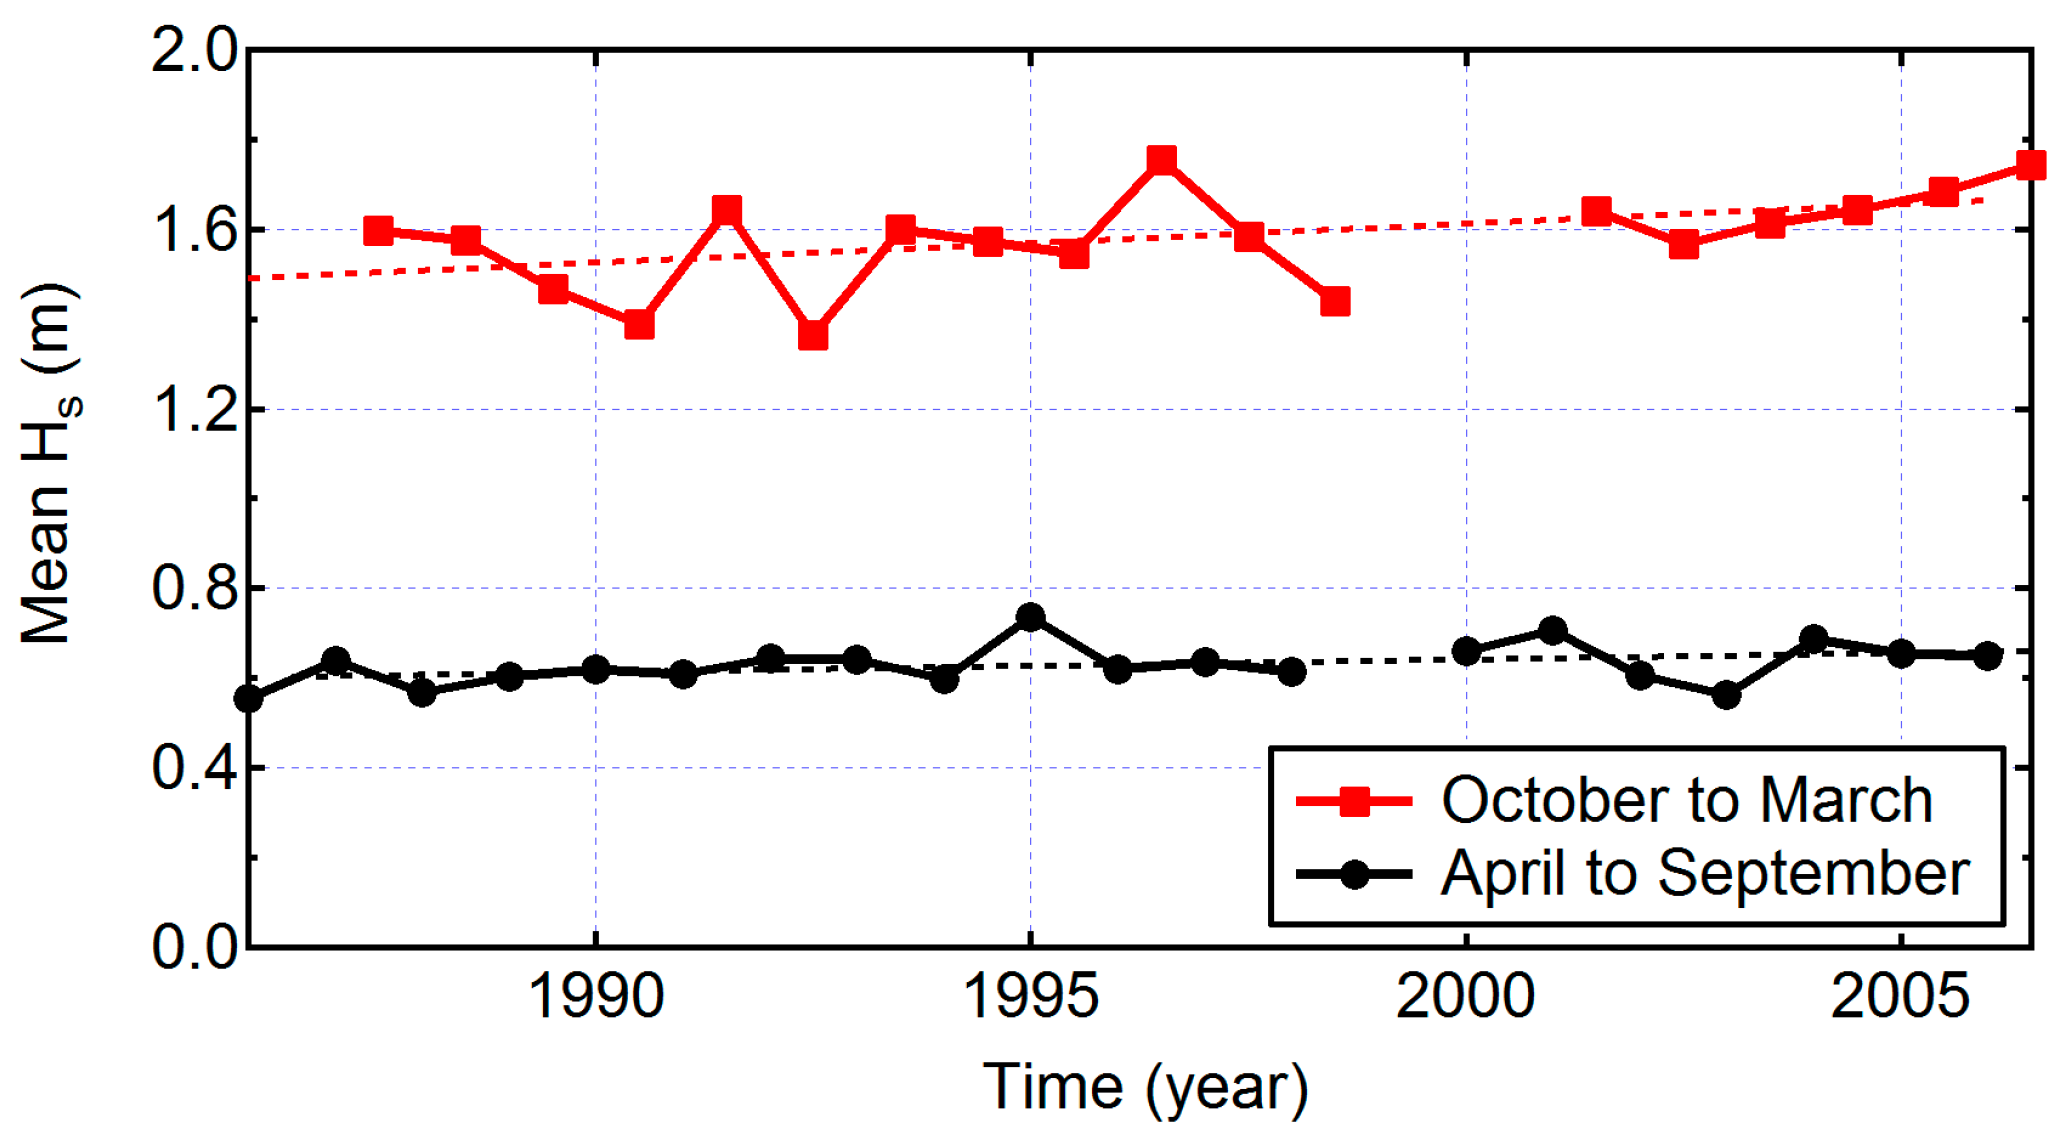
Figure 7 demonstrates the temporal variation of mean significant wave heights observed at Kanazawa Port in contrasting seasons (autumn and winter: from the beginning of October to the end of March; spring and summer: from the beginning of April to the end of September). The wave height in the autumn and winter indicates a weakly increasing trend. This is considered to be related to the recent increase in shoreline variation during winter.
The variation of shoreline location was not uniform over the stretch and period; several kinds of variation with different spatial and temporal scales coexist. 
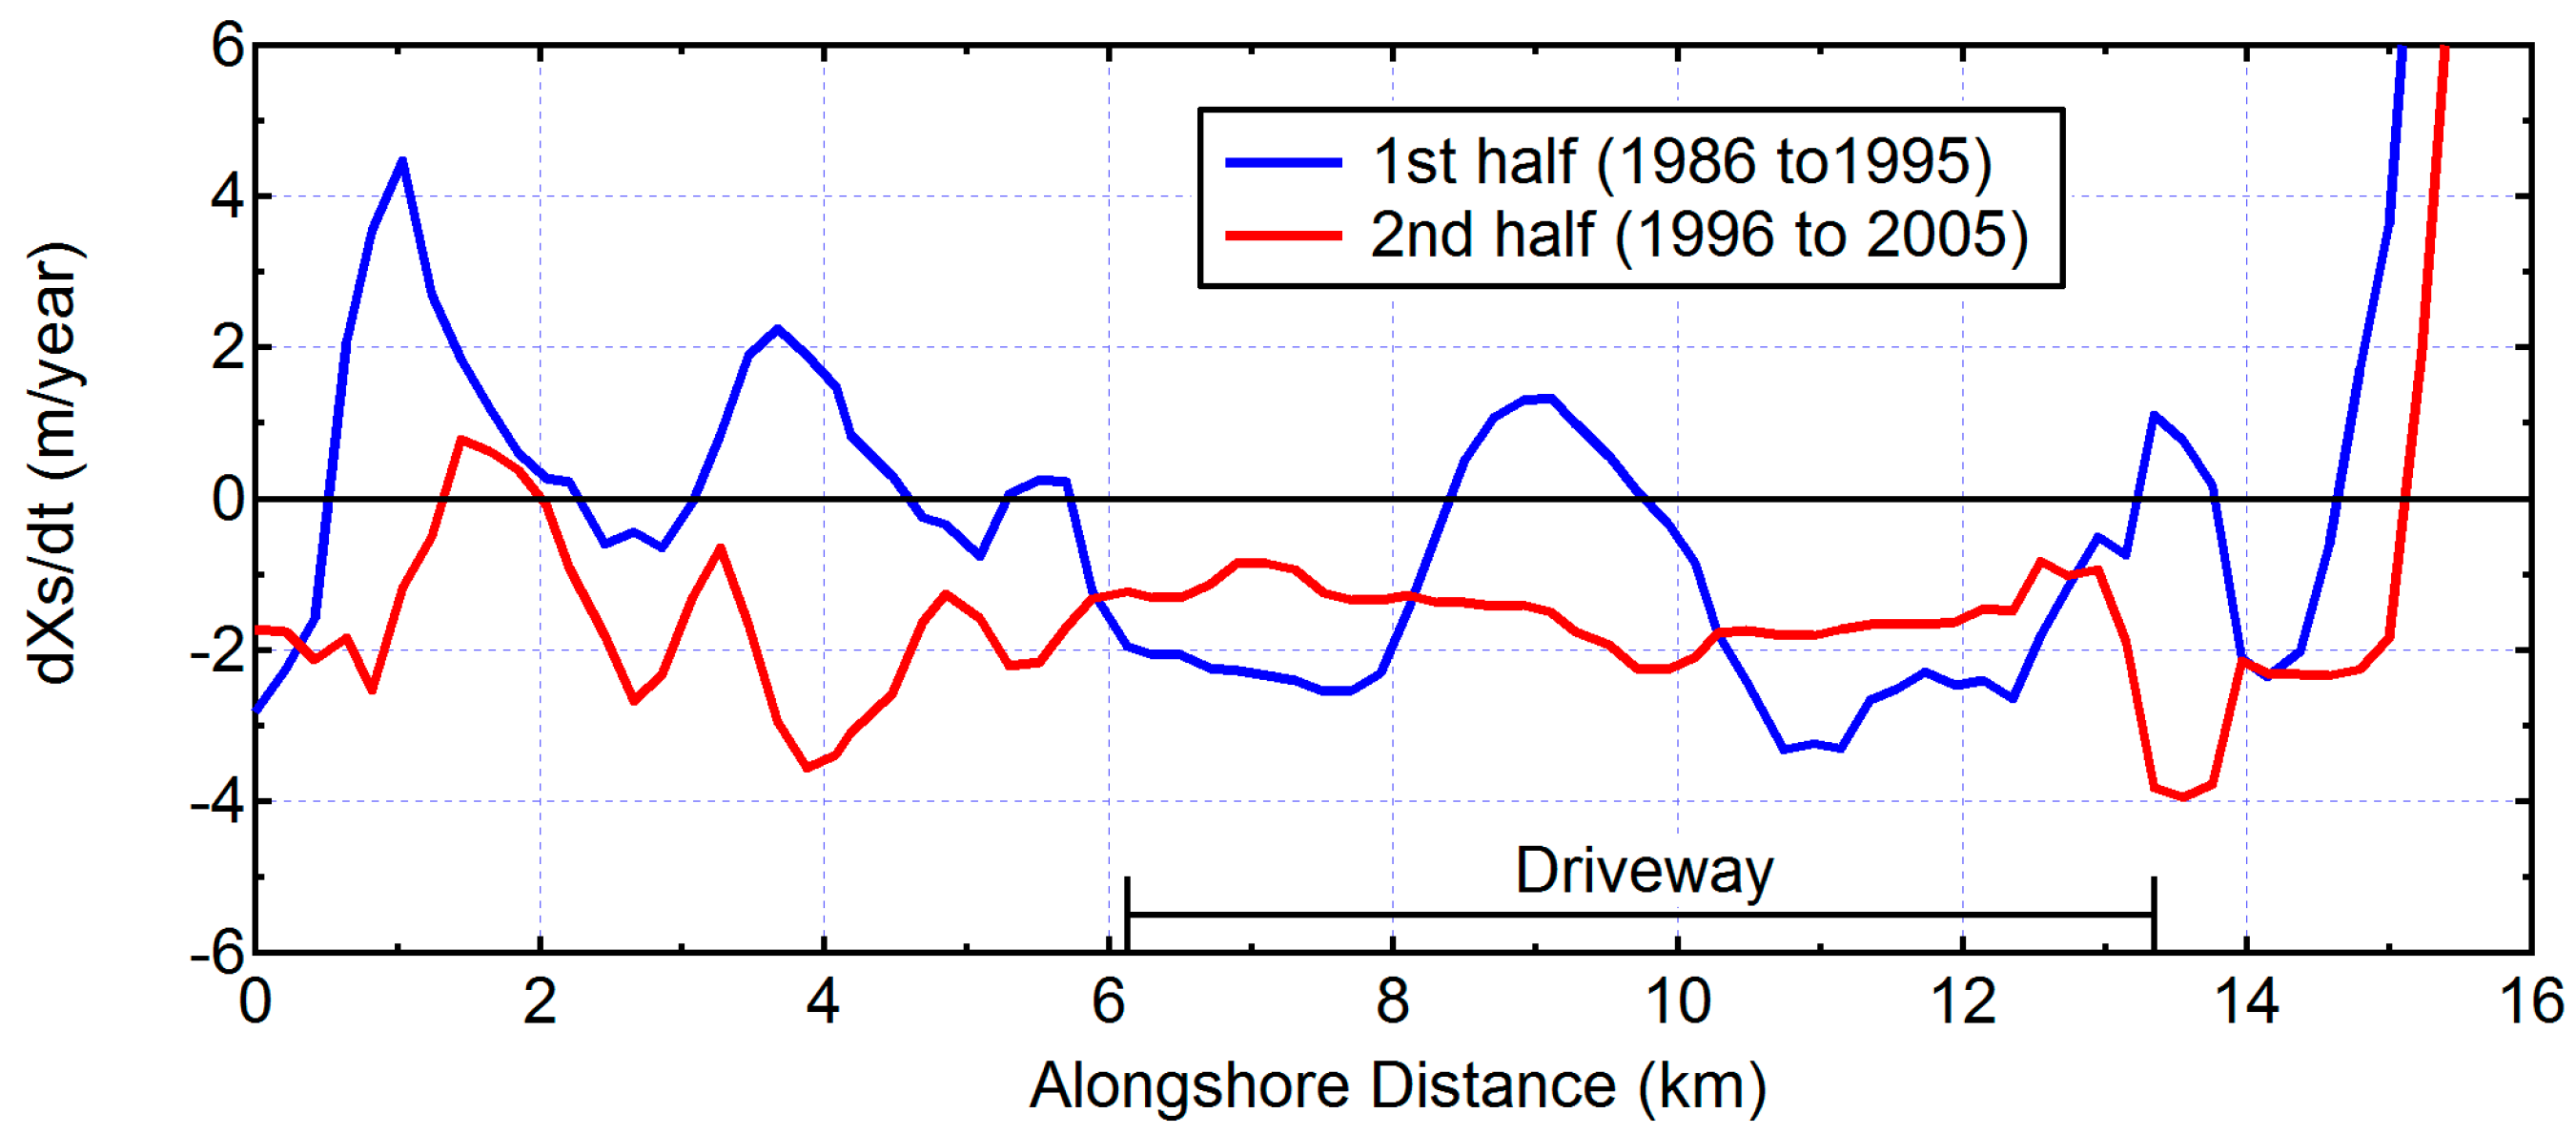
Figure 8 represents the alongshore comparison of the rate of shoreline variation in the first (1986 to 1995) and second (1996 to 2005) halves of the study period. Note that a three-point moving-average was conducted in space to smooth out the local variation. The rate of variation was computed by linear regression. In general, a significant erosional trend is observed, except for the northern end of the study area where an accretionary trend is observed related to the influence of the construction of nearby Taki Port. In the first half of the study period, areas with shoreline advance and retreat appear alternatively. In the second half, the erosional trend became quite dominant. The locations where strong retreat of the shoreline was observed in the second half of the study period roughly correspond to the areas of shoreline advance in the first half. Shoreline retreat over the whole period was more significant in the northern part of the study area. The rate of shoreline retreat was not uniform during the study period. In some locations, it varied significantly between the first and second halves of the study period.
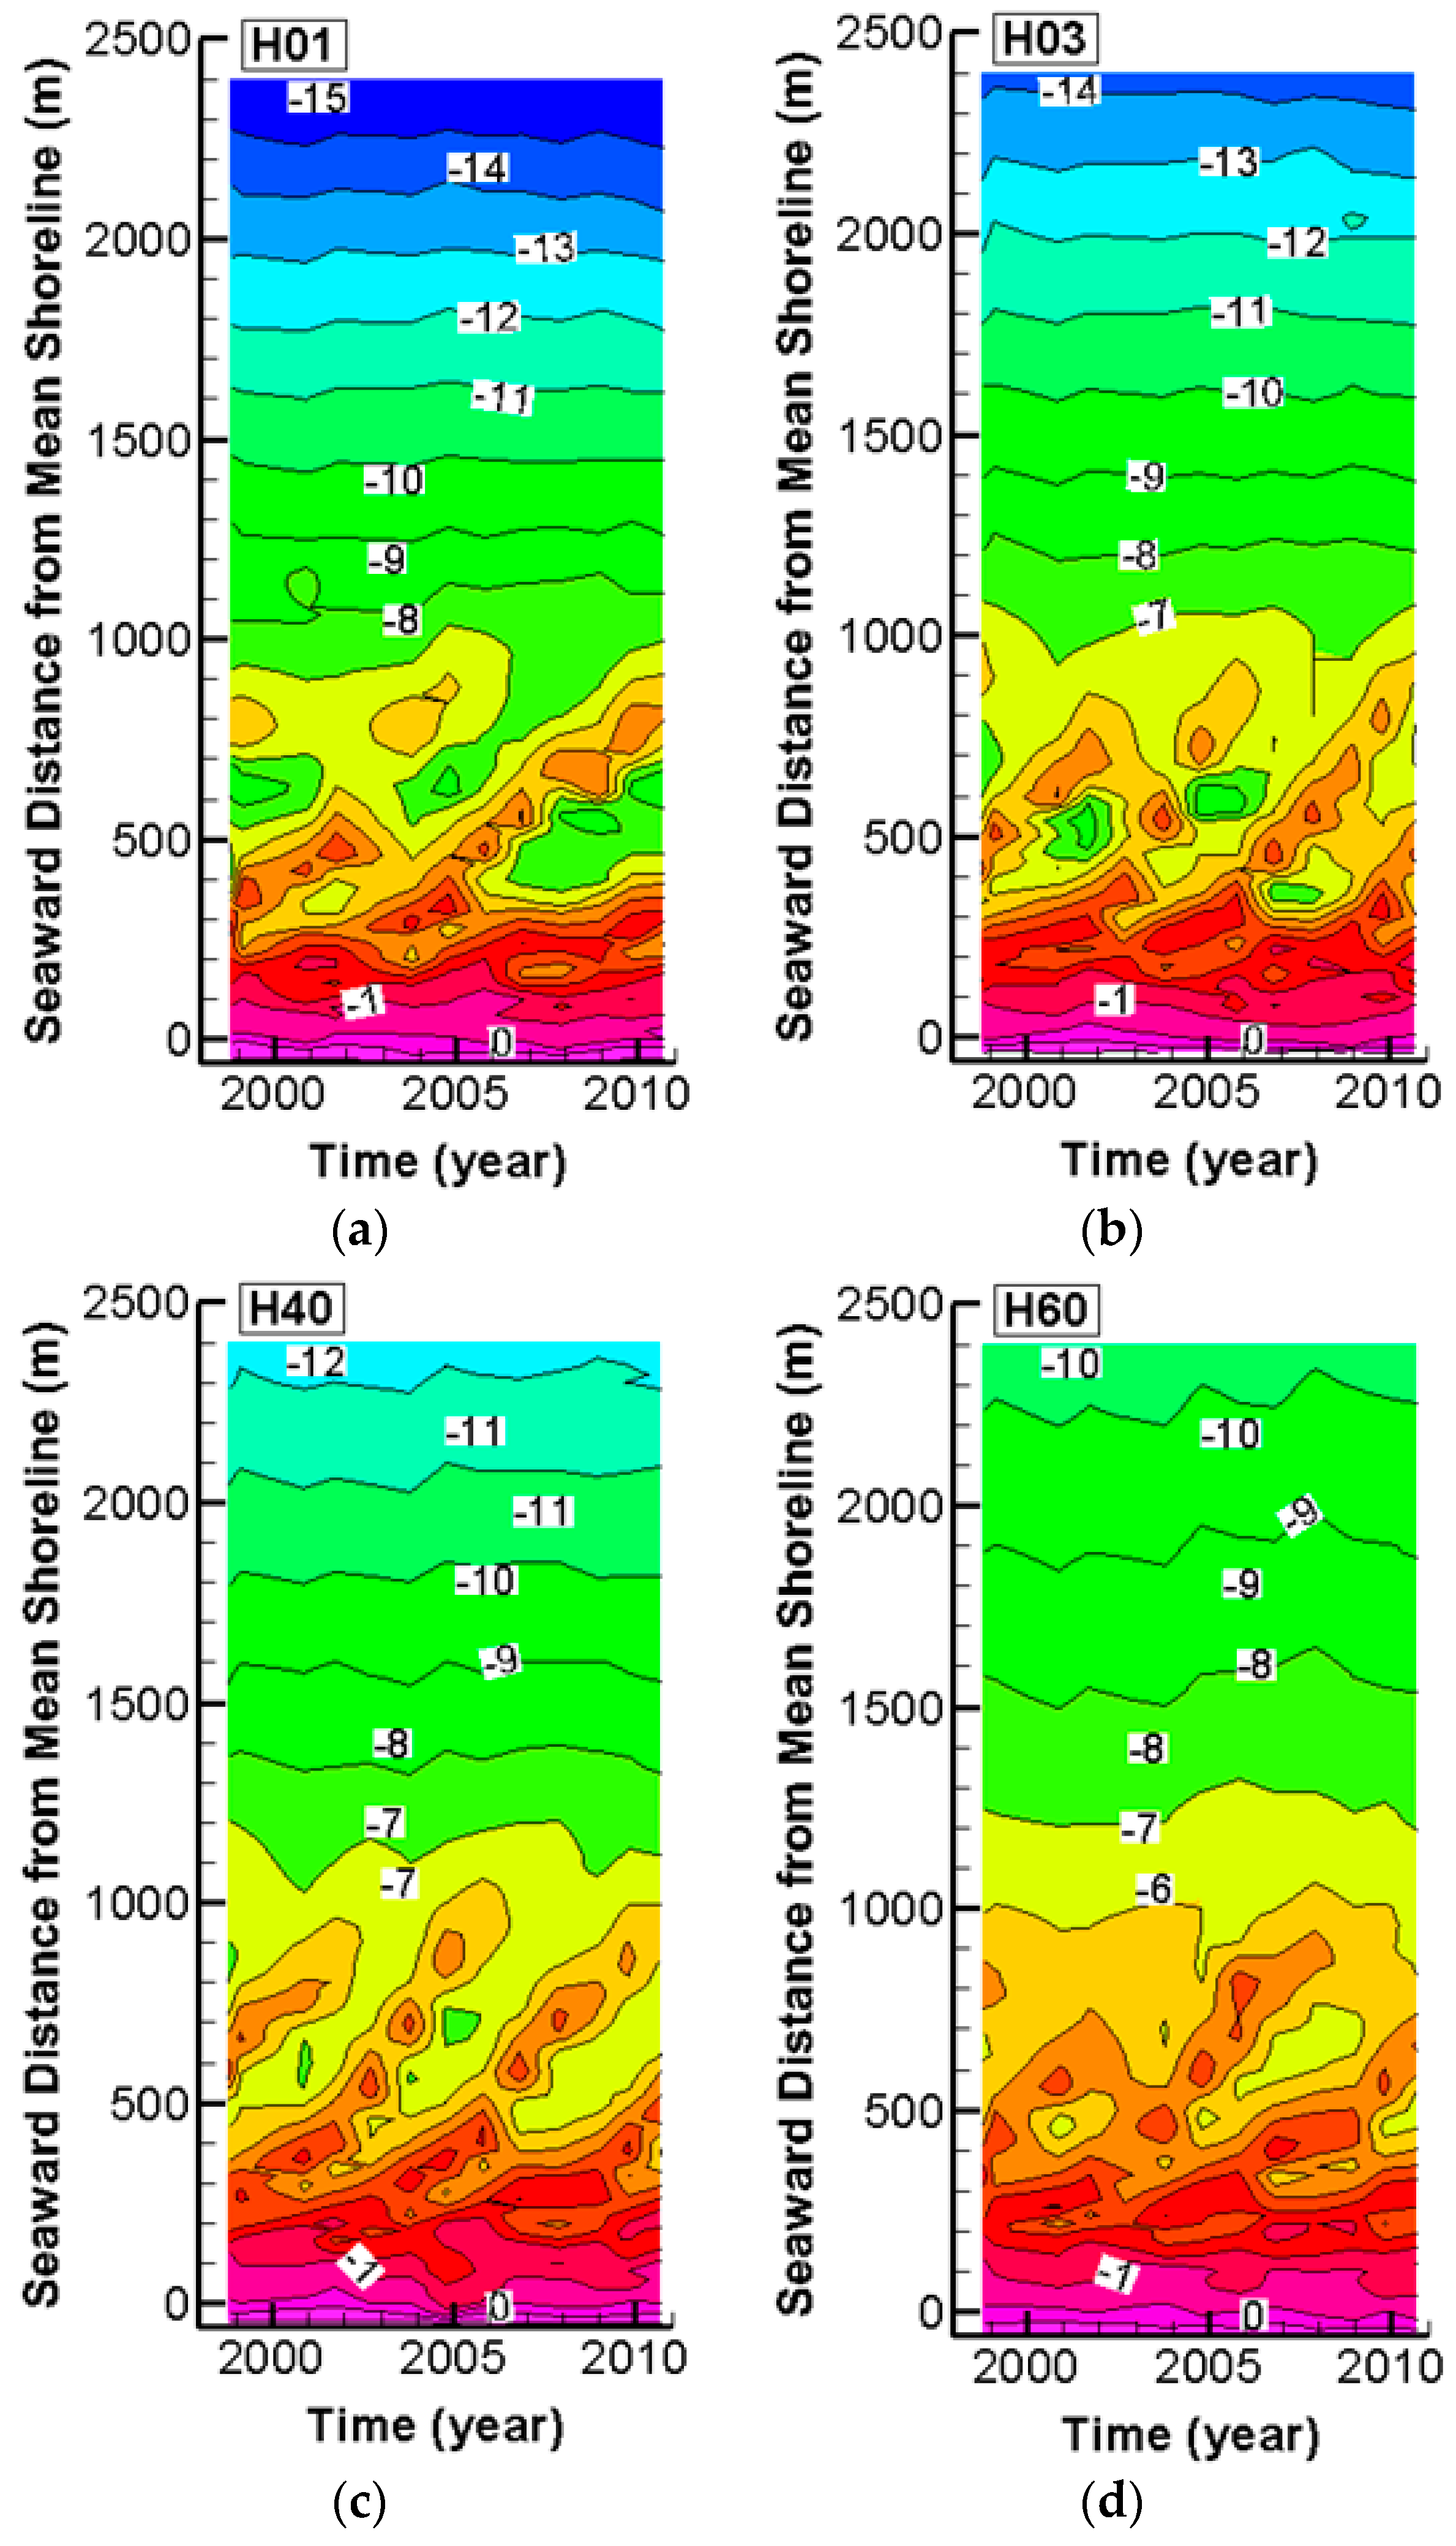
On the basis of the cross-shore survey record, the variation of shoreline location and sediment volume per unit width was computed for each line over the period 1998 to 2010. Although the shoreline analysis indicated a strong retreating trend in the range from 1.5 to 3.0 m/year, the results of volumetric change indicated quite different features; the change in sediment volume is generally small, and in fact, even a weakly increasing tendency was observed. This result implies that the trends in the variation of seabed-level change differ between nearshore and offshore regions. To clarify the difference related to the cross-shore locations, temporal variations of depth contour lines were examined for each line. As shown in Figure 9, the cross-shore seabed slope increases for lines that are located more to the south, which is consistent with the previous field observations [1,6]. This feature is more pronounced in areas where the water depth exceeds 7 m. On lines H40 and H60, located in the central and north parts of the study area, the depth contour lines offshore are slightly advanced with time, whereas the contour lines near the shoreline indicate a retreating trend. As a result, the slope of the seabed is tending to decrease. Because the data coverage of cross-shore survey data used in this study (approximately 10 years) is not sufficiently long and the magnitude of change is not very different from the order of sounding accuracy, further efforts are needed to continuously monitor bed-level changes and to clarify the possible cause of these peculiar changes.

4.2. Characteristics of Systematic Sandbar Migration

Large-scale multiple sandbars have evolved in the study area. In Figure 9, it is clearly seen that interannual movements of these bars are significant, and the migration of the bars has been repeated several times. 
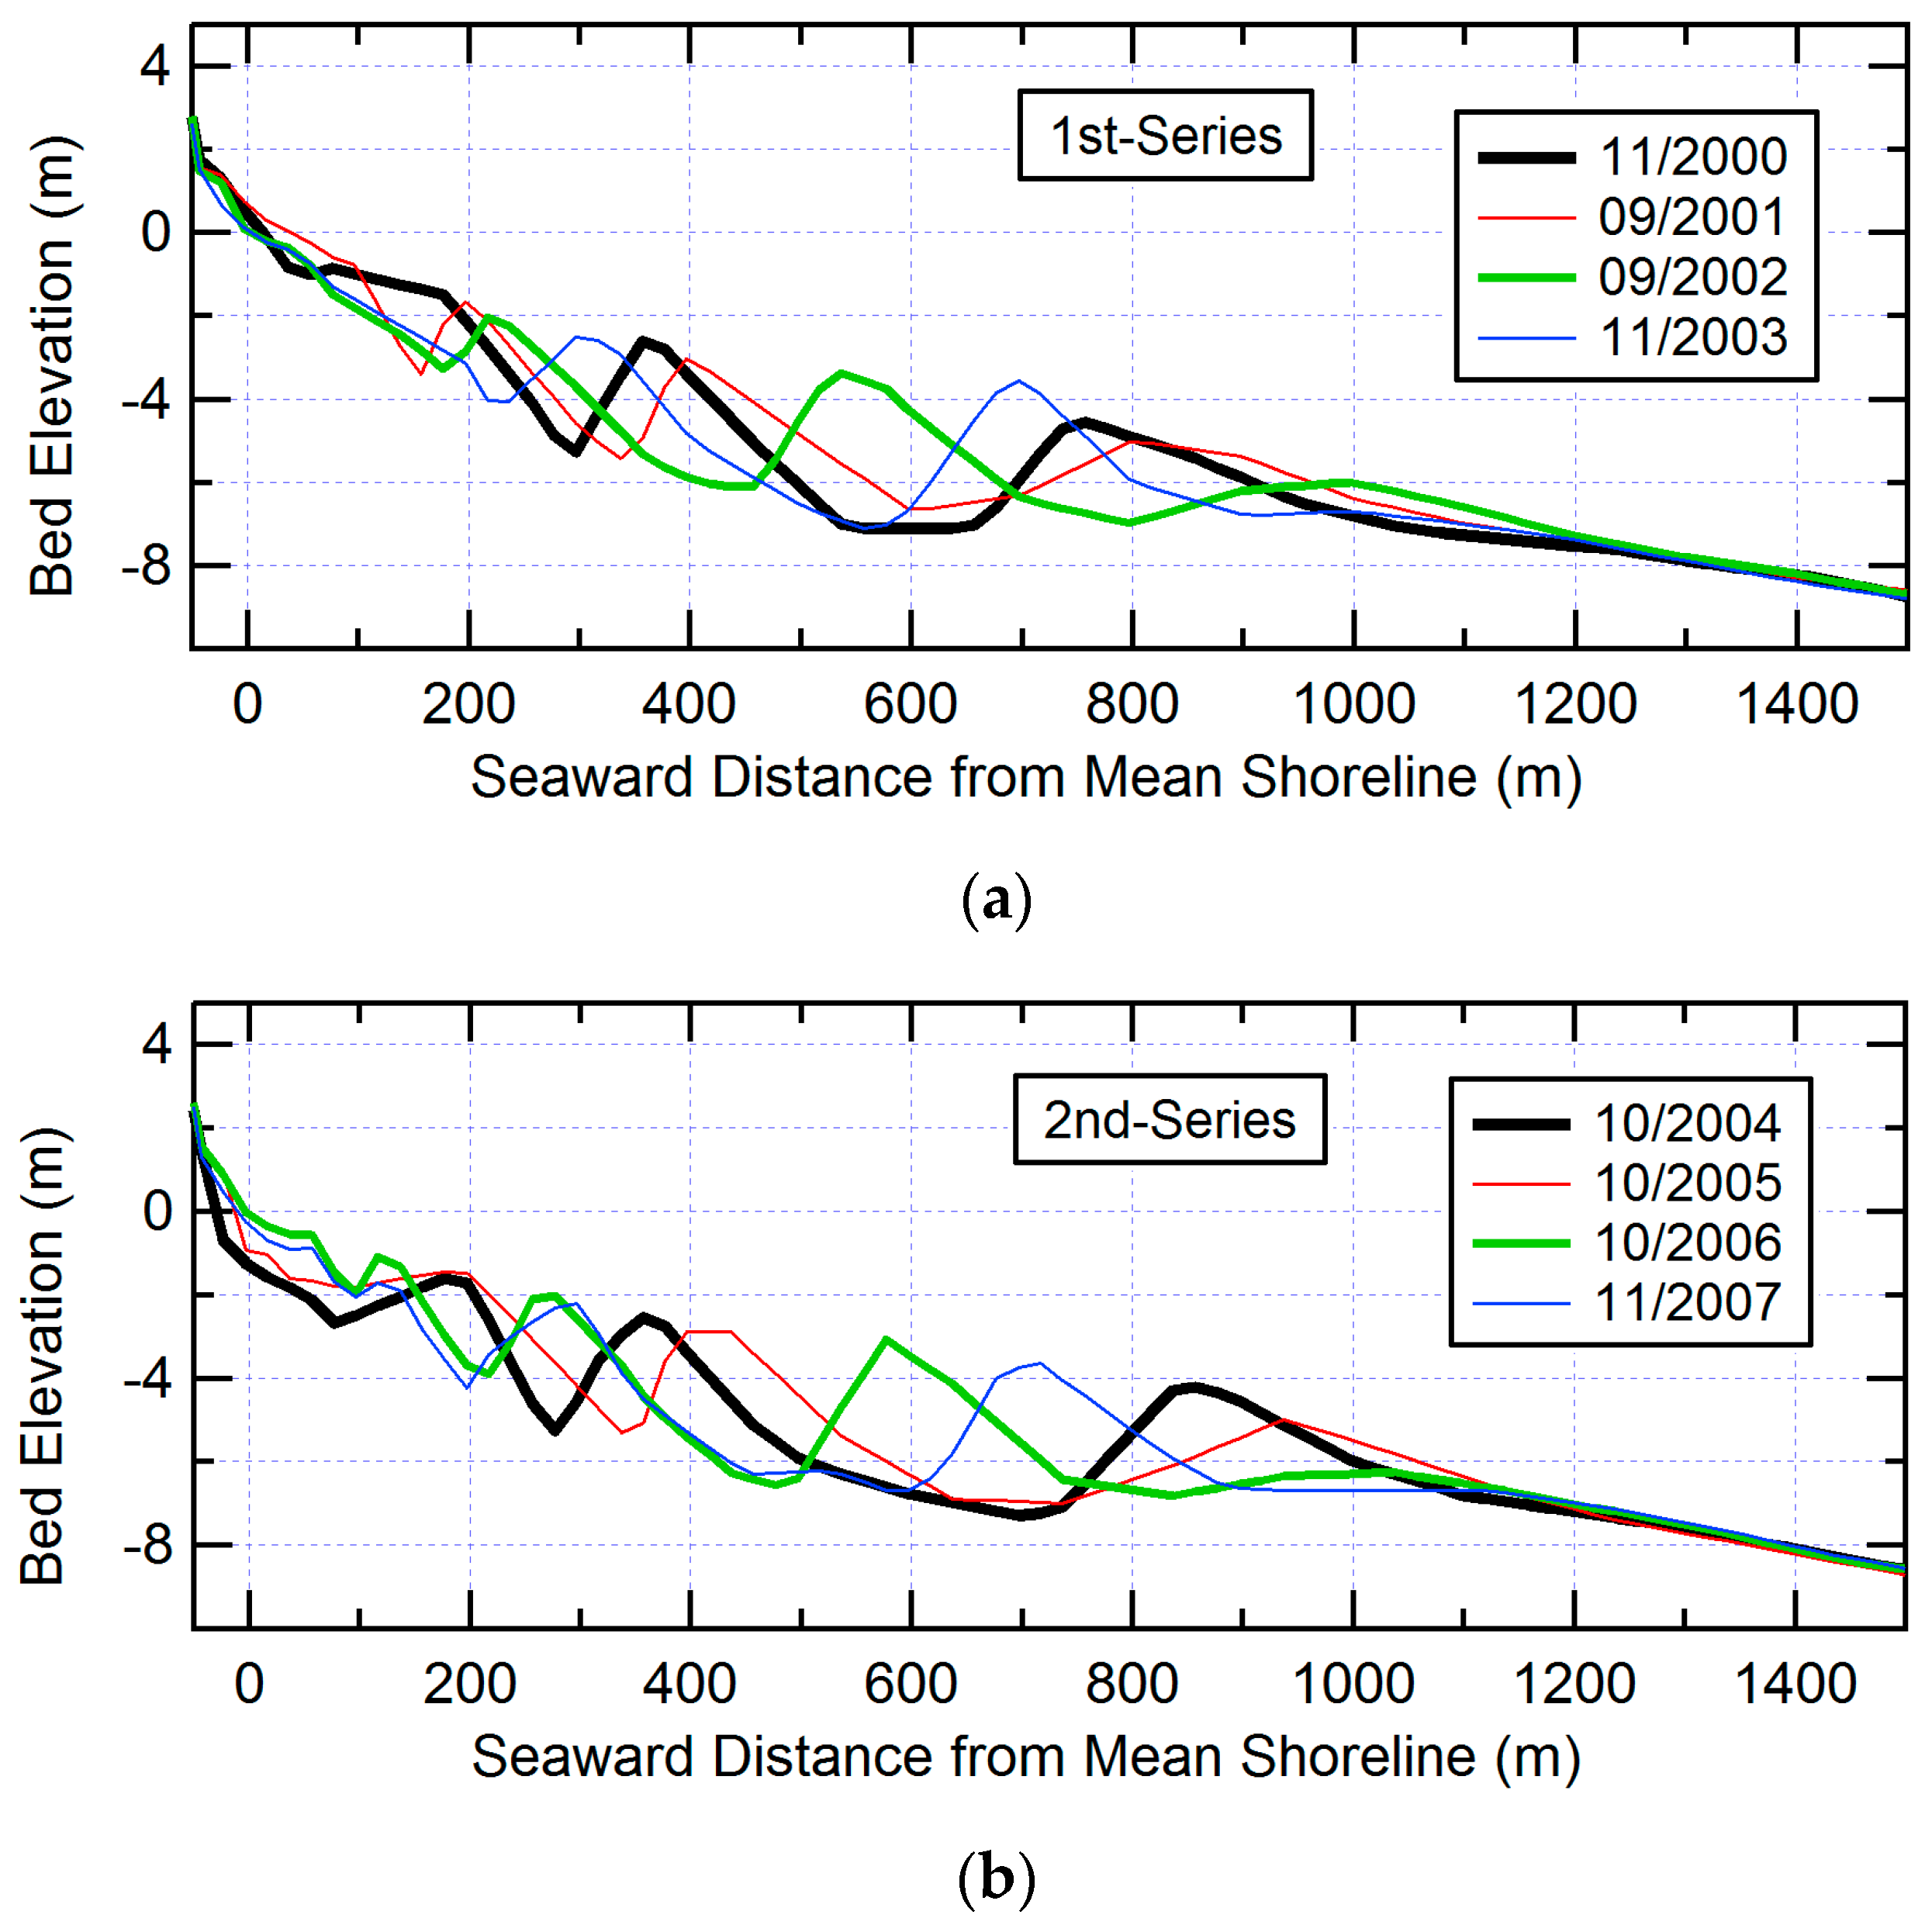
Figure 10 presents typical examples of observed interannual variations of cross-shore profiles on line H40 from November 2000 to November 2007. The bars migrate in a net offshore direction, and the transition of an individual bar consists of generation, seaward migration and decay. When the bar evolves most significantly, the bar height can reach 3 to 4 m. Similar types of temporal variation are observed on other lines. This kind of periodic movement of multiple sandbars is similar to the net offshore migration of bars reported at various locations around the world including the Netherlands [13,14,17], New Zealand [15,17] and Japan [16,17,18].
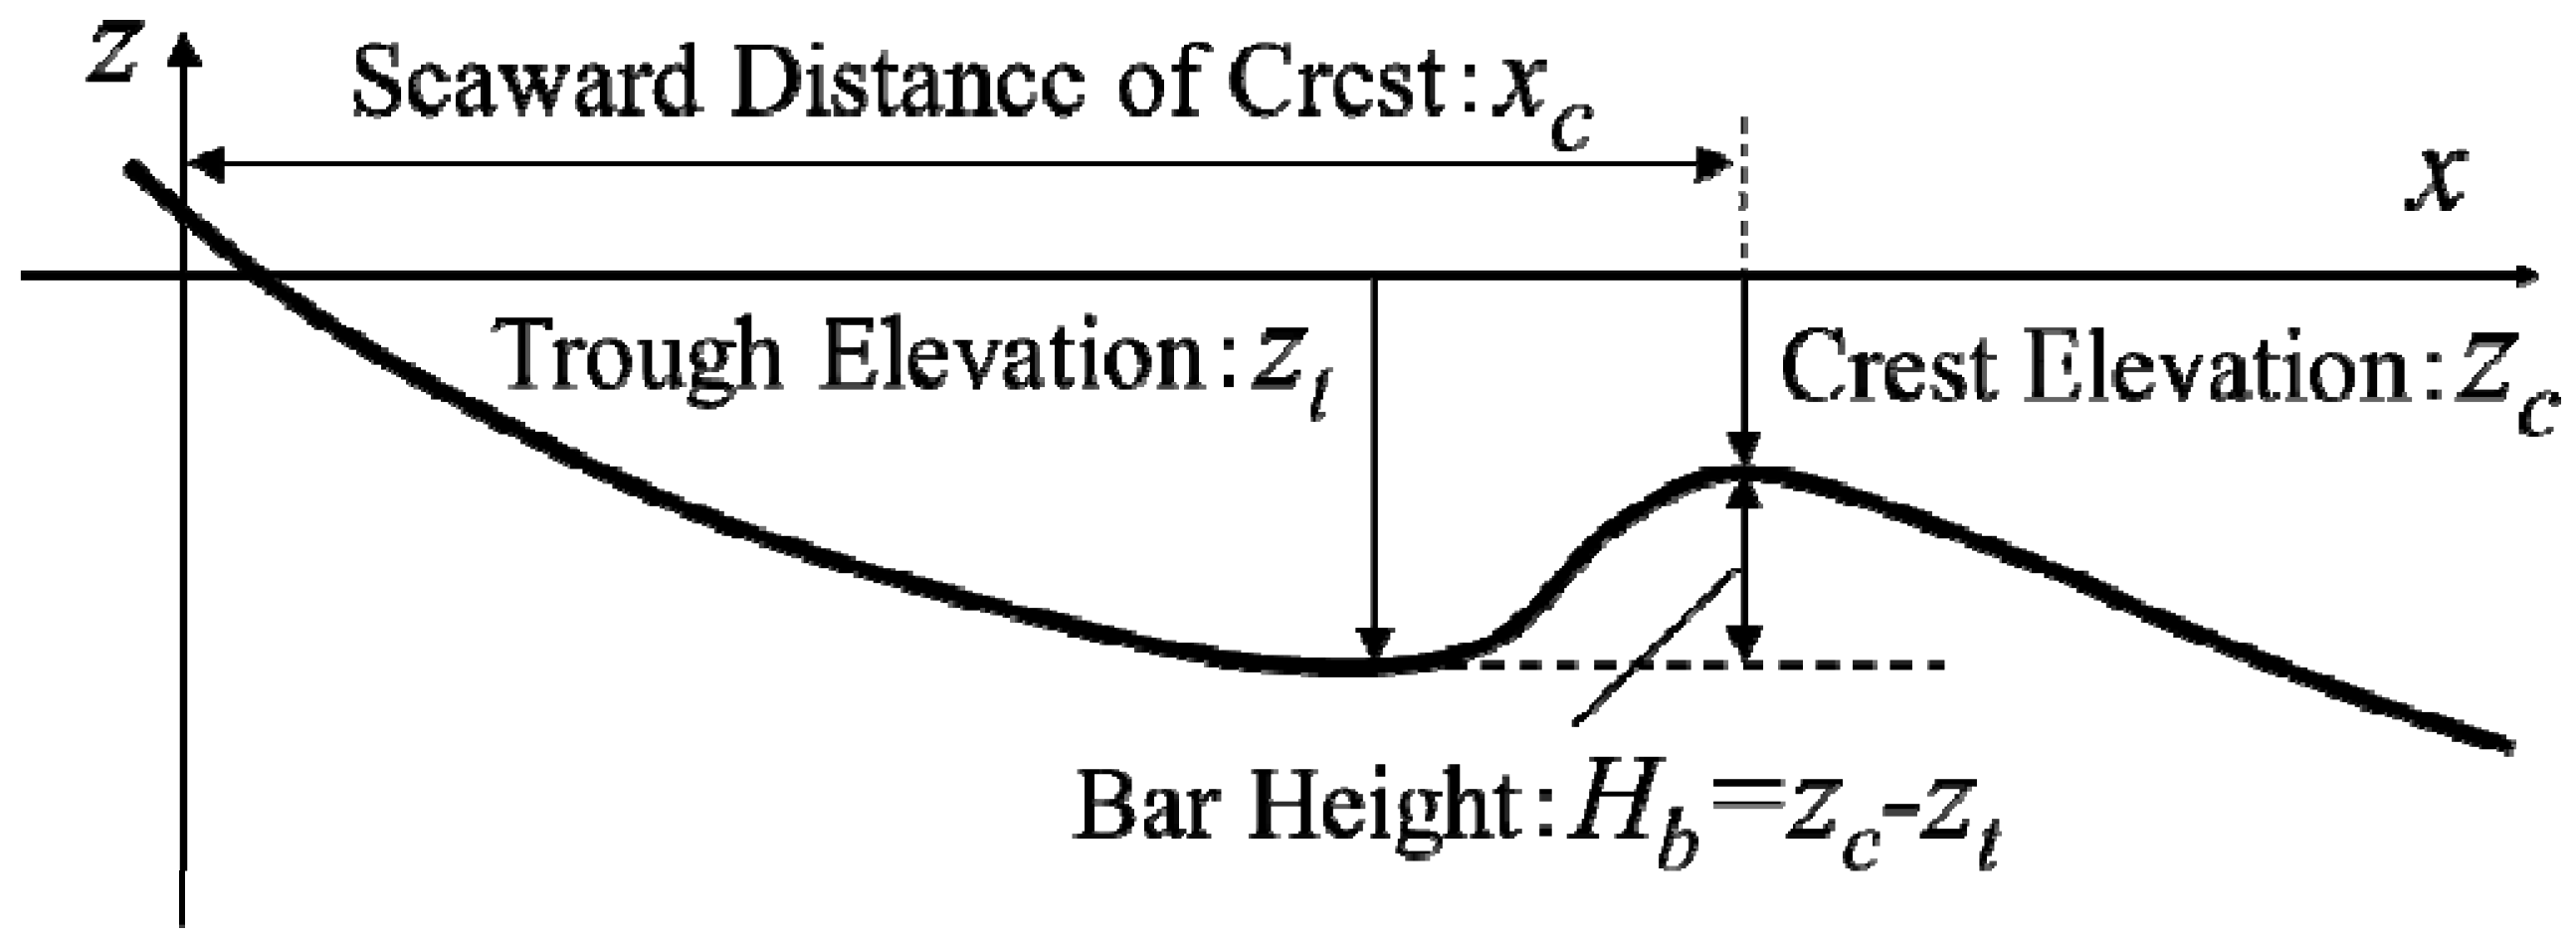
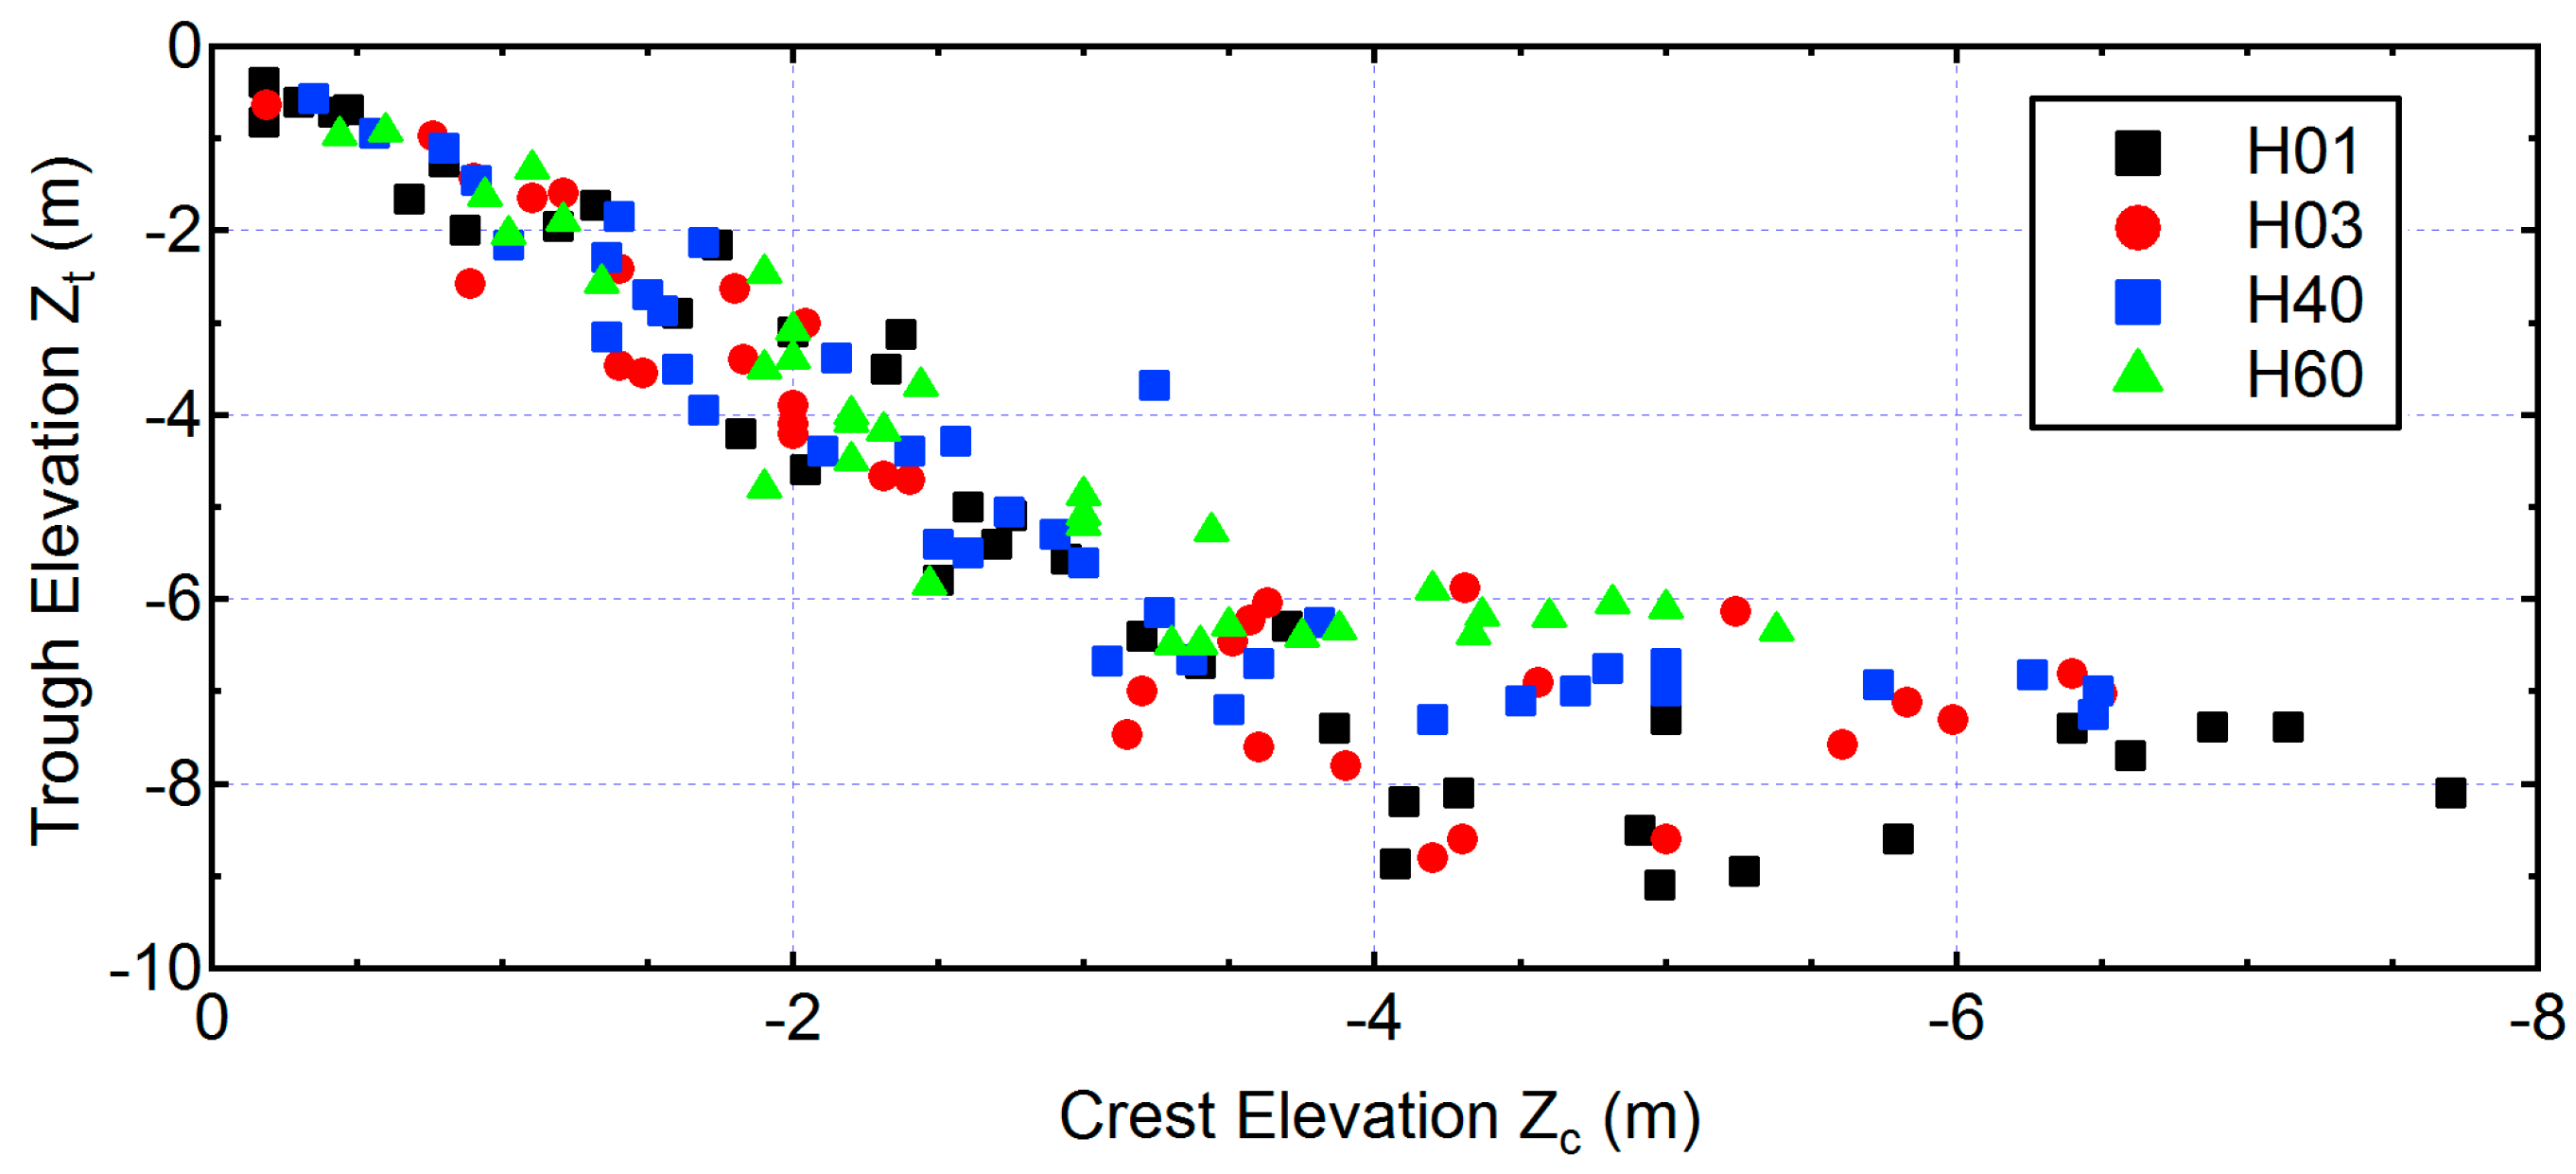
The relationship between the crest and trough elevations is plotted in Figure 11. During the evolution of the bar (roughly corresponding to a crest in elevation of Zc > −4 m), the water depth at the crest increases nearly proportionally to the depth at the trough. The slope of a linear regression line based on the least square method is in the range from 1.8 to 1.9. These values are slightly larger than those determined for the west coast of the United States (= 1.69) [26] and for various Japanese coasts (= 1.47) [5]. In the area where 
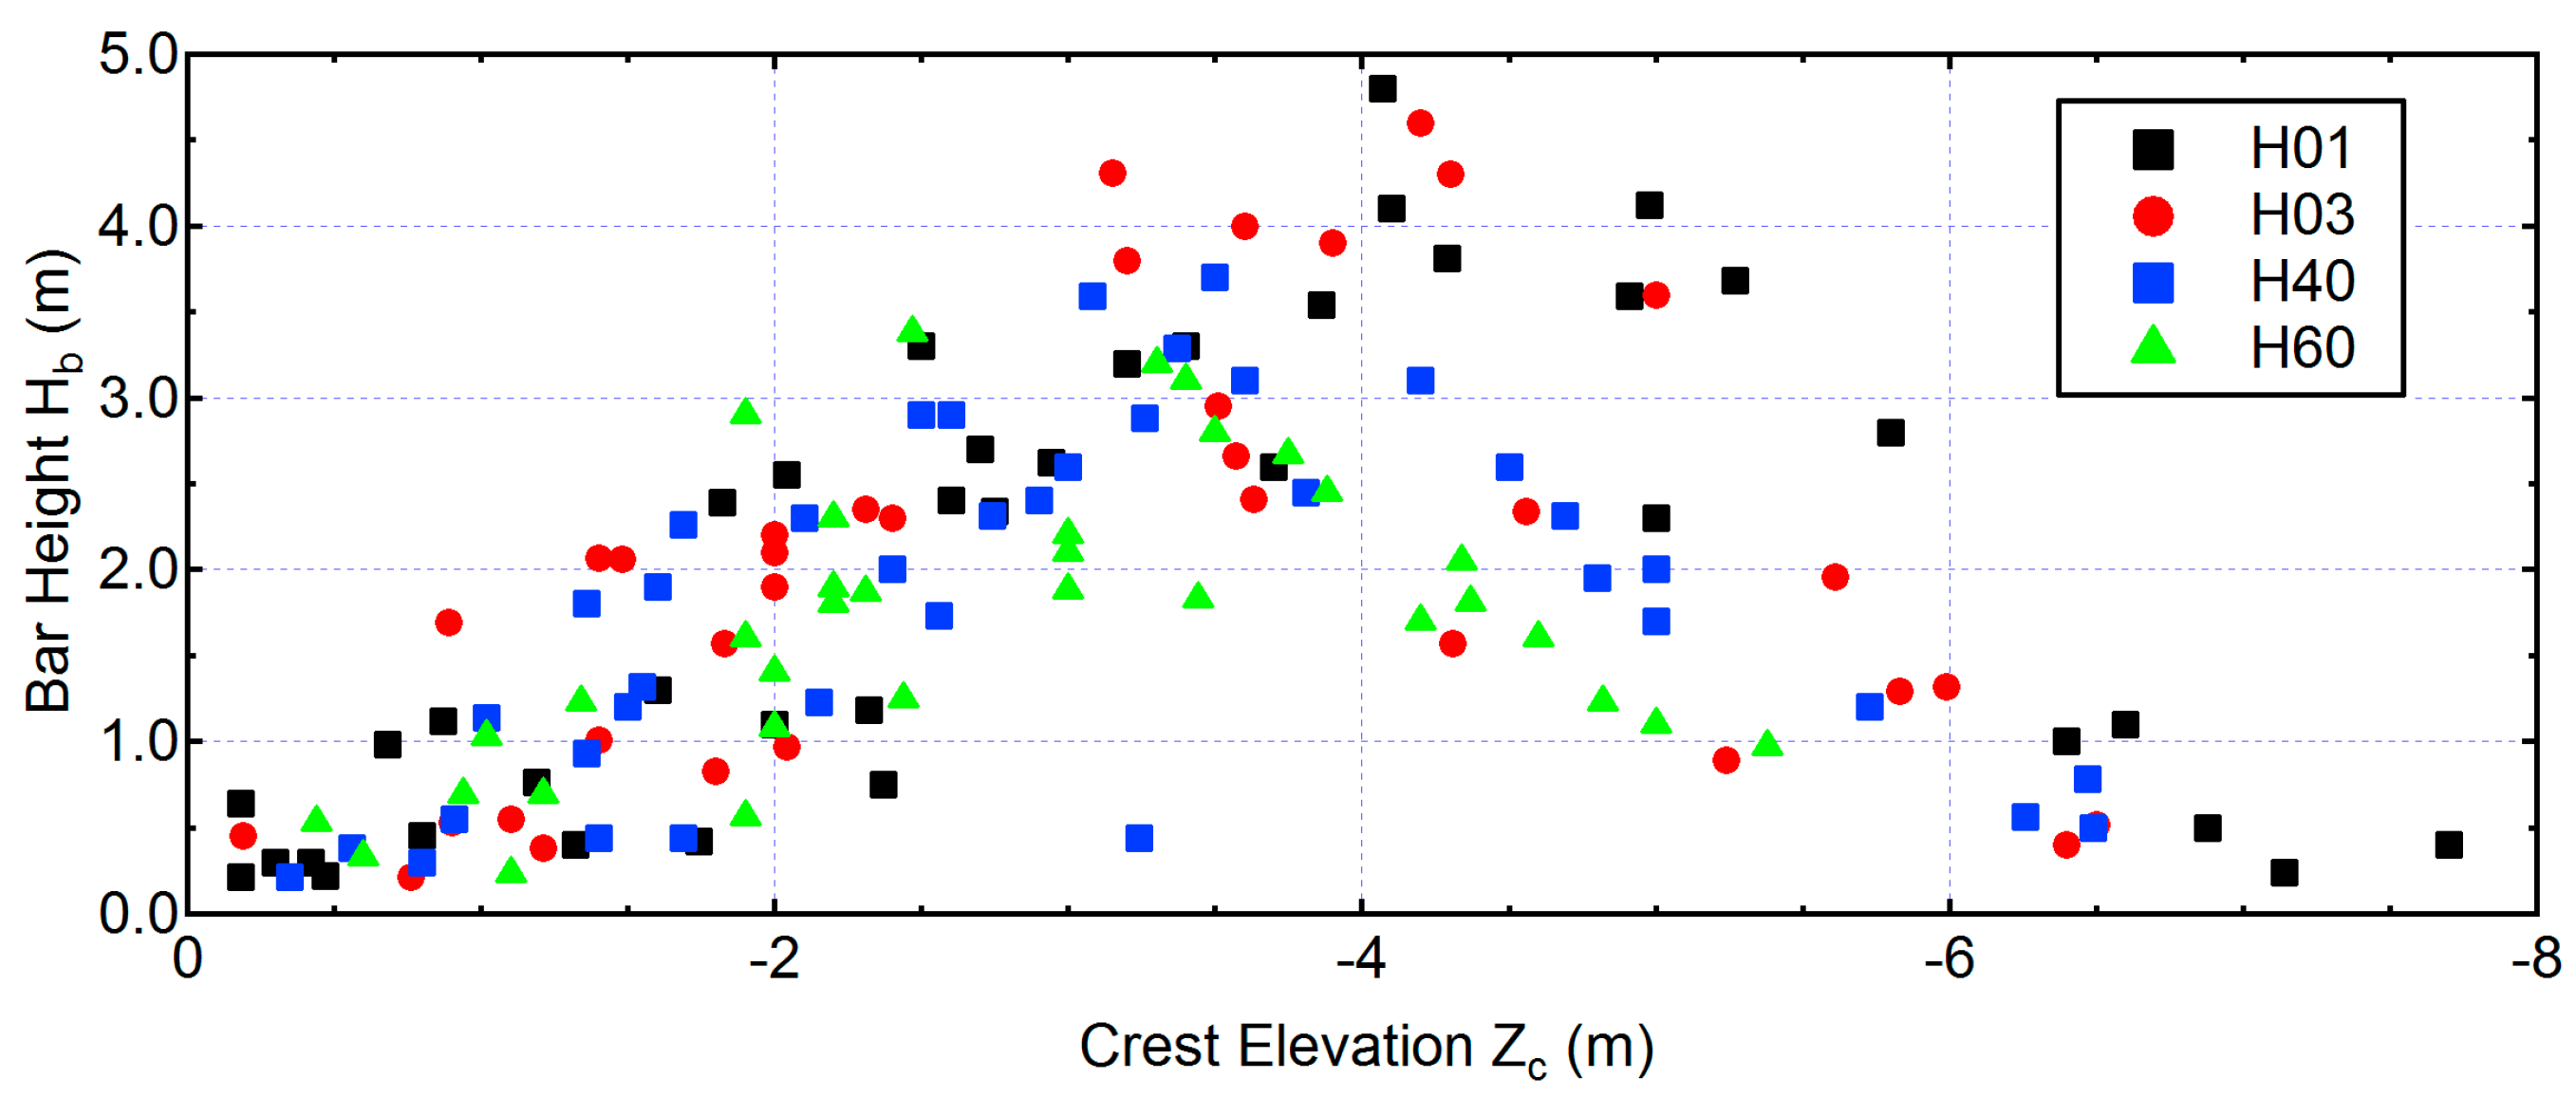
Zc < −4 m, the trough elevation slightly increases with an increase of crest depth on the southern lines (H01 and H03), whereas on the northern lines (H40 and H60), a nearly constant value is taken around the closure depth. As a result, the bar height initially increases with depth at the crest (i.e., seaward distance) as shown in Figure 12. It reaches its maximal value around Zc = −4.2 m. The maximum bar height observed is as large as 4.8 m. Further offshore, the bar height decays progressively. This is consistent with a previous report for various Japanese coasts [5]. The temporal variation of the crest location and bar height is shown in 
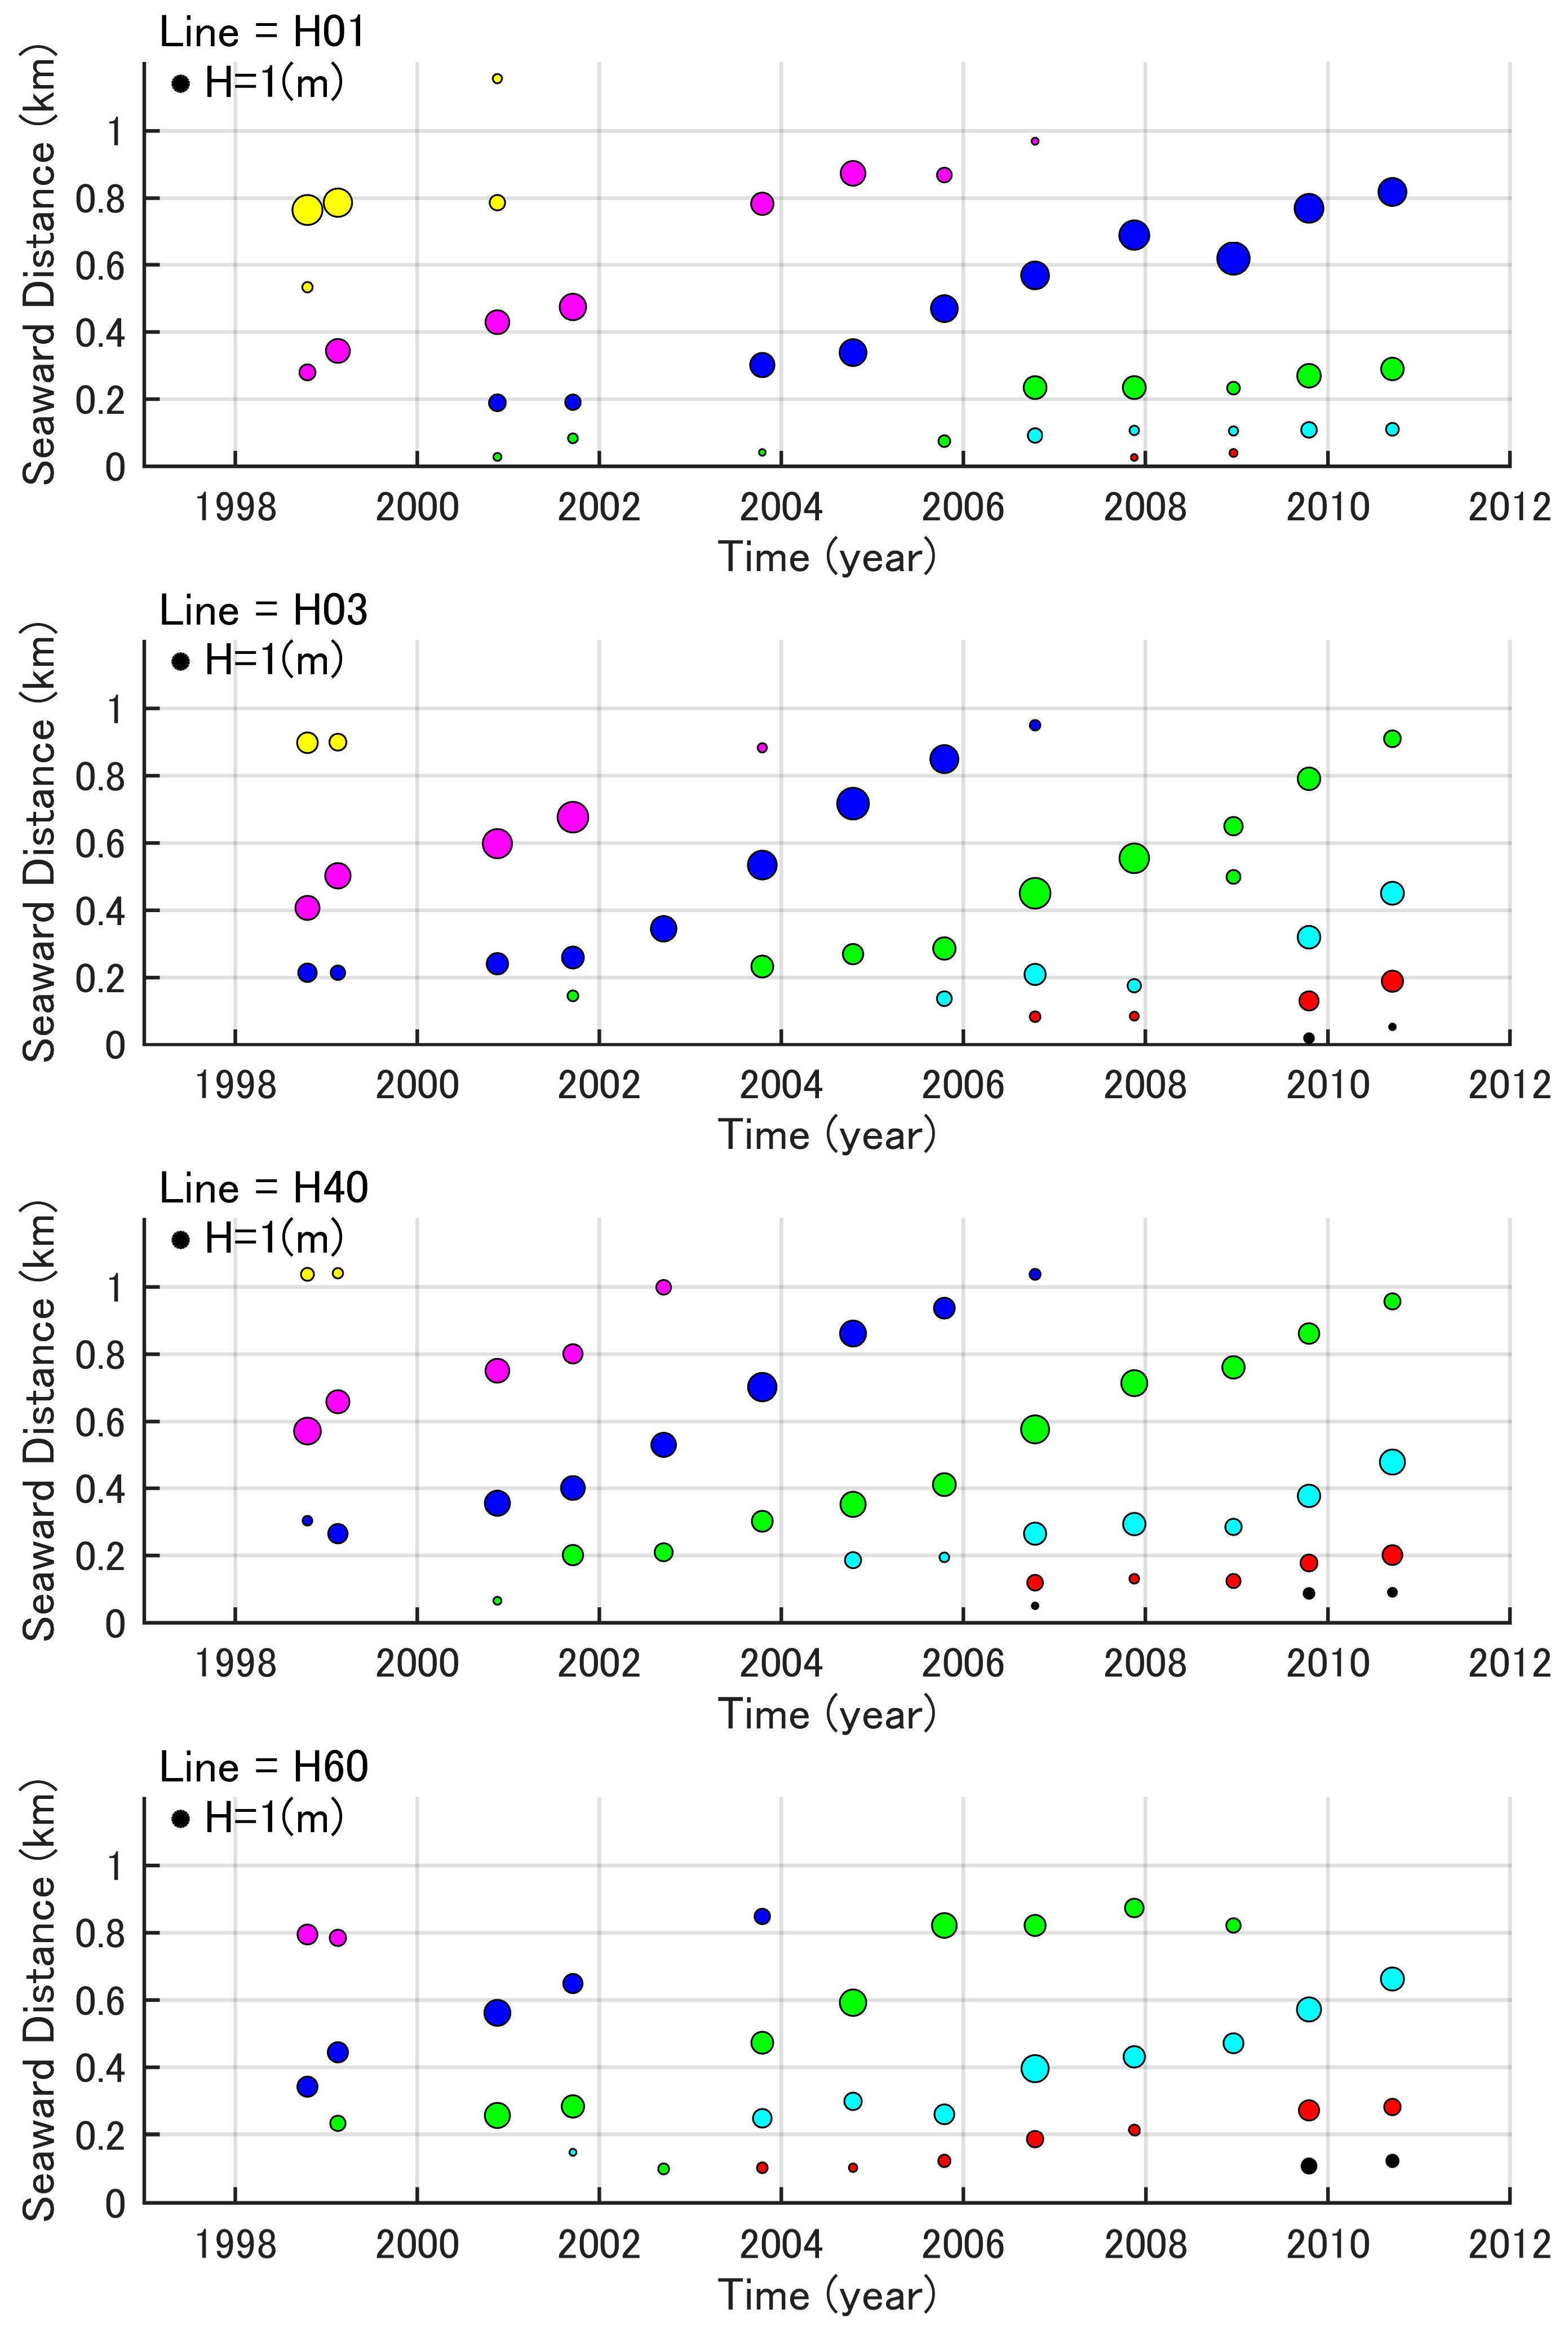
Figure 13 for each line. In this figure, the centers of the circles indicate the locations of bar crests, and the areas of the circles are proportional to the bar heights. These figures clearly indicate that the bars have repeated systematic interannual migrations on all of the lines. The periodic cycles consist of generation, seaward migration and offshore decay. Bars were first generated at a distance of 100 to 200 m from the shore and then migrated seaward. The bar height increased with cross-shore distance until it reached 400 to 700 m. When the offshore bar evolved most significantly, the height became as large as 3 to 4 m. Then, the bar migrated further seaward and diminished at an offshore distance of around 1000 m. After the outermost bar diminished, the next bar replaced the former one. The velocity of offshore migrations was approximately 100 m/year within 400 m of the coast. In the area lying approximately 400 to 800 m from the shore, it was accelerated to 150 to 200 m/year. Further offshore, the migration velocity was not more than 100 m/year. The life span of an individual bar from generation to offshore decay is approximately eight years. The return period, which is defined as the interval between each cycle, is estimated to be three to four years. During the study period, three or four cycles of periodic movement were recognized.
An alongshore comparison of bar migration was conducted next to examine the plan-view shape and migration characteristics of the bar system. 
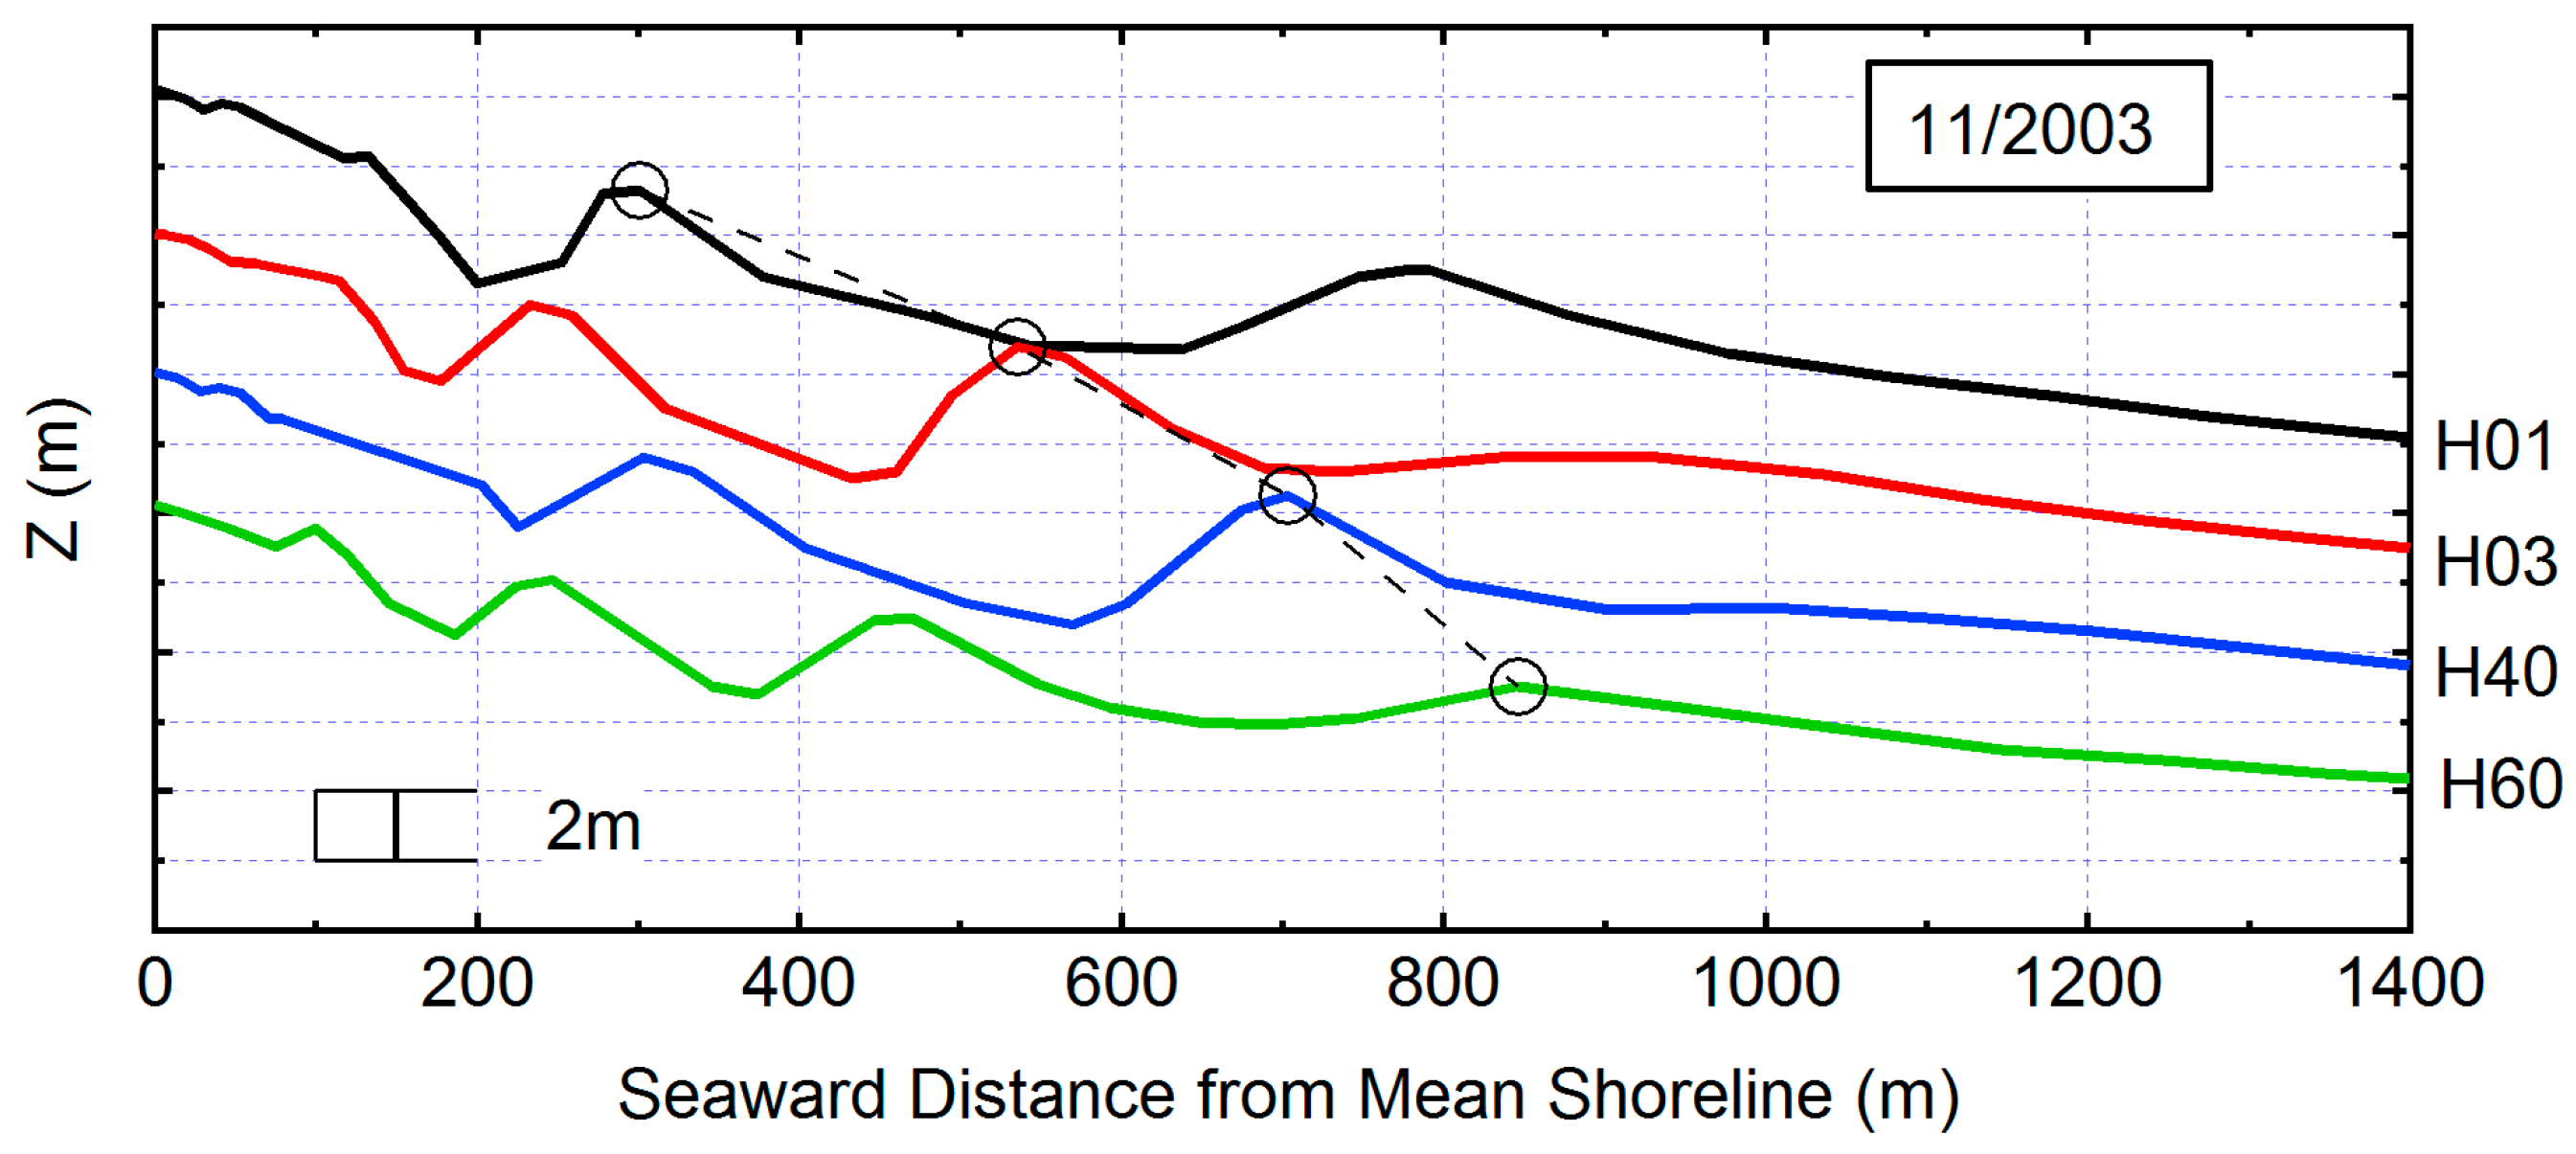
Figure 14 displays examples of the comparisons of cross-shore profiles on the survey lines observed during 2003. In the figure, triple- or four-barred profiles are observed on each transect. From the observation of aerial photographs, the individual bars are generally considered to be continuous in the alongshore direction. To facilitate the example of an alongshore continuous bar configuration, estimated crest lines are plotted by a broken line and open circles in Figure 14. The seaward distance of the bar crests from the shoreline decreases as the location of the line moves southward (i.e., the seabed slope becomes larger). As a result, the plan shape of an individual bar is slightly curved with respect to the shoreline. In Figure 14, the alongshore variability can be clearly seen. For example, the outermost bar on line H01 is substantially decayed on line H03. Further north on lines H40 and H60, the bar is considered to have disappeared already. On the contrary, the third bar (from the offshore) on line H60 has not evolved yet on H40, H03 and H01. The interannual movements of the longshore bar, which corresponds to the crest line in Figure 14, were tracked and compared on the four lines. The comparison shows that the seaward migration of the bar progressed from north (H60) to south (H01). In summary, the longshore bar is slightly closer to the shoreline as the alongshore location moves southward. The individual bar migrates net seaward, keeping the slightly curved plan shape with respect to the shoreline, and finally decays from the north to the south.
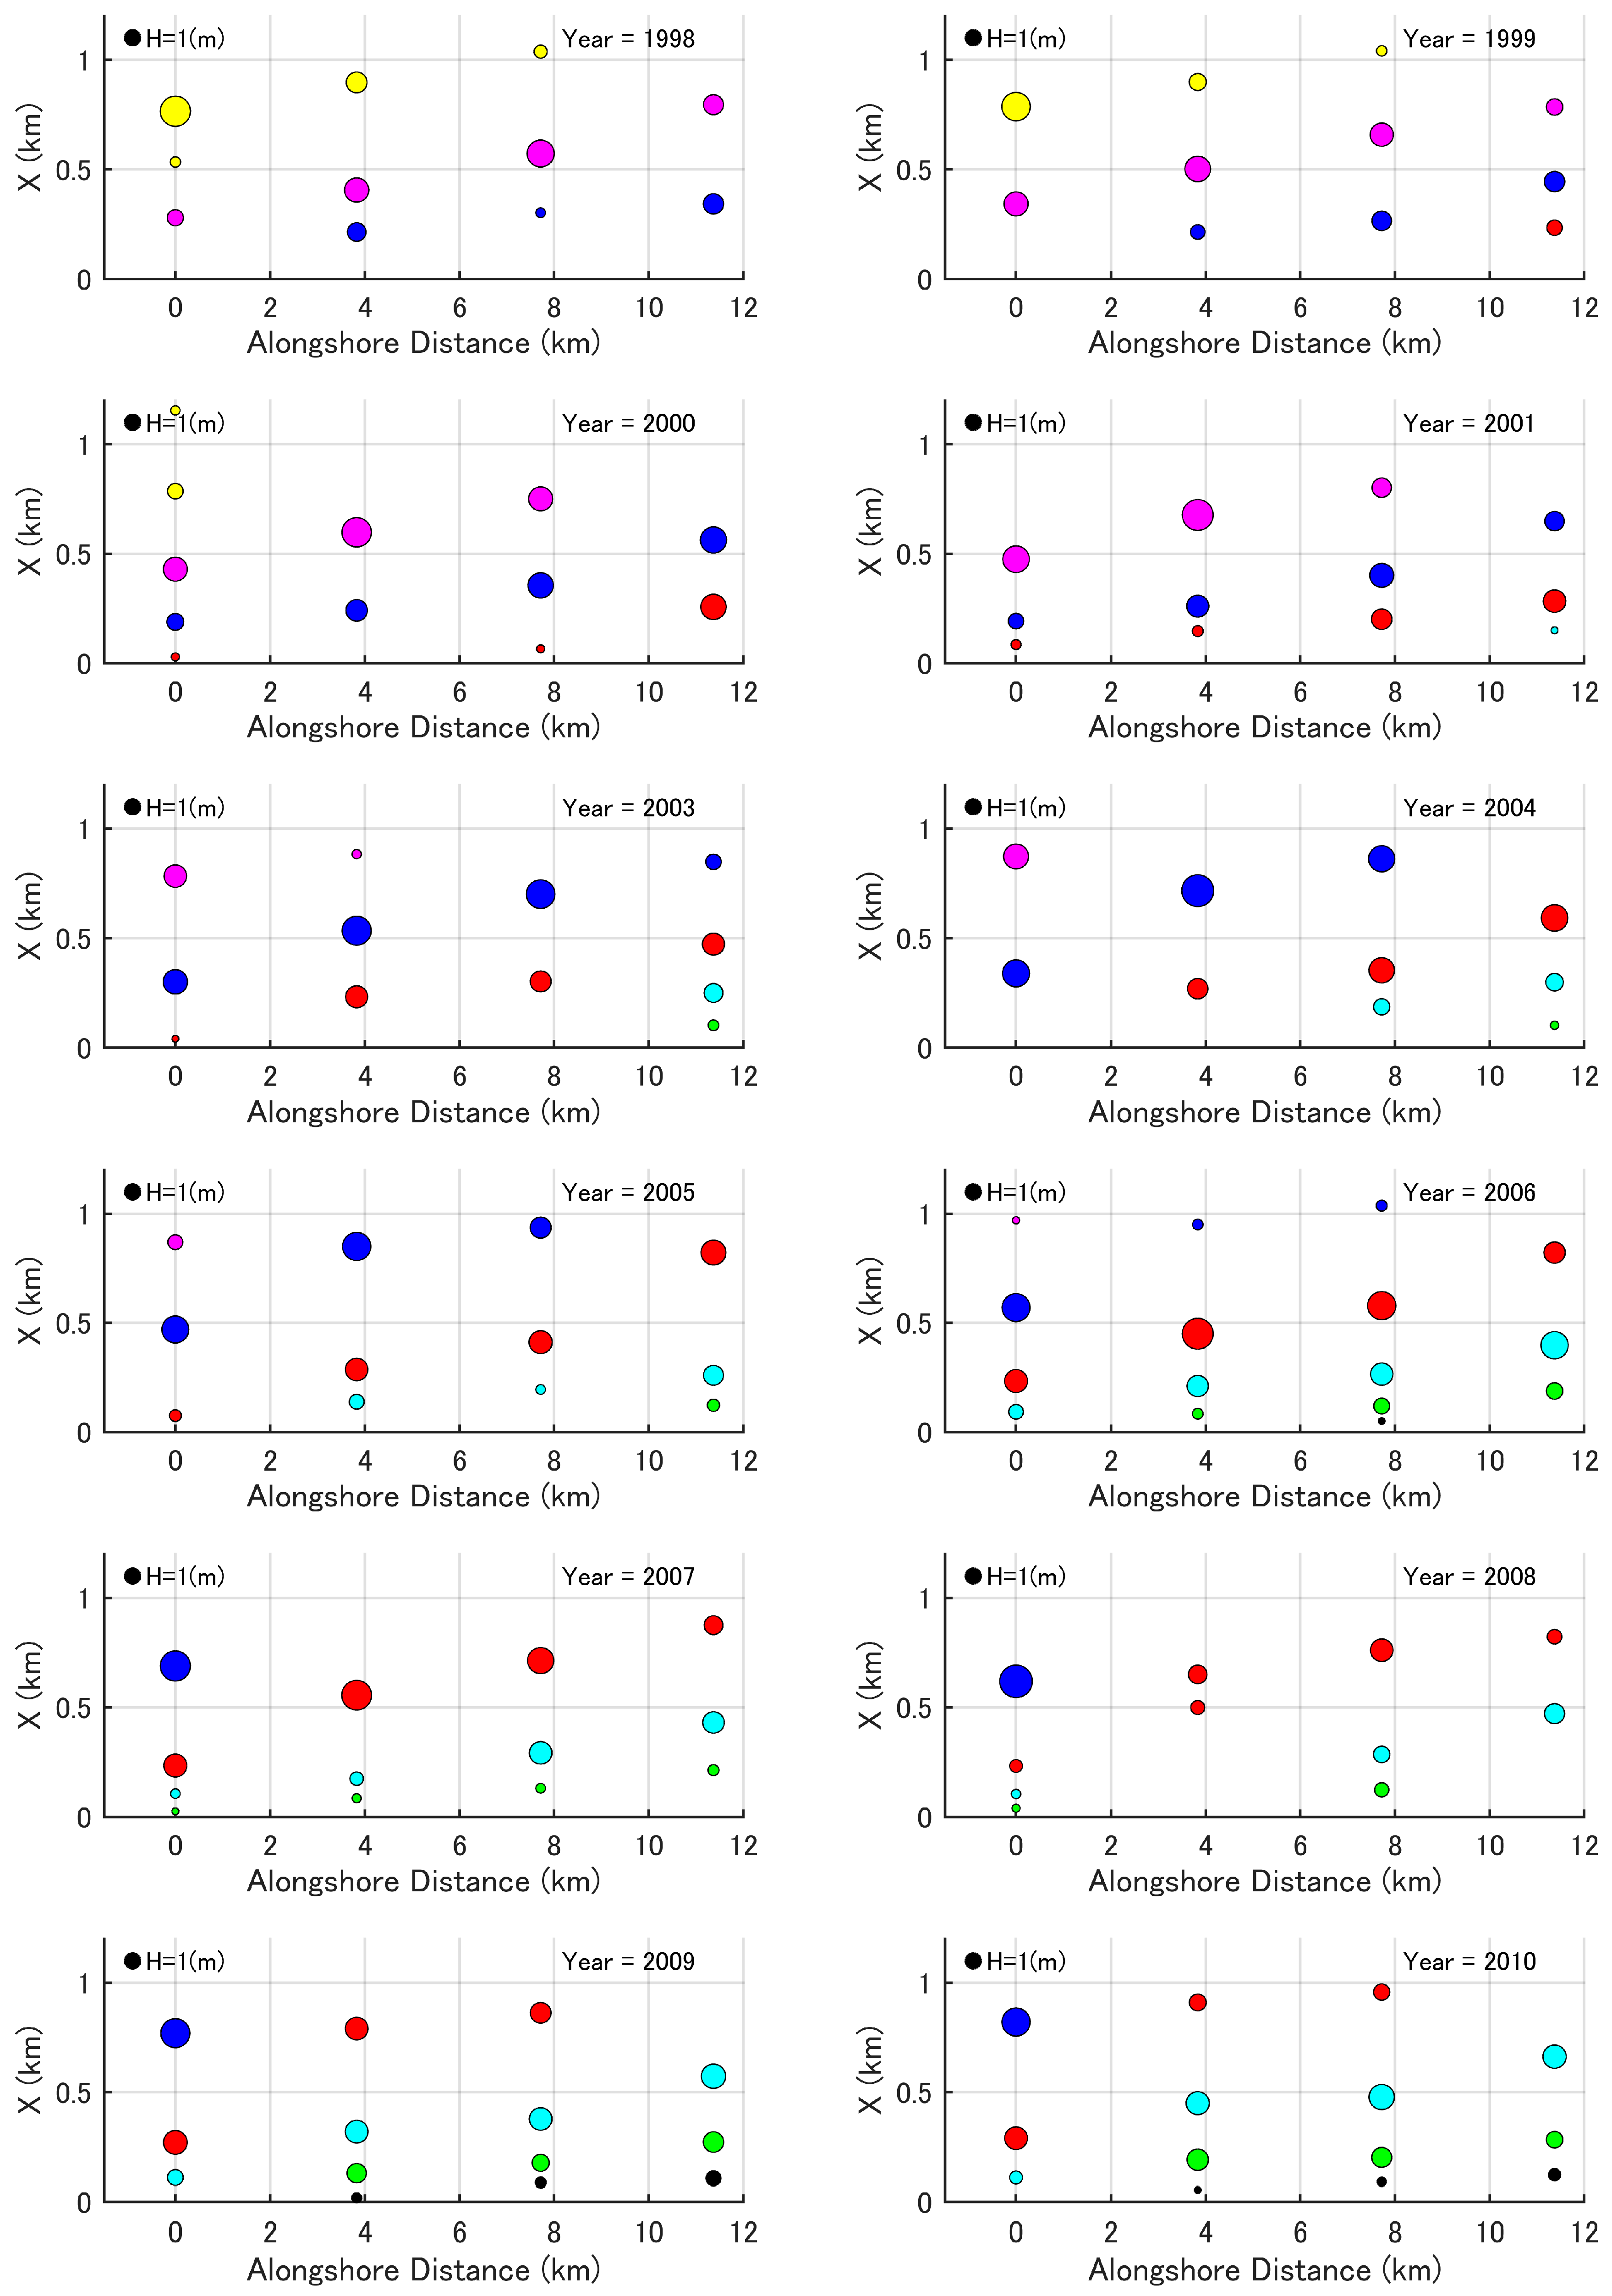
The cyclic movements of the crest lines are plotted in Figure 15. The centers of the circles indicate the bar crest, and the areas of the circle are proportional to the bar height. To distinguish a series of periodic sequences of generation, migration and decay, crest markers that are considered to belong to the same generation of bar (i.e., generated in nearly the same period) are indicated by the same color in the figure. For 1998, the bar indicated in yellow evolved as the outermost bar. Behind it, the next (purple) and the third (blue) bars also evolved. As time goes on, the outermost bar (yellow) migrates seaward and finally disappears from the north to the south. The cyclic movement indicates common features among the four lines. After one cycle, a configuration similar to that of 1998 reappeared in 2001. Another cycle was observed during 2001 and 2005, when the transition seems quite similar to the previous one. The bar behavior in the third cycle is different in some ways to the first and second cycles. Around 2007, the outermost bar (blue) disappeared in most of the area, and then, the next bar (red) started accelerating seaward migration. The migration is significant on the three lines H03, H40 and H60. In contrast, the old outermost bar (blue) remains on H01, and therefore the movement of the next generation of the bar (red) on H01 is much smaller. It is deduced that such an alongshore difference in bar migration resulted in the disconnection of the longshore bar between H01 and H03. From 2008 to 2009, the new bar (red) was considered to have realigned with the old bar (blue). It is assumed that the bars located more landward (light blue and red) have also realigned at the same time. The disconnection and realignment of a bar system has been reported at several NOM sites as ‘bar switching’ (e.g., [15]).

4.3. Principal Modes of Sandbar Migration

Next, EOF analysis was applied to cross-shore profiles on the four lines. The first empirical eigenfunctions explain over 99% of the total variation. The second and third eigenfunctions explain 70% to 80% of the remaining depth variation. The variance explained by higher modes is much smaller. Therefore, the focus is mainly placed on the top three modes of variation. Furthermore, variation of cross-shore profiles appears most clearly in the EOF results up to X = 1300 m, so even though the cross-shore range of EOF analysis extends to X = 2400 m, plots are limited to the shorter distance.
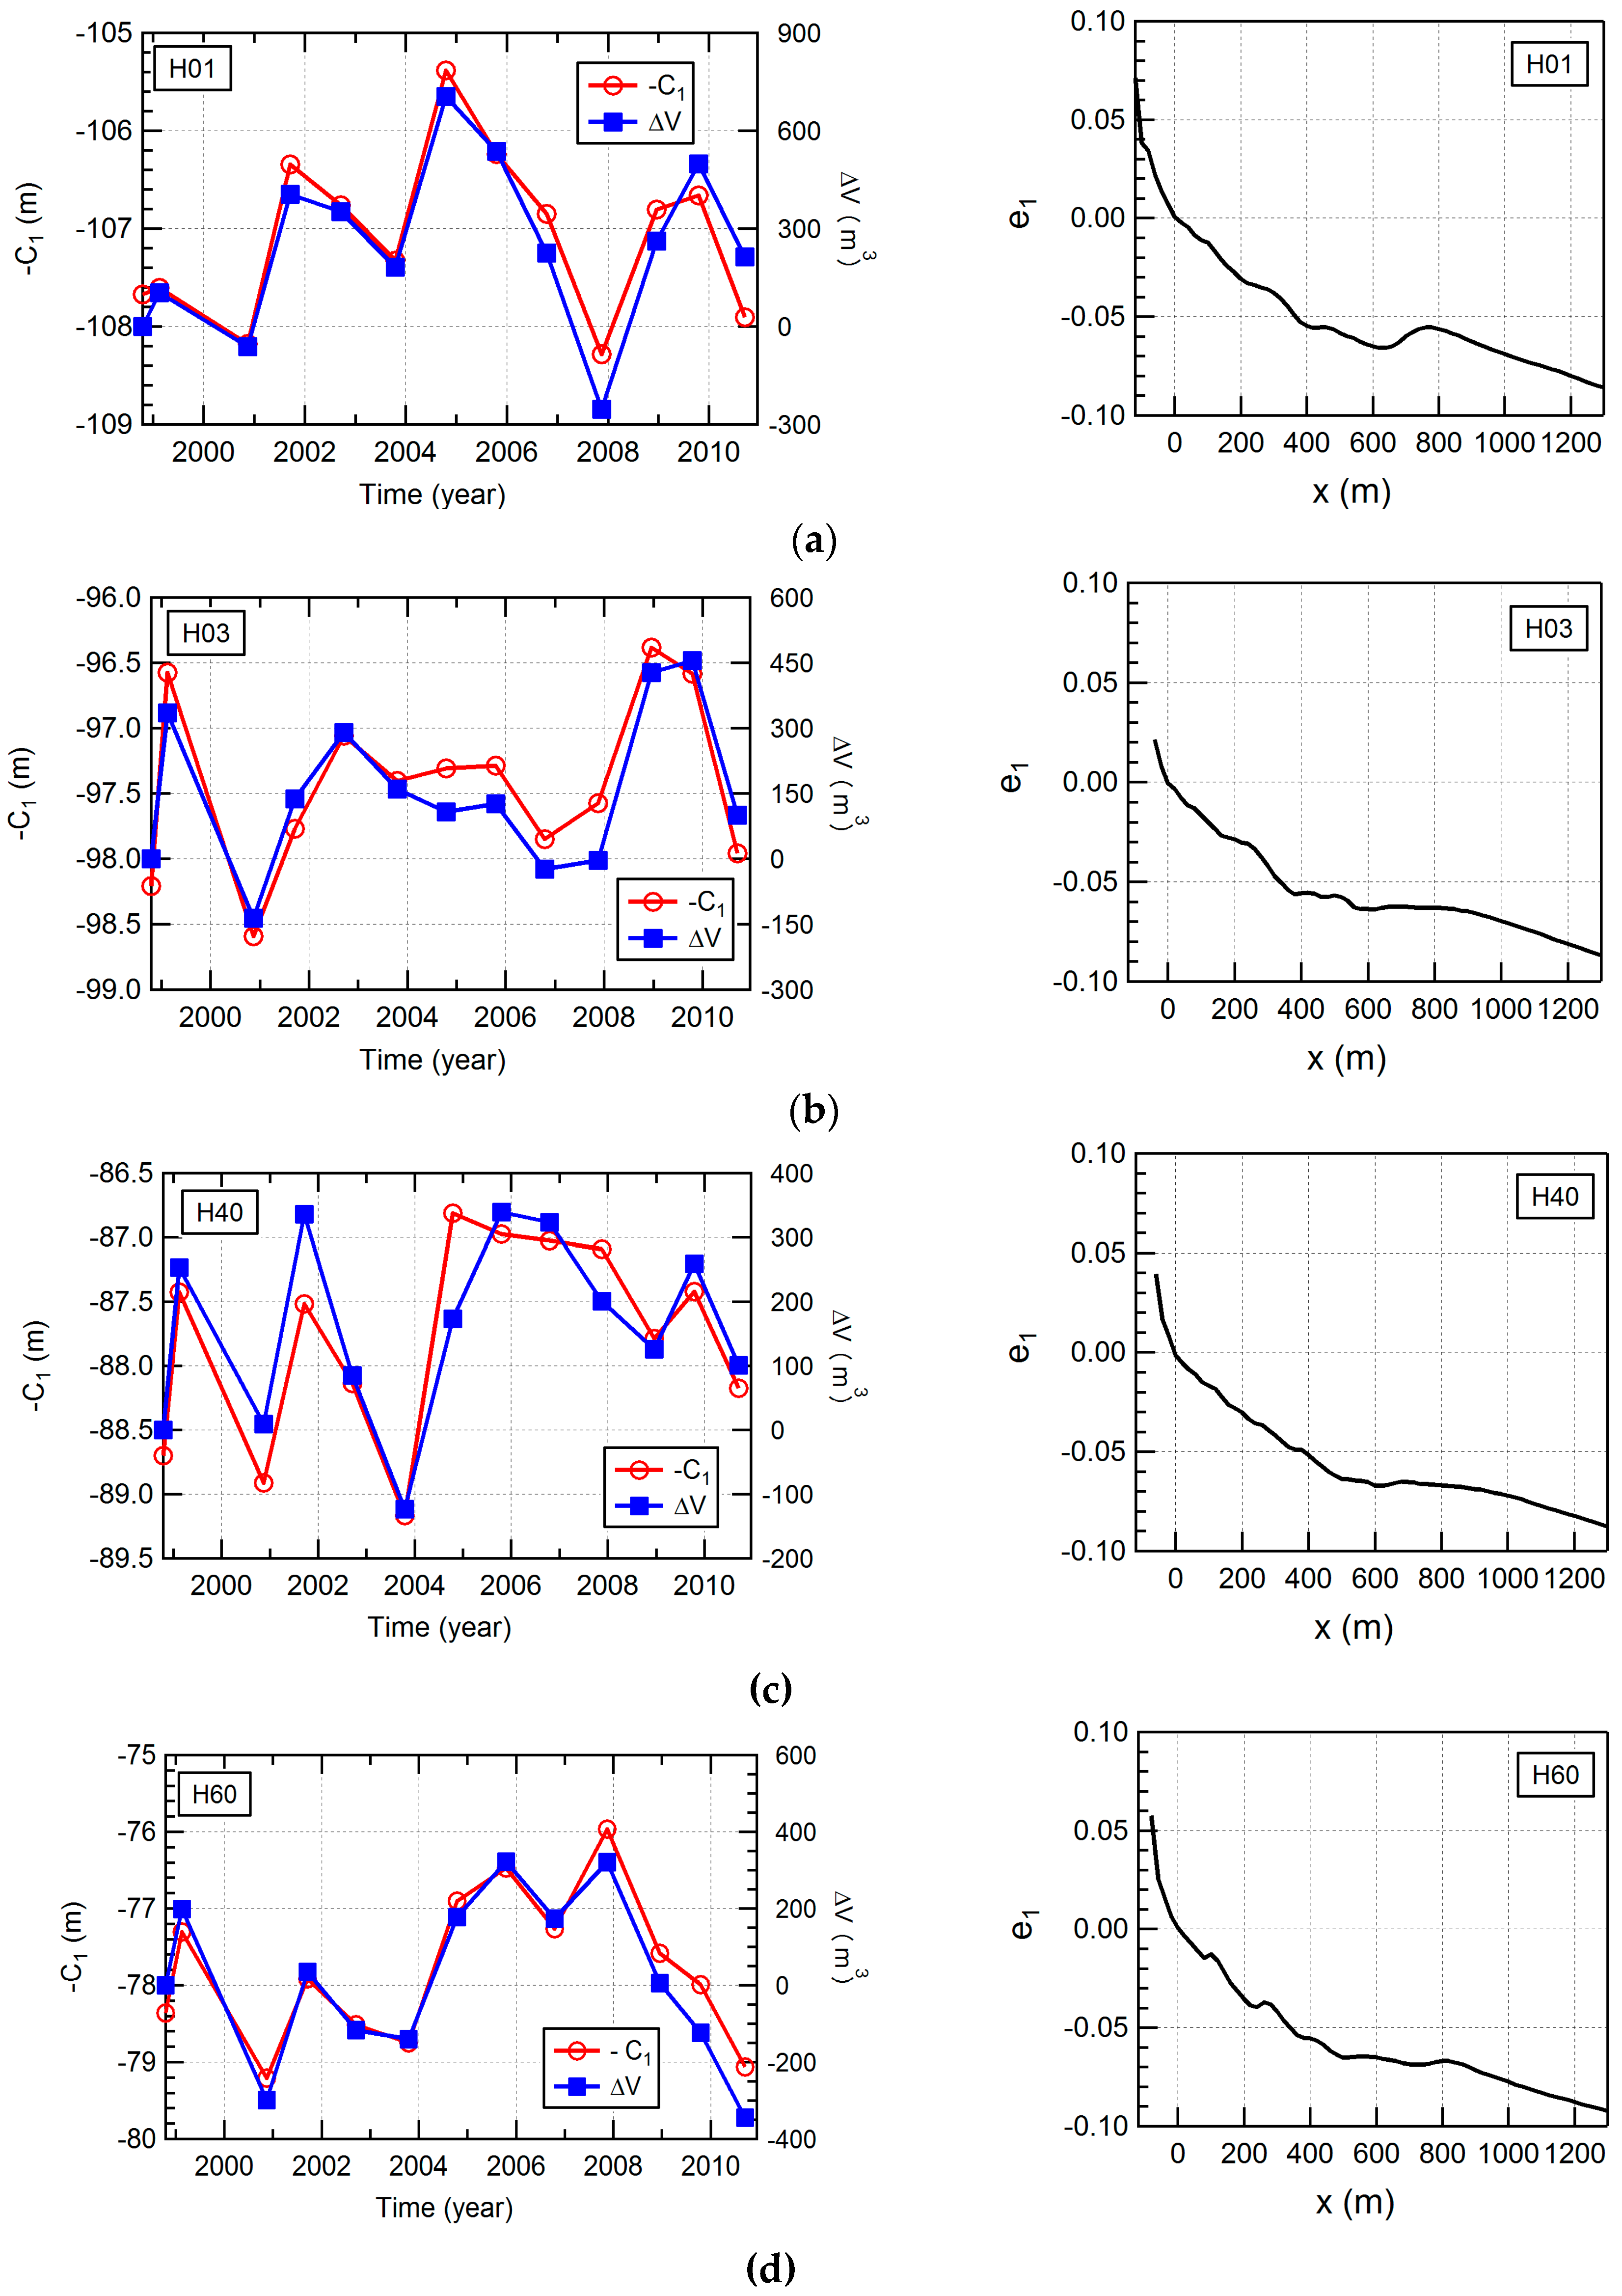
The temporal and spatial eigenfunctions for the first mode of long-term variation are shown in Figure 16. The spatial function of the first mode (e1) expresses the mean profile of the seabed during the study period and is generally similar among the four lines. Detailed inspection indicates that, on line H01, the profile of e1 has local maxima that correspond to the preferential locations of bar crests. The temporal coefficient of the first mode (C1) is shown and compared to the cumulative change of sediment volume per unit width (ΔV) with respect to the value at 1998. It is noted that the time coefficients are plotted after being multiplied by −1 (−C1) in the figure for comparison. Note that on all four lines, C1 is very closely related to the volumetric change induced by the imbalance of alongshore sediment transport or cross-shore exchange of sediment with the backshore and dunes or offshore regions.
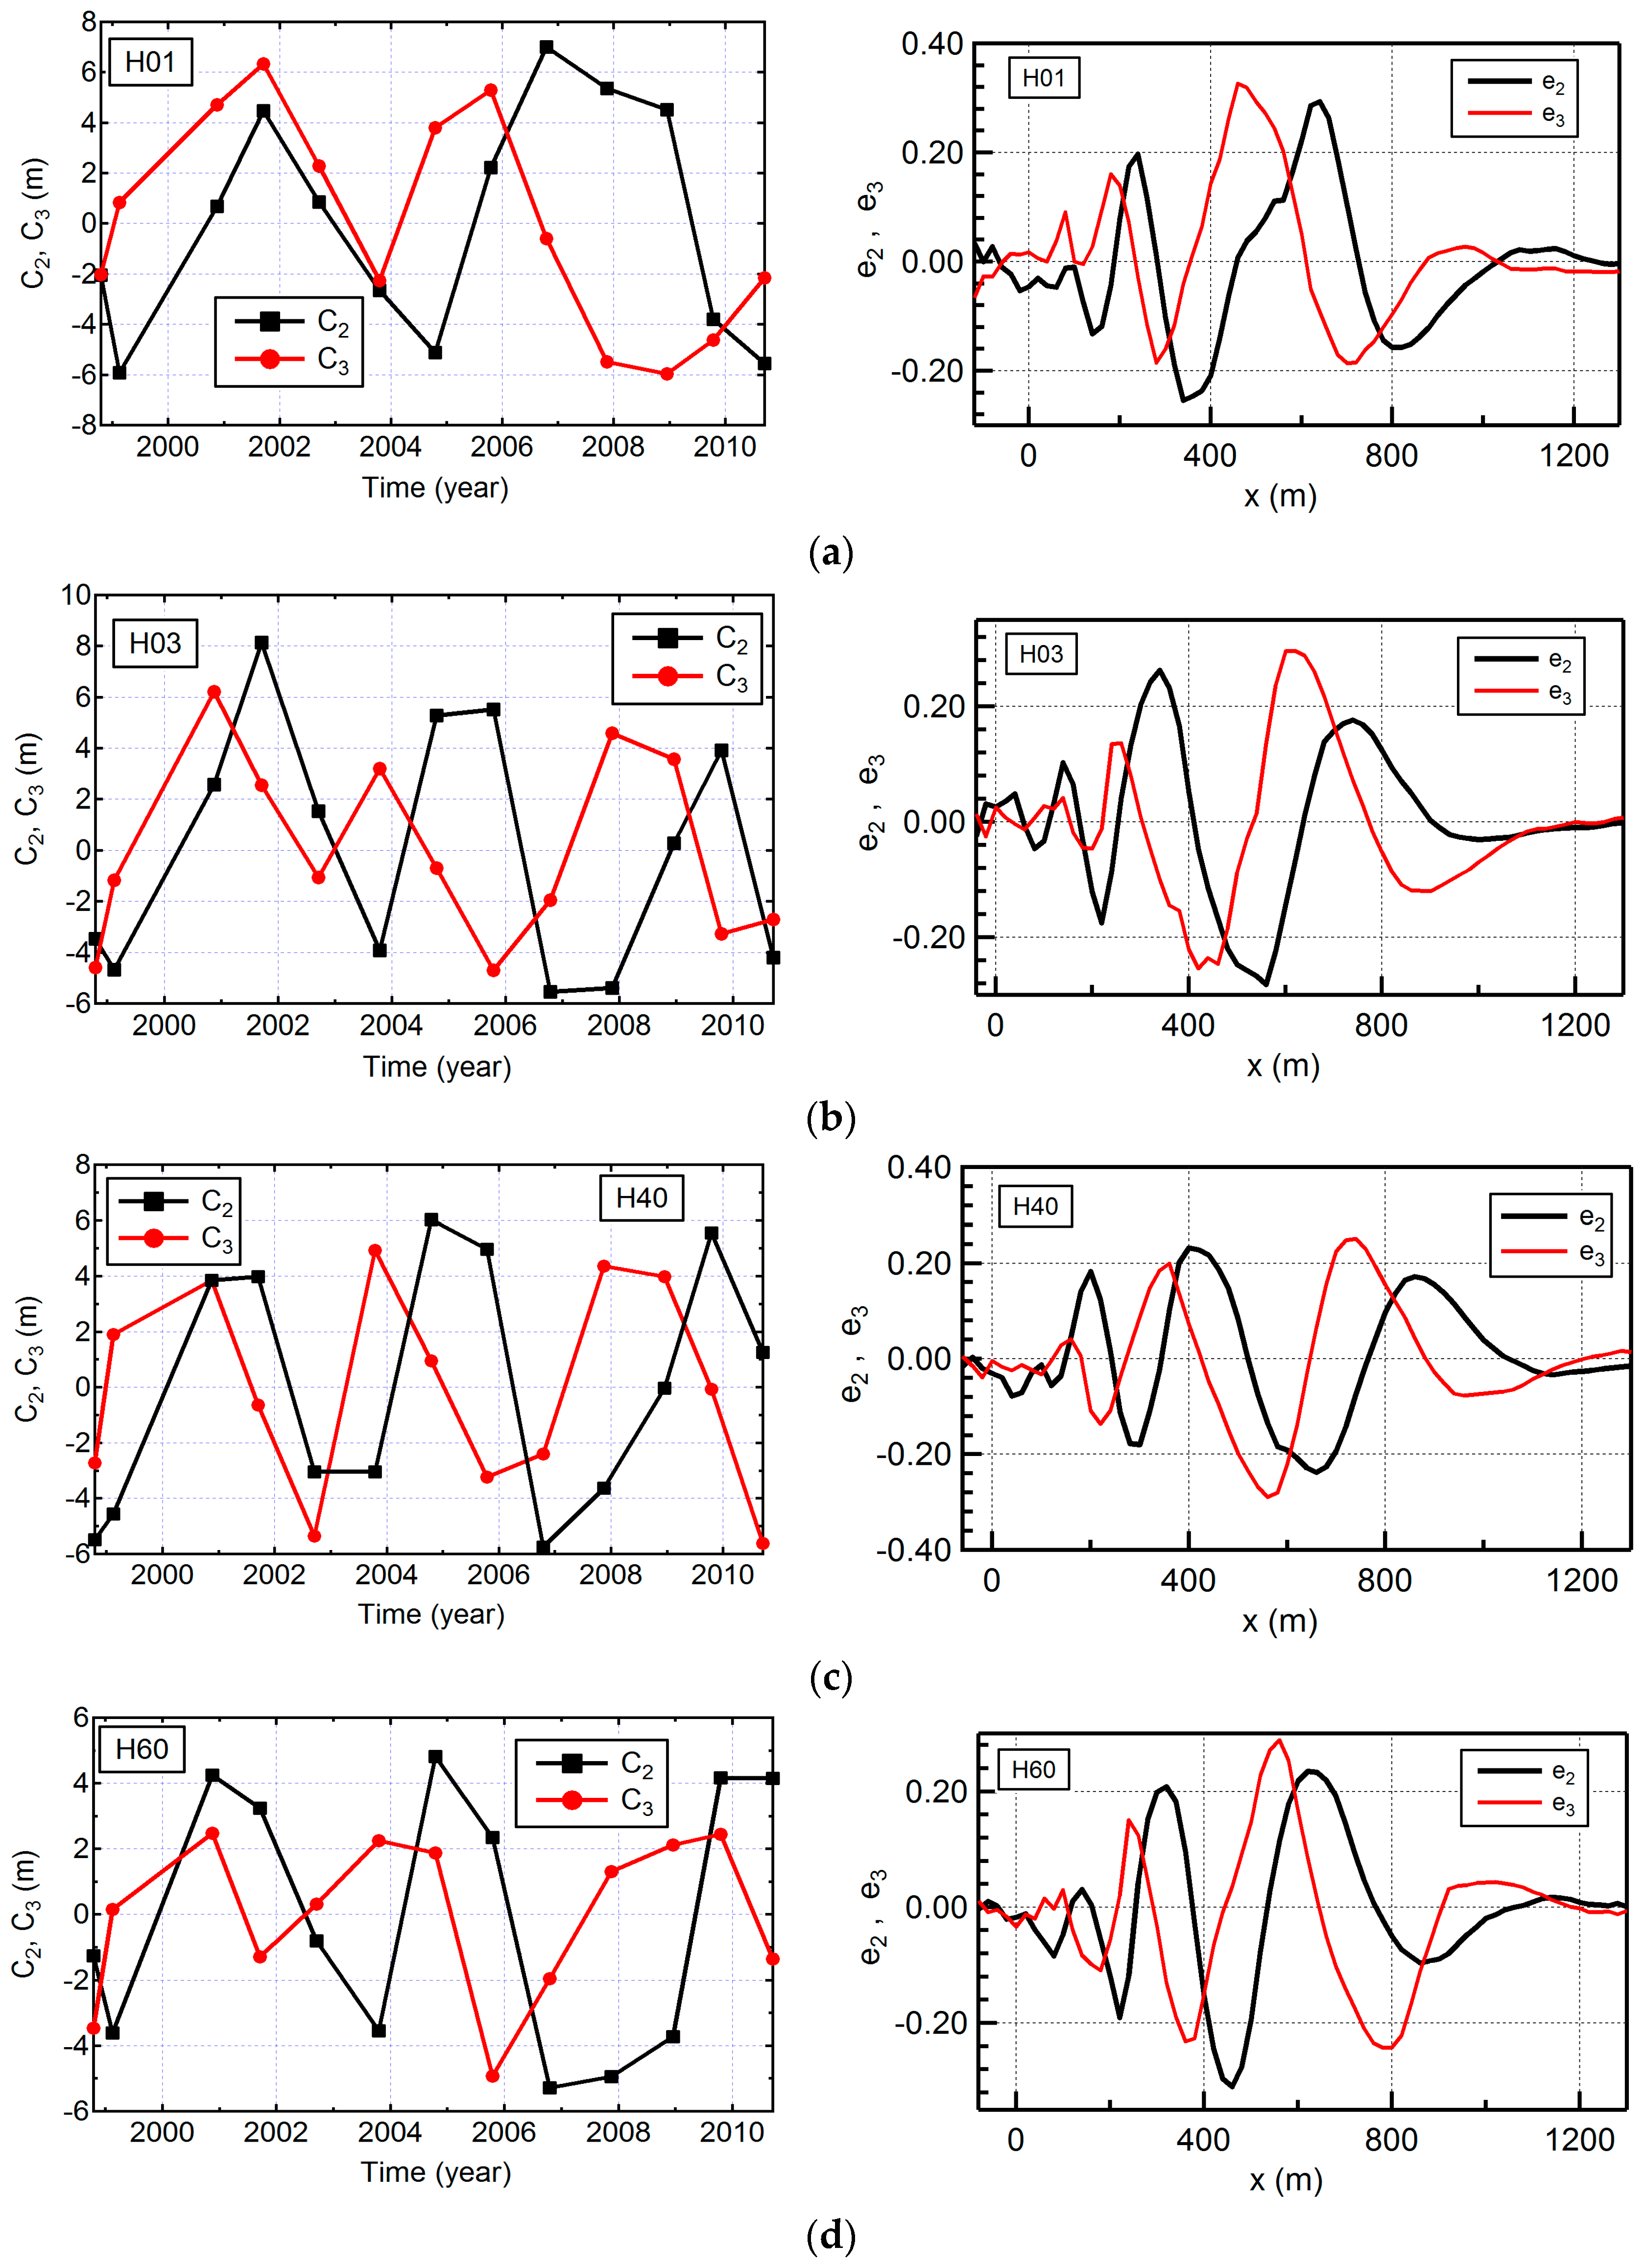
The combination of the second and third modes corresponds to the cyclic behavior of the sandbar system. Figure 17 describes the temporal and spatial eigenfunctions for the second and third modes. Both of the temporal functions, C2 and C3, show periodic variations. The phase difference between these two curves is approximately a quarter of the variation period. Similar features of phase shift are seen for the spatial eigenfunctions; the spatial functions e2 and e3 have features such that when one curve becomes a local maximum or minimum, the other crosses the horizontal axis. This implies that the relative difference in space between e2 and e3 is approximately a quarter wavelength. By synthesis of the characteristics of temporal and spatial functions, the combination of the second and third modes expresses the periodic seaward migration of bars.
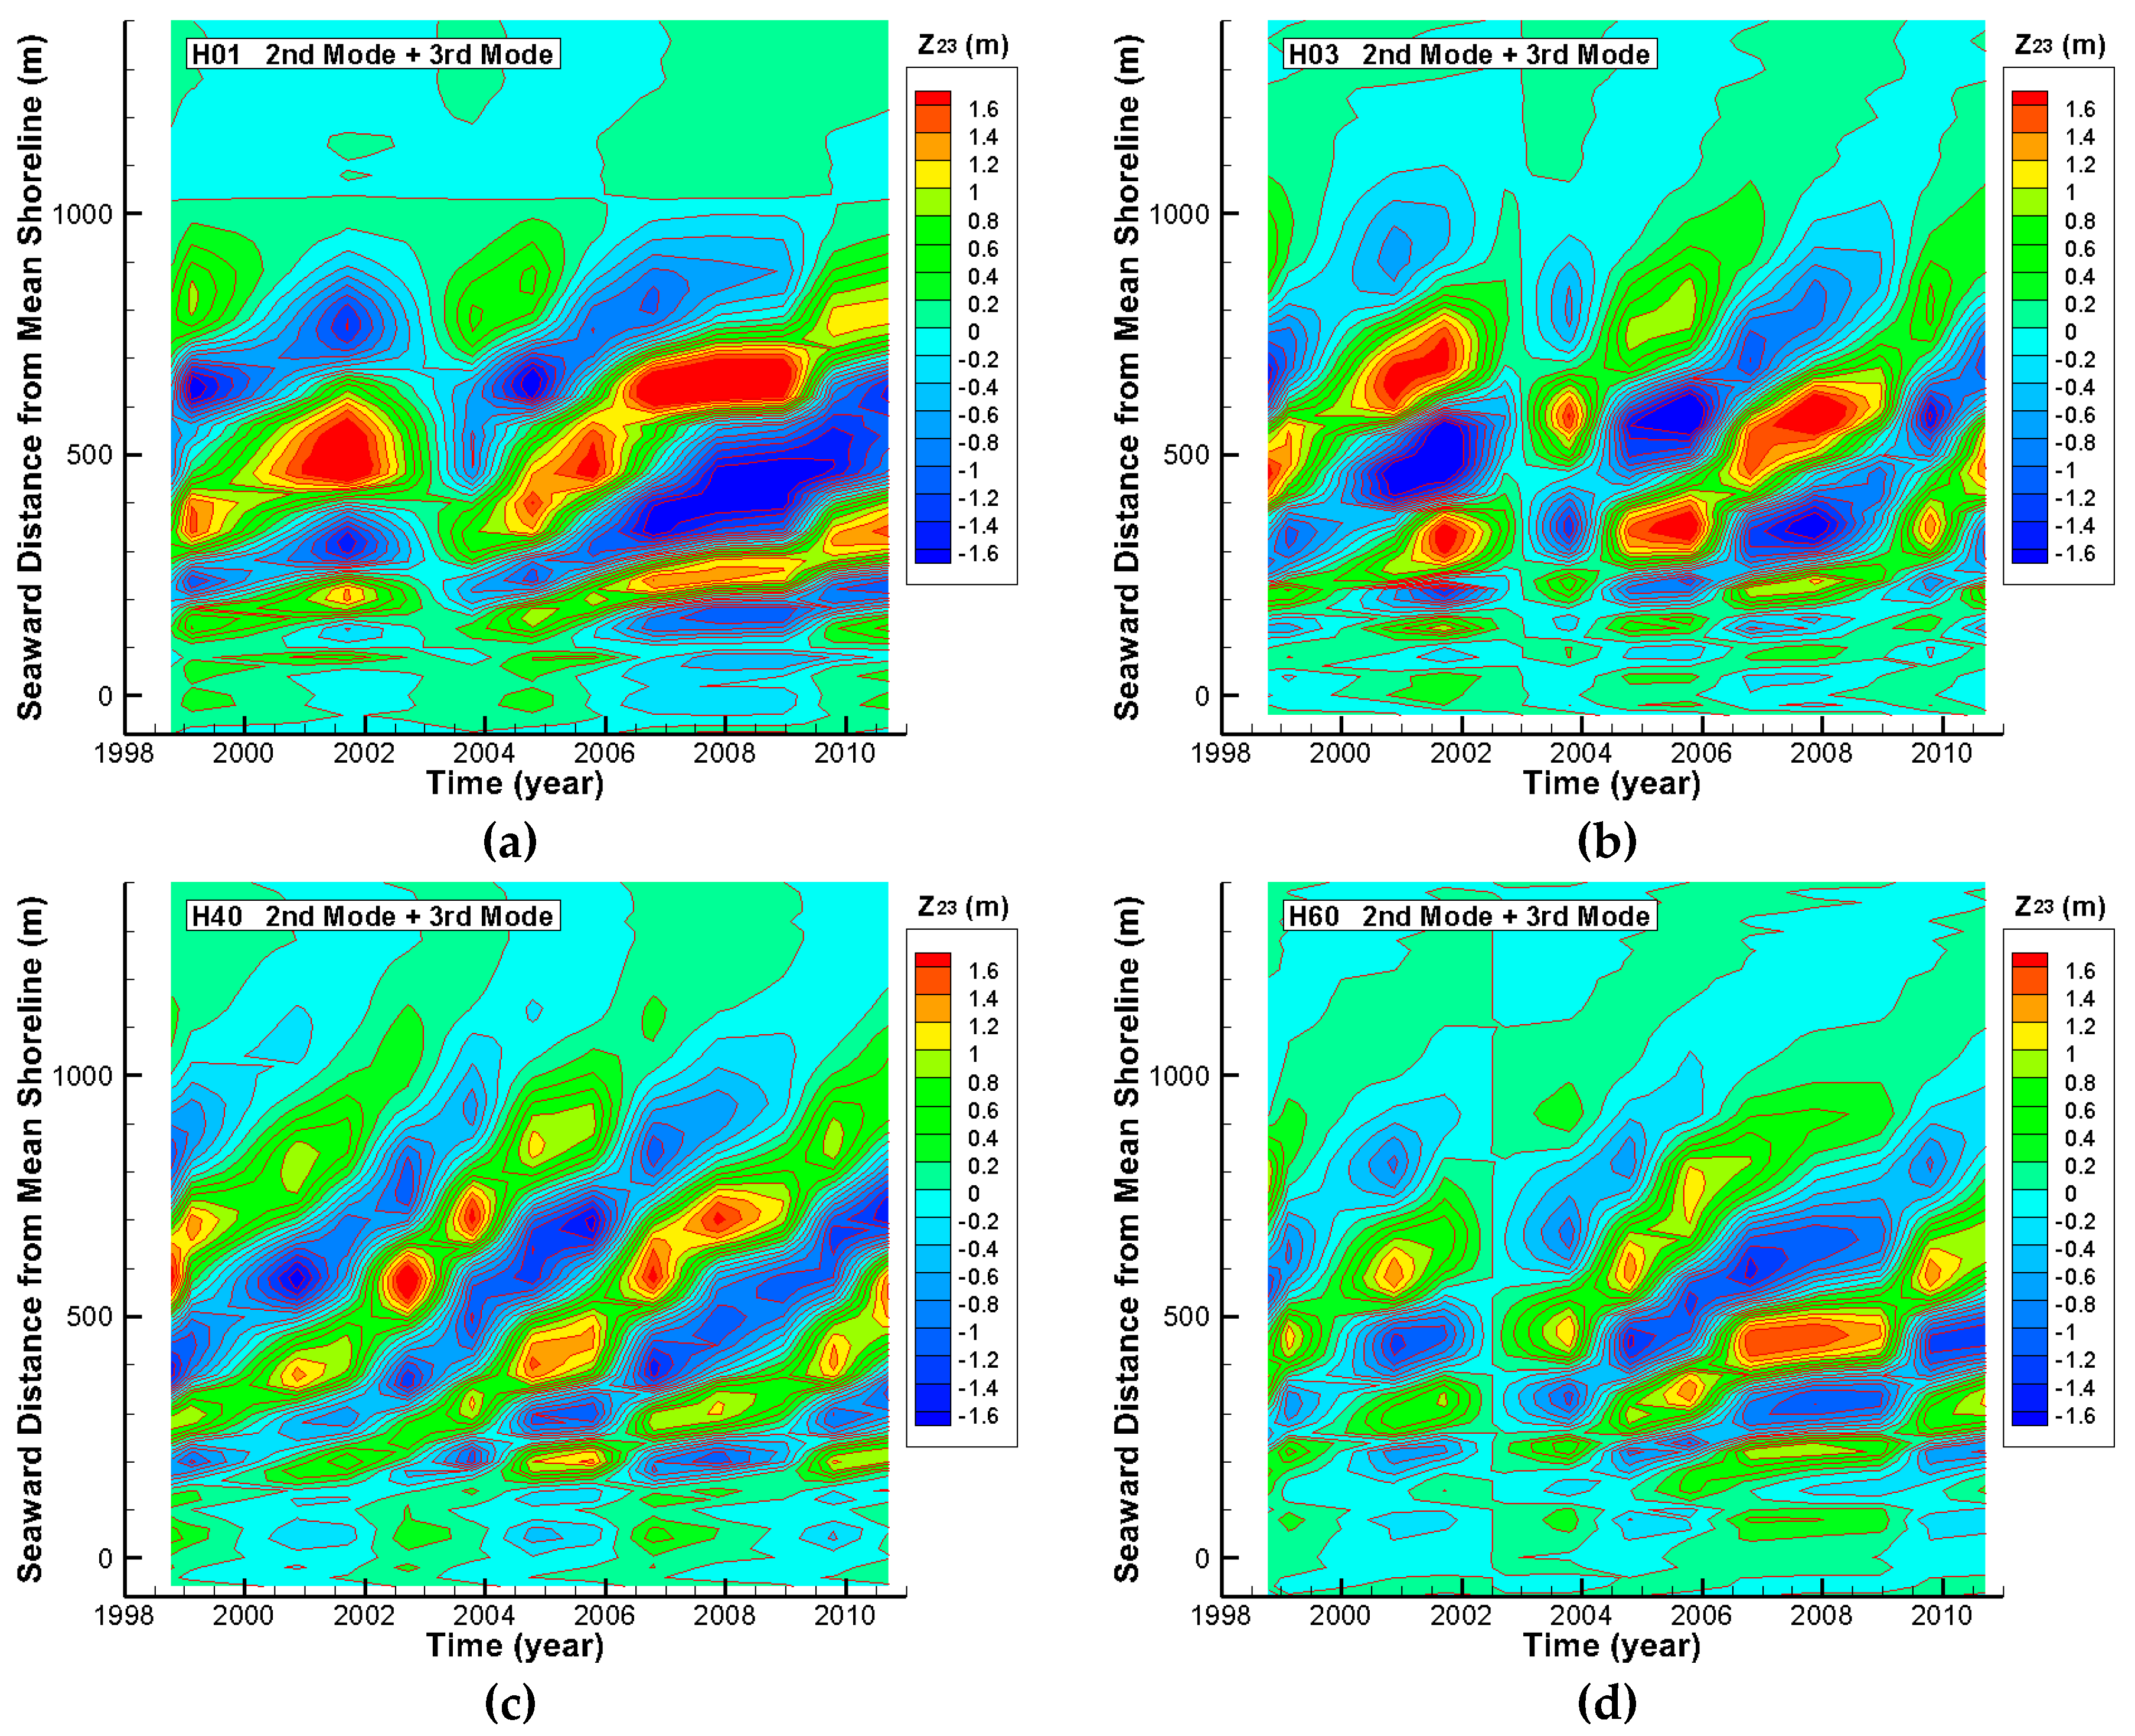
Figure 18 shows the summation of these two modes. The reconstructed data clearly reproduce the cross-shore periodic movement of the outer bar with an approximately four-year cycle. Note also that each bar first appears near the shoreline and then migrates seaward. The size of the bar increases with offshore migration. The net offshore movement continues throughout the bar cycle at this site. After the crest location exceeds 700 to 800 m, the bar begins to degenerate and finally disappears. The EOF results indicate that the life span of individual bars is around eight years on these lines. Although these two modes of bar migration are accompanied by short-term changes in sediment volume among the sub-areas in the profile, it can be deduced that these two modes do not contribute to the long-term variation of sediment volume over a whole transect because there are no long-term trends in the variations of C2 and C3.
In the EOF analysis results, the magnitudes of the temporal functions of the second and third modes (C2 and C3) are generally larger than those for higher (fourth to sixth) modes (C4 to C6). Concerning the spatial functions, the magnitudes of the second to sixth modes (e2 to e6) are comparable in the bar migration zone where large-scale bed-level variation occurs. Because the variation in each mode is expressed by the product of the temporal and spatial functions, the second and third modes are dominant compared with higher modes in the bar migration zone. Near the shoreline, however, the magnitudes of e4 to e6 become larger than e2 and e3 in relatively many cases. Accordingly, the influences of the fourth to sixth modes are not negligible over the local area near the shoreline. Inspection of the spatial and temporal functions of higher (fourth to sixth) modes revealed that the long-term retreating trend of the shoreline is expressed by the fifth mode for lines H01, H40 and H60 and the sixth mode for line H03. It was also seen that the short-term (year-to-year) variation is substantial in the fourth to sixth modes. These higher modes should be taken into account when the long-term trend and year-to-year variation in the shoreline location need to be reproduced.
Finally, the relationship between bar migration and shoreline movement is examined. In general, the location of the shoreline is affected by various factors with different time scales. The annual survey record reflects the combination of the long-term (decadal) trend of erosion, with middle-term (several years) cyclic variations related to interannual bar migration and short-term variations (seasonal variation and short-term changes induced by storms). In the EOF analysis, these factors are decomposed into different eigenmodes. The middle-term shoreline movement related to NOM behavior appears in the second and third modes. Corresponding to the progress of NOM cycles, the cyclic variation of bed level is observed around X = 0 in Figure 18a to Figure 18d. 
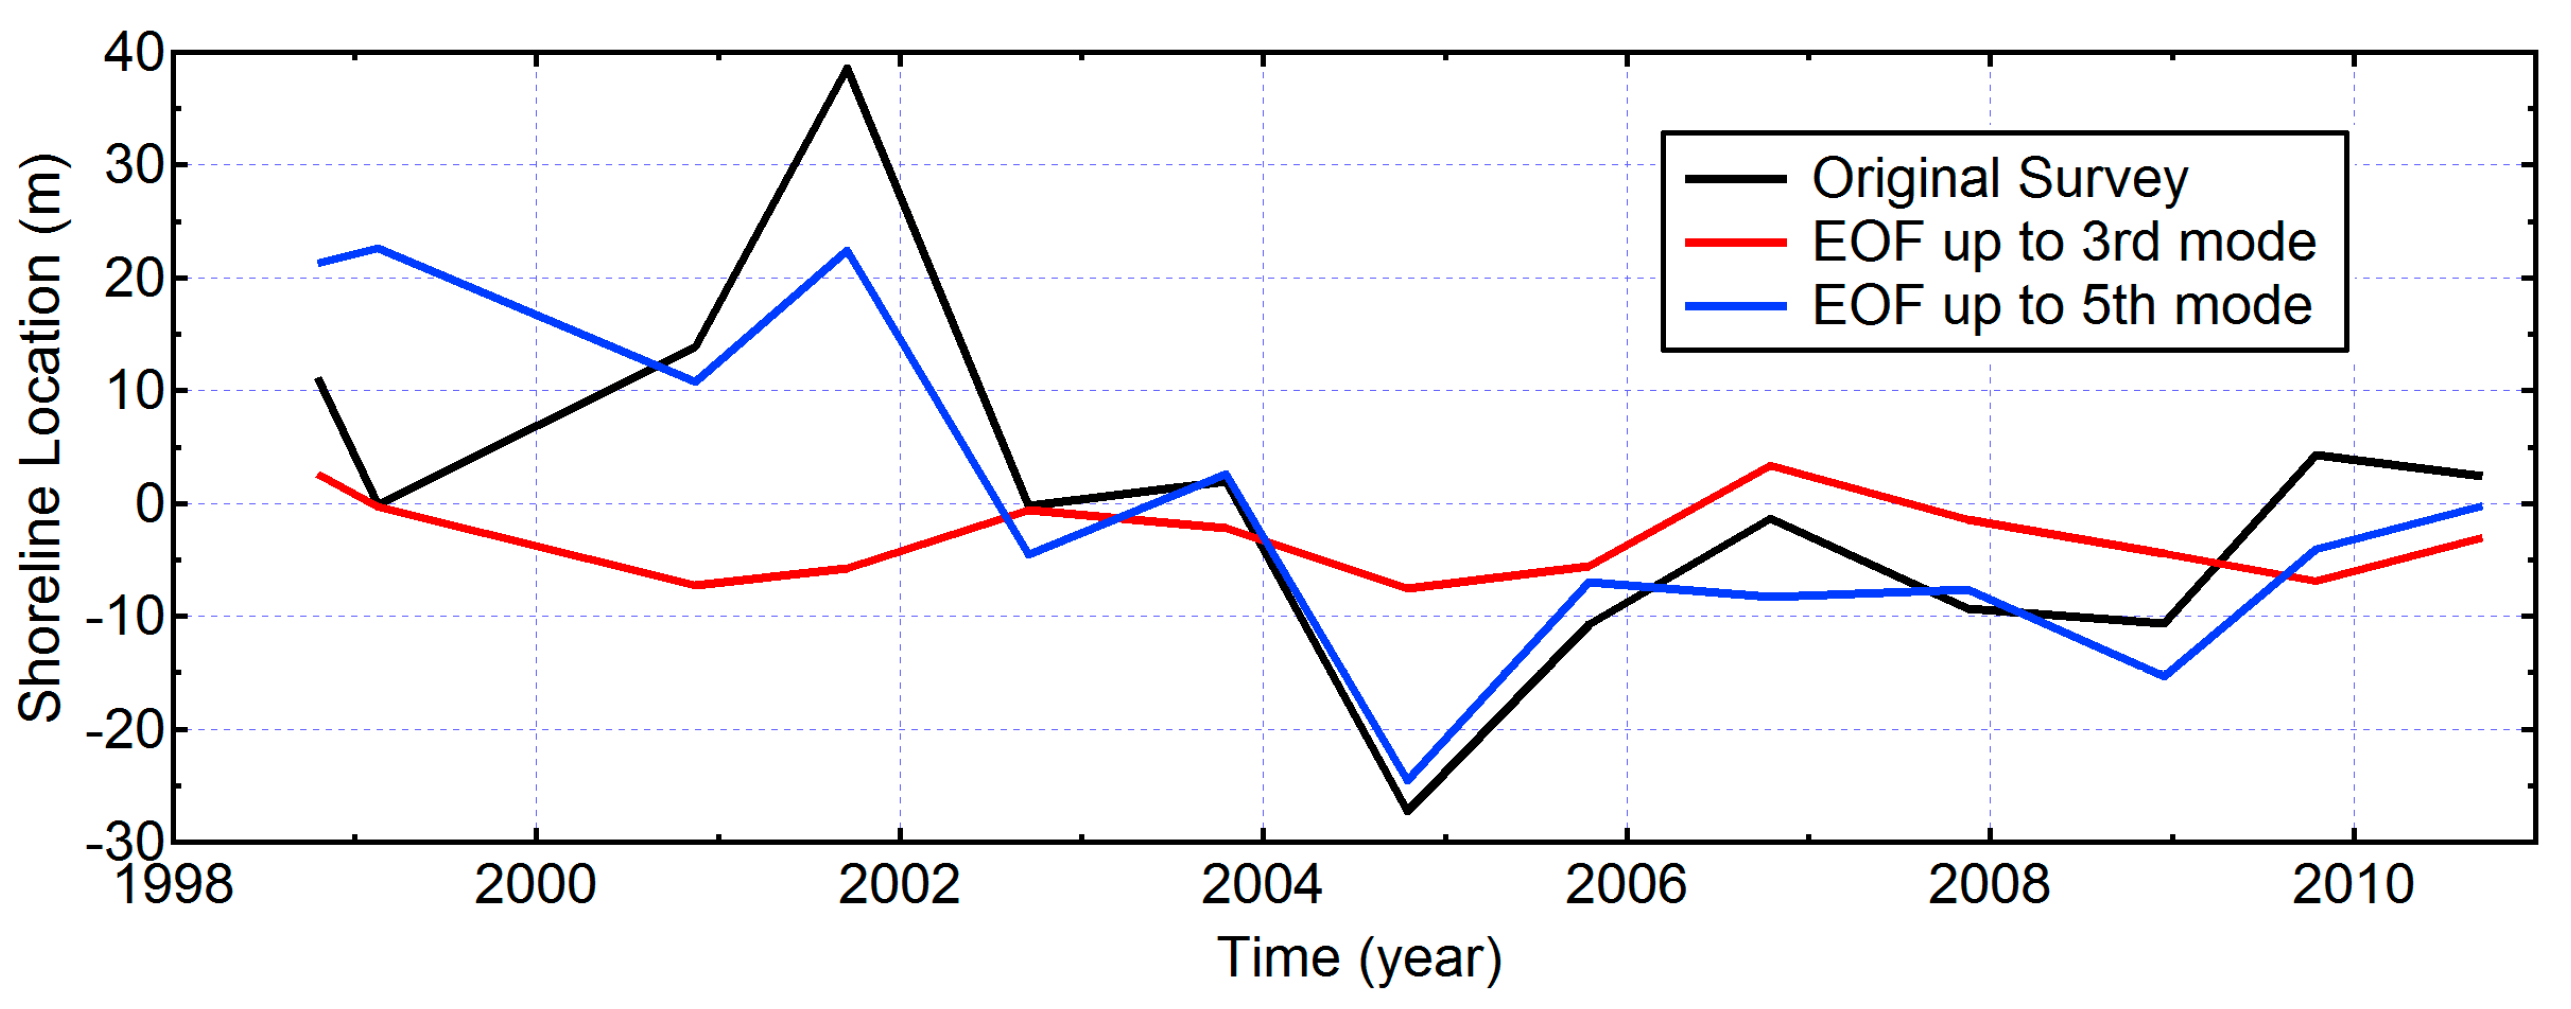
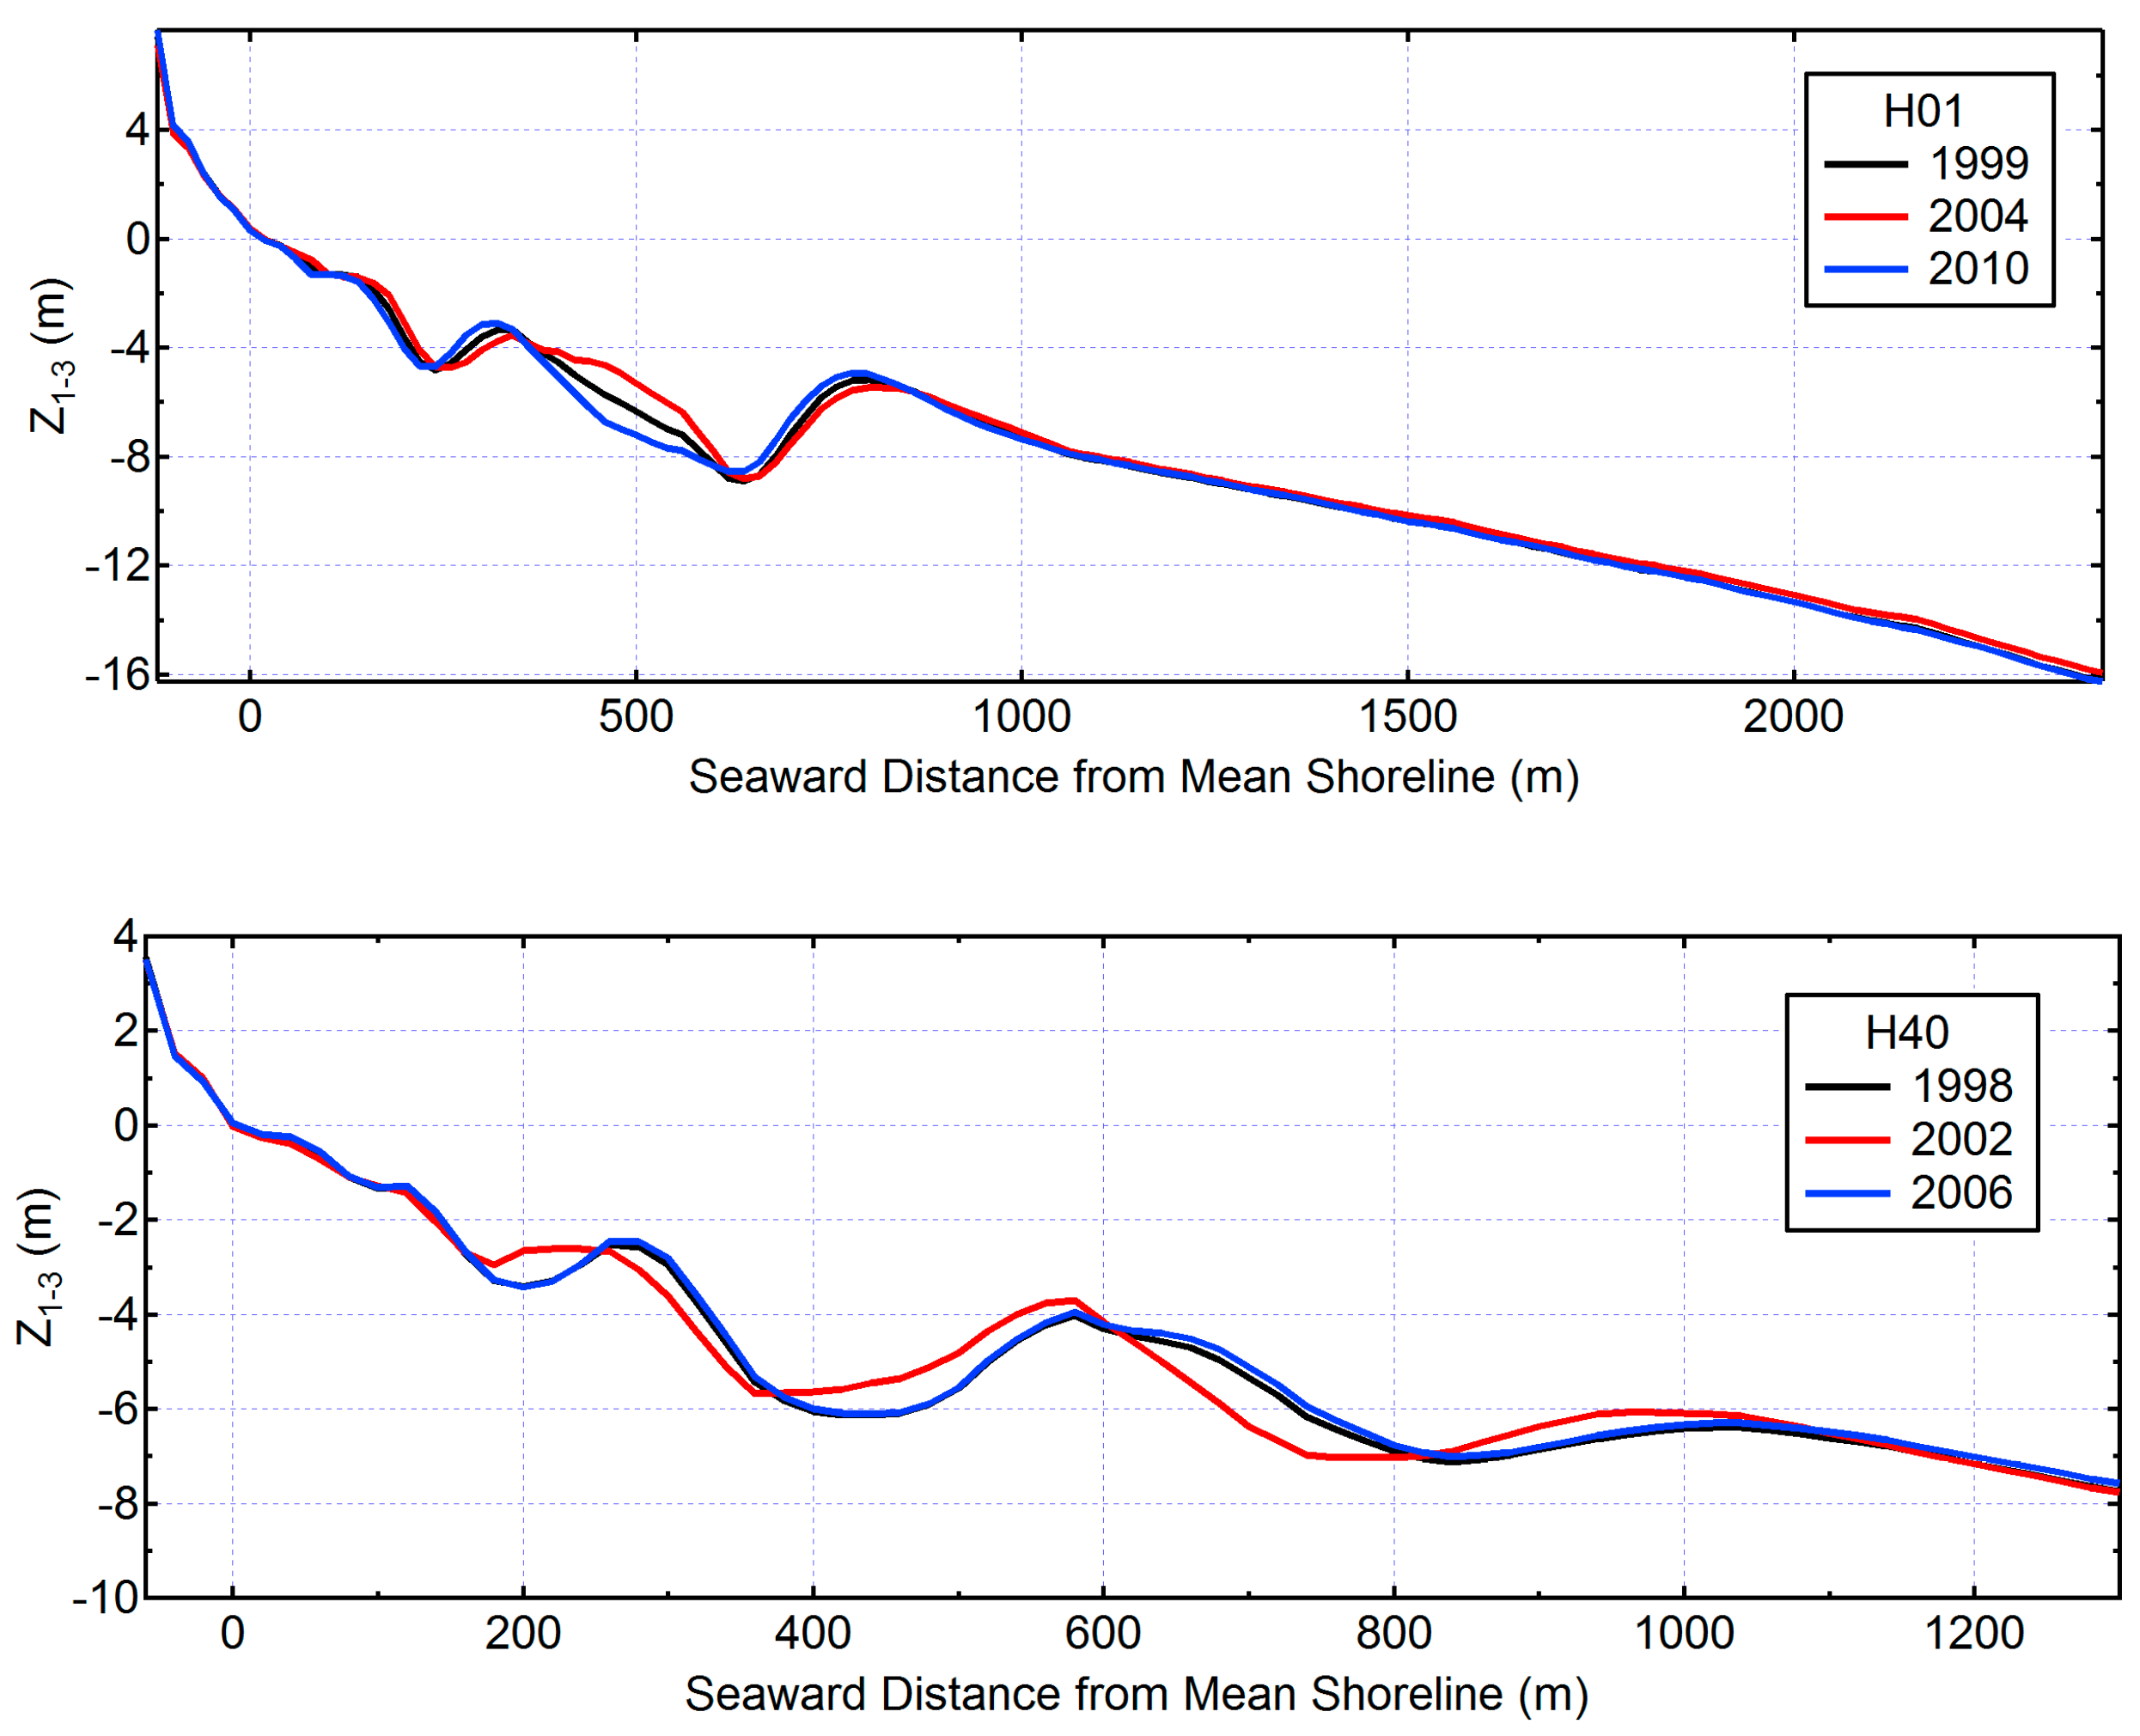
Figure 19 compares shoreline location changes in the original survey with reconstructed EOF results for the first three (Z1-3 = C1e1 + C2e2 + C3e3) and five (Z1-5 = C1e1 + + C5e5) modes for line H40. The reconstructed variation expressed by Z1-5 adequately reproduced the long-term retreating trend of the shoreline. Among the overall variation, Z1-3 extracts oscillatory variations with amplitudes of approximately 8 m without containing the long-term trend. Hereafter, this kind of cyclic variation accompanied by the NOM phenomena is examined to clarify the relation between bar configurations and shoreline movement.
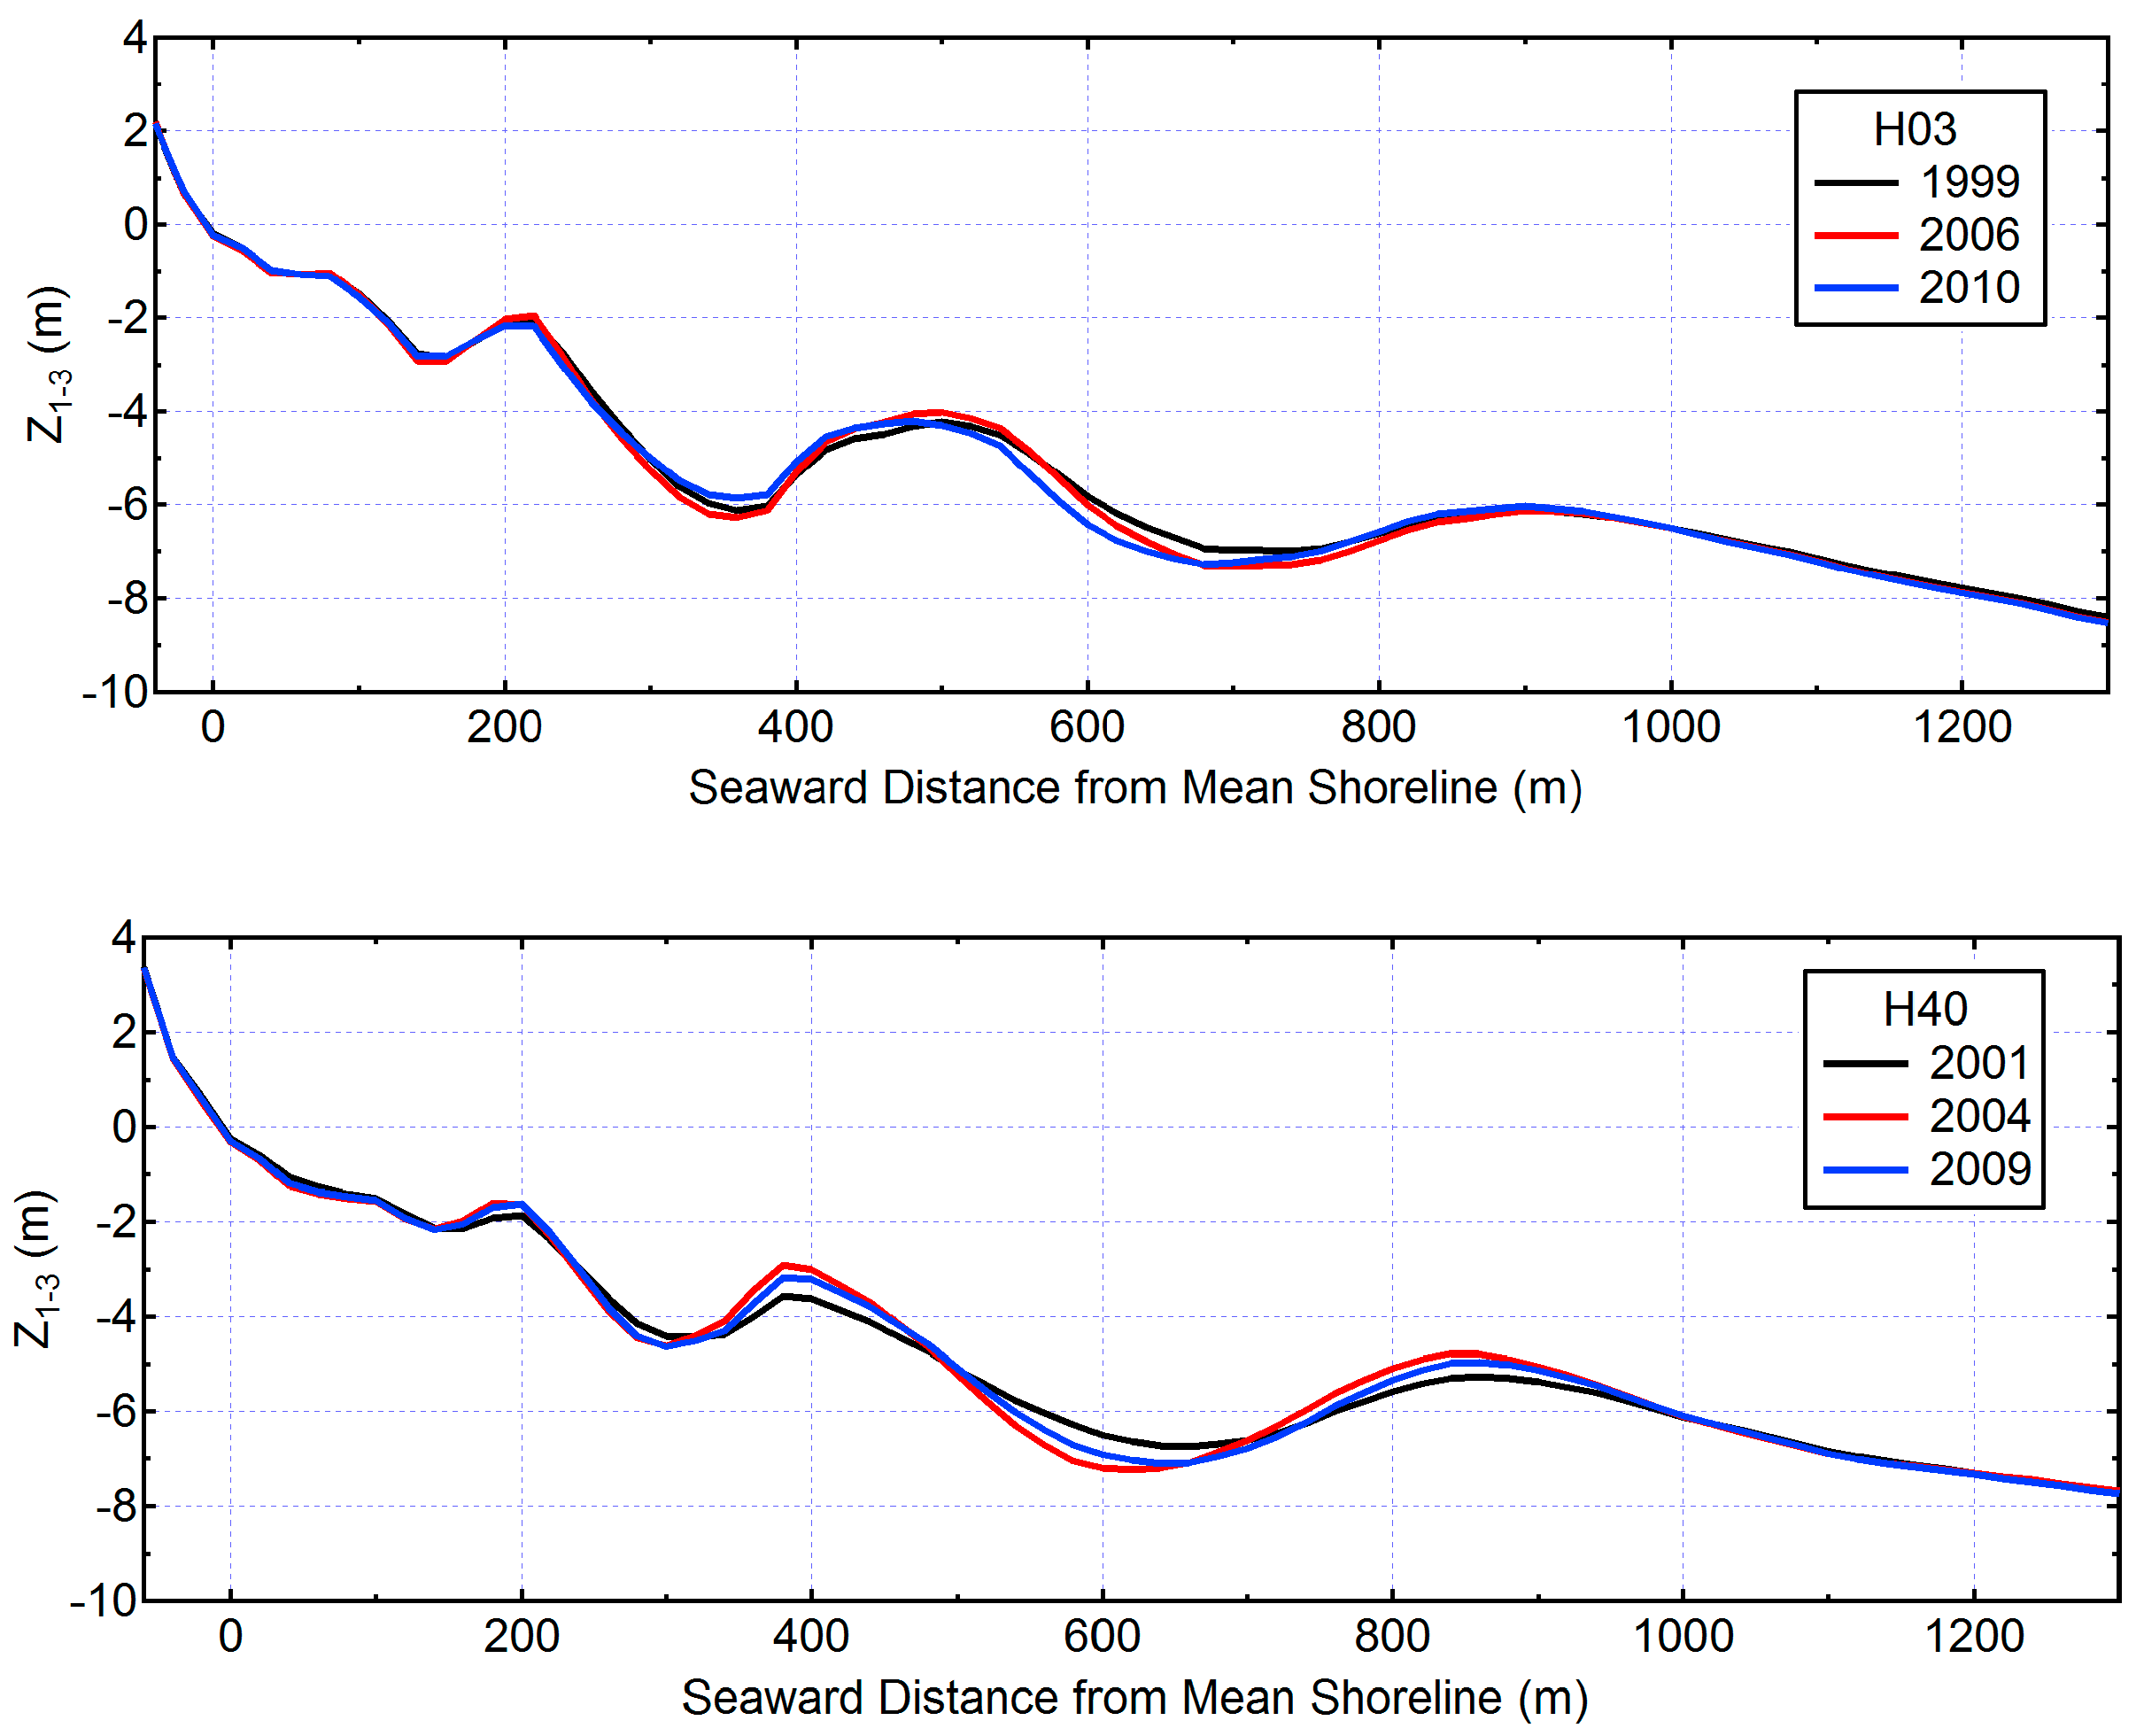
Figure 20 and Figure 21 demonstrate typical examples of cross-shore profiles corresponding to times when the reconstructed EOF results up to the third mode (Z1-3) indicate the retreat (Figure 20) and advance (Figure 21) of the shoreline. The shoreline tends to retreat when the outermost bar is decaying and a new bar is being generated at a seaward distance of some 200 m (i.e., when a triple bar configuration is newly established). This feature is common in lines H03, H40 and H60. In contrast, the shoreline experiences an advance when the outer bar is most evolved. More specifically, on lines H40 and H60, shoreline advances are observed when the old outermost bar remained, but with substantial decay, and the next bar evolved dominantly as the middle bar in a triple bar configuration. On lines H01 and H03, the shoreline experiences an advance when the new outermost bar has evolved significantly in the double bar configuration (the old outermost bar has almost completely diminished). On lines H40 and H60, the shoreline location is neutral when the old outermost bar has completely decayed, and the profile has a double bar configuration.
As a typical example, consider the variation on line H40. The spatial functions in Figure 17c show that the second mode on line H40 corresponds to a triple bar configuration with a new bar generated at around X = 200 m, whereas the third mode indicates the double bar configuration (the third bar has not evolved yet). As was mentioned previously, the temporal coefficients of these modes have a phase shift of approximately a quarter of a period. Accordingly, when the second mode is dominant (i.e., a large C2 magnitude), the influence of the third mode decreases (i.e., corresponding to a small C3 magnitude). Therefore, the bar system is close to a double bar configuration when the third mode is dominant (e.g., 11/2003 in Figure 10), while the transition to a well-developed triple bar system is observed when the second mode is dominant instead (e.g., 10/2004). The cross-shore distribution of e2 indicated that the third bar evolves at around X = 200 m when C2 is maximum. At the same time, over the landward area corresponding to X < 200 m, where e2 is negative, the bed level decreased, and correspondingly, the shoreline location retreated (e.g., 10/2004 in Figure 10). Therefore, the generation of a new bar and resulting transition into a triple bar configuration in a bar system may induce a temporal retreat of the shoreline, whereas the evolution of the outer bar accompanies an advance in the shoreline (e.g., at 10/2006 when C2 had a negative peak). Note here that this kind of middle-term shoreline change over a time scale of years is cyclic and does not contribute to long-term changes in shoreline location within a decadal time scale.
These results imply that on sandy beaches similar to those on the Chirihama Coast where large-scale bar systems have evolved, the temporal variation of shoreline locations with a time scale of several years may appear with the systematic transition to a multiple bar system configuration. Accordingly, it is very difficult on such sandy beaches to estimate the variation of sediment volume over the transect from only the change in the cross-shore shoreline location with an assumption of parallel translation in the cross-shore profile. Care should be taken on this point from an engineering point of view.

5. Summary Remarks

Representative morphological changes on the Chirihama Coast of Japan have been investigated based on two sets of field survey records. The analysis of shoreline survey records spanning two decades indicated a long-term eroding trend. Recently, an increasing seasonal variation has been revealed. Profile surveys undertaken over 13 years demonstrate that the depth contour lines near the shoreline have been progressively retreating, while the locations of contour lines in the offshore area are stable or have been slowly advancing recently. The implication for the seabed slope is that it is becoming gentler. Typical profile configurations are characterized by the presence of multiple bars. The height of the outer bar exceeds 4 m when the bar evolves most significantly. The cross-shore movements of the bars are significant. For the temporal variations, the net offshore migrations of bars have been repeated systematically. During the study period, three or four cycles consisting of the generation, seaward migration and offshore decay of bars have been recognized. The total lifespan of an individual bar is approximately eight years, and the interval between each cycle is approximately four years. It is also recognized that the seaward migration of individual bars propagates from north to south. The principal modes of sandbar migration obtained by EOF analysis clearly captured the main features of the systematic bar behavior. The EOF results suggest that the generation of a new bar at a distance of approximately 200 m from the shoreline, and a corresponding change in bar configuration into a new triple-bar system, results in the temporal retreat of the shoreline. In contrast, the shoreline experiences an advance when the outer bar has most evolved. This type of middle-term shoreline change does not contribute to the long-term changes at a decadal time scale.

Acknowledgments

Field survey records were provided by HRDB. The shoreline survey records were provided by Ishikawa Prefectural Government. This study was partially supported by Grants-in-Aid for Scientific Research by the Japan Society for the Promotion of Science (Nos. 25420517 and 16K06505). The authors wish to acknowledge the contributions of Messrs. Kawashima, Ura and Uehata (former students of Kanazawa University) in the initial stage of this study.

Author Contributions

M.Y. conceived of the general concept of the paper and wrote the manuscript. M.M. and K.H. analyzed the data and contributed analysis tools.

Conflicts of Interest

The authors declare no conflict of interest.

Abbreviations

The following abbreviations are used in this manuscript:
EOFEmpirical orthogonal eigenfunction
HRDBHokuriku Regional Development Bureau, Ministry of Land, Infrastructure, Transport and Tourism, Japan
T.P.Tokyo Peil
JSCEJapan Society of Civil Engineers

References

  1. Ishida, H.; Takase, N.; Nagahara, H.; Ura, R. Current status of erosion problems on Chirihama Beach and Nagisa Driveway. Proc. Coast. Eng. JSCE 1984, 31, 355–359. (In Japanese) [Google Scholar]
  2. Yuhi, M. Impacts of anthropogenic modifications of river basin on surrounding coasts: A Case Study. J. Waterw. Port Coast. Ocean Eng. ASCE 2008, 134, 336–344. [Google Scholar] [CrossRef]
  3. Yuhi, M.; Dang, M.H.; Umeda, S. Comparison of accelerated erosion in riverbed and downstream coast by EOF analysis over a decadal scale. J. Coast. Res. 2013, SI65(1), 618–623. [Google Scholar] [CrossRef]
  4. Mizumura, K.; Yamamoto, T.; Fujikawa, T. Prediction of sand movement near port of Kanazawa. J. Waterw. Port Coast. Ocean Eng. ASCE 1997, 123, 215–222. [Google Scholar] [CrossRef]
  5. Ohmori, M.; Mogi, A.; Hoshino, T. Geology in Shallow Sea; Tokai University Press: Tokyo, Japan, 1971; pp. 209–217. (In Japanese) [Google Scholar]
  6. Kato, K. On the relation between infragravity waves and multiple sandbars. Proc. Coast. Eng. JSCE 1984, 31, 441–445. (In Japanese) [Google Scholar]
  7. Sunamura, T.; Takeda, I. Regional difference in the number of submarine longshore bars in Japan: An analysis based on breaking wave hypothesis. Trans. Jpn. Geomorphol. Union 2007, 28, 381–398. [Google Scholar]
  8. Hayakawa, K.; Yuhi, M.; Ishida, H. Migration of multiple sandbars on the Chirihama Beach, JAPAN. In Proceedings of the Coastal Dynamics 2009: In Impacts of Human Activities on Dynamic Coastal Processes, Tokyo, Japan, 7–11 September 2009; Mizuguchi, M., Sato, S., Eds.; World Scientific: Singapore, 2009; p. 140. [Google Scholar]
  9. Komar, P.A. Beach Processes and Sedimentation, 2nd ed.; Prentice-Hall Inc.: Upper Saddle River, NJ, USA, 1998; pp. 292–302. [Google Scholar]
  10. Wijnberg, K.M.; Kroon, A. Barred beaches. Geomorphology 2002, 48, 103–120. [Google Scholar] [CrossRef]
  11. Masselink, G.; Hughes, M.G. Introduction to Coastal Processes and Geomorphology; Hodder Arnold: London, UK, 2003; pp. 214–217. [Google Scholar]
  12. Greenwood, B. Bars. In Encyclopedia of Coastal Science; Schwartz, M., Ed.; Springer: Dordrecht, The Netherlands, 2005; pp. 120–129. [Google Scholar]
  13. Ruessink, B.G.; Kroon, A. The behavior of a multiple bar system in the nearshore zone of Terschelling, The Neterlands: 1965–1993. Mar. Geol. 1994, 121, 187–197. [Google Scholar] [CrossRef]
  14. Wijnberg, K.M.; Terwindt, J.H.J. Extracting decadal morphological behavior from high-resolution, long-term bathymetric surveys along the Holland coast using eigenfunction analysis. Mar. Geol. 1995, 126, 301–350. [Google Scholar] [CrossRef]
  15. Shand, R.D.; Bailey, D.G.; Shepherd, M.J. An Inter-site comparison of net offshore bar migration characteristics and environmental conditions. J. Coast. Res. 1999, 15, 750–765. [Google Scholar]
  16. Kuriyama, Y. Medium-term bar behavior and associated sediment transport at Hasaki, Japan. J. Geophys. Res. 2002, 107, 3132. [Google Scholar] [CrossRef]
  17. Ruessink, B.G.; Wijnberg, K.M.; Holman, R.A.; Kuriyama, Y.; Enckevort, I.M.J. Intersite comparison of interannual nearshore bar behavior. J. Geophys. Res. 2003, 108, 3249. [Google Scholar] [CrossRef]
  18. Yuhi, M.; Okada, M. Long-term field observations of multiple bar properties on an eroding coast. J. Coast. Res. 2011, SI64, 860–864. [Google Scholar]
  19. Wright, L.D.; Short, A.D. Morphodynamic variability of surf zones and beaches: A synthesis. Mar. Geol. 1984, 56, 93–118. [Google Scholar] [CrossRef]
  20. Niedroda, A.W.; Swift, D.J. Shoreface processes. In Handbook of Coastal and Ocean Engineering; Gulf Publishing Company: Houston, TX, USA, 1991; pp. 735–770. [Google Scholar]
  21. Sato, S. Effects of winds and breaking waves on large-scale coastal currents developed by winter storms in Japan Sea. Coast. Eng. Jpn. 1996, 39, 129–144. [Google Scholar]
  22. Tanaka, S.; Satoh, S.; Kawagishi, S.; Ishikawa, T.; Yamamoto, Y.; Asano, G. Sand transport mechanism in Ishikawa Coast. Proc. Coast. Eng. JSCE 1997, 44, 661–665. (In Japanese) [Google Scholar]
  23. Winant, C.D.; Inman, D.L.; Nordstrom, C.E. Description of seasonal beach changes using empirical eigenfunctions. J. Geophys. Res. 1975, 80, 1979–1986. [Google Scholar] [CrossRef]
  24. Dean, R.G.; Dalrymple, R.A. Coastal Processes with Engineering Applications; Cambridge University Press: Cambridge, UK, 2002; pp. 139–145. [Google Scholar]
  25. Larson, M.; Capobianco, M.; Jansen, H.; Rozynski, G.; Southgate, H.N.; Stive, M.; Wijnberg, K.M.; Hulscher, S. Analysis and Modeling of Field Data on Coastal Morphological Evolution over Yearly and Decadal Time Scales. Part 1: Background and Linear Techniques. J. Coast. Res. 2003, 19, 760–775. [Google Scholar]
  26. Keulegan, G.H. Depths of Offshore Bars; Engineering Notes No. 8; Beach Erosion Board, U.S. Army Engineer Waterways Experiment Station: Vicksburg, MS, USA, 1945. [Google Scholar]
Figure 1. Field site: (a) location of the study site; (b) location of the cross-shore survey lines (H stands for the Hakui district where the Chirihama Coast is located.).
Jmse 04 00040 g001
Figure 2. Nagisa Driveway on the Chirihama Coast.
Jmse 04 00040 g002
Figure 3. Wave climate observed at Tokumitsu Station (1995 to 2005).
Jmse 04 00040 g003
Figure 4. Definition of bar properties.
Jmse 04 00040 g004
Figure 5. Long-term trend of shoreline change.
Jmse 04 00040 g005
Figure 6. Seasonal variation of shoreline location.
Jmse 04 00040 g006
Figure 7. Variation of mean significant wave height during autumn and winter (from the beginning of October to the end of March) and spring and summer (from the beginning of April to the end of September).
Jmse 04 00040 g007
Figure 8. Alongshore comparison of shoreline change rates.
Jmse 04 00040 g008
Figure 9. Variation of seabed level.
Jmse 04 00040 g009
Figure 10. Example of the cyclic migration of sandbars (line H40).
Jmse 04 00040 g010
Figure 11. Relationship between crest and trough elevation.
Jmse 04 00040 g011
Figure 12. Relationship between bar height and crest elevation.
Jmse 04 00040 g012
Figure 13. Cross-shore migration of bars on each transect.
Jmse 04 00040 g013
Figure 14. Alongshore comparison of the sandbar configuration.
Jmse 04 00040 g014
Figure 15. Comparison of the plan shape of the crest lines.
Jmse 04 00040 g015
Figure 16. Temporal and spatial eigenfunctions of the first mode.
Jmse 04 00040 g016
Figure 17. Temporal and spatial eigenfunctions of the second and third modes.
Jmse 04 00040 g017
Figure 18. Reconstructed variation by the superposition of the second and third modes (Z23 = C2e2 + C3e3).
Jmse 04 00040 g018
Figure 19. Comparison of shoreline variation within the original survey record, reconstructed variation by the superposition of empirical orthogonal function (EOF) results up to the third (Z1-3 = C1e1 + C2e2+ C3e3) and fifth (Z1-5 = C1e1 + + C5e5) modes.
Jmse 04 00040 g019
Figure 20. Examples of cross-shore profiles when net offshore migration (NOM)-related modes indicate shoreline retreat.
Jmse 04 00040 g020
Figure 21. Examples of cross-shore profiles when NOM-related modes indicate shoreline advance.
Jmse 04 00040 g021

