1. Introduction
The influence of biological agents in rocky coastal landforms shaping has been recognized for a long time [
1,
2,
3,
4,
5,
6,
7,
8]. Virtually, biota may exert a bioerosive, bioprotective, or bioconstructional role on rocky coasts. In this paper, we focus on bioerosional and bioprotective effects of biota on coastal rocks, considering both of them as part of the “bio-remodeling” effect, and discuss the importance of a quantitative understanding of their role. Bioconstructors as well as borers operating on reefs are neglected, as processes and rates are quite different [
9]. A valuable quantitative approach to erosion on biogenic rocks is provided by Moses [
10].
Due to the high population density in coastal areas and the cost of coastal planning, bio-remodeling represents a relevant problem which has been neglected in the recent literature on coastal management, focused mainly on beach erosion [
11]. Providing an updated conceptual model of biotic agency on coastal rocks, Naylor
et al. [
12] suggest that future research in this field should be aimed at providing quantitative estimates of this process in different contexts, in order to assess its contribution to the global sedimentary budget. In this sense, it is crucial to identify the best methodologies suitable for tackling this issue with a strictly quantitative approach.
The aim of this paper is thus to revise the different methodologies employed in the quantification of the effect of biotic agents on rocks exposed to coastal morphologic agents, comparing their efficiency and inferring specific indications useful for the wide community of scientists working in the coastal environment (engineers and, in a broad sense, all environmental scientists). Literature on biotic agents on coastal rocks has been revised, focusing on quantitative assessments and on methodological approaches. In some cases, quantification should be considered in a relative sense as, e.g., the estimate of a percentage due to bioerosion of overall weathering. As a complement for this review, we provide new and partly unpublished data, suggesting possible additional methodologies, based both on experimental and computational activities.
Rocky shorelines are shaped by a suite of weathering processes (physical, chemical, and biological) that operate on them, reducing the resisting force of rock (FR). Weathering processes affect the coastal profile being scaled in importance according to their elevation with respect to mean sea level (see [
13], Figure 7.3). Among them, bioerosion and its counterpart bioprotection (on the whole “bio-remodeling”) are recognized as playing a relevant role in the intertidal and lower midlittoral zones [
12], but their efficiency long- and cross-shore still needs to be thoroughly defined. In the midlittoral zone, biodiversity is maximized due to the density of biomass colonizing rock surfaces [
14]. Here, a variety of biota displays different activities on rocks, the rate and magnitude of each depending on both ecological factors and environmental constraints.
Since the term “bioerosion” was introduced by Neumann [
1] for the coastal environment, the contribution of biota to the weathering processes affecting coastal rocks has been evaluated by many authors. The papers of Schneider [
2], Trudgill [
4], and Torunski [
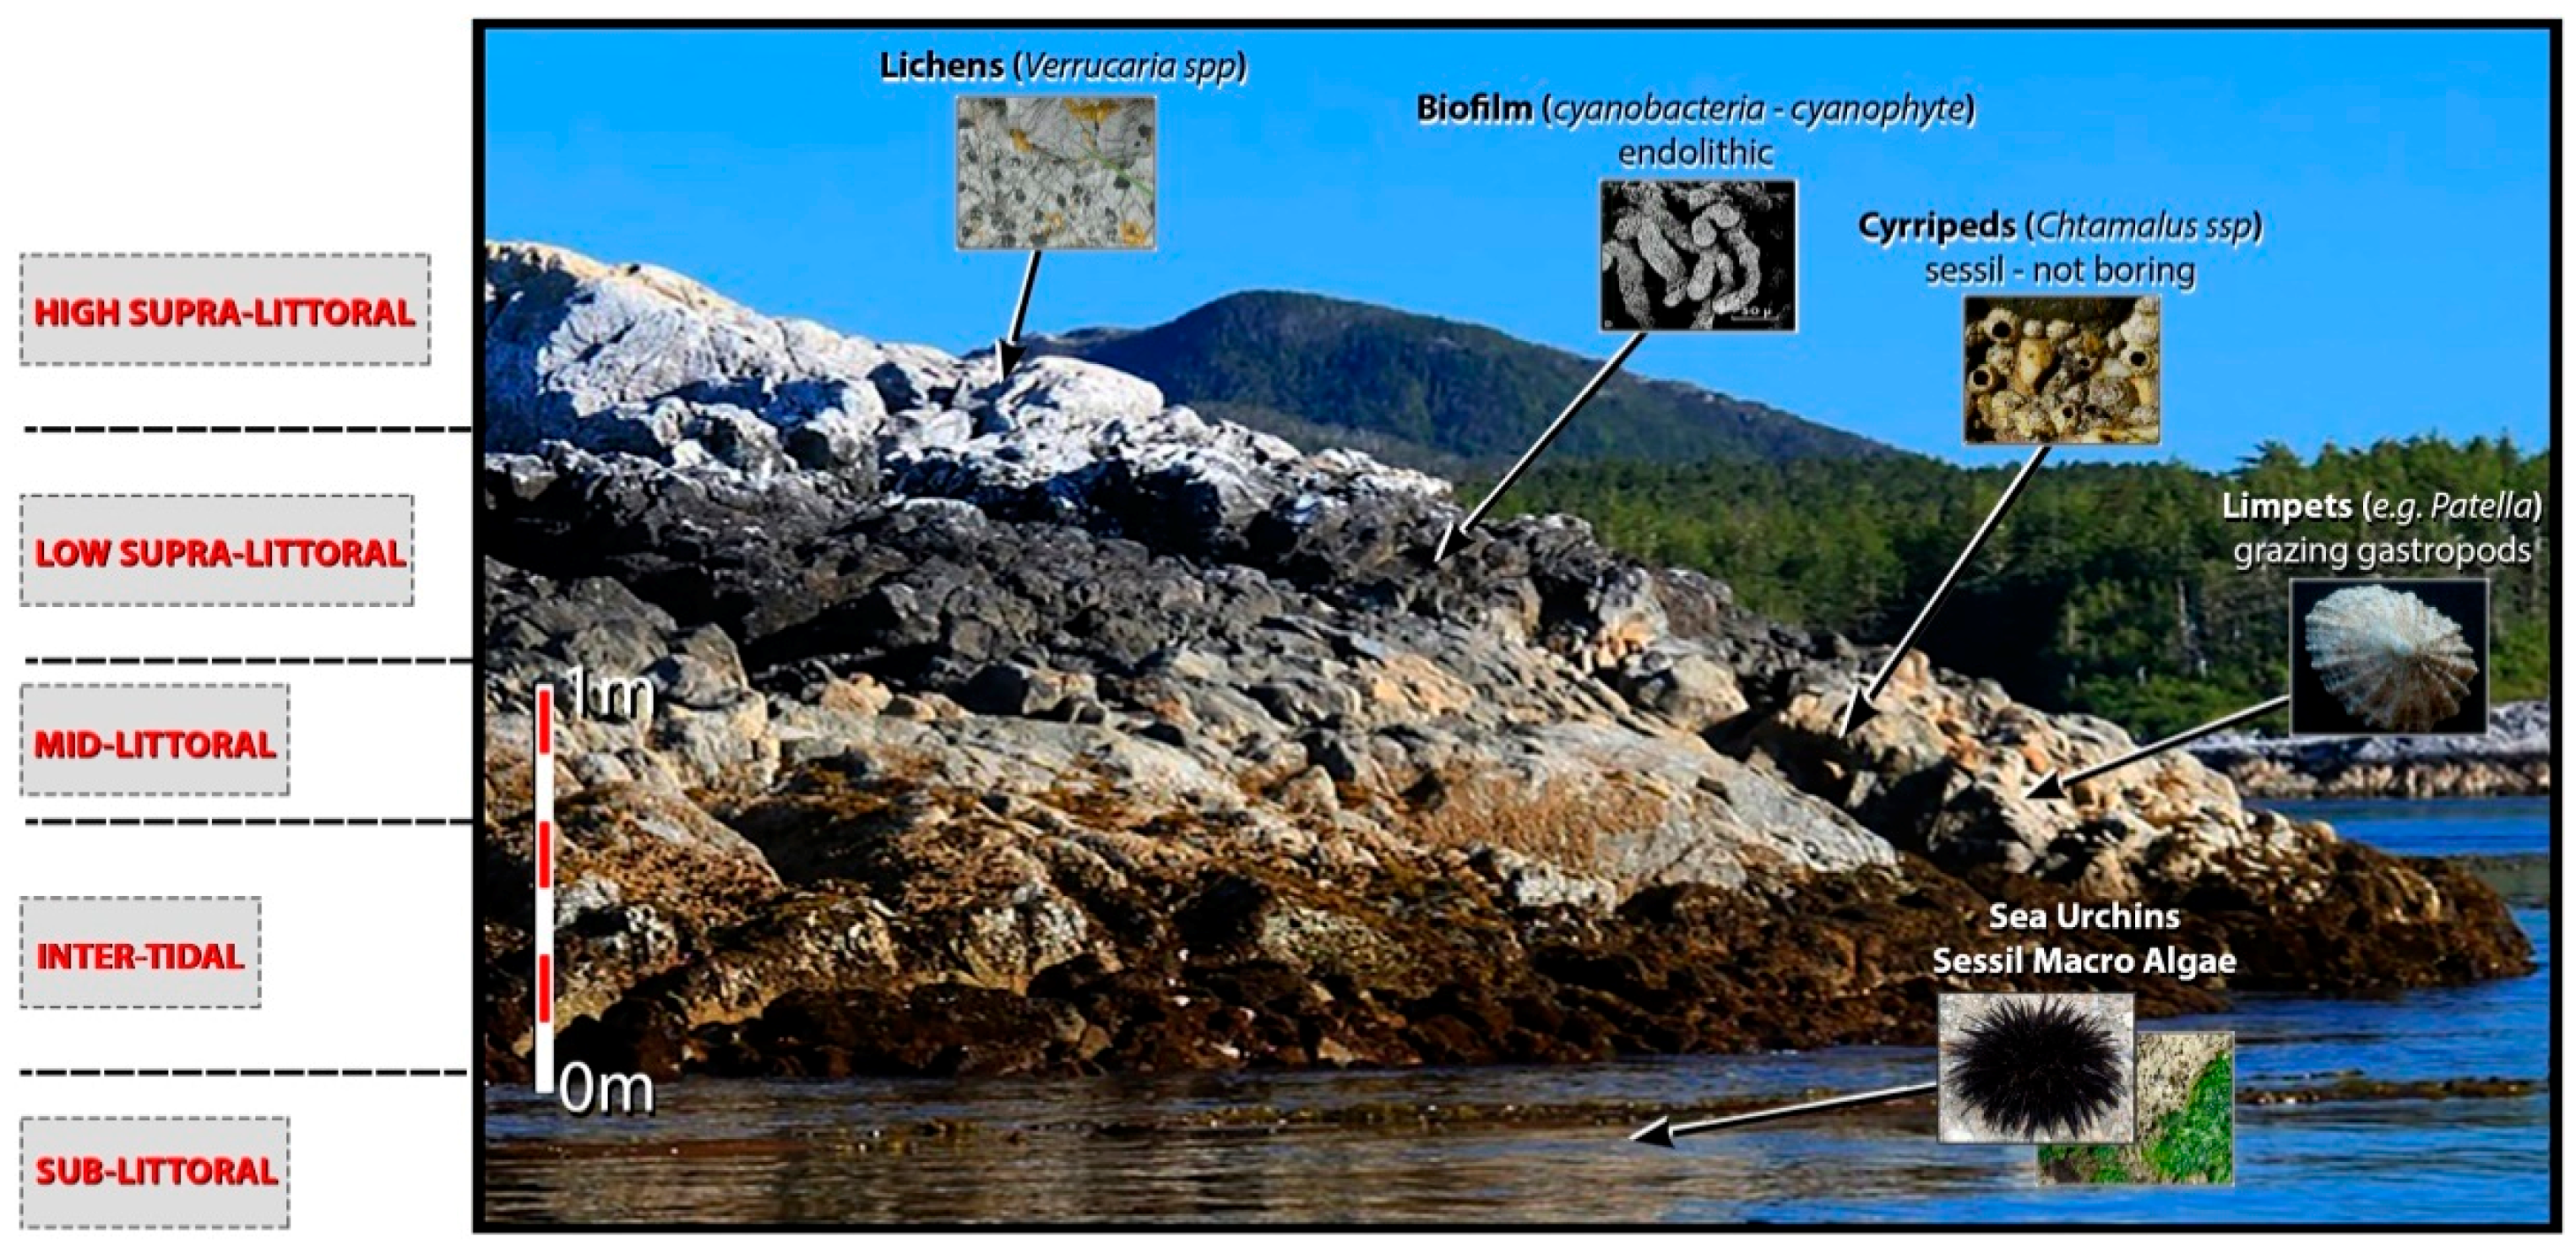
3] still represent the classical reference studies and constitute the fundamentals for any bio-process approach to geomorphological studies of rocky coasts, although limited to limestone shores. These works assess the concept of biological zoning of rocky shorelines,
i.e., the distribution of groups of biota in horizontal bands, scaled with respect to elevation from sea level (
Figure 1). Sea level being, as a matter of fact, a virtual concept, as its elevation with respect to an extraterrestrial reference system is permanently fluctuating in space and time [
15], we refer in this work to “mean sea level”,
i.e., the reference ordnance datum of the official Italian Elevation Network. Biological zoning implies a cross-shore variation in the rate of erosion due to biota, which is determined by strictly ecological factors [
16,
17,
18].
2. Methods
The literature existing on bio-remodeling (see [
12,
19,
20] for comprehensive reviewing) is huge, even if limited to the coastal environment. In this work, we focus on those papers that provide “quantitative” estimates of the effectiveness of the geomorphologic action of this process on rocky shorelines. The authors of this work having quite different cultural backgrounds, it was important to rigorously fix the criteria for the selection of those data that is considered in this review. In particular, it was necessary to assess what we accept as a “quantitative” datum due to the object of our investigation, which is complex, as all natural phenomena are. Those works investigating how different types of biological cover influence weathering rates and types and according to which patterns this interaction changes in time and space, albeit relevant, were properly considered qualitative and thus not included in this review. Many papers provide estimates of the effectiveness of bio-remodeling inferred from proxy data that may be represented by physical or chemical parameters not related to the rock itself,
i.e., not geotechnical in a broad sense. Although extremely relevant from a general point of view, these papers tackle issues that are beyond the focus of this work. Our selection includes only those papers that isolate the sole biological contribution from overall weathering in order to measure it, at least as a percentage of the overall weathering rate. In doing this, we follow the indications of [
12] about aiming to unravel the contribution of bioerosion to coastal sediment budget.
In addition to this analysis of published works, an essay of some novel approaches is proposed to the reader based on original case studies. The specific working methods of each case study are illustrated in the dedicated paragraphs.
3. Review of Published Works
In this section, we summarize the popular research methods for estimating bio-remodeling in the coastal environment and highlight their efficiency and limitations in certain aspects. Bioerosion and bioprotection is examined separately; in fact, a number of works aimed at quantifying the former have been carried out through times, whereas bioprotection has seldom been highlighted and almost never quantified. The main problem in estimating bioerosion is unraveling its effect from other weathering processes acting on rocky coasts. The common approach to tackle this issue is focusing research in those parts of the coastal rock where bioerosion is thought to be the dominant process so that the other processes can be neglected. The most relevant quantitative work carried out in the past century is summarized by Schneider and Le Campion-Alsumard [
21].
Different methods have been employed to quantitatively assess bioerosion. Apparently, grazers are biota with an overall easier quantifiable erosive role on rocky coasts. The first works on this topic date back to the 1960s [
22]. The problem of estimating the bioerosive effect of grazers can be approached using a direct or an indirect method. The latter relates the amount of grazer fecal pellets production to rock erosion rate. Working on the Adriatic coast, [
3] and [
16] sampled fecal pellets from the different biota, such as the gastropods
Monodonta and
Patella and the sea urchin
Paracentrotus. They produce abraded particles whose grain size is determined by their boring pattern. Erosion rates were estimated on average 1 mm/year with a variability pattern depending on coastal zonation. More case studies based on an indirect approach to the quantification of the effect of grazers are provided among others by Abensperg-Traun
et al. [
23] and Andrews and Williams [
24]. Fornos
et al. [
25] worked on three different grazers living along the calcareous coasts of Mallorca (Spain),
i.e., the gastropods
Melarapheneritoides,
Monodonta turbinate, and
Patella rustica. Through field observations and biota manipulation in the lab, they infer the amount of rock eroded by each of the grazers by measuring the amount of fecal pellets produced, in order to determine the amount of rock ingested. The daily quantity of rock eroded by an organism was converted into an erosion rate (mm/year) for a single species of grazer, multiplying the yearly amount of fecal pellets produced daily by an organism per the average density of that biota.
Patella proved to be the most efficient eroder, determining erosion rates exceeding 0.5 mm/year. The validity of this approach was recently assessed by Vidal
et al. [
26]. Trudgill [
4] and Trudgill
et al. [
6] worked out an indirect method to measure the contribution of grazers to overall erosion, combining an estimate of the grazed area with the average depth of incision. This method is efficient as it provides a quantitative estimate of the input into the sediment budget of mineral particles deriving from grazer bioerosion. Its limitations are that it can only take into account a specific portion of the global process of bio-remodeling.
A second methodology applied to quantitatively assess bioerosion can be used to estimate the overall contribution of biota, and not only of grazers. This approach employs the micro erosion meter (MEM, or TMEM in its instrumental evolution). This instrument provides high-precision measurements of erosion rates on exposed rocks [
27]. Based on repeated measurement of oblique coordinates, this instrument proved suitable for getting records of coastal retreat, especially on limestones. For a review of destruction rates obtained in different environments on carbonate rocks, see Furlani
et al. [
28]. Apart from the technical constraints of the TMEM, the major limit of this method is that it is difficult to disentangle the contribution of bioerosion from that of all other weathering processes. Only a few authors, thus, used a micro erosion meter to measure merely bioerosion. Among them, Torunski [
3] measured the destruction rate on limestone bedrock along the Adriatic coast (Central Mediterranean) obtaining values around 0.1–1 mm/year, depending on variable exposure to wetting of the rock. This approach is recommended only in those cases in which the effect of bioerosion is with no doubt overwhelming. Nevertheless, Stephenson and Finlayson [
29] are rather positive in this sense, suggesting that experiments including specific manipulations (such as those with mesh bags) may be effective in polygenetic environments. More recently [
18] used, in Southern Portugal, TMEM repeated measurements combined with other methods (measurement of the volume of macroborer-produced cavities and of the bedrock strength) to test the effect of biota on rocks. This approach compares rates of downwearing obtained from rock patches in the same environmental conditions but with different biological covers. Results highlight a negative correlation between TMEM downwearing rates and the amount of algae covering the rock. A recent work along the French Mediterranean coast [
30], although not providing a quantitative assessment of erosion rates, quantitatively approaches the role of biofilm in mediating the degrading effects of microclimatic changes on coastal rocks. The quantification is provided by micro-topographic change of the rock surface measured through the TMEM.
A further method for quantifying bioerosionrelates to the loss in weight of experimental trials,
i.e., rock chips that can be manipulated both in the natural environment [
31] and in the laboratory [
32]. The latter measured an increase in weight due to biologically produced calcium carbonate in freshly cut limestone and eolianite exposed in the laboratory to sea water for a few months, whereas previously exposed rock chips underwent, during the same time span of exposure in the laboratory, a reduction in weight, which was related to bioerosion. Similarly, Trudgill and Crabtree [
5] performed conventional calculations of rates of downwearing by microborers of known age through exposure of test materials. Weathering assessment through weight changes of exposed rock blocks has been rather popular in the past (see [
31]). However, in this case, the main concern with this method is disentangling the effect of different processes.
Another type of investigation involves microscopic scale observations and measurements. Radtke
et al. [
8] provide a critical review of the work that has been done to highlight bioerosion at the microscopic scale up to the end of the twentieth century. In this century, this type of approach has been employed by some authors, providing robust quantification of the action of borers. Naylor and Viles [
19] used three different microscopy techniques (
i.e., optical light, scanning electron, and laser scanning microscopes) to highlight the nanoscale features created on the surface and in the immediate subsurface of trial limestone blocks exposed for seven months at sea level in the natural coastal environment along the coast of Falasarna (Isle of Crete, East Mediterranean). Microscopic observation highlighted three types of features that could be related to biological weathering processes: (1) microborings; (2) biological etching; and (3) chemical etching, which are all mostly related to the biofilm development on the rock surface and, in particular, to blue-green algae (cyanobacteria). Estimates of the efficiency of bioerosion relied on measurement of the average borehole diameter (ranging from 6.1 to 6.4 μm) and average number (12–14 every 25 cm
2), and on the percentage cover of biological etching (60%–86%). Sticking to those features revealed by SEM observations, Coombes
et al. [
33] quantified the amount of weathering due to biota-rock interaction through the thickness of the penetration of euendolithic microborers and through the surface width and density of borehole entrances. These authors also highlighted the occurrence of biochemical crusts and of biological cryptoendolithic growths, which represent agents of facilitative bioerosion (
sensu Naylor
et al. [
12]) difficult to quantify. Finally, they relate the amount and type of biota-rock interaction to the bedrock type, applying their experimental design in study sites in Cornwall (UK), to natural bedrocks of different lithology as well as to concrete. Naylor
et al. [
12] extends to macro-scale borers the method of estimating the bioerosive effect of microborers, measuring the size and frequency of boreholes and their depth of penetration to a genus of polychaete,
Boccardia.
Interestingly, microclimate elements monitoring [
33,
34,
35] has recently been used to provide a quantitative insight on the relationship between physical and biological agents responsible for coastal rocks shaping. This approach, although unable to provide direct erosion rates, deserves to be considered very promising for improving our comprehension of geomorphic processes driven by biota and addressing future research aimed at quantifying such processes.
4. Bio-Remodeling: A Geological Approach
Employing geological methods to assess and quantify bioerosion has been suggested by Naylor
et al. [
12]. Rock hardness/strength changes assessment may provide a quantification of bioerosion [
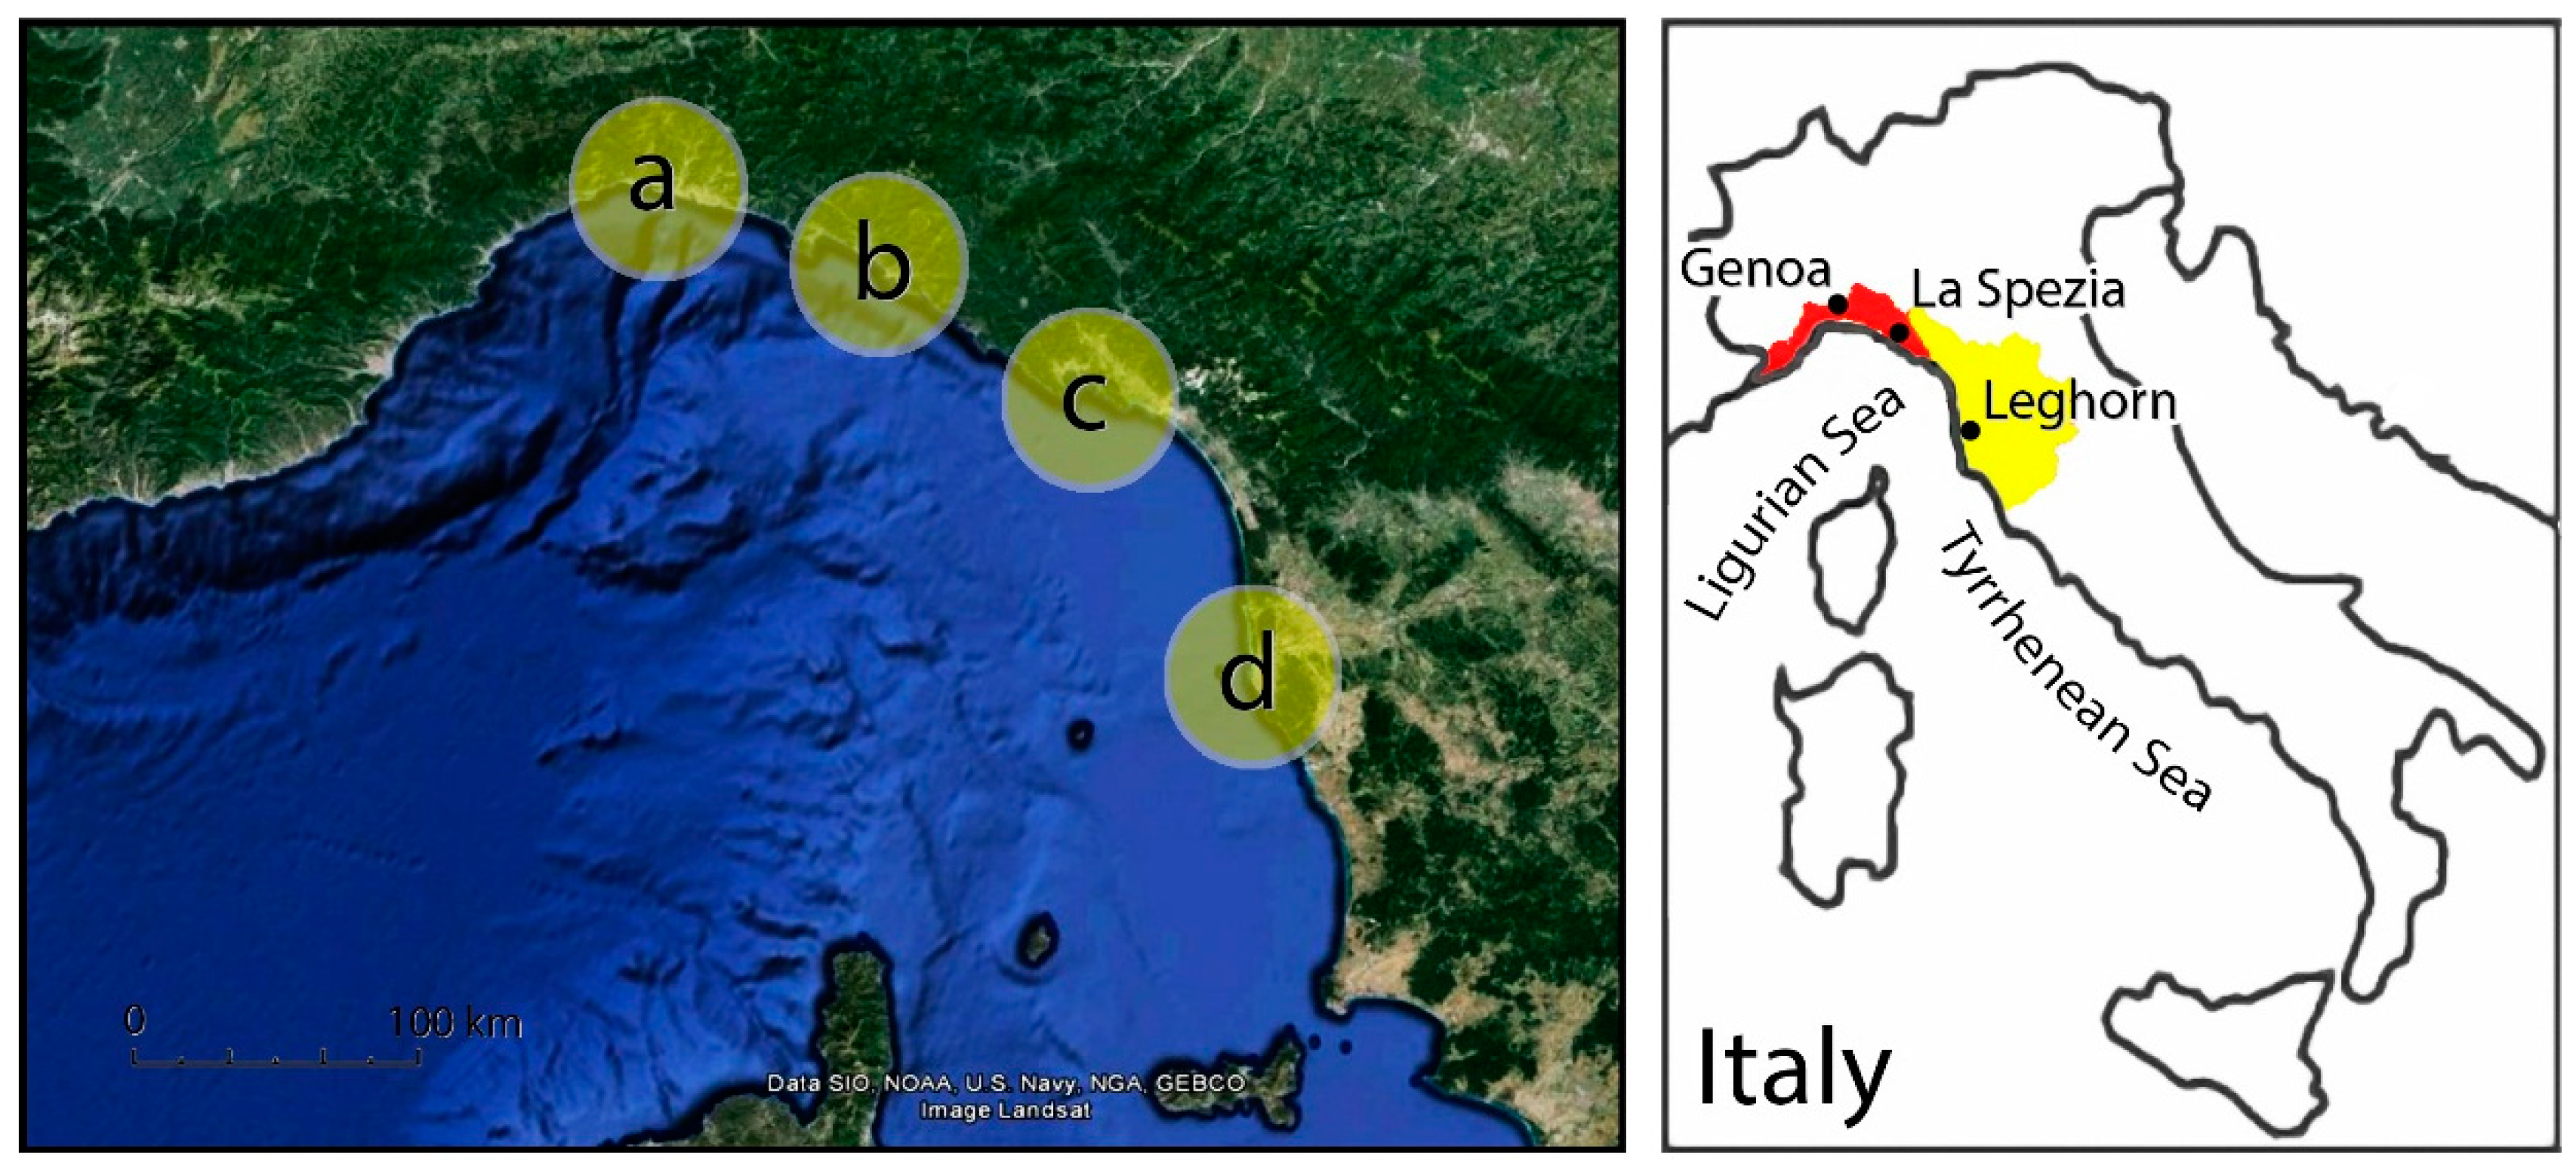
36], although mostly providing a relative estimate of the contribution of biota to surface weathering. In this section, we illustrate some experiments carried out by some of the authors of this paper in order to highlight the differences in rock hardness between coastal rock surfaces differently affected by the presence of biota. Our preliminary experimental evidence come from Schmidt hammer testing on a number of sites along the coast of NW Italy stretching for
ca. 300 km; their main features are reported in
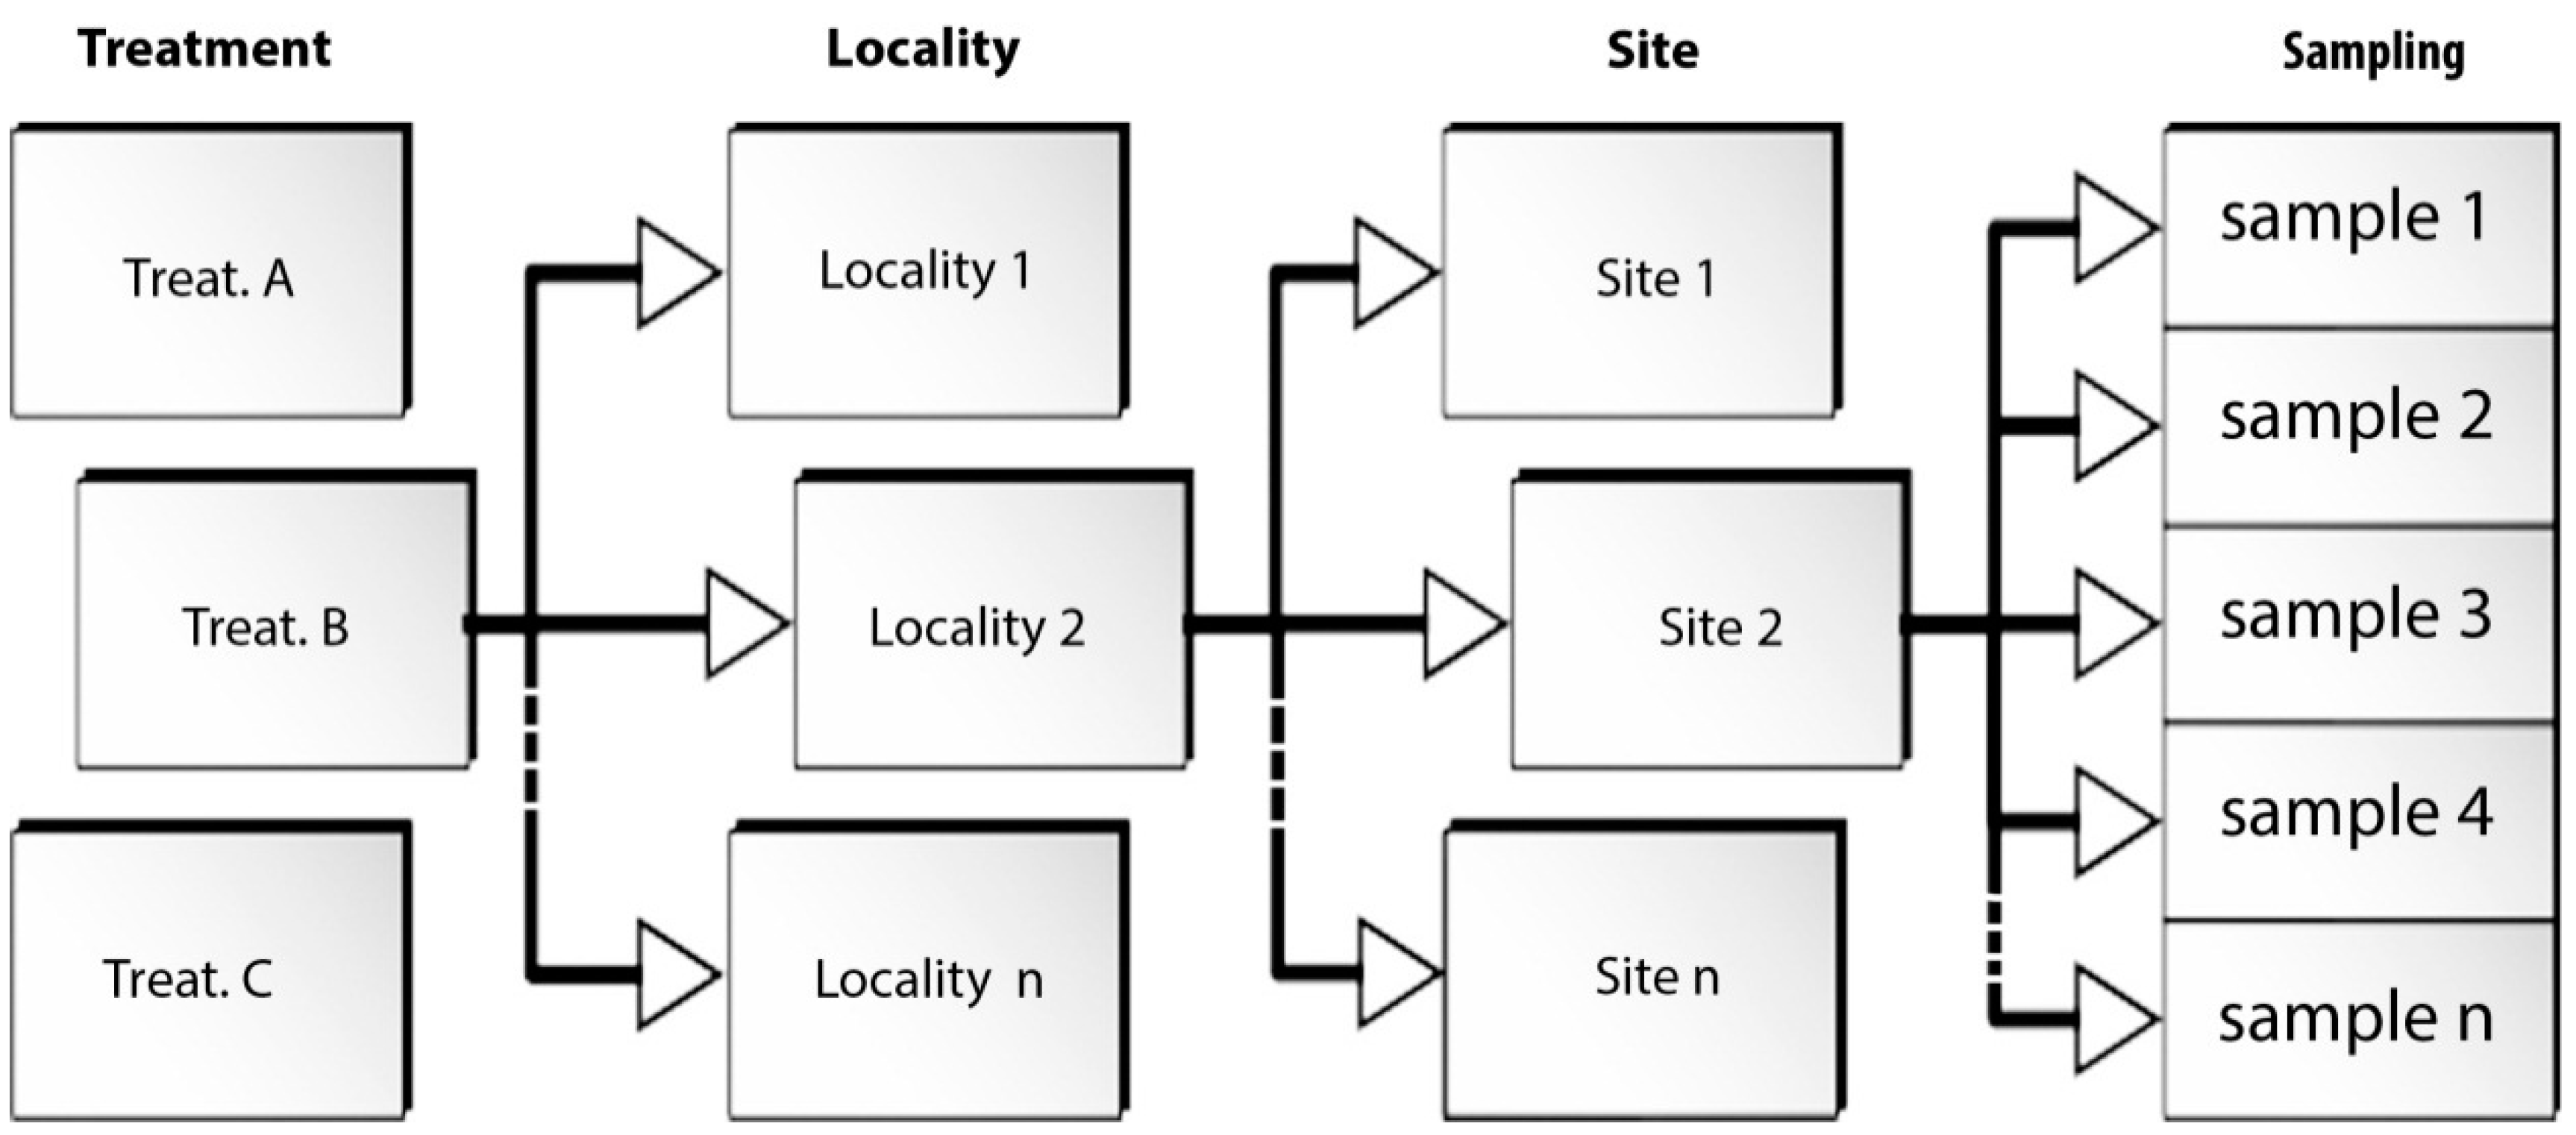
Figure 2. Data collection followed a preordered spatial arrangement (
Figure 3), worked out in order to facilitate the employment of some of the data in different experimental designs and maximize the efficiency of their subsequent statistical treatment. The whole coastal tract was split into two study areas, represented by rocky littorals differently shaped, separated by a tract of sandy coast, which was neglected. In each study area, a number of localities were selected, each of which displays homogeneous geological features (rock type, fracturing degree) and almost constant exposure to incoming waves. Inside each locality two to five sites were identified; each site represents a basic unit of landform,
i.e., a “shore platform”. In geomorphology, this term is broadly used to indicate a polygenetic, sub-horizontal, or moderately seaward dipping rocky surface located in the midlittoral or lower supralittoral [
37]. For rock hardness assessment, the methodology proposed by Aydin and Basu [
38] was employed, based on an instrumental tool, the Schmidt hammer, which records the rebound distance of a piston connected to a plunger that is pressed against the rock surface by the operator, keeping a few cm away from rock discontinuities. The rebound distance is transformed into a dimensionless index known as the rebound value (
R) that provides a measure of the rock surface hardness. In the detail, within each site, a number of testing points are selected, the position and density of which depends on the experimental design. Inside each 10 × 10 cm sampling area (quadrat), 35 readings were taken with the Schmidt hammer. These were processed removing the lowest 10 and averaging the remaining 25. The final value corrected, for the effect of the dip of the device, represents the surface hardness of the rock in the testing point.
It had been demonstrated [
39] that, in one of the study areas (Eastern Liguria), small shore platforms can be subdivided in two portions, regardless of their bedrock type: a more seaward portion from mean sea level to an elevation of 0.5–4 m (depending on wave exposure), characterized by the extensive, often continuous patching of the surface by biofilm, and an upper portion in which biofilm is very scattered or absent. Visually, the two portions can be distinguished based on a chromatic difference; independently from the bedrock type, the lower portion is darker than the upper. Chelli
et al. [
39] tested the two portions of six shore platforms in Eastern Liguria with the Schmidt hammer and highlighted that the lower portion of each platform displays lower rock hardness than the upper one up to 17%, differences in most cases being statistically significant. This evidence suggest that weathering processes are more effective in the portion of the platform displaying a biofilm cover; it is thus sensible to hypothesize that biofilm may play a role in bedrock hardness lowering.
Further testing carried out along cross-shore transects highlighted a seaward-landward positive gradient of the rebound value (
R) within the portion of the platforms below the cyanobacteria patching upper boundary. Chelli
et al. [
40] tested this positive trend on five shore platforms in Eastern Liguria (Locality: Palmaria,
Figure 2), two of which were reshaped by quarrying activity in the 19th century and thus had been exposed to coastal weathering for less than 200 years. The reduction in mean
R value of the weathered rock surface was assessed separately for each upper and lower portion of each platform and compared to the values tested on artificially exposed, unweathered rock on the same landform. The reduction proved to be lower in the platform upper portion, ranging from 13% to 32%, whereas in the lower portion, extensively patched by biofilm, it ranged from 35% to 48%. Similar results were obtained for the natural and for the quarried rock surfaces; this reveals that the weathering processes in the study area have a fast evolution rate.
The increase in rock hardness with elevation from sea level should be related not only to the presence of the biofilm, but also to the simultaneous colonization of the littoral by different types of biota, acting at different elevations according to their ecological needs. The displacement of the different biota creates what is known as the “biological zoning” of rocky shores [
41,
42,
43]. In Eastern Liguria [
39], the biota affecting the rocky shores are represented by macroalgae dominating the sublittoral (
Figure 1), sharing their habitat with scattered sea urchins. A belt densely populated by a specific benthic community then characterizes the midlittoral, including grazers in the lower part (limpets, e.g.,
Patella spp. and other Gastropods) and barnacles in the upper part, belonging to the genus
Chthamalus spp. The supralittoral is dominated by a continuous patina of endolithic Cyanobacteria, and, above the sharp, upper boundary of this, Cyanobacteria spots are mixed with the lichen
Verrucaria adriatica in patches.
Preliminarily, a cross-shore variation in the rate of bio-remodeling can be hypothesized due to this biological zoning, but its pattern is not completely disclosed. In fact, for some of the biota colonizing the rock, a bioerosive effect has been demonstrated (in particular for the grazers and, partly, also for the Cyanobacteria within the biofilm, see
Section 3), but others, such as barnacles, play an enigmatic role ([
44]; see also Section 4.3).
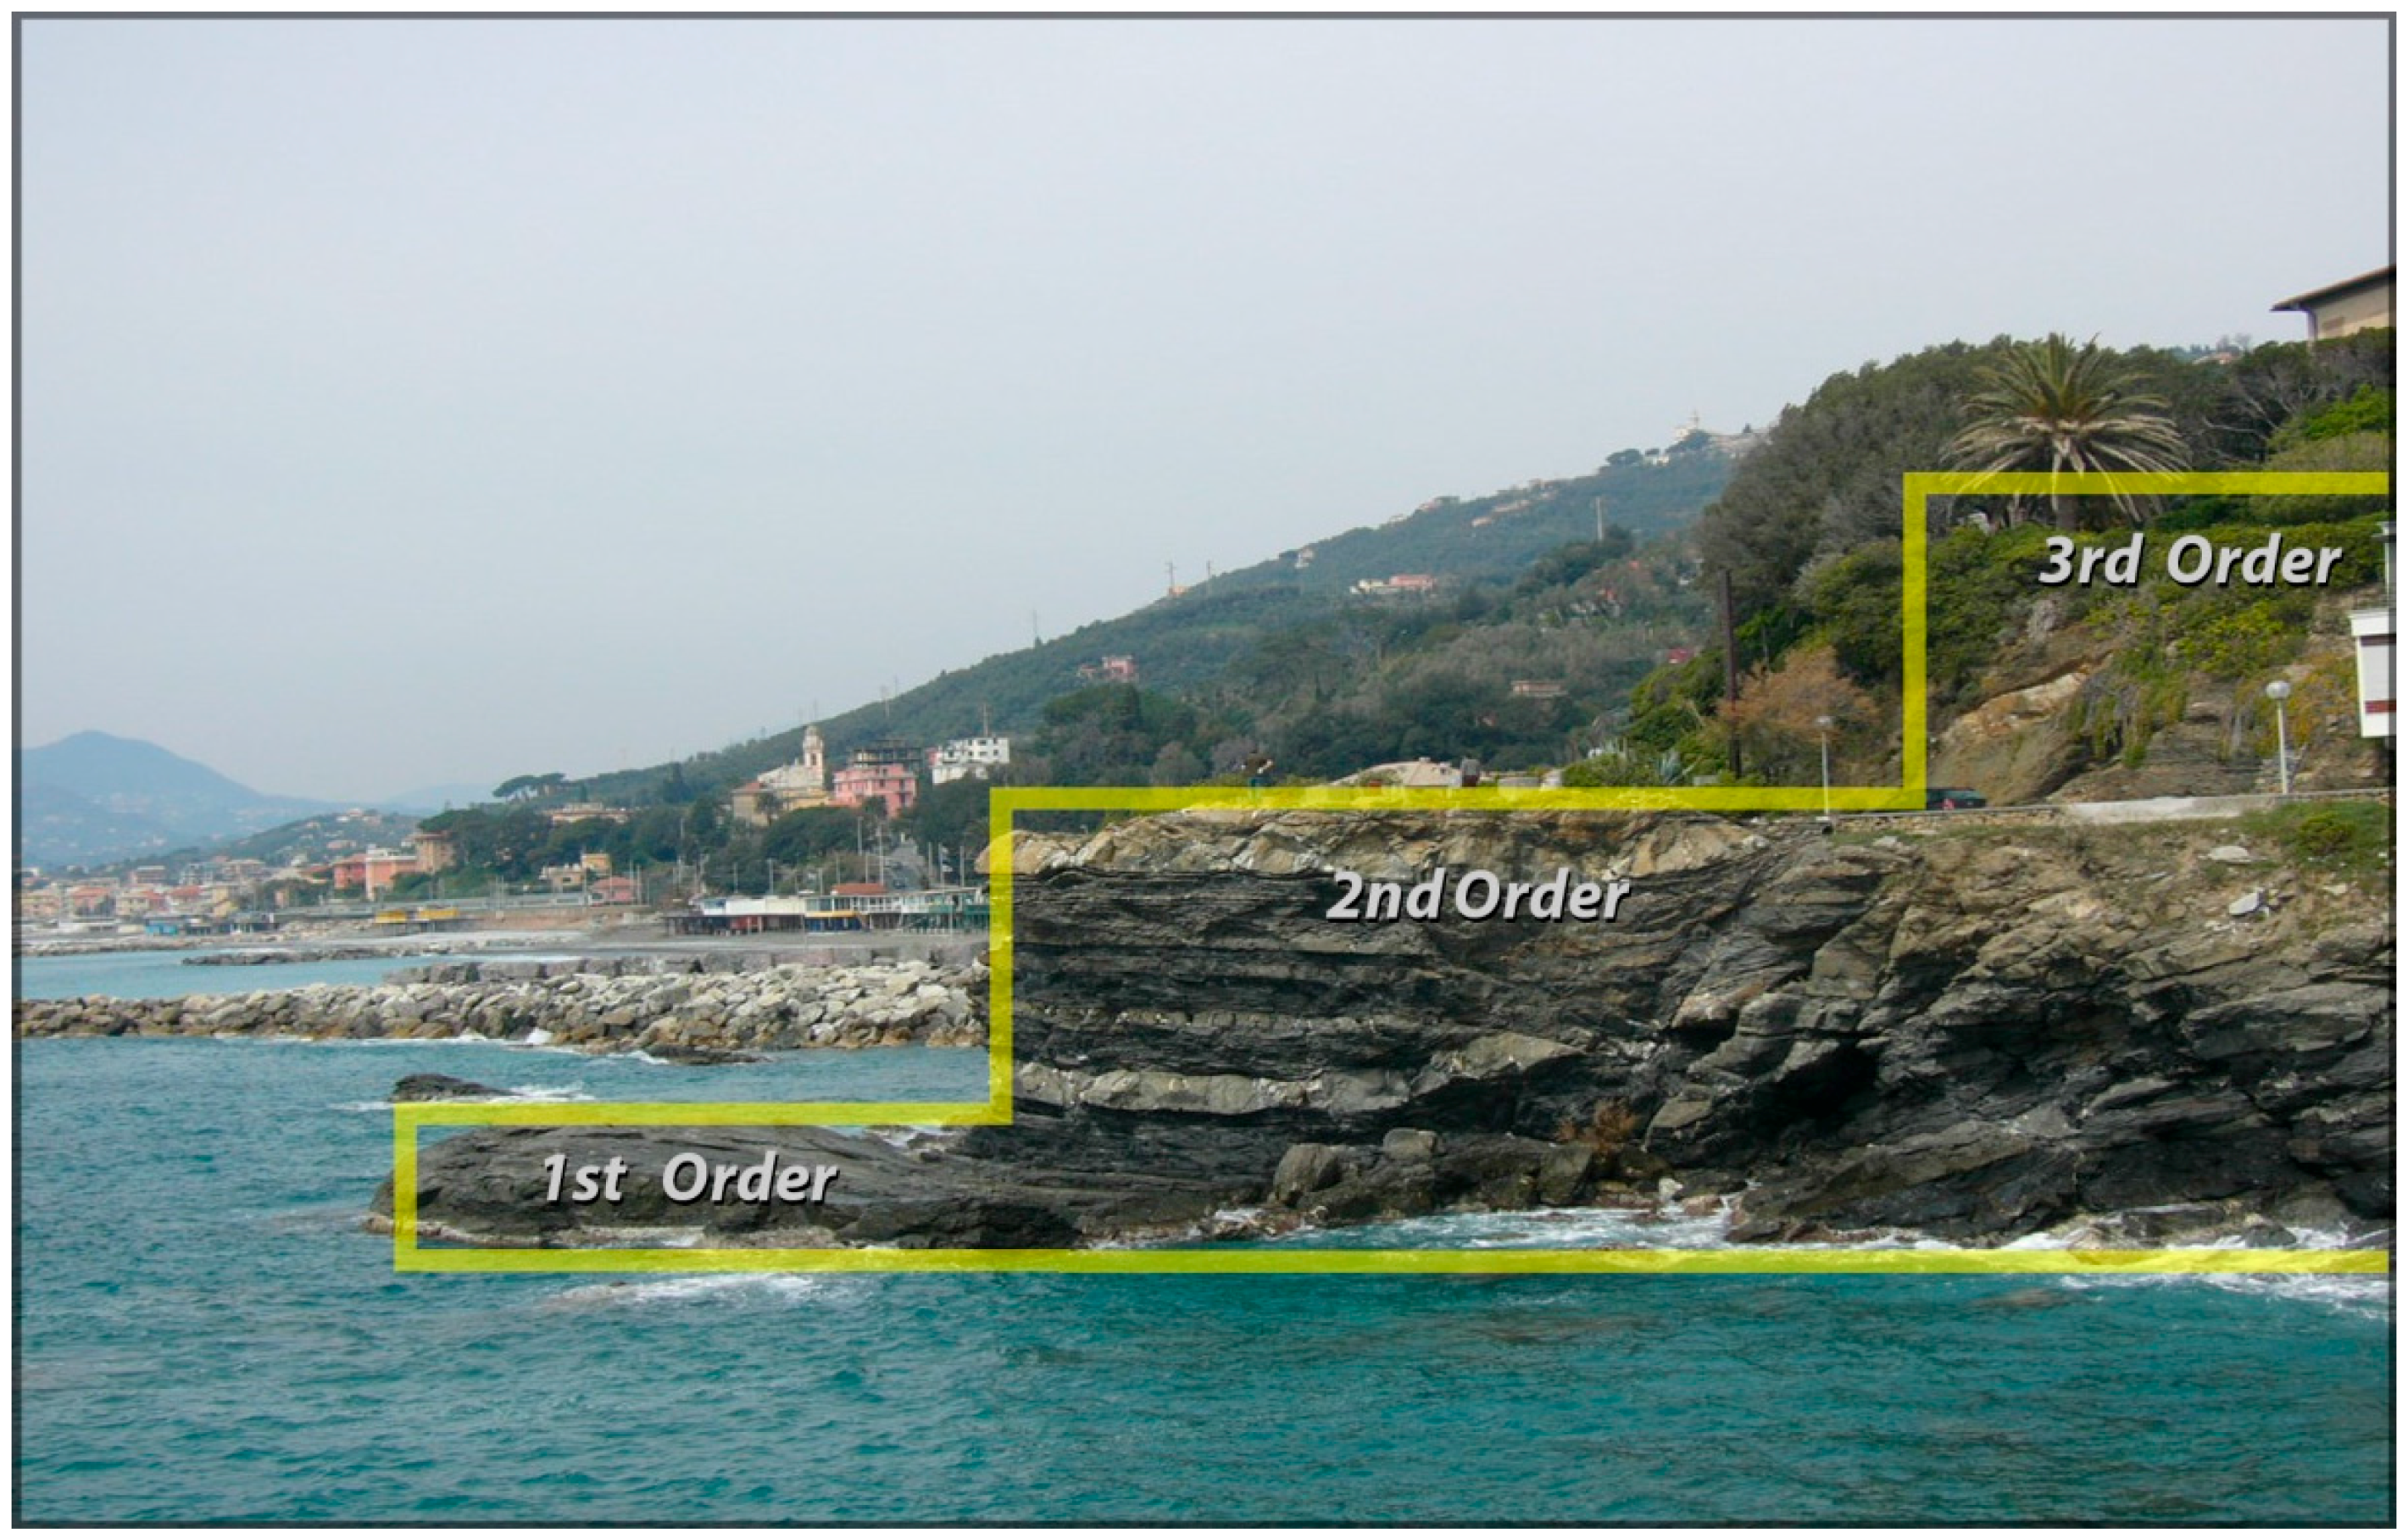
4.1. Comparison of Measured Rock Hardness between Platforms of Different Order (i.e., Different Elevation)
The purpose of this experiment was providing further evidence of the effectiveness of biota in decreasing rock hardness through a comparison of the mean rebound value tested on a group of shore platforms constrained in elevation within the low supra-littoral (first-order platforms) and another group of platforms, in the high supra-littoral, within the same coastal tract, ranging in elevation from 11 to 13 m above sea level (a.s.l.) (second-order platforms,
Figure 4). These should be considered inherited landforms [
45],
i.e., a counterpart of mid-supralittoral shore platforms that had been closer to sea level in the past and that are now above the ordinary reach of sea spray due to either tectonic uplift or to a relative sea level lowering [
46].
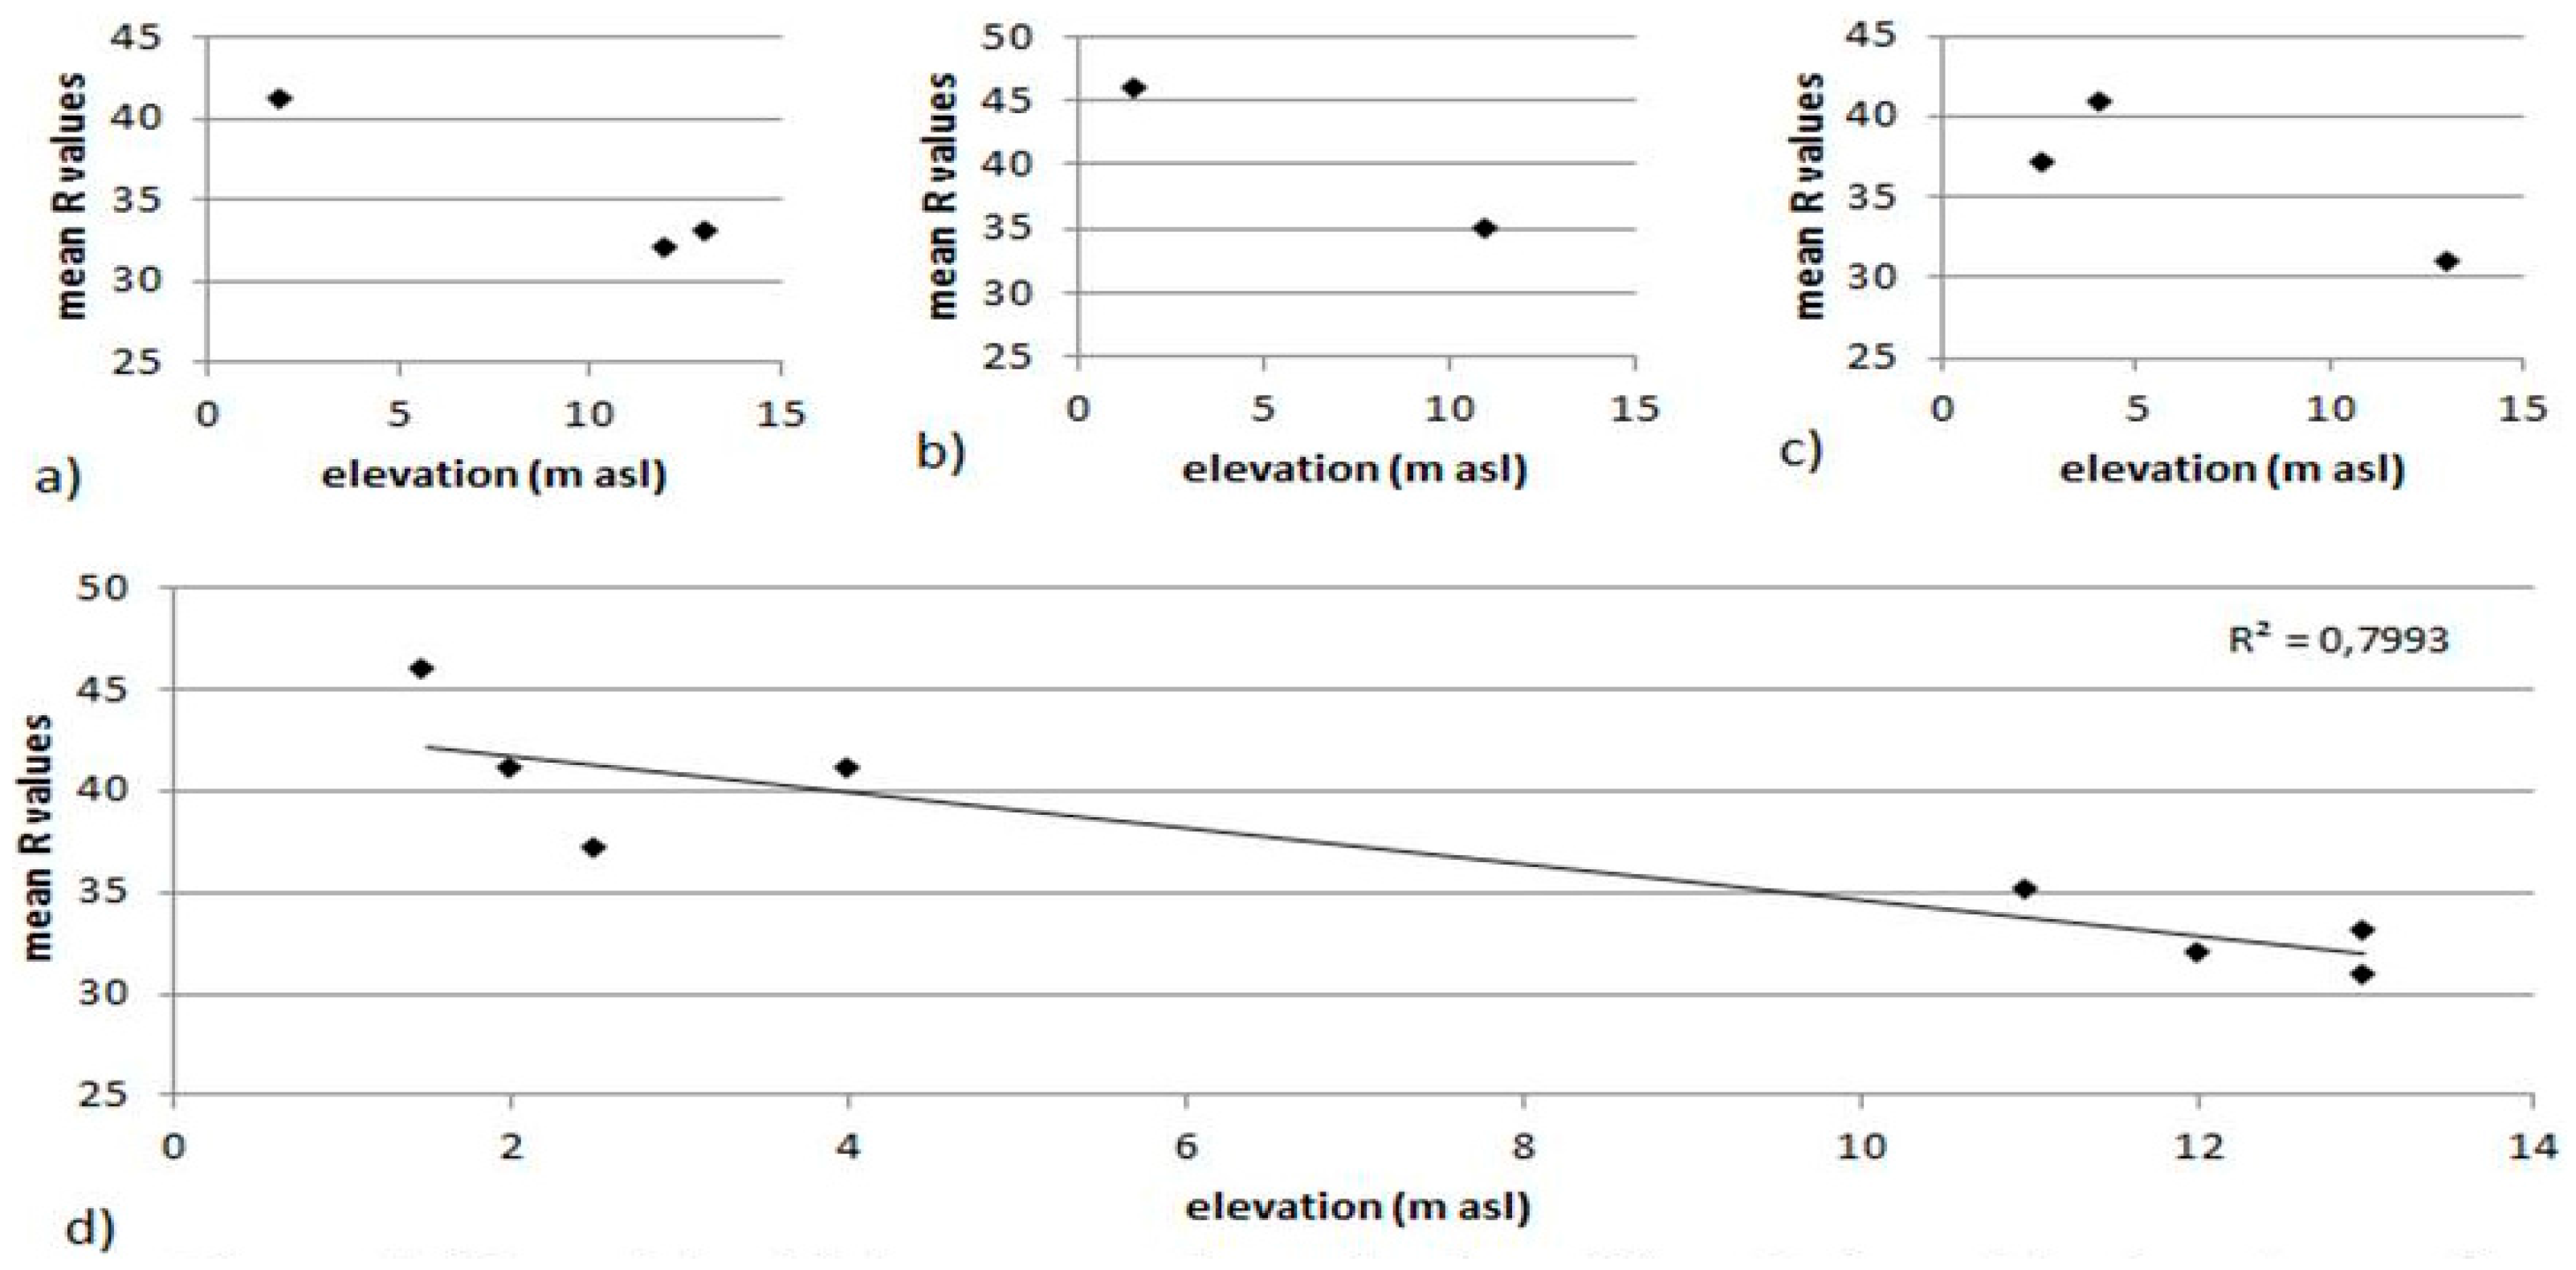
The activities were carried out in three localities of the Eastern Liguria study area, shaped in a flysch bedrock, namely, Castello Cirlo (CC), Villa Baldini (VB), and Villa Beatrice (VBE). Two to three platforms (each one considered one “site” in the experimental design) from each locality were tested, three to four for each order. On each of them, a number of testing points was randomly selected (approximately one point each 2 m
2 of surface), each of which yielded a rebound (
R) value. On the whole, 75 points were tested. Averaging the
R values of all the testing points within a platform/site the mean
R value for the platform/site was plotted against the platform elevation a.s.l. (
Figure 5).
A negative correlation between elevation and rock hardness can be envisaged.
R-values obtained from testing points of each platform/site were tested against those obtained from testing points of each other platform/site within the same locality using Student’s
t-test (95% confidence interval). Only mean
R values obtained comparing platforms/sites of different order are significantly different (
Table 1). This experiment demonstrates that platforms of a different order are significantly different from the point of view of weathering intensity and in particular that those of the first (lower) order, located in the low supra-littoral, are less weathered than those of the II (upper) order, constrained in the high supra-littoral. This difference can be quantified on average of the 20%. Being only the lower platforms affected by biota, we can confidently hypothesize that reduction in rock hardness in upper-order platforms is not due to the presence of biota (bioerosion), but to the persistence of abiotic weathering agents for a much longer time than they have been acting in the lower-order platforms.
4.2. Preliminary Assessment of the Contribution of Barnacles and Lichens to the Overall Platform Remodeling
Through this experiment, a preliminary attempt was made to explore the contribution to the platform bio-remodeling of Chthamalus spp. (barnacle) and Verrucaria spp. (lichen), the most common sessile organisms of the upper-midlittoral and lower-supralittoral zones in the study area of Eastern Liguria.
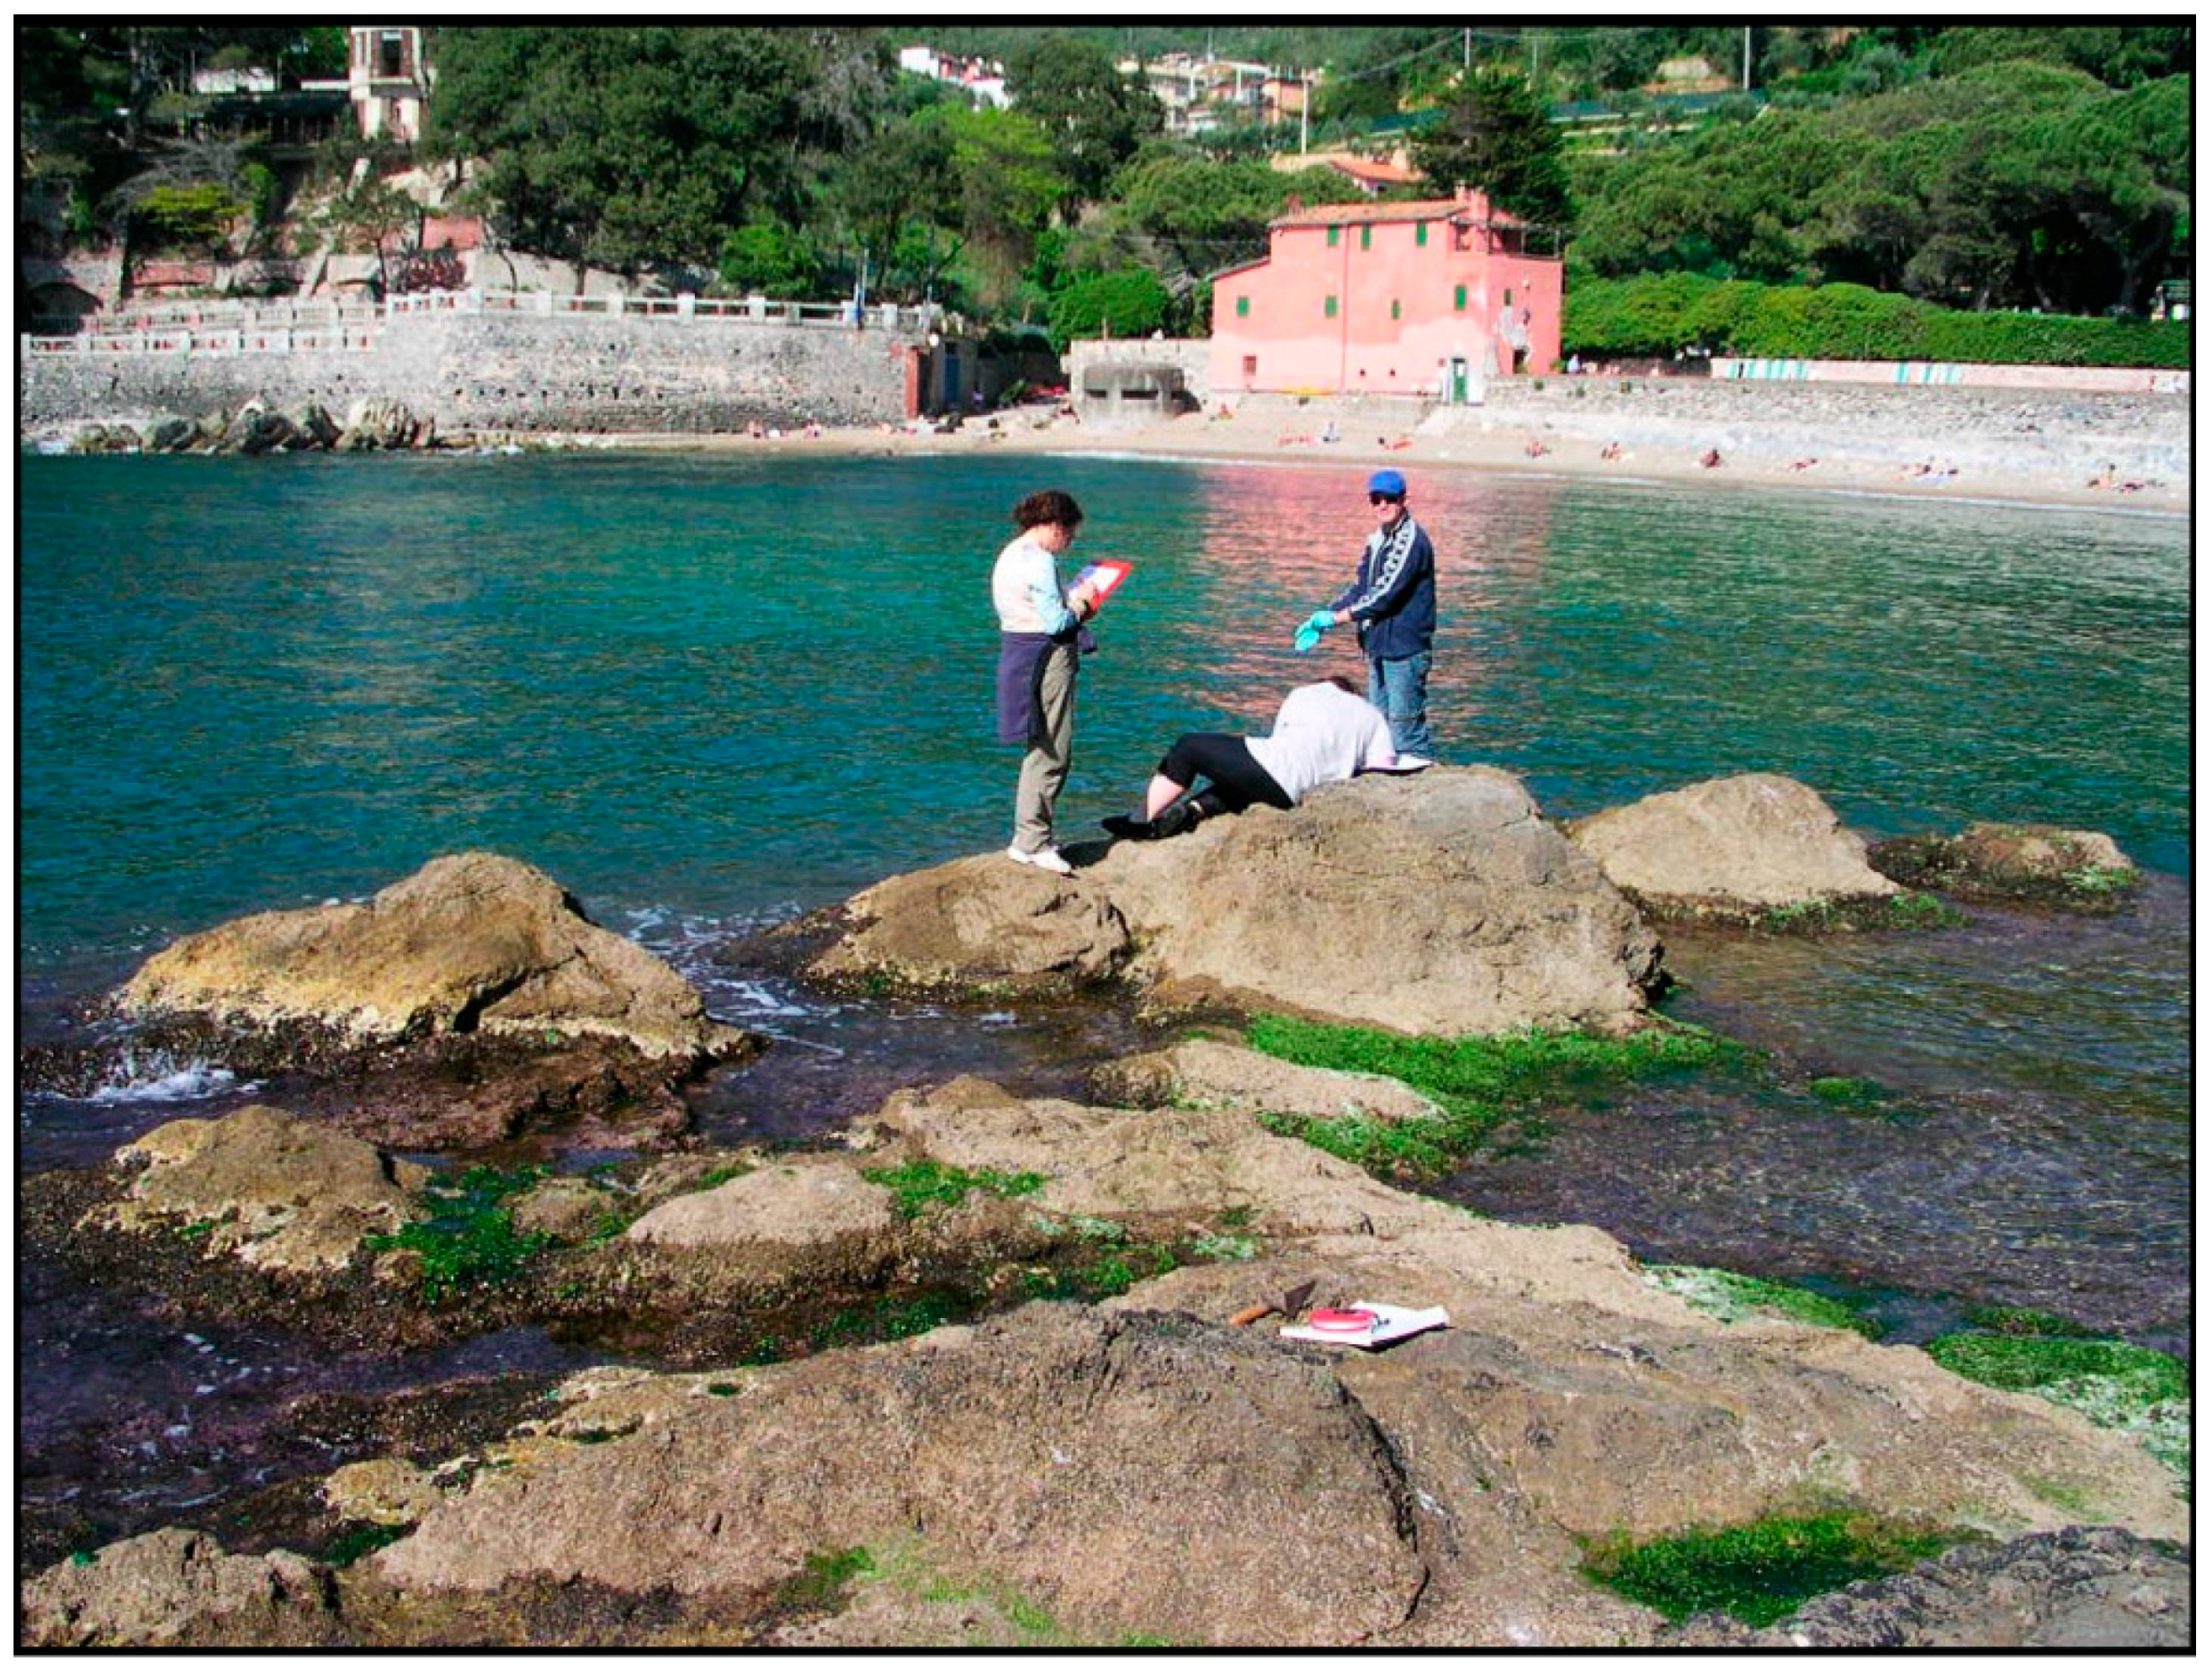
A simple experimental design, focused in a single locality (Tellaro), where the bedrock is represented by Upper Triassic-Lower Jurassic dolomites and limestones, was worked out, affected by a complex template of different fault systems [
47]. Testing was carried out on the two sites SS1 and SS5, each corresponding to a shore platform (
Figure 6). Exposure to incoming waves was the same, and the biota displayed a similar zonation pattern with the same organisms present at the two sites. A well-defined barnacle belt, constituted by a mixture of
Chthamalus montagui and
Chthamalus stellatus, is confined to a relatively small area of the shore. In fact, barnacles are concentrated within a belt with a width of approximately 30 cm, as expected for sheltered sites in microtidal environments [
48], which is located in the midlittoral slightly above it. Immediately above the barnacle belt, another area covered by cyanobacteria and
Verrucaria adriatica is present, stretched for approximately 0.5 m up to the upper boundary of the low supra-littoral. The uppermost part of the platforms (high supra-littoral) is covered only by patches of
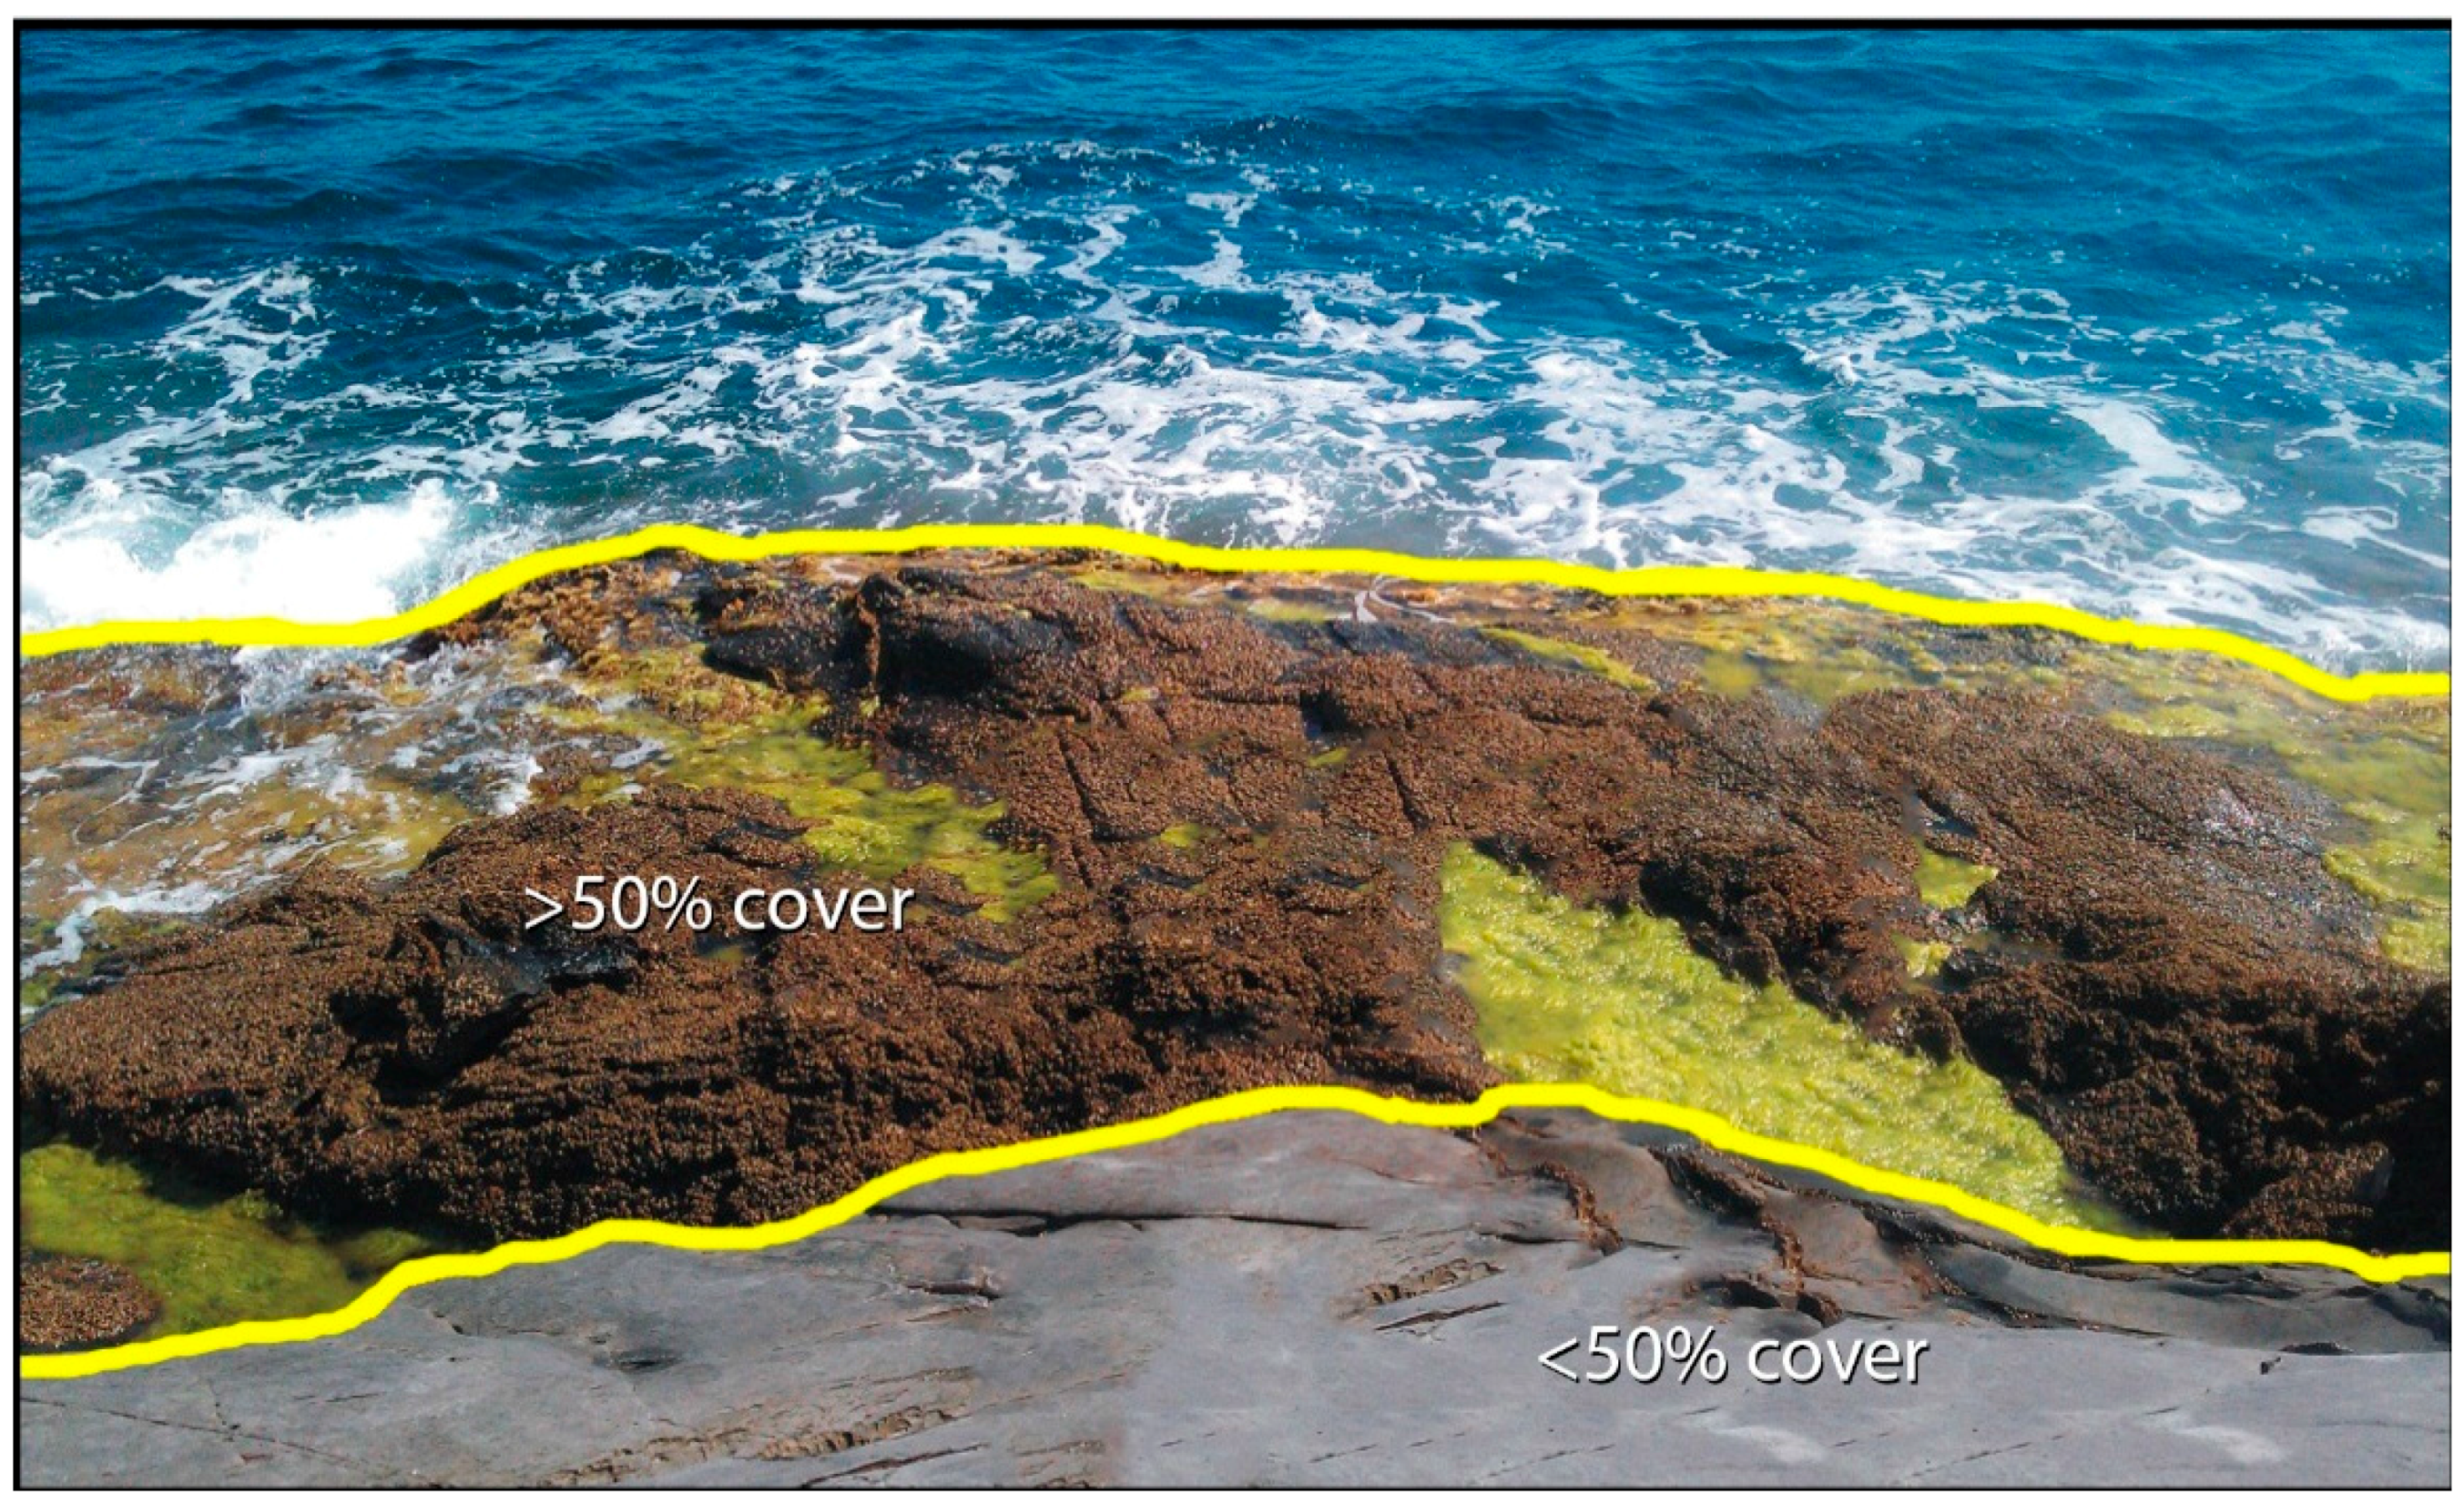
Verrucaria adriatica. Rock hardness was recorded in 153 testing points with a Schmidt hammer according to the methodology illustrated above; 81 testing points were located across the barnacle belt upper boundary and 72 in the high supralittoral. Measures of the biota cover percentage were combined to them,
i.e., in 10 × 10 cm quadrats, centered on each testing point. Biota measures were performed using the point intercept method [
49] that consists of counting the number of intercepts (out of 25 in total) that cover the target organism compared to bare rock. A stratified sampling strategy was adopted: The 10 × 10 cm quadrats were randomly selected in areas exhibiting an abundant (>50%) or scarce (<50%) cover of target organisms. Quadrats were distributed on open rock at two different heights on the shore: in the barnacle belt and in the upper part of the supralittoral zone where the lichen
Verrucaria adriatica is the main representative. Measures were recorded by hammering directly on the substratum except for those areas exhibiting an abundant
Chthamalus spp. cover. Here, prior to the employment of the Schmidt hammer, we carefully scraped off barnacles from the quadrat while making sure not to damage rock surface.
Verrucaria was not scraped off as the very first piston impacts apparently destroyed it.
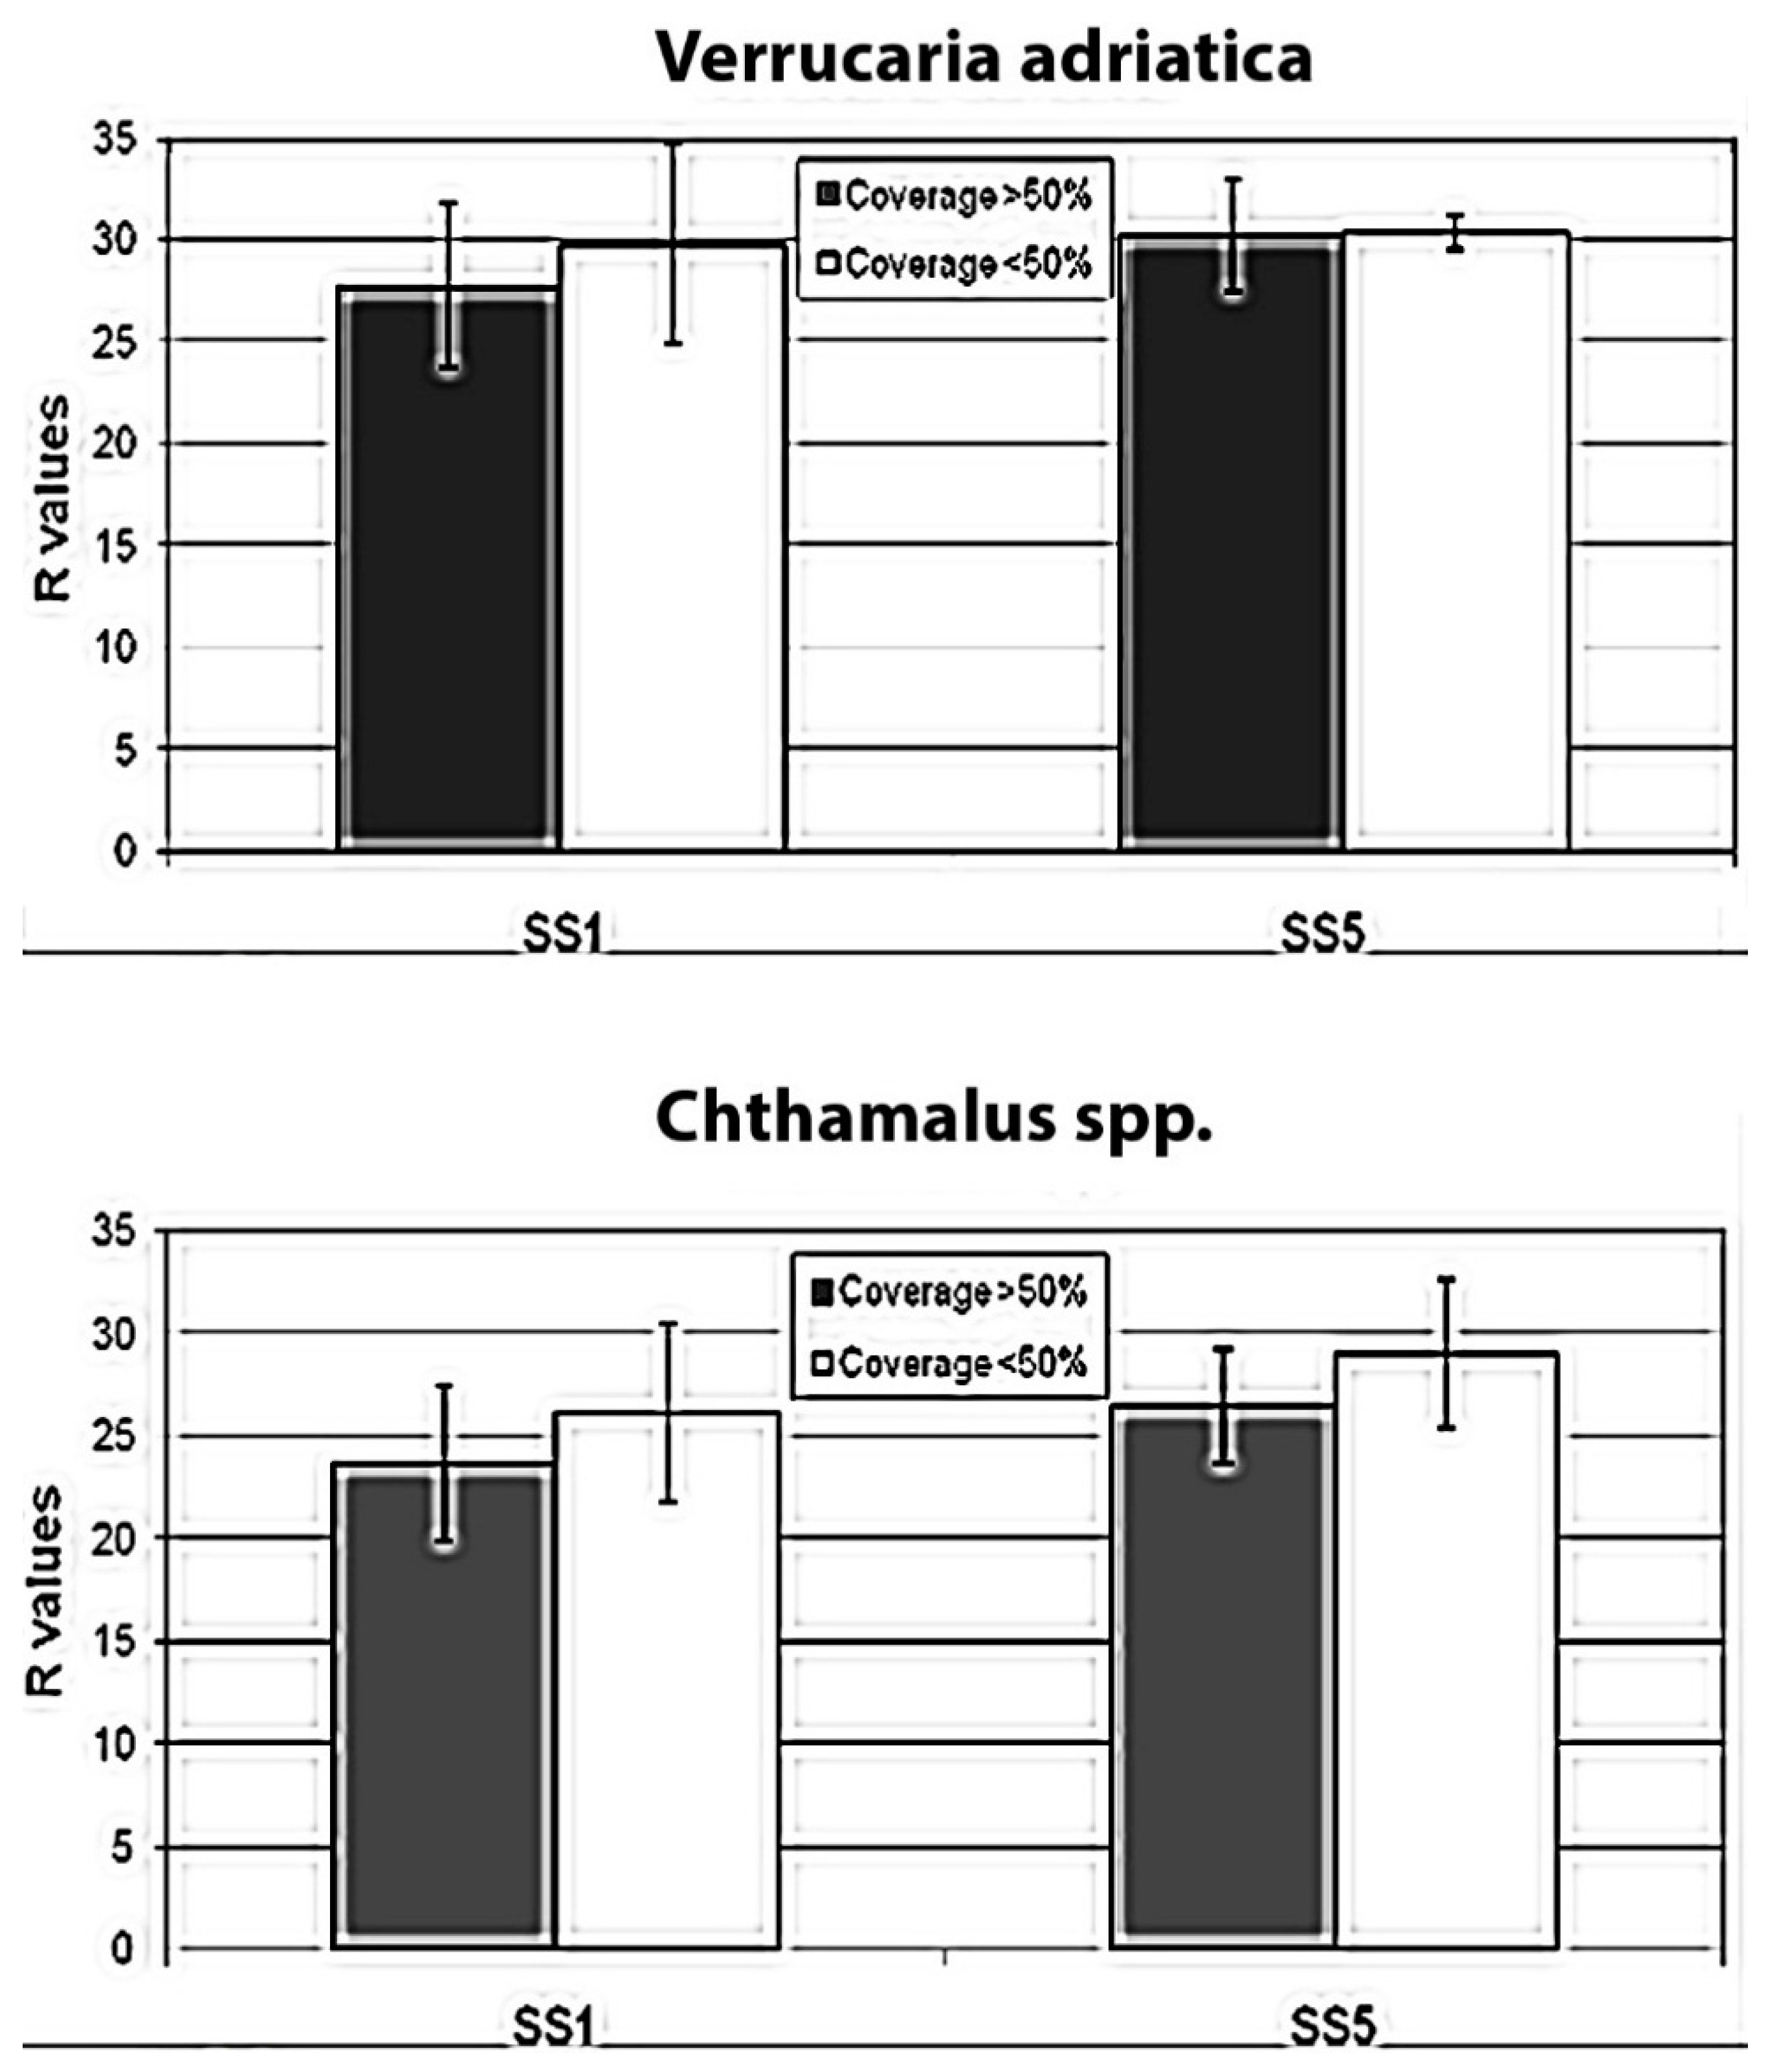
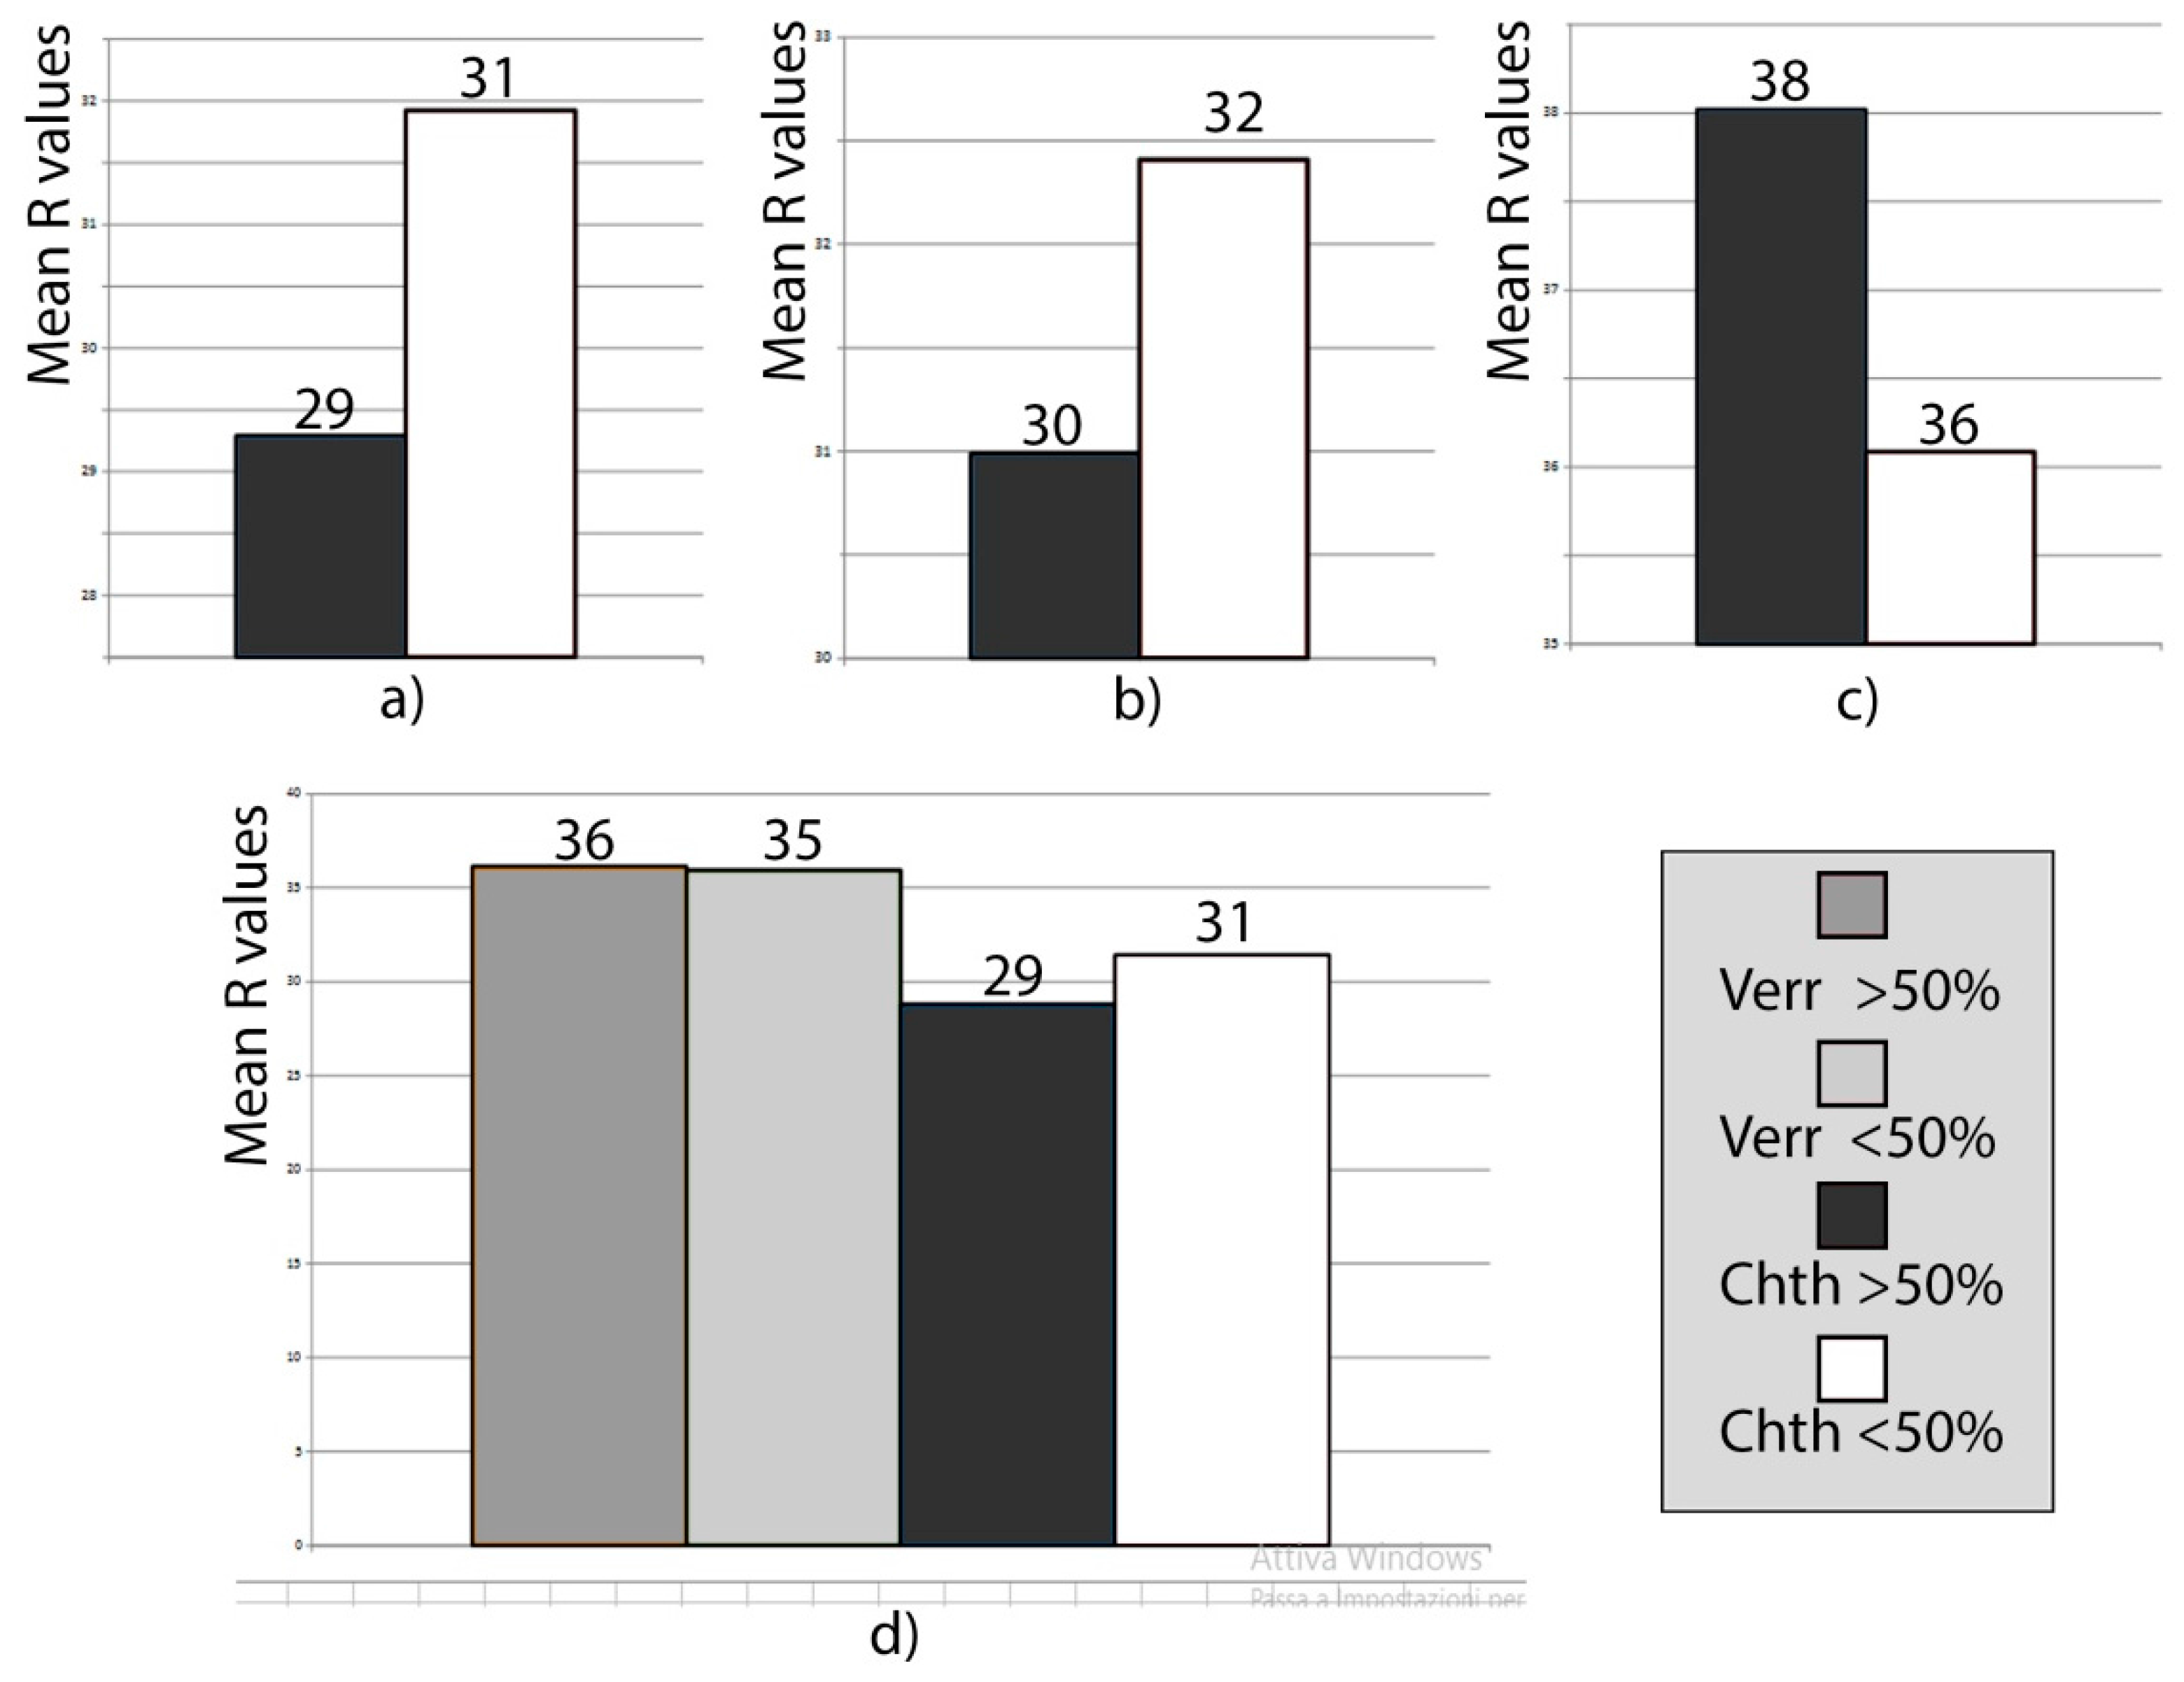
Results show (
Table 2,
Figure 7) that at both sites mean
R values are slightly lower where the barnacle cover is higher (>50%), meaning that the presence of
Chthamalus spp. could negatively influence rock hardness. When compared with
t-tests (
Table 2), only data relative to SS1 provide significant results. At the SS5 site, differences in rock hardness between covered and uncovered quadrats do not show statistically significant results. This could be attributed to the lower number of replicate quadrats screened at SS5 than at SS1. The pattern observed at SS1 for
Verrucaria adriatica resembles the one recorded for
Chthamalus spp.:
R values are lower where the lichen percentage cover is higher, meaning that its presence could weaken rock hardness. However, at SS5 no pattern is evident. In addition, the
t-tests do not highlight significant results at any site, meaning that differences observed at SS1 could be due to mere chance.
As for the role of
Verrucaria adriatica in influencing rock hardness, results suggest that there is no relationship between lichen cover and rock hardness (
Table 2,
Figure 7). At the SS1 site,
R values are moderately lower, but not statistically significant, where cover is >50%. At site SS5, instead, no difference in hardness was revealed between covered and uncovered rock. This may be because our experimental design was not suitable for the purpose, while it was for barnacles, because
Verrucaria has neither a bioprotective nor a bioerosive role, or because this lichen plays both roles at the same time [
50,
51,
52].
4.3. Dependence of Rock Strength from the Abundance of Barnacles Cover
A more articulated test was designed in order to highlight the differences in rock hardness between coastal rocks differently affected by the presence of barnacles in comparable conditions of exposure to marine morphological processes.
Within the study area of Eastern Liguria, three localities were selected (
Figure 2), each of which displayed homogeneous features (rock type, fracturing degree, exposure). One of the localities coincides with the one already tested in the experiment described in
Section 4.2 (Tellaro, dolomite, and limestone bedrock); the new localities are both shaped in a terrigenous bedrock due to the late phases of sedimentation within the Tethys sedimentary basin. In the Lavagna locality, the dominant rock type is slate, whereas the Pontetto bedrock (
Figure 8) is a marly limestone flysch. The platforms in Lavagna locality have been recently (
ca.10 years) artificially reshaped to improve the coastal slope stability. For each locality, a number of testing points—26 in Tellaro, 30 in Lavagna, and 60 in Pontetto—were randomly selected within a portion of the rock surface,
ca. 50 cm wide, located across the barnacle band upper boundary, slightly above the midlittoral-supralittoral boundary. Half of the replicate quadrats displayed an abundant (>50%) barnacle (
Chthamalus spp.) cover, whereas in the other half the cover was scarce (<50%). All the points were tested according to the methodology applied in
Section 4.2, measuring biota percentage cover within a 10 × 10 cm quadrate (replicate quadrate) centered in each of them. In the Tellaro locality, 26 more points were also tested in the supralittoral, half of which displayed a lichen cover >50% (
Verrucaria adriatica), whereas in the other half the lichen cover was <50%.
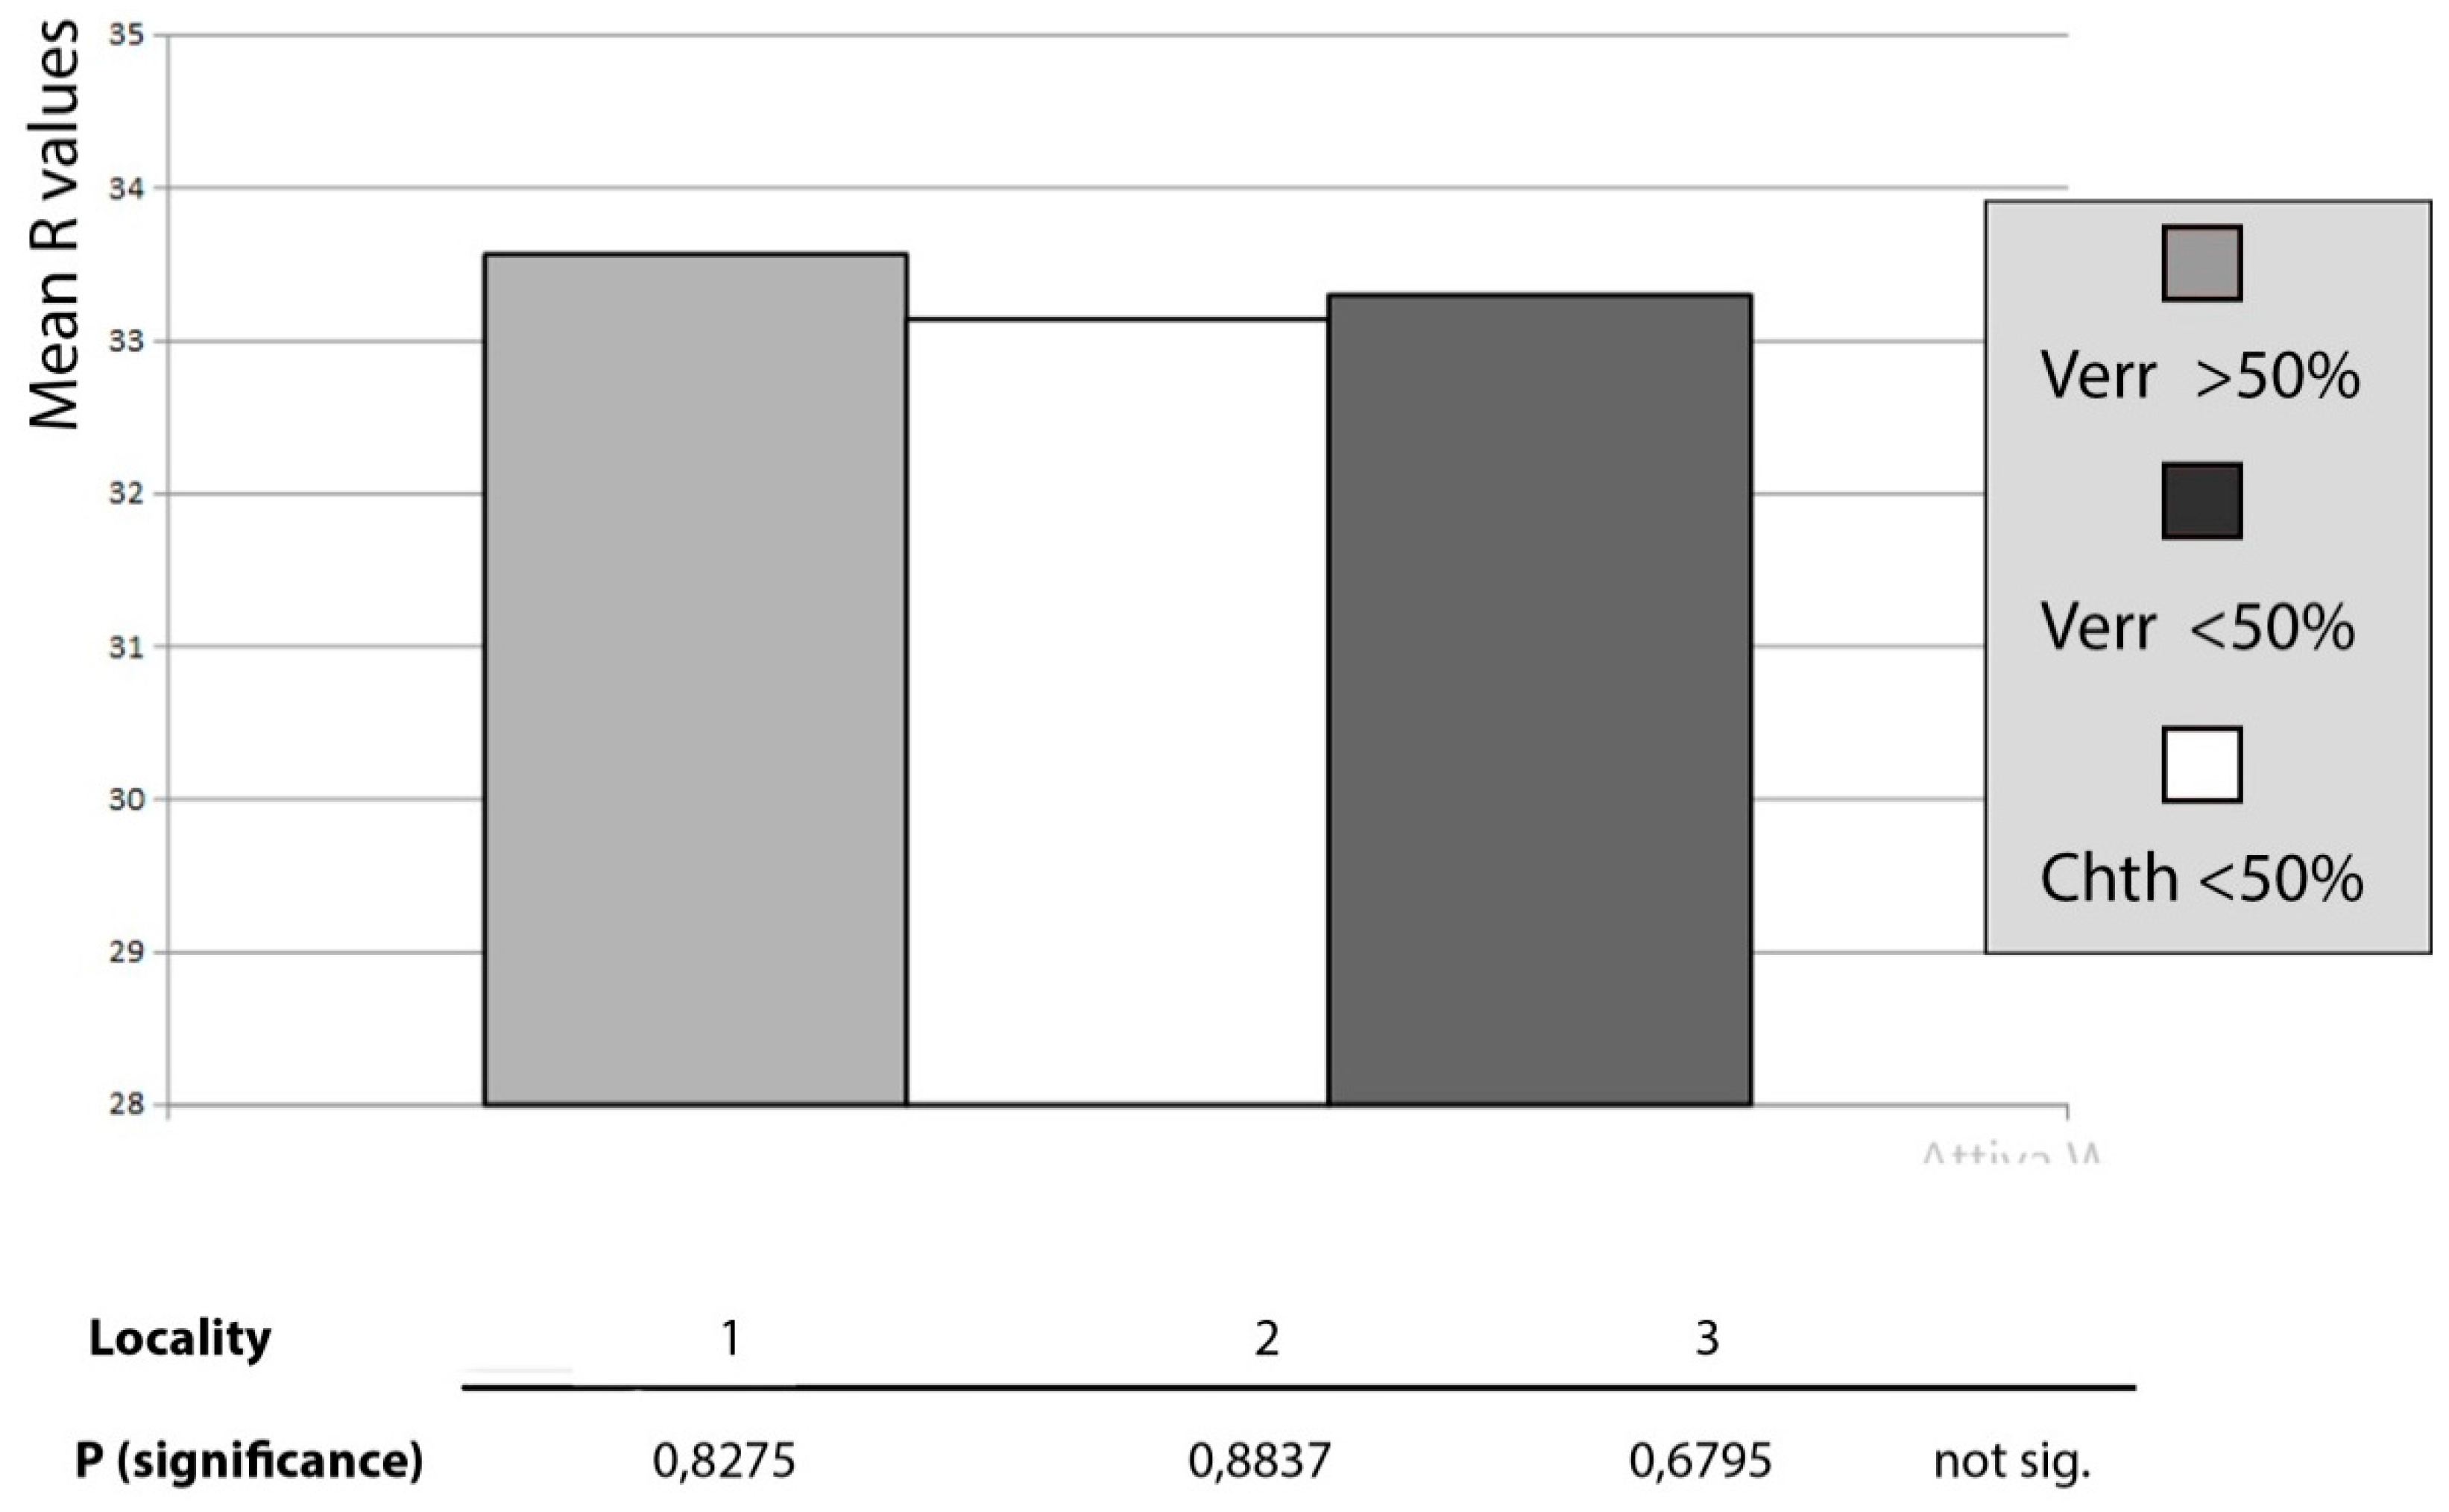
Data were analyzed separately for each locality and for the two biota. In Pontetto and Tellaro localities, where the average
R value is very similar, the quadrats with barnacle cover >50% (covered) displayed (
Figure 9) a lower
R value than those with barnacle cover <50% (uncovered). The reduction in hardness is 6%. These results are consistent with those from the preliminary experiment described in
Section 4.2. In the Lavagna locality, the overall
R value is higher than in the previous localities due to recent anthropic rock reshaping; here, testing on covered quadrats show a harder bedrock than on uncovered ones, suggesting a bioprotective role of biota.
In all the three localities, the two datasets cannot be differentiated on a statistical basis, as the results of the
t-test indicate (
Table 3). This could be due to the moderate difference in hardness of covered rocks with respect to uncovered ones; the resolution of the measuring tool could be too low to highlight such small differences [
53]. Nevertheless, our evidence is indicative of a possible bioerosive role of barnacles in natural contexts. It is instead unlikely that the reduction in hardness between uncovered and covered quadrats is due to their differing elevation from sea level, as it is not relevant to control the efficiency of sea closeness-dependent weathering processes, the quadrats being constrained within a narrow belt and the upper barnacle boundary being undulated.
For the lichen cover, instead, no bio-remodeling effect was highlighted. Our data suggest (
Figure 9) that the number of replicate quadrats and data scatter (indicated by standard deviation and by the level of significance from the
t-test) are negatively correlated. It is possible that a consistent increase of test points (
i.e., of tested replicate quadrats) in each locality would enable the differentiation of the two datasets.
In order to investigate the source of variability of the
R value, the ANOVA statistic test was applied for the three localities. Within each locality the replicates were subdivided into three sites, based on spatial contiguity. The experimental design (
Figure 3) adopted in this work employs three factors: the fixed factor “treatment” represented by two levels (>50% and<50%) and the two random factors “locality” and “site.” The response of this text shows a probability value which is highly significant for the “site” factor. This demonstrates that the variability between sites of the same locality is great; thus, a remarkable variability exists within each site. These results prevent the possibility of drawing conclusions about the differences between treatments (>50% and <50%) as well as between localities.
4.4. Minimizing the Environmental Differences between Sites in Order to Disentangle the Effect of Barnacles Cover from Other Weathering Processes
The results of the experiment illustrated in
Section 4.3 suggest that moderate reduction in rock hardness is likely to be due to the effect of the barnacle cover along the rocky shores of Eastern Liguria. To get reliable evidence of the action of barnacles on littoral rocks in our study area, it should be necessary to increase the resolution of the rock hardness measuring tool and to minimize disturbance from other factors affecting this parameter. In particular, data processing with ANOVA demonstrates that a great spatial variability of rock hardness exists between sites at the small scale.
In order to minimize environmental differences between sites, a new study area, Calafuria, was selected, 120 km apart from Eastern Liguria (
Figure 2). Here, the rocky shore is extremely uniform, being shaped in a sandstone bedrock belonging to a single member of the Macigno Formation (Oligocene), a silicic turbidite sandstone, medium-coarse grained, moderately sorted, interbedded with very tiny fine conglomerate beds [
54]. In this area, an experimental design was worked out (
Figure 3) based on the random selection of nine sites (
i.e., platforms) subdivided into three localities. For each site, ten sampling points and corresponding replicate quadrats were selected with the same principle applied to the experiment in
Section 4.3: biota cover percentage and rock hardness were measured in all quadrats, located across the barnacle (
Chthamalus spp.) band (midlittoral to low supralittoral) upper boundary, displaying one half of an abundant (>50%) barnacle cover, and one half of the scarce (<50%) cover. Five additional quadrats were tested for each site, in which barnacles were scraped off from the rock one month before testing, and the rock surface was then left exposed to air and sea water with no protection. On the whole, 135 quadrats were tested.
Rebound data are remarkably more scattered than in the previous experiment (
Figure 10), although the bedrock was lithologically and structurally homogeneous and the replicate quadrats were more numerous in the Calafuria area. Averaging all the
R values obtained from quadrats equally treated, we obtain a negligible difference in the
R value, as the histograms in
Figure 10 show. Data processing with
t-test confirms the randomness of such differences, and ANOVA processing highlights that uncovered and covered quadrats (treatments) do not display significant
R differences, regardless of the way they are grouped (by area, locality or site).
It should be concluded, thus, that the methodological approach adopted in this Section highlighted a possible effect of biota in coastal rocks shaping, but it was not appropriate to quantify the effect of bio-remodeling. In fact, we found overwhelming differences of R values between sites of the same locality and between replicas within the same site, for each treatment, due to the variability within each site. For this reason, simply using a higher resolution instrument for rock hardness assessment, such as the Equotip, is not likely to improve our results, and a different approach, such as the one described in the next paragraph, seems more promising.
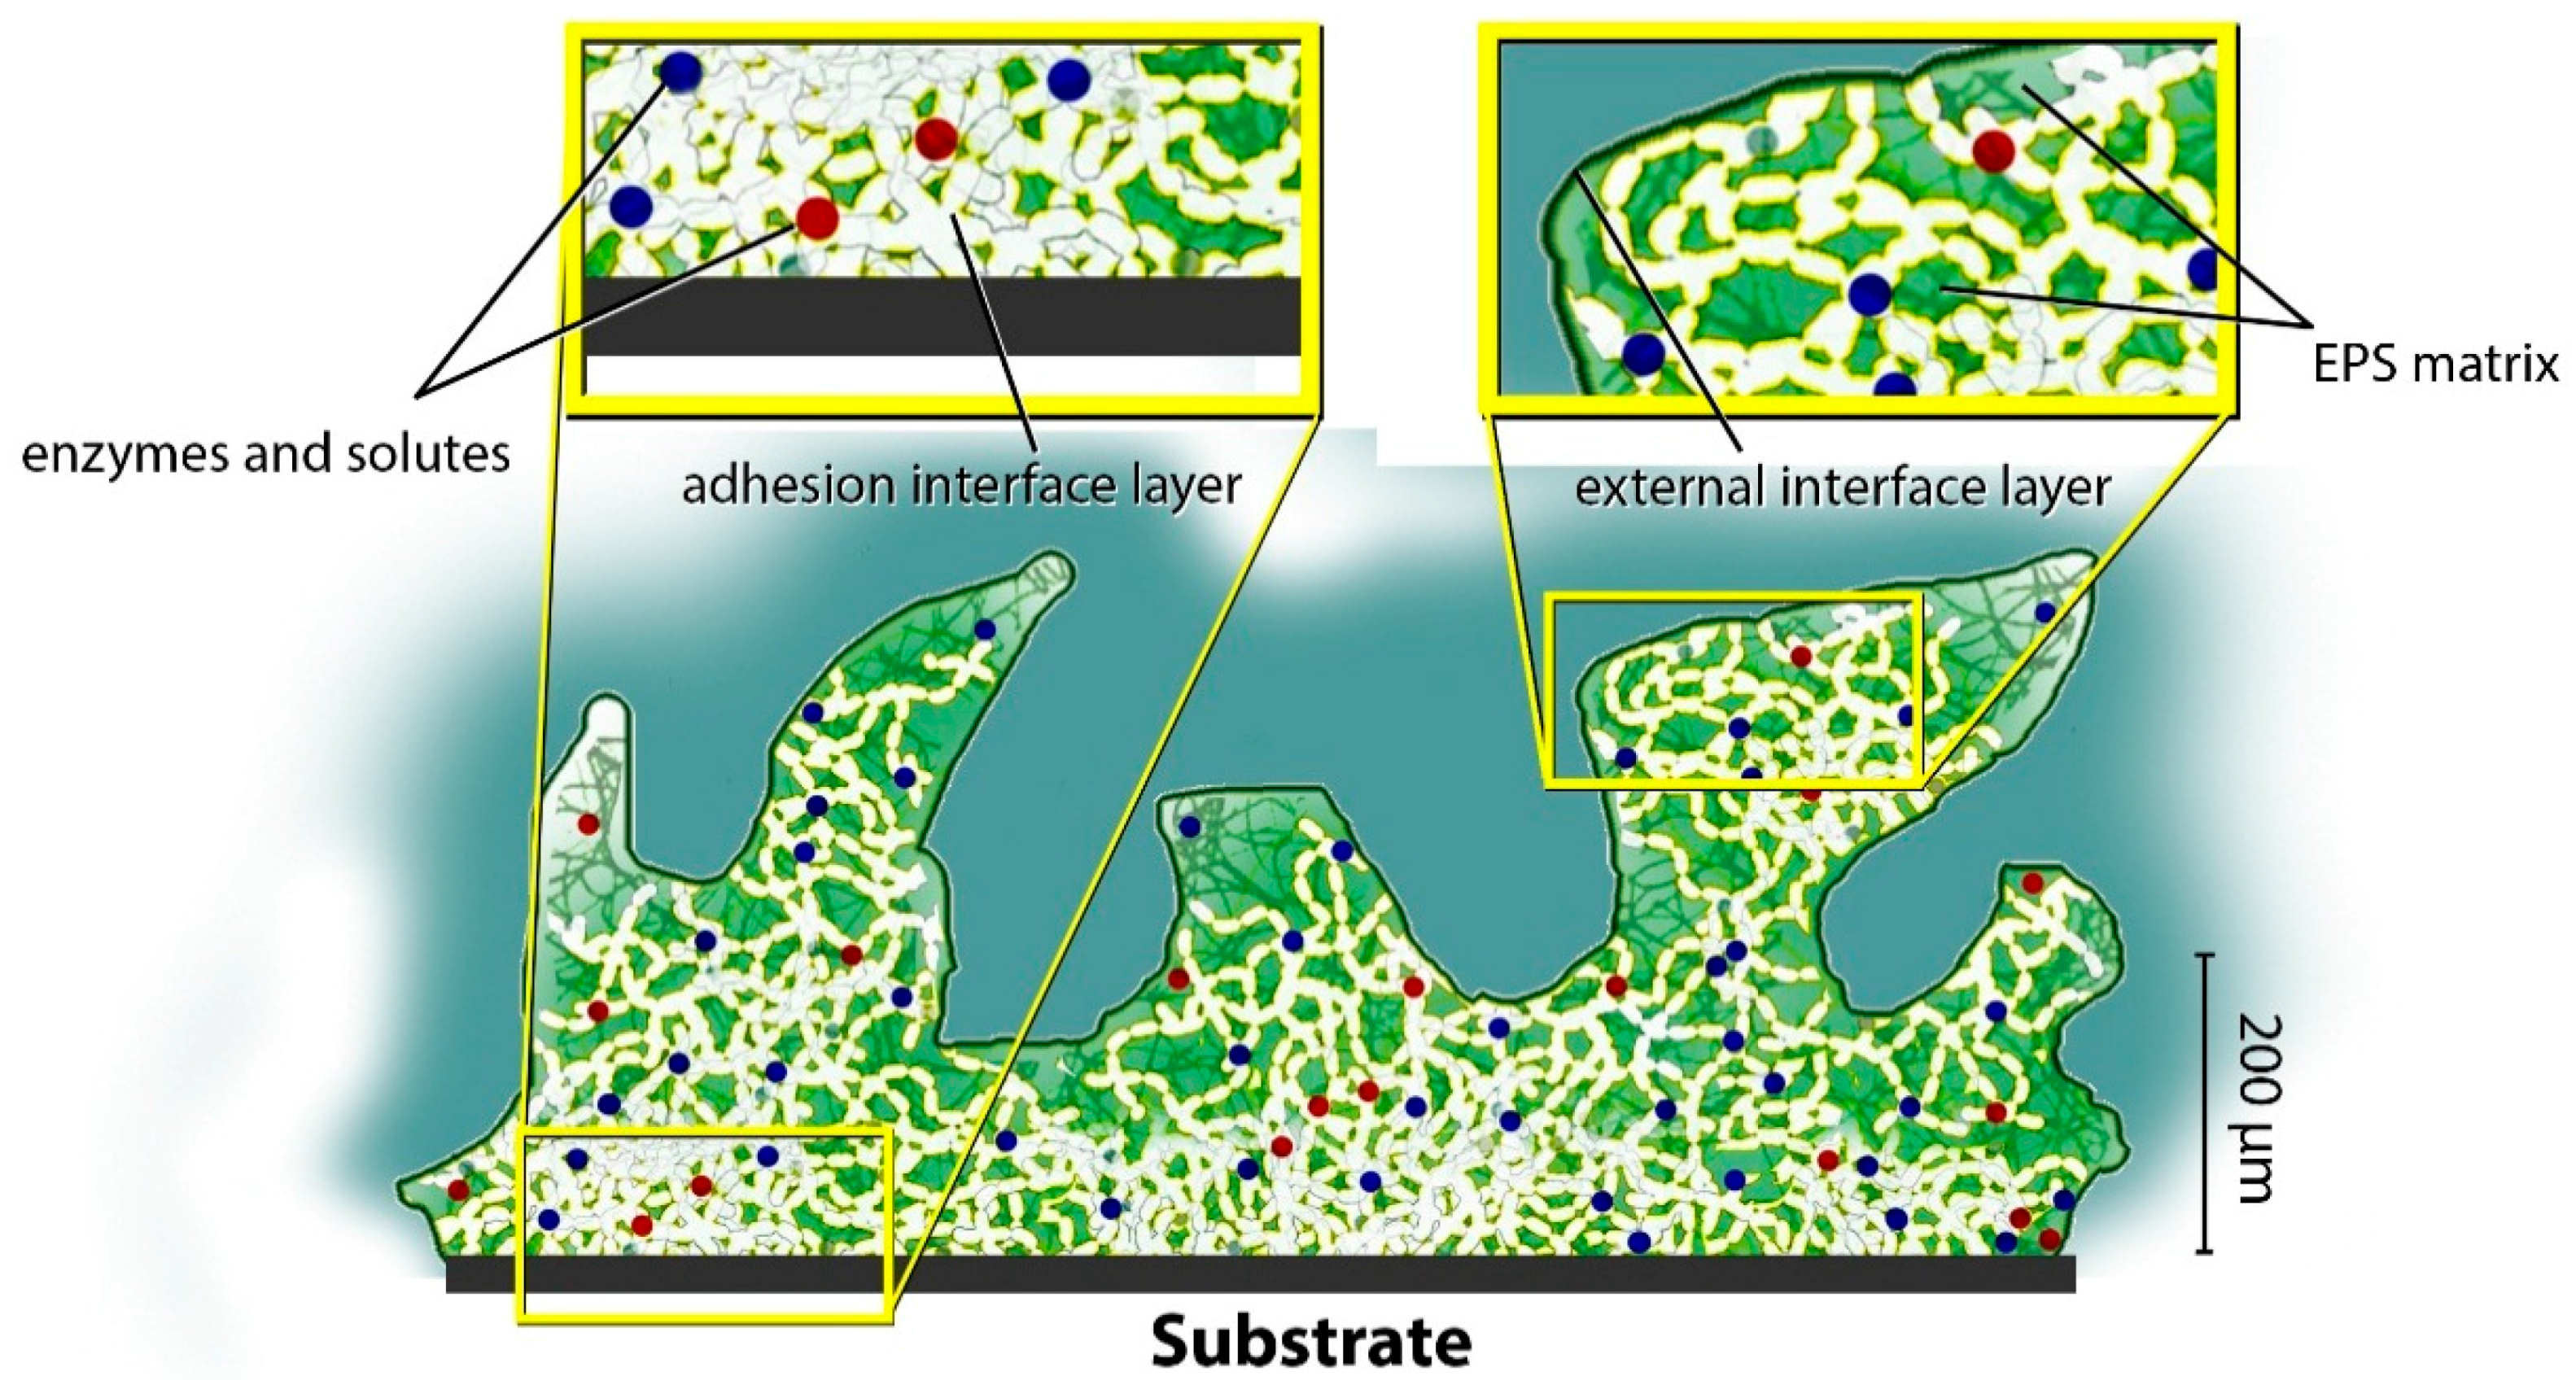
5. Biofilm EPS and Bio-Remodeling: A Computational Approach Proposal
A new approach to provide wide insights in the bio-remodeling process of coastal landforms is based on computational modeling. Biofilm is widely distributed on any type of substrate (even anthropogenic ones) as a fundamental component of the ecosystem, and is well studied and monitored for scientific purposes. Biofilm structure is usually based on different cyanobacteria and diatom communities attached to the bedrock and linked together in a complex gelatinous structure of biochemical compounds, water and ions (with a wide species variability in percentages and composition) known as extra-cellular polymeric substances (EPS) (
Figure 11).
Many scientific publications have involved experimental approaches to quantify the impact of biofilms over substrates in underwater and subaerial environments, mainly quantifying the direct action exerted by endolithic/epilithic cyanobacteria in controlled conditions [
55] or field testing/monitoring of areas of interest with geotechnical procedures and instruments [
35]. In particular, researchers have focused on the capability of cyanobacteria to operate like borers at the micro-scale and thus weaken the rock surface. Instead, however, in order to investigate the role of biofilm in mediating the interaction between coastal rocks and weathering agents (
i.e., indirect action), a computational modeling approach can be used.
Biofilm, likeother life forms, adapts to stress conditions lowering metabolism and dehydrating EPS (normally rich of water up to 97%); the high variability and hierarchical nature of organic EPS structures and the inherent difficulties disentangling the indirect effects of cyanobacteria presence from other shaping forces acting over the coastal landforms permits a multidisciplinary approach involving biology and computational modeling. This field of study is known as materiomics [
56] and is based on the assumption that a material system (like biological materials) is hierarchically organized in sub-components leading to emerging non-linear behavior that cannot be explained analyzing the single components of the system. The characterization of the composition and structure is necessary to build an accurate continuum computational model; analyzing samples of bedrock with scanning and optical microscopes leads to the acquisition of key information on the texture and structural features of the rock (especially mineral grain size and sorting, porosity, joint width, and spacing). Moreover, the determination of the biofilm community is necessary to gain a specific knowledge of the mean EPS compound composition. The following step is taken to determine the abundance of the biomass present on the bedrock area. As known, the cyanobacteria are photosynthetic organisms, rich in a-chlorophyll, which has strong absorption in red–near-infrared (NIR) bands; a strong correlation is found by NIR remote sensing photographic analysis and analytically detected biomass [
57]. The key approach for a multiscale computational model for the EPS is to build or retrieve the models of substrate and EPS main constituents from online open source databases (such as RCSB.org) and run a molecular dynamics (MD) simulation to study mechanical properties of the compounds involved using VMD and LAMMPS open source software (
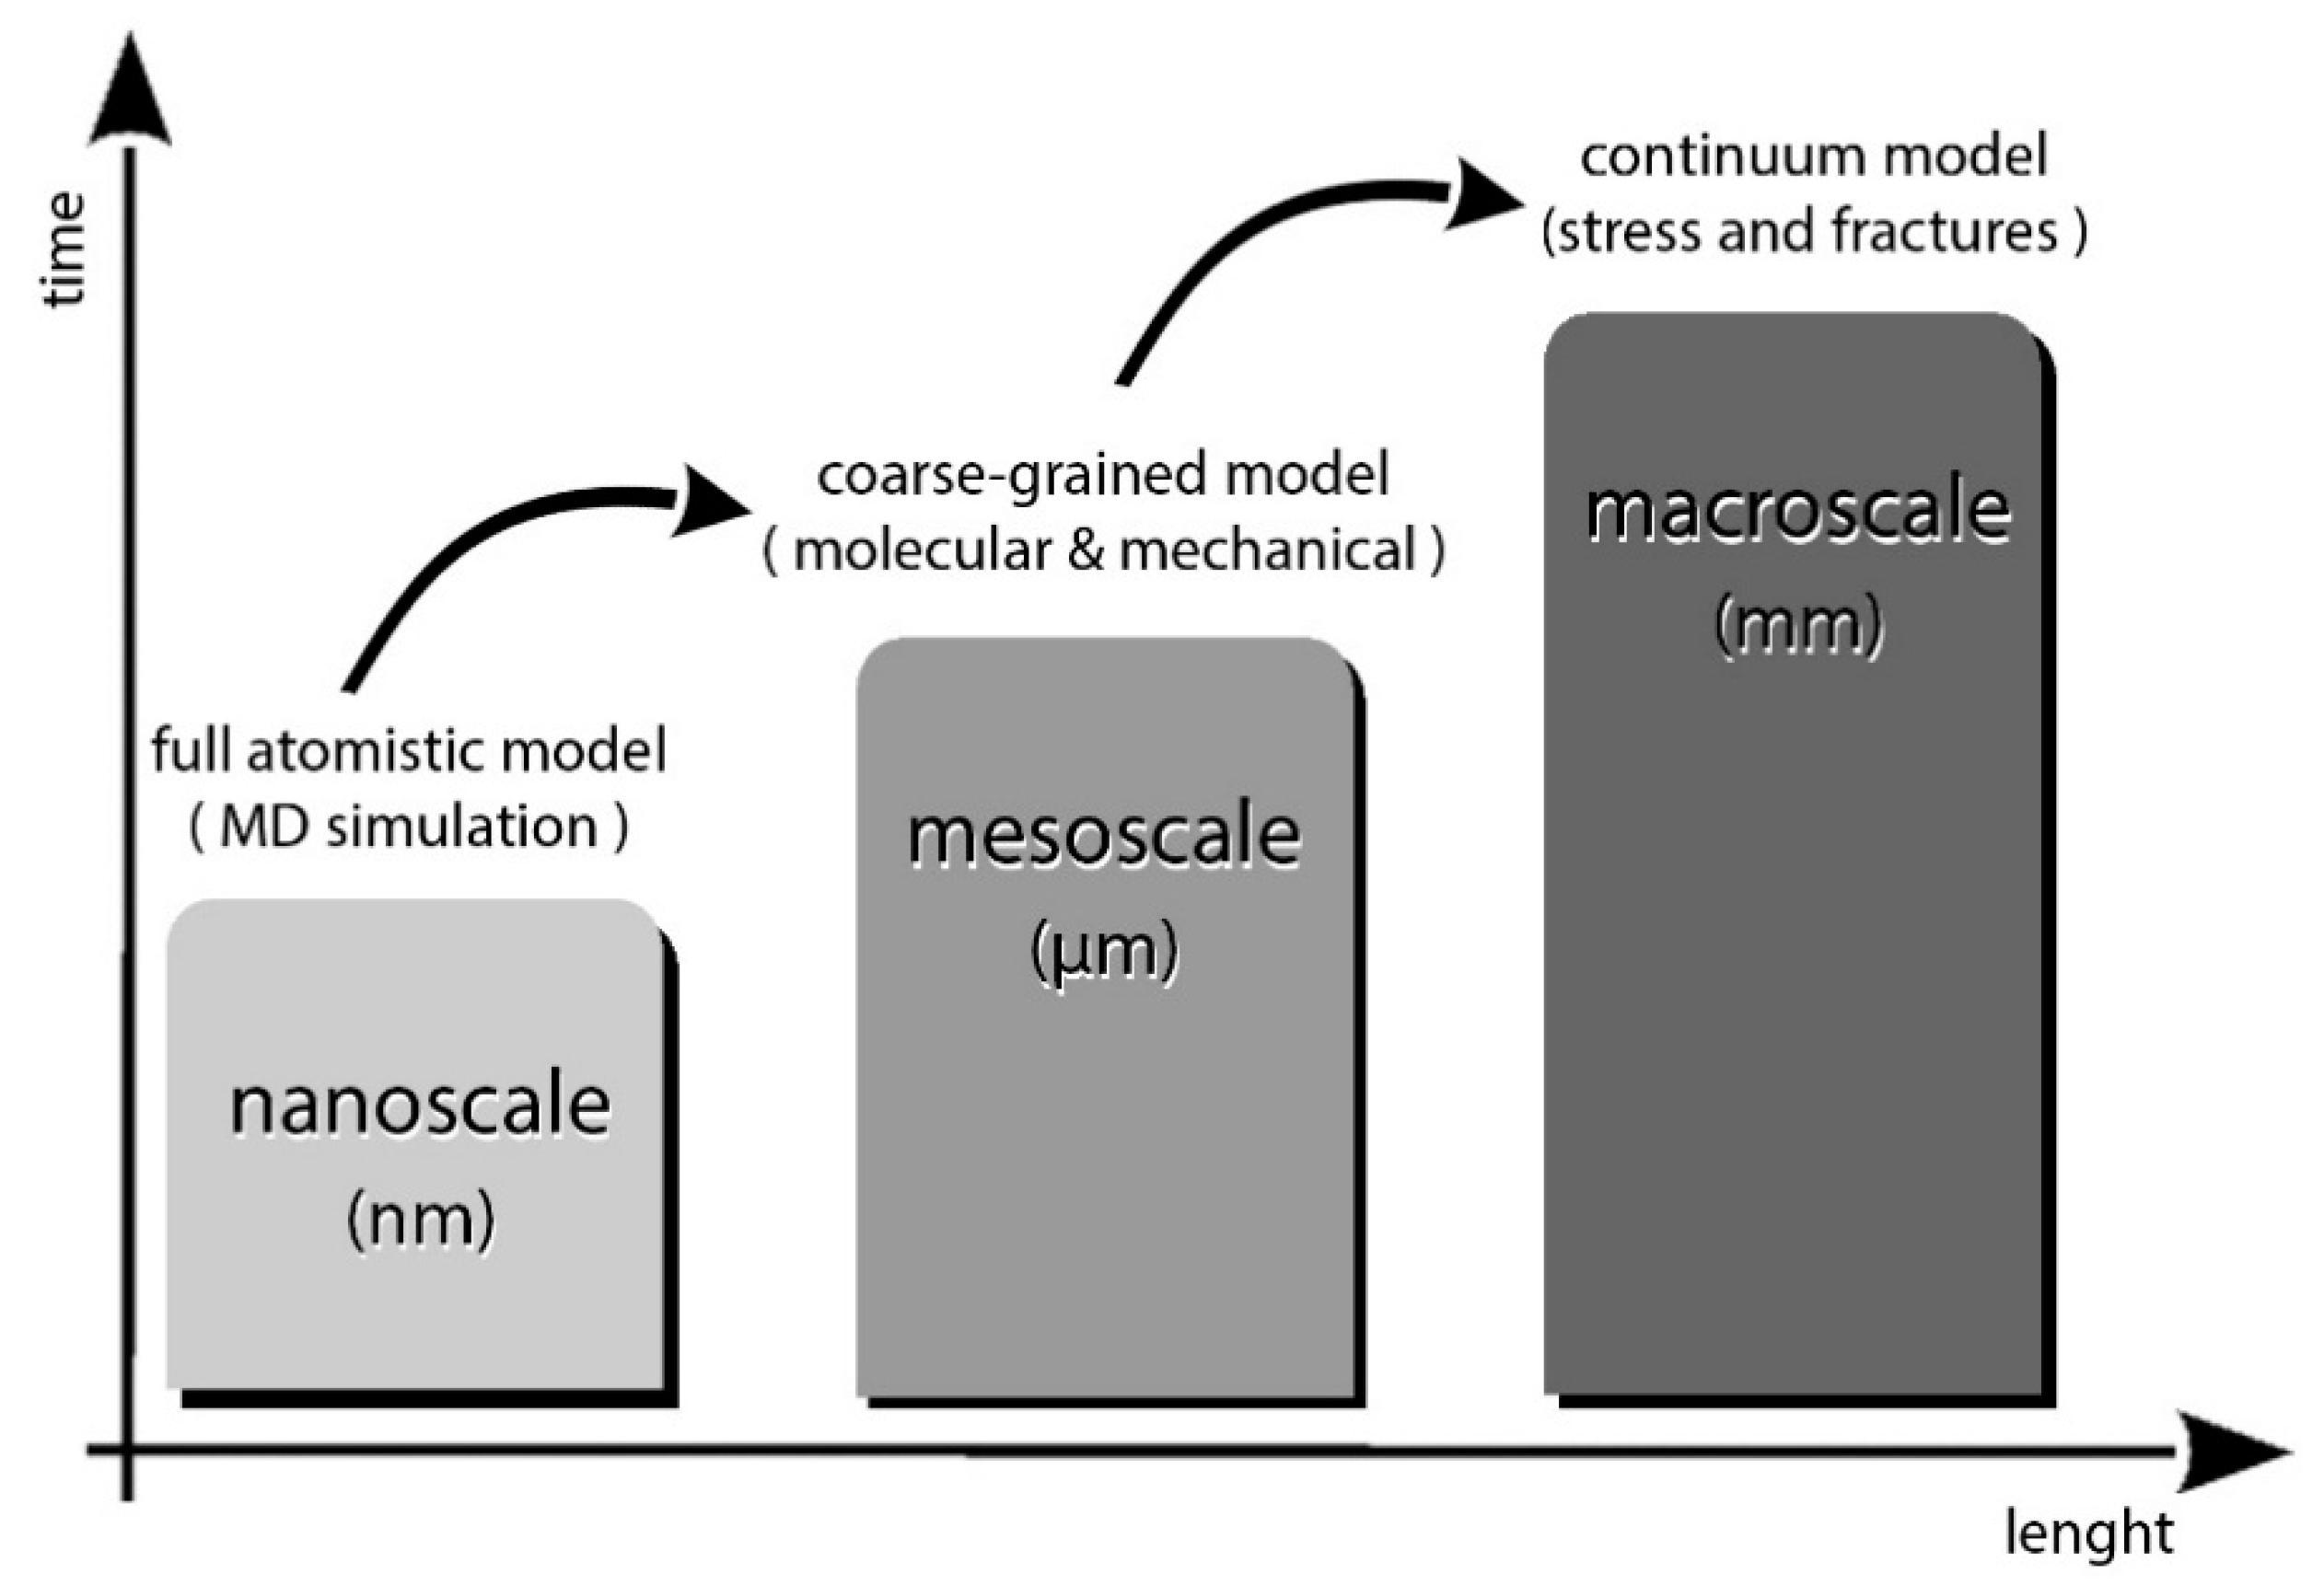
http://www.ks.uiuc.edu/) therefor. The simulation needs to be progressively scaled to wider assemblies from nanoscale to a continuum model for stress material testing.
Scaling up with thousands of compounds acting in a simulation simultaneously and retaining the full atomistic (fine-graining) information currently is not possible, as it would require huge amounts of time and enormous computer calculation power. The solution to such a problem is a simplification of the behavior of the single compound to a more manageable model with the same chemical and mechanical characteristics but with fewer degrees of freedom. The process is known as coarse-graining and is normally employed in materials science to investigate the interactivity of discrete particle systems (
Figure 12). Moreover, the simulation gives clues about molecular forces involved, adhesion dynamics, and interaction behaviors in solutions or other compounds.
To quantify the forces exerted over the surface rock layer by EPS hydration/dehydration cycles and other weathering effects on the rock, a further approximation of the behavior of the material as a continuum homogeneous mass rather than a discrete particles system is necessary; the simulation is based on a coupled continuum material with shear forces acting on the micro-fractures and interstitial spaces replicating the mean rock texture previously seen.
Shear stress is induced by the volume expansion and contraction respectively of mineral grains and EPS, and simulation can thus be adapted to the magnitude and frequency of weathering processes actually taking place in the field.
The computational model has to be validated with direct measures that are able to quantify, in controlled experimental cases, the real shear forces applied and the substrate behavior and mechanical properties. This information is necessary to confirm simulation efficacy and the related hypothesis; as seen in other works [
58,
59,
60], tensile machines and sensors are used to quantify adhesion forces or failure loads of byssus filaments and spider webs. For this case in particular, we suggested a procedure using a tensile machine in order to study the behavior of the unaltered rock sample under traction load conditions. This procedure may be used to calibrate extensometer sensors too in order to avoid data fluctuation due to external factors (temperature, moisture,
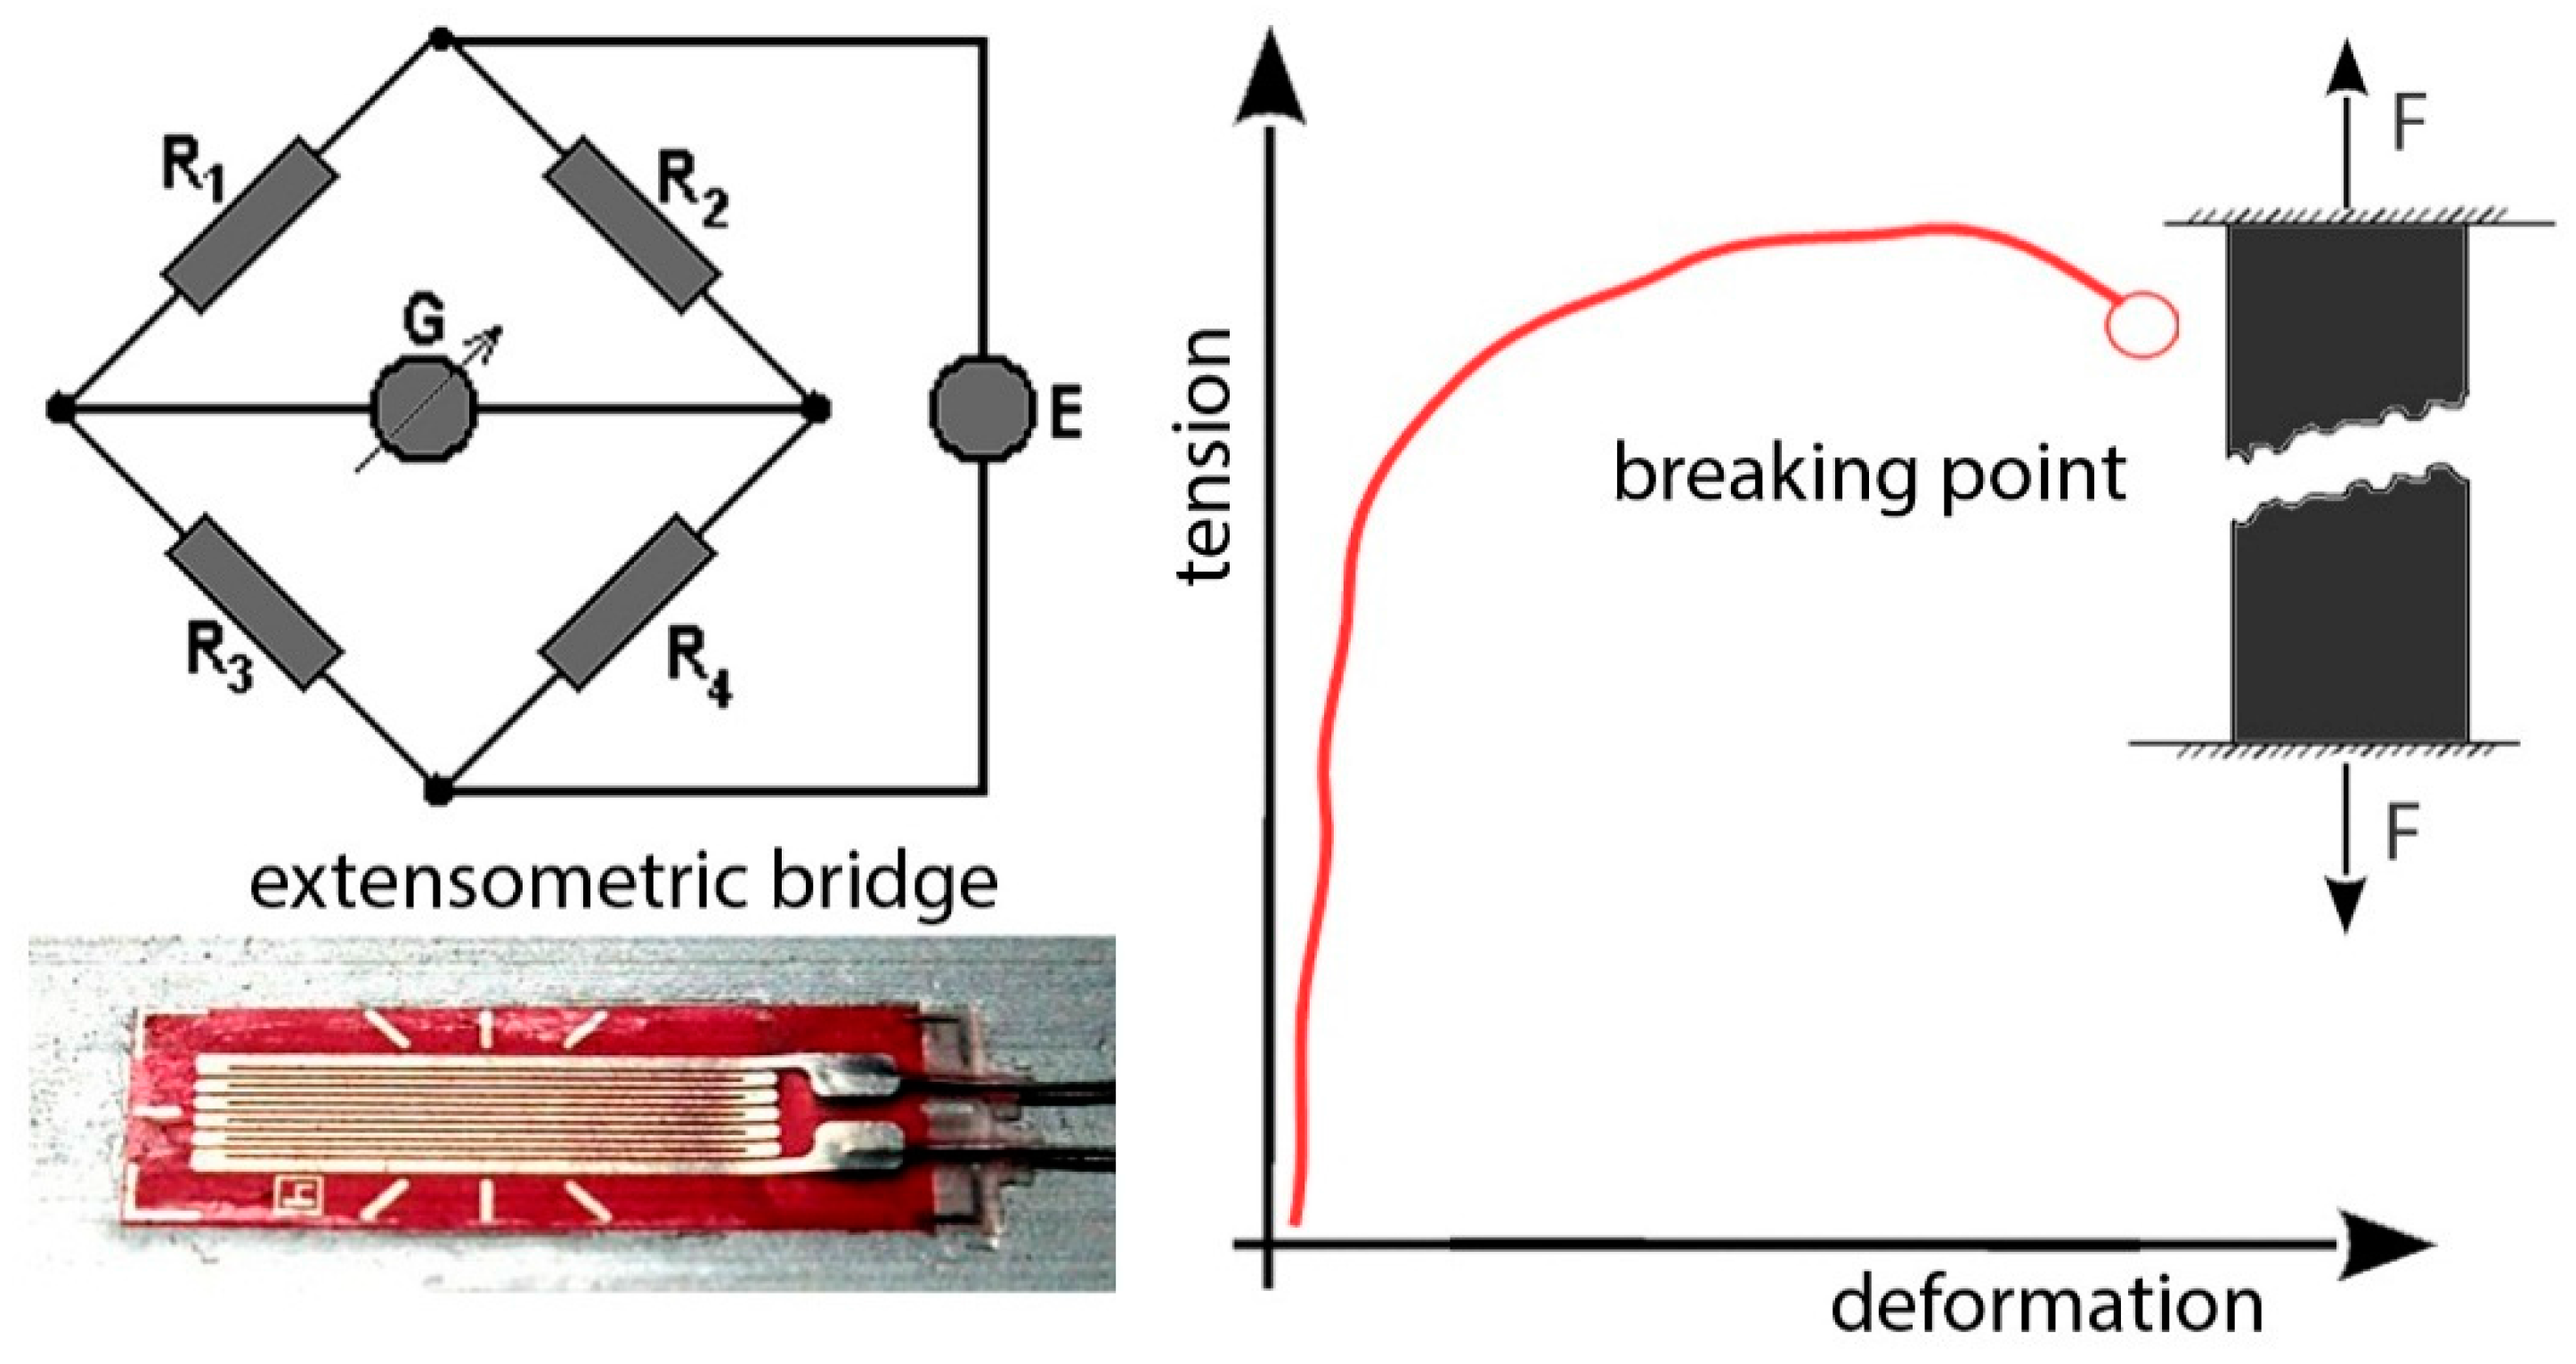
etc.) at low intensity loads, using an extensometric bridge in the experimental setup. Such variations can be quantified with a digital signal output (
Figure 13).
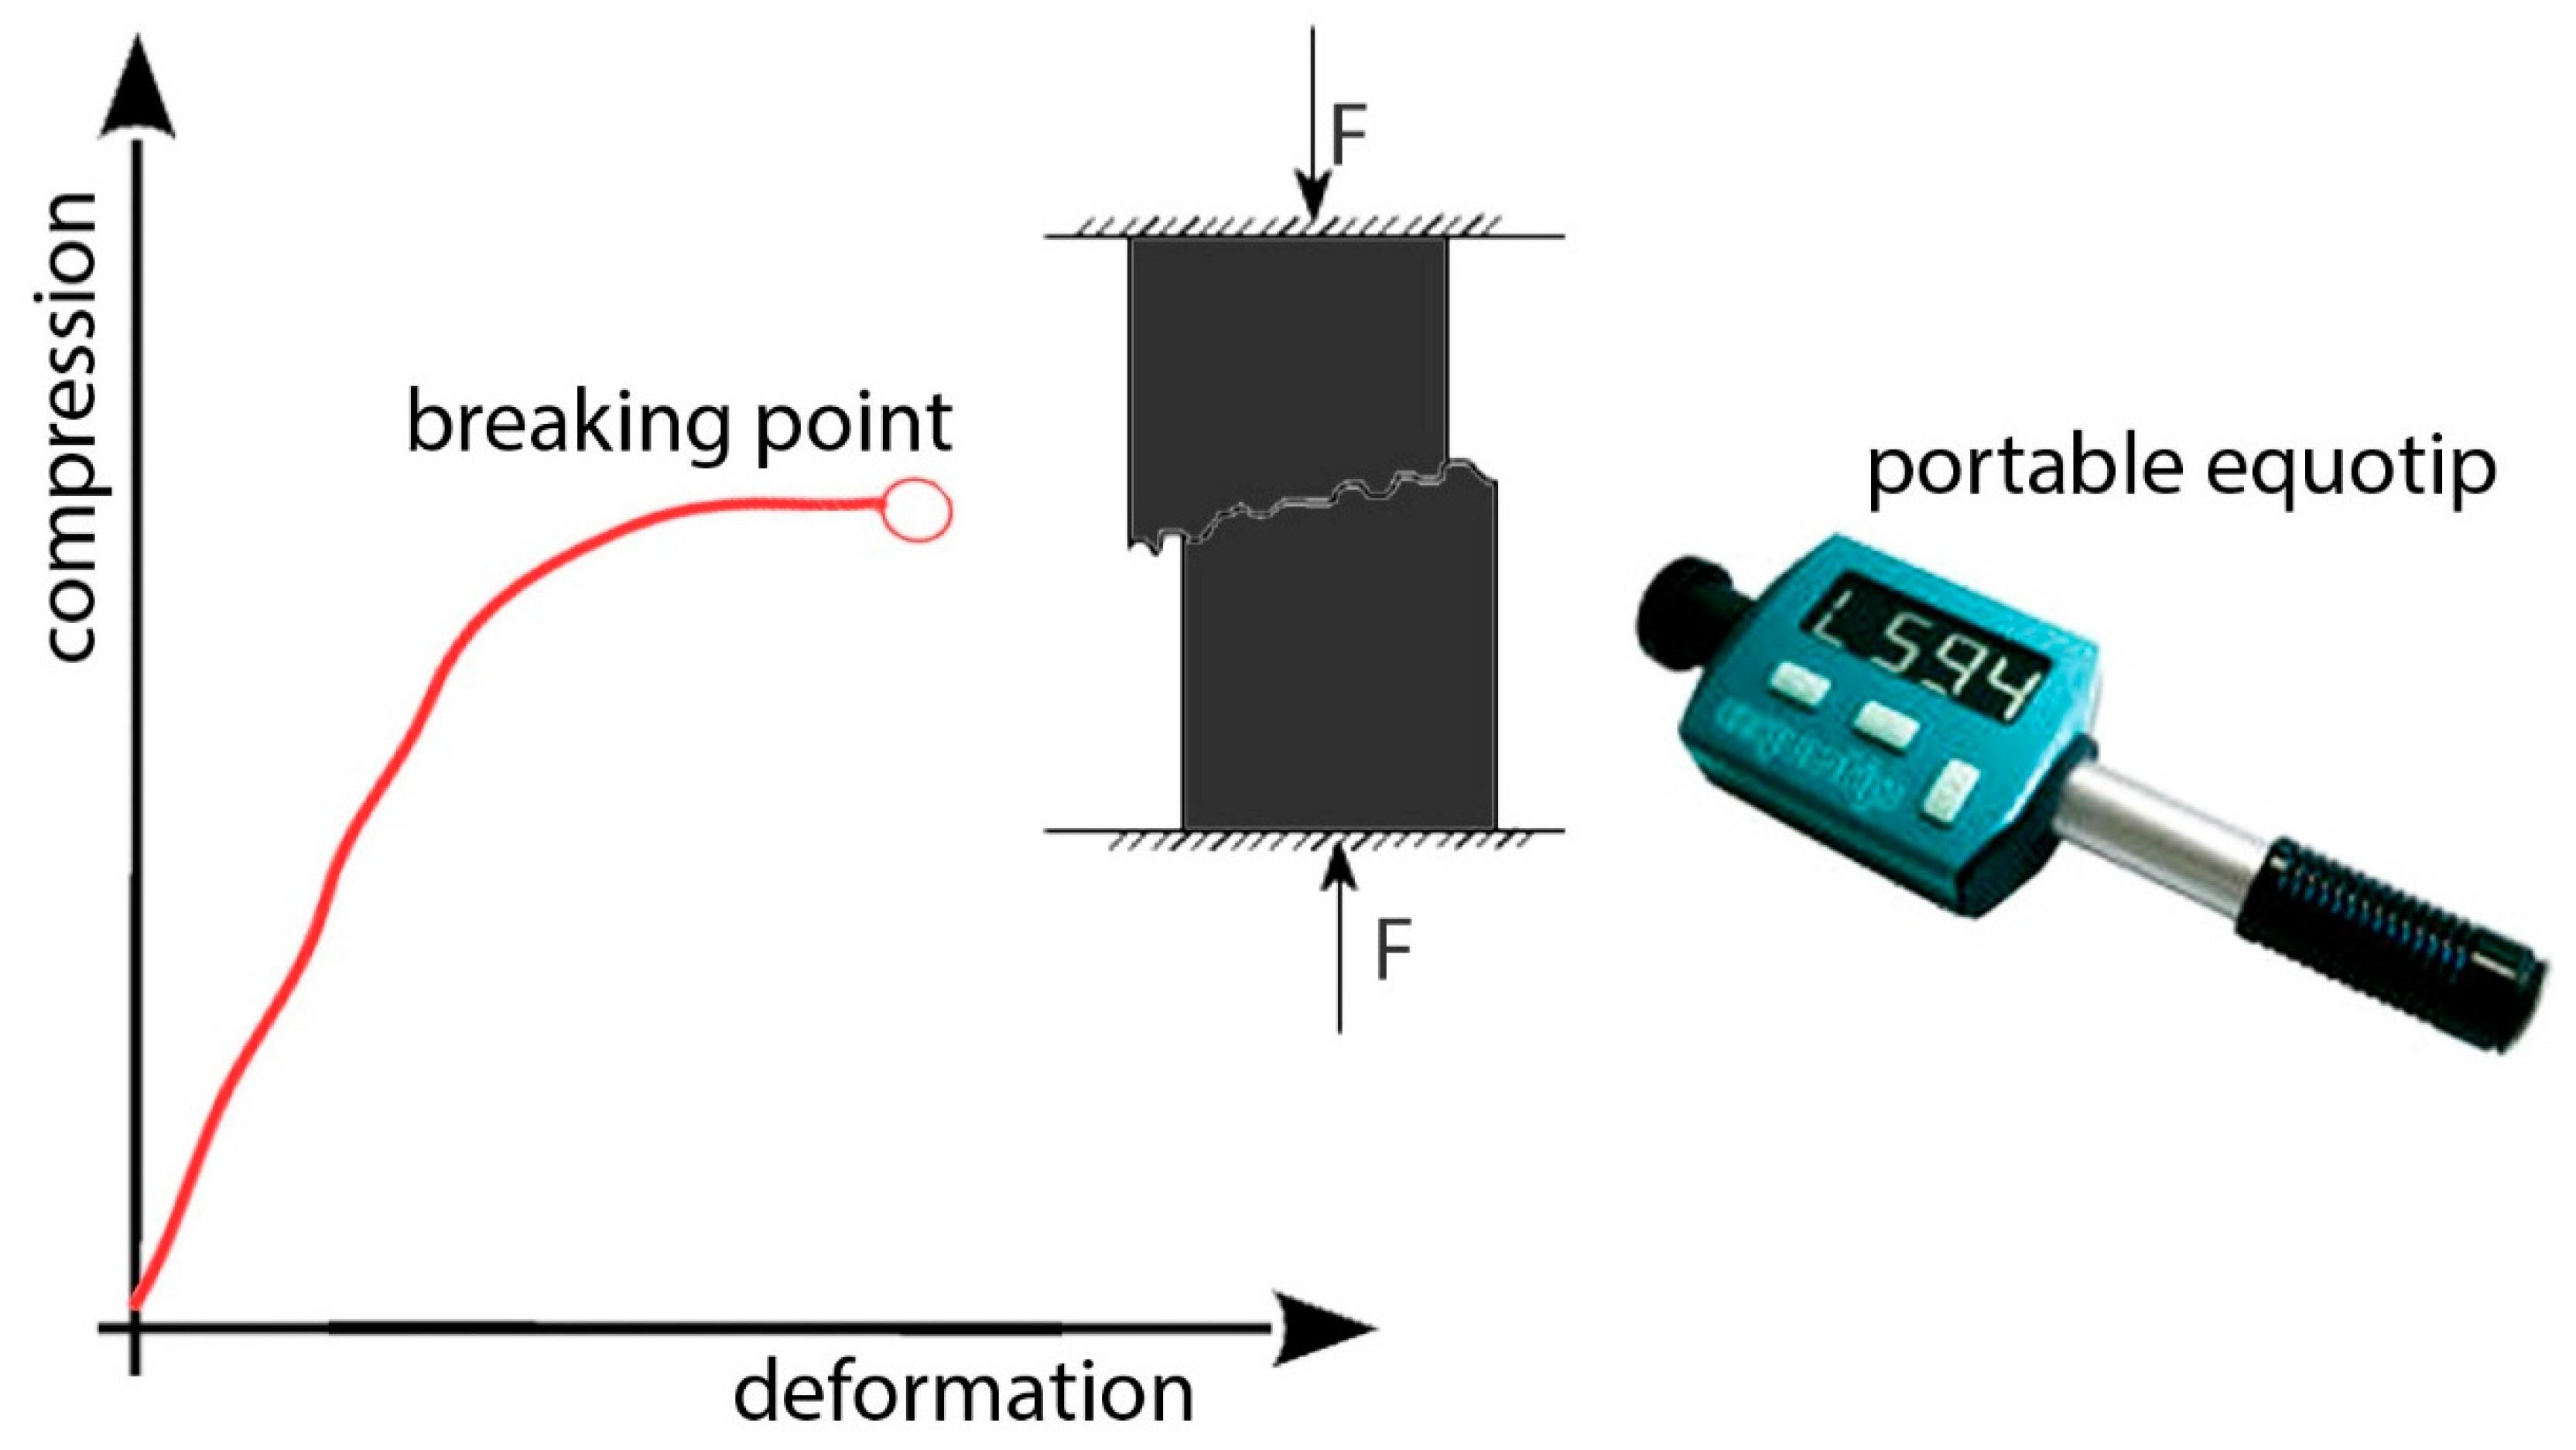
The extensometer is pasted on the surface of the body, generally using instant adhesives such as cyanoacrylate, following the deformations of the surface to which it is bonded, elongating and shortening together, and causing a variation in the electrical resistance of the wire. Moreover, it is possible to test an unaltered rock sample with a compressive machine in order to calibrate Equotip
L measurements previously collected in the field (
Figure 14).
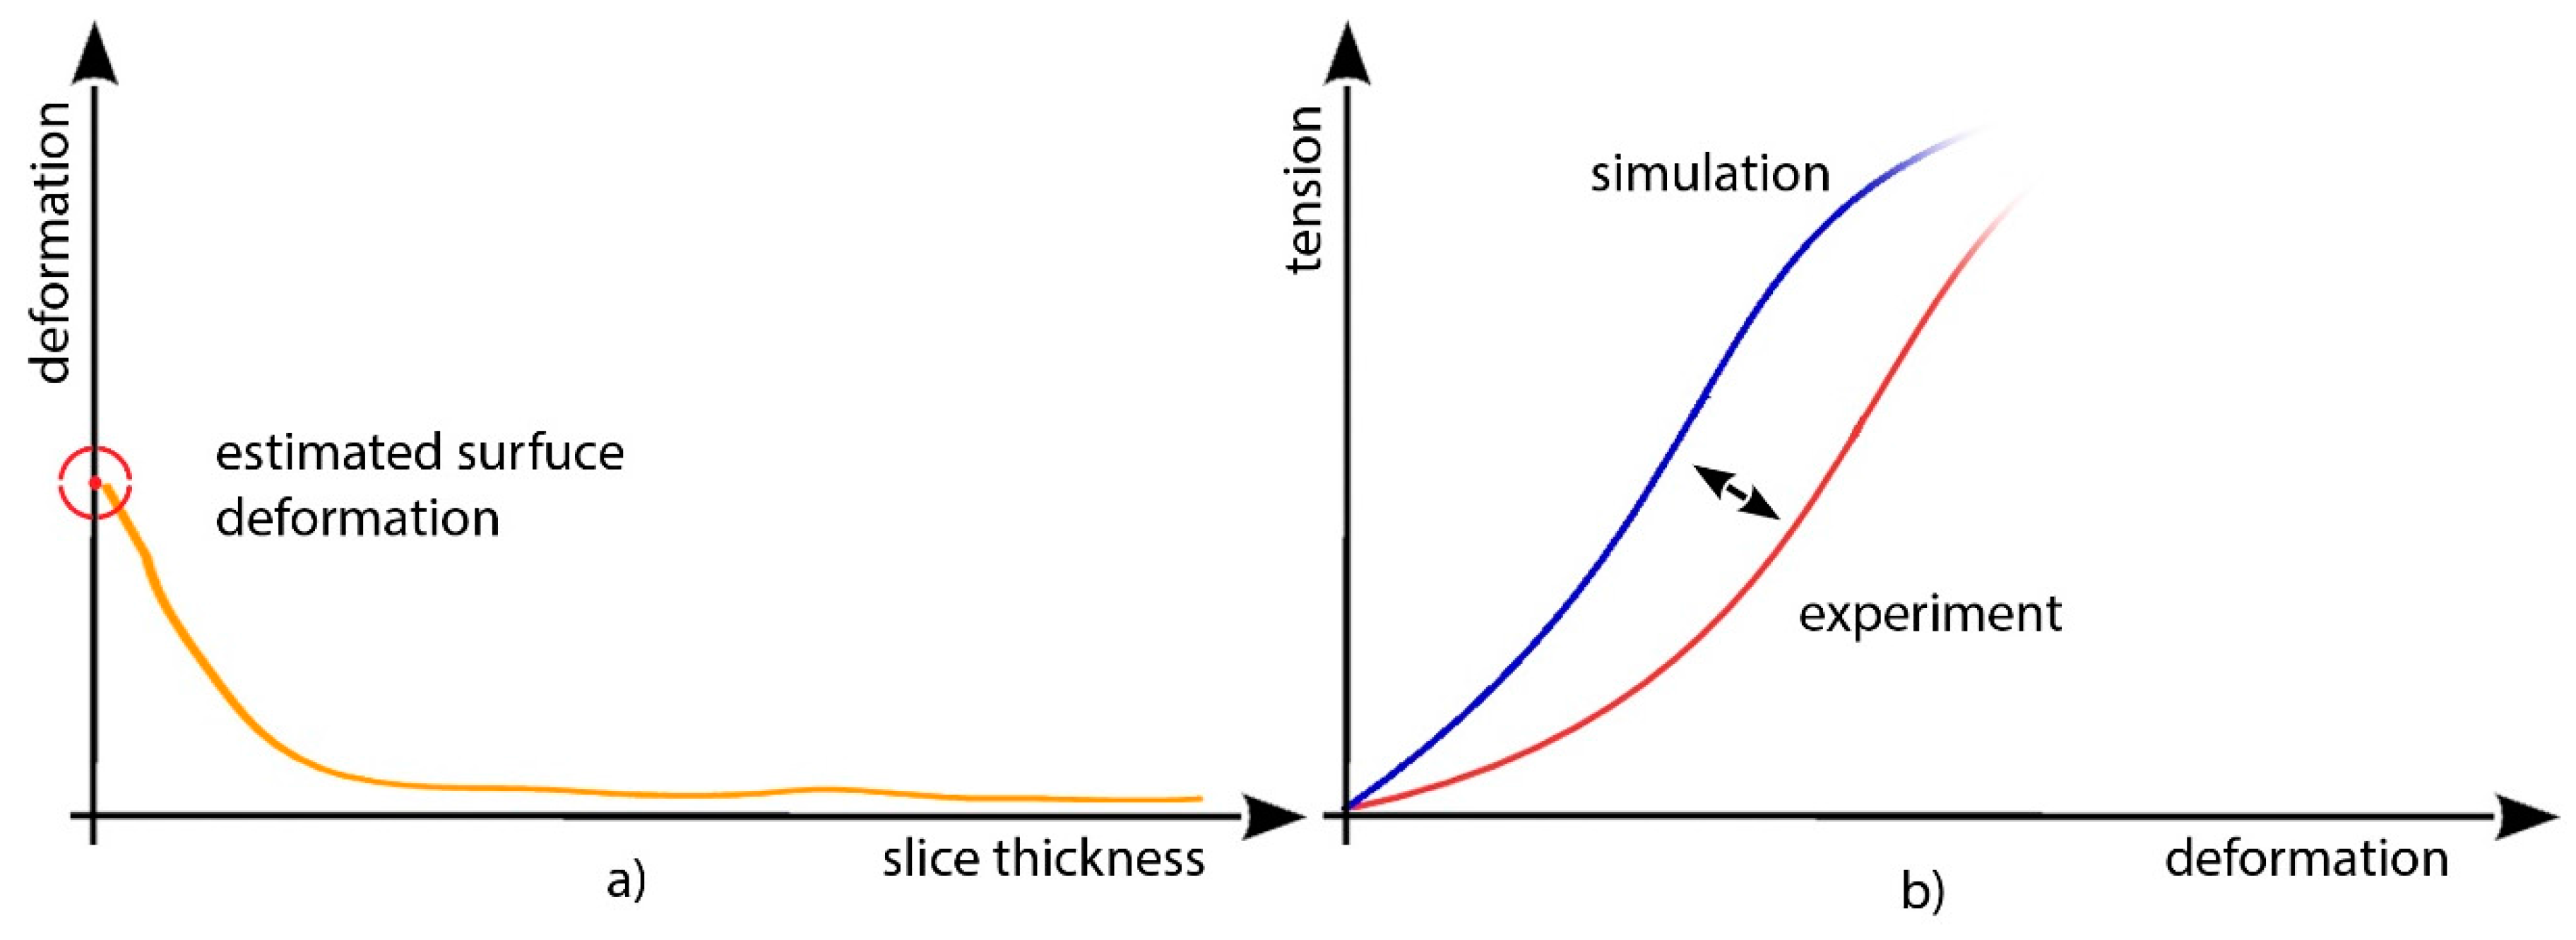
After sensor calibration, it is possible to proceed with the validation test under stress conditions (changing moisture levels) for the colonized sample; slices of progressive thicknesses are tested in order to evaluate the magnitude order and the maximum depth penetration of the forces acting on the colonized surface, which are necessary to interpolate a mean surface deformation value (
Figure 15).
A further issue is to test the behavior of EPS in the presence of a single pollutant (for example PAHs or heavy metals), which may have a relevant impact on data collected in the field, gaining clues over the impact human pollution may lead to the trophic chain and indirectly to erosion rates of coastal landforms.
The computational approach displays a number of advantages compared to the experimental approach. Among them are the possibility of setting arbitrary boundary conditions to the system (which are really difficult to control in experimental procedures), the possibility of performing accelerated computational simulations of dynamics that may occur in geological time spans in nature (such as erosion dynamics), and the possibility of understanding how dynamics propagate differently, scaling the hierarchy of the system (cross-scaling).
6. Conclusions
Bioerosion and bioprotection (here indicated as bio-remodeling) have been extensively investigated in marine and subaerial contexts. Many efforts have also been made to provide quantitative estimates of the efficiency of bio-remodeling compared to that of other shaping agents, and some results have been achieved in assessing the contribution of bioerosion to the littoral sediment budget.
Our experimental evidence, as presented in this paper, suggests that geological methods may provide some useful insight into the subject of bio-remodeling quantification. In particular, rock hardness/strength assessment tools provide quantitative estimates of the efficiency of weathering agents and thus, with an appropriate experimental design, also of that of bioerosive and bioprotective effects. Nevertheless, it is evident that there are some local factors that limit our capability of disentangling the effect of biota when we test rock hardness/strength on a rocky surface. Widening the spatial scale of analysis is not sufficient to remove this site effect. This happens because there is a lack of knowledge on how biota, especially sessile ones, interact with the surfaces of coastal rocks. In particular, it would be relevant to learn how the covered rock surface changes its chemical composition and mechanical property, as well as quantify this change for different types of biota and surface coverage. Both biota and rock are very complex, and more than a single method to explore the problem is required. We suggest that it would be worthwhile to combine experiments and simulations to overcome this problem. In fact, experimentally assessing the quantitative contribution of biota to the overall rock surface remodeling, differentiating it from the contribution of other weathering agents, may be prevented by the difficulty of working out a suitable experimental design, whereas a computational approach allows for the extrapolation of the role of biota from that of other weathering agents. Moreover, materiomics consider the hierarchical contributions of each of the sub-components constituting biological materials.
We propose combining the materials science and environmental science approaches at the intersection of mechanics and biology and hypothesize that the activity of sessile biota alters the surface property of coastal rock by changing both its mechanical strength and chemical composition. We hypothesize that bioerosion occurs primarily at the interface between biota and coastal rock and cause the rock surface to lose its strength, which couples with physical and chemical weathering and wave erosion to shape landforms effectively.
The parallel experimental and computational modeling approach may offer a synergic solution able to accelerate the processes of identification of single components acting in complex dynamic systems; moreover, it is a viable way to validate experimental results or hypotheses in simplified environments, allowing the calibration of new methodologies to save time and funds, which is a fundamental issue in any research field.
The effects of bioerosion and bioprotection have remarkable practical value in bridging the knowledge gap between the evolution of coastal landforms and the environmental changes due to human activities. Lack of such knowledge prevents us from understanding the significance of the impact of biota on the long-term evolution of coastal landforms and human activities connected to them.


