1. Introduction
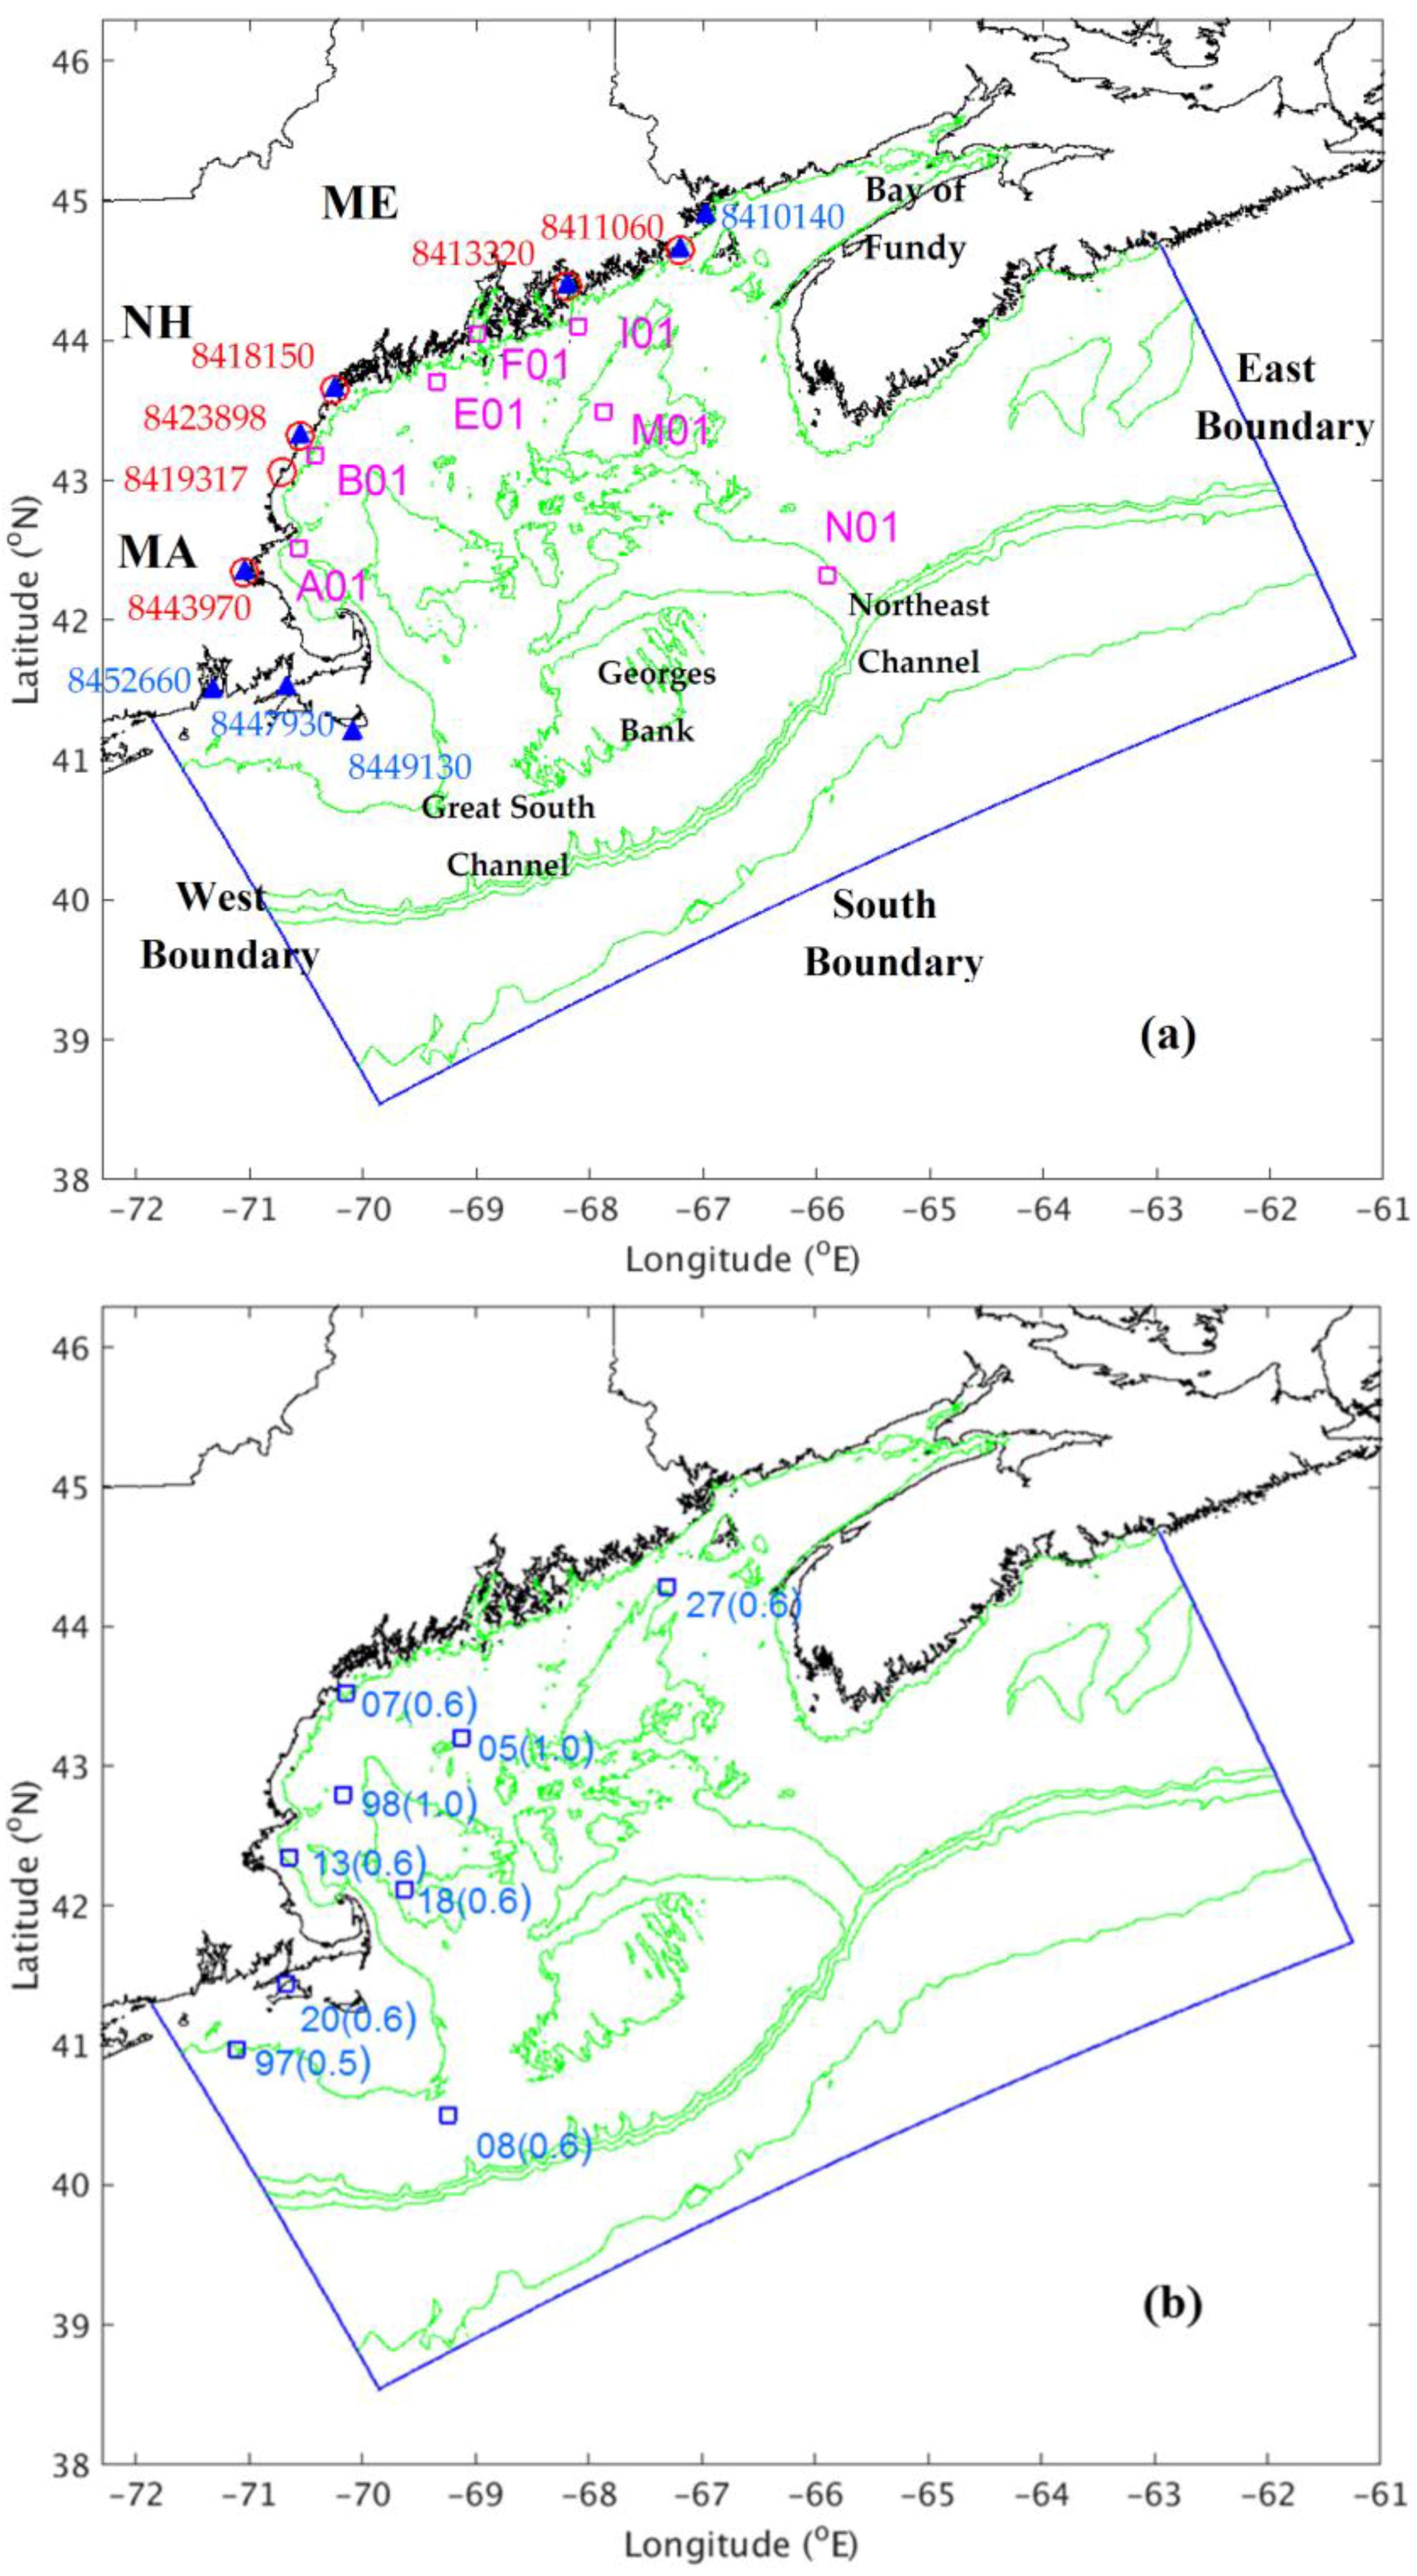
The Gulf of Maine (GoM) is a semi-enclosed coastal basin located along the coastline of the northeastern U.S. (
Figure 1). It is surrounded by the New England coast to the west and to the north. It is adjacent to the Bay of Fundy (BF) to the northeast and is bounded by the coast of Nova Scotia to the east. To the south, the Gulf water communicates with the open ocean through a series of shoals, banks and channels, such as Nantucket Shoals (NS), the Great South Channel (GSC), Georges Bank (GB), the Northeast Channel (NEC), Brown Bank (BB), and the Cape Sable Channel (CSC).
The GOM/GB system demonstrates a broad variety of physical oceanography phenomena such as a complicated circulation system, intense tidal currents, fronts, internal tides, etc. Baroclinic hydrography, barotropic tidal dynamics, and meteorological factors are responsible for incurring their existence and modulating of their intensity. Their relative significance varies spatially as well as seasonally [
1,
2,
3,
4,
5].
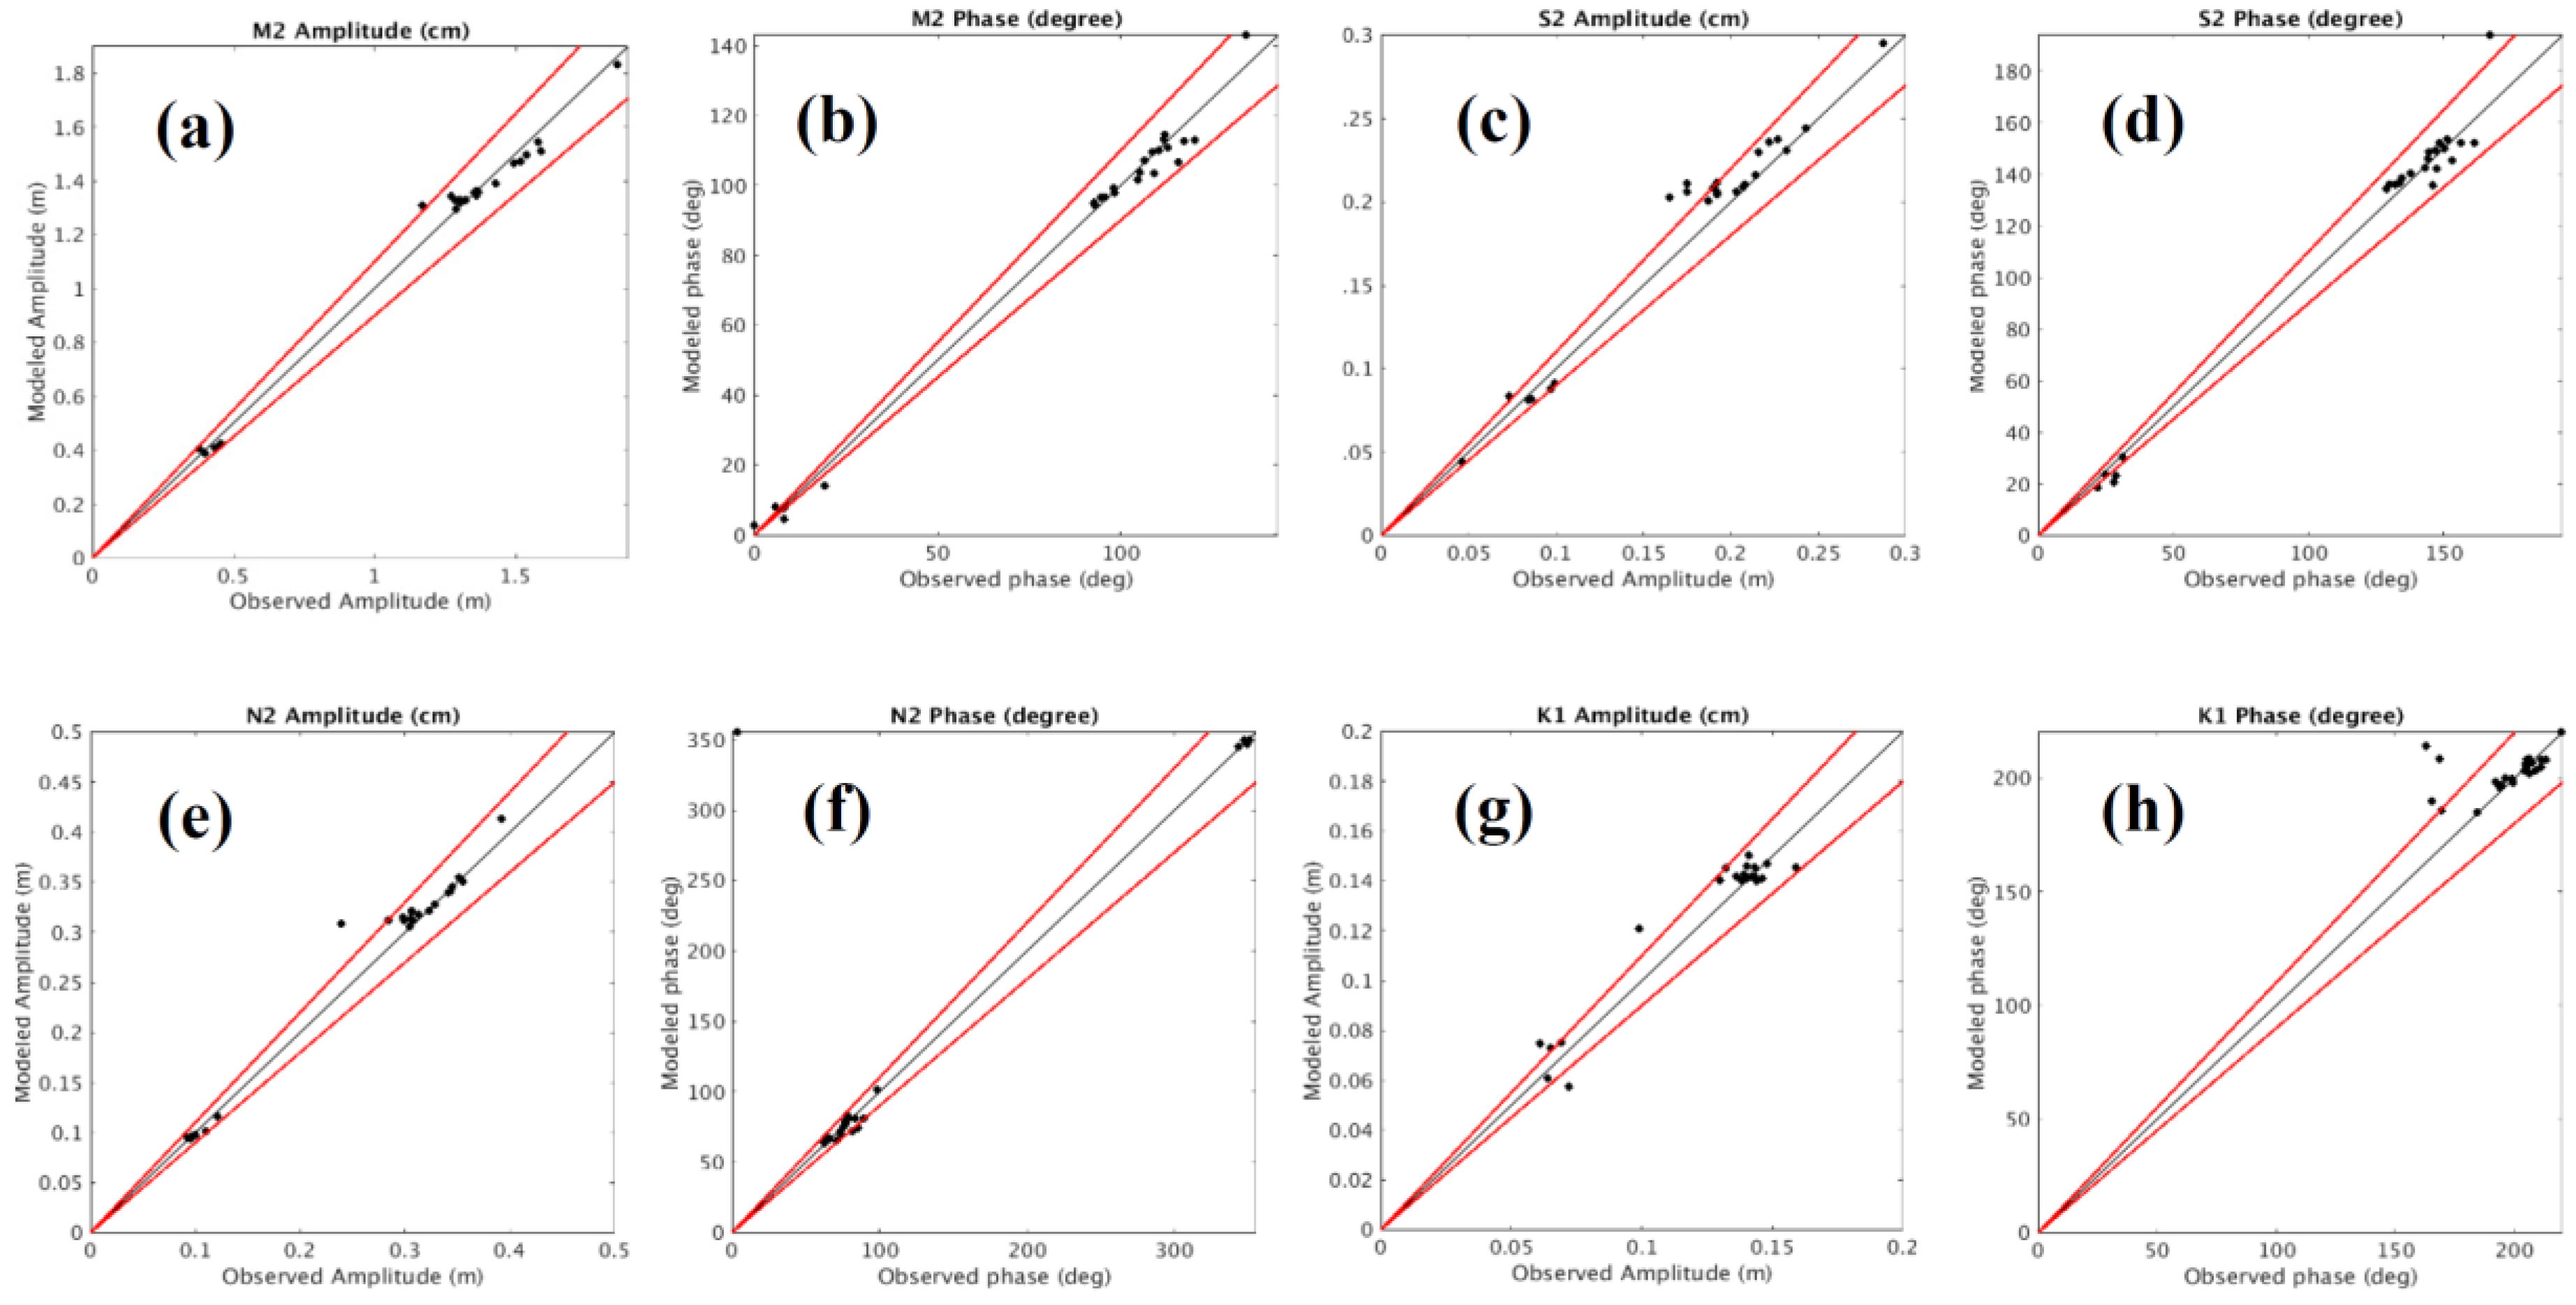
The area is well known for its significant tidal fields. The tidal range is greater than 3 m along the northern and western coast and over 5 m in the BF. The tidal currents are as high as 0.5 to 1 m/s over the NS and GB. The tidal dynamics are heavily involved in forming the circulation, fronts, etc. [
6]. Within the Gulf, tides are forced by ocean tides along the shelf break. Five tidal constituents, M
2, S
2, N
2, K
1, and O
1, account for 94% of the total tidal potential energy, while the M
2 constituent contributes over 80% of the total energy [
7].
Researchers have explored the hydrodynamics of the area using various types of numerical models, such as the finite difference [
8,
9,
10], finite element [
4,
11], and finite volume [
12] models. Greenberg [
8] and Naimie et al. [
4] investigated the tidal dynamics of the M
2 astronomical constituent. Using the ADvanced CIRCulation (ADCIRC) model (ADCIRC), Yang and Myers [
11] investigated the pathway and intensity of the barotropic M
2 tidal energy flux. Chen et al. [
12] studied both barotropic and internal tidal dynamics in the region using the Finite Volume Coastal Ocean Model (FVCOM).
Several of the numerical studies focused on investigating the three-dimensional (3-D) hydrodynamics of the area. Naimie and Lynch [
4] studied summer season stratification in the GB area using the unstructured-grid finite element model QUODDY. Chen et al. [
9] used the modified Princeton Ocean Model (ECOM-si) to investigate the dynamics of the tidal currents rectifications and its impact on the formation of upwelling in the GB region. Xue et al. [
5] simulated the seasonal circulations using the Princeton Ocean Model (POM). Gangopadhyay et al. [
13] developed a multiscale feature model to study the characteristic physical circulation features. To support the Gulf of Maine Ocean Observing System (GoMOOS) operations, Xue et al. [
10] developed the POM-based nowcasts/forecast system to produce real-time, 3-D distribution of circulation and water properties. More recently, Wilkin et al. [
14] developed the data-assimilative “Doppio” real-time and reanalysis ROMS system to make the forecast of hydrodynamics for the broad Mid-Atlantic Bight and the GoM regions.
The National Ocean Service (NOS) of National Oceanic and Atmospheric Administration (NOAA) has recently been working on developing an operational oceanographic nowcast/forecast system for the Gulf of Maine (GoMOFS). The GoMOFS aims to produce real-time nowcast and short-range forecast guidance for water levels, 3-dimensional currents, water temperature, and salinity over the broad GoM region. It will support the GoM harmful algal bloom (HAB) forecast, marine navigation, emergency response, and the environmental management communities.
The GoMOFS uses the Regional Ocean Model System (ROMS) [
15] as the hydrodynamic model. In developing the GoMOFS, we conducted a one-year hindcast simulation for the year of 2012 and evaluated the model performance using the NOS standard skill assessment software [
16].
This article describes the model setup and skill assessment results of the hindcast simulation. It is organized as follows. This section reviews the general hydrodynamics in the Gulf, previous numerical studies, and NOAA’s initiative in developing the GoMOFS.
Section 2 describes the model setup of the 2012 hindcast simulation.
Section 3 describes the observed data used for the skill assessment.
Section 4 presents the model results.
Section 5 describes the skill assessment results.
Section 6 states the conclusion and summery.
2. Model Setup
The GoMOFS model has a nearly rectangular domain that goes from the eastern Long Island Sound in the west to the shelf of Nova Scotia in the east and extends to the deep ocean outside of the shelfbreak (see
Figure 1). It has an orthogonal model grid with horizontal dimensions of 1177 by 776 and a uniform spatial resolution of 700 m. The grid resolved major coastal embayments including Cape Cod Bay, Boston Harbor, Casco Bay, Penobscot Bay, and the Bay of Fundy. However, the 700-m resolution prohibits the model from resolving small scale coastal features such as navigation channels and river courses, e.g., the Cape Cod Canal. The grid has three open ocean boundaries (see the blue lines in
Figure 1): the western boundary in the western Long Island Sound, the southern boundary outside the shelfbreak to the southeast of the GoM, and the eastern boundary across the shelf of Nova Scotia.
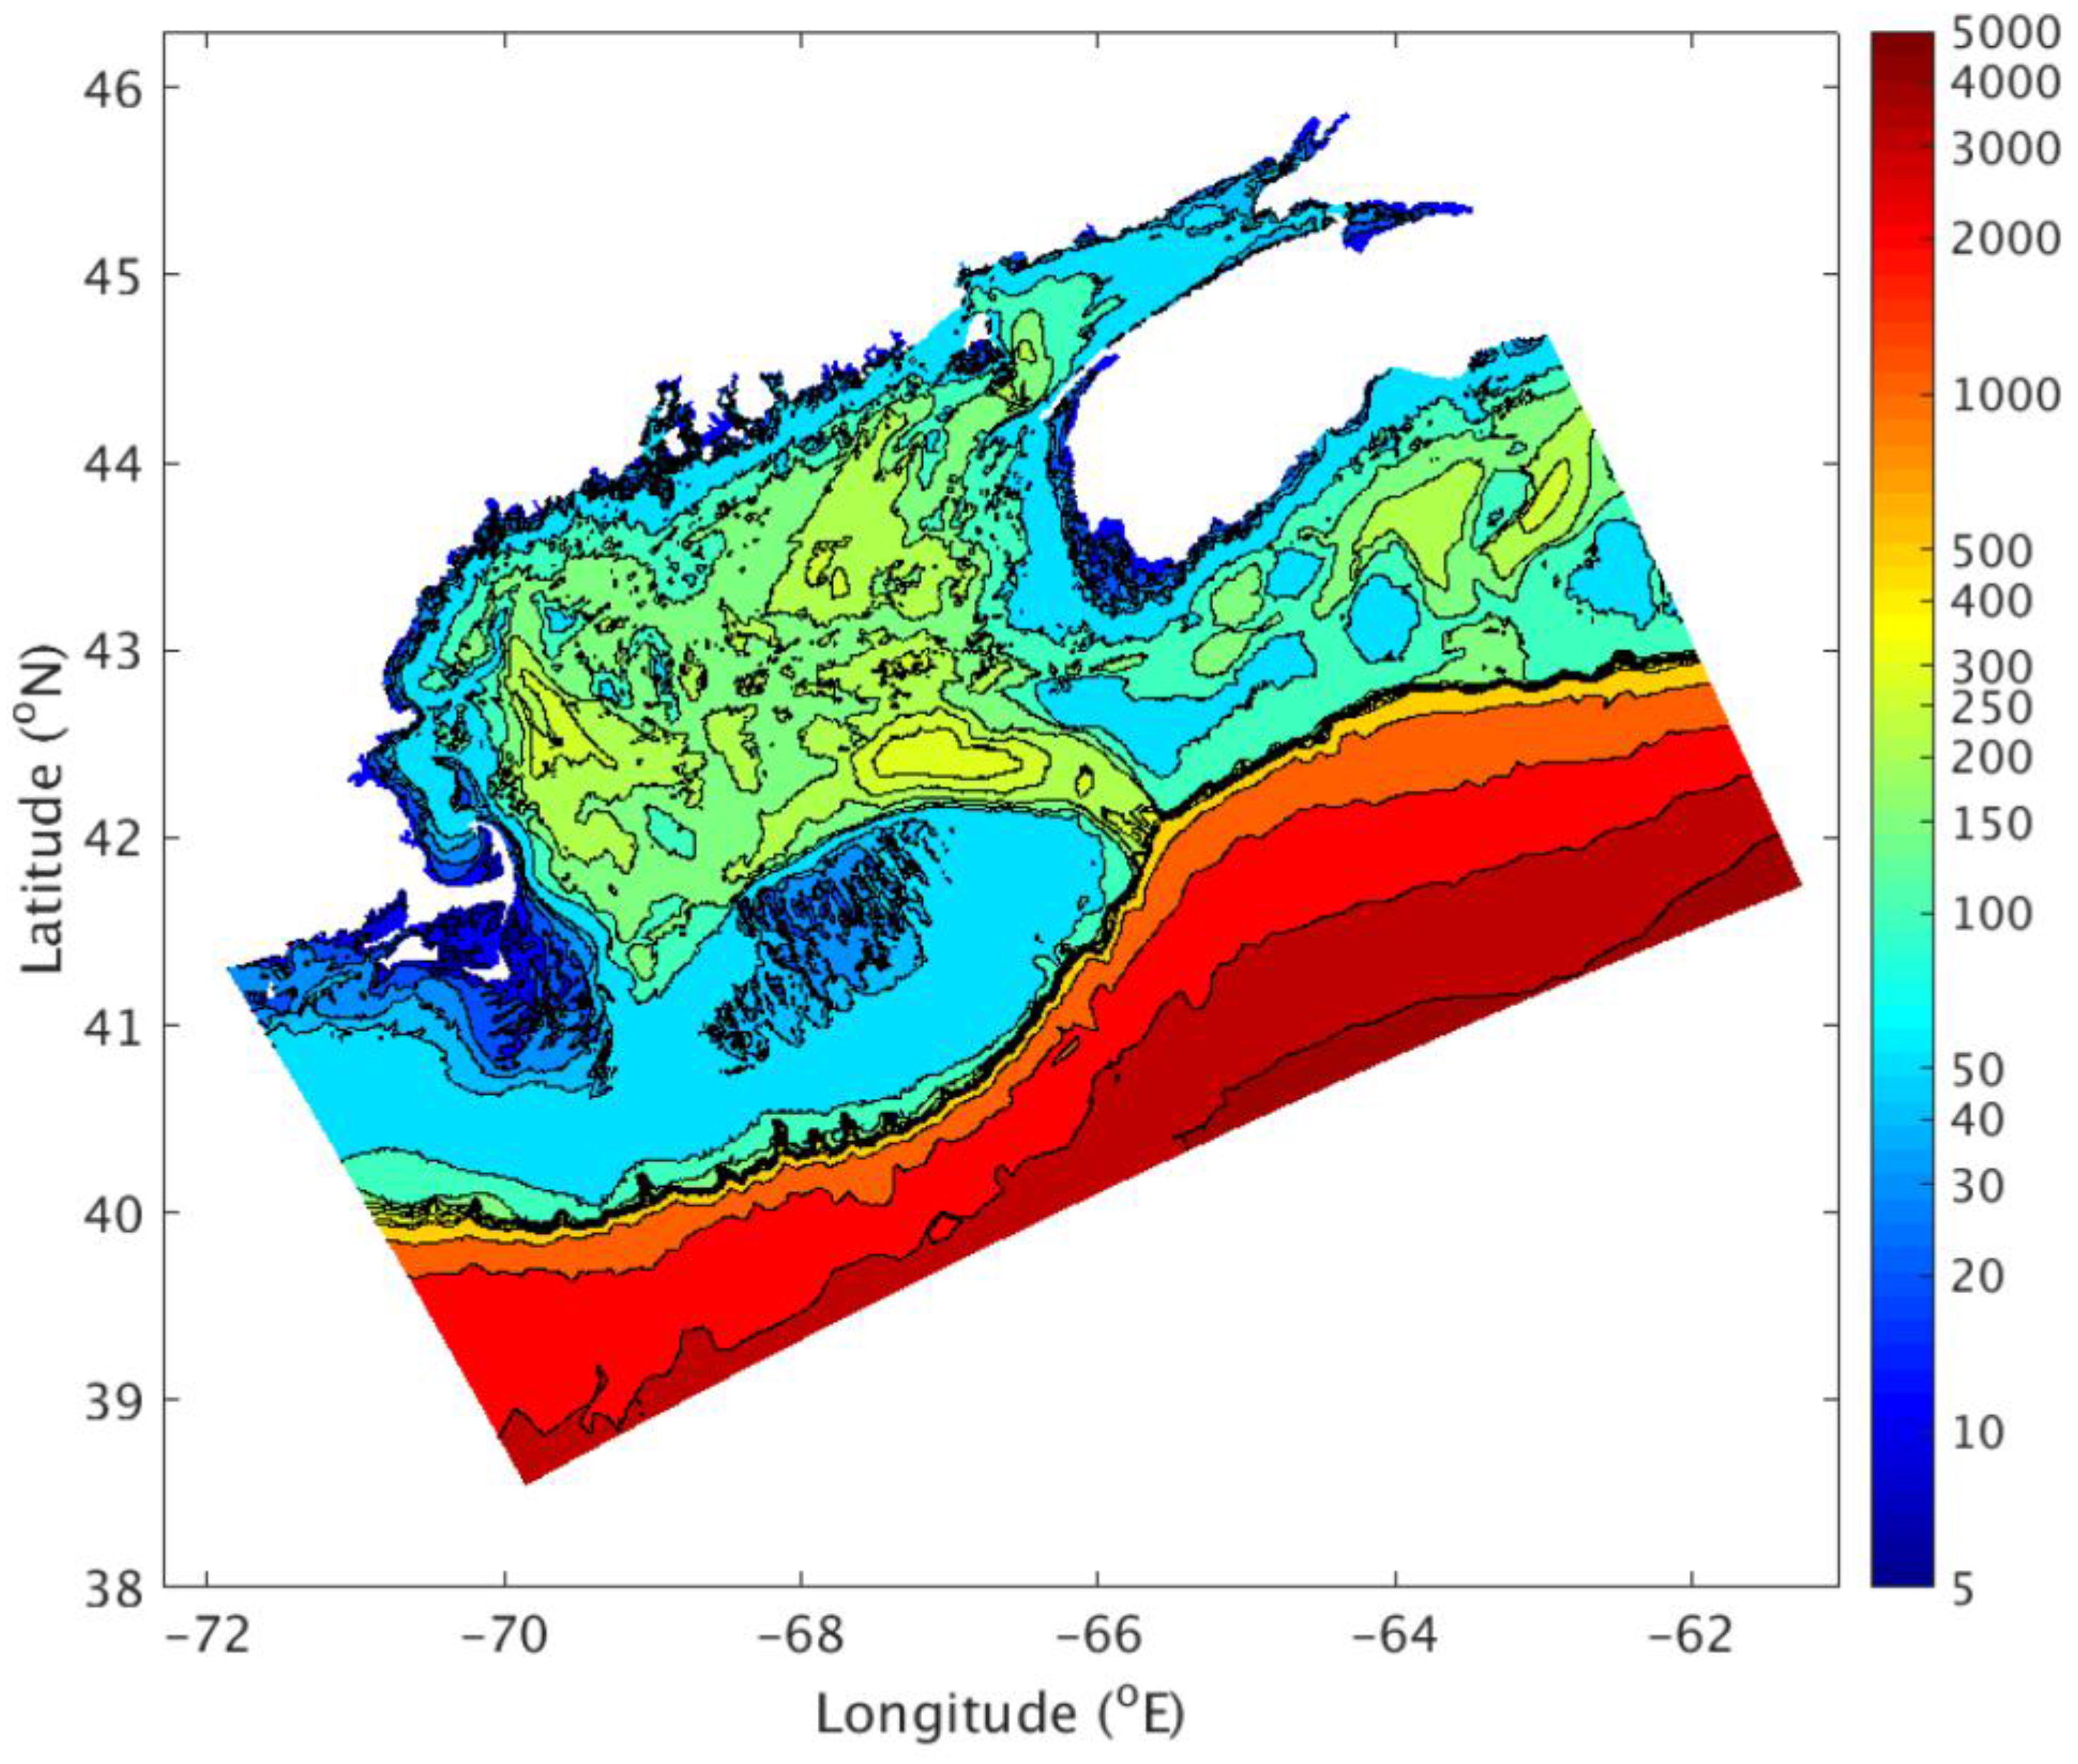
The bathymetry of the model grid was populated by linearly interpolating the combined VDatum ADCIRC model grid bathymetry [
17] and the bathymetry in the 2-min Gridded Global Relief Data (ETOPO2) [
18].
Figure 2 displays the color coded bathymetry. The model grid resolves key bathymetric features such as Georges Bank, the Northeast Channel, the Great South Channel, etc.
The model is configured with 30 sigma layers. It uses the ROMS wetting and drying feature, a quadratic bottom friction scheme, and the two-equation model of the “revised” Mellor-Yamada Level 2.5 turbulence closure scheme (GLS/k-kl) implemented through the ROMS generic length scale (GLS) module.
For the open ocean boundary, we adopted the implicit Chapman condition for the free surface, the Flather condition for the 2-D momentum, and the radiation-nudging condition for the 3-D temperature, salinity, and velocity.
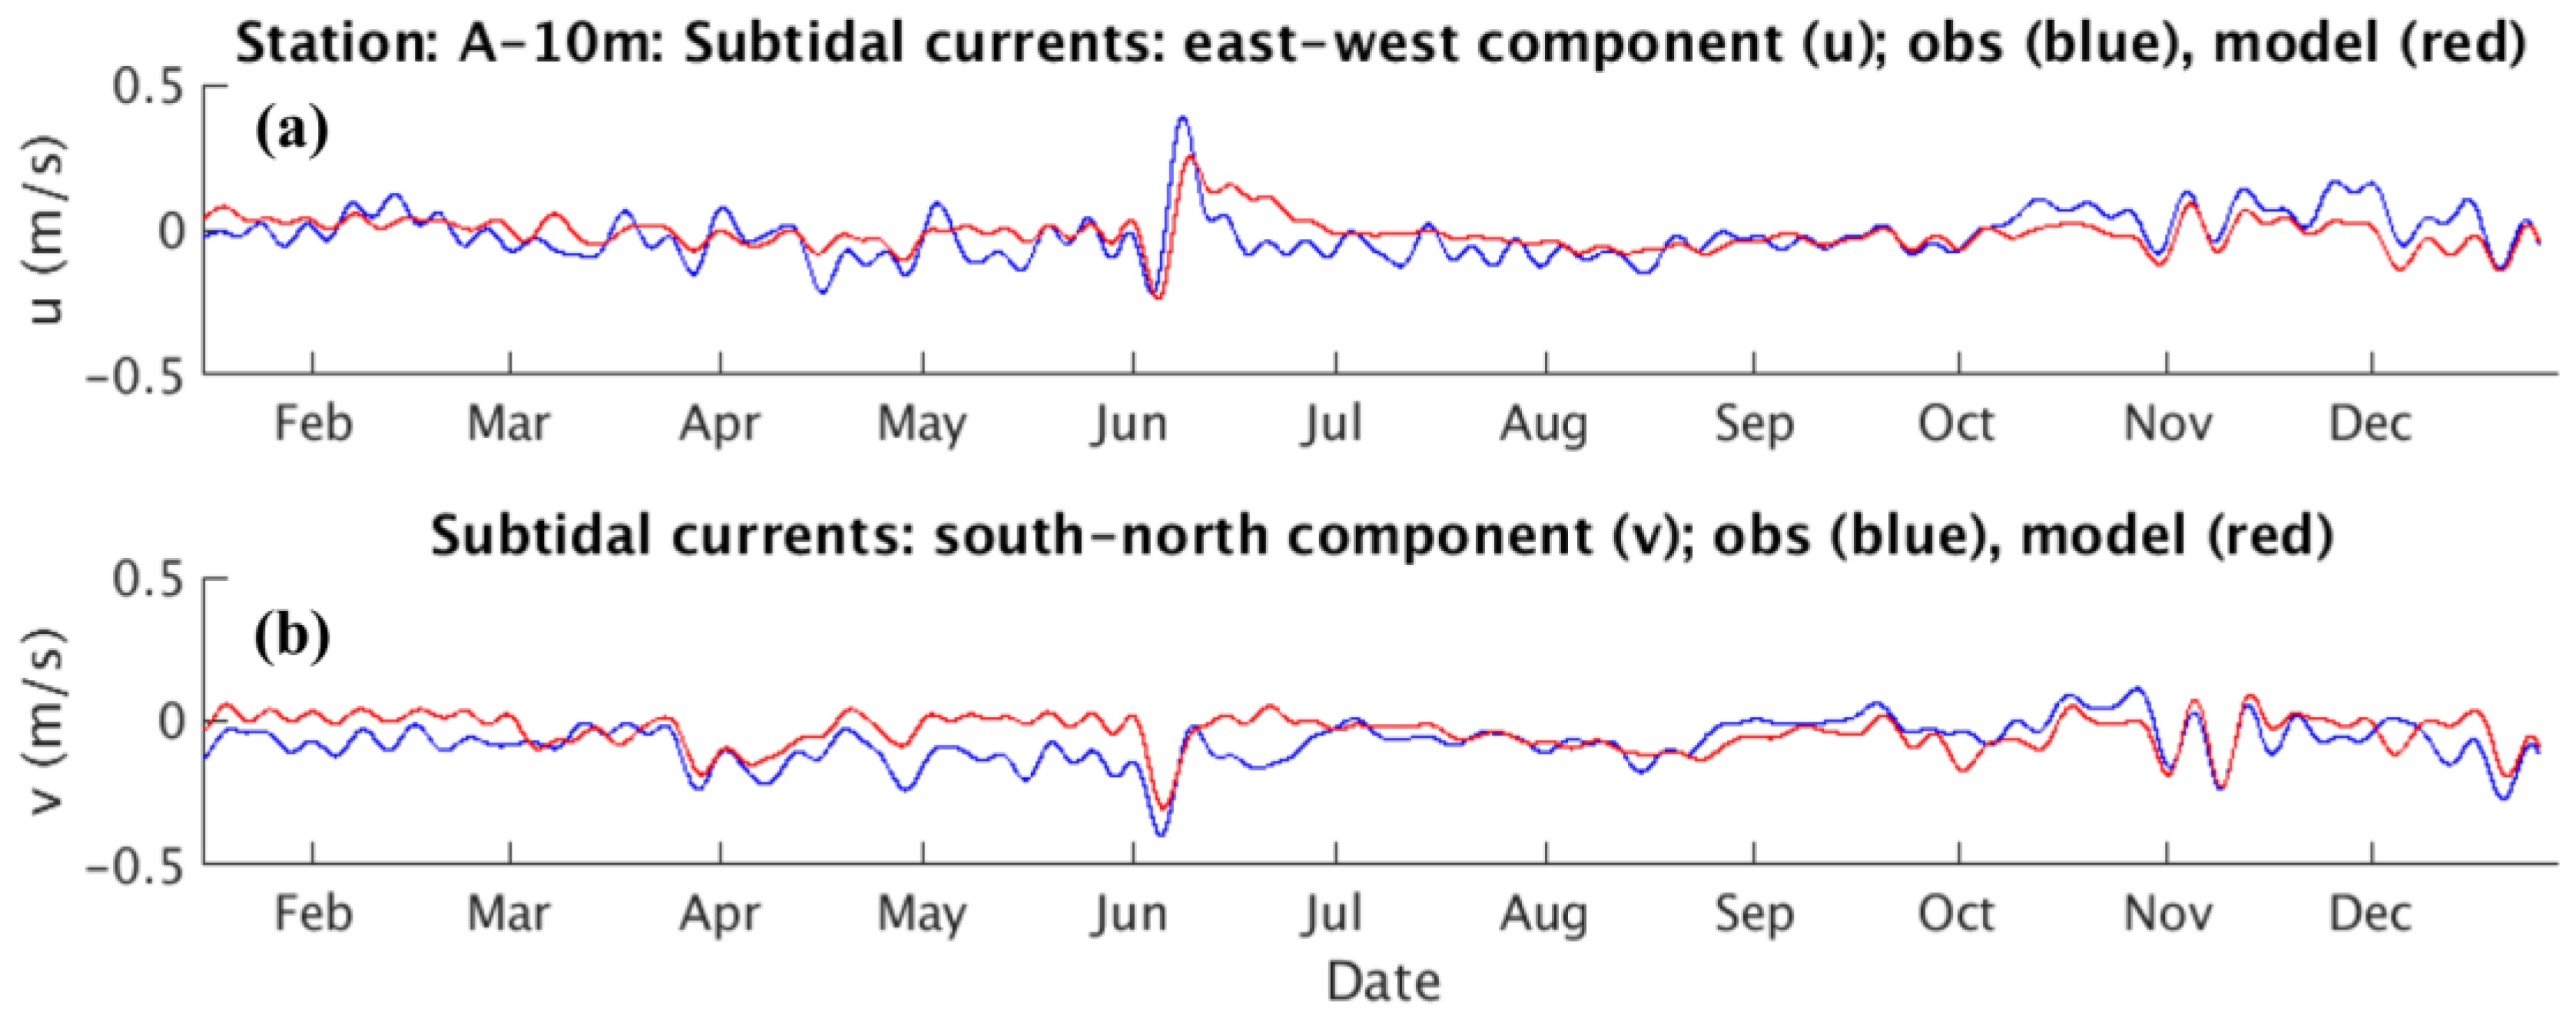
The hindcast simulation was driven with the complete suite of model forcing data including open ocean boundary forcing of the tidal and subtidal water level, 2-dimensional depth-averaged tidal currents, 3-dimensional temperature (T), salinity (S), and subtidal currents, river discharge, and the sea-surface meteorological forcing. It is noted that in the current setup the atmospheric pressure was not applied as a model forcing. Instead, we factored in the pressure effect by applying an inverse barometric pressure adjustment on the simulated water levels. In fact, we tested a setup with the air pressure forcing and the results appeared to be less satisfactory in terms of the model-data agreement.
The tidal water levels and currents on the open ocean boundaries were calculated using the tidal and currents harmonics of the TPXO 8.0-Atlas tidal database developed at the Oregon State University [
19]. We chose eight tidal constituents (M
2, S
2, N
2, K
2, K
1, O
1, P
1, and Q
1) as the tidal forcing. The database was of the 1/30° horizontal resolution and was interpolated onto the GoMOFS grid. Some adjustment on the tidal amplitude and phase along the model’s open ocean boundary was made to optimize the model-data agreement at the water level stations. The adjustment was made through a trial-and-error procedure. In quantitative details, the amplitude was altered by −7.0 cm for M
2, −1.5 cm for S
2, −0.5 cm for N
2, 1.0 cm for P
1, and 3.0 cm for K
1; the phase was altered by 8.0 degrees for M
2, 2.0 degrees S
2, 6.0 degrees for N
2, 6.0 degrees for K
2, 8.0 degrees for P
1, and 10.0 degrees for K
1.
The non-tidal open ocean conditions used the nowcast results from the Global Real-Time Ocean Forecast System (G-RTOFS) [
20,
21]. The G-RTOFS is being operated by the NOAA National Centers for Environmental Prediction (NCEP). It is based on the Naval Oceanographic Office’s configuration of the 1/12° eddy resolving global Hybrid Coordinates Ocean Model (HYCOM). Its ocean model has 4500 by 3298 horizontal dimensions and 32 vertical hybrid layers (isopycnals in the deep, isolevel in the mixed layer, and sigma in shallow waters). The system assimilates in situ profiles of temperature and salinity from a variety of sources and remotely sensed SST, SSH and sea-ice concentrations. The G-RTOFS is forced with 3-hourly momentum, radiation, and precipitation fluxes from the operational NCEP Global Forecast System. It runs once a day and produces nowcasts and forecast guidance for sea surface values (SSH, SST, and SSS) at three hour intervals, and full volume parameters (3-dimensional temperature, salinity, currents, and mixed layer depths) at six-hourly interval. The nowcast outputs of the three-hourly water level and the six-hourly 3-D currents and T/S as the non-tidal forcing were spatially interpolated onto the model grid’s open ocean boundaries and temporally interpolated across the hindcast period of the entire year of 2012.
It is noted that no adjustment on the G-RTOFS data were performed to improve the accuracy of the open ocean boundary conditions. Due to the lack of real-time observations at locations along the GoMOFS open boundary, it is not feasible to realize the adjustment during the GoMOFS operational practice. Considering that the hindcast simulation with the non-adjusted G-RTOFS forcing demonstrated skills meeting the NOS standard skill assessment criteria (
Section 5), we decided to accept the “flawed” model configurations and the results therein in the forecast implementation. It is noted that data assimilation should ultimately be the methodology (being considered for future NOS OFS implementations) to solve this kind of input errors.
The river forcing includes discharges from nine rivers along the Gulf coast. From north to south they are: St. John River, St. Croix, Machias River, Penobscot River, Kennebec River, Androscoggin River, Saco River, Merrimack River, and Neponset River. The river discharge and water temperature data were the U.S. Geological Survey (USGS) river discharge observations [
22]. Note that the river discharge data were available at locations usually far from the river mouths. In the hindcast setup, the magnitude of the discharge was increased by 20%. This factor was determined through a series of empirical trial-and-error experiments.
The salinity was specified to be zero for all nine rivers. The assumption of zero salinity was the recourse that was decided upon after considering factors such as data availability, the model grid configuration for the river course, and the skill of the hindcast run results. The GoMOFS model grid goes into the river course by four to ten kilometers for different rivers rather than defining the river entrance by the nodes immediately along the open coast. The distances from the open coast are not large enough to fully justify the zero salinity assumption. However, there is a lack of salinity observations of the river discharge. Hence, following the “informal” common practice, we specified the zero salinity values rather than choosing any other arbitrary value. As an ad hoc justification for the zero-salinity assumption and for the adjusted discharge, the hindcast salinity demonstrated reasonably good agreement with the observations (
Section 5).
The hindcast made use of the 12-km resolution forecast guidance of the NOAA National Center for Environmental Predictions (NCEP’s) North American Mesoscale Forecast Modeling System (NAM) for surface forcing. The ROMS model was forced with 10-m wind velocity to compute the surface wind stress, 2-m surface air temperature and relative humidity, total shortwave radiation, downward longwave radiation, and the ROMS bulk formulation to calculate the air-sea momentum and heat fluxes, evaporation and precipitation rate to calculate the net salinity flux across the air-sea interface.
Two scenarios of model simulations were conducted: a tidal forcing only simulation and a hindcast simulation of year 2012. The model configuration in both simulations remains the same except that the former was initialized with constant water temperature and salinity and forced with tidal water level and currents on the open ocean boundary, whereas the latter was driven with the total water level and currents on the open ocean boundary, sea-surface meteorological forcing, and river forcing. The purpose of the tidal only simulation was to verify the tidal open ocean boundary setup so as to ensure a favorable model performance in reproducing realistic water levels.
3. Observation Data
The observed data for the skill assessment are water levels from the NOS Center for Operational Oceanographic Products and Services (CO-OPS) water level stations, temperature (T) from the CO-OPS meteorological observation stations, the National Data Buoy Center (NDBC) buoys, and the Northeastern Regional Association of Coastal Ocean Observing Systems (NeraCOOS) buoys, and salinity (S) and currents from the NeraCOOS buoys.
The water level data in 2012 were downloaded from the NOS CO-OPS Web site [
23]. Of the stations with the real time observations in 2012, the data from six stations (
Figure 1a) were chosen for the model-data comparison by comparing the station location with the model domain and the grid layout. Some other stations located in the small estuaries, embayment, or inter-island channels which were not resolved by the model grid were excluded. They are the stations 8449130 (Nantucket Island, MA, USA), 8447930 (Woods Hole, MA, USA), 8447435 (Chatham, MA, USA), and 8410140 (Eastport, ME, USA).
The water temperature data were collected at five CO-OPS meteorological observation stations, ten NDBC buoys, and seven NeraCOOS buoys (
Figure 1). All three data sets were downloaded from the NDBC online archive [
24]. The CO-OPS and NDBC data were near surface observations. The depths of the CO-OPS and the NDBC measurements are shown in
Figure 1a), respectively. The NeraCOOS measurement depths are listed in
Table 1.
Both the salinity and current velocity data were from the seven NeraCOOS buoys (
Figure 1).
Table 1 lists the corresponding measurement depths. The data were downloaded from the NeraCOOS website [
25].
5. Skill Assessment
We evaluated the hindcast results using the NOS standard skill assessment software [
16]. The model time series of water level, currents, temperature, and salinity were compared against the observed data (
Section 2). In the following, we focused on reporting two key parameters, RMSE and the central frequency (CF). CF represents the fraction (percentage) of the model errors that are less than some prescribed criteria of RMSE. The NOS standard prescribes the criteria as 0.15 cm for water level, 0.26 m/s for the currents speed and 22.5 degree for the phase of currents, 3.0 °C for temperature, and 3.5 psu for salinity, as well as the constant value of CF equal to 90% for all the above ocean state parameters. The present skill assessment results demonstrated that the hindcast performance met the above criteria. It is noted that the one set value criteria are not region specific and may not reflect the regional variability of the concerned variables. Hence it poses limitations on the validity and applicability of the model skill metrics from the criteria.
We compared the criteria with the performance of the nowcast/forecast system of the Gulf of Maine Ocean Observing System (GoMOOS) [
10] in terms of monthly averaged properties (i.e., T, S, and current speeds). In general, the GoMOOS model skill in all three variables meet the NOS criteria, especially for the 3
°C RMSE temperature criteria. The present results (reported in the following) also meet the criteria with large margins at nearly all stations. In this regard, the 3
°C criteria does not pose serious change to the model skill in the GoM region. This seems to indicate that the region specific criteria would be needed to closely reflect the model skill. Bearing this in mind, we adopted the constant criteria in this study before any regional dependent criteria are officially developed in the future.
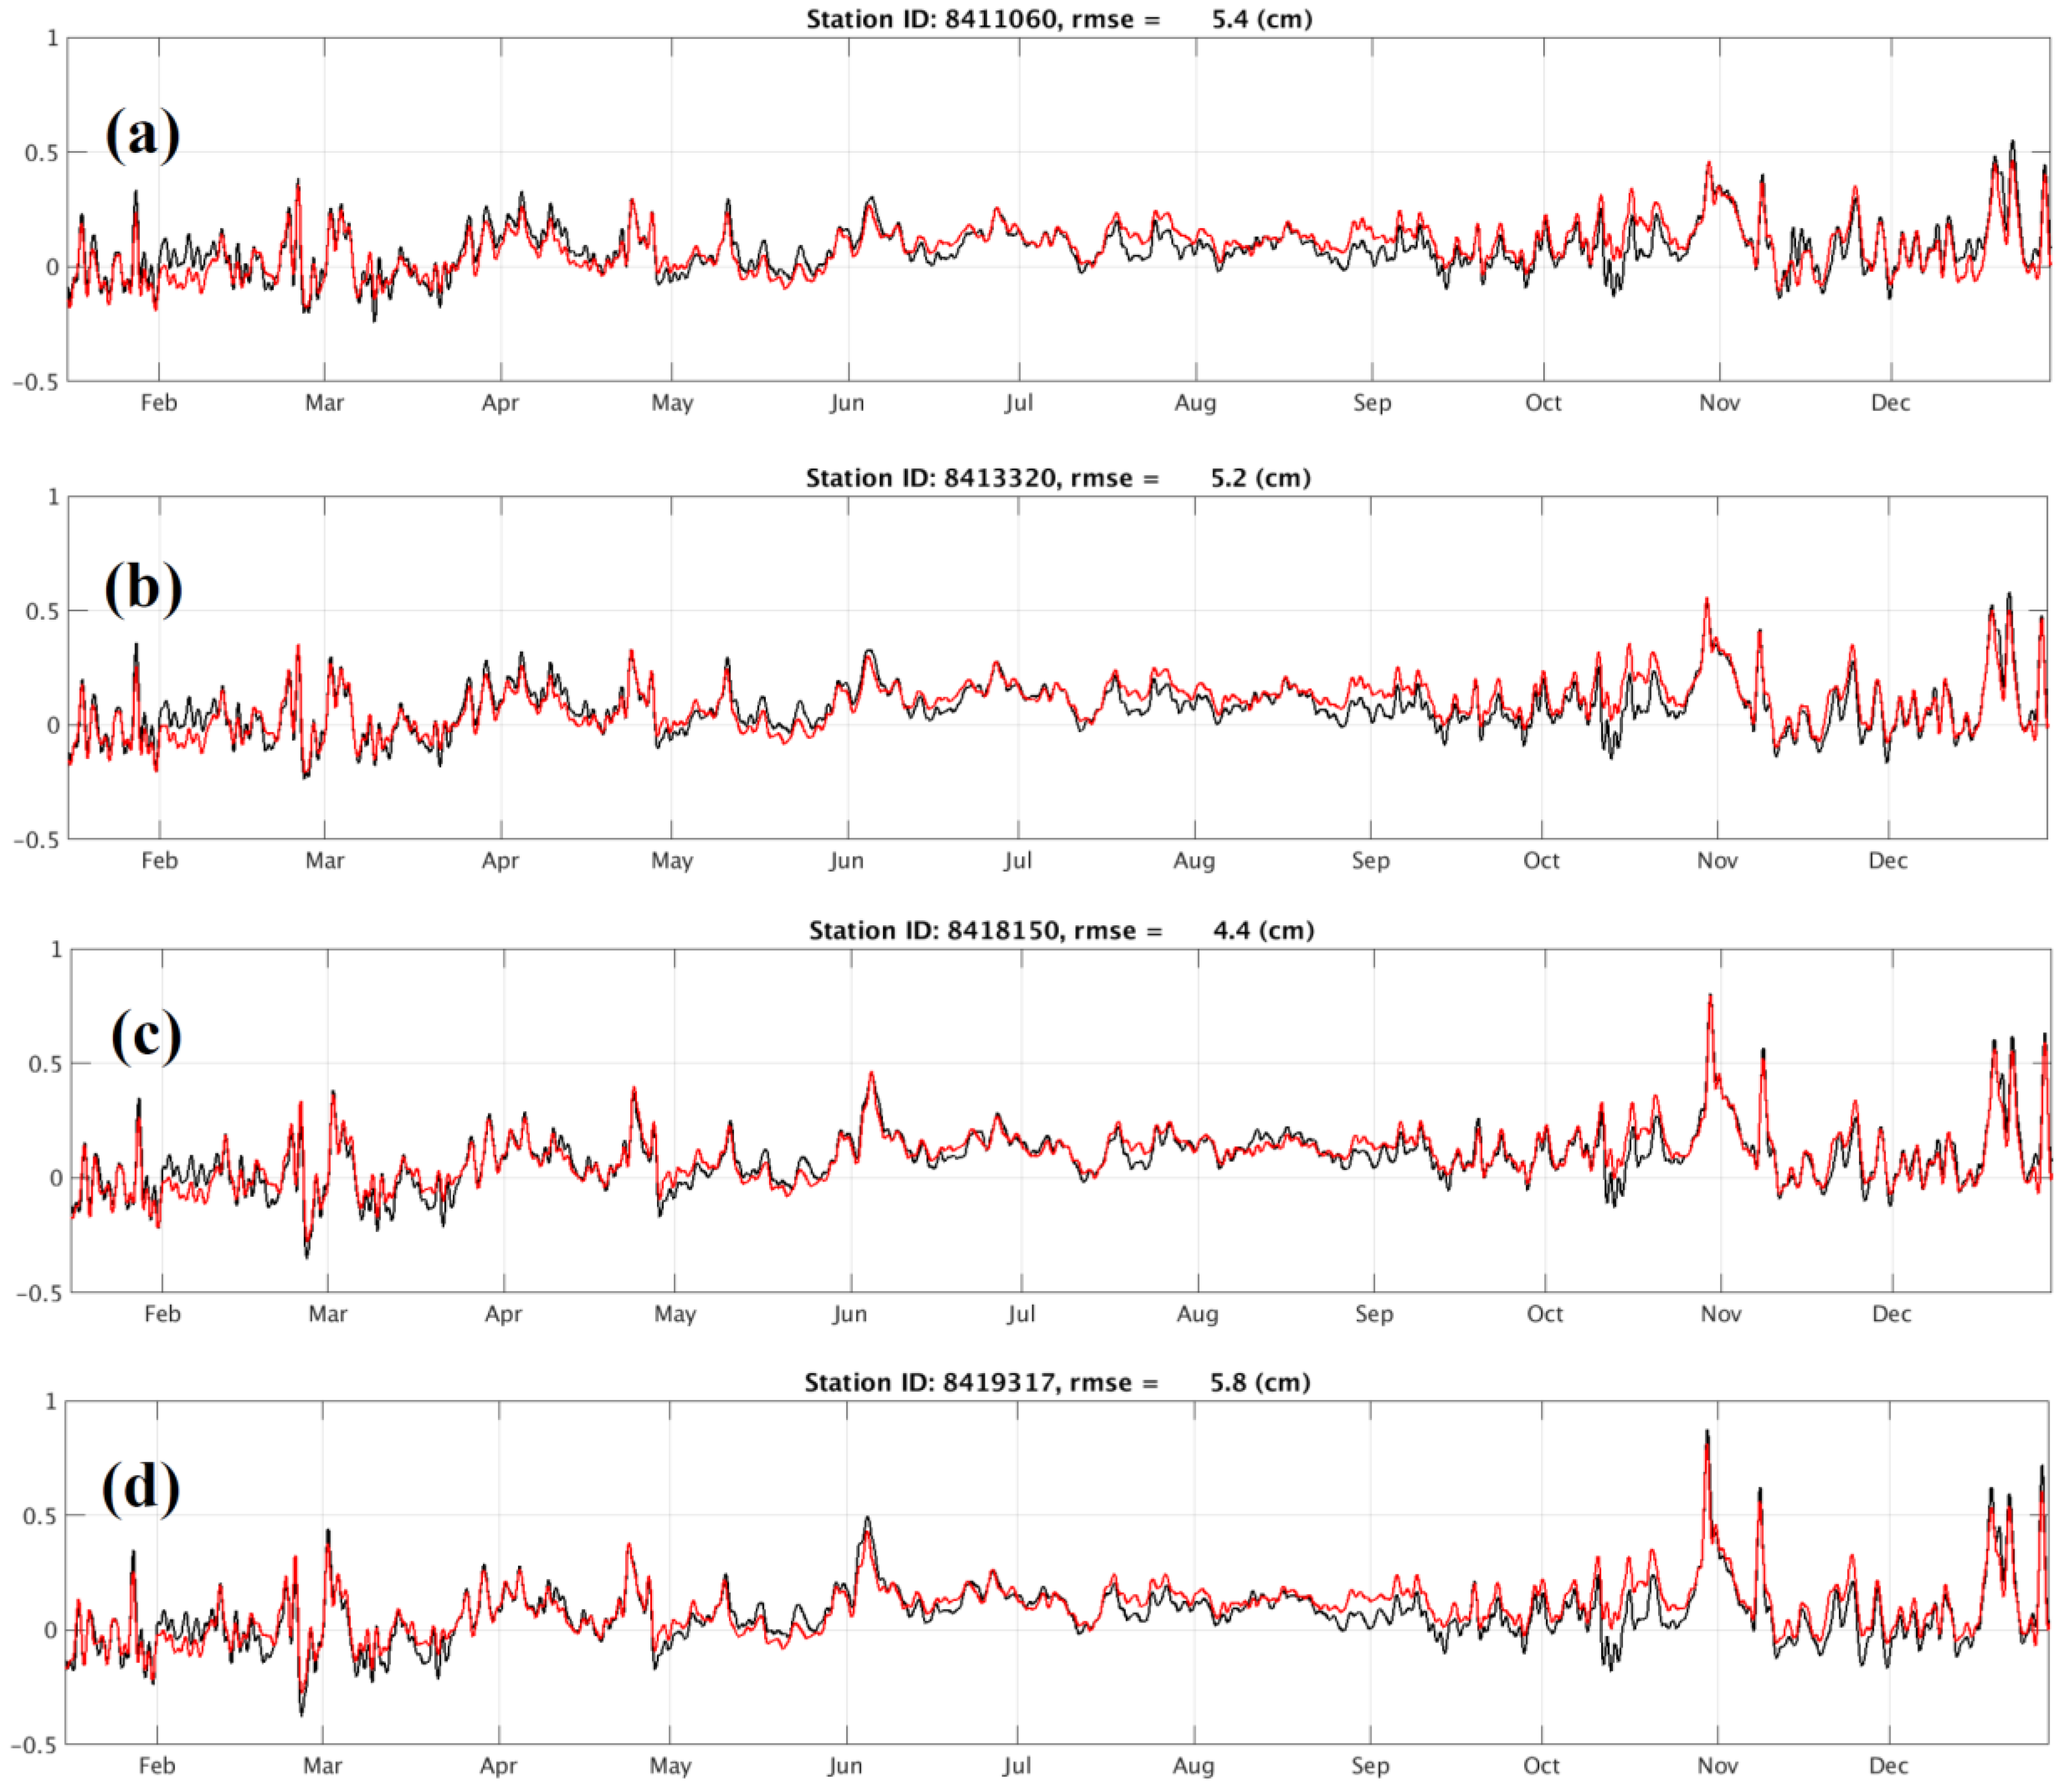
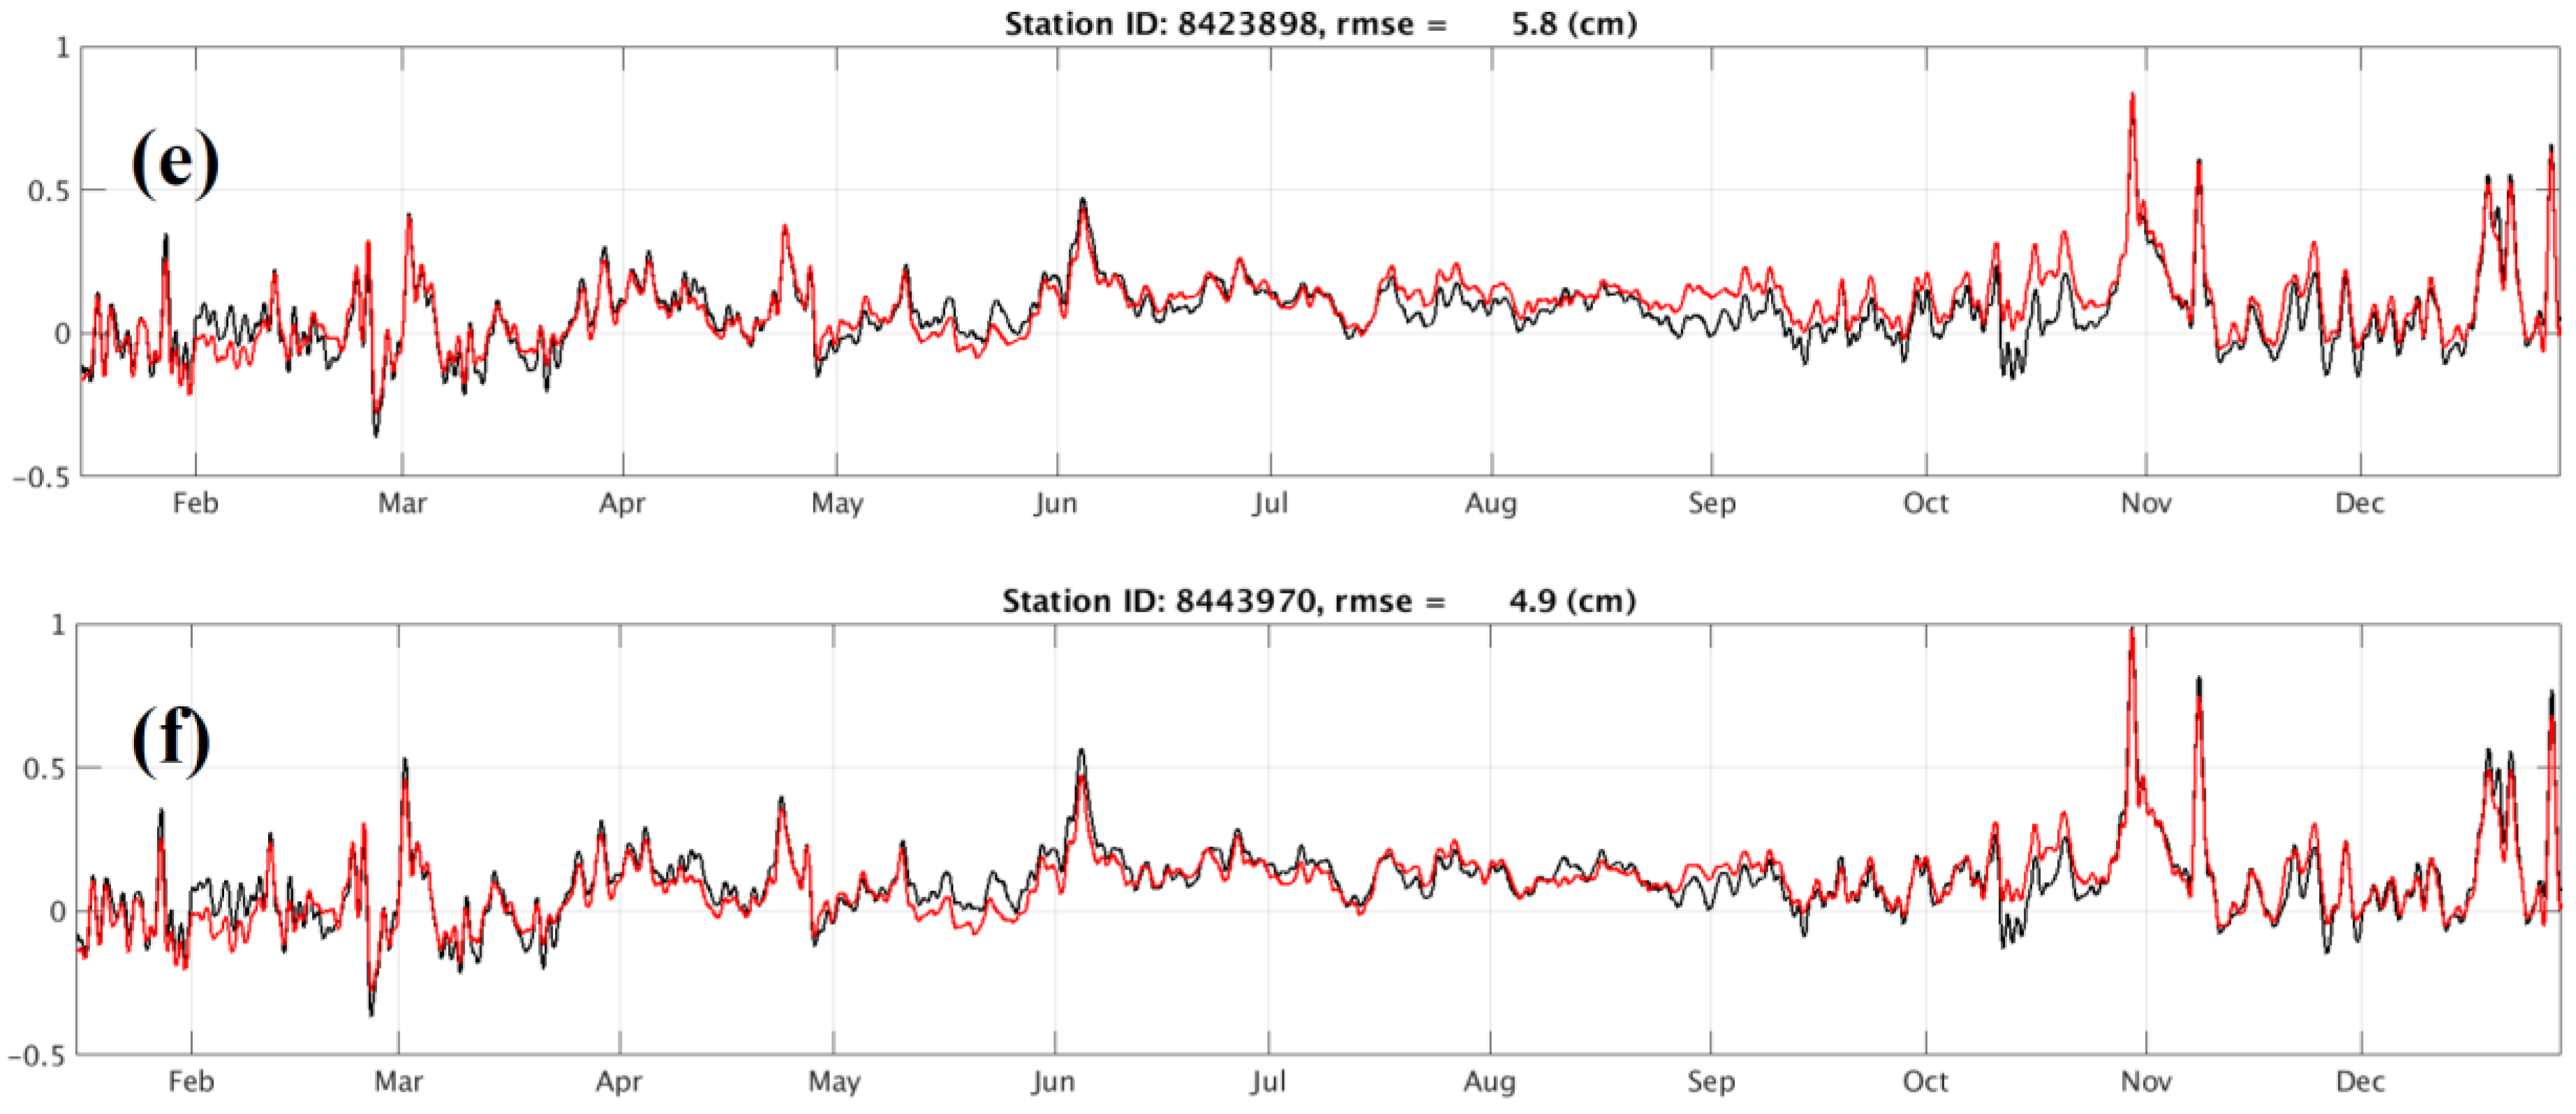
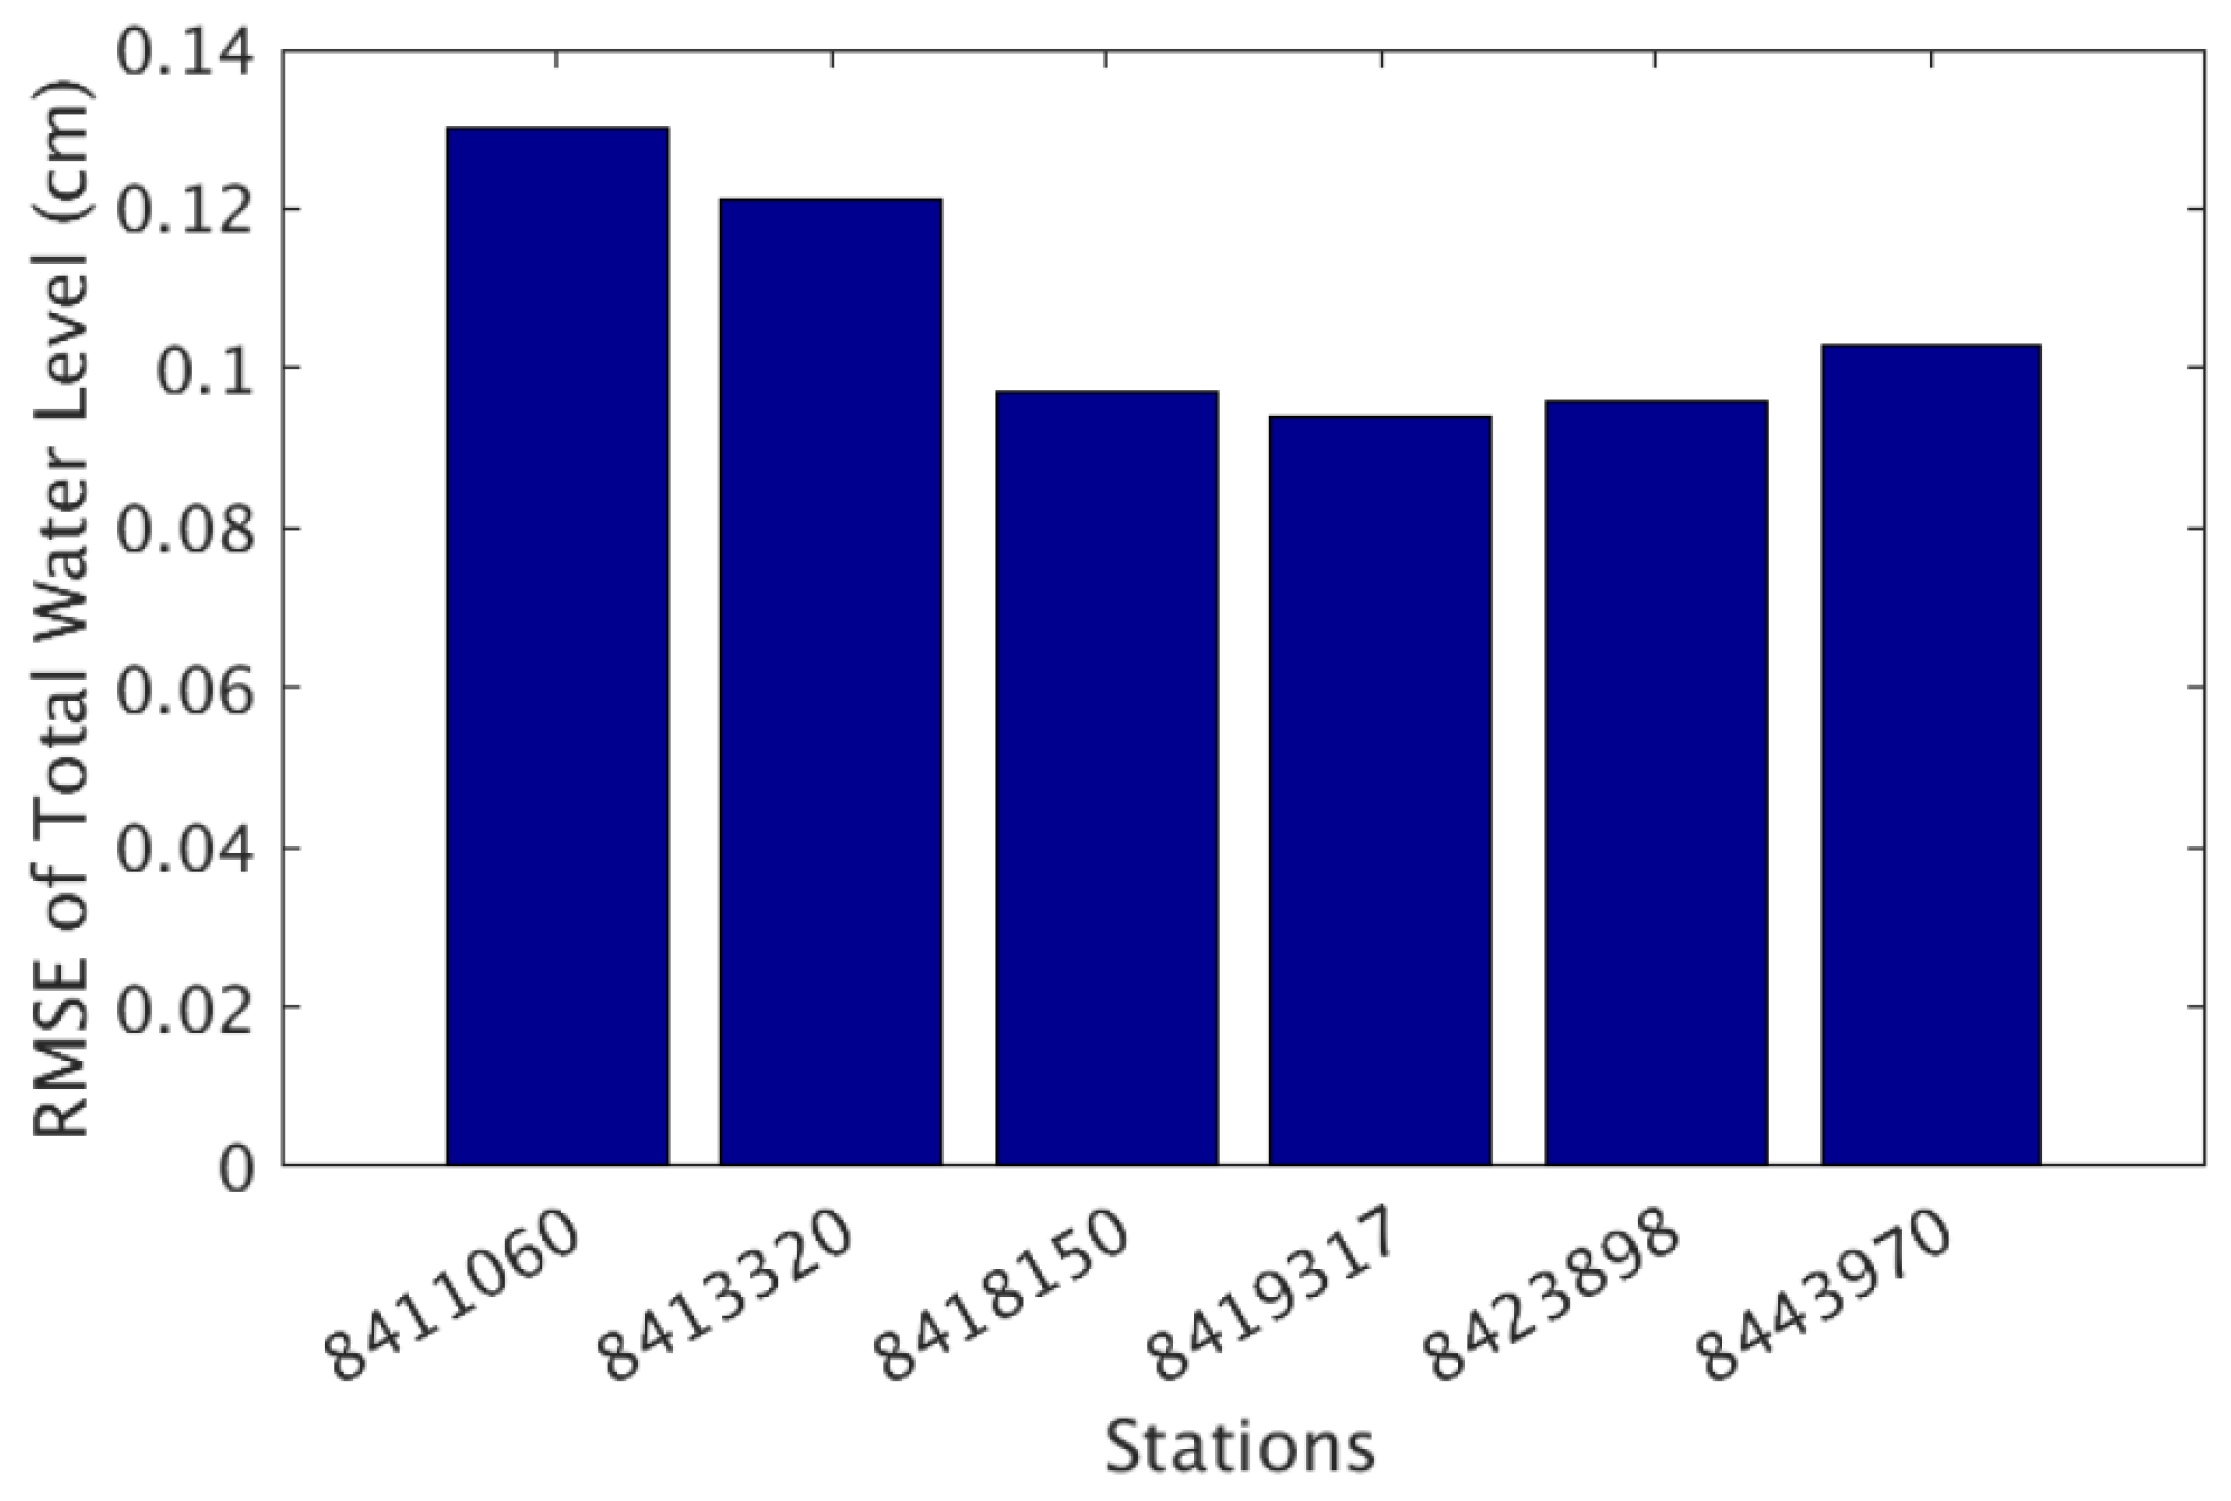
5.1. Water Level
Figure 9 display the model RMSE and CF, respectively. The RMSE ranges nearly from 0.09 m (Station ID 8418150, Portland, ME, USA) to 0.13 m (Station ID 8411060, Cutler Farris Wharf, ME, USA). The CF ranges from 76.2% (Station ID 8411060, Cutler Farris Wharf, ME) to 89.6% (Station ID 8418150, Portland, ME, USA). With respect to the RMSE and CF, the hindcast demonstrated better skill at stations near the central western Gulf coast than that along the Massachusetts coast and the northern Maine coast.
The better model skill in the central domain stations might be attributed to their particular geographical locations. The stations are farther away from either the open ocean boundary (OOB) or the Bay of Fundy (BF) area compared with the other stations. The tidal range in the BF may reach up to nearly 7 m due to the tidal resonance effect (
Section 1). The farther distance naturally made the central domain receive less adverse impact on the model skill due to the inherent inaccuracies in the OOB conditions or the errors in the model predicted tidal resonance effect in the BF.
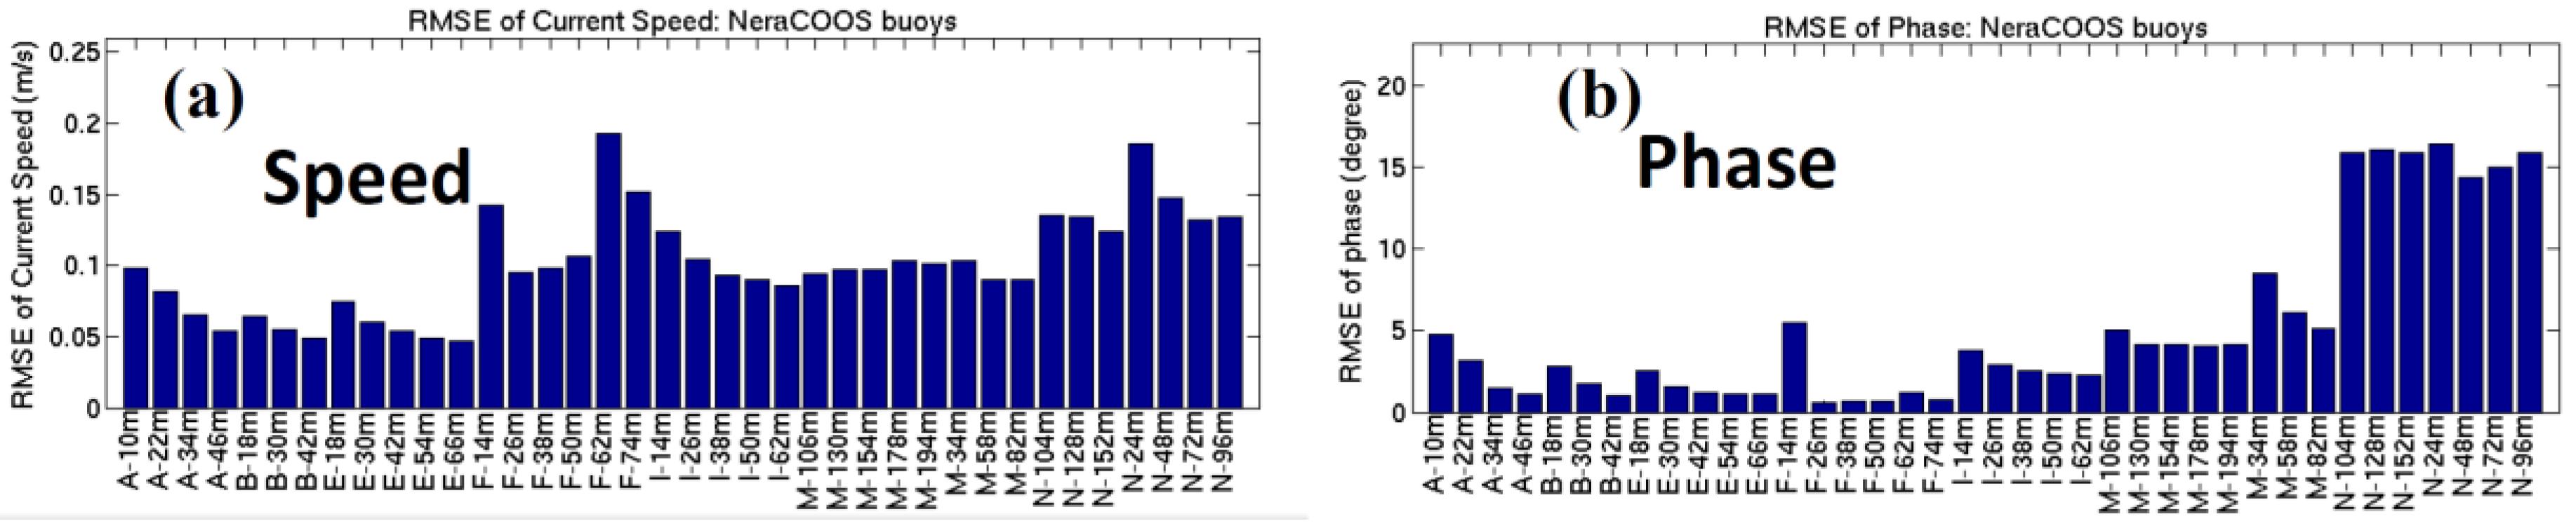
5.2. Currents
Figure 10a,b displays the RMSE the currents speed and phase, respectively. In each figure, the station ID is named with the first letter denoting the buoy ID (
Figure 1) and the following digits denoting the measurement depths in meter.
For the current speed, the RMSE ranges from 0.05 m/s at station E-66m to about 0.20 m/s at stations F-74m and N-24m. CF were mostly greater than 95% and lay between 80% and 90% at stations F-74m and N-24m. At buoys stations A, B, E, F, and M, RMSEs ranged between less than 2 degrees to 10 degrees and CFs were all above 95%. At station N01, RMSE was between 15 cm/s and 17 cm/s and CF was around 85% at all depths.
Note that the station N01 demonstrated significantly less favorable model skills than the other stations. This might be related to the complex hydrodynamics in the Northeast Channel where the station is located (
Figure 1a). The channel has a sill depth of 230 m and is the major pathway for the water mass exchange between the Gulf and the open ocean. The deep ocean water flows into the central Gulf at depths and the Scotian water flows across the channel in the near surface layer. The channel also serves as a major route for tidal energy to propagate into the Gulf. The combined subtidal and tidal currents may reach a speed of 1 m/s or more. In contrast, hydrodynamics in the other areas of the Gulf appear to be much less complex. The complex hydrodynamics in the channel posed more serious challenges to realistically reproduce the local hydrography than elsewhere and contributed to the greater model errors at Station N01.
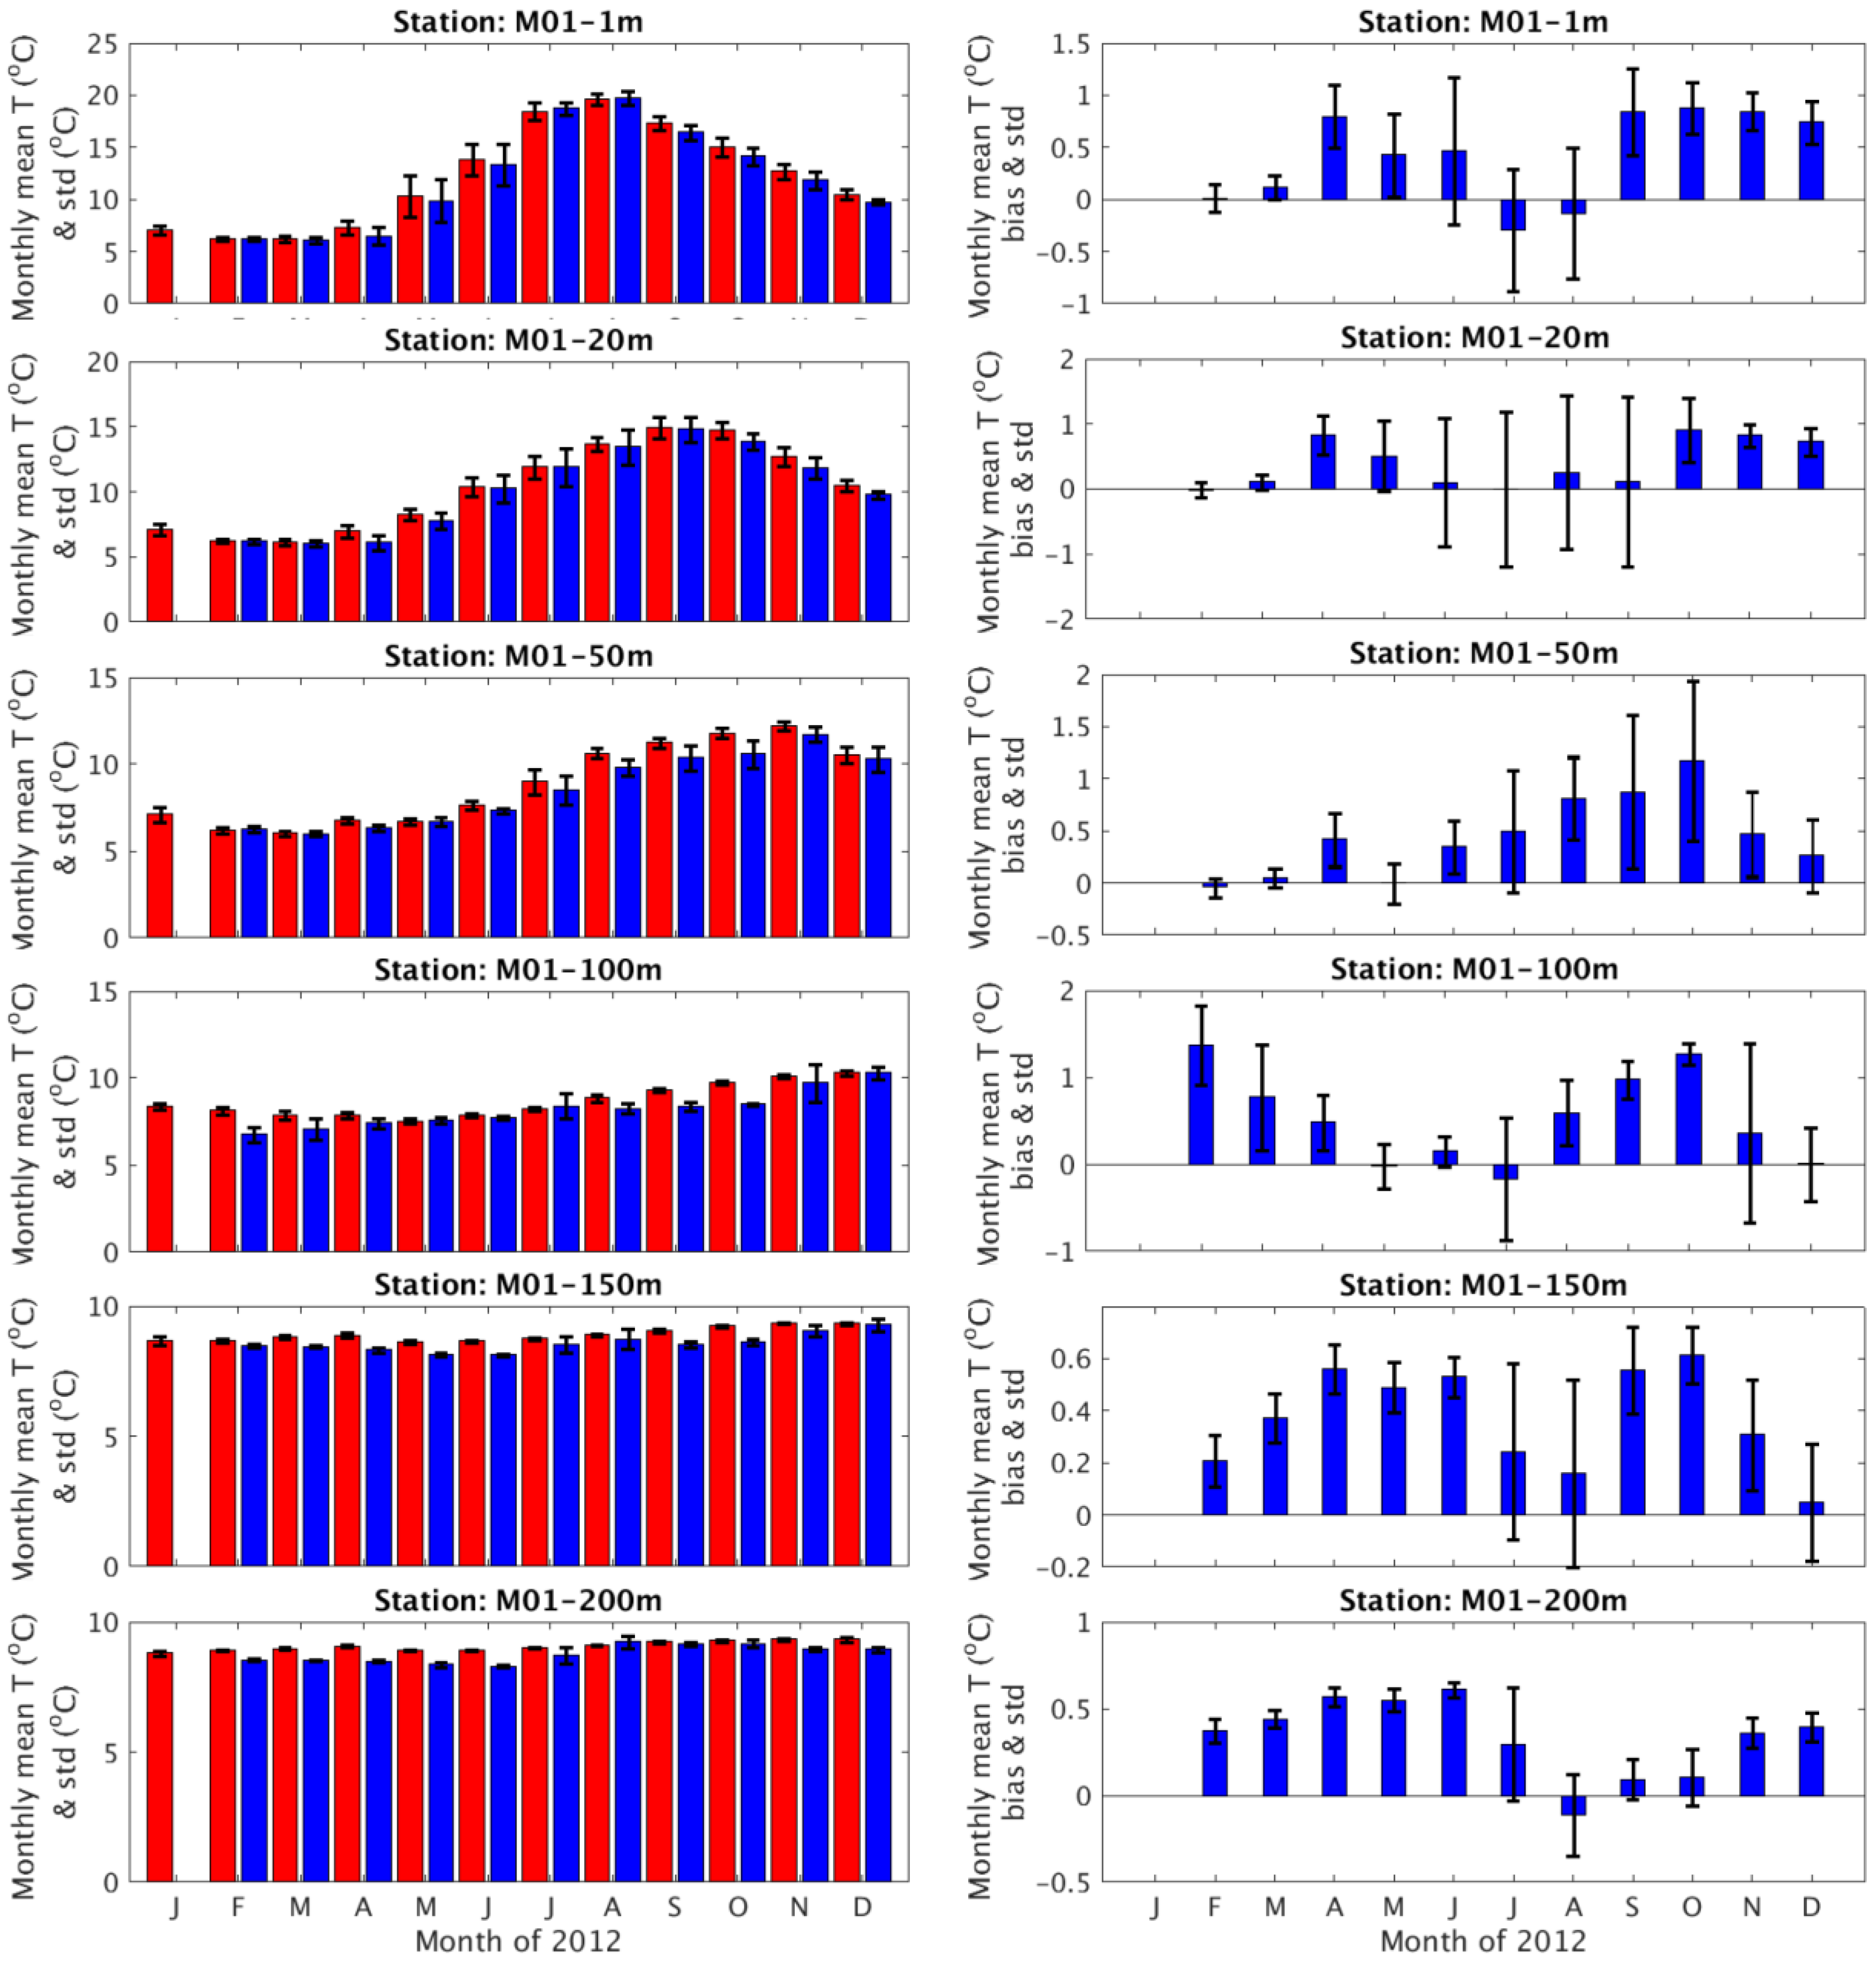
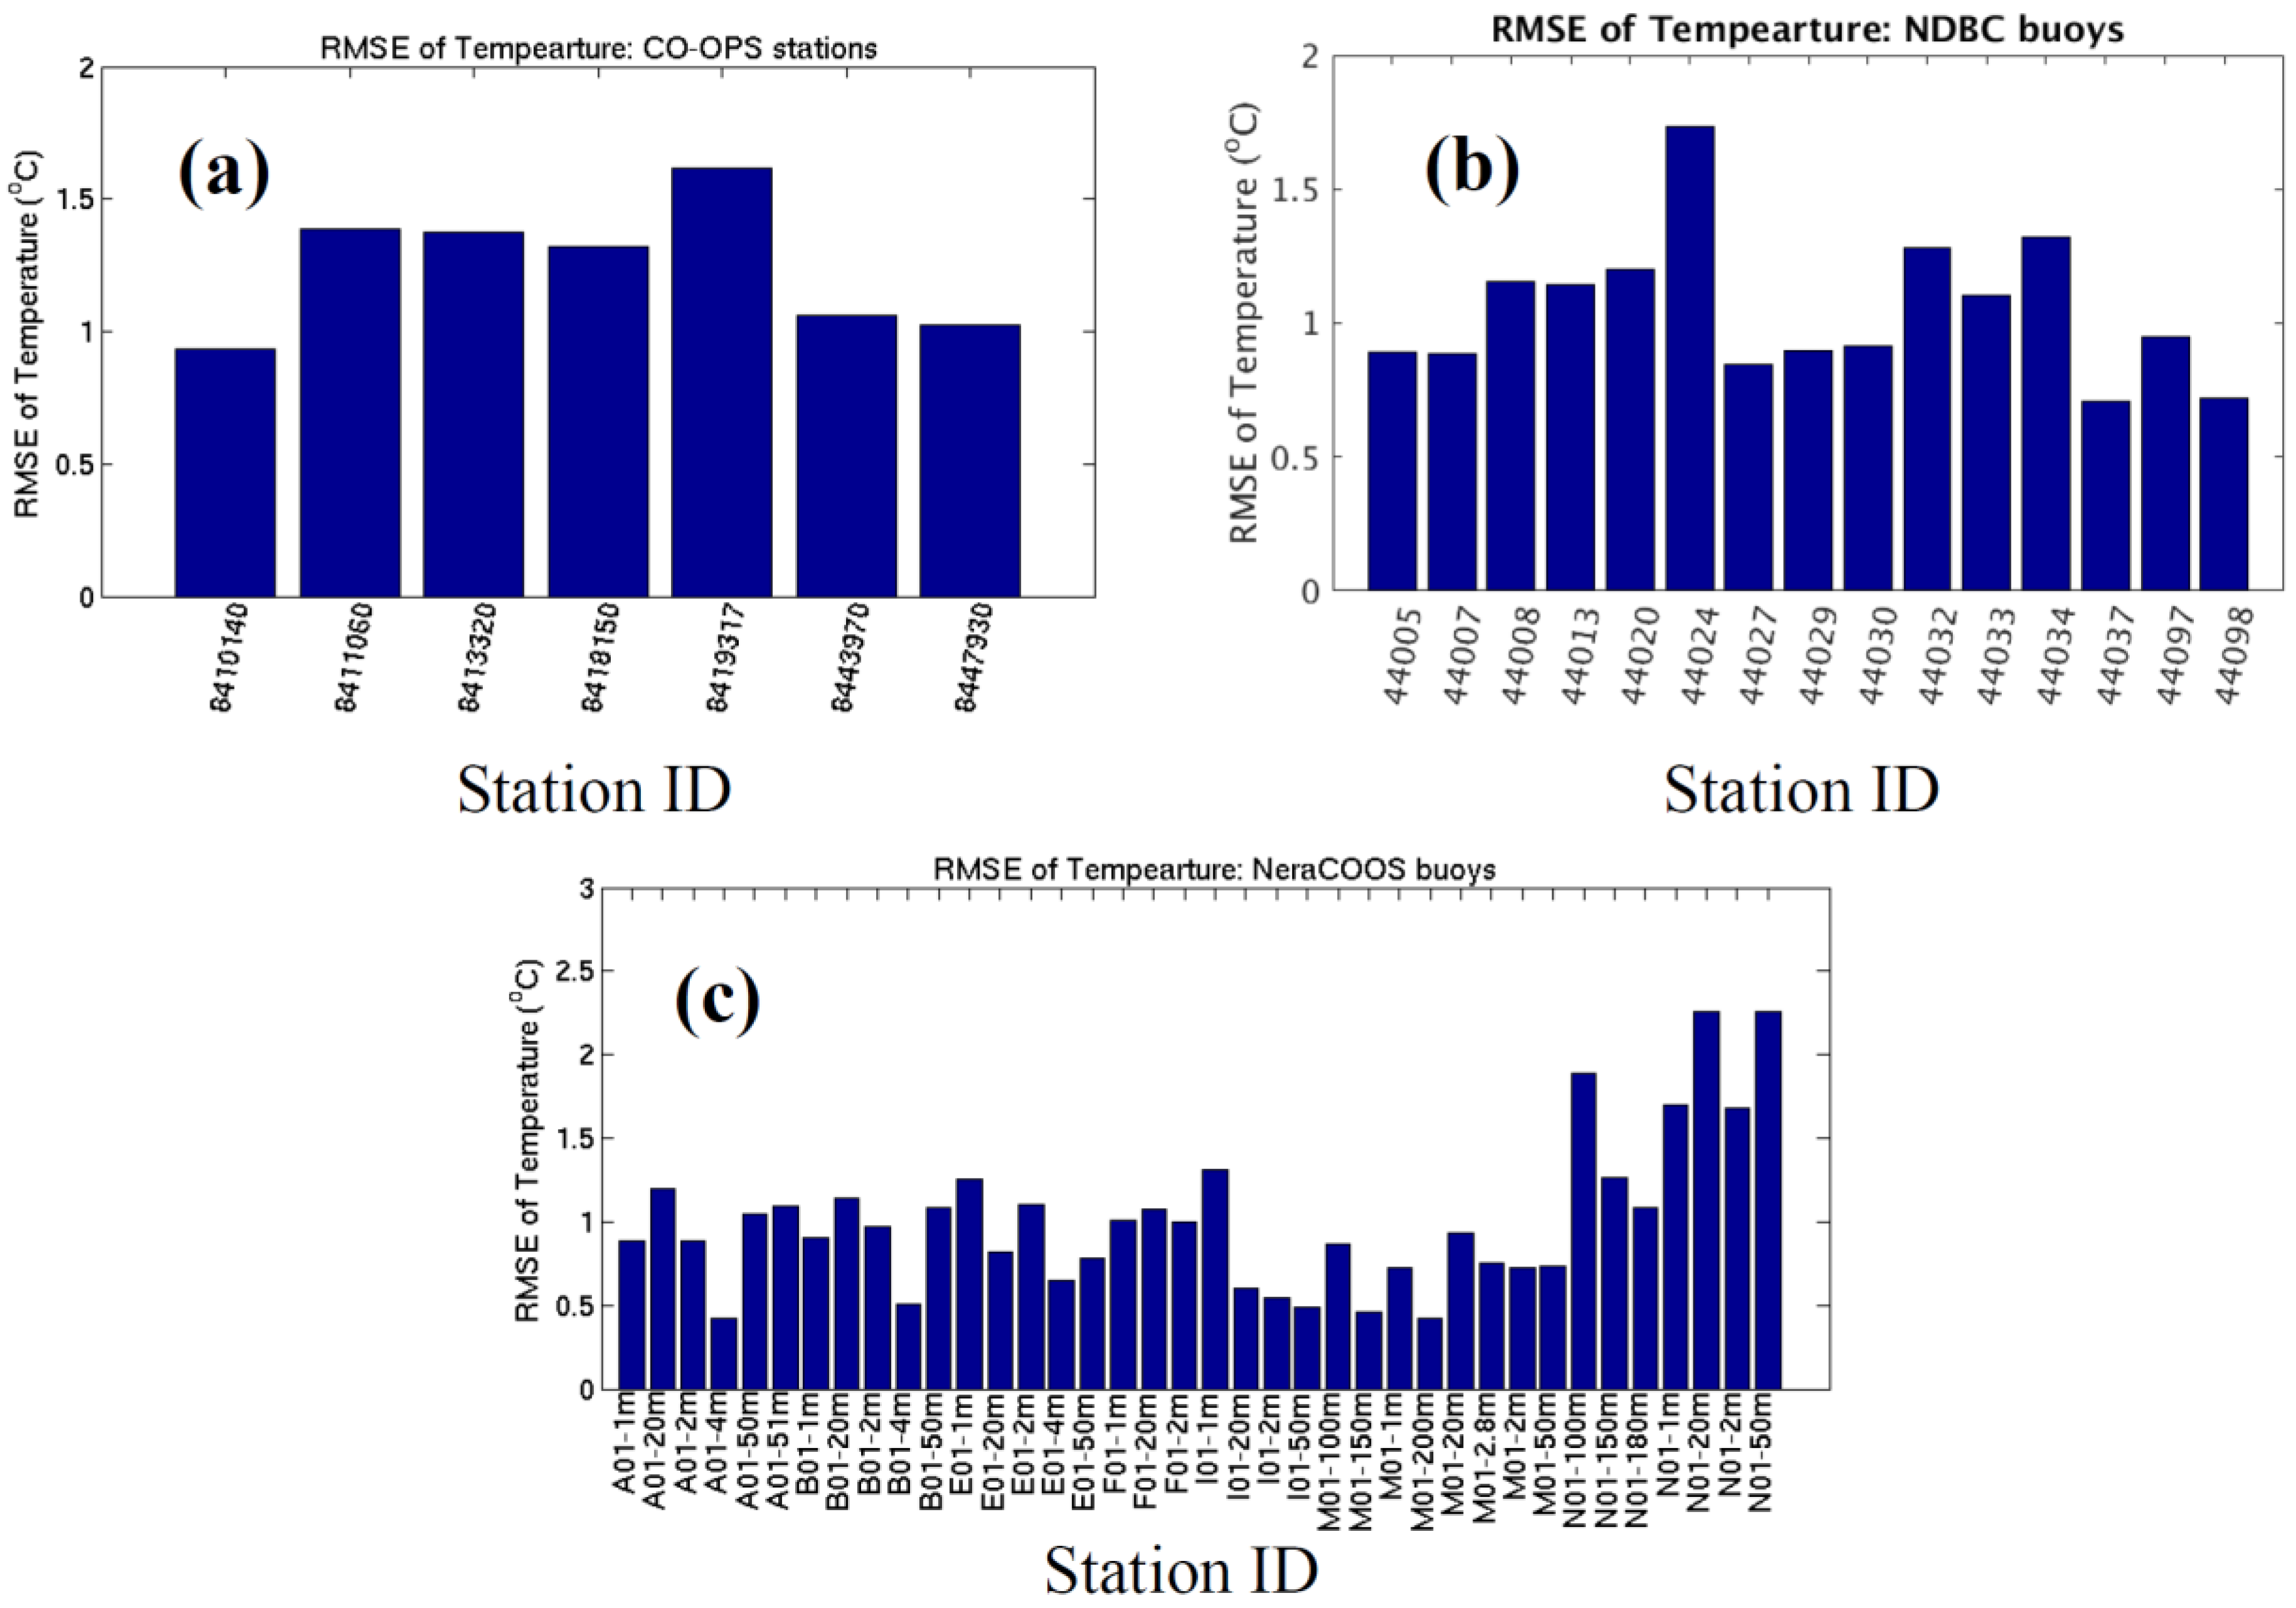
5.3. Water Temperature
Figure 11 illustrates the skill assessment results in three groups with respect to the sources of observed data, i.e., CO-OPS stations, the NDBC buoys, and the NeraCOOS buoys. In each figure, the abscissa represents the station ID. In particular, the NeraCOOS station IDs (
Figure 11c) followed the same naming convention as shown in
Figure 8. Both the CO-OPS and the NDBC buoy data corresponded to the near surface measurements and the NeraCOOS data correspond to both the surface and in-depth measurements. In addition, the CO-OPS stations are located in the nearshore area whereas the other two data sets (the NDBC and NeraCOOS buoys) correspond to the further offshore areas and even in the central Gulf and near the shelfbreak area. Therefore, the skill assessment results of the three groups represent the hindcast performance in different hydrodynamic regimes, e.g., nearshore vs. offshore areas as well as at the sea surface vs. the in-depth waters.
The RMSE at the seven CO-OPS stations ranged from 0.9 °C to 1.7 °C and CF was all above 95%. The RMSE at the NDBC stations was between 0.7 °C and 1.8 °C. Correspondingly CF was above 90%.
The RMSE at the NeraCOOS stations ranged from less than 1.0 °C at station M01 in the eastern Gulf to around 2.3 °C at stations N01-20m and −50 m. CF was above 90% except at stations N01-20m and −50 m for which CF equaled ~80%. Note that buoy N is located in the Northeast Channel (
Figure 1).
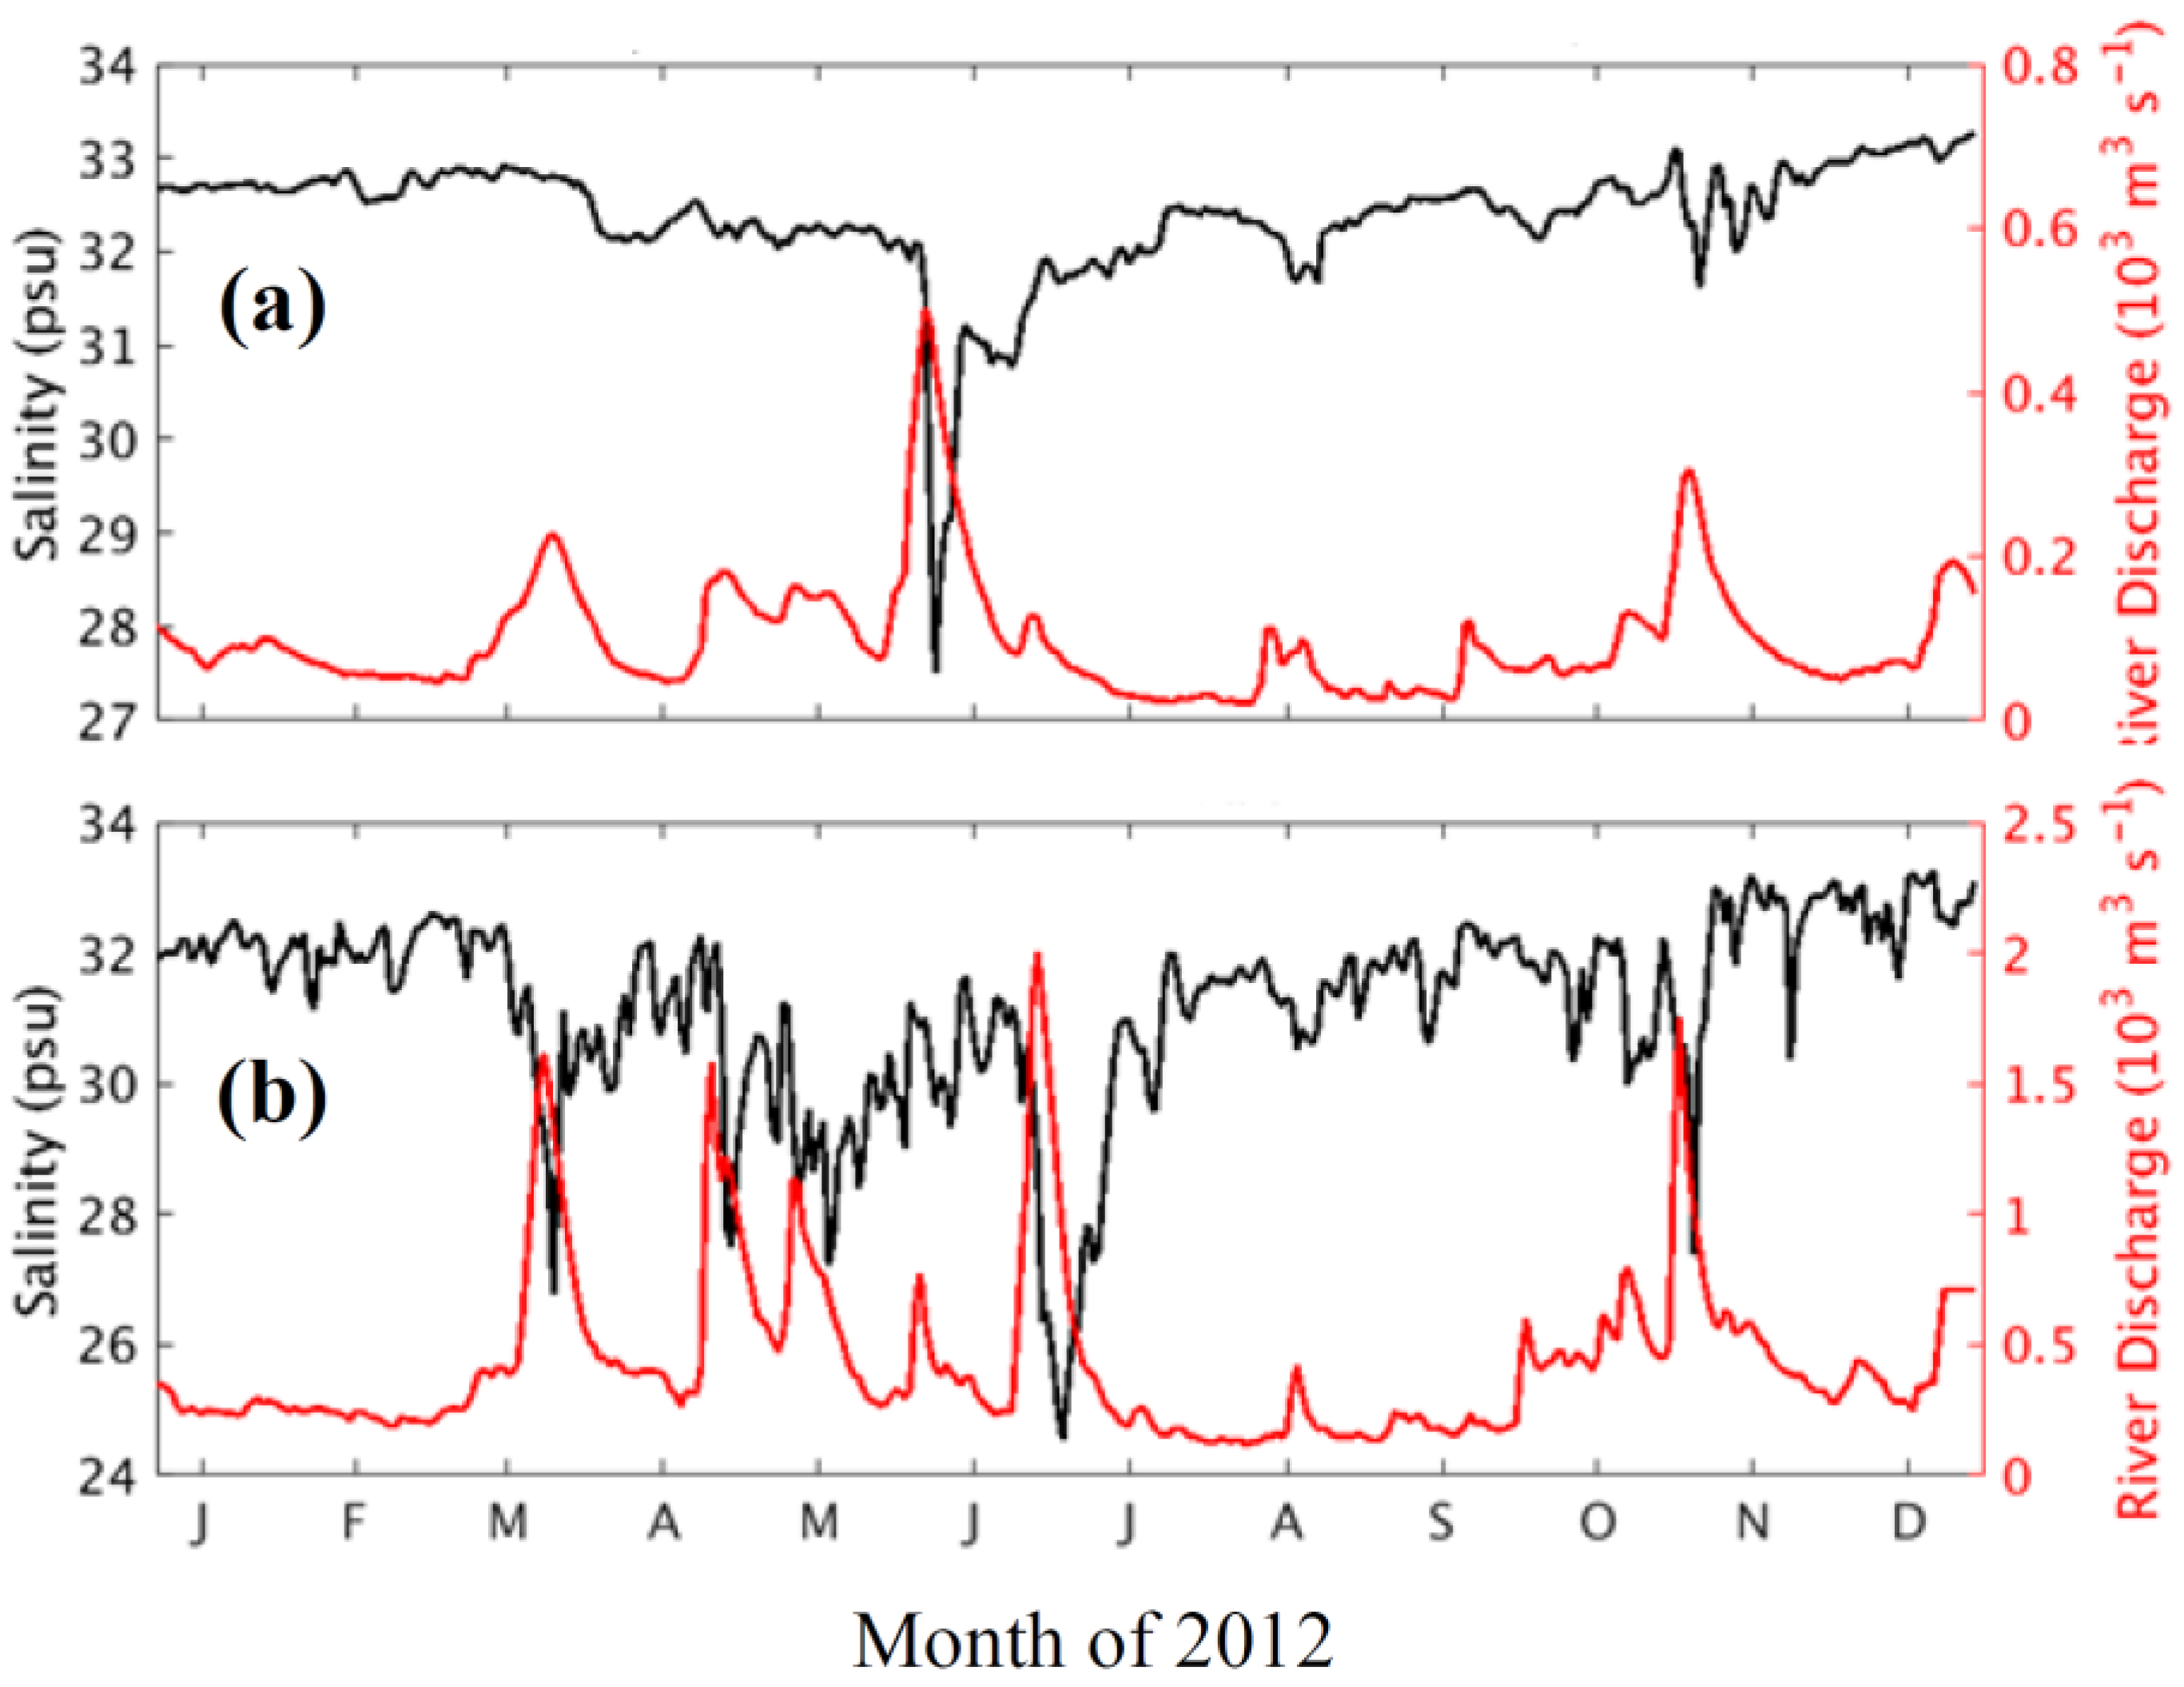
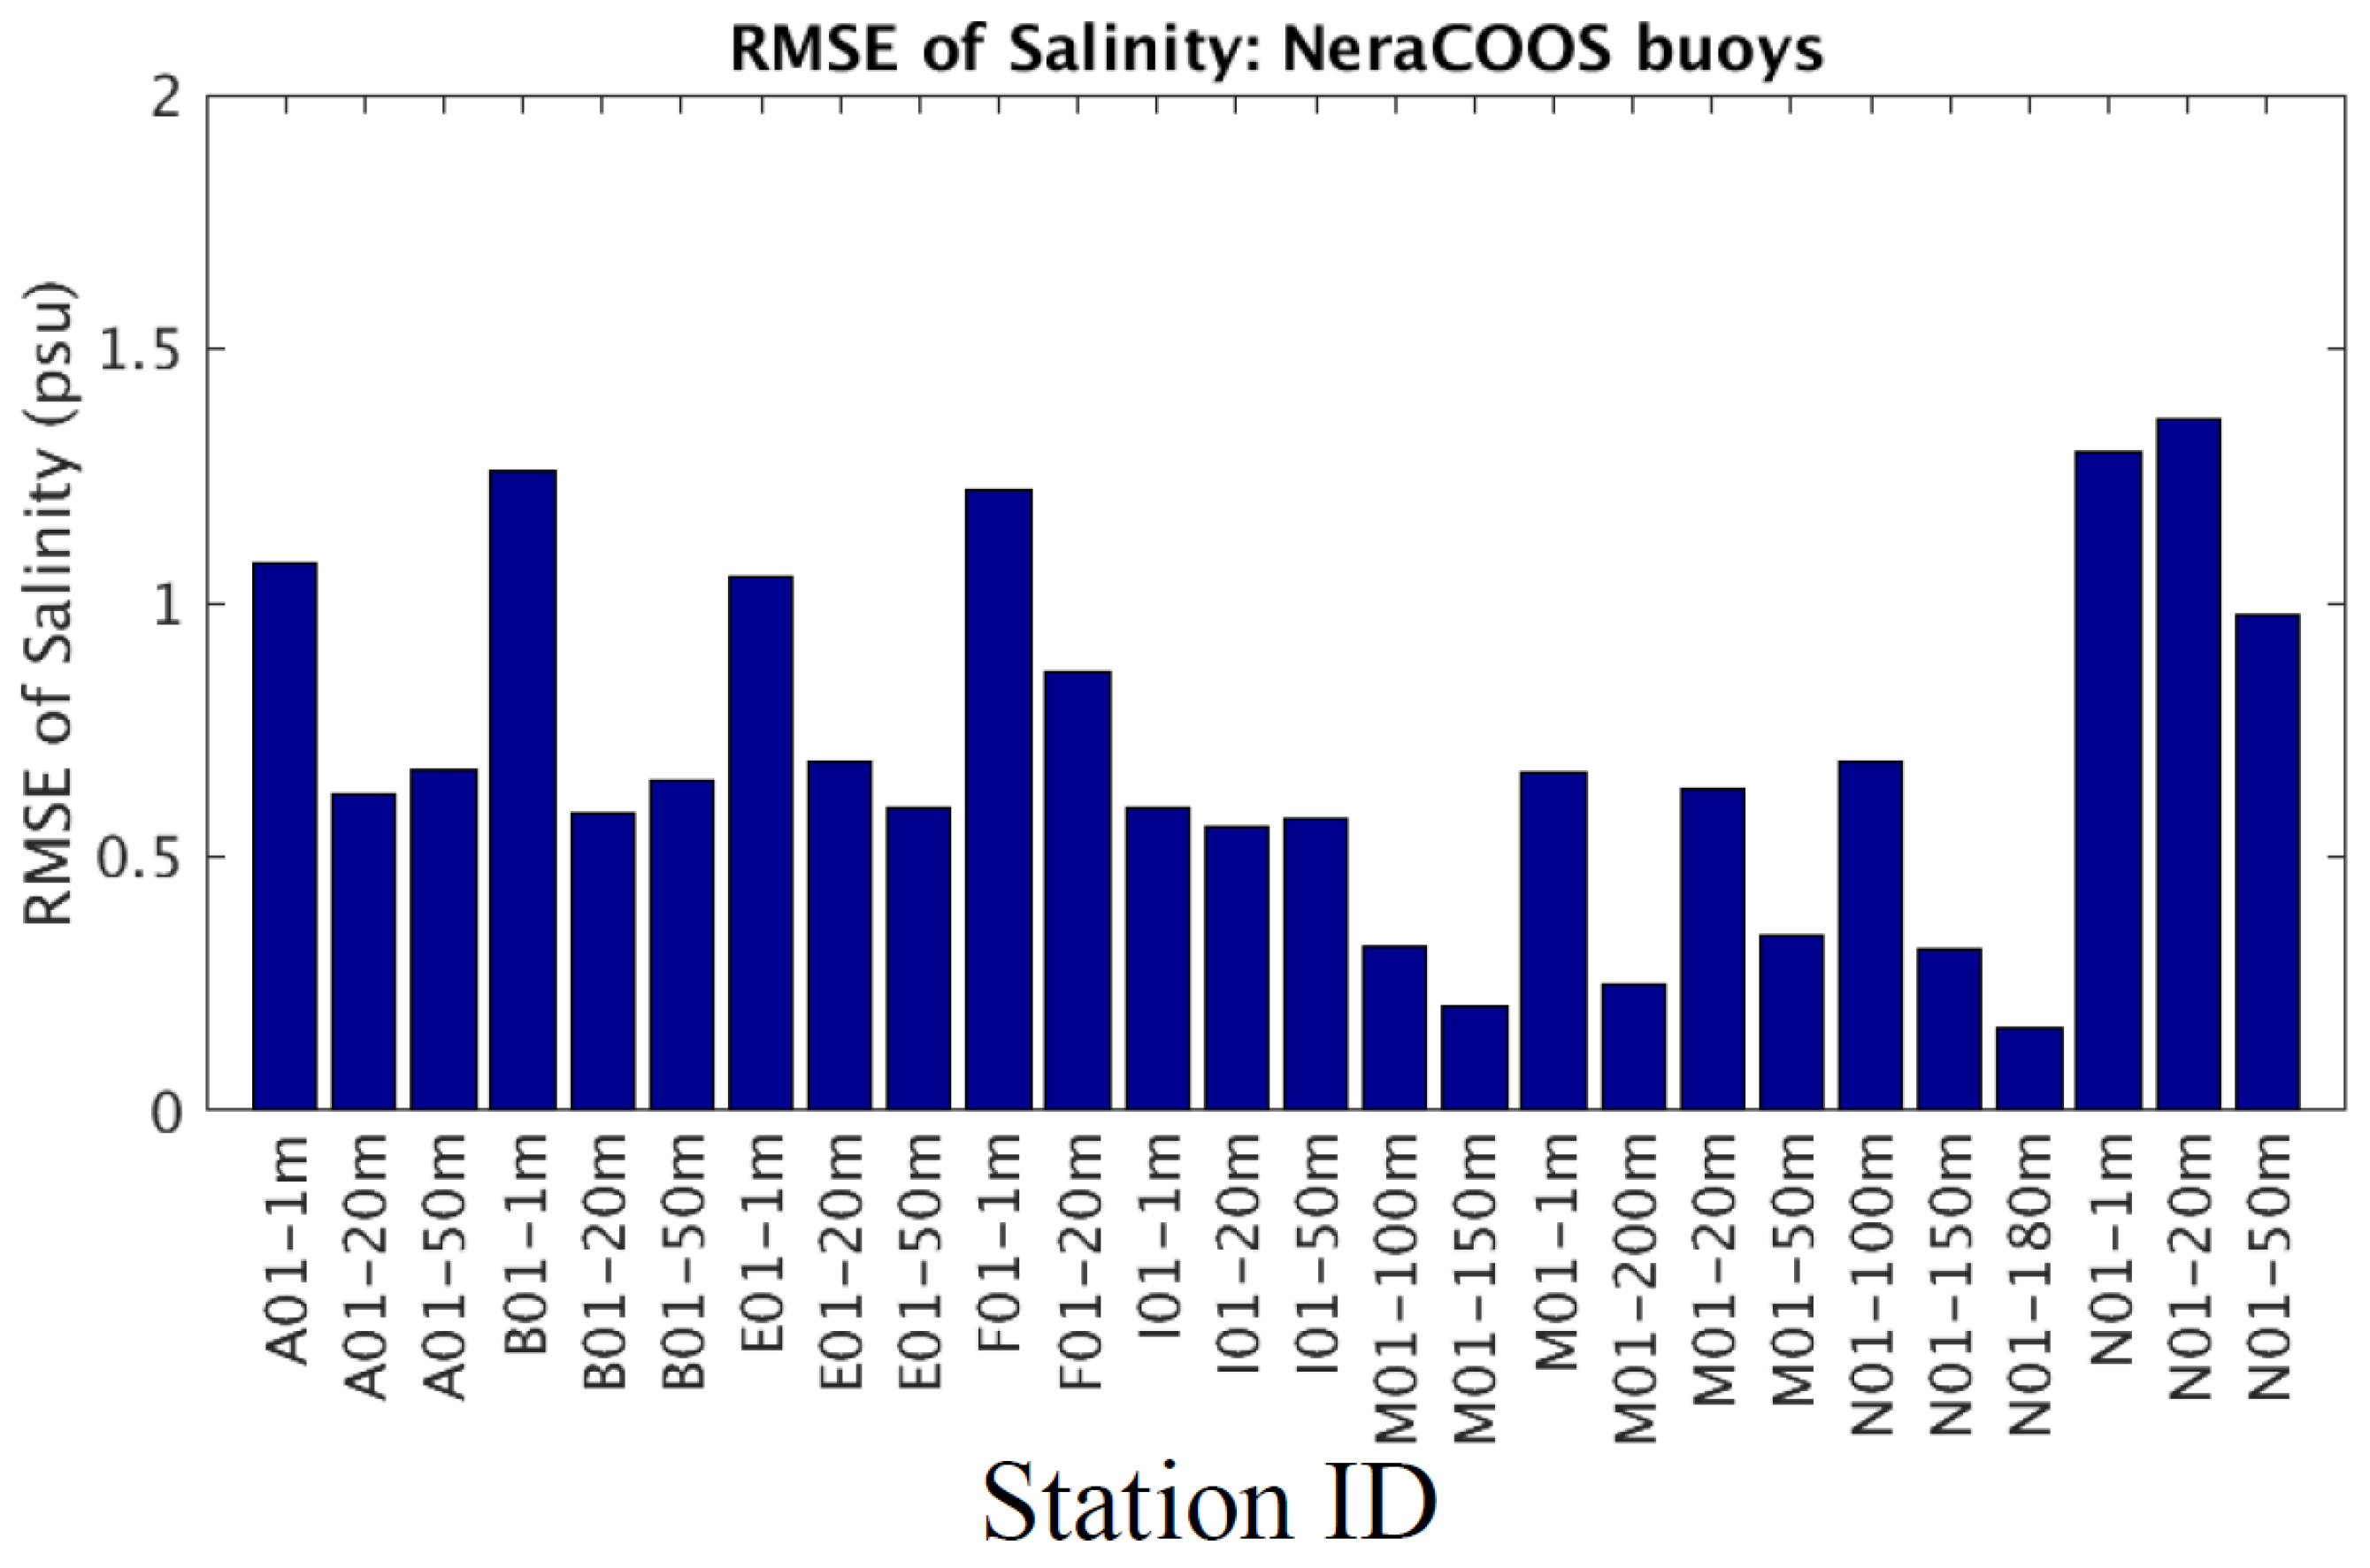
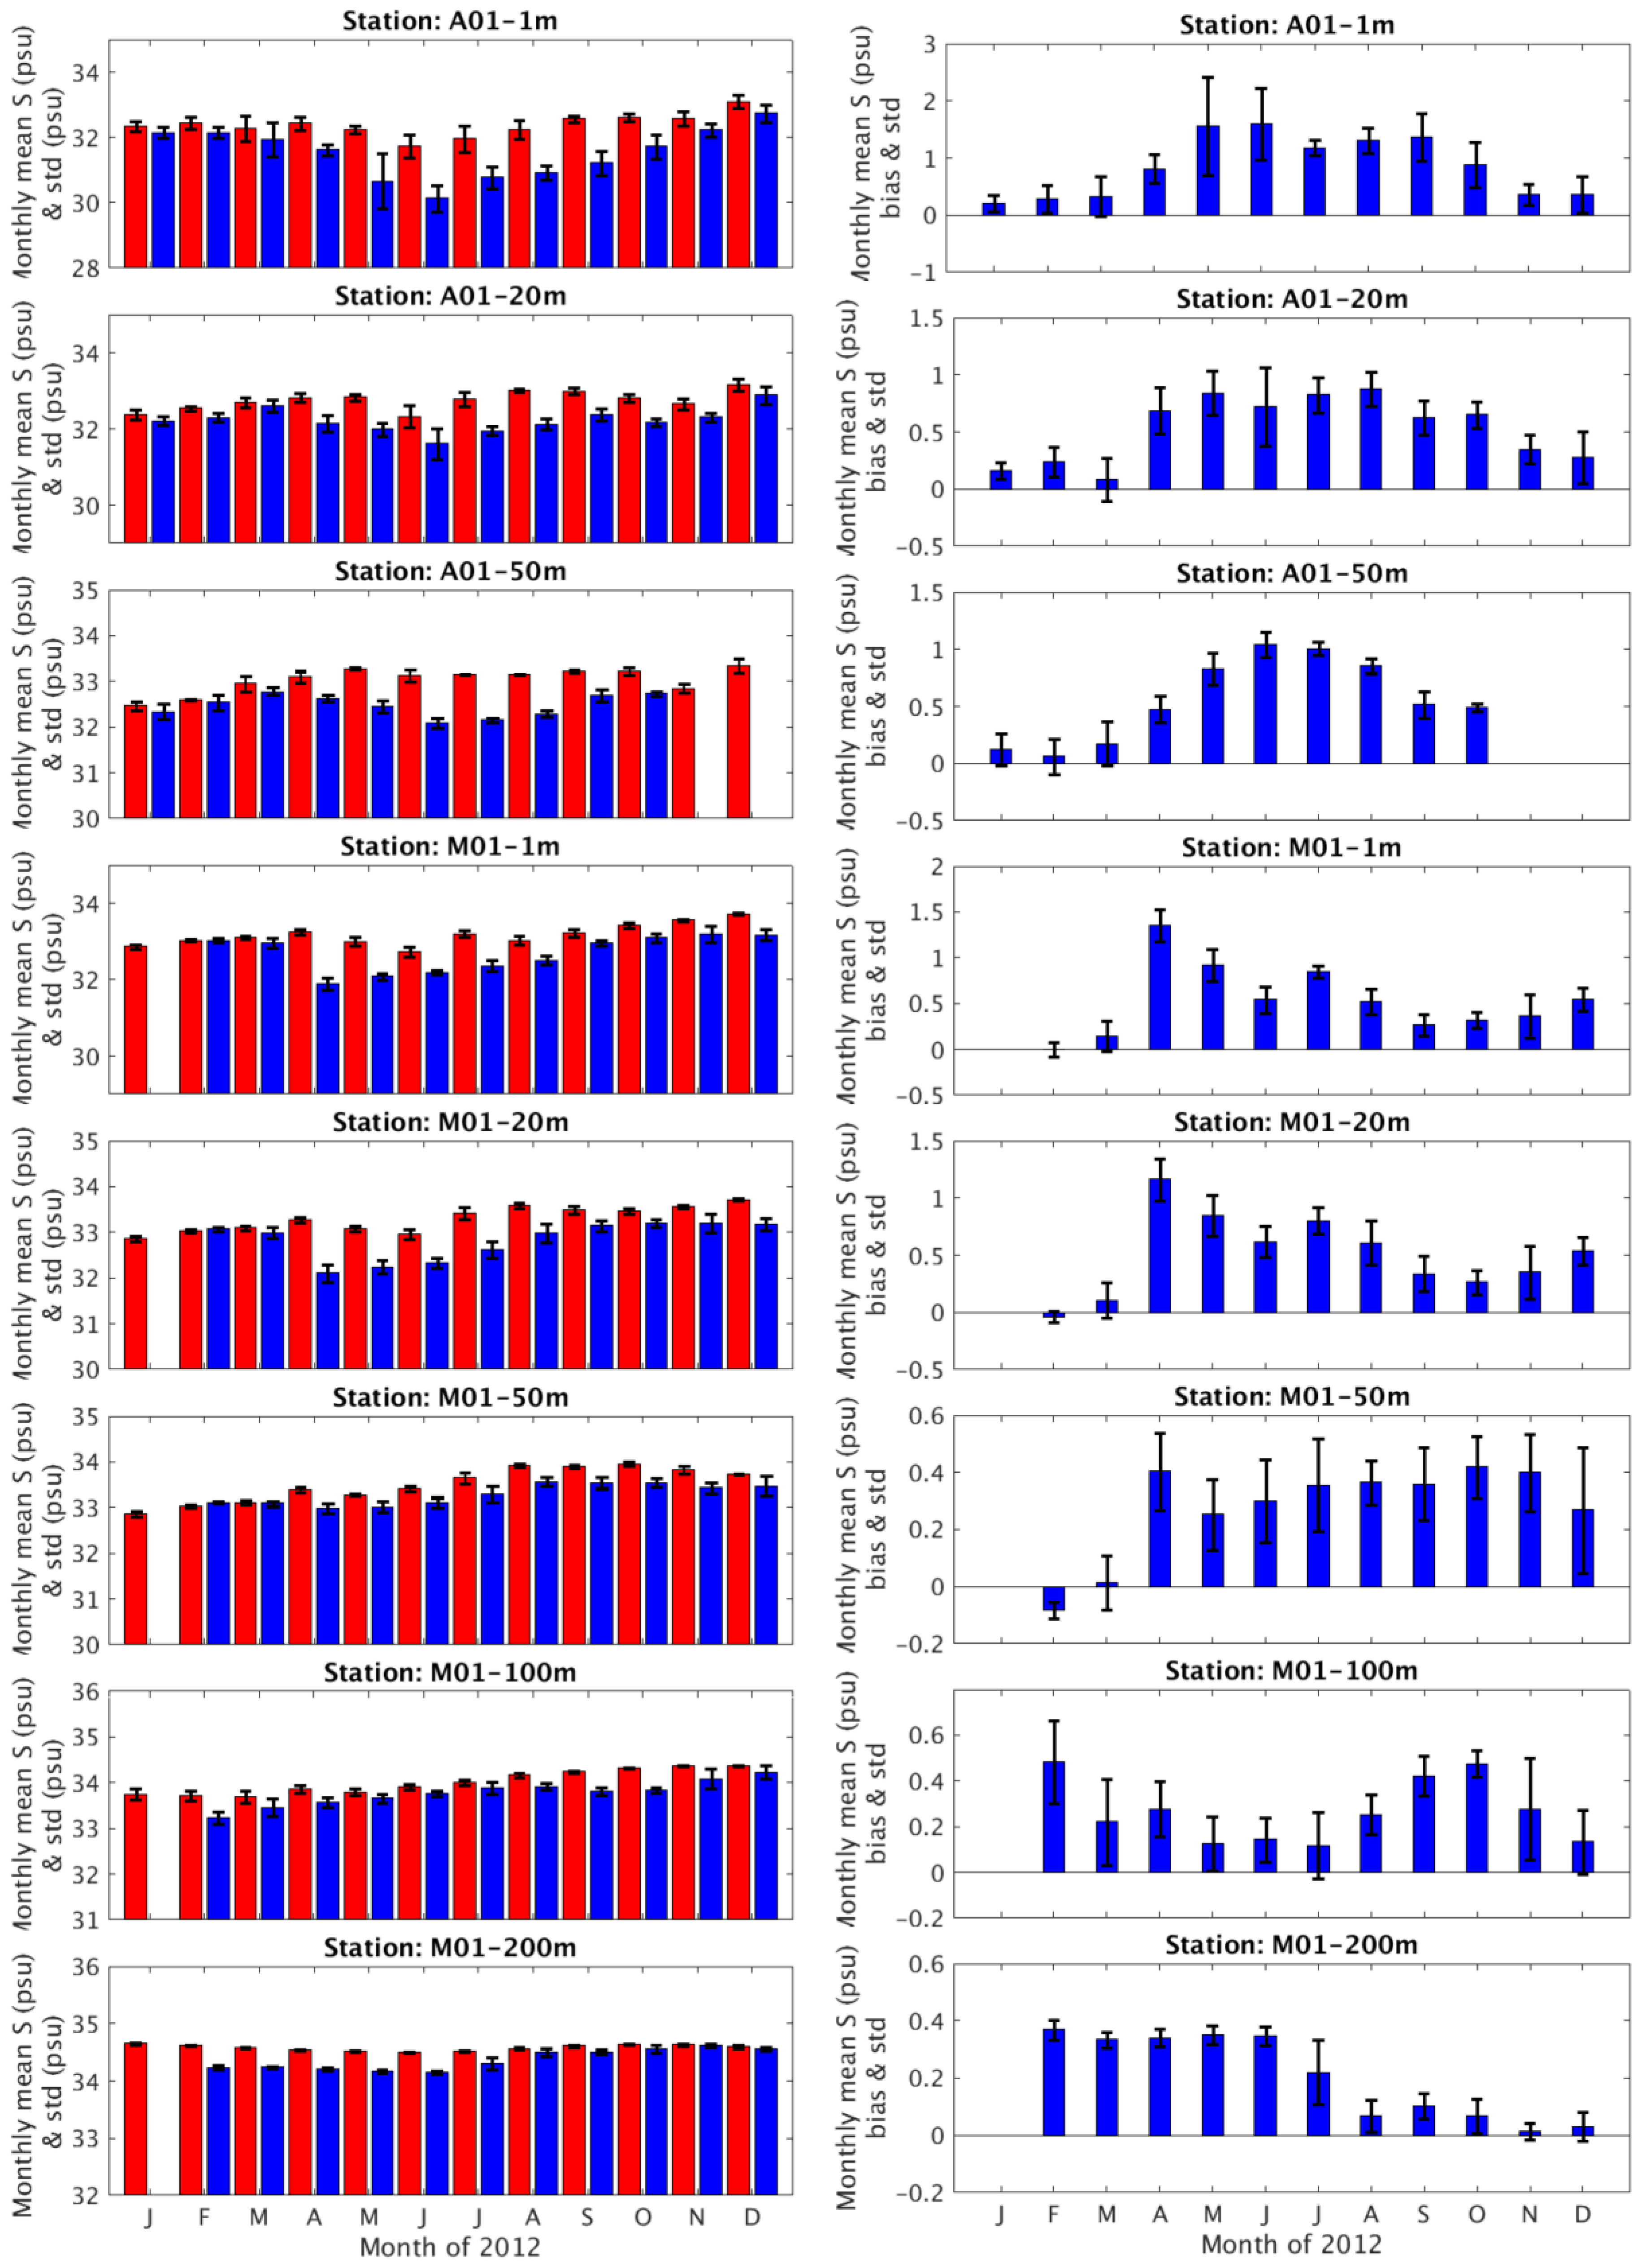
5.4. Salinity
Figure 12 displays the RMSE of the salinity skill assessment results. In general, the RMSE ranged from 0.2 psu to 1.5 psu and the CF was close to 100%. At buoys A, B, E, F, I, and M, the RMSE of the near-surface salinity was around 1.0–1.5 psu, whereas the RMSE in the subsurface layer is much smaller, less than 0.7 pus in general. At buoy N, the RMSEs at all three depths (1 m, 20m, and 50 m) were between 1.0 psu and 1.4 psu.
6. Summary and Conclusions
The NOAA NOS is developing the Gulf of Maine operational nowcast/forecast system (GoMOFS) to aim for producing real-time nowcast and short-range forecast guidance for water levels, 3-dimensional currents, water temperature, and salinity over the broad GoM region. Following the routine procedure of the OFS development, we conducted a one-year period hindcast simulation of 2012. This manuscript described the model development, hindcast setup and the skill assessment results.
The model performance was evaluated using the NOS standard skill assessment software and the criteria by comparing the hindcast results with the observed time series of water level, T/S, and currents collected by both the NOAA agencies (including the CO-OPS and NDBC) and the NeraCOOS. In general, the hindcast results met the skill assessment criteria. The RMSE was about 0.12 m for water level, less than 1.5 °C for temperature, less than 1.5 psu for salinity, and less than 0.2 m/s for the currents speed and less than 15 degrees for the currents phase. The corresponding central frequency was between 80% and 90% for the water level and generally above 90% for the other properties.
The NOS is working on transitioning the hindcast setup into operations on the NOAA’s Weather and Climate Operational Supercomputing System. The GoMOFS is anticipated to be in operations in fiscal year 2017.


