Macro and Micro Properties of Organic Matter in Hydraulic Mud Consolidation


1
School of Earth Sciences and Engineering, Sun Yat-sen University, Guangzhou 510275, China
2
Guangdong Province Key Laboratory of Geological Processes and Mineral Resources, Guangzhou 510275, China
3
The Commonwealth Scientific and Industrial Research Organisation (CSIRO), Manufacturing, Clayton, VIC 3168, Australia
*
Author to whom correspondence should be addressed.
J. Mar. Sci. Eng. 2018, 6(1), 22; https://doi.org/10.3390/jmse6010022
Submission received: 4 January 2018
/
Revised: 9 February 2018
/
Accepted: 21 February 2018
/
Published: 1 March 2018
(This article belongs to the Section Ocean Engineering)
Abstract
:Due to the co-existence of multiple organics and multiple length scales of the structure, quantitative characterization of the microstructure of organic matter in hydraulic mud consolidations, and understanding the impact on its mechanical properties have been challenging topics. This article attempts to tackle the challenge using lab experiments and a data-constrained modelling (DCM) approach combined with multi-energy synchrotron-based X-ray micro-CT (computed tomography). In this paper, scanning electron microscopy (SEM) and other different technical means were combined to study the microstructure of hydraulic mud composition and distribution. One unmodified hydraulic mud and four remolded samples were analyzed in vacuum preloading tests corresponding to organic matter contents of 1.65%, 3.75%, 5.15%, 8.65%, and 11.15%, respectively. Organic matter plays a significant role in hindering the shear strength of consolidation. Macro- and microstructure under different pressures could be extracted by the DCM and X-ray CT. The DCM-reconstructed microstructure of fine-grained soil from hydraulic mud is presented by four groups: organic matter, two groups of minerals, and pores. Different groups are displayed with different colors, which could clarify the distributions and density degrees of each component (group). The macro- and microstructures and the distribution of organic matter were quantified and compared among groups. It was demonstrated that the mechanical properties of the organic matter were closely correlated to the meso- and nano-scale clusters of porosity and minerals. The variation of organic clusters with loading pressure, and the number of sub-macro organic clusters, were small. Three scales of organic cluster (40–400 μm, 4–40 μm, and 0.4–4 μm) changed visibly in consolidation at 200 kPa and 800 kPa. The analysis has shown that pressures of 100 kPa and 400 kPa could be used as two characteristic values of structure change of hydraulic mud, which perhaps matched the turning points of destruction. The DCM approach, combined with multi-energy synchrotron-based X-ray micro-CT presented here, are applicable in studying the relationship between the microstructure and macro-properties for various other engineering materials.
1. Instruction
Sludge fill in a hydraulic mud land reclamation project (called hydraulic mud, hereafter) is widely used around the coastal areas in China [1,2]. Hydraulic mud is an important engineering mud to relieve the shortage of land resources [3,4,5]. It is characterized by high clay content (above 60%) [6,7], abundant organic matter (over 1% by the potassium dichromate method) [8], high water absorption ratio (80–300%) [9], high plasticity index (30–35) [10,11], and low shear strength (τ ≤ 25 KPa) [12]. In hydraulic mud, organic matter is a special component with poor geological engineering properties [13,14]. It limits the soil improvement in hydraulic mud land reclamation projects and causes special engineering problems in deep foundation or land reclamation projects from the sea, including airports, docks, highways, and tall buildings [15]. These problems could result in high economic costs and very significant technical difficulties that limit the engineering applications of hydraulic mud.
Results from the practical applications and experiments have shown that organic matter limits engineering properties of the hydraulic soil or mud [16,17]. For example, Wehling et al. [18] revealed that the peaty organic soil is particularly soft and highly compressible in the open field with initial high water content. Xu [19] prepared artificial organic soil from soft soil with different contents of added humic acid, and also studied the relationship between physical consistency index (liquid limit and plastic limit) and organic content. Mou et al. [20] analyzed the organic matter content and physical mechanical indices of soft soil and believed that organic matter had a significant influence on the engineering properties of soil. According to the consolidation characteristics and consolidation mechanism of soft soil, Liu et al. [21] found that the mechanical properties of soil became worse with a higher content of cellulose and humus. Obour et al. [22] suggested that glyphosate application could affect soil chemistry due to its indirect effects on soil organic matter. Based on the influencing mechanism of soil strength, Guo [23] believed that the increase of organic matter increased the acidity of soil. During soil hydration, organic matter reacted with the hydration production in advance, which inhibited the generation of hydration products and formed a layer of adsorption film on the surface of the soil particles [24]. These acidic ions could decompose hydration products, and then restrict the formation of a continuous network of the skeleton structure, thus weakening the strength of the solidified soil. Arifuzzaman [25] pointed out that organic matter beneath the filling soil decomposed and formed a soft organic layer. This soft layer would lead to significant settlement due to its own weight. Guo [26] discovered that carboxyl groups on the surface of humic acid (one type of organic matter) was easy to decompose, and amino groups were easy to protonate during the studies on the solidification mechanism of sludge soil. When Virto et al. [27] studied the cycling rule and action mechanism of organic matter in non-cropland soil with the laser diffraction method, they found that organic matter could slow down the consolidation of the organic matter of the soil. Inma et al. [28] proposed that organic matter could improve micro-properties of soil and then increase strength through affecting soil temperature and microorganism activity. Monreal [29] found that organic adhesive in the soil was related to water content in large aggregates during the cultivation of Brown chernozem. The content of organic chemicals, including carbohydrate and lignin monomers, were relatively high in soil aggregates. These studies on the organic matter of soils were focused mostly on qualitative analysis. However, characteristics of organic matter and multicomponent interaction are rarely reported [24,30].
Currently, the study of soil structure is mainly based on micro-imaging technology [31,32]. Although these technologies have high resolution, there are many difficulties in the multi-material and multi-scale research. For example, the soil sample needs to be coated with gold or carbon, but the thickness of the coating and humidity can result in image blurring or pixel drifting [33]. Soil samples are very diverse between different types, and it is difficult to construct an observation surface. Continuous high-resolution image technology was used to study the 3D (3-dimentional) structure of soil [34,35,36], but it was difficult to obtain continuous features of soil. More difficult is that most of the pores in the early consolidation of hydraulic mud were within millimeters, with relatively large space between layers. Harjupatana et al. [37] found that the X-ray micro-CT technique could be used to characterize soil microstructures down to imaging pixel-size resolution without damage [38]. However, because this approach ignores the sub-pixel structures in the samples [39], it is not possible to obtain the structure distribution of a pixel with size less than one micron [40] or to analyze quantitatively.
Yang et al. [41] proposed a material microscopic characterization method—the data-constrained model (DCM). It considers the absorption coefficient difference of each material component in the multi-energy X-ray (ME) sample, and establishes a three-dimensional mathematical model of the material based on the micro-CT scan [42]. DCM not only characterizes material structure information that is greater than or equal to the pixel size, but it also retains the material distribution information that is smaller than the pixel size. For the fine-grained soil in the silt, DCM can build a three-dimensional model of the soil with the pixel size based on the high-precision CT scanning technique, including the mass occurrence and pore structure information of the micro-scale pixel size [43,44].
In this paper, the macro- and microstructures of fine-grained soil under different pressures were extracted by multi-energy X-ray tomography combined with DCM. The distribution of organic matter and other components were quantitatively analyzed. The relationship between organic matter and the other components were studied from the perspective of the microstructure.
2. Methods
2.1. Materials and Lab Experiments
The soil sample was taken from the hydraulic mud located in Daya Bay of South China. The sampling stratum is quaternary strata. The hydraulic mud was dried at 45 °C. According to the Chinese standard for soil test method, basic physical and mechanical properties of hydraulic mud were obtained and are listed in Table 1.
The hydraulic mud was divided into five samples. One of the samples was reserved in unchanged organic matter content (1.65% dry weight) and the structure formed in a shallow marine environment. Other samples were mixed with added humic acid powder. Humic acid powder (>90%) was produced by Shandong Ronghua Chemical Ltd. (Binzhou, China). This material is a mixture of humic acid, fulvic acid, and other plant extracts, and was produced by extraction and other processes. The organic matter was sieved using a 0.075 mm sieve. Humic acids can form complexes with ions that are commonly found in the environment, creating humic colloids. The soft clay was divided into five samples and remolded: (1) One sample retained its natural organic content (1.65%). (2) Four samples were mixed with humic acid powder to make their organic contents 3.75%, 5.15%, 8.65%, and 11.15%, respectively. Then, all five samples were watered until the gravimetric water content reached 120% (weight percentage). They were cured for 20 days for a complete mixture of the soil and the chemical additives. The gravimetric water contents of all the five samples were decreased to 83.10%. The room temperature was controlled at 25 °C. Organic matter was measured in Guangdong Province Key Laboratory of Geological Processes and Mineral Resources.
Simulation tests of one unmodified soil sample (hydraulic mud) and four remolded soil samples were analyzed in vacuum preloading chambers with the same size of 555 mm × 460 mm × 400 mm. One plastic drainpipe (the diameter of the drainpipe was 10 mm) was installed in the center of the test chamber. The drainpipe was wrapped with geotextile which was water-permeable and soil-isolated. Vacuum was kept over 85 kPa during the vacuum preloading test for 40 days [45]. At the beginning of vacuum preloading test, the initial water content of all tested samples was the same (83.10% and decreased). After the vacuum preloading test, a vane shear test on consolidated soil was analyzed.
2.2. Sample Preparation and Data-Constrained Modelling
In the process of the vacuum preloading test, hydraulic mud samples were put in a vacuum-sealed box, in which it was difficult to continuously take soil samples. In order to have a better understanding of structure and mechanical mechanisms of organic matter during the soil consolidation, the fine-ground soil powder with measured organic content of 1.65% was passed through a 0.075 mm wet sieve to obtain organic matter and fine soil powder for the self-weight sedimentation and one-dimensional consolidation test under pressure. Samples were treated with vertical pressures of 0 kPa, 100 kPa, 200 kPa, 400 kPa, 800 kPa, and 1600 kPa. All samples were hand-cut into a size of 5 mm in diameter and divided into six columnar samples. In order to decrease the size effect of modeling [46] and to balance test conditions and image quality, the maximum thickness of samples was 66 times the maximum diameter (0.075 mm) of particles.
Fine-ground soil included four components: pores, organic matter, Minerals 1, and Minerals 2. Their linear attenuation coefficients of X-ray were varied. X-ray micro-CT experimentation was applied to characterize the soil microstructures non-destructively down to an imaging pixel size resolution with two energies of 30 keV and 40 keV, respectively. Fragile minerals of fine-ground soil were broken easily at the initial stage of compression, and SEM was not suitable to obtain its 3D structural features.
The synchrotron radiation X-ray micro-CT experiment was conducted in the Image and Medical Beam Line (IMBL) at the Australian Synchrotron Radiation Center. A ruby detector (Single pco. edge sensor) was used to collect projective images with a distance between sample and detector of 30 cm. The effective pixel size of the detector was 6.53 μm. Exposure time corresponding to 30 keV energy was about 100 ms, while that to 40 keV was about 40 ms. When X-ray energies were selected, components’ linear attenuation coefficients, densities, and thicknesses of fine-grained soil samples were considered.
During the synchrotron radiation X-ray micro-CT experiments with both energies, the positions of samples were unchanged. Samples were rotated at 180° to collect 1800 projection images (image collection interval was 0.1°). Before and after CT scan, 20 flat-field images and 20 dark-field images were collected. X-TRACT software (TRC Bridge Design Software, Rancho Cordova, CA, USA) was used to reconstruct CT slices. The process includes background corrections, image normalizations, phase retrieval (δ/β value of 769.29 at 30 keV and 1111.91 at 40 keV), and ring artefact correction, during which a filtered back projection algorithm and change size of filtering waves were analyzed repeatedly to realize loop artifact correction and reconstruction.
As one important part of the four components of hydraulic mud, organic matter’s microstructure distribution could be analyzed according to the data constraint modelling. Each of the six fine-ground soils were analyzed with a pixel size of 6.53 μm and an actual model volume of 1.306 × 1.306 × 1.306 mm3.
The nonlinear constraint algorithm of DCM minimizes the discrepancy between the expected and the measured linear absorption coefficients, and maximizes the Boltzmann distribution probability. Ignoring the interactions between neighboring voxels, the objective function at each voxel n is described as follows [47]:
where n = 1, 2, … N, N is the total number of voxels in the system which is 8 × 10⁶ used in the “analysis grid” and 106 in the “test grids”; is the difference between the expected and the measured linear absorption coefficients at beam energies l, l = 1, 2, … L, L is the number of X-ray beam energies; l = 1 denotes for beam energy 30 keV and l = 2 for 40 keV; is the dimensionless phenomenological internal energy; is the linear absorption coefficient of compositional group m at the X-ray energy l; m = 0, 1, 2, 3; M = 3, where M is the total number of groups in the system; m = 0 denotes for pores, m = 1 for organic matter, m = 2 for Minerals 1, and m = 3 for Minerals 2; is the volume fraction of group 𝑚. The sum of the voxel pore fraction in the “analysis grid” is the porosity of the “analysis grid”; are the X-ray CT measures’ linear attenuation coefficient values at beam energy l; denotes the self-energy (chemical potential) for the composition group m; and is the interaction energy between compositions m1 and m2. In this paper, we used the default value of the DCM software .
Based on the 3D structure model, 3D quantitative data was obtained to analyze the connection and coexistence between other components. The interconnection threshold [48] was set to be x arbitrarily, and the interconnection property of the component between neighboring units was analyzed. When both volume percentages ( and ) of one component (m) between two neighboring units (n1 and n2) were greater than x, the two connected elements formed a whole connected cluster. When the threshold x was from 0 to 1, the volume percentage of the maximal connection was calculated, and the threshold values were determined at the changing point or steep dropping zone.
According to the pore classification standard in soil testing regulation from the Geology and Mineral Resources Ministry, cardinality 4 was used as the limit value to classify organic clusters on the basis of the data statistical method with logarithmic coordinates. For convenience in evaluating the degree of connection, the volumes of the clusters were represented by equivalent spheres of equal volumes. The diameter of the sphere is calculated in Equation (2):
where the unit of is μm; K is the total number of clusters in an analysis grid. μm3 is the volume of a voxel; Tk is the number of voxels in the k-th cluster. is the total volume of T clusters satisfied with the composition group m. The total volume of DCM “analysis grid” is 1.306 × 1.306 × 1.306 mm3. The scale of the diameter spans over five magnitudes of length scales. For notational convenience, the scales of clusters were divided into six types, as shown in Equation (3):
3. Results
3.1. Special Properties Based on Lab Experiments
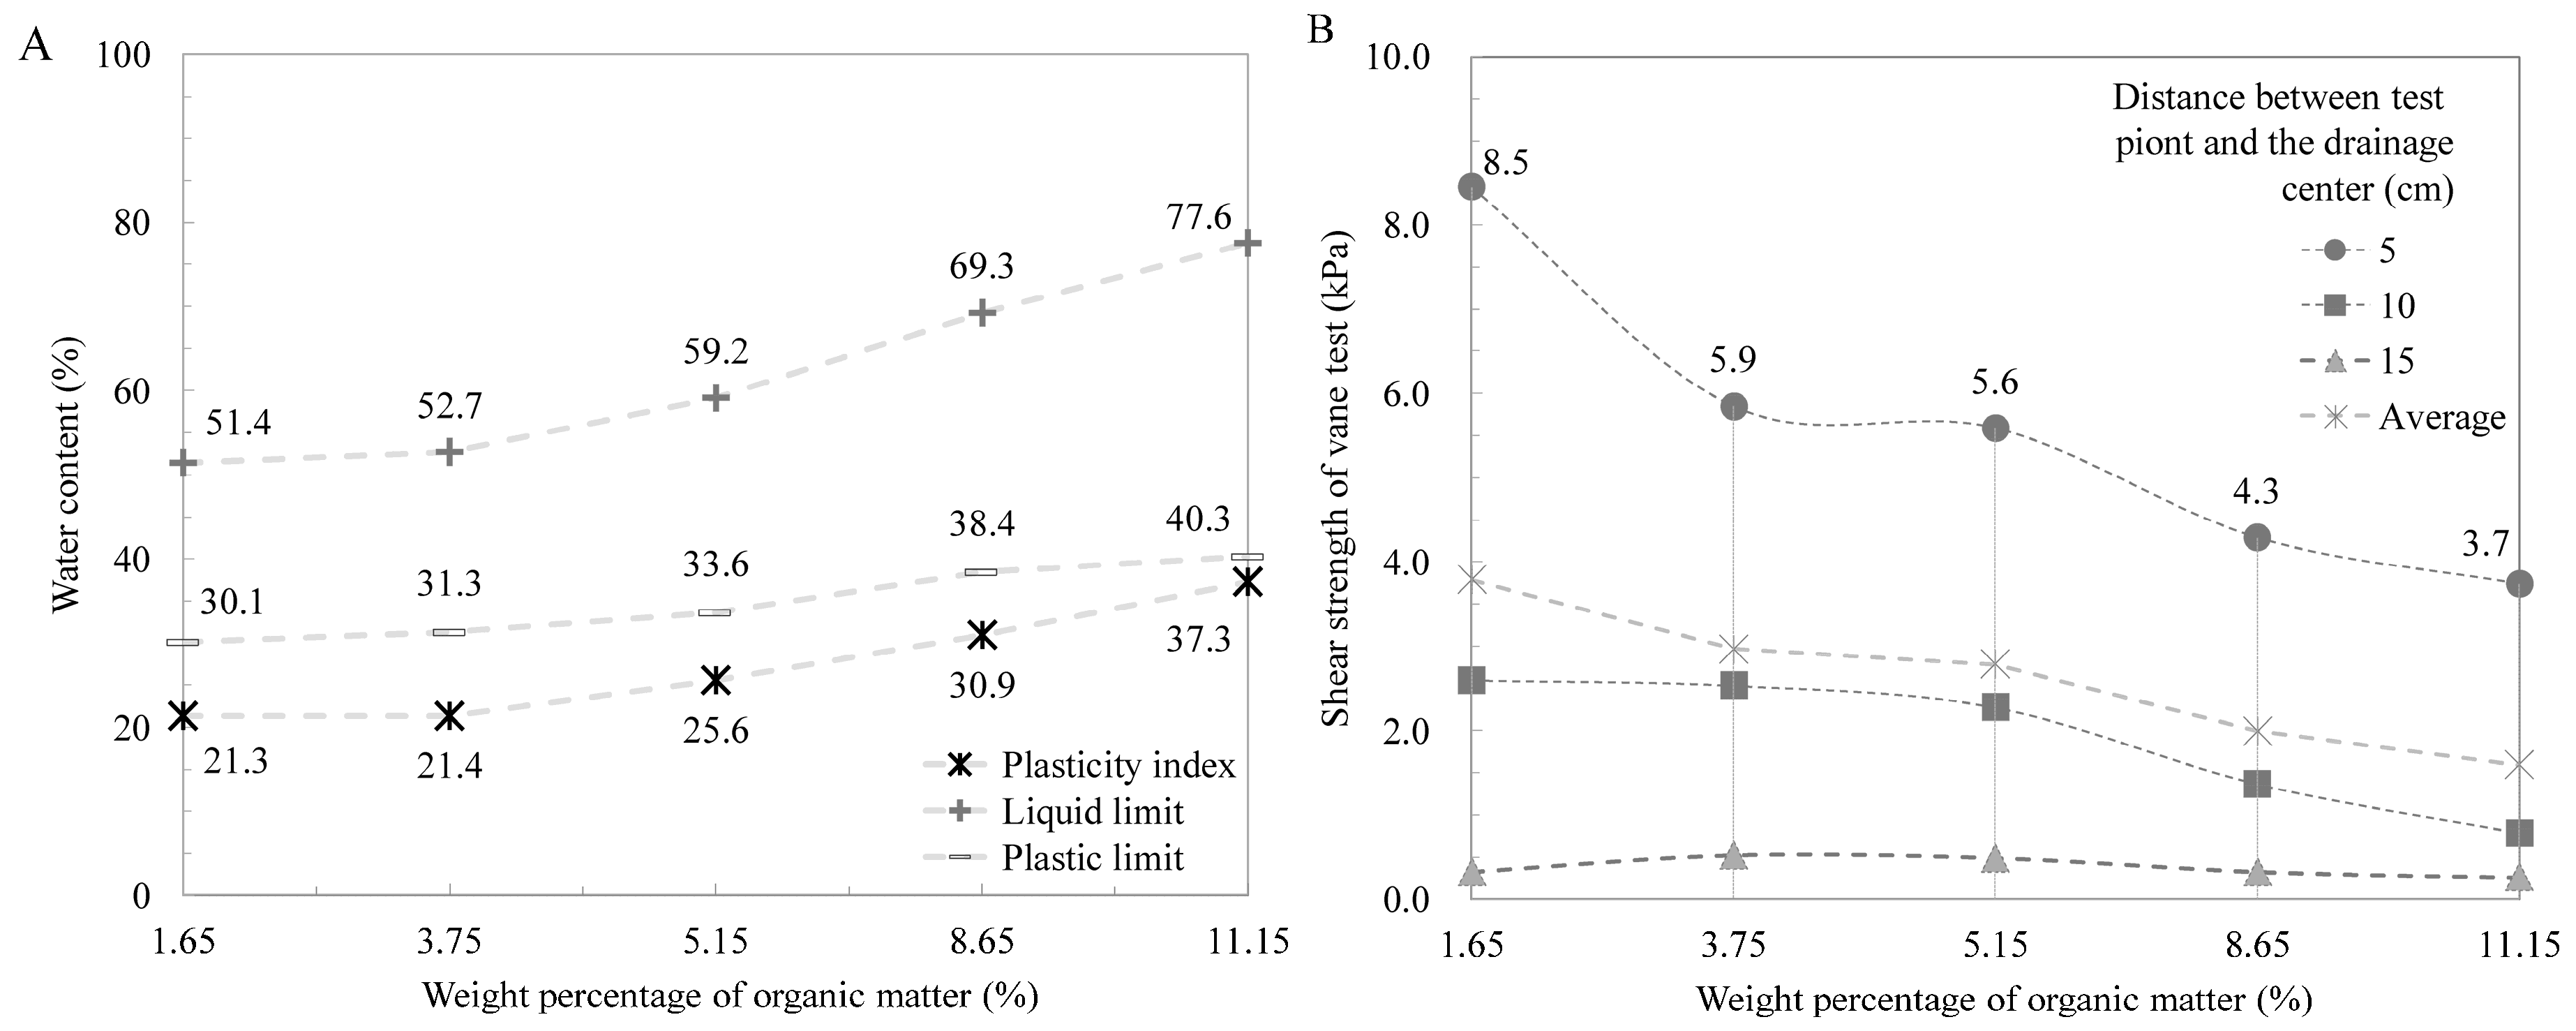
The consistency indices (liquid limit and plastic limit) of five hydraulic mud samples increased with the increase of organic matter, as shown in Figure 1A. The plasticity index decreased very slightly from 1.65% to 3.75%, and then increased significantly with the increase of organic matter.
The relationship between shear strength and organic matter content is shown in Figure 1B. The shear strength had a negative relationship with the distance from the drainage center. It decreased rapidly by the increasing distance from the drainage center. It was also decreased with the increase of organic matter content.
3.2. Connection and Coexistence Properties Based on DCM
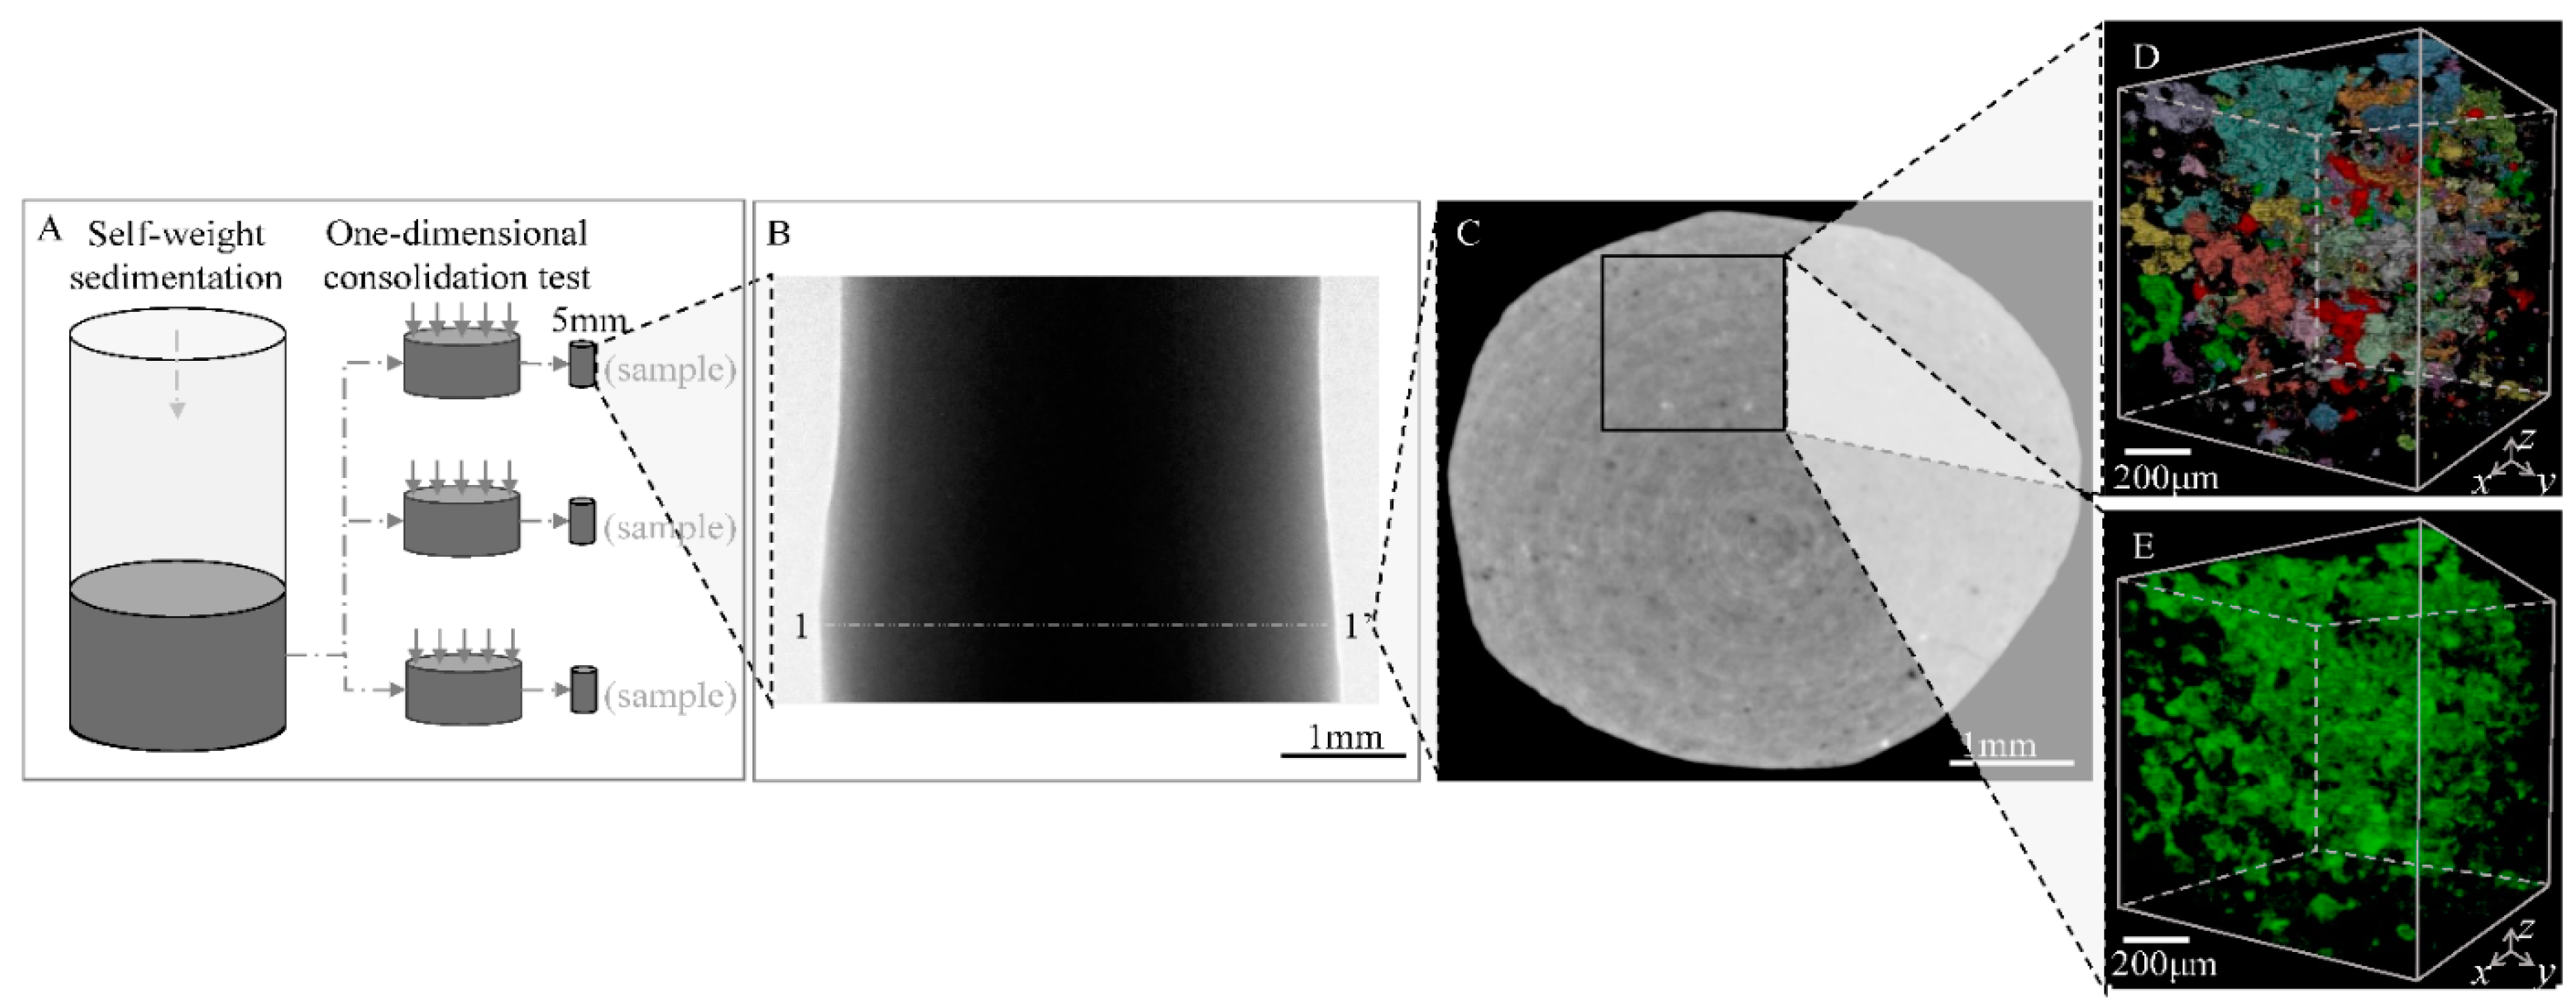
After one-dimensional tests (Figure 2A), projection images and micro-CT slices were obtained (Figure 2B,C). By DCM reconfigurable computing, 3D quantitative distribution characterization of organic matter was realized, as shown in Figure 2D,E.
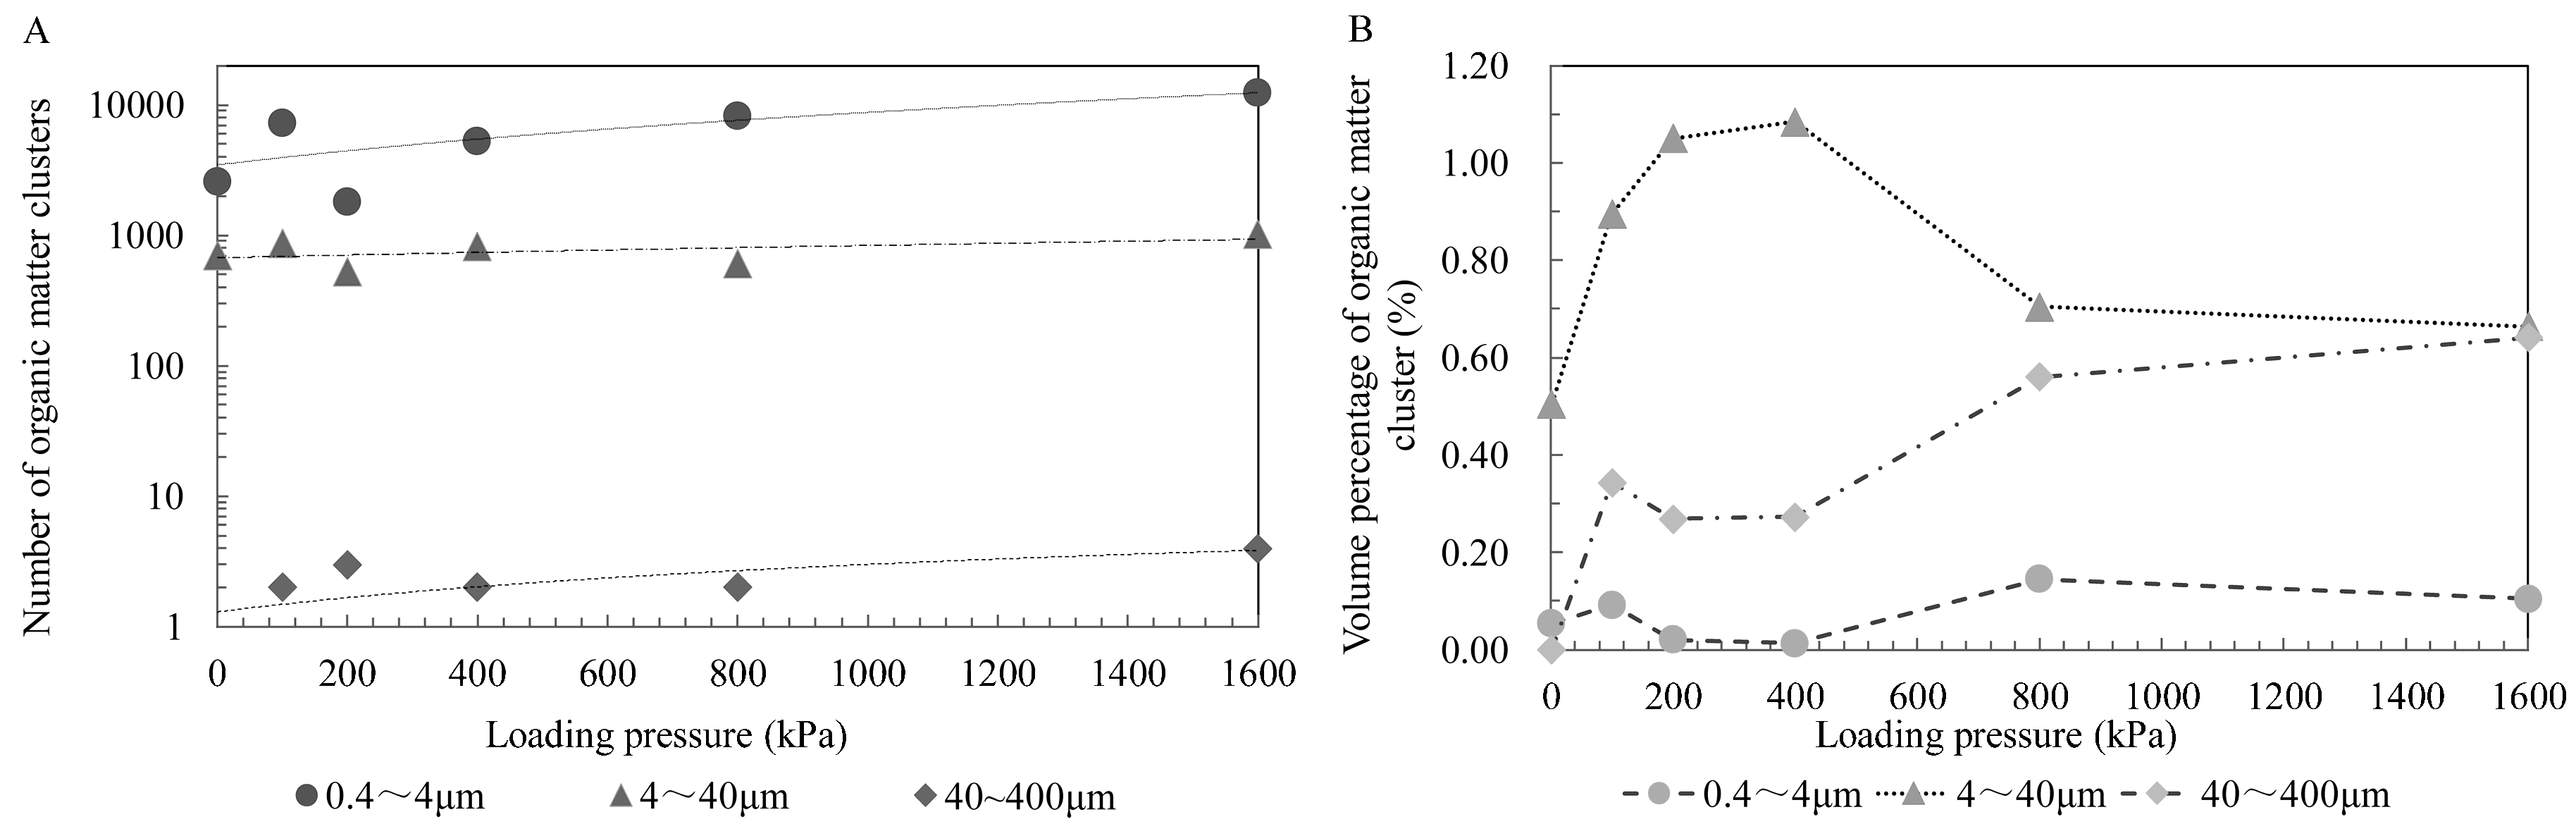
After consolidation pressure, the quality of organic composition and density were considered, and the threshold value was set at x = 0.015. The curve of quantity and volume change of organic cluster was obtained, as shown in Figure 3.
As shown in Figure 3A, the number of sub-macro organic clusters was few. Three scales of organic cluster (40–400 μm, 4–40 μm, and 0.4–4 μm) changed visibly in consolidation at 200 kPa and 800 kPa. As shown in Figure 3B, the micro scale of organic clusters was the main scale which had the greatest volume percentage. The volume percentages of three scales of organic cluster were changed rapidly at 100 kPa. When pressure was more than 400 kPa, the volume percentage of three scales of organic cluster was changed rapidly. Pressures of 100 kPa and 400 kPa could be two characteristic points of structure change of organic cluster, which perhaps matched the turning points of the destruction of hydraulic mud [49]. Therefore, it demonstrated that organic structure could be presented remarkably by volume percentage.
The character of organic clusters along with pressure was analyzed quantitatively with DCM, which overcame the contradiction between imaging field and resolution in the traditional field to a certain extent. In addition, because the size of pores shrinks and blocks the channels, the organic matter aggregated gradually. The 3D structure of each component with nanometer resolution was realized, and each component could be discriminated.
Correlation coefficient method [50] was used to calculate the correlation coefficient between different components in each unit. A correlation coefficient closer to 1 meant the chance of two materials coexisting in one unit was larger, while a correlation coefficient near to −1 indicated that the two materials usually did not coexist in one unit. A correlation coefficient closer to 0 meant that coexistence of two materials were unrelated.
When pressure was from 100 to 1600 kPa, multi-component materials led to different correlation coefficients with the increase of pressure, as shown in Figure 4A. Because of the one-dimensional high-pressure consolidation test on soil samples without leaking out of particles with water, the change of correlation coefficient between two component groups with pressure was small. Meanwhile, the correlation coefficient between organic matter and pores was decreased with the increase of pressure, indicating that the coexistence between organic matter and pores was improved during the drainage consolidation. Meanwhile, the correlation coefficient between organic matter and Minerals 2 was positive at about 0.1, while the correlation coefficient between organic matter and Minerals 1 was negative at around −0.15. Although the weight percentage of organic matter was 1.5%, the correlation coefficients suggested that Minerals 2 might coexist with organic matter more easily than Minerals 1 because of its hydrophilic clay component.
The X-ray linear attenuation coefficient is a physical characteristic of material which can be obtained by DCM software (New York, NY, USA). As shown in Figure 4B, minerals could be divided into three groups based on the attenuation coefficient ratio value of minerals to organic matter [39]. One group was organic matter whose ratio value was 1. Minerals 1 had chlorite, illite, and calcite whose ratio were greater than 20. Minerals 2 had other materials whose ratio values were greater than 10 and less than 20.
4. Discussion
4.1. Distribution Relationship of Minerals and Pores
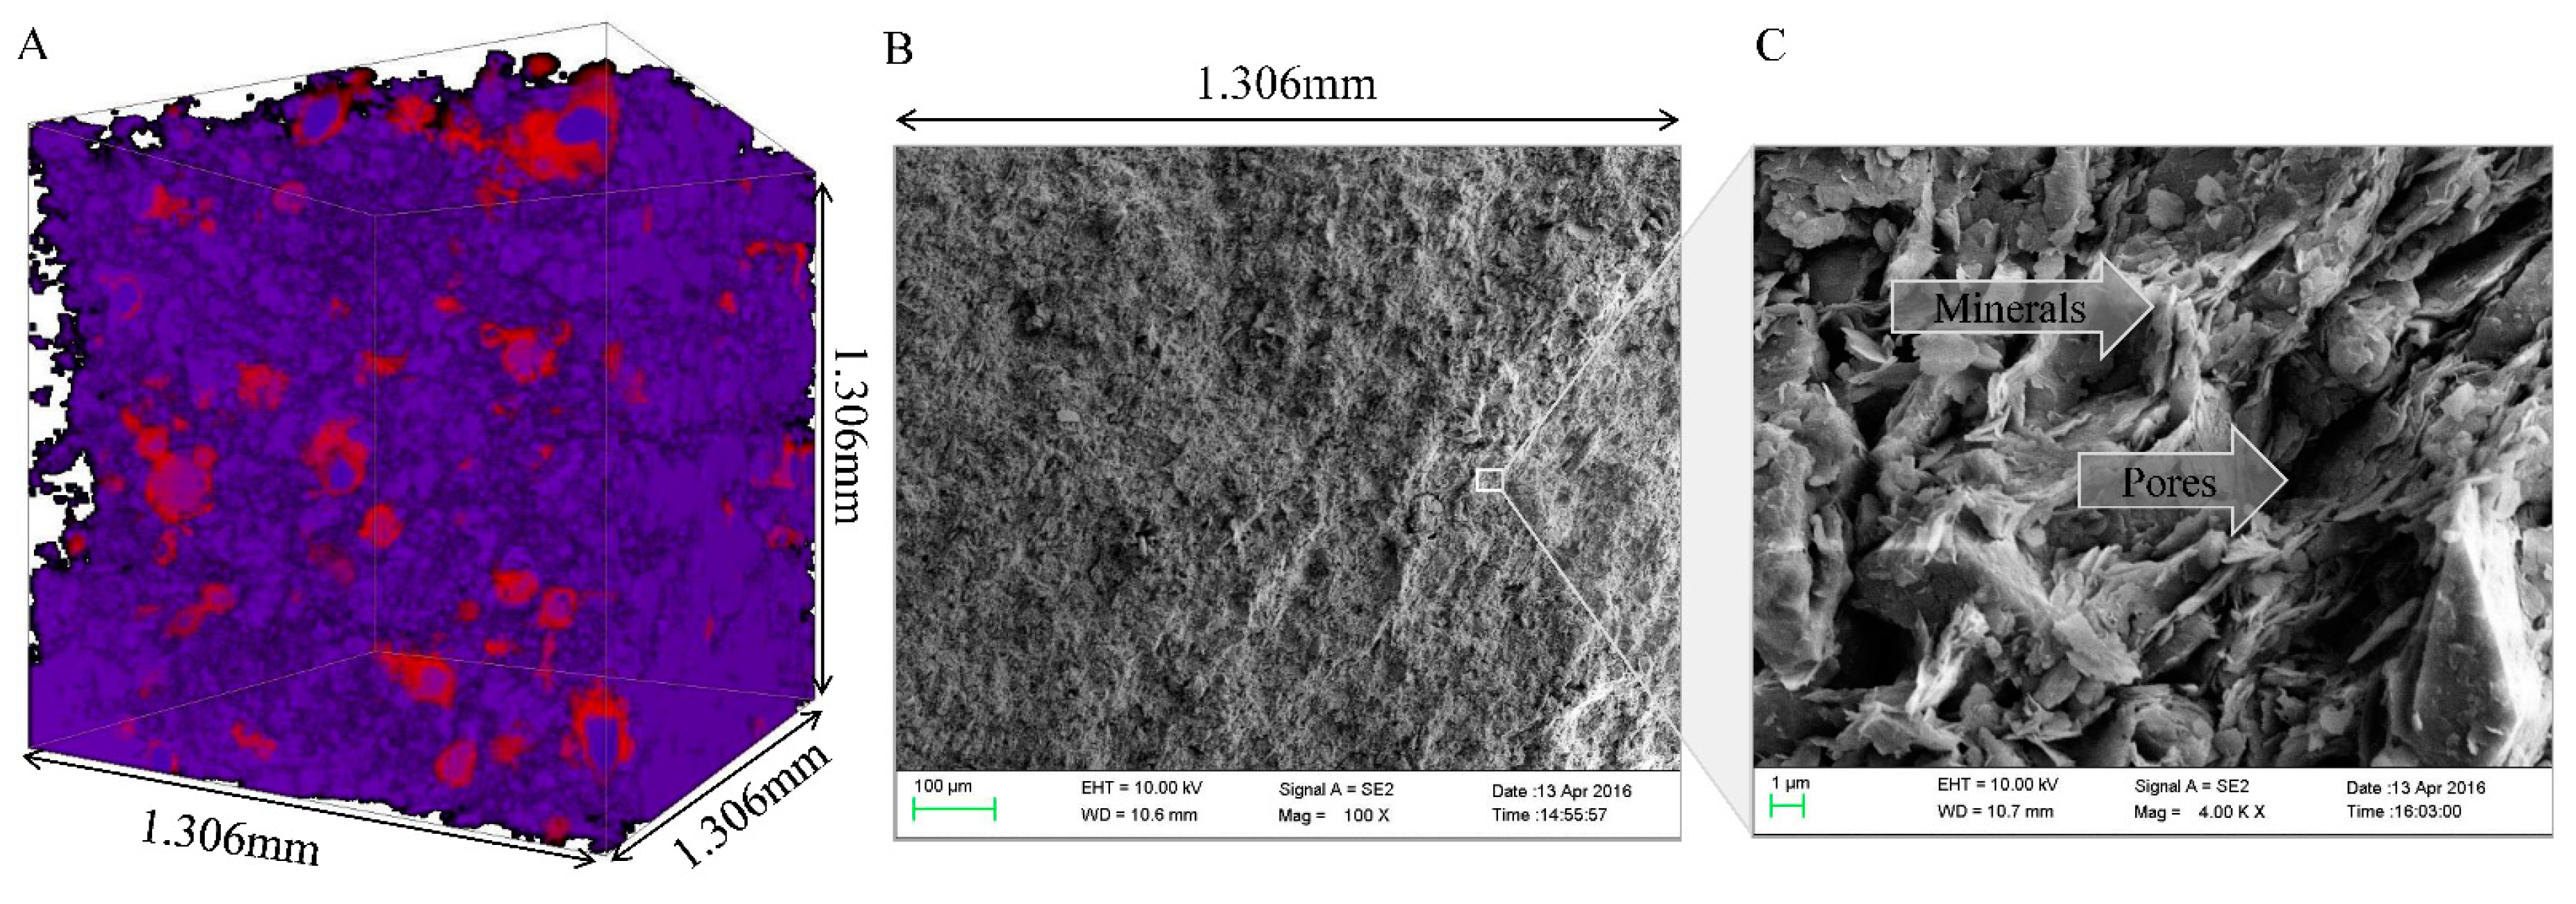
The structure of Minerals 2 of the soil coexisting on a cross-section is shown in Figure 5. Figure 5A shows the three-dimensional structure of the coexisting minerals and pores. Most of pore (blue) and its minerals (red) was within one volume unit, and most of the model units were purple. The SEM images in Figure 5B (100× magnification) and Figure 5C (4000× magnification) showed that the water draining channel could be represented by the component distribution of minerals with illite as its main component during the water-draining and consolidation process.
4.2. Distribution Relationship of Minerals and Organics
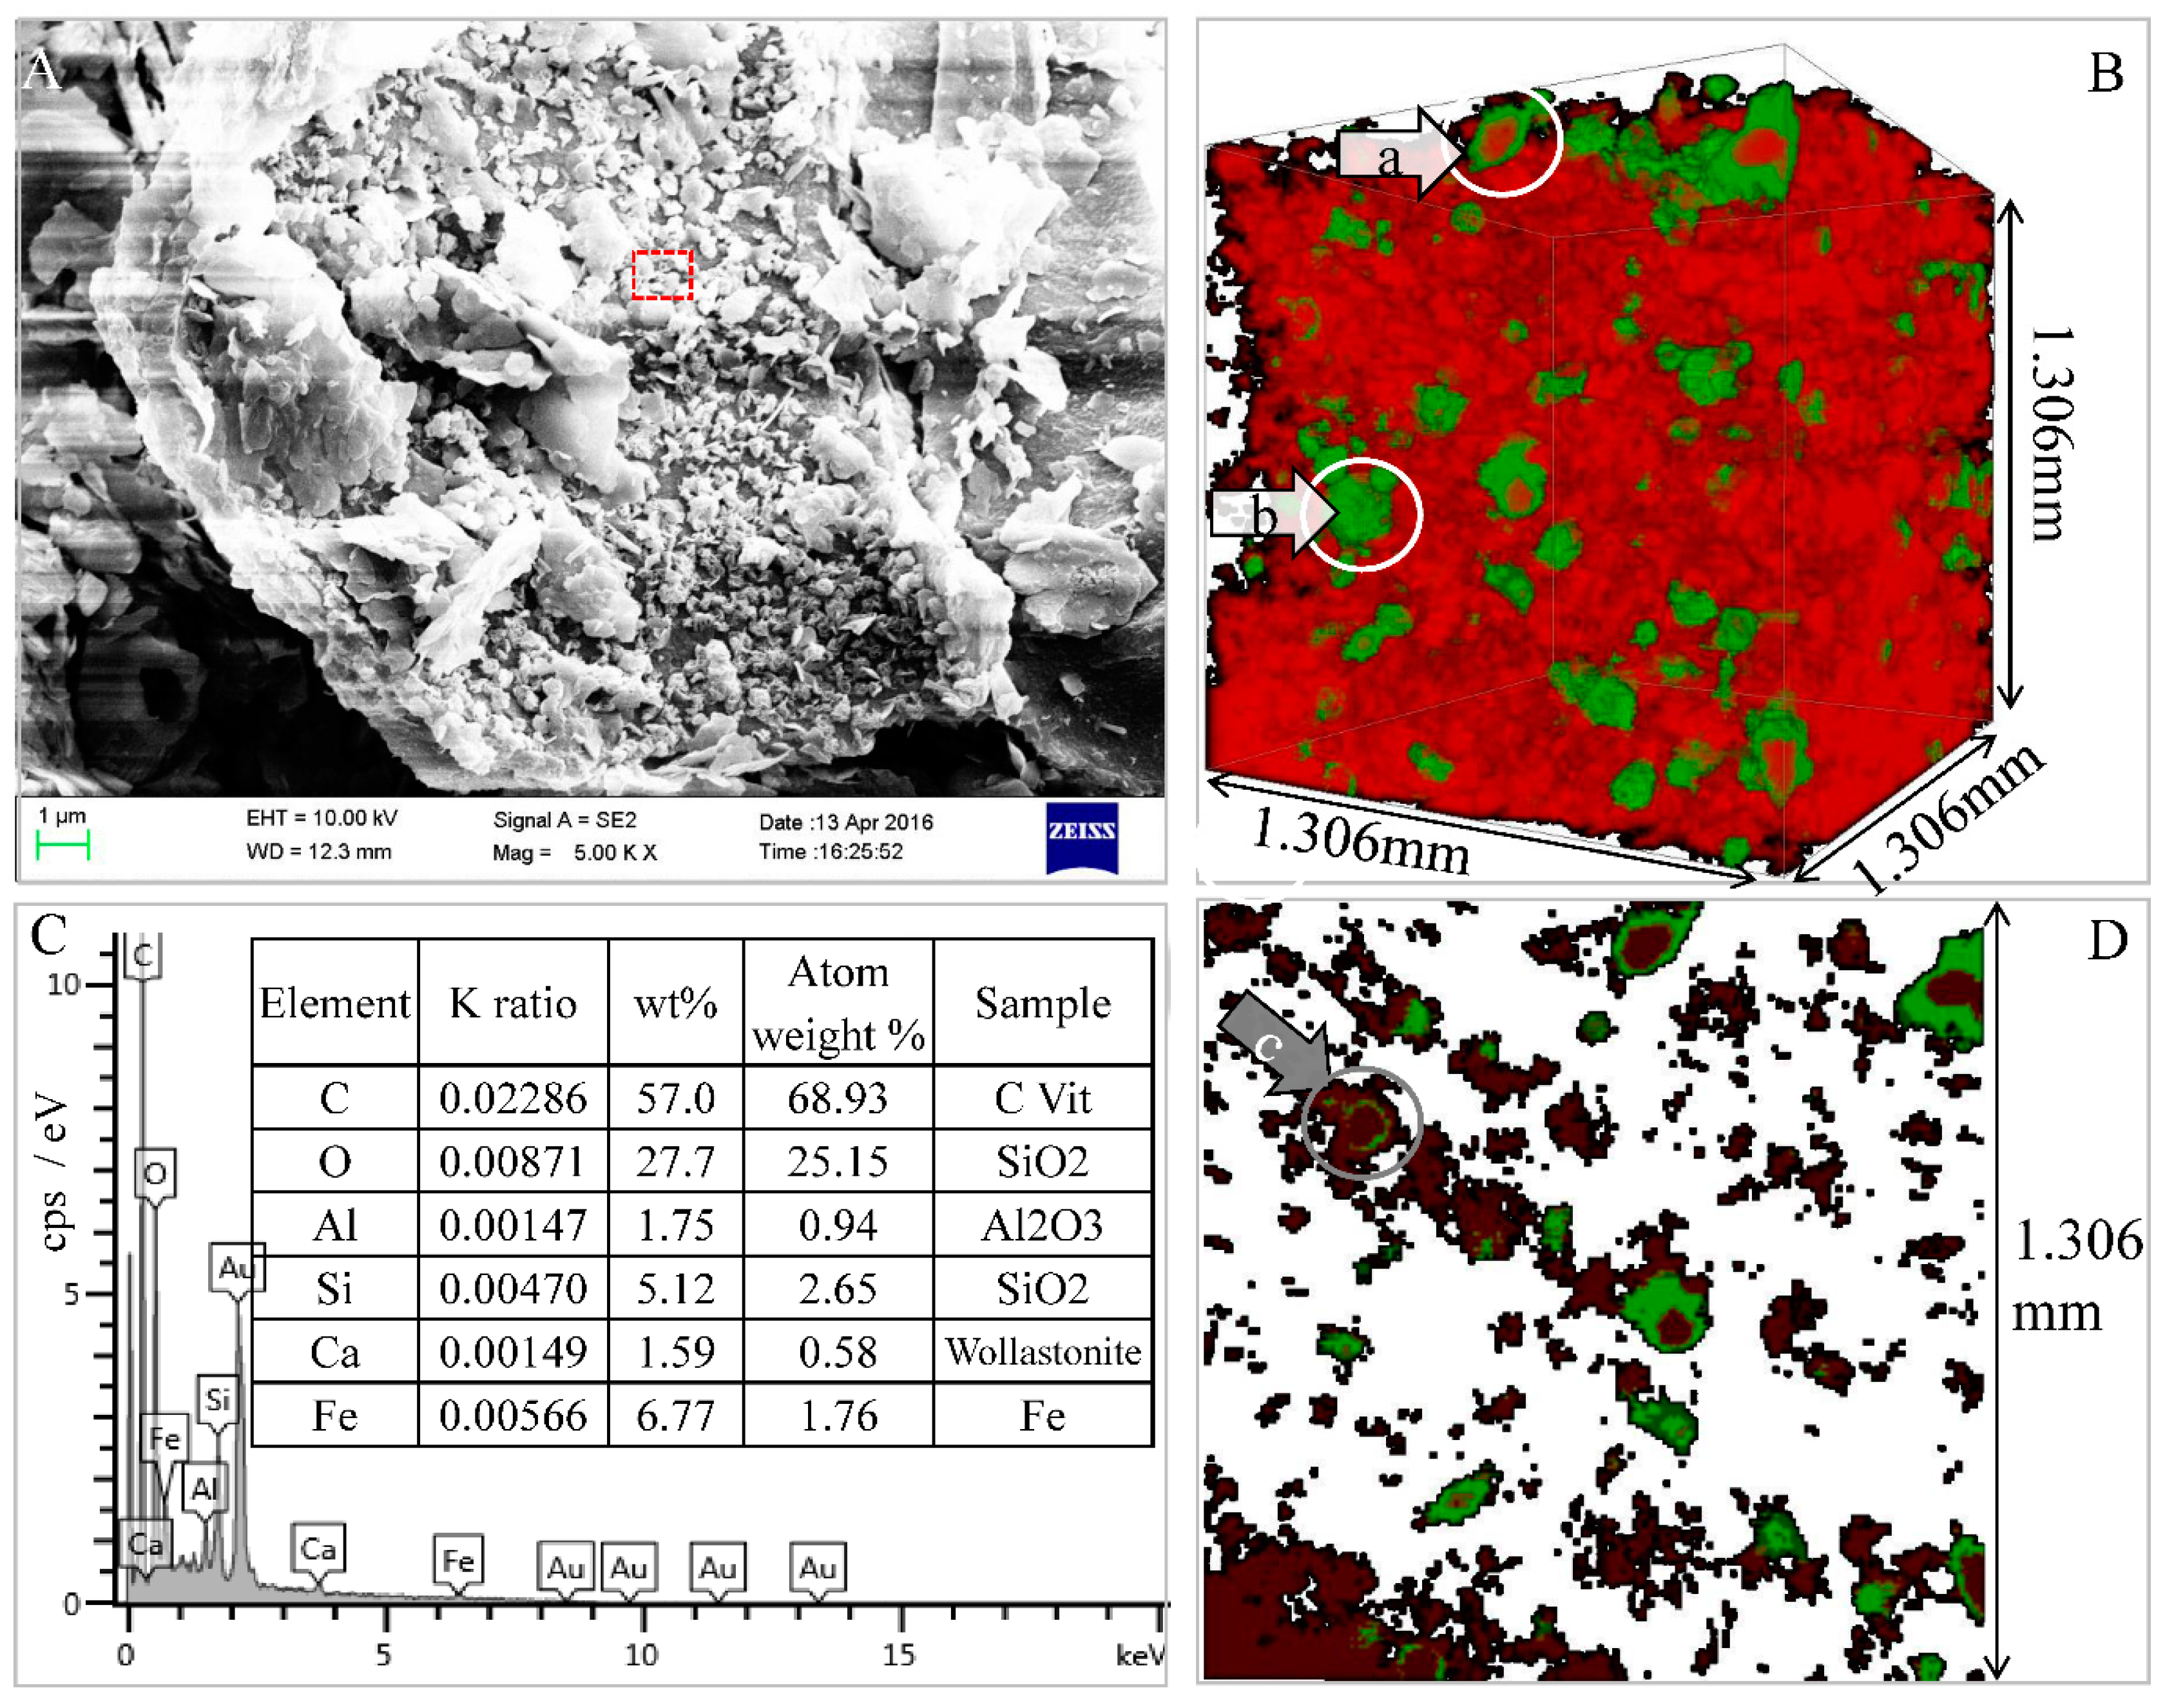
Chen (2005) reported that clay minerals could absorb pore water and closely coexist with organic matter. Based on SEM and Energy Dispersive Spectroscopy (EDX) results [51], the coexistence of organic matter (Figure 6A) and fine soil powder (Figure 6B) was obtained. It showed that there were aggregates or organoclay composite from organic matter (with large specific surface area) and mineral particles. According to the DCM, the 3D distribution of organic matter was similar to those of two minerals. For example, as shown in Figure 6C,D, the 3D coexistence of mineral with illite as its main component could be determined. There are three types in the coexistence of organic matter: organic matter is distributed on the surface of clay minerals, such as area “a” in Figure 6B; organic matter wraps clay minerals up, as in area “b” in Figure 6B; and organic matter is embedded in the layer structure of clay minerals, as in area “c” in Figure 6D. These states are surface adsorption, particle wrapping, and interlayer embedding, respectively.
Prior to discussion, physical and mechanical tests concluded that shear strength decreased with the increase of organic matter content, which was shown in Section 3.1. The number of soil particles were significantly connected together, which was shown in Section 4.1.
The physical and mechanical properties of hydraulic mud are related to the combination of microscopic materials. The hydrophilic organic matter was adsorbed onto the surface of soil particles, then formed the hydrated matter on the surface of soil particles. In this status, organic matter plays a significant role in holding moisture and hindering drainage consolidation of sludge soil, which was connected with deformation in consolidation. So, in our opinion, we deduced that the strength and the deformation of soil would be changed by hydrated matter, which would be greatly influenced by organic matter.
4.3. Distribution Relationship of Minerals, Organics, and Pores
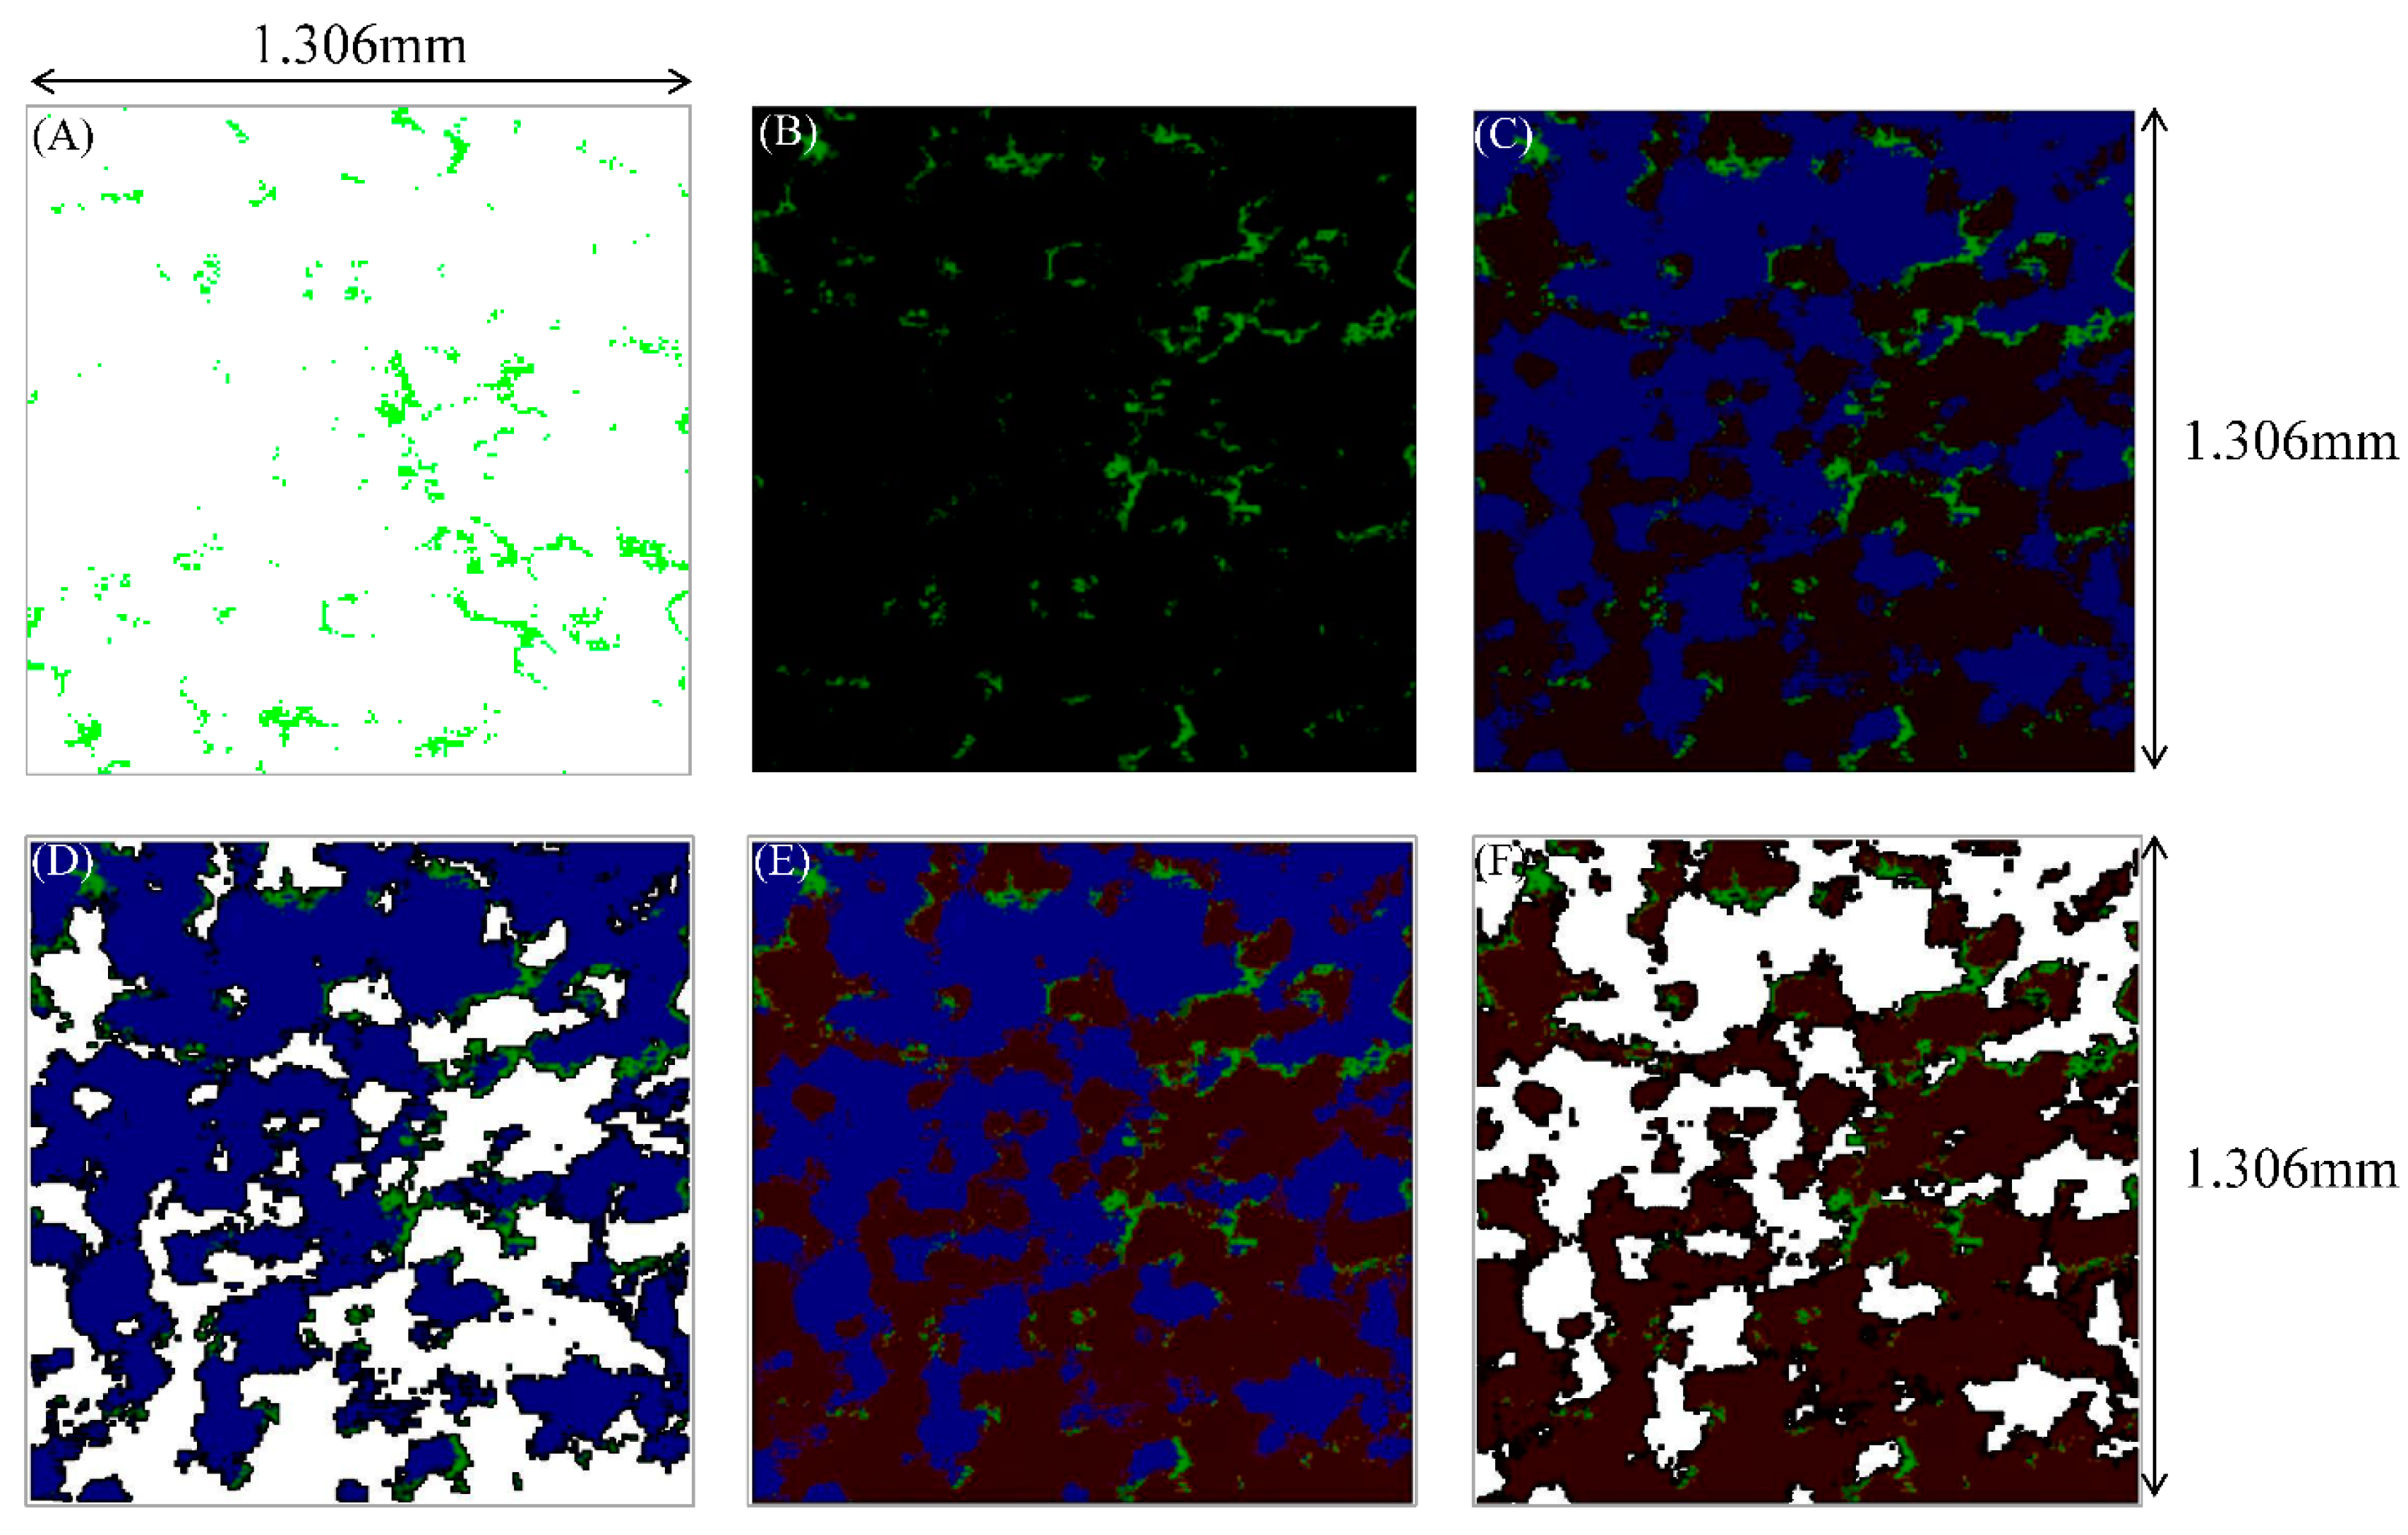
Most of the organic matter was dispersed between two mineral groups, as shown in Figure 7A. Meanwhile, the value of correlation coefficient between Minerals 2 and pores was always greater than 0.8, indicating that hydrophilic flocculent structure was relatively significant.
Organic matter did not coexist with pores (Figure 7B), and the color did not change from Figure 7A to Figure 7B. This is possibly due to the migration of organic matter with water during the consolidation process. During the consolidation of hydraulic mud, pores and Minerals 1 formed the skeleton structure of soil body (Figure 7C,D). Furthermore, the strong water absorption capacity of the hydrocolloid in organic matter caused organic matter to be attached to the surface of Minerals 2 (Figure 7E,F).
Both the rough surface of organic matter and Minerals 1 could facilitate the coexistence of the hydraulic channel. Particles with high contented clay mineral in Minerals 2 could be connected with strongly-bound water, then attach to the surface of the primary mineral and form a stable flocculent structure gradually.
5. Conclusions
The approach of DCM combined with two-energy synchrotron-based X-ray micro-CT presented in the article is applicable in studying the relationship between microstructure and macro-properties of soil. The materials in the soil were classified into four groups of organic matter, and two groups of minerals and pores, based on their X-ray attenuation coefficient under different energies. The analyses have demonstrated that:
- It was demonstrated that organic matter plays a significant role in hindering the shear strength of consolidation. Organic matter affected the physical properties of the soil mainly through the adsorption of water on the surface of soil particles. Soil particles were connected to each other through the absorbed water film, leading to the decrease of resistance, adhesion strength, and the shear strength between soil particles.
- During the consolidation of hydraulic mud, the analysis has shown that the pressures of 100 kPa and 400 kPa could be used as two characteristic values of structure change of hydraulic mud, which perhaps matched the turning points of destruction. The organics tend to be exclusive from pores and minerals.
- The size of pores shrank and blocked the channels, and the organic matter aggregated gradually in consolidation. Minerals 2 (including minerals of chlorite and illite, etc.) coexisted with organic matter more easily than Minerals 1 (including primary minerals and some clay minerals) because of their hydrophilic clay component.
Data-constrained modelling (DCM) is a novel method in the quantitative analysis of 3D microstructures. This method would be an effective research tool in organic structure research. It can be applicable in the microstructure distribution, property characteristics, and quantification for various other engineering applications.
Acknowledgments
The study was financially supported by the Natural Science Foundation of China (41402239, 41572277), the National Basic Research Program of China (2014CB239004), the Natural Science Foundation of Guangdong Province China (S2012040007331), the Foundation for University Young Teacher by the Ministry of Sun Yat-sen University (13lgpy63). Thanks to students for their supporting on the work and the reviewer’s valuable comments. Y.S. Yang would like to acknowledge hospitality by Shanxi University.
Author Contributions
J.S. did experiments, analyzed the data and wrote the paper. Y.-S.Y. was the inventor of data constrained modelling technology which was used in analyzing. X.L. set up the model and adjusted parameters. Z.-Q.L. was mainly responsible for the experiment and data processing.
Conflicts of Interest
The authors declare no conflict of interest.
References
- Karthikeyan, M.; Dasari, G.R.; Tan, T.S. In situ characterization of land reclaimed using big clay lumps. Can. Geotech. J. 2004, 41, 242–256. [Google Scholar] [CrossRef]
- Zhang, M.; Zhu, X.; Yu, G.; Yan, J.; Wang, X.; Chen, M.; Wang, W. Permeability of muddy clay and settlement simulation. Ocean Eng. 2015, 104, 521–529. [Google Scholar] [CrossRef]
- Nishida, N.; Ito, M.; Inoue, A.; Takizawa, S. Clay fabric of fluid-mud deposits from laboratory and field observations: Potential application to the stratigraphic record. Mar. Geol. 2013, 337, 1–8. [Google Scholar] [CrossRef]
- Lou, X.; Mao, X.; Chen, X. Comparative Study on Determination of the Content of Organic matter in Soil Test. Bull. Sci. Technol. 2015, 31, 112–114. [Google Scholar]
- Abt, H. Land reclamation and soil improvement works for two deep water ports in Vietnam. Jpn. Geotech. Soc. Spec. Publ. 2016, 2, 1773–1777. [Google Scholar] [CrossRef]
- Song, J.; Wang, Q.; Zhang, P. Laboratory Research on Fine Particle Migration of High Clay Dredge Fill in Consolidation Process. J. Eng. Geol. 2012, 20, 1042–1049. [Google Scholar]
- Jafari, N.H.; Stark, T.D. Field scale hydraulic conductivity and compressibility of organic clays. Eng. Geol. 2017, 220, 52–64. [Google Scholar] [CrossRef]
- Song, J.; Wang, Q.; Xia, Y. Physical and Chemical Indicators of Dredger Fill with High Clay by Vacuum Preloading. J. Jilin Univ. (Earth Sci. Ed.) 2011, 41, 1476–1480. [Google Scholar]
- Xu, G.; Ji, F.; Wen, J. Sedimentation Behavior of Dredger Slurry at High Water Content. J. Civ. Eng. Manag. 2012, 29, 22–27. [Google Scholar]
- Salgado, J.; Mato, M.M.; Vázquez-Galiñanes, A.; Paz-Andrade, M.I.; Carballas, T. Comparison of two calorimetric methods to determine the loss of organic matter in galician soils (nw spain) due to forest wildfires. Thermochim. Acta 2004, 410, 141–148. [Google Scholar] [CrossRef]
- Song, J.; Tang, L.; Wang, Q. Analysis on Physical and Mechanical Properties of Some Typical Dredger Fill in Coastal Regions. Acta Scientiarum Naturalium Universitatis Sunyatseni 2014, 53, 106–111. [Google Scholar]
- Dong, Y.; Hu, W. Comparison and Anlysis of Processing Experiments on Dredger Fill Consolidation. Ground Water 2011, 6, 171–172. [Google Scholar]
- Liao, B.Q.; Allen, D.G.; Leppard, G.G.; Droppo, I.G.; Liss, S.N. Interparticle interactions affecting the stability of sludge flocs. J. Colloid Interface. Sci. 2005, 249, 372–380. [Google Scholar] [CrossRef] [PubMed]
- Sun, Y.J.; Sun, S.Q.; Bao, S.F. Cause of conventional vacuum consolidation technology failure to newly filled reclamation mud foundation. Port Waterw. Eng. 2015, 11, 148–154. [Google Scholar]
- Buljan, R.; Pollak, D.; Gulam, V. Engineering properties of marine sediments in Mali Ston Bay (Croatia) based on “Mainland-Pelješac” bridge investigations. Geologia Croatica 2012, 65, 233–242. [Google Scholar] [CrossRef]
- Valarini, P.J.; Díaz Alvarez, M.C.; Gascó, J.M.; Guerrero, F.; Tokeshi, H. Assessment of soil properties by organic matter and EM-microorganism incorporation. Revista Brasileira de Ciência do Solo 2003, 27, 49–75. [Google Scholar] [CrossRef]
- Gu, R.G.; Fang, Y.G. Experiment study of the effects of organic matter on the rheological characteristics of soft soils. Civ. Eng. J. 2009, 42, 101–106. [Google Scholar] [CrossRef]
- Wehling, T.M.; Boulanger, R.W.; Arulnathan, R.; Harder, L.F.; Driller, M.W. Nonlinear Dynamic Properties of a Fibrous Organic Soil. J. Geotech. Geoenviron. Eng. 2003, 129, 929–939. [Google Scholar] [CrossRef]
- Xu, R.; Guo, Y.; Liu, Z. Experimental Study on Mechanical Properties of Stabilized Artificial Organic Soil. J. Zhejiang Univ. (Eng. Sci.) 2007, 41, 109–113. [Google Scholar]
- Mou, C.; Li, B. Influence of Organic matter on Mechanical Character of Soft Soil. Hydrogeol. Eng. Geol. 2008, 35, 42–46. [Google Scholar] [CrossRef]
- Liu, F.; Chen, J.; Bai, S. Analysis of Formation Mechanism and Consolidation Characteristics of High Organic Soft Clay. Rock Soil Mech. 2013, 34, 3453–3458. [Google Scholar]
- Obour, A.K.; Stahlman, P.W.; Holman, J.D. Soil chemical properties as influenced by long-term glyphosate-resistant corn and soybean production in the central Great Plains, USA. Geoderma 2016, 277, 1–9. [Google Scholar] [CrossRef]
- Kazemian, S.; Prasad, A.; Huat, B.B.K.; Ghiasi, V.; Ghareh, S. Effects of Cement–Sodium Silicate System Grout on Tropical Organic Soils. Arab. J. Sci. Eng. 2012, 37, 2137–2148. [Google Scholar] [CrossRef]
- Kennedy, M.J.; Pevear, D.R.; Hill, R.J. Mineral Surface Control of Organic Carbon in Black Shale. Science 2002, 295, 657–660. [Google Scholar] [CrossRef] [PubMed]
- Anisuzzaman, M. Engineering Properties of Soft Organic Soil Underlying Dredge Fill Areas of Dhaka, Bangladesh. Planet. Sci. Res. Cent. 2013, 5, 28–32. [Google Scholar]
- Guo, Y.; Xu, R.; Shao, Y. Study on Mechanism of Muddy Soil Stabilization. J. Zhejiang Univ. (Eng. Sci.) 2008, 42, 1071–1075. [Google Scholar]
- Virto, I.; Gartzia-Bengoetxea, N.; Fernández-Ugalde, O. Role of Organic matter and Carbonates in Soil Aggregation Estimated Using Laser Diffractometry. Pedosphere 2011, 21, 566–572. [Google Scholar] [CrossRef]
- Lebron, I.; Mcgiffen, M.E., Jr.; Suarez, D.L. The Effect of Total Carbon on Microscopic Soil Properties and Implications for Crop Production. J. Arid Land 2012, 4, 251–259. [Google Scholar] [CrossRef]
- Monreal, C.M.; Schnitzer, M.; Schulten, H.R.; Campbell, C.A.; Anderson, D.W. Soil Organic Structures in Macro and Micro-aggregates of Cultivated Brown Chernozem. Soil Biol. Biochem. 1994, 27, 845–853. [Google Scholar] [CrossRef]
- Li, L. The Research of Existing Characteristics of Soil Organic Matter in the Typical Tabacco-Growing Area; Chongqing Southeast University Press: Chongqing, China, 2015; pp. 1–90. [Google Scholar]
- Valérie, B.; Piet, S.; Winnie, D.; Sophie, L.; Thanh, T.H.T.; Bart, V. Phytoremediation as a management option for contaminated sediments in tidal marshes, flood control areas and dredged sediment landfill sites. Environ. Sci. Pollut. Res. 2009, 16, 745–764. [Google Scholar]
- Cui, Z.D.; Jia, Y.J. Analysis of electron microscope images of soil pore structure for the study of land subsidence in centrifuge model tests of high-rise building groups. Eng. Geol. 2013, 164, 107–116. [Google Scholar] [CrossRef]
- Zhang, X.; Kong, L.; Wang, J. Experimental Study of SEM-EDS for Cementation Bond Characteristics of Zhanjiang Clay. Rock Soil Mech. 2013, 34, 195–203. [Google Scholar] [CrossRef]
- Kilfeather, A.A.; van der Meer, J.J.M. Pore size, shape and connectivity in tills and their relationship to deformation processes. Quat. Sci. Rev. 2008, 27, 250–266. [Google Scholar] [CrossRef]
- Payan, M.; Senetakis, K.; Khoshghalb, A.; Khalili, N. Influence of Particle Shape on Small-stran Damping Ratio of Dry Sands. Geotechnique 2016, 66, 1–7. [Google Scholar] [CrossRef]
- Xu, R.; Den, W.; Xu, B. Calculation of Three-Dimensional Porosity of Soft Soil Based on SEM Image. Chin. J. Rock Mech. Eng. 2015, 34, 1497–1502. [Google Scholar] [CrossRef]
- Harjupatana, T.; Alaraudanjoki, J.; Kataja, M. X-ray Tomographic Method for Measuring Three-dimensional Deformation and Water Content Distribution in Swelling Clays. Appl. Clay Sci. 2015, 114, 386–394. [Google Scholar] [CrossRef]
- Zolotarev, K.; Kulipanov, G.; Levichev, E.; Mezentsev, N.; Pindyurin, V.; Piminov, P.; Tolochko, B. Synchrotron Radiation Applications in the Siberian Synchrotron and Terahertz Radiation Center. Phys. Procedia 2016, 84, 4–12. [Google Scholar] [CrossRef]
- Wang, Y. Quantitative Methodology on Material Using Synchrotron Radiation X-ray Microscopic CT. Ph.D. Thesis, Graduate School of Chinese Academy of Sciences, Beijing, China, May 2012. [Google Scholar]
- Ma, R.; Cai, C.; Li, Z.; Wang, J.; Xiao, T.; Peng, G. Evaluation of soil aggregate microstructure and stability under wetting and drying cycles in two ultisols using synchrotron-based X-ray micro-computed tomography. Soil Tillage Rese 2015, 149, 1–11. [Google Scholar] [CrossRef]
- Yang, Y.S.; Tulloh, A.; Chen, F.; Liu, K.Y.; Clennell, B.; Taylor, J. Data-constrained characterization of sandstone microstructures with multi-energy X-ray CT. J. Phys. Conf. Ser. 2013, 463, 012048. [Google Scholar] [CrossRef]
- Wang, Y.D.; Yang, Y.S.; Cole, I.; Trinchi, A.; Xiao, T.Q. Investigation of the microstructure of an aqueously corroded zinc wire by data-constrained modelling with multi-energy X-ray ct. Mater. Corros. 2014, 64, 180–184. [Google Scholar] [CrossRef]
- Yang, S.; Gao, D.C.; Muster, T.; Tulloh, A.; Furman, S.; Mayo, S.; Trinchi, A. Microstructure of a paint primer -a data-constrained modeling analysis. Materi. Sci. Forum 2010, 654–656, 1686–1689. [Google Scholar] [CrossRef]
- Wang, H.P.; Yang, Y.S.; Jiang, X.J.; Yang, J.L.; Nie, Y.H. Physical structure characterization of direct coal liquefaction residue by dcm model and synchrotron X-ray ct. J. Shanxi Univ. 2014, 37, 545–552. [Google Scholar] [CrossRef]
- Technical Committee. Technical Code for Ground Treatment of Building JGJ79-2012; China Architecture Building Press: Beijing, China, 2012. [Google Scholar]
- Jenck, O.; Dias, D.; Kastner, R. Discrete Element Modelling of a Granular Platform Supported by Piles in Soft Soil-Validation on a Small Scale Model Test and Comparison to a Numerical Analysis in a Continuum. Comput. Geotech. 2009, 36, 917–927. [Google Scholar] [CrossRef]
- Yang, Y.S.; Trinchi, A.; Tulloh, A.; Chu, C. Tutorial Introduction to DCM Quantitative Characterization and Modelling of Material Micro-structures Using Monochromatic Multi-Energy X-Ray CT. AIP Conf. Proc. 2014, 342–347. [Google Scholar] [CrossRef]
- Benedetti, A.; Abrahamowicz, M.; Leffondré, K.; Goldberg, M.S.; Tamblyn, R. Using Generalized Additive Models to Detect and Estimate Threshold Associations. Int. J. Biostat. 2009, 5. [Google Scholar] [CrossRef]
- Liu, Z.-Q.; Song, J.; Yang, Y.-S.; Ren, Y.-Q. Three dimentional pores evoluation characteristics of during consolidation process of saturated fine-grained soil. J. Eng. Geol. 2016, 24, 931–940. [Google Scholar] [CrossRef]
- Chen, G.-S.; Wang, Y.-M.; Bai, T.; Du, H.-H. Diagnoses of Runoff-sediment Relationship Based on Variable Diagnostic Method-variable Step Length Sliding Correlation Coefficient Method in Ning-Meng reach. Int. J. Hydrog. Energy 2016, 41, 15909–15918. [Google Scholar] [CrossRef]
- Hazra, B.; Varma, A.K.; Bandopadhyay, A.K.; Chakravarty, S.; Buragohain, J.; Samad, S.K.; Prasad, A.K. FTIR, XRF, XRD and SEM characteristics of Permian shales, India. J. Nat. Gas Sci. Eng. 2016, 32, 239–255. [Google Scholar] [CrossRef]
Figure 1.
Physical and mechanical properties of hydraulic mud. (A) Physical properties of hydraulic mud. (B) Mechanical properties of hydraulic mud.
Figure 1.
Physical and mechanical properties of hydraulic mud. (A) Physical properties of hydraulic mud. (B) Mechanical properties of hydraulic mud.

Figure 2.
Experiments and modeling process. (A) Sample preparation after physical simulation experiment; (B) A projection image after background correction of one sample; (C) CT slice after reconstruction of the sample; (D) Distribution of organic clusters; (E) Distribution of organic matter.
Figure 2.
Experiments and modeling process. (A) Sample preparation after physical simulation experiment; (B) A projection image after background correction of one sample; (C) CT slice after reconstruction of the sample; (D) Distribution of organic clusters; (E) Distribution of organic matter.

Figure 3.
Variation of organic clusters with loading pressure. (A) The number of organic clusters varies with loading pressure; (B) the volume of organic clusters varies with loading pressure.
Figure 3.
Variation of organic clusters with loading pressure. (A) The number of organic clusters varies with loading pressure; (B) the volume of organic clusters varies with loading pressure.

Figure 4.
Variation of the correlation coefficient of different components. (A) Correlation coefficient of matter varies with loading pressure changes; (B) Three components of the soil: Minerals 1, Minerals 2, and organic matter.
Figure 4.
Variation of the correlation coefficient of different components. (A) Correlation coefficient of matter varies with loading pressure changes; (B) Three components of the soil: Minerals 1, Minerals 2, and organic matter.
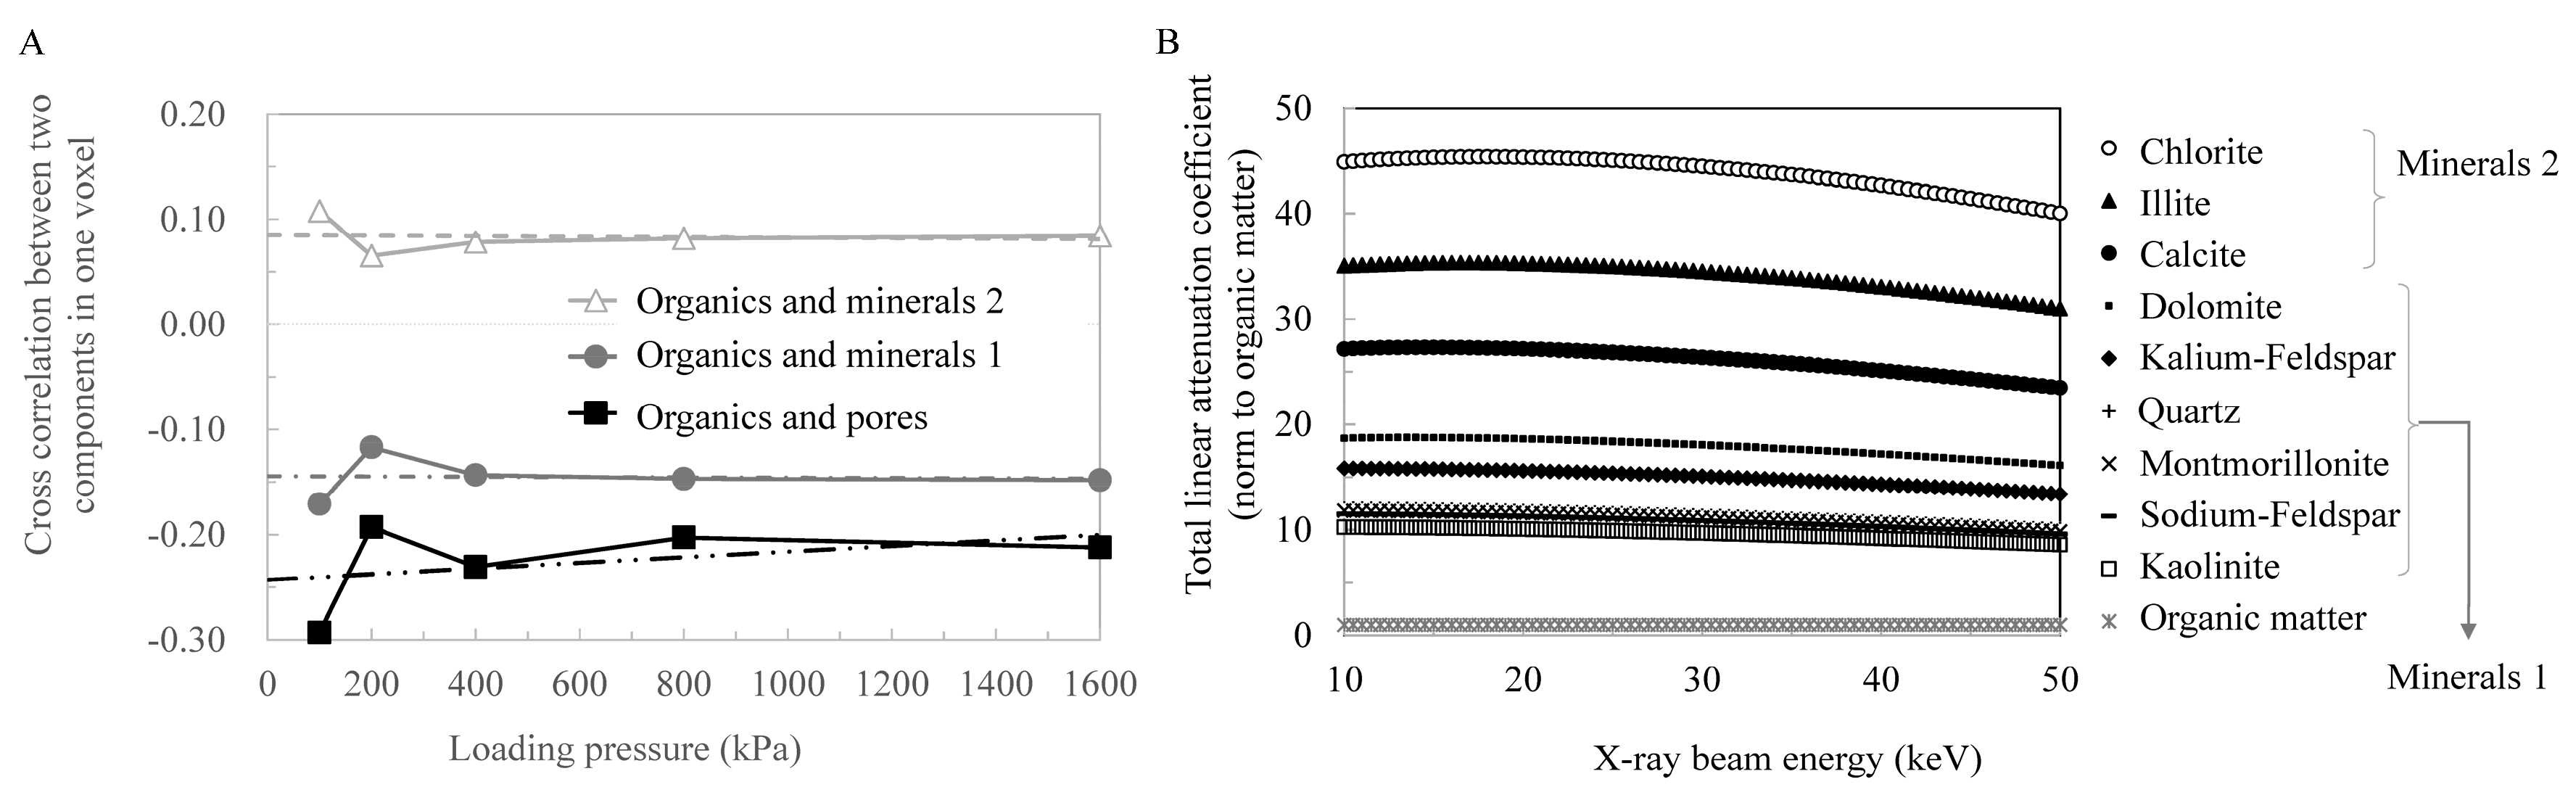
Figure 5.
Minerals combined with pores. (A) Three-dimensional data-constrained modelling (DCM) model of clay mineral bound with pores (red denotes minerals, and purple indicates a mix of minerals and pores; (B) Amplified SEM image at 100 times magnification; (C) Amplified SEM image at 4000 times magnification).

Figure 6.
Coexistence of organic and clay mineral. (A) Amplifying SEM images of 5000×; (B) Structure of clay minerals and organic matter; (C) Elements in EDX energy spectra; and (D) 2D coexistence of organic and minerals (green and dark brown denote organic matter and a mixture of Minerals 1 and Minerals 2).

Figure 7.
Multi-components distribution. Green, black, blue, red, and dark brown denote organic matter, pore, Minerals 1, Minerals 2, and a mixture of Minerals 1 and Minerals 2, respectively. (A) Two-dimensional slice of organic matter; (B) Distributions of organic matter and pore; (C) Distributions of organic matter, porosity, and minerals; (D) Distributions of organic matter and Minerals 1; (E) Distributions of organic matter, Minerals 1, and Minerals 2; (F) Distributions of organic matter and Minerals 2.

Table 1.
Physical properties of dredger fill.
| Water Content (%) | Void Ratio | Specific Gravity | Dry Density (g/cm3) | Wet Density (g/cm3) | Compressive Property av1-2 (MPa−1) | Shear Strength (kPa) | Organic Content (%) |
|---|---|---|---|---|---|---|---|
| 83.10 | 2.28 | 2.29 | 0.82 | 1.50 | 0.65–0.80 | 1.50 | 1.65% |
© 2018 by the authors. Licensee MDPI, Basel, Switzerland. This article is an open access article distributed under the terms and conditions of the Creative Commons Attribution (CC BY) license (http://creativecommons.org/licenses/by/4.0/).
Share and Cite
MDPI and ACS Style
Song, J.; Yang, Y.-S.; Liu, Z.-Q.; Li, X. Macro and Micro Properties of Organic Matter in Hydraulic Mud Consolidation. J. Mar. Sci. Eng. 2018, 6, 22. https://doi.org/10.3390/jmse6010022
AMA Style
Song J, Yang Y-S, Liu Z-Q, Li X. Macro and Micro Properties of Organic Matter in Hydraulic Mud Consolidation. Journal of Marine Science and Engineering. 2018; 6(1):22. https://doi.org/10.3390/jmse6010022
Chicago/Turabian StyleSong, Jing, Yu-Shuang Yang, Zhi-Qing Liu, and Xue Li. 2018. "Macro and Micro Properties of Organic Matter in Hydraulic Mud Consolidation" Journal of Marine Science and Engineering 6, no. 1: 22. https://doi.org/10.3390/jmse6010022
Note that from the first issue of 2016, this journal uses article numbers instead of page numbers. See further details here.