Article

Monitoring Litter Inputs from the Adour River (Southwest France) to the Marine Environment

Surfrider Foundation Europe, 33 allée du Moura, 64200 Biarritz, Pyrénées-Atlantiques, France
*
Author to whom correspondence should be addressed.
J. Mar. Sci. Eng. 2018, 6(1), 24; https://doi.org/10.3390/jmse6010024
Submission received: 4 December 2017 / Revised: 11 February 2018 / Accepted: 26 February 2018 / Published: 6 March 2018
(This article belongs to the Special Issue Maritime Environment Monitoring)

Abstract

:
Rivers are major pathways for litter to enter the ocean, especially plastic debris. Yet, further research is needed to improve knowledge on rivers contribution, increase data availability, refine litter origins, and develop relevant solutions to limit riverine litter inputs. This study presents the results of three years of aquatic litter monitoring on the Adour river catchment (southwest of France). Litter monitoring consisted of collecting all litter stranded on river banks or stuck in the riparian vegetation in defined areas identified from cartographic and hydromorphological analyses, and with the support of local stakeholders. Litter samples were then sorted and counted according to a list of items containing 130 categories. Since 2014, 278 litter samplings were carried out, and 120,632 litter items were collected, sorted, and counted. 41% of litter could not be identified due to high degradation. Food and beverage packaging, smoking-related items, sewage related debris, fishery and mariculture gear, and common household items represented around 70% of identifiable items. Overall, the present study contributes to our knowledge of litter sources and pathways, with the target of reducing the amounts entering the ocean. The long-term application of this monitoring is a way forward to measure societal changes as well as assess effectiveness of measures.

1. Introduction

Oceans are priceless resources to humanity, especially for oxygen production and food. Many coastal communities rely on traditional fishing activities for survival and are therefore highly dependent on ocean health [1]. Yet, marine biodiversity is under global threats. The combined impact of climate change [2], overfishing, and pollution leads to marine ecosystem changes [3] and biodiversity loss.
Marine debris pollution is known to affect marine wildlife and represents additional pressure on already threatened species. Every compartment of the ocean is of concern: sea surface, seabed, water column, and shorelines [4]. 693 species were reported to have encountered marine debris, of whom 92% were plastic debris [5]. The impact of plastic debris on marine life includes entanglement, ingestion, contamination of the food chain by persistent pollutants, and introduction of exotics species [6].
Many studies have investigated ocean plastic pollution, accumulation in gyres, degradation, and impacts. Yet, few studies focused on origins and pathways. Although all sources and pathways seem to be identified [7], their individual contribution to worldwide plastic pollution is still unknown.
Rivers are recognized as a major pathway for litter entering the ocean, especially plastic debris; however few studies have attempted to estimate the litter discharge of rivers into the ocean. Lechner et al. [8] calculated that 174 kg of litter flows into the Black Sea through the Danube river delta every hour. A recent study from Lebreton et al. [9] estimated that rivers discharge between 1.15 and 2.41 million tons of plastic waste into the ocean every year globally. Previously, Jambeck et al. [10] calculated that the annual land-based plastic discharge into the ocean ranges between 4.8 and 12.7 million metric tons.
Both studies used different relevant data in their respective models (waste management, population density, and hydrological information for Lebreton et al. [9] and data on solid waste, population density, and economic status for Jambeck et al. [10]) and were calibrated with existing studies that derived river litter discharges from field studies. The wide range between estimates shows the importance of conducting field studies in order to estimate river litter locally, but also provide relevant numbers to be included in models at a worldwide scale. Different aquatic litter monitoring methods are currently developed either directly into the river water body or on the river banks. These methods include visual observation with or without collection, automated image acquisition systems, estimation from structures such as dams and weirs, riverbed and bottom nets sampling, boom samplings, manta trawl and pumps, as well as sediment samples [11].
This paper aims to present the results of three years (2014–2017) of aquatic litter monitoring on the Adour river catchment (southwest of France). The monitoring method is derived from beach litter surveys [12] and adapted to freshwater environment. Overall, the present study contributes to our knowledge of aquatic litter sources and pathways, with the target of reducing the amount of litter entering oceans. The long-term application of this monitoring is a method to measure societal and behavioral changes of waste management practices, as well as to assess the effectiveness of current and future legislative and regulatory measures.

2. Materials and Methods
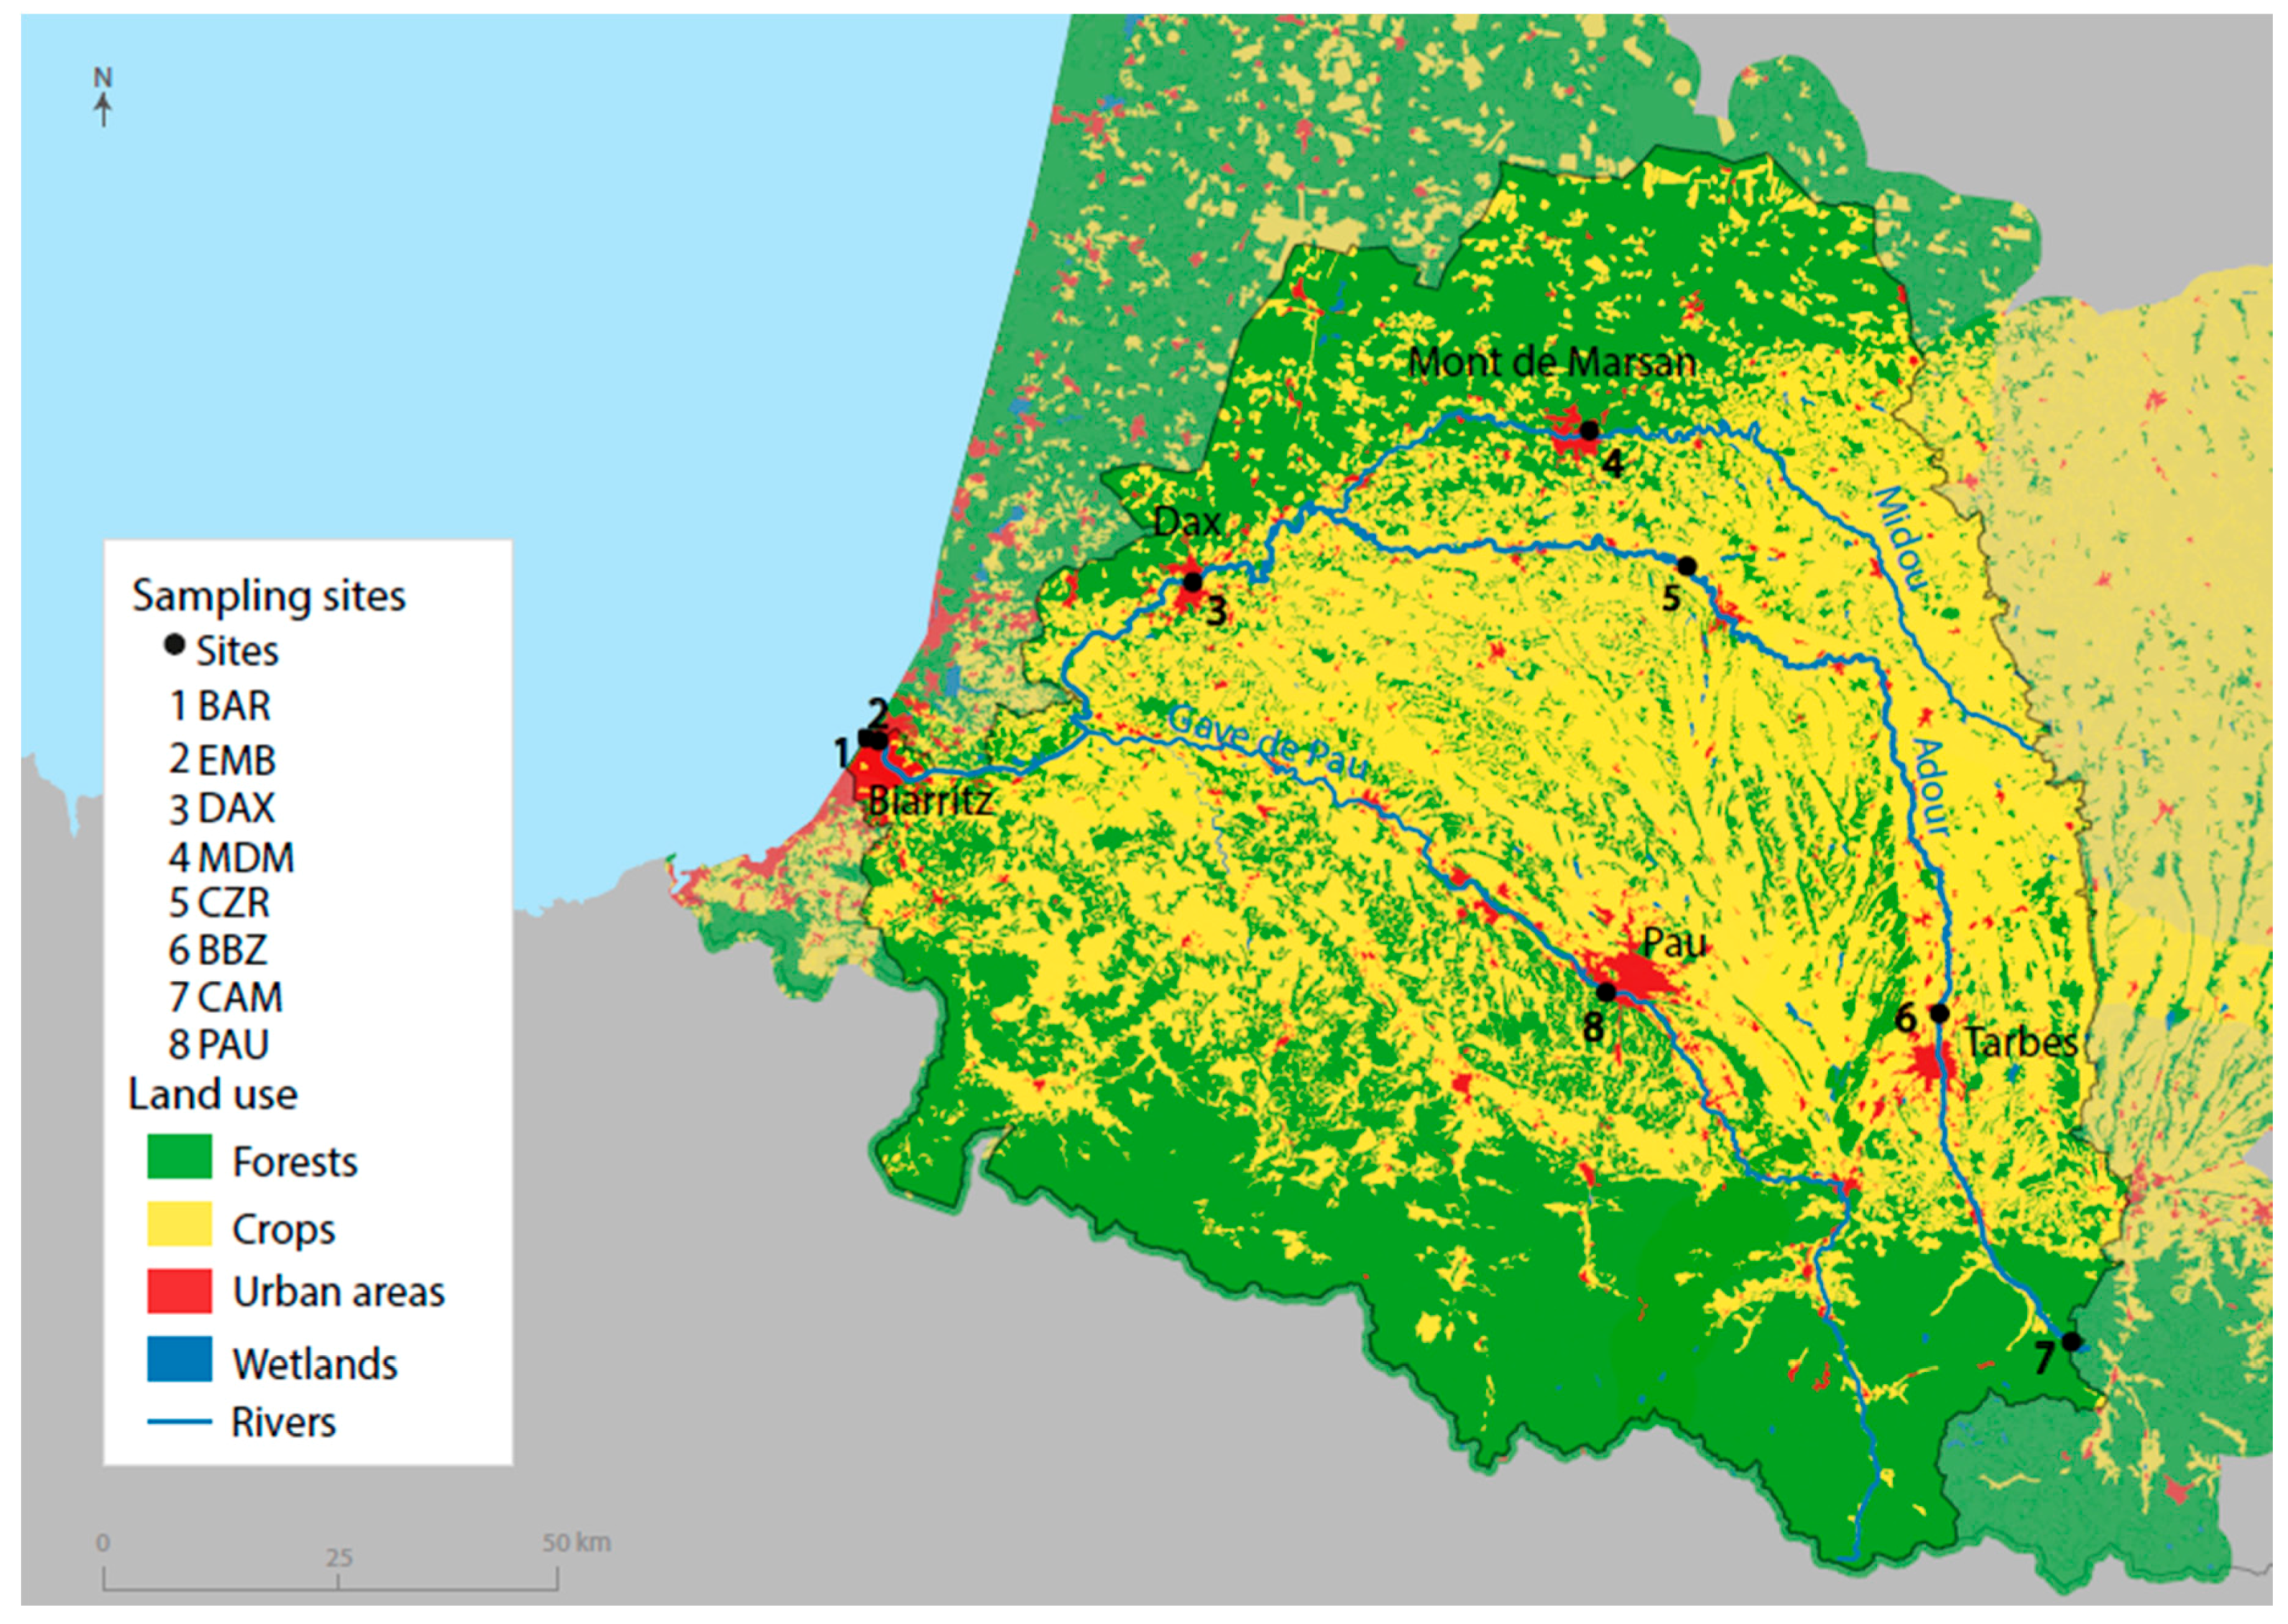
2.1. Study Site

The study was carried out on the Adour river catchment in southwestern France (Figure 1). The catchment area is 16,880 km² and total population reaches 1,070,000 inhabitants, primarily distributed in the cities of Pau, Bayonne, Tarbes, Mont-de-Marsan, Dax and Lourdes. The Adour River has four main tributaries: the Midouze, the Nive, and the gaves of Pau and Oloron. This catchment was selected for three main reasons. First, it drains one of the major French rivers and hosts a wide diversity of anthropogenic activities (e.g., tourism, agriculture, industry). Second, a study from Galgani et al. [13] demonstrated, through a trawling survey, the presence of significant litter densities in the area around the Adour estuary, which were the highest densities found in the Bay of Biscay. Third, the catchment was located geographically near the Surfrider Foundation Europe’s premises to allow frequent samplings.
The primary inland socio-economic activity potentially influencing litter input in this catchment area is agriculture (predominantly grain, vegetable crops, orchards, and livestock farming at high altitude). Several industrial sectors are also present, such as agro-food, aeronautics, and chemical and wood processing. Finally, tourism is well developed throughout the catchment [14]. Land use in this catchment area is distributed as followed: agricultural land 48.91%, forest and semi-natural habitat 47.66%, urbanized areas 3.11%, water surfaces 0.29%, and wetlands 0.03% [15].

2.2. Sampling Strategy & Litter Monitoring

Sampling consisted of collecting all litter stranded on the river banks or stuck in the riparian vegetation in a pre-defined area. Litter is, in this case, defined as any persistent, manufactured, or processed solid material discarded, disposed of, lost, or abandoned in the environment.
To this aim, eight sampling sites were identified from cartographic and hydromorphological analysis, and with the support of local stakeholders, including municipalities, river basin committee, federation for fishing and the protection of the aquatic environment (personal communications; Figure 1; Table 1). Sites are widespread from the source to the estuary and are located on both the Adour and its tributaries. Sites are situated downstream from clearly identified anthropogenic pressures zones, such as touristic, industrial, agricultural, and urban areas. They are located on the river banks, between the bank-top and the water. Additionally, most sites are situated after a turn in the river, on the outside edge of the turn (Figure S1).
Each site was sampled monthly. Data used in this paper were collected between March 2014 and August 2017. The monitoring was organized in three steps:
First, each area was delimited before collection using a Global Positioning System (GPS) with three meters of accuracy (eTtrex® 20, Garmin, Nanterre, France) to ensure sampling consistency over time. Coordinates were read on the GPS in UTM format (WGS-84 datum) and then converted into decimal degrees. Fixed and perennial physical landmarks such as old trees and rocks helped in some cases to improve location accuracy.
Second, all litter items greater than 0.5 cm, out of water and visible (not submerged or buried) were collected. Litter items were then gathered in a dedicated bag labelled with the site name and date.
Third, litter was sorted by volunteers under the supervision of the project manager. To reduce bias, a short training was given to volunteers and the project manager completed the list of litter items. The list was inspired by the OSPAR list [12] and adapted to river conditions. We considered that several item categories were missing in the OSPAR list and decided to complete it with items frequently found on river banks (e.g., plastic flower pots, plastic flowers, agricultural tarpaulin). The list used in this study contains 130 item categories (Table S1). Each item was characterized by its material and use. The grid holds nine material categories (artificial polymer materials, paper and cardboard, metal, rubber, glass and ceramics, processed and worked wood, chemicals, cloth and textile, undefined material) and 10 use categories (food and beverages packaging, smoking-related items, sewage related debris, fishery and mariculture tackles, common household items, recreational fishing and hunting, industrial packaging and construction debris, agricultural tarpaulin and packaging, diverse, unknown). The artificial polymer materials category gathers all types of synthetic polymers including plastics. The category “diverse” includes identifiable items that could originate from both professional and public activities while the “unknown” category includes the non-identifiable items.

2.3. Environmental Data Collection

Sampling areas are water level dependent. Each area was measured several times for varying water levels using the GPS eTtrex® 20 (Garmin, Nanterre, France) and the mean value was computed. Mean areas varied from 84 to 4750 m².
Water levels were extracted from the Banque Hydro database (http://www.hydro.eaufrance.fr/; website managed by the French ministry for the environment, Paris, France) [16] for the six inland sampling points. Stations used were Q0100010, Q0120060, Q5231010, Q1100010, Q2503320 and Q3120030. Data were downloaded every 6 hours and were used to calculate monthly mean water level, maximum water level for the considered month, normed mean water level, and water level during sampling. The normed mean water level was calculated by dividing the monthly mean water level by the 2014–2017 mean water level for the considered location. The normed maximum water level was calculated similarly.
The distance to the sea was computed using QGIS Geographic Information System (QGIS Development Team, Open Source Geospatial Foundation Project, http://qgis.osgeo.org) and corresponded to the length of the river track. The number of inhabitants living upstream from each sampling point was calculated with INSEE (National Institute of Statistics and Economic Studies) data and GIS tools [17]. Catchment area upstream of each sampling point was calculated using QGIS Geographic Information System and SIEAG (Système d’Information sur l’Eau du bassin Adour-Garonne—Agence de l’eau Adour-Garonne, Toulouse, France) data [18].

2.4. Statistical Analyses

Litter composition of La Barre beach was compared with litter collected inland. The sampling site EMB located in the Adour estuary receives litter coming from both land- and sea-based sources; therefore, those results were not included in this analysis. As sampling site areas and number of samples vary from one site to the other, data were converted into percentages and densities (average number of litter item collected per 100 m2 per sampling).
The 10 most frequently found identifiable items were determined for both the inland sampling sites and La Barre beach by aggregating the number of each identifiable item.
The density of litter items was plotted against distances to the sea. A non-linear model (exponential) was fitted to determine the link between both variables using the NLS (Nonlinear Least Squares) function in R [19].
Two multivariate analyses were performed to study litter origins and distribution among sampling sites. Multivariate analyses, such as the ones used in the present study, allow assessment and visualization of patterns of relative compositions and abundance between sites, for different categories of litter.
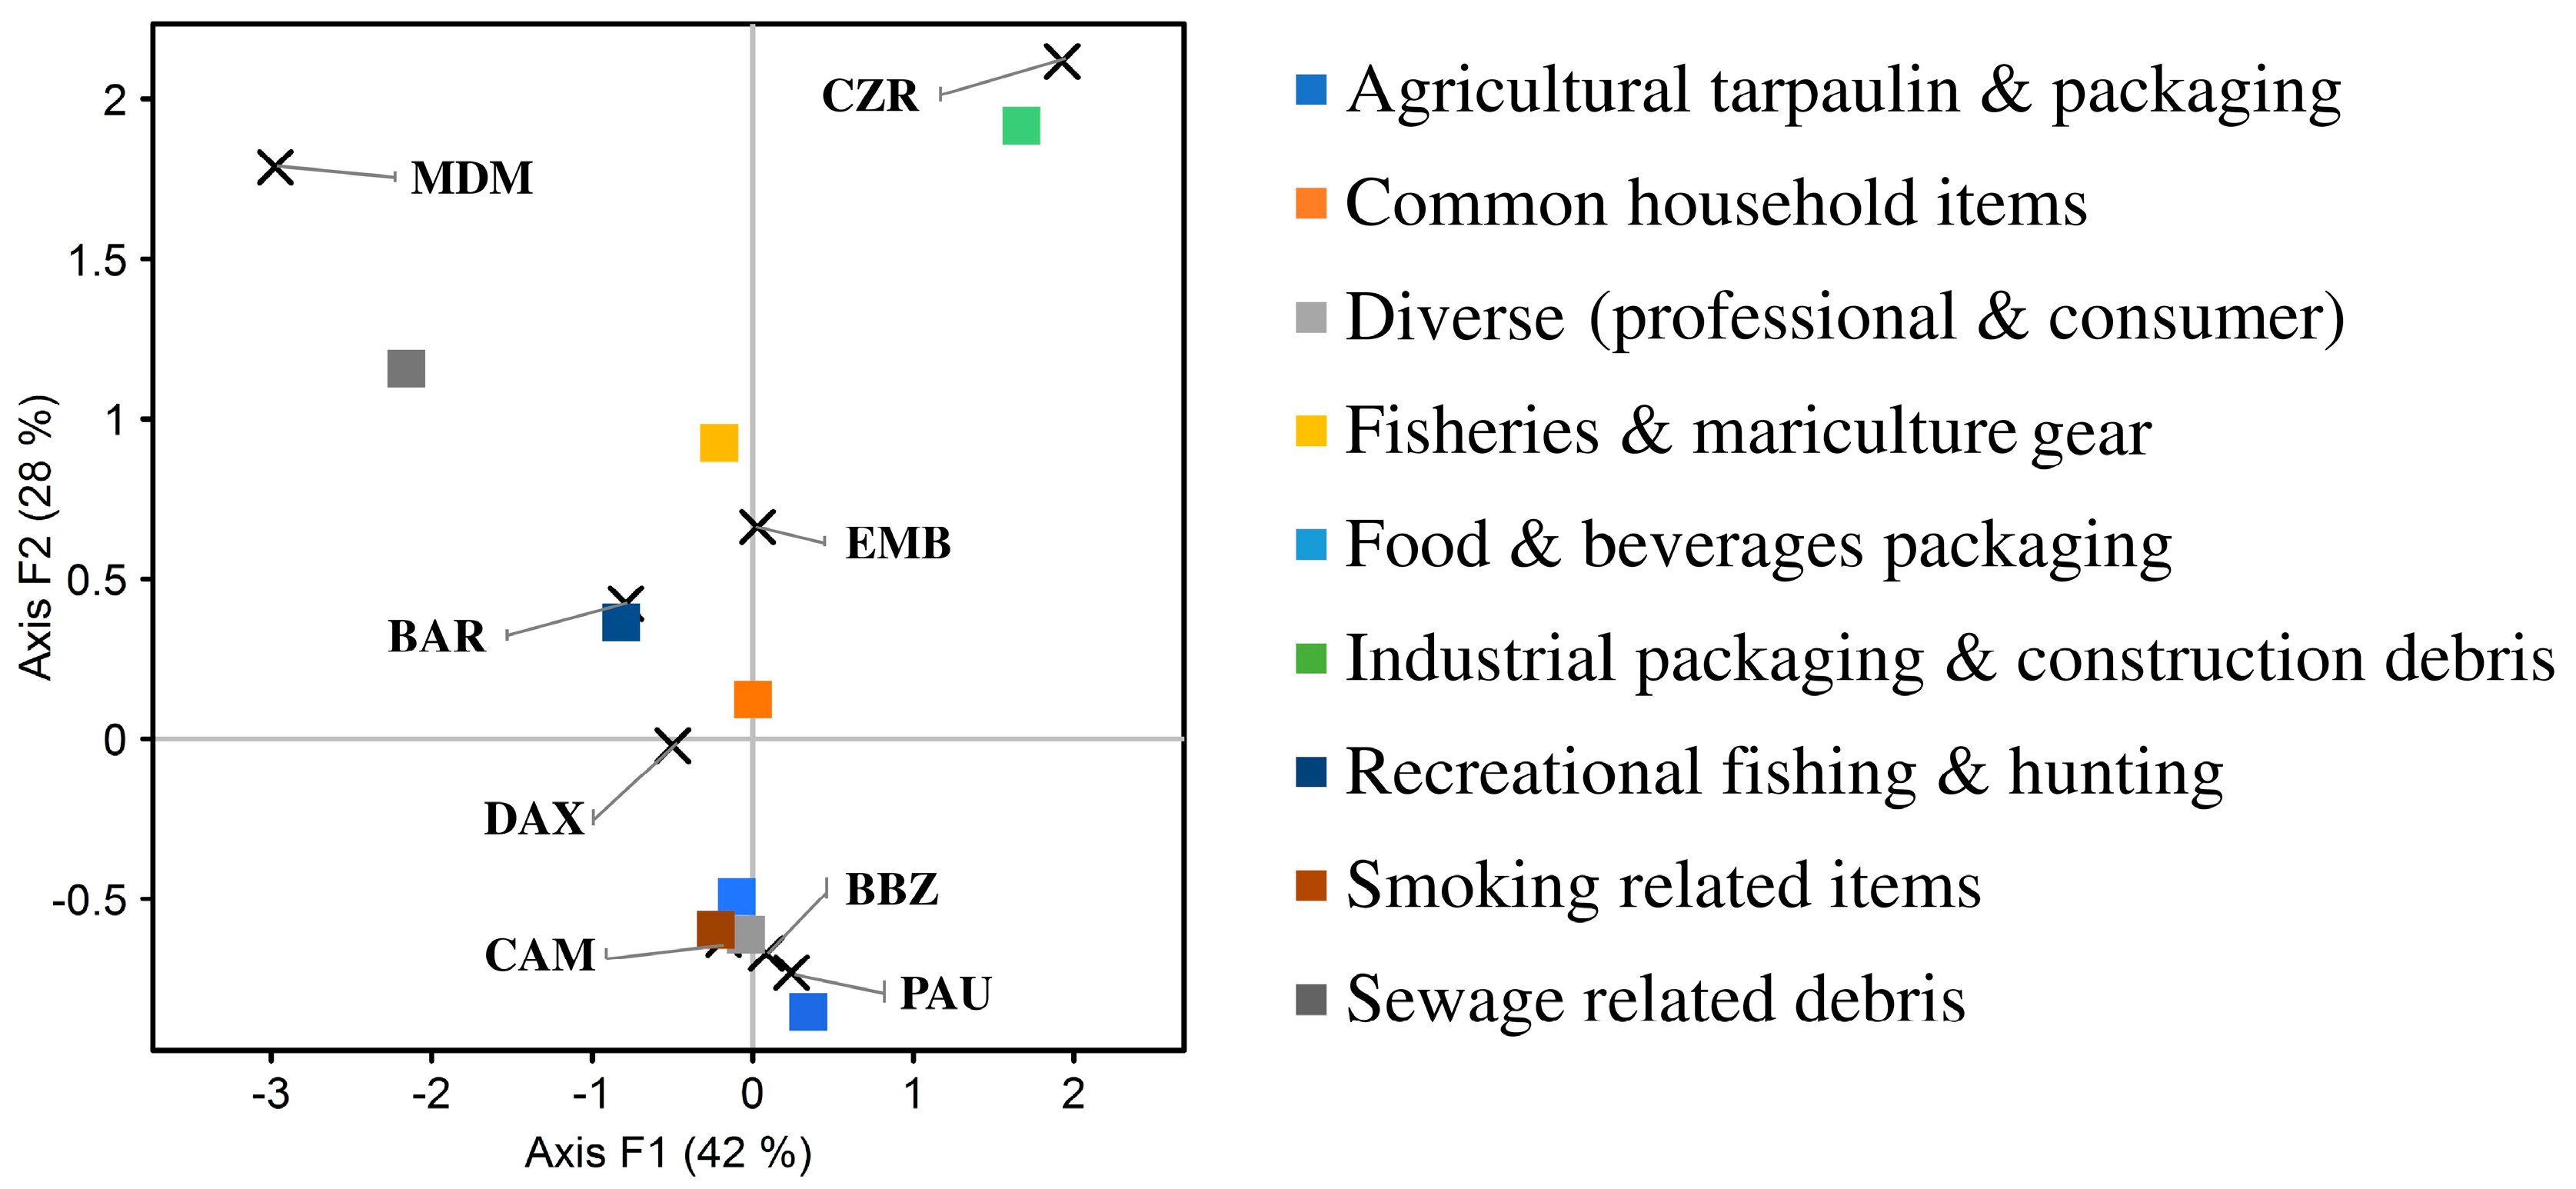
  • A correspondence analysis (CA) was computed on normed density of litter per sampling site for each use category, i.e., the total number of collected litter items per sampling site were transformed in density (number of litter items/number of samplings/area of sampling site) and were then normed by dividing by the total number of litter items in each use category. The use category “unknown” was not included because it does not provide relevant information for this analysis. The CA was used to study how the relative litter compositions and origins differ between sampling sites.
  • A canonical Redundancy Analysis (RDA) was applied to identify factors driving litter abundance on river banks. RDA is a constraint ordination method, which estimates linear relationships between components of response variables that are explained by a set of explanatory variables. Count density and mass density of litter were selected as response variables while normed mean water level, normed max water level, catchment area, population density and distance to the sea were selected as potential explanatory variables. This analysis was only performed for the six inland sites, because water level on La Barre beach and in the estuary is tide dependent. Variables were standardized in R using the decostand function (method = “max”) of the vegan package [20], as they are expressed with different orders of magnitude and on different measurement scales. The constrained and unconstrained variances were compared. A much higher constrained variance compared to the unconstrained variance means that some of the variation in the response data may be accounted for by the explanatory variables [21].
    CA and RDA were carried out in R with package ade4 and vegan, respectively [19,20,22].

3. Results

A total of 278 litter samplings were completed between March 2014 and August 2017 and 120,632 litter items were collected, sorted, and counted. Number of samplings, number of collected litter items, wet mass, litter density and surface are presented for each sampling site in Table 2. The total wet mass reached 949 kg. Of the number of collected items, 18% was collected inland, 49% on La Barre beach, and 33% in the estuary.
Litter collected inland and on the beach had similar material composition (95% of artificial polymer materials on the beach and 94% in the rivers). Other materials were found in much lower quantities (Figure 2).
Overall, 59% of collected litter could not be identified due to high degradation and was therefore classified as “unknown origin” (74%, 47% and 62% of non-identifiable litter items in rivers, the estuary and on the beach, respectively). Food and beverage packaging was the dominant litter use category and totaled 27% and 38% on inland sampling sites and on La Barre beach, respectively (Figure 3). Fishing and mariculture gear was mostly found on La Barre beach. Higher quantities of agricultural tarpaulin and packaging were found inland compared to amounts found on La Barre beach and in the estuary. However, this could be due to the fact that those items may have been too fragmented when they reached the ocean to be identifiable.
The top 10 identifiable items for both La Barre beach and inland sampling sites are presented in Table 3.
At first, litter density and distance to the sea did not seem correlated. However, litter density at Bours (BBZ) was much higher than on other sampling sites and this strongly skewed the results. The same analysis was computed excluding the BBZ sampling site, and the results showed a non-linear correlation between litter density and distance to the sea (Figure 4). This indicates a litter accumulation gradient from the upper part of the catchment to the estuary.
A CA was conducted to explore the relative distribution of litter uses among the height sampling sites. Cumulated inertia for the two first axis equaled 70%. The CA biplot (Figure 5) showed similarities in litter composition between La Barre beach and the site EMB, located in the estuary. Both sites received high amounts of litter from fishing and mariculture gear. These were also the sites that received the most litter from recreational fishing and hunting. The sampling site MDM was isolated from the others because litter composition is primarily constituted of sewage-related debris. Similarly, the site CZR is isolated because most of the litter found on this site originates from industrial packaging and construction debris. The last group was composed of sampling sites located downstream of urban or touristic areas. Litter found on those sites included common household items, food and beverages related items, smoking related items, and diverse items. Agricultural tarpaulin and packaging were also regularly found on those sites and may have come from the agricultural areas located upstream.
A RDA analysis was used to study the contribution of several environmental factors on litter density. This analysis provided mixed results and did not fully allow for the identification of drivers contributing to the presence and abundance of litter in the aquatic environment. The total variation explained (cumulated inertia) was less than 5% and constrained variance was much lower than unconstrained variance (Table 4). The redundancy analyses biplot (type I scaling) is presented in Figure S2.

4. Discussion

The present study shows the results of three years of aquatic litter monitoring on the Adour River catchment, with the aim of improving our understanding on marine litter pathways and sources. Stranded litter was sampled monthly on eight sites located inland on river banks, in the estuary and on the beach adjacent to the river mouth. To our knowledge, this study holds the longest record of macro-litter samplings on river banks, which is important because long-term sampling is a critical factor to effective litter monitoring.
Litter items were collected, sorted, counted, and weighted to determine their material composition and original usage. Artificial polymers are the dominant litter material found on the river banks and beach studied. A high number of those items could not be identified due to high fragmentation. Regarding identifiable items, food and beverages packaging were most commonly found, followed by the “diverse” category. Those two categories represent more than 50% of all collected litter items in rivers and on the beach. The “diverse” category includes items for which the origin cannot be identified (e.g., buckets, light bulbs). Indeed, some items are used both by households and the industry, and it is therefore impossible to determine their origin.
Sampling sites were chosen for their representativeness of anthropogenic pressures such as agriculture area, urban and industrial areas. For instance, the MDM site is located downstream of a combined sewer overflow (CSO). Litter composition on this site was found to be different from other sites since it receives high quantities of sewage related debris. To a different extent, this is also the case for the CZR site, which receives mainly litter from industrial packaging and construction debris. This site is in a rural area and captures mainly litter from illegal dumping activities. Sites BAR and EMB are located on the beach and in the estuary, respectively, and receive litter coming from both inland areas and the ocean. Those sites receive high amounts of fisheries and mariculture gear. Both sites also present high amounts of food packaging, common household items, and smoking-related items, most likely coming from the upstream urban area. This could explain their similarities in terms of litter use composition with sites located downstream of urban area such as PAU, DAX, and BBZ. The site CAM receives mainly food related items, likely due to the fact that it is in a tourist area.
A significant gradient in litter abundance was identified for seven of the sampling sites (excluding BBZ), with higher densities downstream from the river. This demonstrates a phenomenon of litter accumulation throughout a river catchment, but with high heterogeneity between sites.
In the present study, we were not able to accurately identify the drivers of riverine litter inputs to the ocean using an RDA method. This may be due to a limited sampling effort and environmental data diversity. More data and sampling points in the future will probably help. However, the RDA computed in this article provides a basis for future studies exploring environmental drivers of riverine litter abundance. Such results are highly important to increase riverine litter inputs model’s accuracy.
Based on our results and field experience, we intend in this section to explain pathways through which litter from the main use categories end up in rivers and the ocean.
(1)
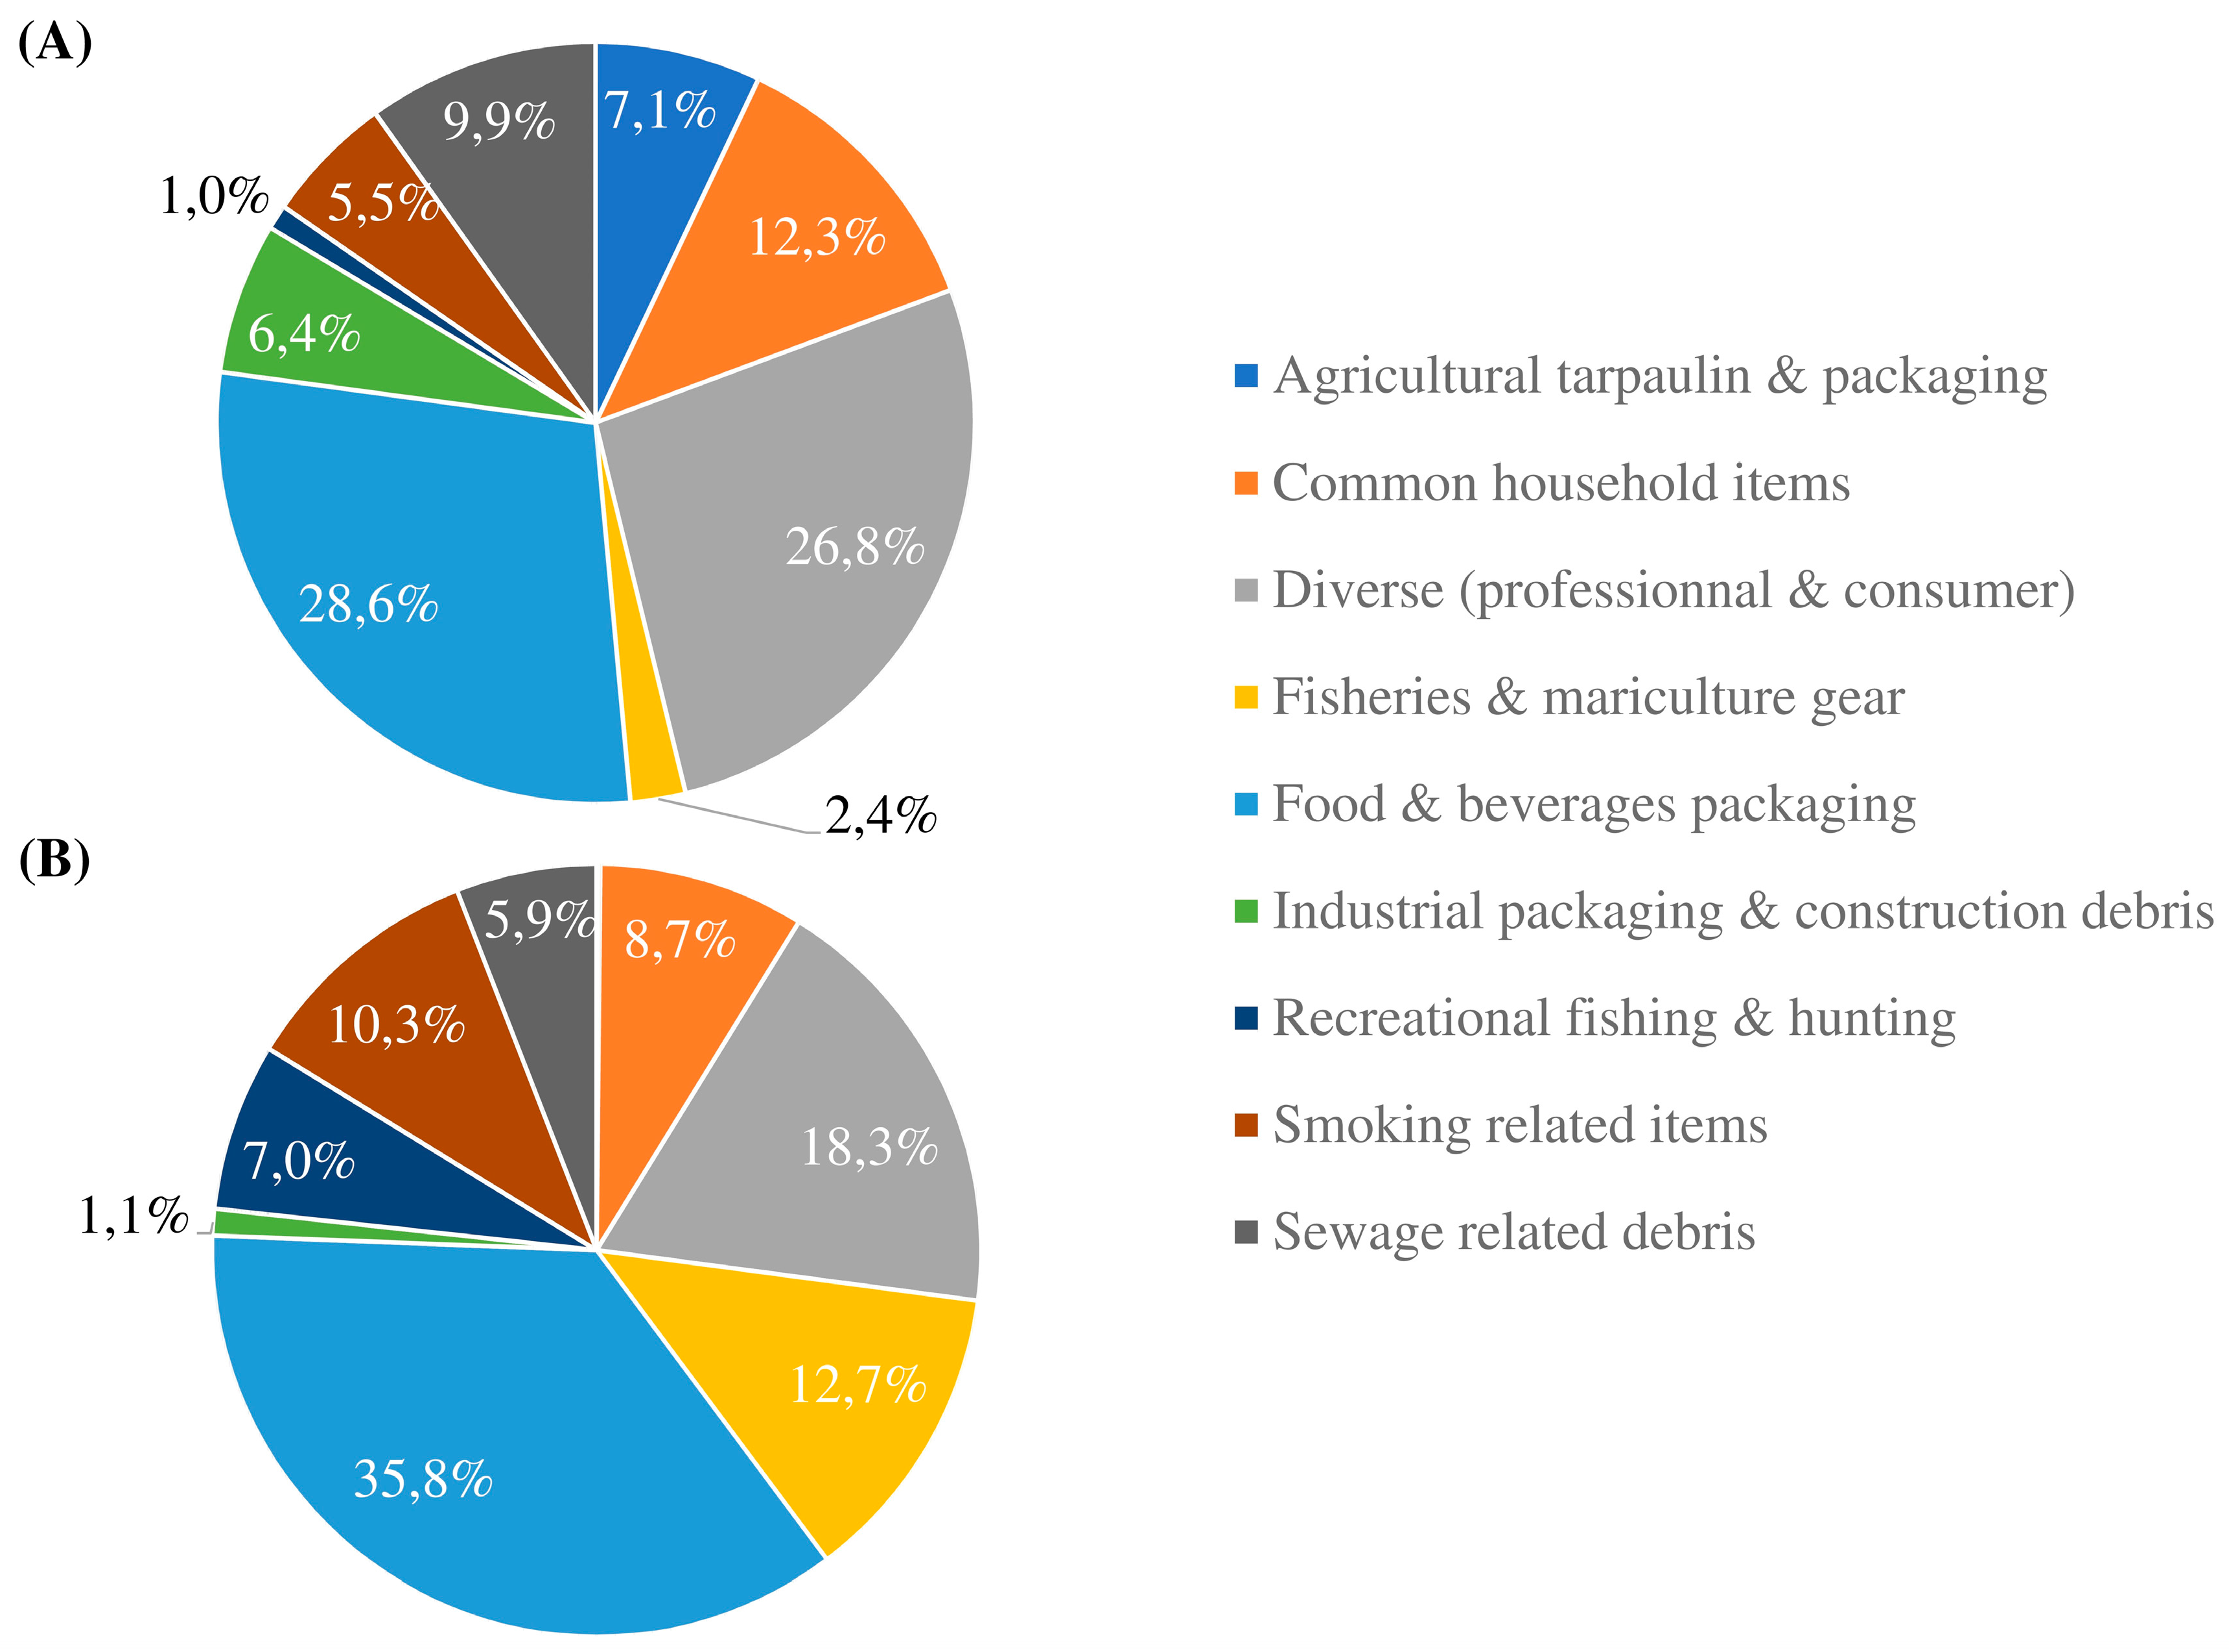
Food and beverages packaging, smoking related items, and common household items can be either thrown away because of incivility, involuntary loss, or mismanagement (discarded during collection operations or transport by local authorities). This litter category is mostly found in tourist areas and cities, close to “take-away” restaurants. Food packaging often consists of very fine plastics that fly away and break up very easily. Packaging ending up on city grounds are pushed by the wind and runoff to rainwater collection systems which take them either straight to the closest river or to the next Waste Water Treatment Plant (WWTP). Some packaging can also be directly discarded on the beach and can end up in the sea because of wind or tide rise. Cigarette butts are mostly thrown away due to incivility.
(2)
Fishery and mariculture gear are found in high numbers on La Barre beach and in the estuary, even though there is no intensive fishery activity in this area. This suggests that most litter related to this usage category travels from further areas and are lost at sea during storms. For instance, we found high quantities of rubber pieces on the beach that are used in mariculture.
(3)
Sewage related debris are mostly sanitary and medical products discarded in toilets. From there, they either reach the WWTP and end up in the sewage sludge or, in the case of combined networks and overload, end up directly into the environment via CSO.
(4)
Industrial packaging and construction debris are either dumped directly in the environment to avoid paying taxes, or lost during transportation. Most construction companies use dump trucks and do not cover bins before transportation on the road. Waste flies away and end up on roads before being damaged by cars. Small pieces are then carried by runoff to the nearest rainwater collection system.
(5)
Agricultural tarpaulin such as mulching film and packaging are occasionally discarded or forgotten on agricultural fields. Wind and floods carry them to the closest river.
(6)
Recreational fishing tackles are primarily found on La Barre beach and in the estuary. High recreational fishing activities occur in the estuaries, since those areas contain high volumes of fish. Windy conditions and rocky bottoms may make fishing activities difficult. Tackles are therefore more likely to be discarded or lost closer to the sea than inland.
One of the primary goals of this study was to introduce and test a long-term litter monitoring method derived from beach litter surveys [12] and adapt it to a freshwater environment. Though the method appears efficient in identifying and quantifying riverine litter inputs potentially reaching the ocean, we believe there are possible biases in the monitoring methodology used. Identifying these biases will help improve the monitoring method and further samplings.
First, it is important to remember that this monitoring is based on the number of collected items. This method tends to favor materials that break up easily. Furthermore, stranded litter on river banks are more likely to be composed of light and floating materials. Both arguments suggest that our results are biased toward plastic. Morritt et al. [23] showed that high quantities of litter are transported in river beds, particularly at the bottom. Our study does not consider those amounts, and it is difficult at this stage to build a correlation between litter quantities carried by the river and the litter stranded on banks.
Sampling area hydromorphology seems to play a key role in stranded litter abundance. Dead water areas with large riparian vegetation and low slope (such as BBZ sampling site) are more likely to retain litter. This makes it difficult to compare litter amounts between sampling sites since their physical characteristics are different. Similar approaches should consider selecting sampling sites with similar hydromorphological characteristics.
The methodology used in this study is time consuming. For instance, 30 days and three staff members were needed to collect and sort litter on our height sampling points for one year. Surfrider Foundation Europe relies on numerous volunteers to sort and count litter items. Citizen science is a way to develop such time-consuming studies.
Future litter analyses could be improved using learnings from our results. For instance, most of the gloves collected during our samplings were found on La Barre beach and in the estuary. Few gloves were found inland, meaning that most gloves found on beach are lost at sea. Our study could therefore help to clarify the sea-based or land-based origin of some litter items.

5. Conclusions

Overall, the present study contributes to improving understanding of aquatic litter composition. While the method used does not allow the quantification of litter inputs to the ocean, it shows similarities between litter present in rivers and marine litter. Those results suggest an important contribution of rivers to ocean litter pollution. Food and beverages packaging contribute to more than a quarter of the total litter pollution in the Adour catchment. This category of litter should therefore be targeted as a priority in the frame of waste reduction and future policies. Citizen and manufacturer awareness, improved waste management and the spread of eco-conception practices are ways forward to reduce the amount of packaging entering the ocean. This study also attempted to explain litter density on river banks according to several environmental factors such as water level, catchment area and population density. This analysis was not successful due either to a lack of data or to a high heterogeneity in sampling sites hydromorphology. However, the methodology used could provide a basis for future studies investigating correlations between litter density and environmental factors. Such correlations are essential to improve the accuracy of global models of litter inputs from rivers to the ocean. Litter accumulation from the spring to the river mouth was demonstrated for seven of the height sampling sites, meaning that actions against aquatic litter should not be restricted to the shore but should also be developed upstream of catchment areas. A harmonized and accurate method is still needed to monitor litter in rivers. The present study contributes to the development of such a method by testing a protocol based on the collection, sorting, and counting of stranded litter on the river banks. Long-term monitoring of litter in river-based areas will surely allow for the assessment of measures effectiveness and contribute to the global reduction of ocean litter pollution.

Supplementary Materials

The following are available online at https://www.mdpi.com/2077-1312/6/1/24/s1, Figure S1: Satellite view of the sampling site located in Cazère-sur-l’Adour, Figure S2: Redundancy analyses biplot type I scaling, Table S1: Database of collected litter items for each sampling site.

Acknowledgments

This study was funded by the French ministry for the environnement and the Direction Interrégionale de la Mer Sud-Atlantique. We thank Megan Long, United Nations volunteer, for proofreading this article.

Author Contributions

C.B and P.M. conceived and designed the experiments; A.B., C.B. and J.C. performed the experiments; A.B., J.C., C.M. and H.C. analyzed the data; C.M. performed cartographic analyses; A.B. and H.C. wrote the paper.

Conflicts of Interest

The authors declare no conflict of interest.

References

  1. Hudson, A. Restoring and protecting the world’s large marine ecosystems: An engine for job creation and sustainable economic development. Environ. Dev. 2016, 22, 150–155. [Google Scholar] [CrossRef]
  2. Poloczanska, E.S.; Brown, C.J.; Sydeman, W.J.; Kiessling, W.; Schoeman, D.S.; Moore, P.J.; Brander, K.; Bruno, J.F.; Buckley, L.B.; Burrows, M.T.; et al. Global imprint of climate change on marine life. Nat. Clim. Chang. 2013, 3, 919–925. [Google Scholar] [CrossRef]
  3. Zaneveld, J.R.; Burkepile, D.E.; Shantz, A.A.; Pritchard, C.E.; McMinds, R.; Payet, J.P.; Welsh, R.; Correa, A.M.S.; Lemoine, N.P.; Rosales, S.; et al. Overfishing and nutrient pollution interact with temperature to disrupt coral reefs down to microbial scales. Nat. Commun. 2016, 7, 11833. [Google Scholar] [CrossRef] [PubMed]
  4. Woodall, L.C.; Sanchez-Vidal, A.; Canals, M.; Paterson, G.L.; Coppock, R.; Sleight, V.; Calafat, A.; Rogers, A.D.; Narayanaswamy, B.E.; Thompson, R.C. The deep sea is a major sink for microplastic debris. R. Soc. Open Sci. 2014, 1, 140317. [Google Scholar] [CrossRef] [PubMed]
  5. Gall, S.C.; Thompson, R.C. The impact of debris on marine life. Mar. Pollut. Bull. 2015, 92, 170–179. [Google Scholar] [CrossRef] [PubMed]
  6. Derraik, J.G. The pollution of the marine environment by plastic debris: a review. Mar. Pollut. Bull. 2002, 44, 842–852. [Google Scholar] [CrossRef]
  7. Van der Wal, M.; Van der Meulen, M.; Tweehuijsen, G.; Peterlin, M.; Palatinus, A.; Kovač Viršek, M. Identification and Assessment of Riverine Input of (Marine) Litter; IFREMER: Issy-les-Moulineaux, France, 2015. [Google Scholar]
  8. Lechner, A.; Keckeis, H.; Lumesberger-Loisl, F.; Zens, B.; Krusch, R.; Tritthart, M.; Glas, M.; Schludermann, E. The Danube so colourful: A potpourri of plastic litter outnumbers fish larvae in Europe’s second largest river. Environ. Pollut. 2014, 188, 177–181. [Google Scholar] [CrossRef] [PubMed]
  9. Lebreton, L.C.; van der Zwet, J.; Damsteeg, J.W.; Slat, B.; Andrady, A.; Reisser, J. River plastic emissions to the world’s oceans. Nat. Commun. 2017, 8, 15611. [Google Scholar] [CrossRef] [PubMed]
  10. Jambeck, J.R.; Geyer, R.; Wilcox, C.; Siegler, T.R.; Perryman, M.; Andrady, A.; Narayan, R.; Law, K.L. Plastic waste inputs from land into the ocean. Science 2015, 347, 768–771. [Google Scholar] [CrossRef] [PubMed]
  11. González, D.; Hanke, G.; Tweehuysen, G.; Bellert, B.; Holzhauer, M.; Palatinus, A.; Hohenblum, P.; Oosterbaan, L. Riverine Litter Monitoring—Options and Recommendations. MSFD GES TG Marine Litter; Joint Research Centre: Brussels, Belgium, 2016. [Google Scholar]
  12. OSPAR Commission. Guideline for Monitoring Marine litter on the Beaches in the OSPAR Maritime Area; OSPAR Commission: London, UK, 2010; p. 84. [Google Scholar]
  13. Galgani, F.; Leaute, J.P.; Moguedet, P.; Souplet, A.; Verin, Y.; Carpentier, A.; Goraguer, H.; Latrouite, D.; Andral, B.; Cadiou, Y.; et al. Litter on the sea floor along European coasts. Mar. Pollut. Bullet. 2000, 40, 516–527. [Google Scholar] [CrossRef]
  14. Adour-Garonne Basin Committee. Synthesis Update State of the SDAGE of 2016–2021; Adour-Garonne Basin Committee: Toulouse, France, 2013. [Google Scholar]
  15. CORINE Land Cover. CLC 2012. Available online: http://land.copernicus.eu/pan-european/corine-land-cover (accessed on 12 October 2017).
  16. Banque Hydro. Available online: http://www.hydro.eaufrance.fr/ (accessed on 10 August 2017).
  17. INSEE (Institut National de la Statistique et des Etudes Economiques). Available online: https://www.insee.fr (accessed on 14 August 2017).
  18. SIEAG (Système d’Information sur Eau du bassin Adour-Garonne). Available online: http://www.siaeag.fr/ (accessed on 14 August 2017).
  19. R: A Language and Environment for Statistical Computing. R Foundation for Statistical Computing; R Core Team: Vienna, Austria, 2014.
  20. Vegan: Community Ecology Package; R Package Version 2.4-5; Ordination Methods, Diversity Analysis and Other Functions for Community and Vegetation Ecologists; CRAN: Oulu, Finland, 2017.
  21. Legendre, P.; Legendre, L.F. Numerical Ecology; Elsevier: Oxford, UK, 2012. [Google Scholar]
  22. Dray, S.; Dufour, A.B. The ade4 package: Implementing the duality diagram for ecologists. J. Stat. Softw. 2007, 22, 1–20. [Google Scholar] [CrossRef]
  23. Morritt, D.; Stefanoudis, P.V.; Pearce, D.; Crimmen, O.A.; Clark, P.F. Plastic in the Thames: A river runs through it. Mar. Pollut. Bullet. 2014, 78, 196–200. [Google Scholar] [CrossRef] [PubMed]
Figure 1. Localization of sampling sites.
Jmse 06 00024 g001
Figure 2. (A) Inland litter composition by material, (B) Beached litter composition by material.
Jmse 06 00024 g002
Figure 3. (A) Inland litter composition in term of uses, (B) Beached litter composition in term of uses.
Jmse 06 00024 g003
Figure 4. Relationship between litter density and distance to the sea excluding the BBZ sampling site.
Jmse 06 00024 g004
Figure 5. Correspondence analysis showing the spatial distribution of litter according to their uses over the height sampling sites. F1 × F2 is the reduced space used for the correspondence analysis. Inertia of both axis is presented in brackets in the axis legend.
Jmse 06 00024 g005
Table 1. Study sites characteristics.
SiteAbbr.River or Tributary RiverAverage Surface (m2)Coordinates (Decimal Degrees)Main Type of Anthropogenic PressureDistance to the Sea (km)Hydromophology
CampanCAMAdour36642.93718/0.29376tourism293low slope, little riparian vegetation
BoursBBZAdour8443.28552/0.08281urban244low slope, well developed riparian vegetation
PauPAUGave de Pau26843.29369/−0.40991urban119low slope, little riparian vegetation
Cazère-sur-l’AdourCZRAdour45943.75682/−0.31715agriculture164medium slope, very dense riparian vegetation
Mont de MarsanMDMMidouze18643.89868/−0.47107sewage station149strong slope, little riparian vegetation
DaxDAXAdour13643.71484/−1.05039urban68steep slope, well developed riparian vegetation
AngletEMBAdour265743.52569/−1.50326urban/harbor1.7medium slope, rocks without vegetation
La Barre BeachBAR-475043.52823/−1.52392urban/tourism, beach cleaned every day during summer and on a regular basis the rest of the year--
Table 2. Number of samplings, collected litter items and litter density for each site.
SiteNumber of SamplingsNumber of Collected ItemsWet Mass (kg)Litter Density (Items/Collection/100 m²)Surface (m²)
CAM36891 (for 29 samplings *)1377
BBZ391639520 (for 32 samplings)400105
PAU31194532 (for 31 samplings)27231
CZR38176513 (for 31 samplings)20229
MDM3167521 (for 31 samplings)10210
DAX3048717 (for 30 samplings)9176
EMB3539859678 (for 30 samplings)432657
BAR3859417167 (for 31 samplings)354426
Total27812063294958411
*At the beginning of the project, collected litter was not weighed.
Table 3. Top 10 identifiable items for La Barre beach and inland sampling sites.
TopLa Barre BeachInland Sampling Sites
1Drink bottlesCrisps packets/sweets wrappers and lolly sticks
2Cigarette butts and filtersFoam (insulation, packaging and foam)
3String and cord (diameter less than 1 cm)Food containers incl. fast food containers
4Food containers incl. fast food containersPlastic caps/lids
5Fishing line/monofilament (angling)Agricultural tarpaulin
6Plastic caps/lidsOther sanitary items
7Crisps packets/sweets wrappers and lolly sticksSheets, industrial packaging, plastic sheeting
8Foam (insulation, packaging and foam)Other glass items
9Cotton bud sticksCigarette butts and filters
10Cups and cup lidsOther textiles (incl. rags)
Table 4. Results of redundancy analyses applied to study the influence of normed mean water level, normed max water level, catchment area, population density and distance to the sea on river banks litter density.
VariablesInertiaProportion (%)Eigenvalues
Dim. 1Dim. 2
Total0.047100
Constrained axes0.01020.40.0080.002
Unconstrained axes0.03779.60.0280.010

