1. Introduction
Tropical cyclones (TCs), and their associated storm surge, are some of the most damaging natural phenomena [
1]. The magnitude of the resulting storm surge is dependent on geographical and bathymetric features, as well as TC characteristics including intensity, size, translational speed, and the direction in which the TC approaches the coast at landfall. The lack of availability of observations and accuracy of these properties prior to landfall, and the limitations in the characterization of the TC wind structure prove a challenge for real-time forecasting of storm surge impacts. When trying to understand how storm surge impacts will affect coastal regions, it is imperative to have a clear understanding of the factors that have influenced storm surge estimates in the past. Yet, as is the case with TCs, historical data on storm surge events is limited [
2].
Based on a recent review on TC induced storm surges, maximum water level data is available for 389 TCs in the western North Atlantic Basin, with 17 events on Caribbean Islands, 242 events along the U.S Gulf Coast and 110 events along the U.S. Atlantic Coast [
3]. Only 22% of the events observed along the U.S Atlantic Coast occurred along the coastline from Virginia to Maine [
3]. Some of these TC and extratropical cyclone (ETC) induced storm surge events have been highly destructive, partly because their landfall location has been around densely populated areas in states such as New York (NY) and New Jersey (NJ) [
4]. In this study, we considered one of such events as a case-study. Hurricane Sandy is a TC known for its unique development and track, as well as the magnitude of the damages it caused. Despite being a unique case, Hurricane Sandy is an example of the vast impact TCs can have, and how a combination of factors can amount to such extensive damages [
5]. As such, Hurricane Sandy is chosen as our case of interest.
Hurricane Sandy is now ranked as the fourth costliest storm to impact the US [
6]. The damages produced were primarily caused by the large extent of the TC’s wind field [
7], the near perpendicular landfall angle [
8], and the consequent storm surge produced by the combination of these factors. The storm surge observed reached up to 3.85 m above normal tide level at Kings Point, NY, USA [
7,
9]. Moreover, having reached unprecedented storm surge heights, Hurricane Sandy tested the resilience of the NJ and NY coastal infrastructure to storm surge. Events such as Hurricane Sandy highlight the importance of understanding the physical processes behind storm surge and improving modeling techniques, and as such, this remains an active topic of research.
Atmospheric forcing is the principal driver of storm surge [
10,
11]. In storm surge models, atmospheric forcing is provided in the form of surface pressure and near-surface wind fields from various sources and configurations. These can include the use of cyclone track-based data implemented in parametric vortex models, as well as the use of wind reanalysis products and 3D atmospheric models.
Parametric vortex models use a simple set of storm parameters to represent the wind and pressure fields. These models range in complexity in their representation of the TC wind field, which can be represented as a simple symmetric vortex [
12] or can more accurately describe the wind field by accounting for wind asymmetries [
13,
14]. Some storm surge models such as the Sea, Lake and Overland Surges from Hurricanes (SLOSH) allow for the use of symmetric vortex models, with spatially constant radius of maximum wind (Rmax), to characterize the TC wind field for a given track dataset. However, a recent study comparing multiple meteorological forcing for the case of Hurricane Rita found that due to uncertainties in the wind field, an asymmetric model outperforms the symmetric model in forecasting storm surge [
15].
The parameters needed for implementation in the parametric vortex model include the storm location, minimum central pressure, maximum wind velocity and radius of maximum winds [
10,
11]. These parameters are available as part of the National Hurricane Center (NHC) forecast advisories issued every 6 h throughout the storm’s lifetime. The availability of these storm parameters and the computational efficiency of parametric vortex models provide for timely storm surge forecasts. As such, the use of parametric vortex models is suitable for real-time forecasting of storm surge. However, these models are a simplification of the TC wind field and fail to capture important dynamic processes such as weakening and distortion of the TC wind field after interaction with topography. Full physics atmospheric models can more accurately represent these processes and interactions in the TC wind field and have been used for storm surge assessment. As storm surge modeling shifts into real-time coupling of inundation and full-physics atmospheric models, it becomes relevant to study and evaluate the coupled model performance in predicting storm surge. Understanding of the limitations of these coupled systems will contribute to further development in the field.
Recent studies have researched the effect of using various meteorological forcing for storm surge or wave assessment. Akbar et al. [
15] performed a hindcast of Hurricane Rita to study the effect of varying wind fields on storm surge estimates, including meteorological forcing from the National Oceanic and Atmospheric Administration (NOAA)/Hurricane Research Division’s (HRD) Real-time Hurricane Wind Analysis System (HWIND; [
16]), the Dynamic Holland Model [
12], and the Asymmetric Holland Model [
14]. Results from the study indicate that HWIND performed better than both the Dynamic and Asymmetric Holland Models. The sensitivity of storm surge to different meteorological forcing types for the case of Hurricane Isaac (2012) in the Gulf of Mexico has also been studied. Dietrich et al. [
10] showed that provided availability of accurate forecast advisories, in a hindcast scenario, a parametric vortex model results in reasonable storm surge estimates. Bennett and Mulligan [
17] compared the effect of wind fields from two parametric models and a 3D atmospheric model on the generation of surface waves by Hurricane Sandy and concluded that the 3D atmospheric model, which has the best description of the storm wind field, is most suitable for their assessment.
Studies comparing different atmospheric forcing make use of NHC forecast advisories or NHC-BT datasets in their parametric vortex model implementations, and compare them to storm surge forecasts forced by full-physics atmospheric models or wind reanalysis products (e.g., Akbar et al. [
15], Dietrich et al. [
10] and Bennett and Mulligan [
17]). That is, the comparisons are not exclusive of atmospheric forcing method but also account for accuracy of the data used. In this study, we perform similar comparisons but aim to isolate the effectiveness of using a parametric vortex model in contrast to a full-physics atmospheric model. To achieve this, we explore the use of a single dataset produced by an atmospheric model and format the output according to the forcing method of interest. The surface pressure and near-surface wind fields from an atmospheric model are directly implemented as atmospheric forcing. In addition, we process the output of the atmospheric model to obtain a track file similar to the NHC-BT and implement it using the Generalized Asymmetric Holland Model (GAHM; [
13]) described in
Section 2.2. This method allows us to perform a more direct comparison between both atmospheric forcing configurations. The methodology of extracting a track dataset from a full-physics atmospheric model highlights an alternative way of incorporating these models for hindcasting and real-time forecasting purposes.
The model configurations, model coupling details and an overview of the simulations performed are described in
Section 2. Results from the control simulation and the coupled model simulations are described in
Section 3. The implications and limitations of the study are discussed in
Section 4. Finally, conclusions are provided in
Section 5.
3. Results
The WRF-ADCIRC simulations were compared to CTL, and to water elevation observations at various stations. The FWP12-4 simulation was directly compared to SCT12-4 to determine differences arising from the use of varying meteorological forcing methods. Finally, a sensitivity test based on model resolution was performed for the simulations forced with the full-physics atmospheric model.
3.1. WRF Model Evaluation
Prior to the WRF-ADCIRC coupling the accuracy of the simulated TC was evaluated. Evaluation of the WRF model simulations were performed by comparing the track and intensity of the simulated storms with data from the NHC-BT dataset. The discussion will be focused mainly on the WRF 12-4 km simulation, except in situations that warrant further analysis.
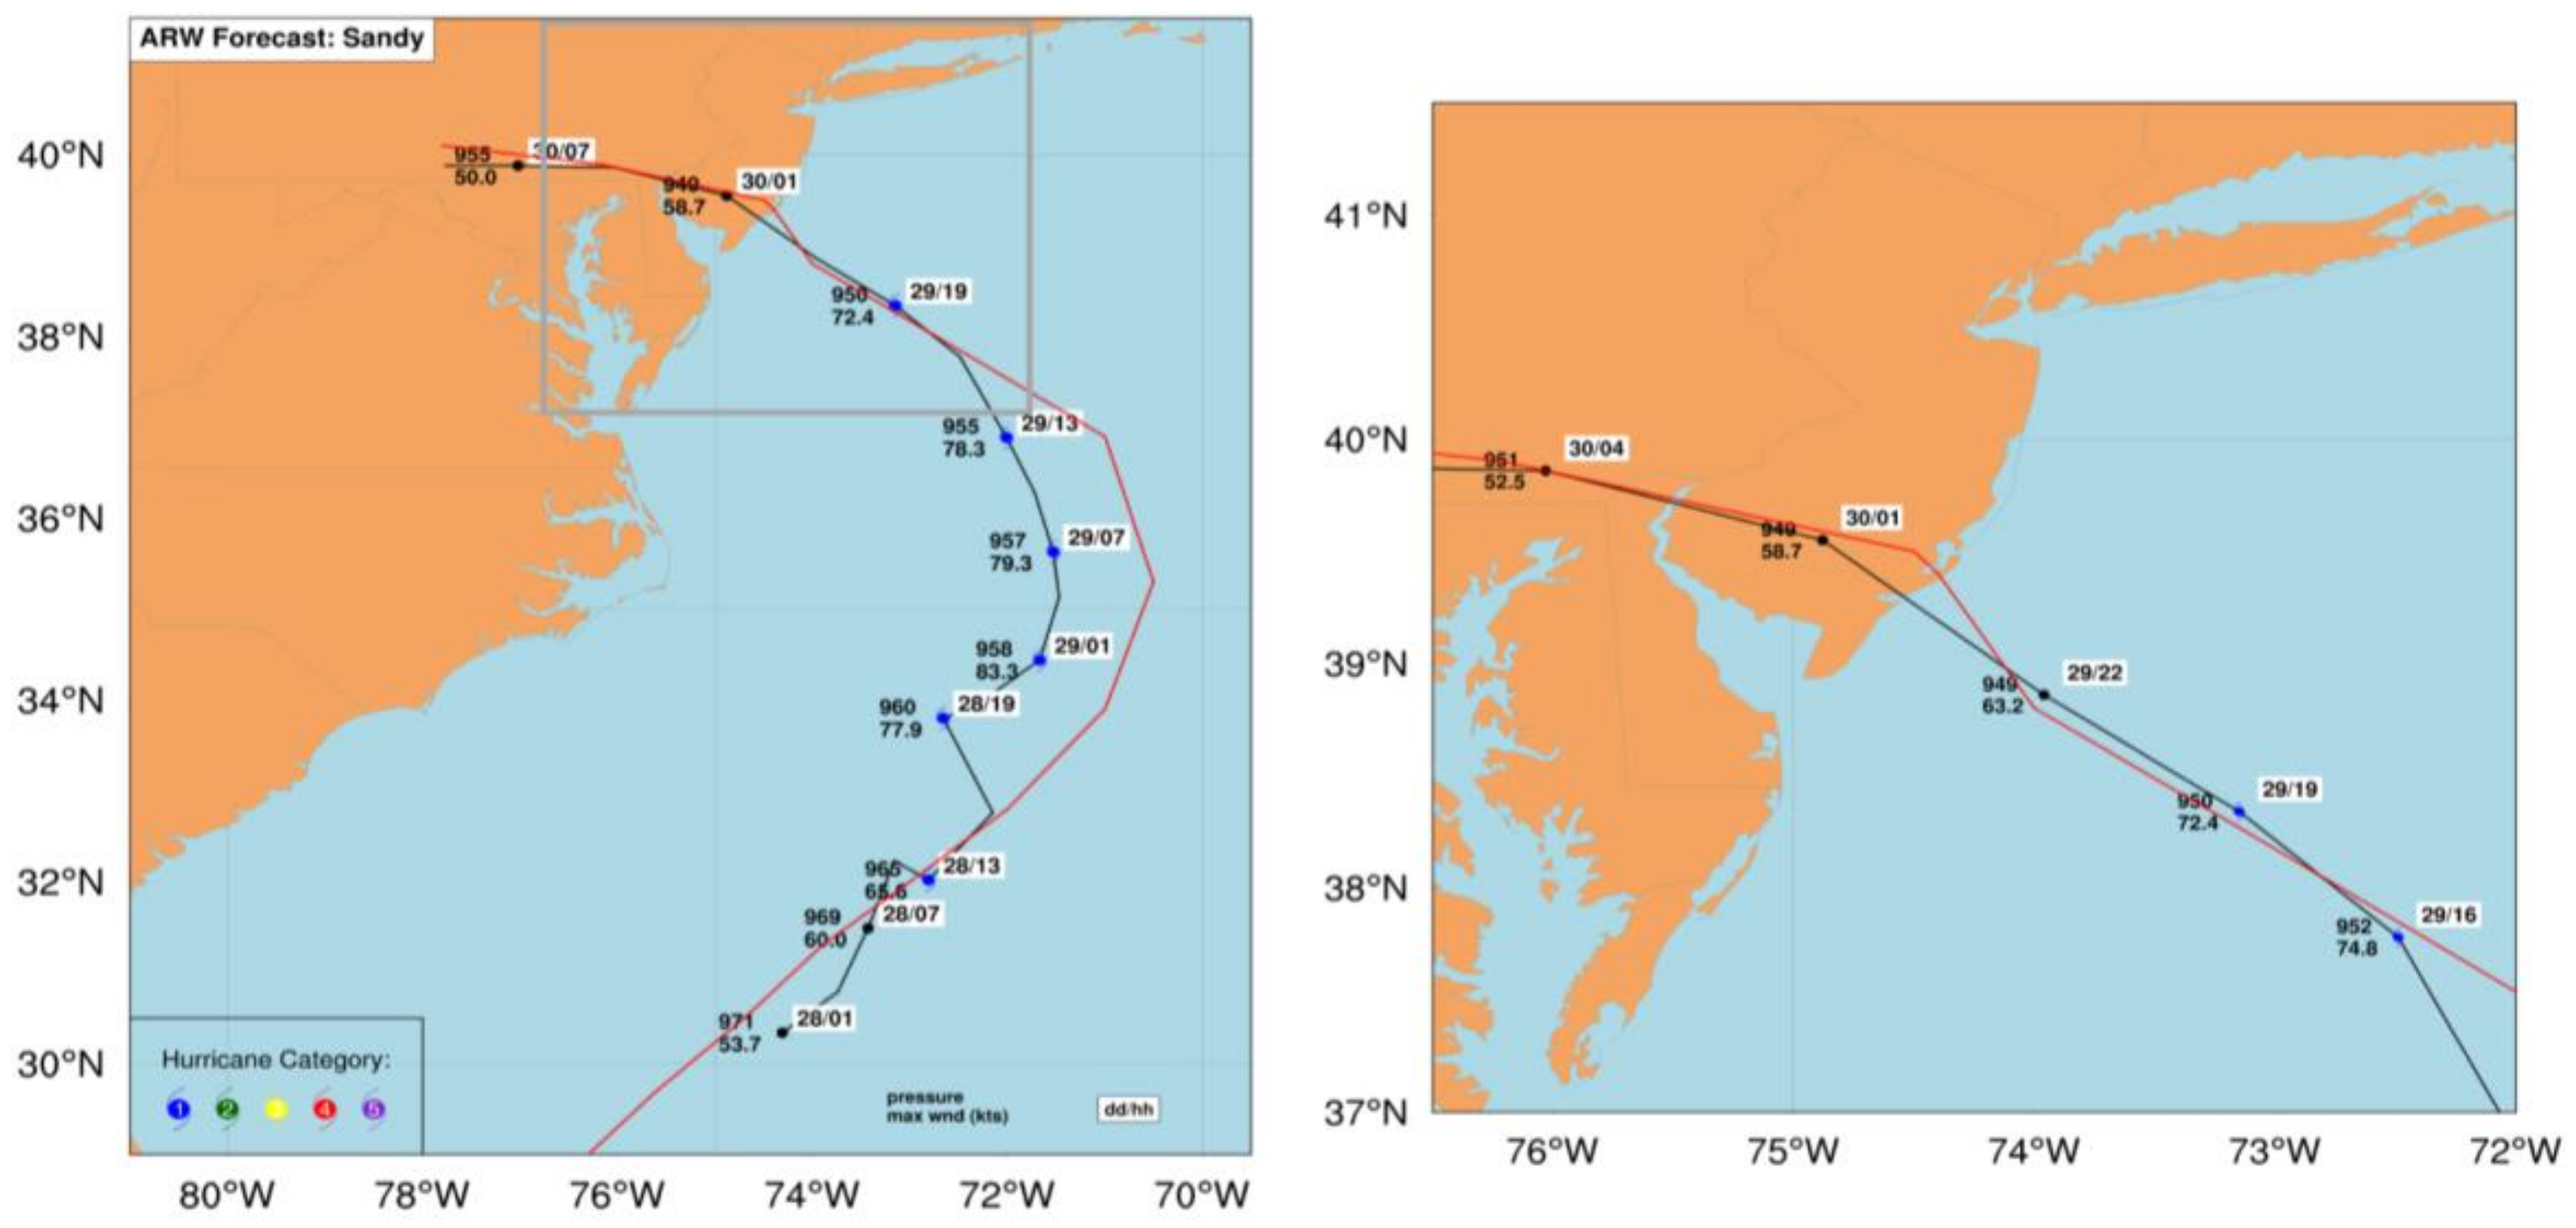
The two-way nested WRF 12-4 km model simulation proved skillful in predicting the observed track and landfall location. At the time of initialization, the simulated storm track was located about 46 km to the right of the observed BT location (
Figure 2). The track error increased to a maximum of about 110 km, with the simulated track shifting to the left of the observed location on 29 October 0600 UTC. The track then followed the same trend as the NHC-BT observations and took Hurricane Sandy’s characteristic Northwest turn towards the NJ coast. After 29 October 1600 UTC, the track error was reduced to about 32 km. The simulated storm remained to the left of the observed track and made landfall south of Brigantine, NJ, USA with a track error at the time of landfall at 2330 UTC on 29 October of 21.5 km (
Figure 2).
In terms of the minimum sea level pressure at landfall, the simulated hurricane was only fractionally weaker (3.6 mb) than the observed. The lifetime minimum pressure obtained by our simulation was 948.5 mb at 0000 UTC 30 October, while the observed hurricane reached a minimum pressure of 940 mb at 1800 UTC 29 October. The slightly weaker nature of the simulated storm is evident when comparing the maximum winds (
Figure 3). The maximum wind of the simulated storm at landfall was 4.48 ms
−1 less than observations, but the error is still within the range of NHC’s annual average intensity error for a 48 h forecast of about 5.45 ms
−1 (10.6 kts per 2016 standards; [
38]). Despite the weaker maximum wind at landfall, our simulation reached the secondary intensity peak of 43.5 ms
−1 which nearly matches the observed maximum of 44 ms
−1. The simulated storm reached its maximum early at 0600 UTC on 29 October, which is approximately 6 h prior to the observed peak for Hurricane Sandy.
The single-nested WRF 12 km simulation on the other hand, followed the general observed track but showed signs of instability along the track, prior to recurving to the left (
Figure 4). The track error is less than that of the WRF 12-4 km simulation in the hours prior to landfall but increases to about 37 km as it approaches the coast and makes landfall north of the observed location. The WRF 12 km simulated TC was in general weaker than the WRF 12-4 km. In this case, the lifetime minimum pressure occurring near landfall on 30 October 0100 UTC, was 949.8 mb. The storm also reached a maximum intensity of 43.1 ms
−1 on 29 October at 0600 UTC. As shown in
Figure 3, the storm starts with a lower intensity than the WRF 12-4 km simulated TC, remaining as such for the entire simulation until reaching peak intensity and weakening faster than the former after landfall.
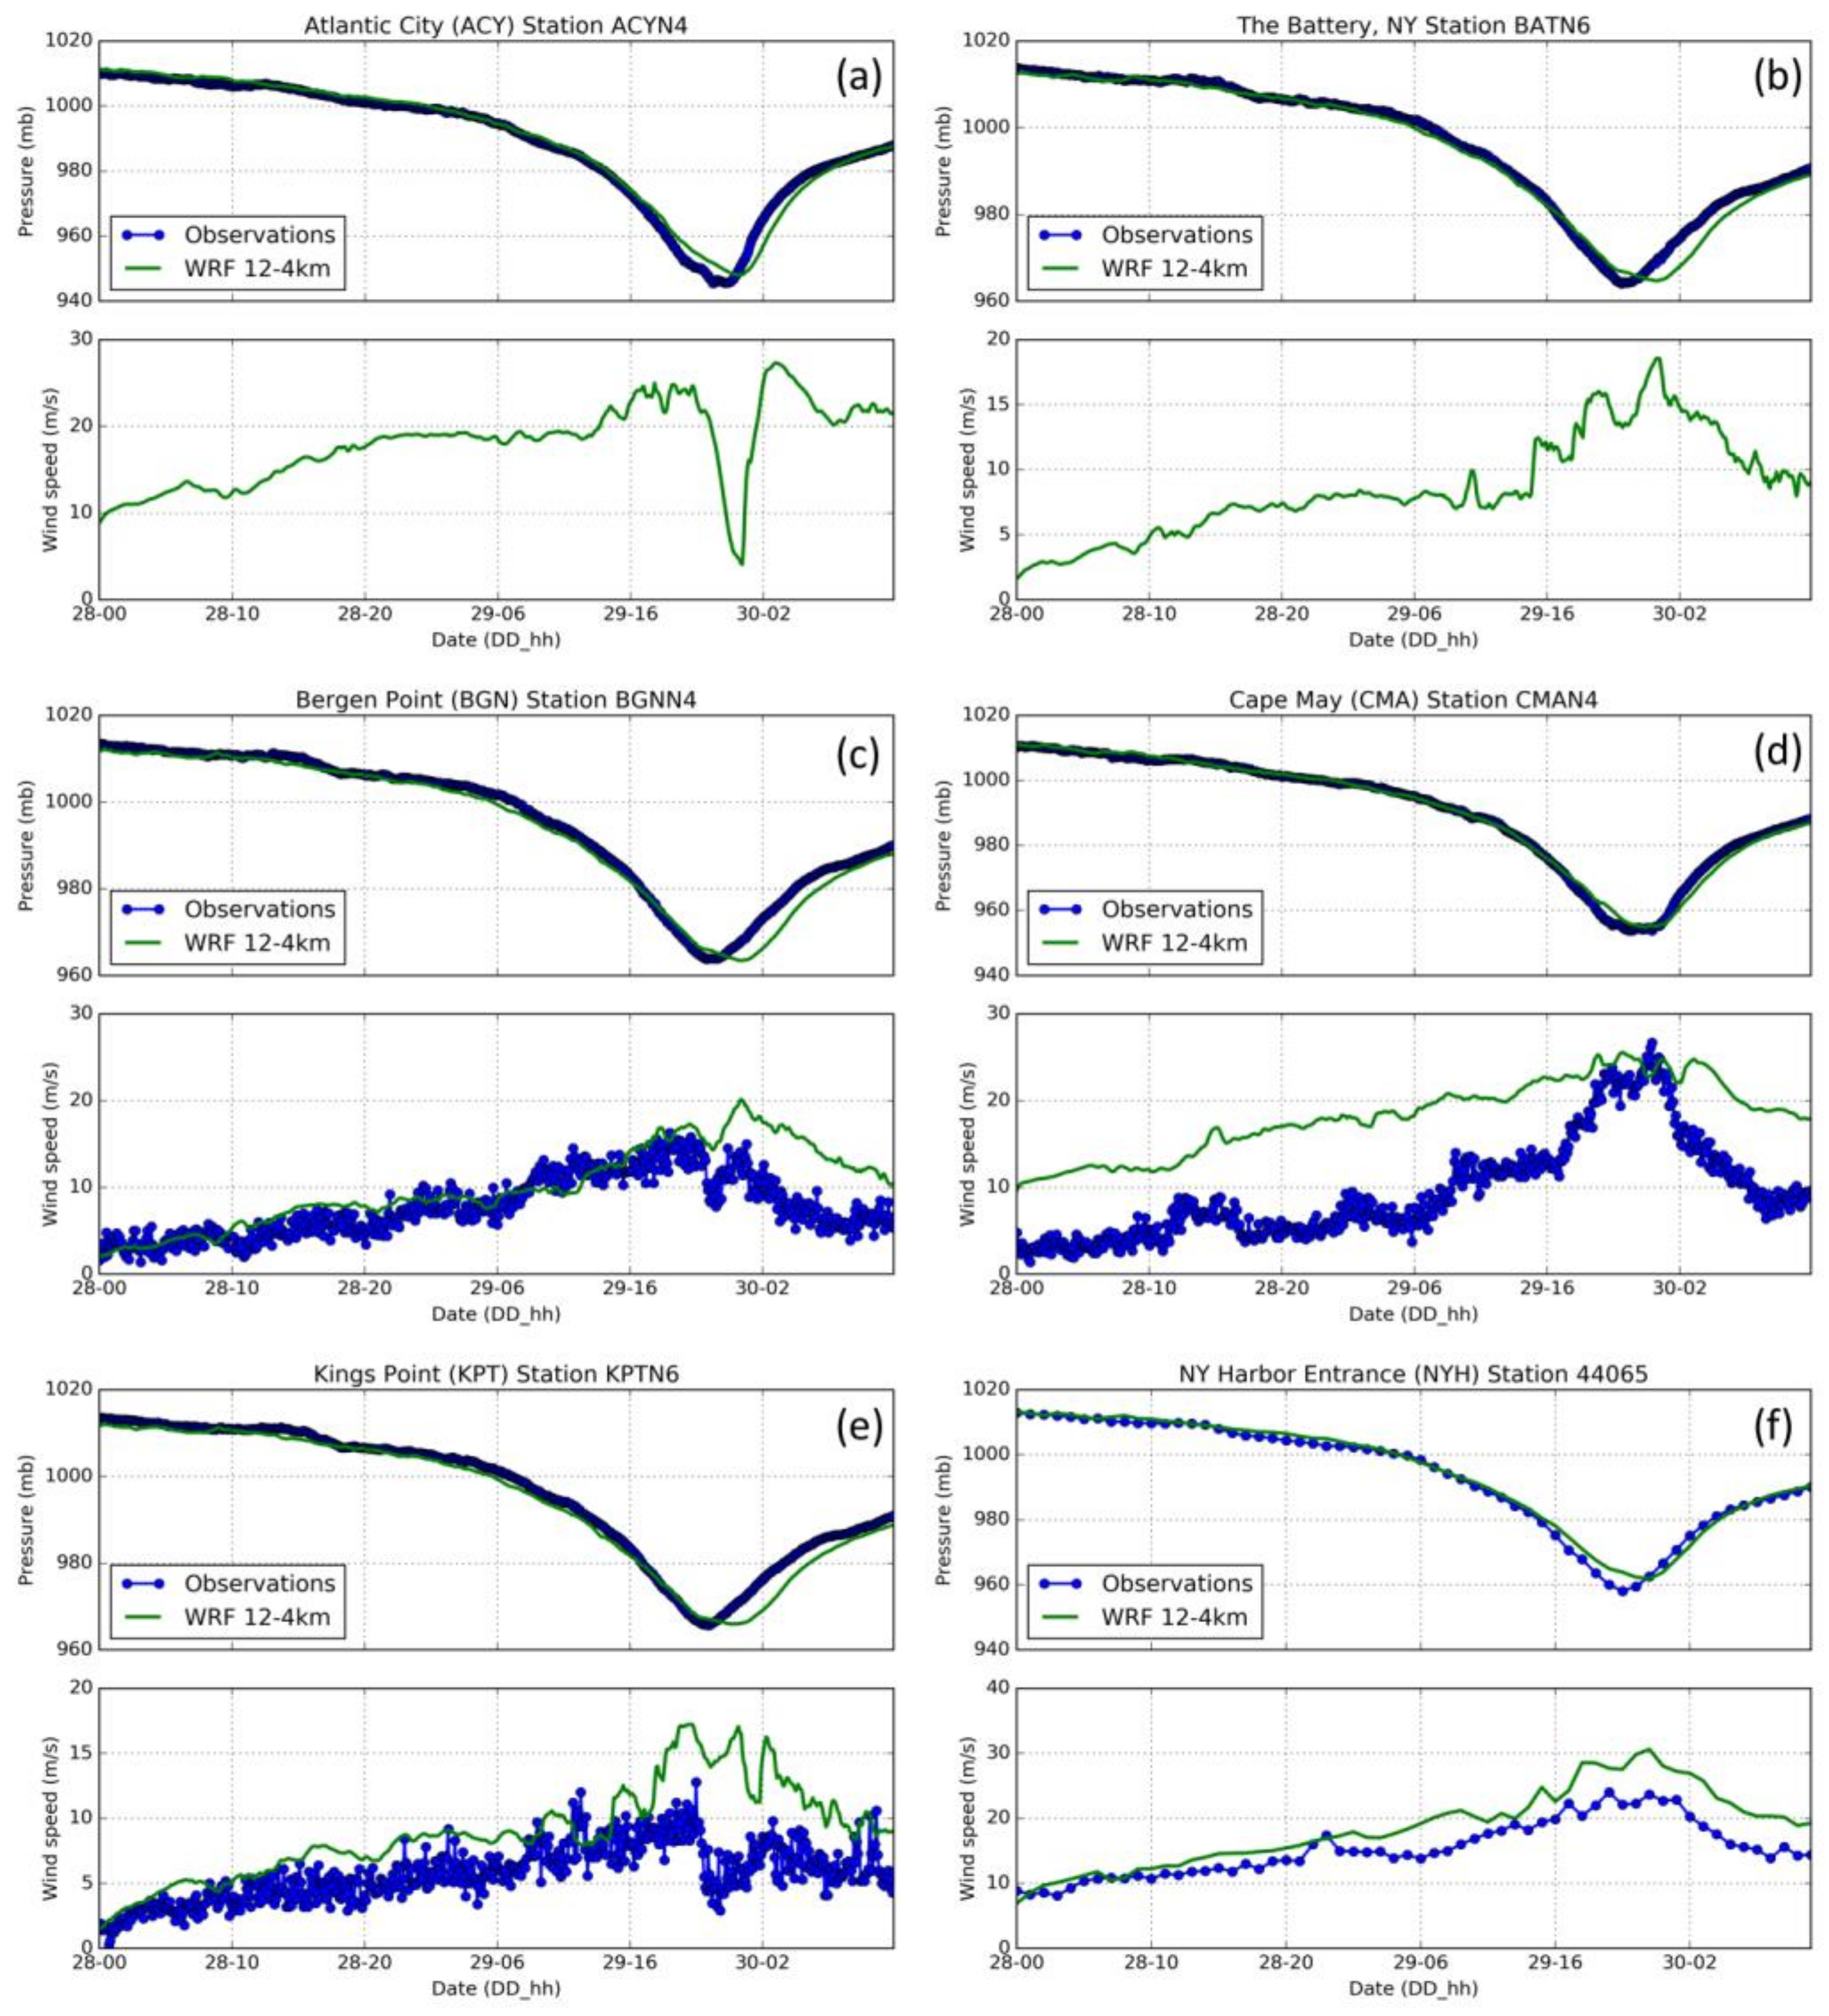
Wind patterns and minimum pressure estimates were further explored for the WRF 12-4 km simulation by comparing observations from the NOAA National Data Buoy Center buoys and weather stations along the coast of NJ and NY to the WRF simulations (
http://www.ndbc.noaa.gov/). Nevertheless, the comparisons provide additional insight into the WRF 12-4 km simulated wind and pressure field patterns. Unlike many stations in the vicinity, the New York Harbor Entrance Station recorded wind and pressure data throughout the entire analysis period (
Figure 5f). The simulated pressure pattern matched well with observations and accurately captured the pressure drop at the buoy, with a significant correlation coefficient of 0.995. The simulated wind patterns followed the same general behavior as the observed winds, although the simulated winds appear to be slightly overestimated at this station (correlation of 0.952). Other stations examined followed a similar pattern of significant correlation between pressure and wind estimates. Minimum pressure was well simulated in all stations (
Figure 5). Wind speed time series for the Cape May, NJ and Kings Point, NY stations (
Figure 5d–e) showed more discrepancies. In these stations the simulated winds are overestimated, however the peak wind speed is accurately captured in the Cape May station.
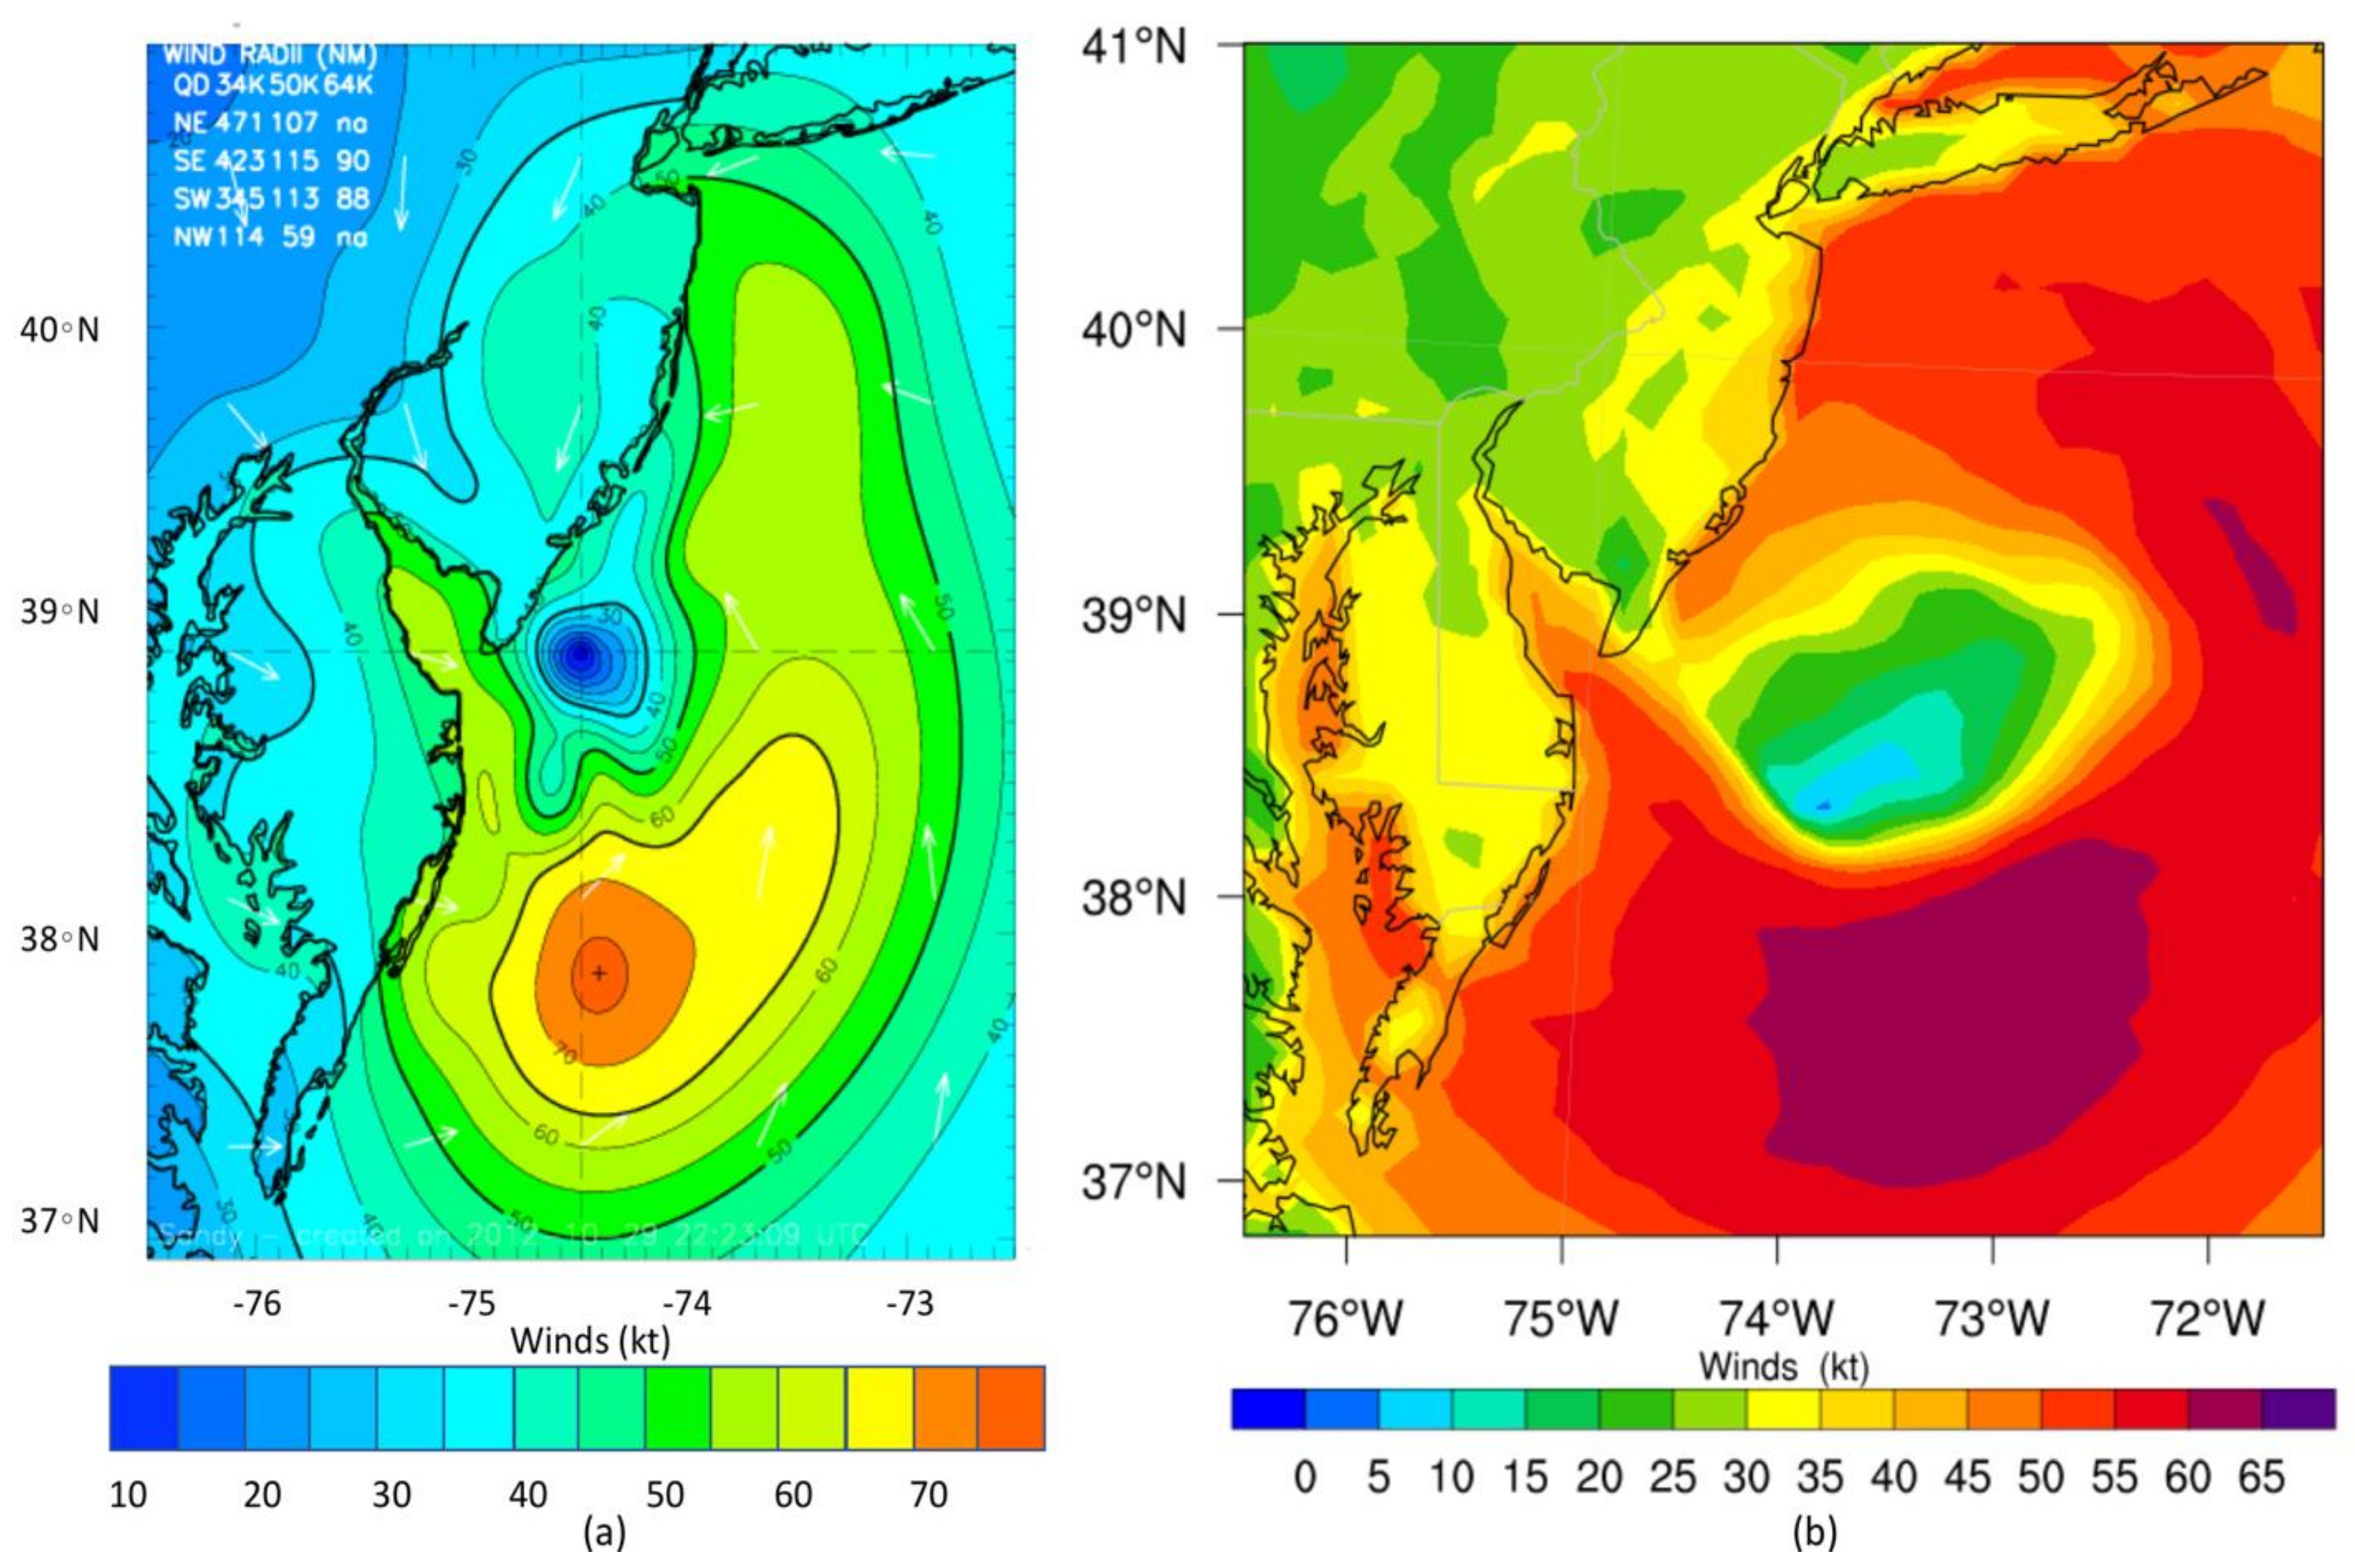
For storm surge assessment, it is important that the atmospheric simulations can reproduce the structure and location of maximum intensity observed for TCs, but more so it requires that the overall wind fields are accurately depicted (i.e., extent and asymmetries). We compared the wind field from the HWIND product for various forecast times before and during landfall to the WRF 12-4 km simulation. We determined that the WRF 12-4 km simulation could capture the main features in structure and intensity observed for Hurricane Sandy, with maximum wind intensities both on the left and right side of the track, characteristic of extratropical cyclones. Our comparison shows that at 2100 UTC 29 October, 2 h prior to landfall, the model simulation reproduced the annular/semi-annular structure of the TC, as well as the location and intensity of the maximum winds in the lower TC quadrants (
Figure 6). After landfall at 0000 UTC 30 October, the model simulation was also able to capture the weakening and dissipation of the TC as it started losing definition of its structure when interacting with land and topography.
3.2. Control Storm Surge Simulation
Figure 7 shows the maximum water elevation for the CTL run, where ADCIRC was forced with the NHC-BT data for Hurricane Sandy and implemented with the GAHM. The NHC-BT should have marginal track and intensity errors, and per ADCIRC model configuration, should be the closest representation to actual observations. In the WRF12-4 km simulation of Hurricane Sandy strong winds prevail on both sides of the storm tracks, as discussed in
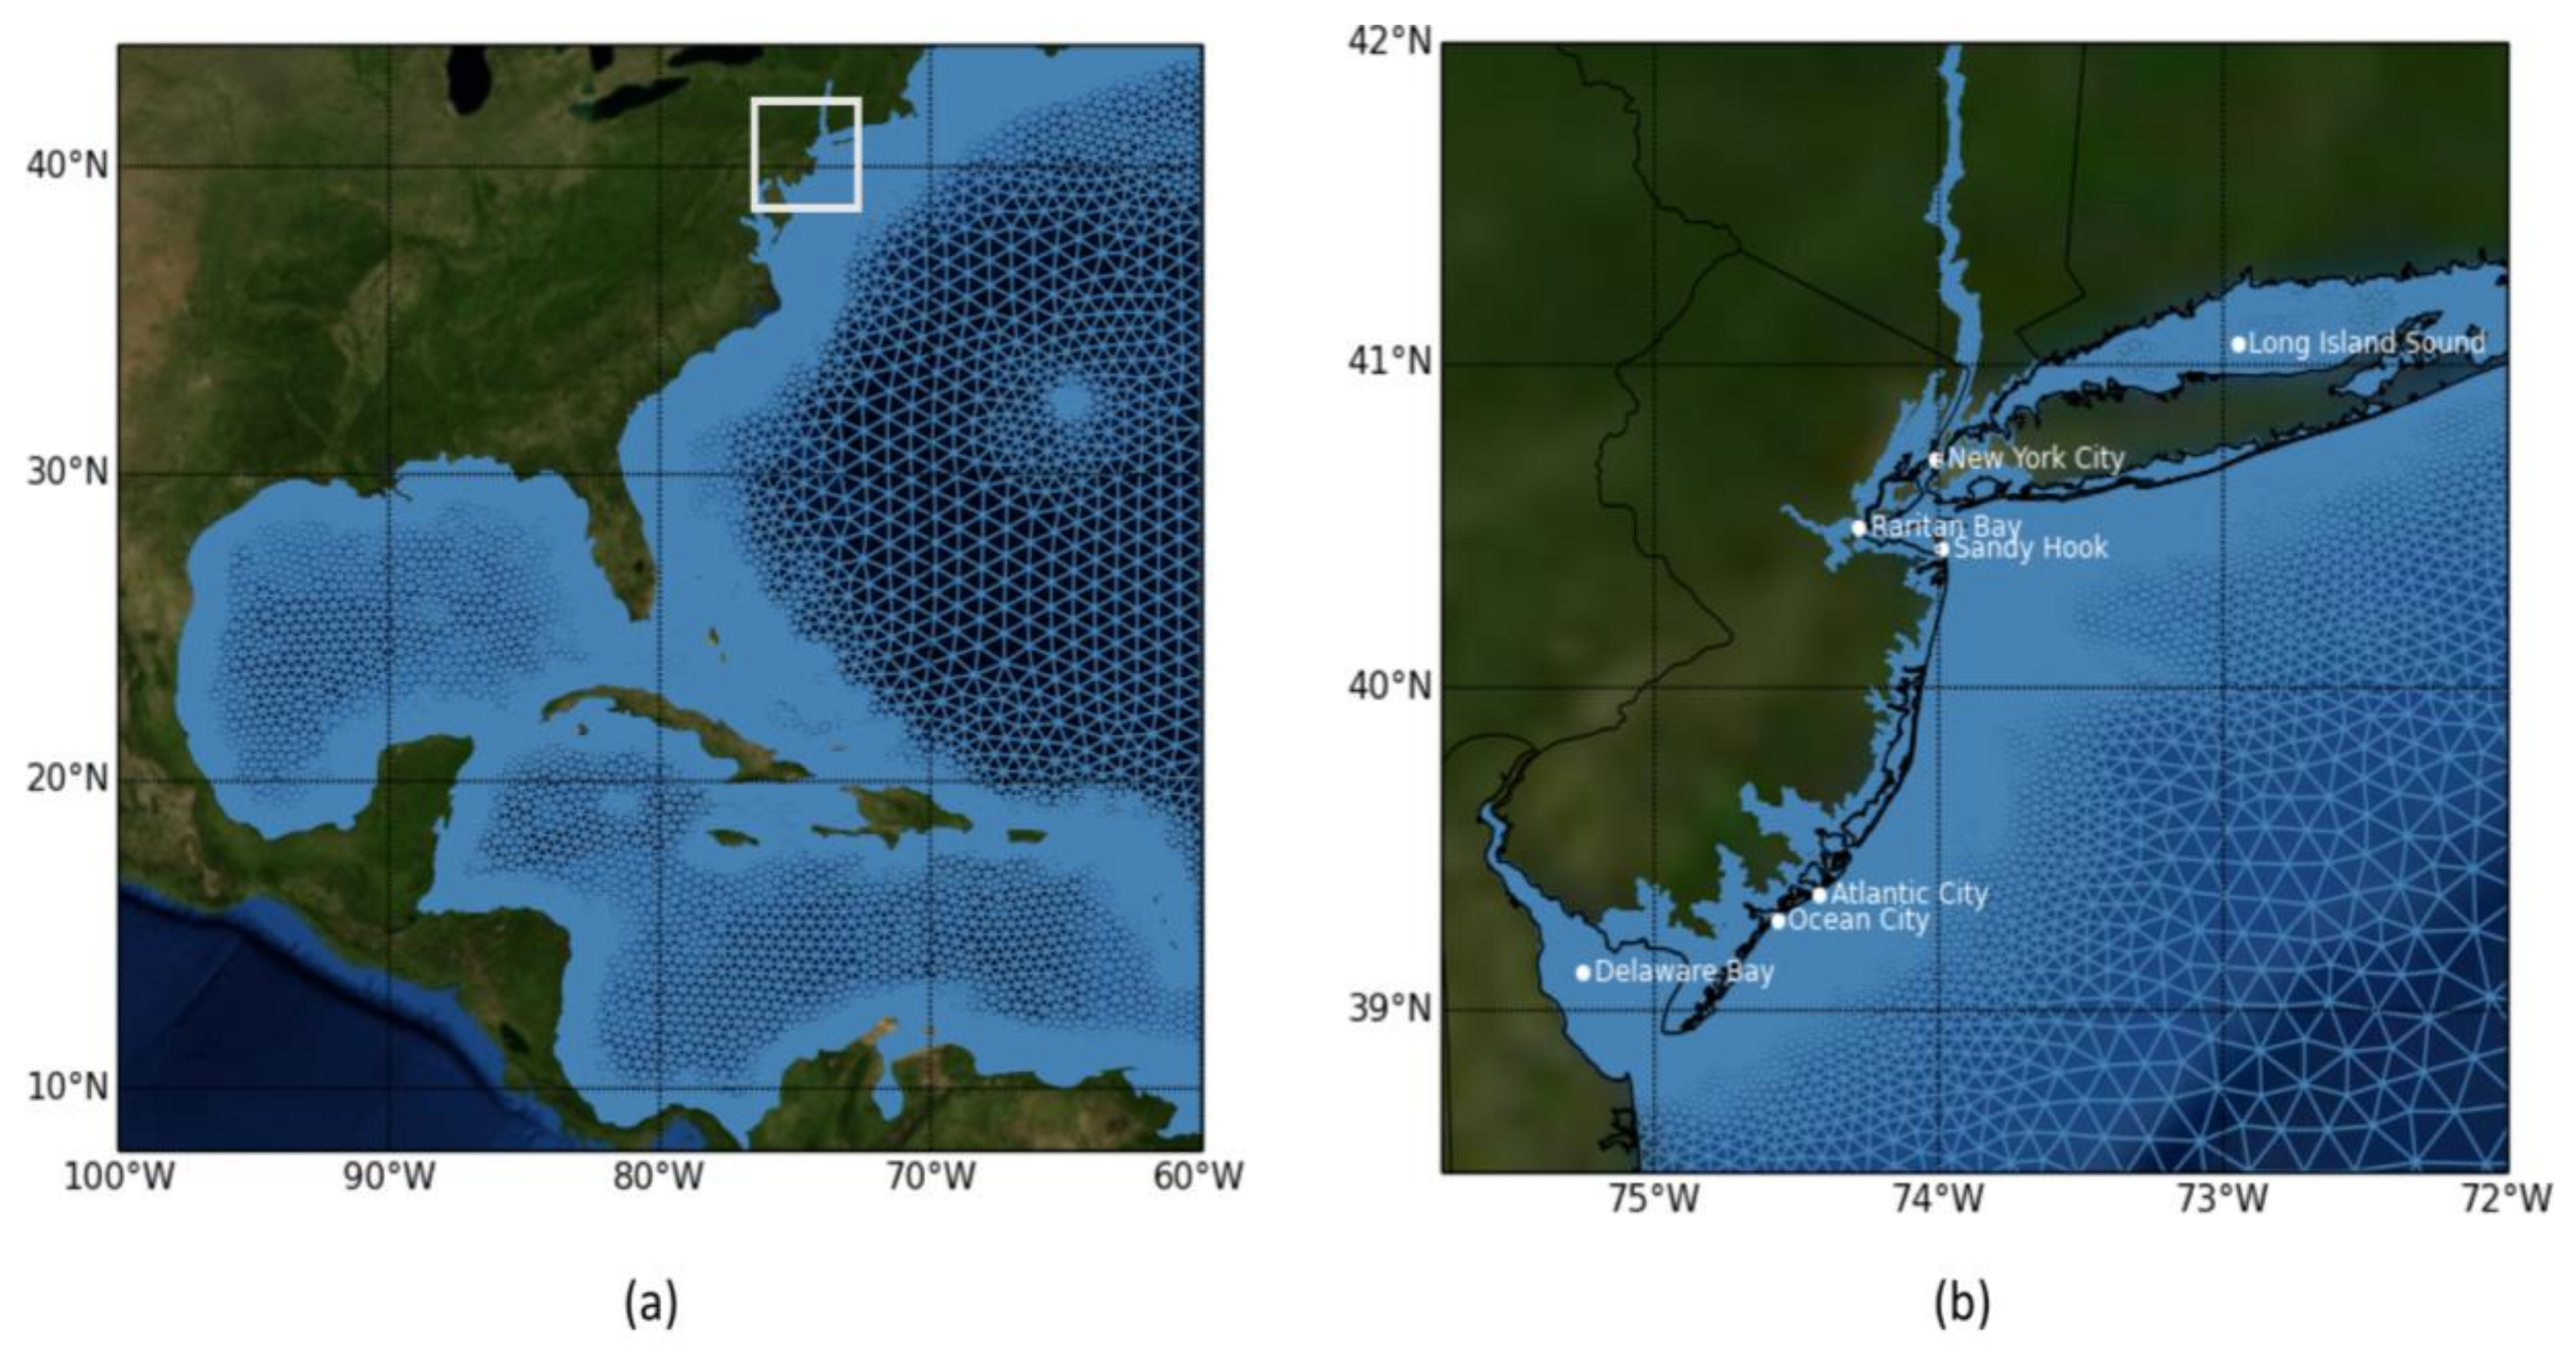
Section 3.1. The maximum water elevation estimates reached the maximum observed storm tide (storm surge + tide) of about 4 m. High water elevations are observed in areas right of the storm track including the NY Harbor and Long Island Sound regions. Opposite results are seen to the left of the storm track, where storm surge was lowest overall. Maximum water elevation estimates on the southern coast of NJ and in the Delaware Bay range between 1–2 m. Near Brigantine and Atlantic City water elevation estimates were moderate, ranging between 1.5 and 2.5 m.
3.3. WRF Simulated Cyclone Track-Forced Storm Surge Simulation
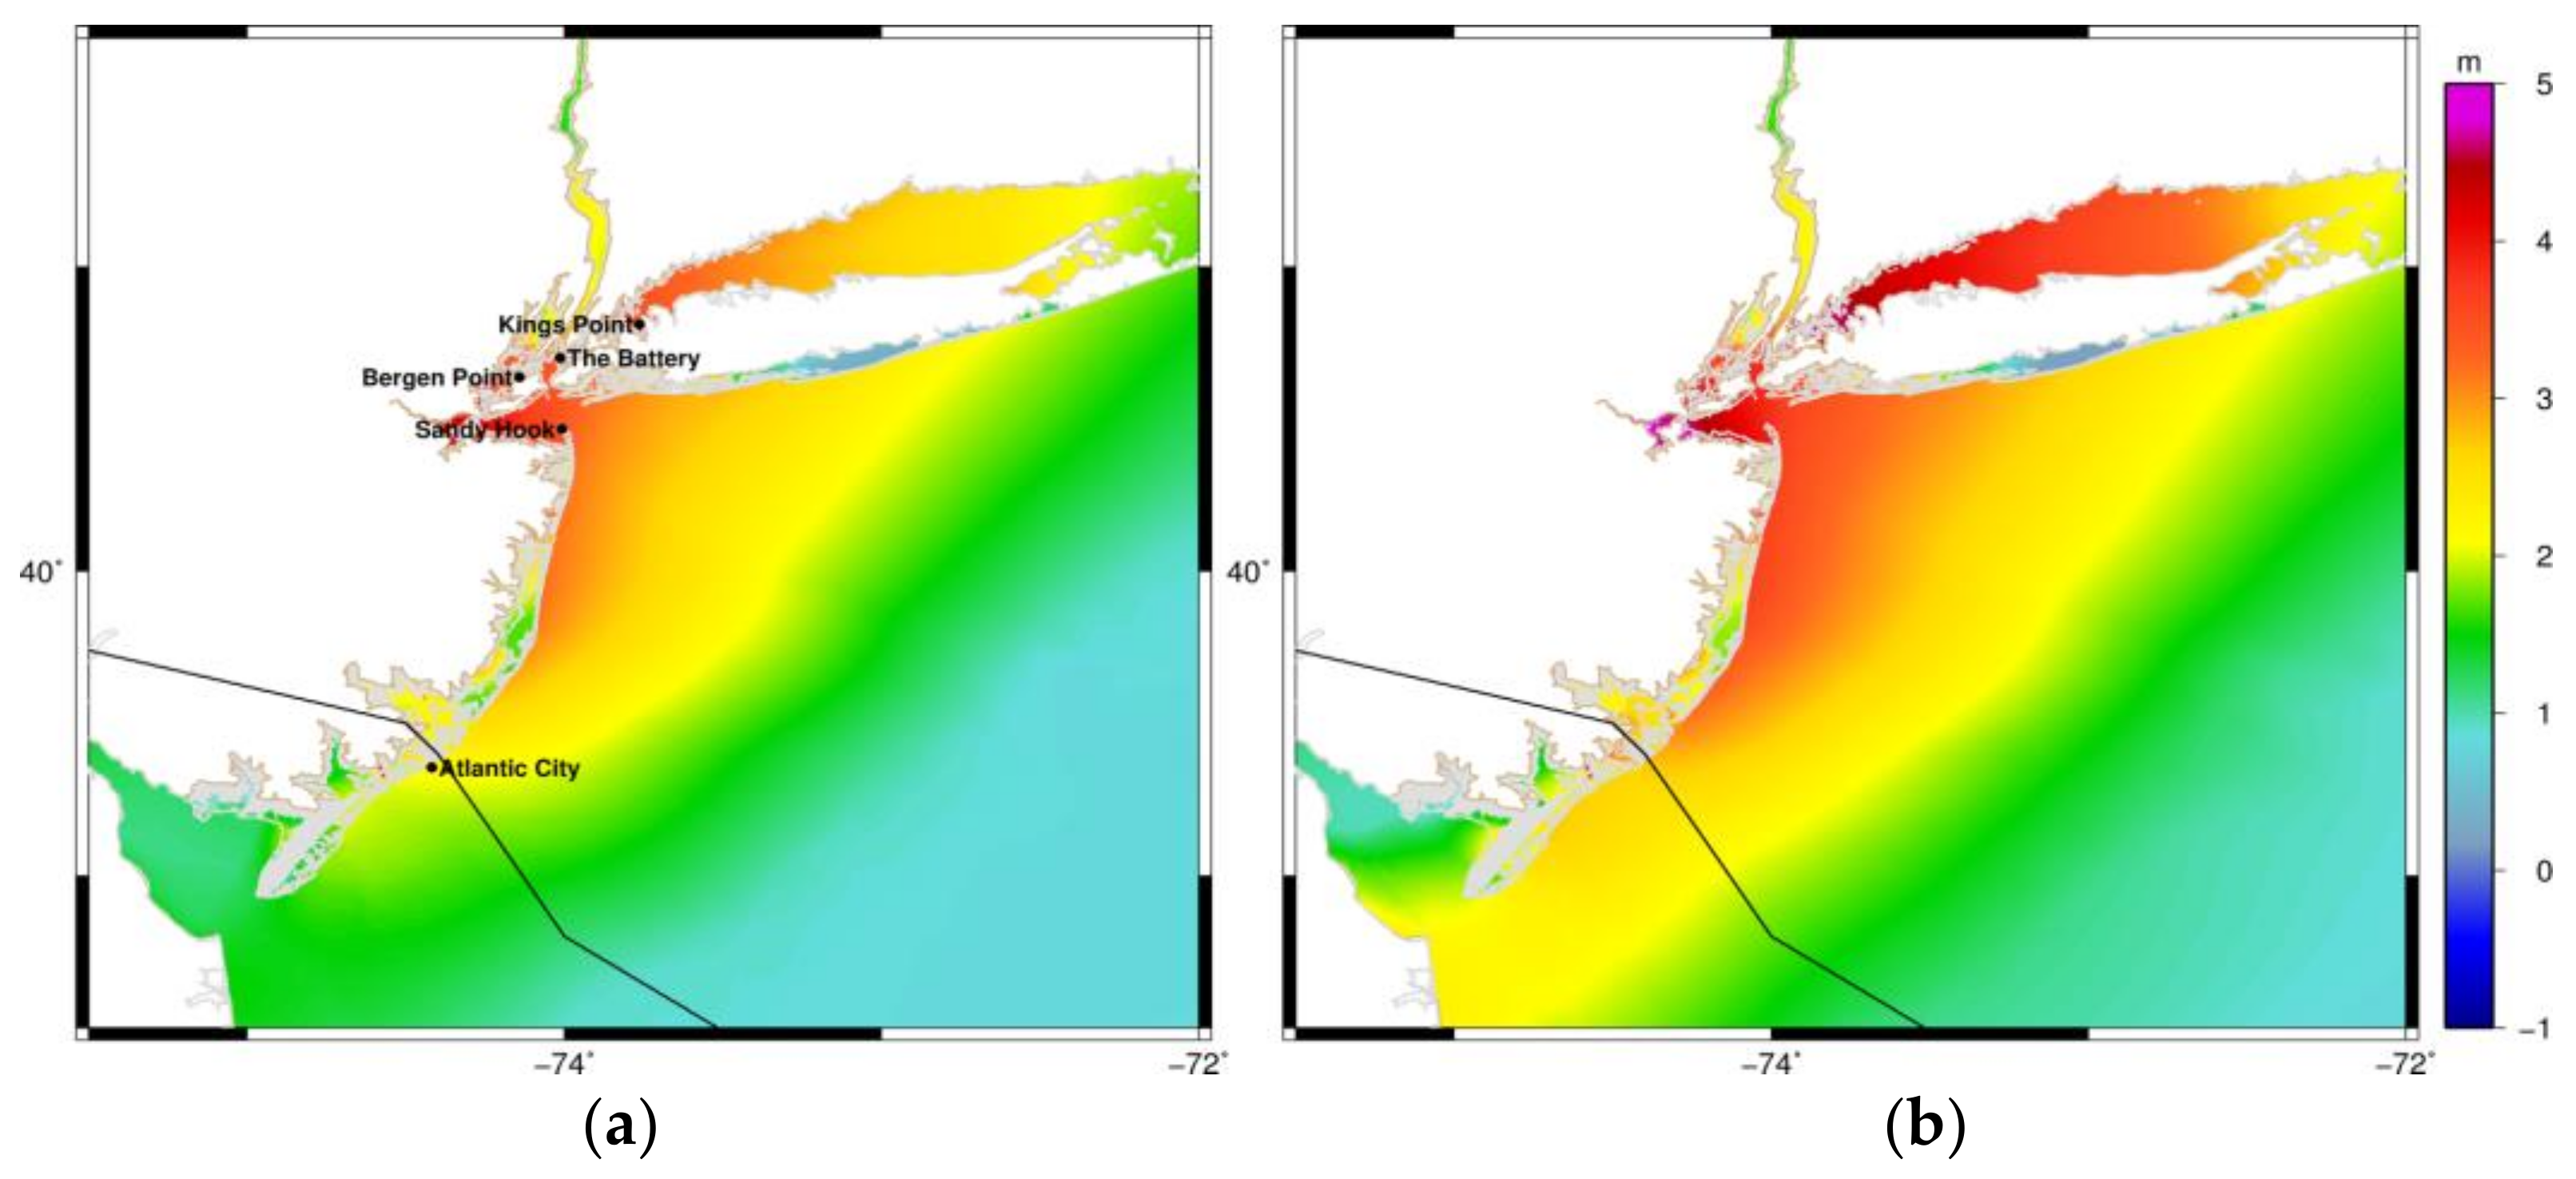
The WRF-ADCIRC SCT12-4 simulation results show maximum water elevation estimates that do not reach the maximum observed storm tide for Hurricane Sandy (
Figure 8a). One of the causes to consider is the simulated TC size. On 28 October 0000 UTC the NHC-BT data indicate that Hurricane Sandy’s 34-kt wind radii extent for the NE, SE, SW and NW quadrants are 480, 300, 300 and 280 nm, respectively. The 34-kt wind radii calculated for SCT12-4 were generally smaller than observations, particularly in the NE quadrant, with a 241-, 276-, 298- and 326-nm extent for the NE, SE, SW, and NW quadrants, respectively. The simulated storm in SCT12-4 is smaller than was observed for Hurricane Sandy and is not expected to have that significant of an effect on maximum water elevations.
Water elevation in the NY Harbor, Raritan Bay and Long Island Sound areas mainly ranged between 2 and 3 m, while estimates in the Delaware Bay were lower and ranged between 1 and 2 m. When compared to the CTL run, the simulated maximum elevation gradient resembles that of the CTL, with highest surge in the NY Harbor and Long Island Sound regions. However, the maximum water elevation estimate in the NY Harbor was largely underestimated by the SCT12-4 simulation with differences ranging between about 0.75 and 1.5 m (
Figure 8b). SCT12-4 overestimates maximum water elevation in the Delaware Bay. Near the area of landfall in Brigantine, NJ the differences between the CTL and SCT12-4 are the lowest. Differences range between 0.0 and −0.5, owing to similarities in track and intensity between the WRF12-4 simulated storm and observations for Hurricane Sandy near landfall.
3.4. WRF Full Field-Forced Storm Surge Simulations
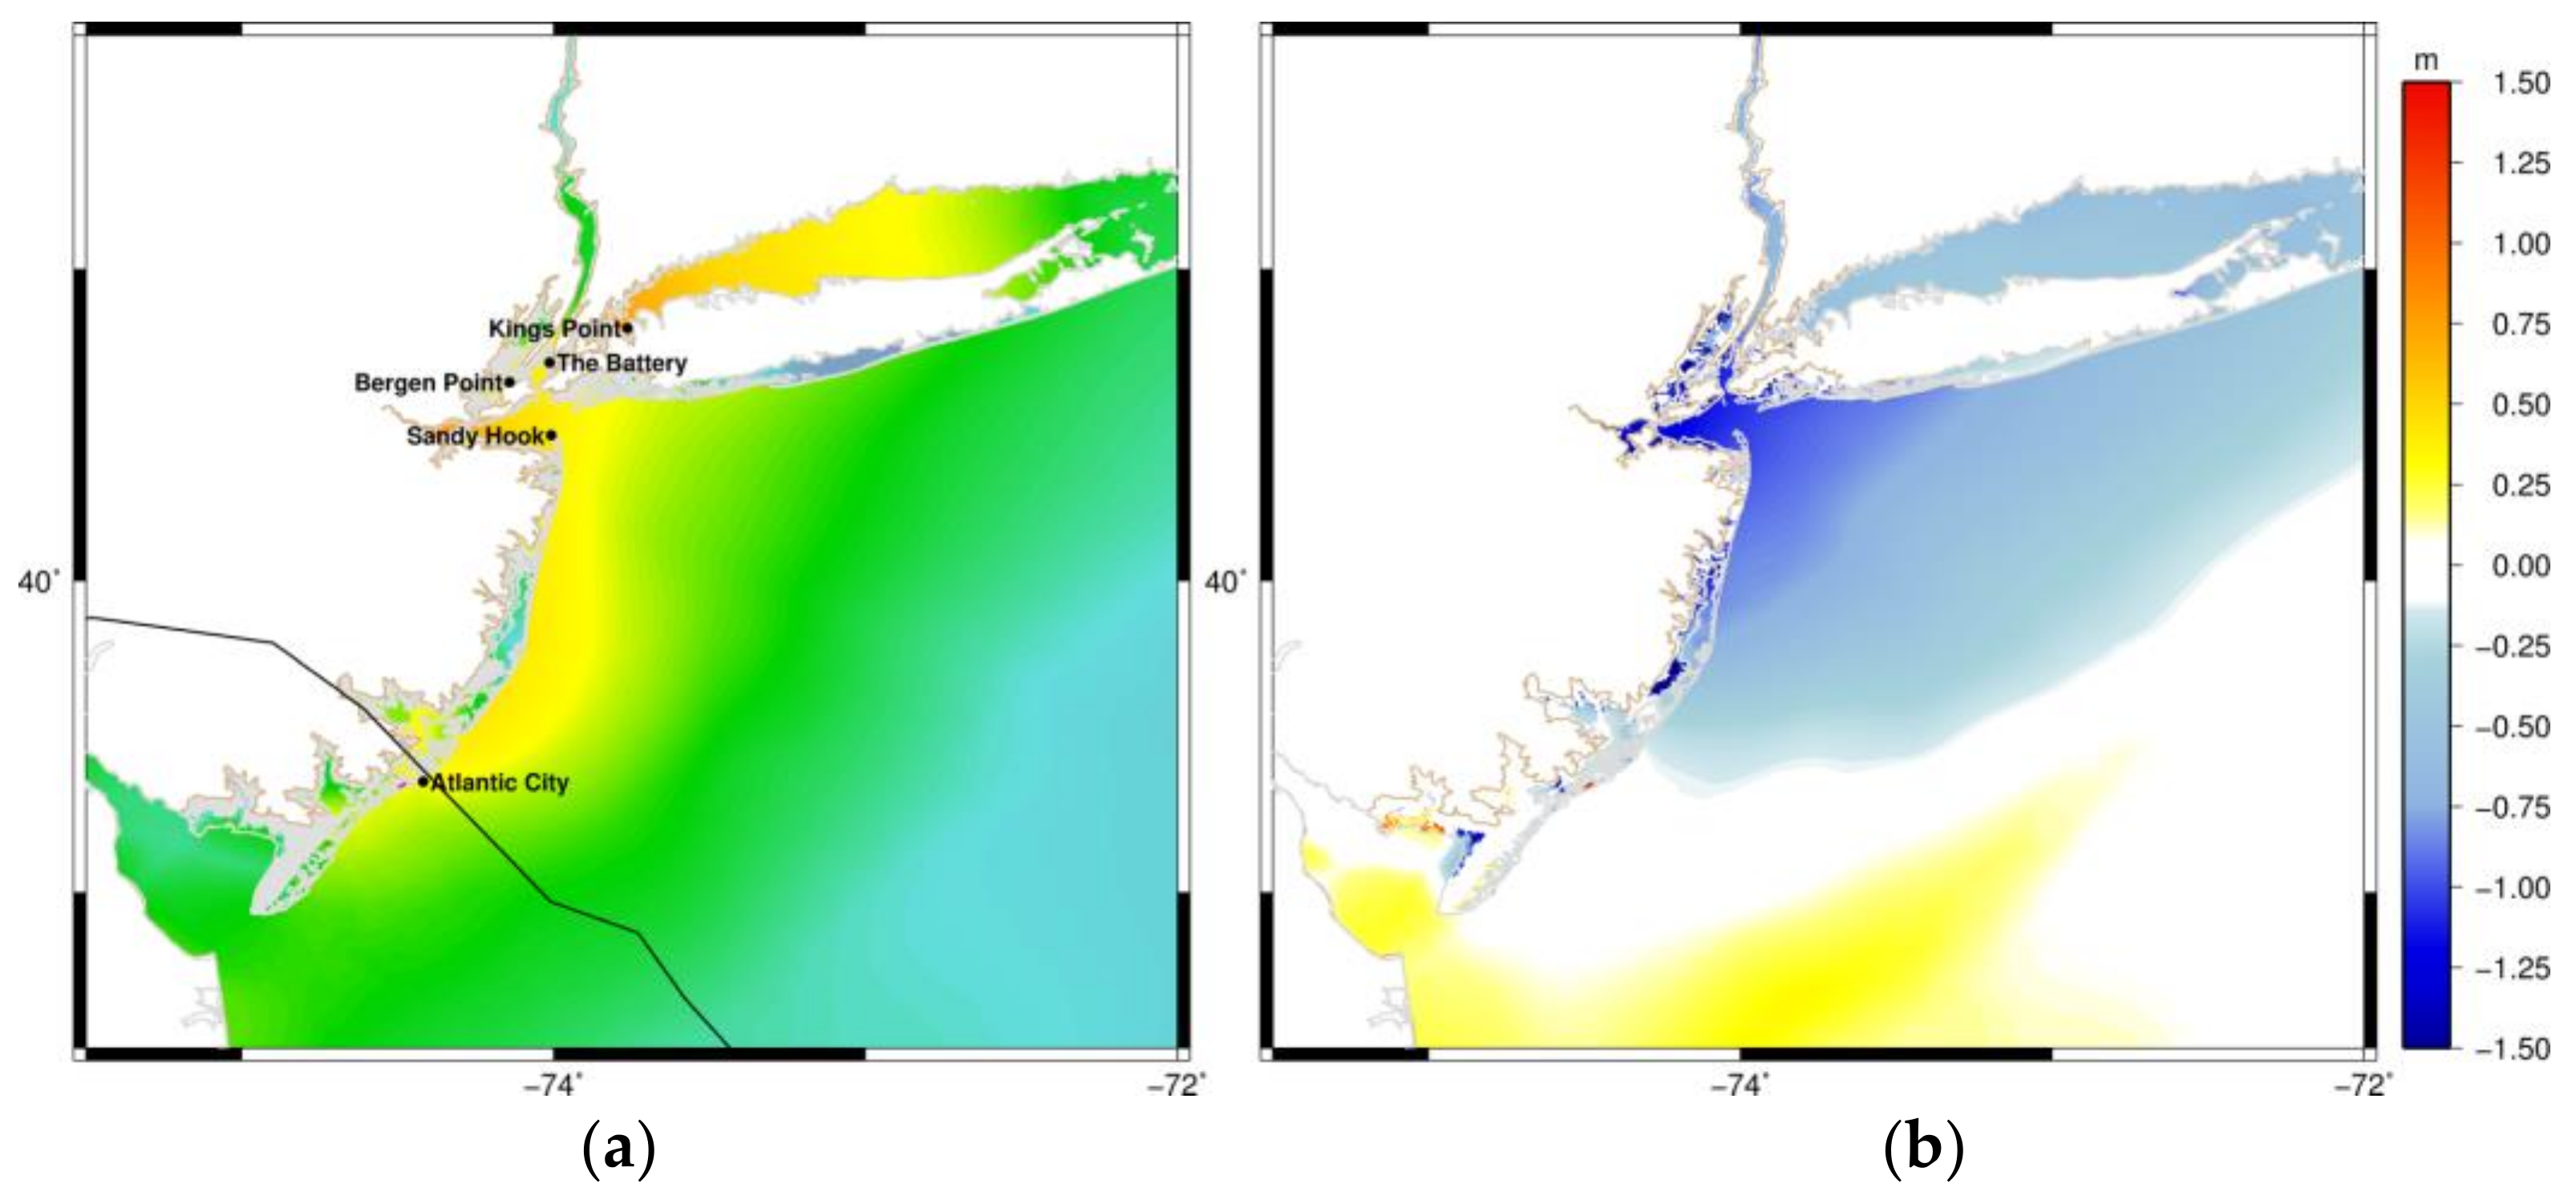
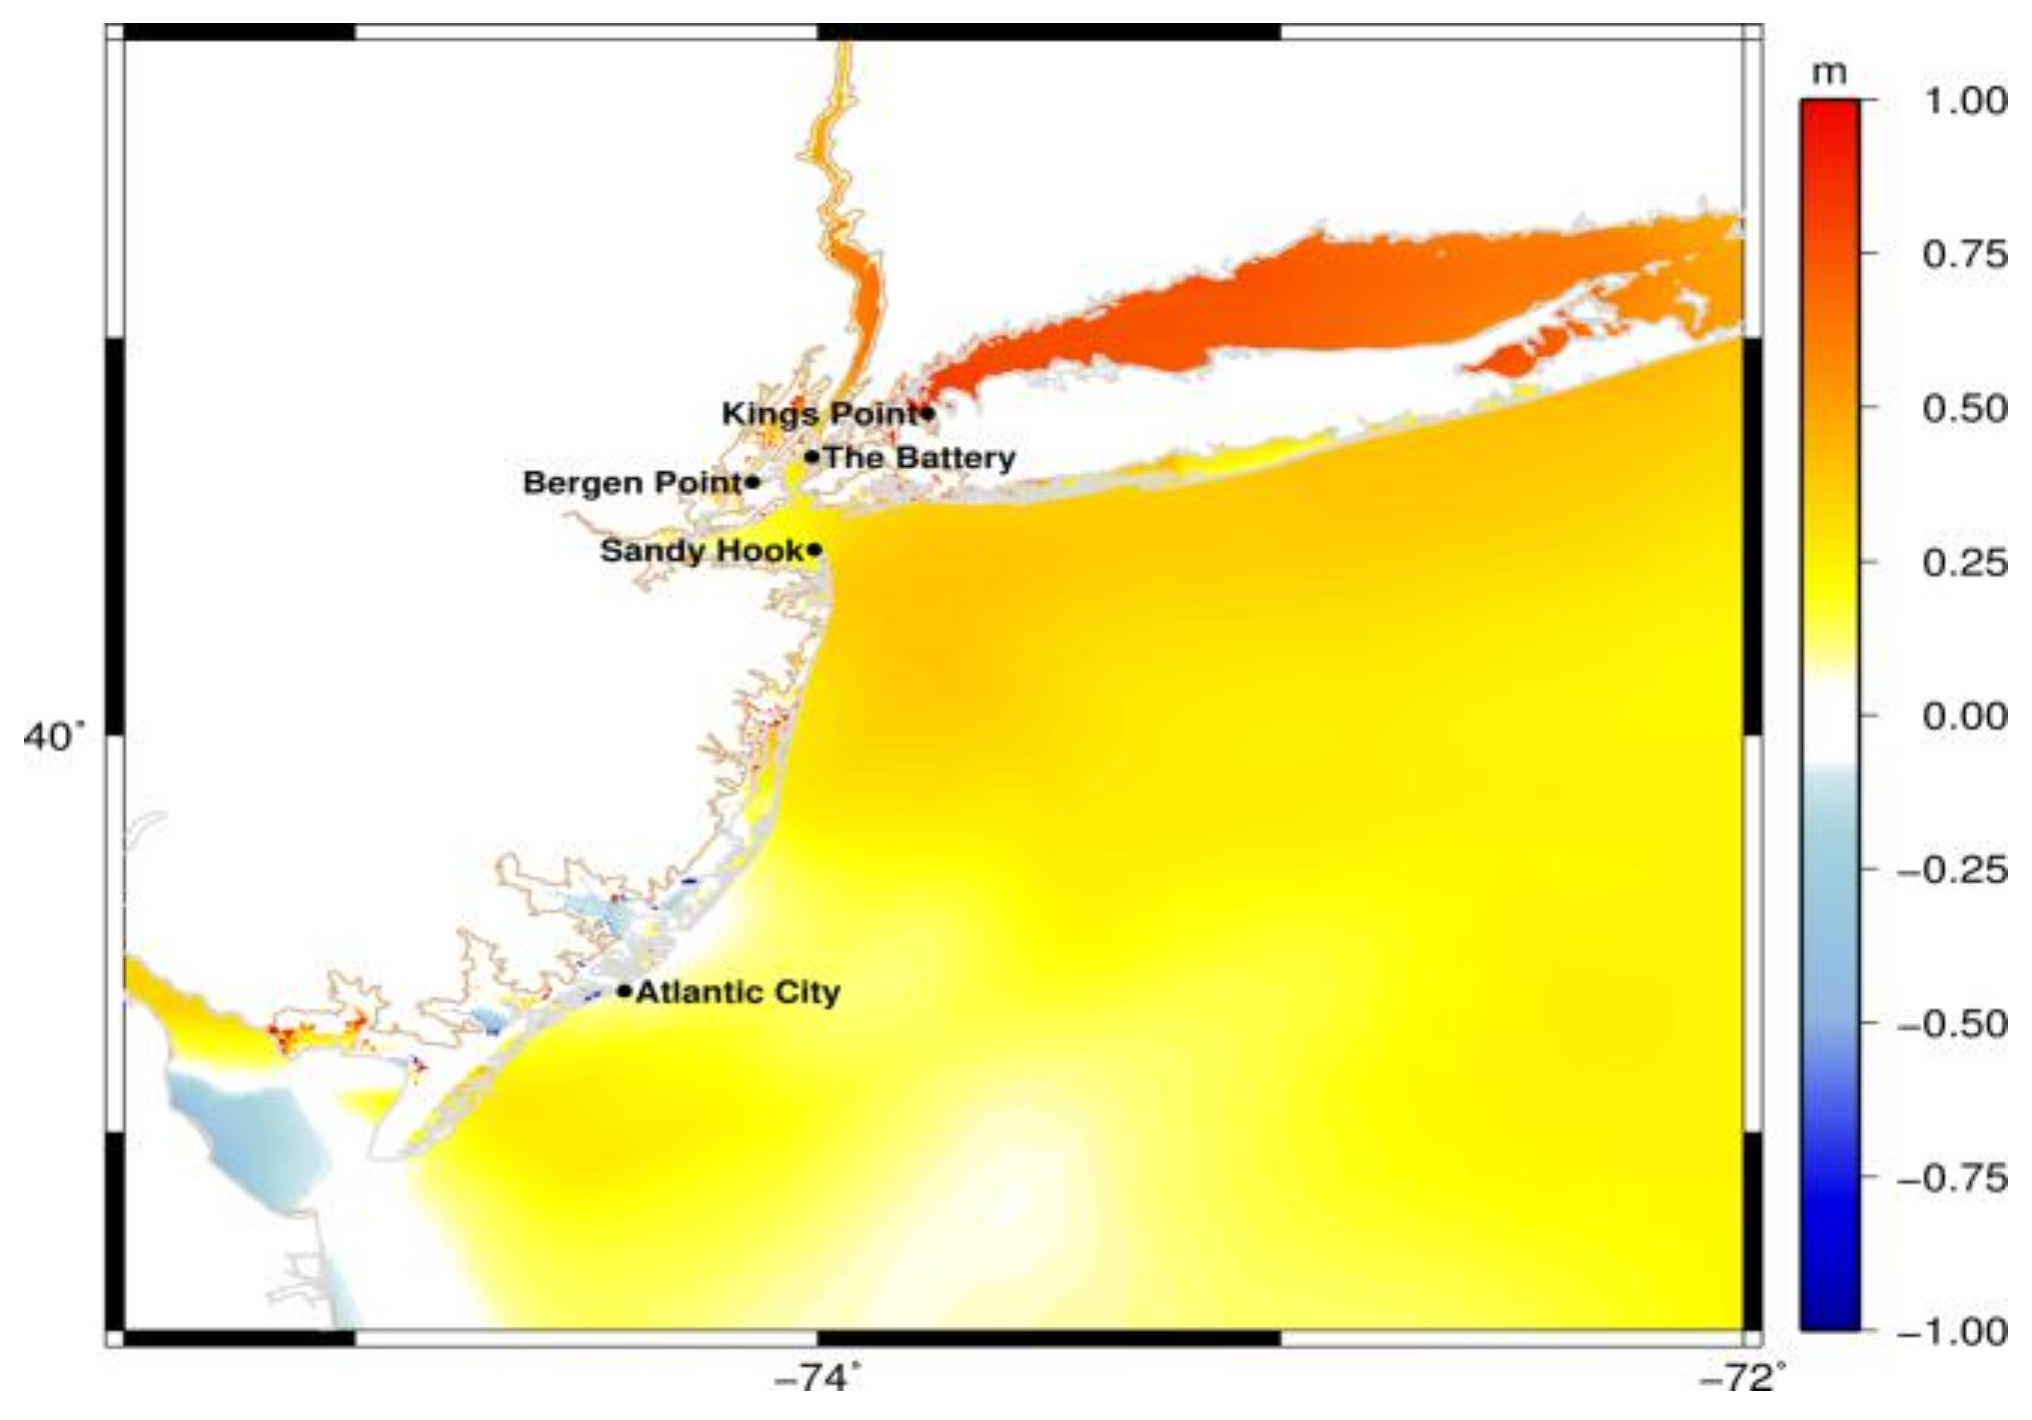
One of the main features evident in the FWP12-4 simulation, is high maximum water elevation in Long Island Sound (
Figure 9a), where maximum water elevations in this region reached up to 4 m, overestimating CTL by about 1 m. Compared to CTL, the FWP12-4 simulation underestimates the maximum water elevation along the NY Harbor and Raritan Bay areas by about 0.4–1.0 m (
Figure 10a), as expected for a storm with winds between 5 and 8 m/s weaker than observations. Meanwhile it overestimates water elevations by about 0.4 m in the coastal region south of Atlantic City, NJ, USA.
The area where the maximum water elevation ranged between 2 and 3 m is broader in this simulation, extending further east into the Atlantic Ocean than in the SCT12-4 simulation. This area of higher water elevation also extends further south along the NJ coastline in FWP12-4 than both the CTL and SCT12-4 simulations, pointing to a larger TC wind field representation in the full-physics model compared to the parametric wind model. Also, evident in this simulation are higher estimates along the Hudson River where the maximum water elevation reached above 2 m. The increased surge along the Hudson River is a feature that could not be captured in the previous track-forced simulation (SCT12-4) but is present in the CTL run. These discrepancies could point to significant differences in wind speed and direction along the narrow river.
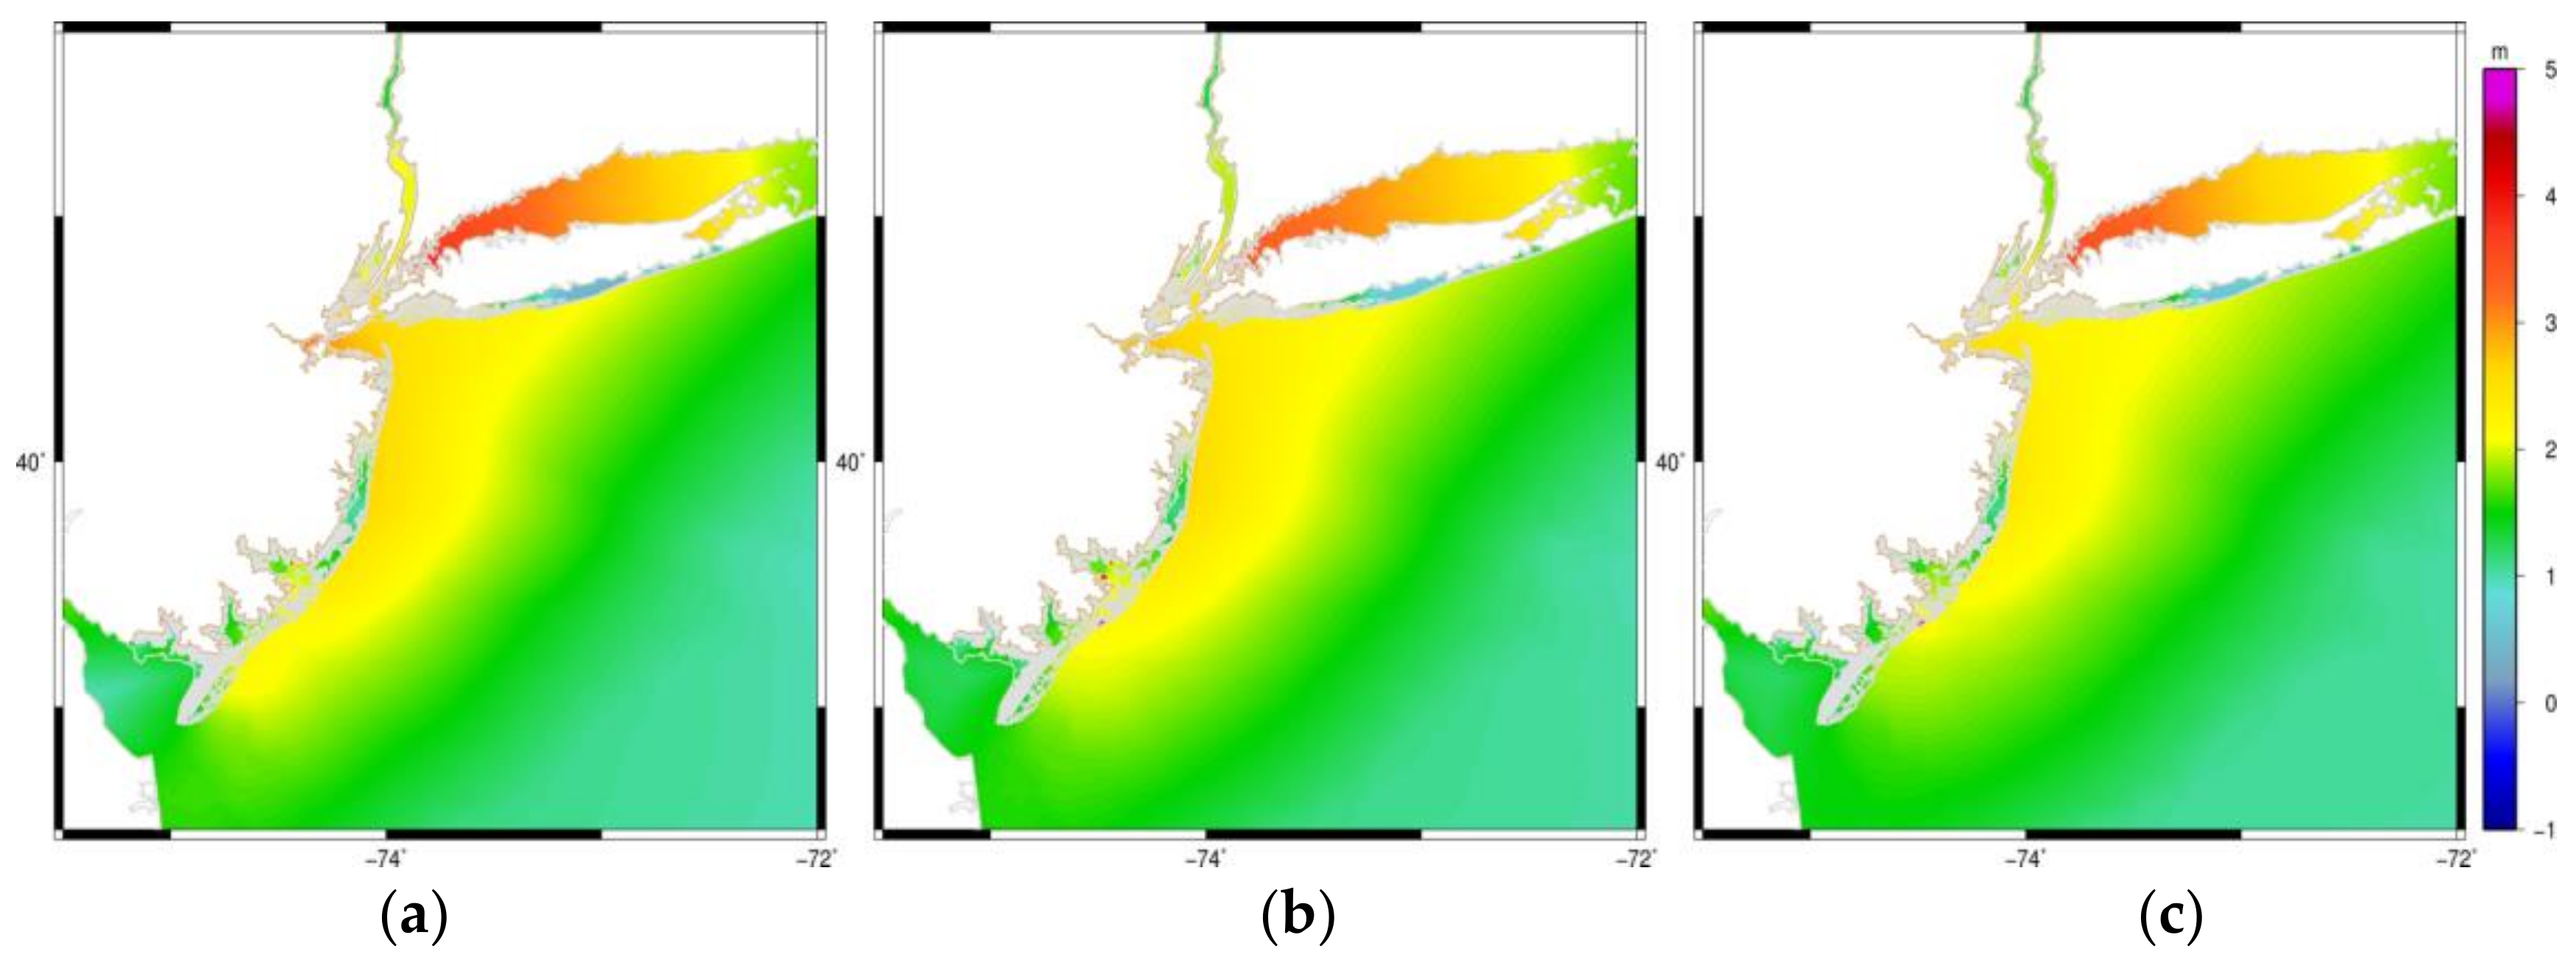
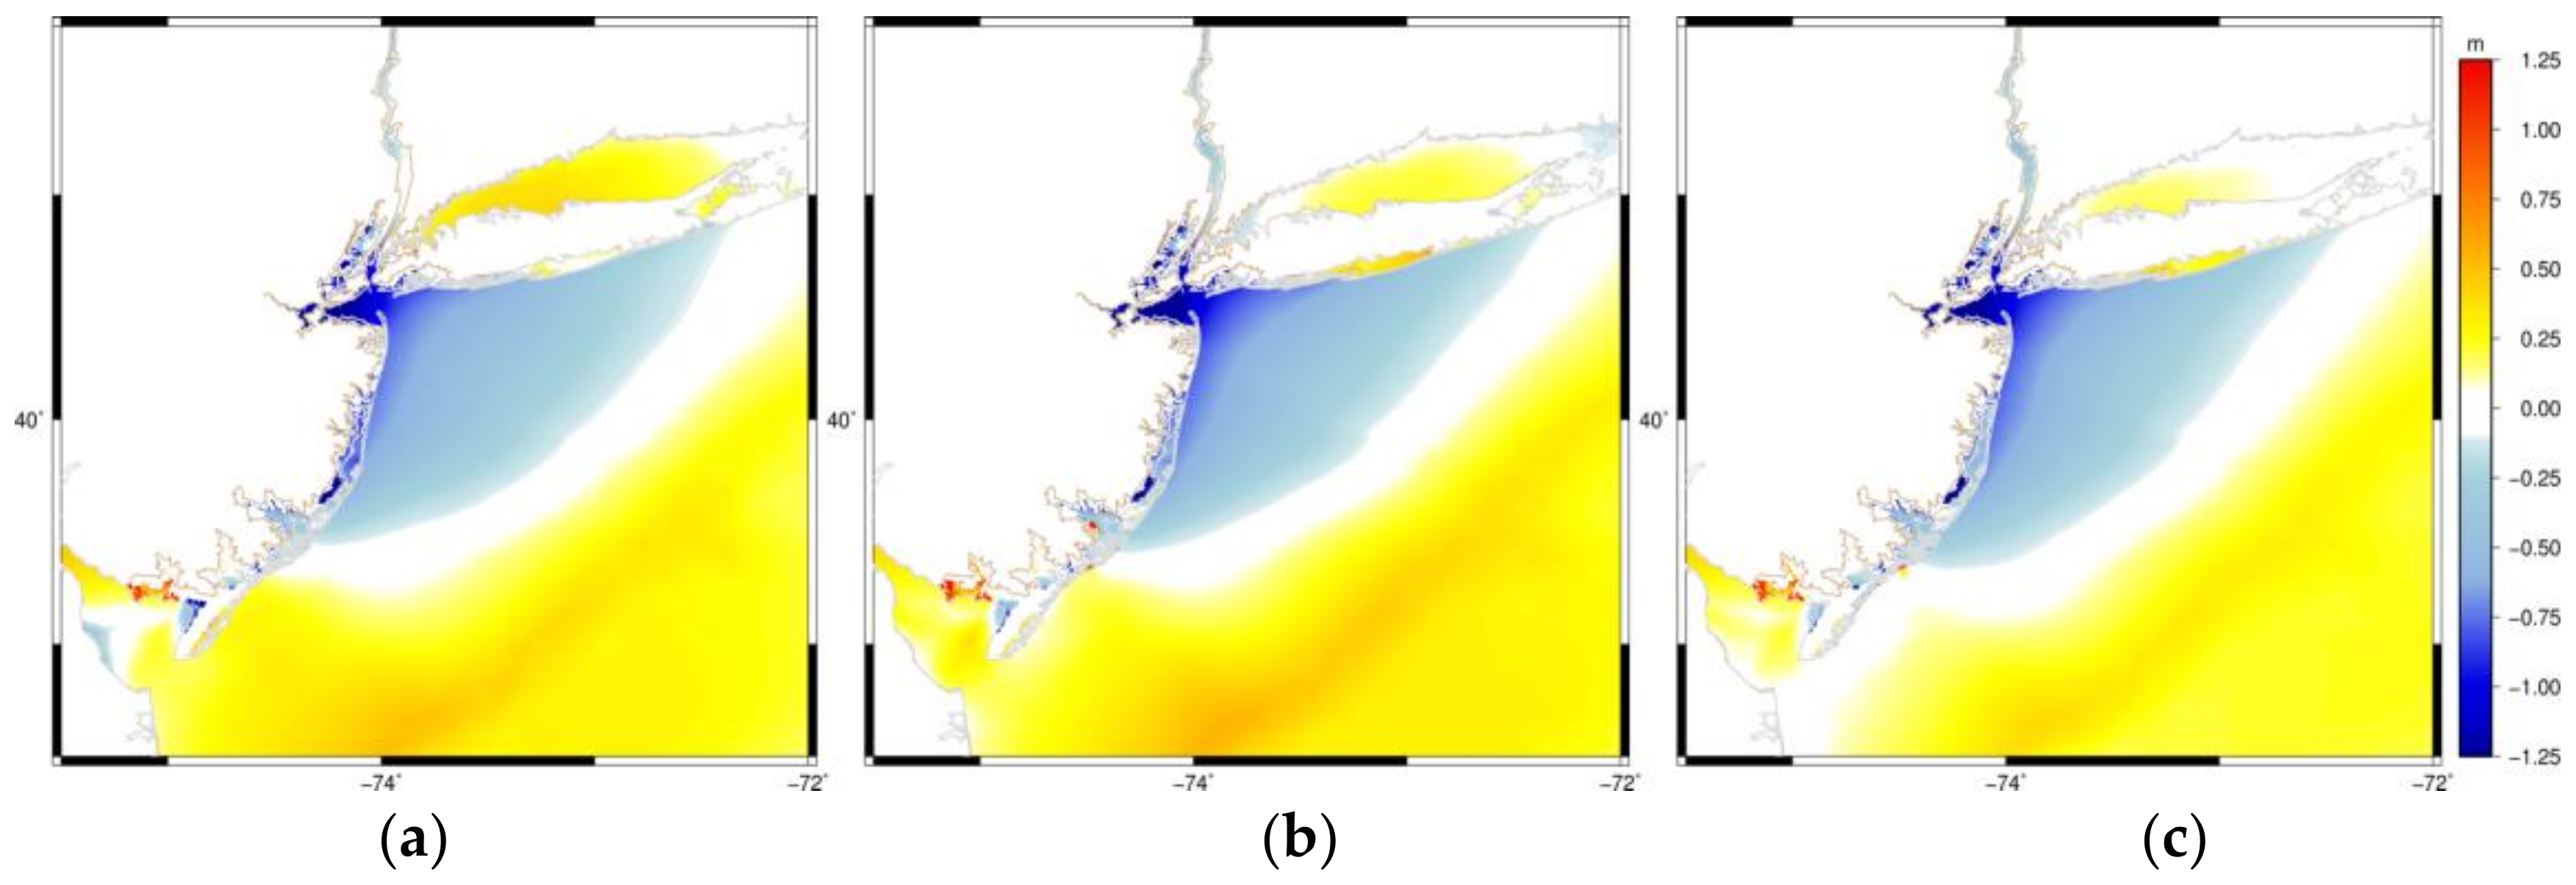
The sensitivity of storm surge estimates to differences in horizontal resolution of the meteorological input data in the form of full wind and pressure fields were also explored. The FWP12 produces similar maximum water elevation estimates when compared to the FWP12-4. Maximum water elevation for FWP12 are generally lower than FWP12-4 in the New York Harbor and Long Island Sound region. When comparing FWP12 to the CTL, differences are reduced in Long Island Sound (
Figure 10b). A similar maximum elevation pattern is observed for FWP4, where maximum elevations in Long Island Sound compare closer to the CTL with differences around 0.3 m (
Figure 10c). However, FWP4 underestimates water elevations in the NY Harbor region by 1.2–2.0 m.
3.5. Inter-Comparison of Simulations with Varying Meteorological Forcing
All simulations exhibit higher storm tide to the right of the TC track, and a lower storm tide estimate to the left of track. This result is expected for TCs with wind maxima on the right-hand side of the storm. The fact that ETCs can exhibit two regions of wind maximum on either side of the track has notable implications for this case. With strong offshore winds to the left of the track, more water is moved offshore, reducing storm surge on the left side of the track. Observations, as well as all model simulations, show this pattern of higher storm tide along the northern NJ coast and Long Island (right of track), and lower estimates along the southern NJ coast (left of track).
Figure 11 shows the difference in modeled maximum water elevation between SCT12-4 and FWP12-4. Results indicate that much of the difference observed between these simulations is within Long Island Sound. In this region, FWP12-4 estimates water elevations that are generally between 0.8 and 1.0 m above the SCT12-4 estimates. Meanwhile, the opposite is observed in the Delaware Bay, where SCT12-4 estimates a storm surge about 0.4 m higher than FWP12-4, pointing to possible differences in wind field extent. Overall, differences were within the 1 m range, with FWP12-4 overestimating maximum elevation in most of the area of study, when compared to SCT12-4. Nevertheless, the track-forced SCT12-4 simulation had higher correlation and lower RSME than the FWP12-4 simulation.
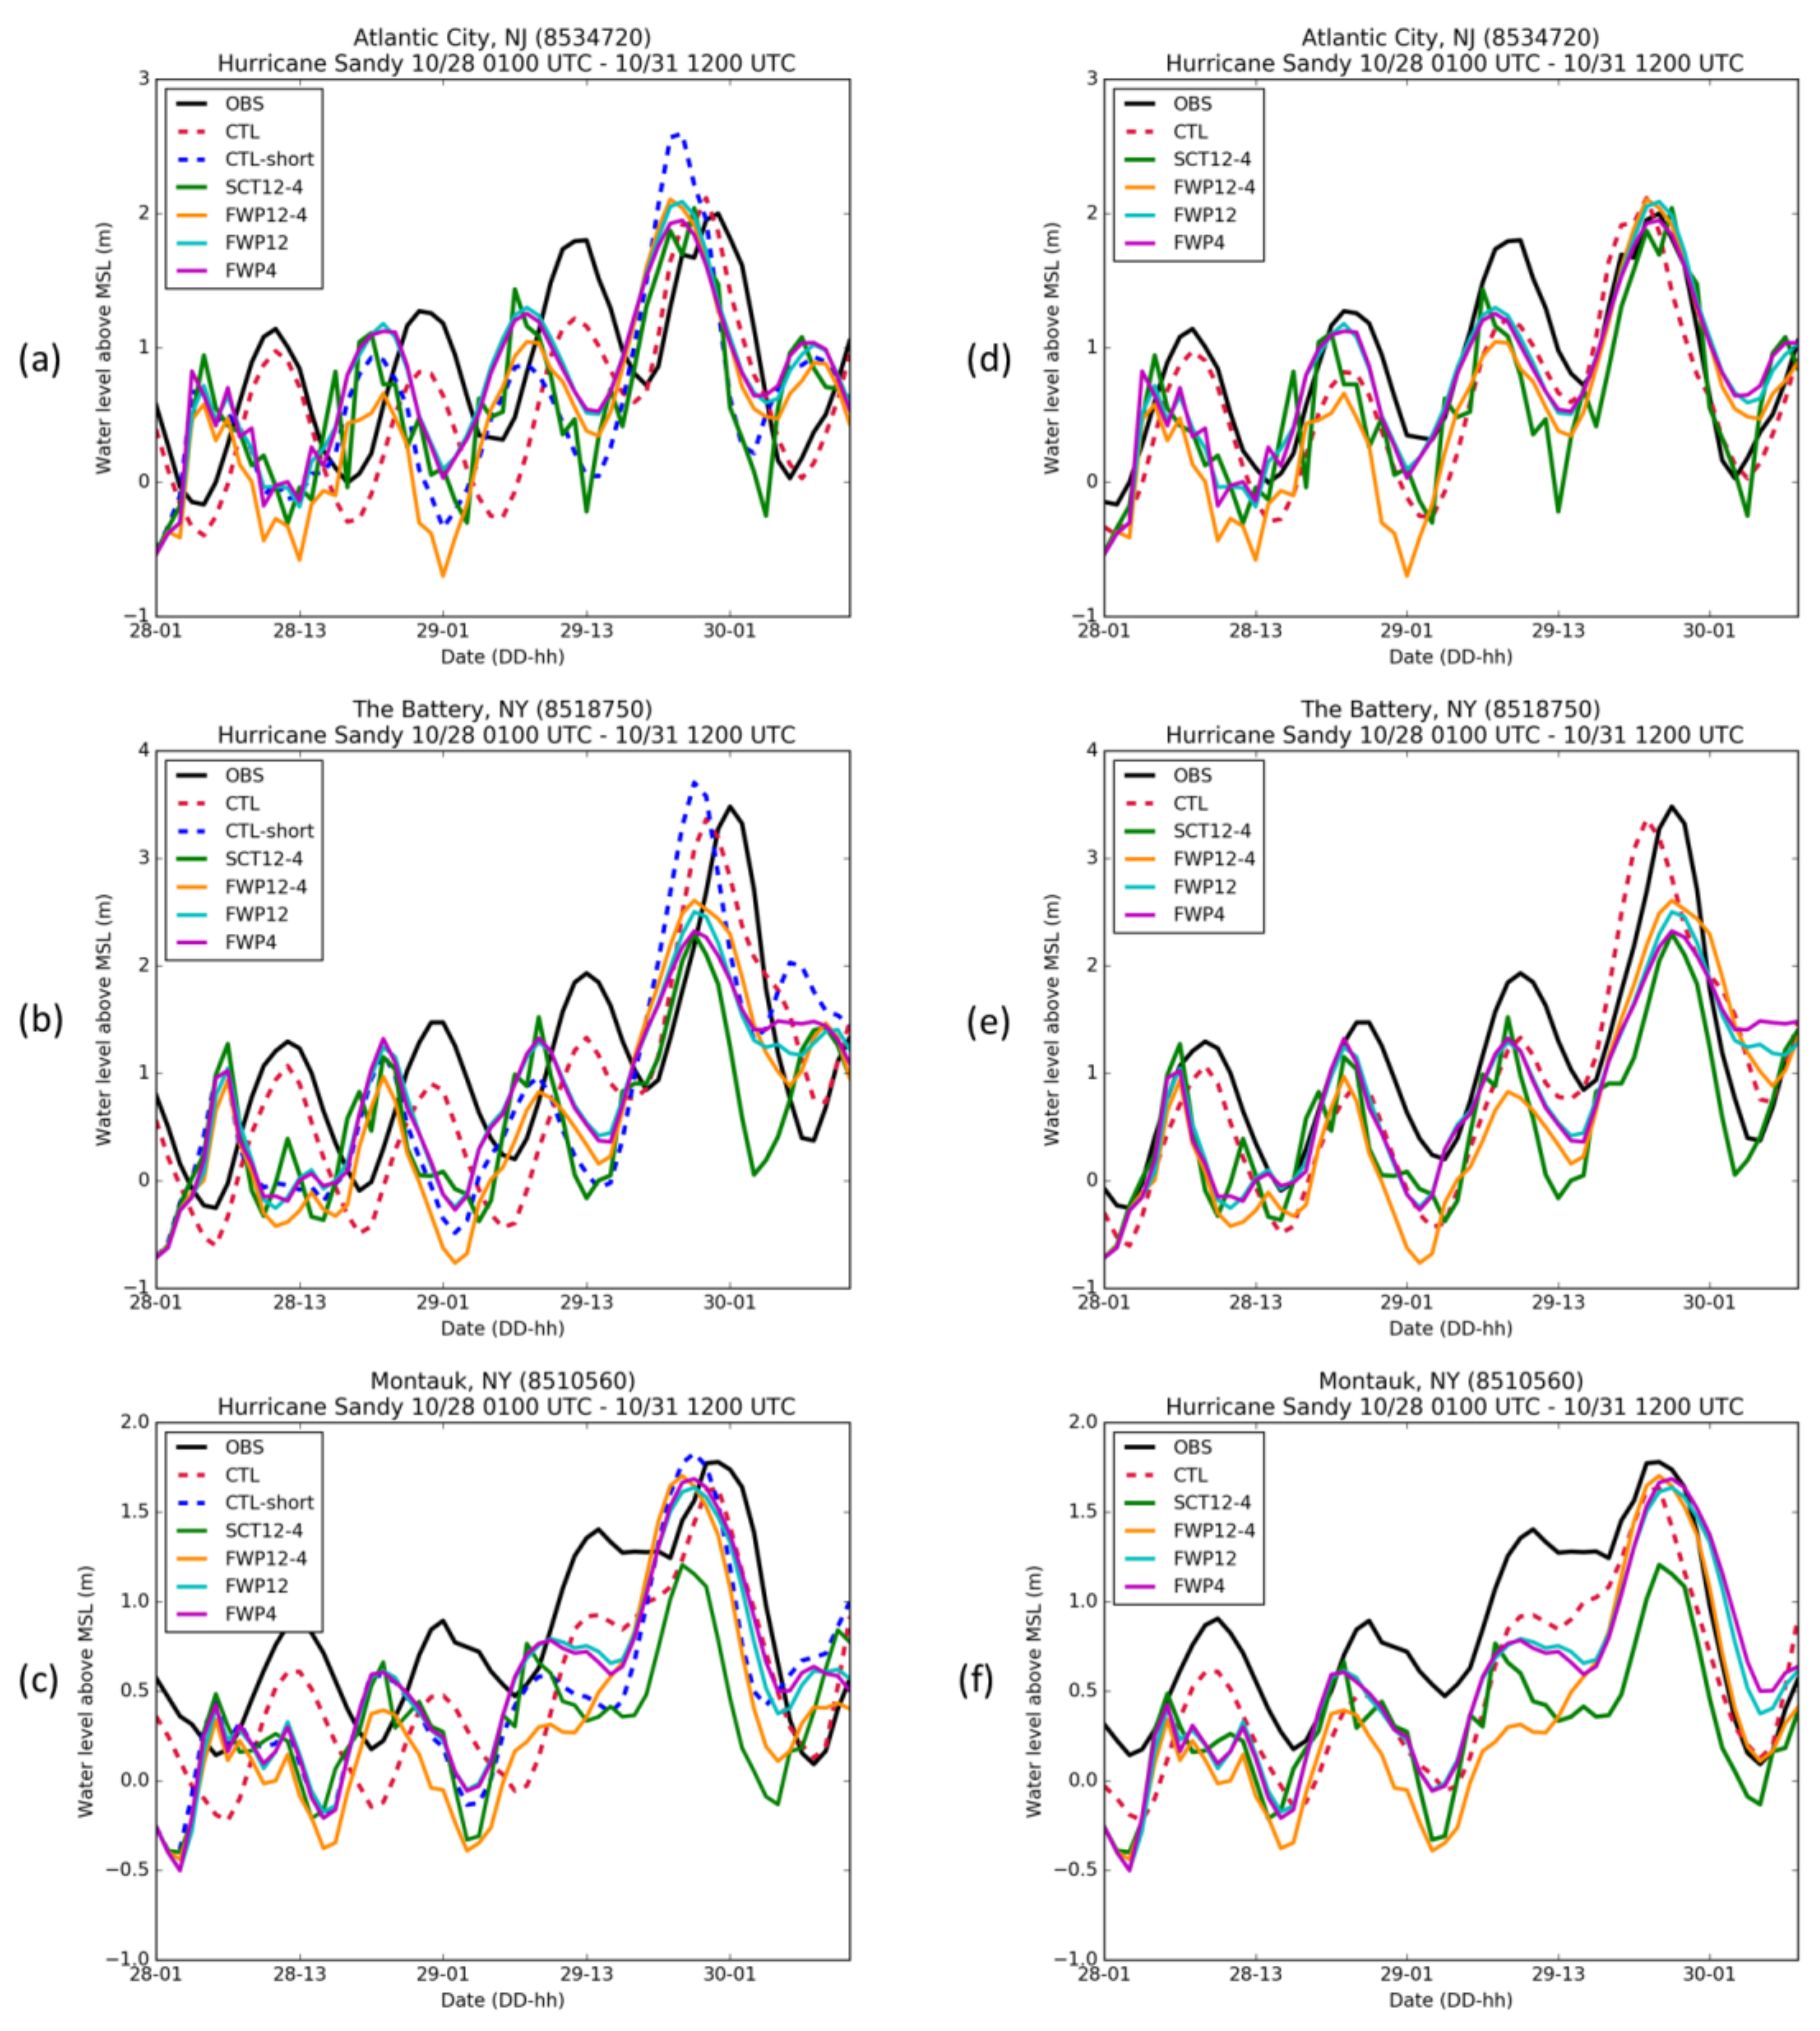
We then compared all simulations to maximum water elevation hourly time series from various NOAA Tides and Currents [
39] stations marked on
Figure 7. Results point to a reduction in the extent of the inundation area, as discussed in results from Akbar et al. [
15]. Out of the seven stations considered, three stations are projected to be dry, one station is projected to dry after initial inundation, and 3 others are wet throughout the entire simulation. These three stations are discussed here and include Atlantic City, NJ station (ID: 8534720), The Battery, NY station (ID: 8518750) and Montauk, NY station (ID: 8510560). Results from the time series comparisons indicate a phase lag between modeled and observed data, with all WRF-ADCIRC simulations peaking 3–4 h prior to observations (
Figure 12a–c). It was hypothesized that the lag in the peak water levels was caused by the difference in the length of the simulations. To test the effect of the differences in initialization time of the meteorological forcing for the case of Hurricane Sandy, an additional simulation was performed with the same configurations as CTL but beginning on 28 October 0000 UTC. The phase lag observed between the WRF-ADCIRC simulations and the station observations of about 3–4 h, was also apparent for the shorter CTL simulation. However, time-series for this simulation indicate that the shorter time configuration causes overestimation of the maximum water elevation at all station locations. This overestimation is thought to be a product of abruptly adding a very large TC as meteorological forcing for ADCIRC (see
Section 3.3).
These results from the shorter CTL simulation therefore indicate sensitivity to the initialization time of the meteorological forcing and points to the cause of the observed phase shift in the WRF-ADCIRC simulations. The shorter CTL simulation was performed for purposes of testing, and henceforth we will only refer to the original CTL simulation initialized on 23 October 0000 UTC. Furthermore, hurricane Sandy was a slow-moving TC and the sensitivity to initialization time could be heightened by this factor, as the effect of the winds acting on the surface and generating surge are longer lasting for slower storms. It would prove interesting to examine other cases and explore this sensitivity of the simulated storm tracks to initialization time.
To further understand the coupled model characteristics, we shifted all the WRF-ADCIRC time series by 3 h (
Figure 12d–f) so that the peak water levels would coincide with observations. This allowed for a better assessment of the magnitude of the water level each simulation could capture. For evaluation purposes the Pearson correlation coefficient (p) and the root mean square error (RMSE) were calculated for each simulation (
Table 4). The coefficients of correlation between shifted modeled and observed water level estimates ranged between 0.76 and 0.93. Although the CTL simulation underestimated the water elevation at all stations, the strongest correlations are observed for this simulation with an average across stations of 0.91. Following the CTL simulation, FWP12 had the highest correlation and lowest RMSE averaging to 0.82 and 0.46 m, respectively, for all stations. Similarly, the FWP4 simulation had an average correlation of 0.78 and average RMSE of 0.49 m. The SCT12-4 simulation had an average correlation of 0.80 for all stations, and generally underestimated the water levels, specifically near the time of landfall.
Investigation of the wind field structure for SCT12-4 shows that the wind radii estimates for the 34-, 50-, and 64-kt winds in the WRF12-4 km simulation are underestimated in comparison to wind structure data from the NHC-BT. These results highlight modeled storm surge sensitivity to wind structure and radii of maximum winds. The use of a track dataset, such as in SCT12-4, would rely on having accurate and consistent wind radii estimates. We should keep in mind that the NHC-BT data set is a post-storm analysis that uses various observational methods for assessment and reanalysis. On the contrary, the tracking algorithm used in this study to obtain track and wind radii estimates from the WRF simulation is based solely on the WRF model output. The incorporation of observations, as in NHC-BT, is omitted in SCT12-4 and can thus contribute to the errors discussed.
The FWP12-4 simulation usually estimated peaks that were lower in magnitude than both track-forced simulations: CTL and SCT12-4. However, near the time of landfall this pattern was altered. Although the water elevations for FWP12-4 remained lower than station observations, this simulation was able to capture the observed peak better than the SCT12-4 in all three stations (
Figure 12d–f). Consideration should be given to the WRF 12-4 km simulation configuration. Near the time of landfall, the high-resolution vortex following nest (4 km) is positioned over the region where the stations are located. This pattern and the unexpected result of lower error in the SCT12-4 simulation implied that it may be a construct of including a moving nest in the WRF simulations, and of possible model grid interpolation problems. This hypothesis is further validated when we consider that the effect is minimized in Montauk station, which is the farthest station from the center of the TC and of the high-resolution domain.
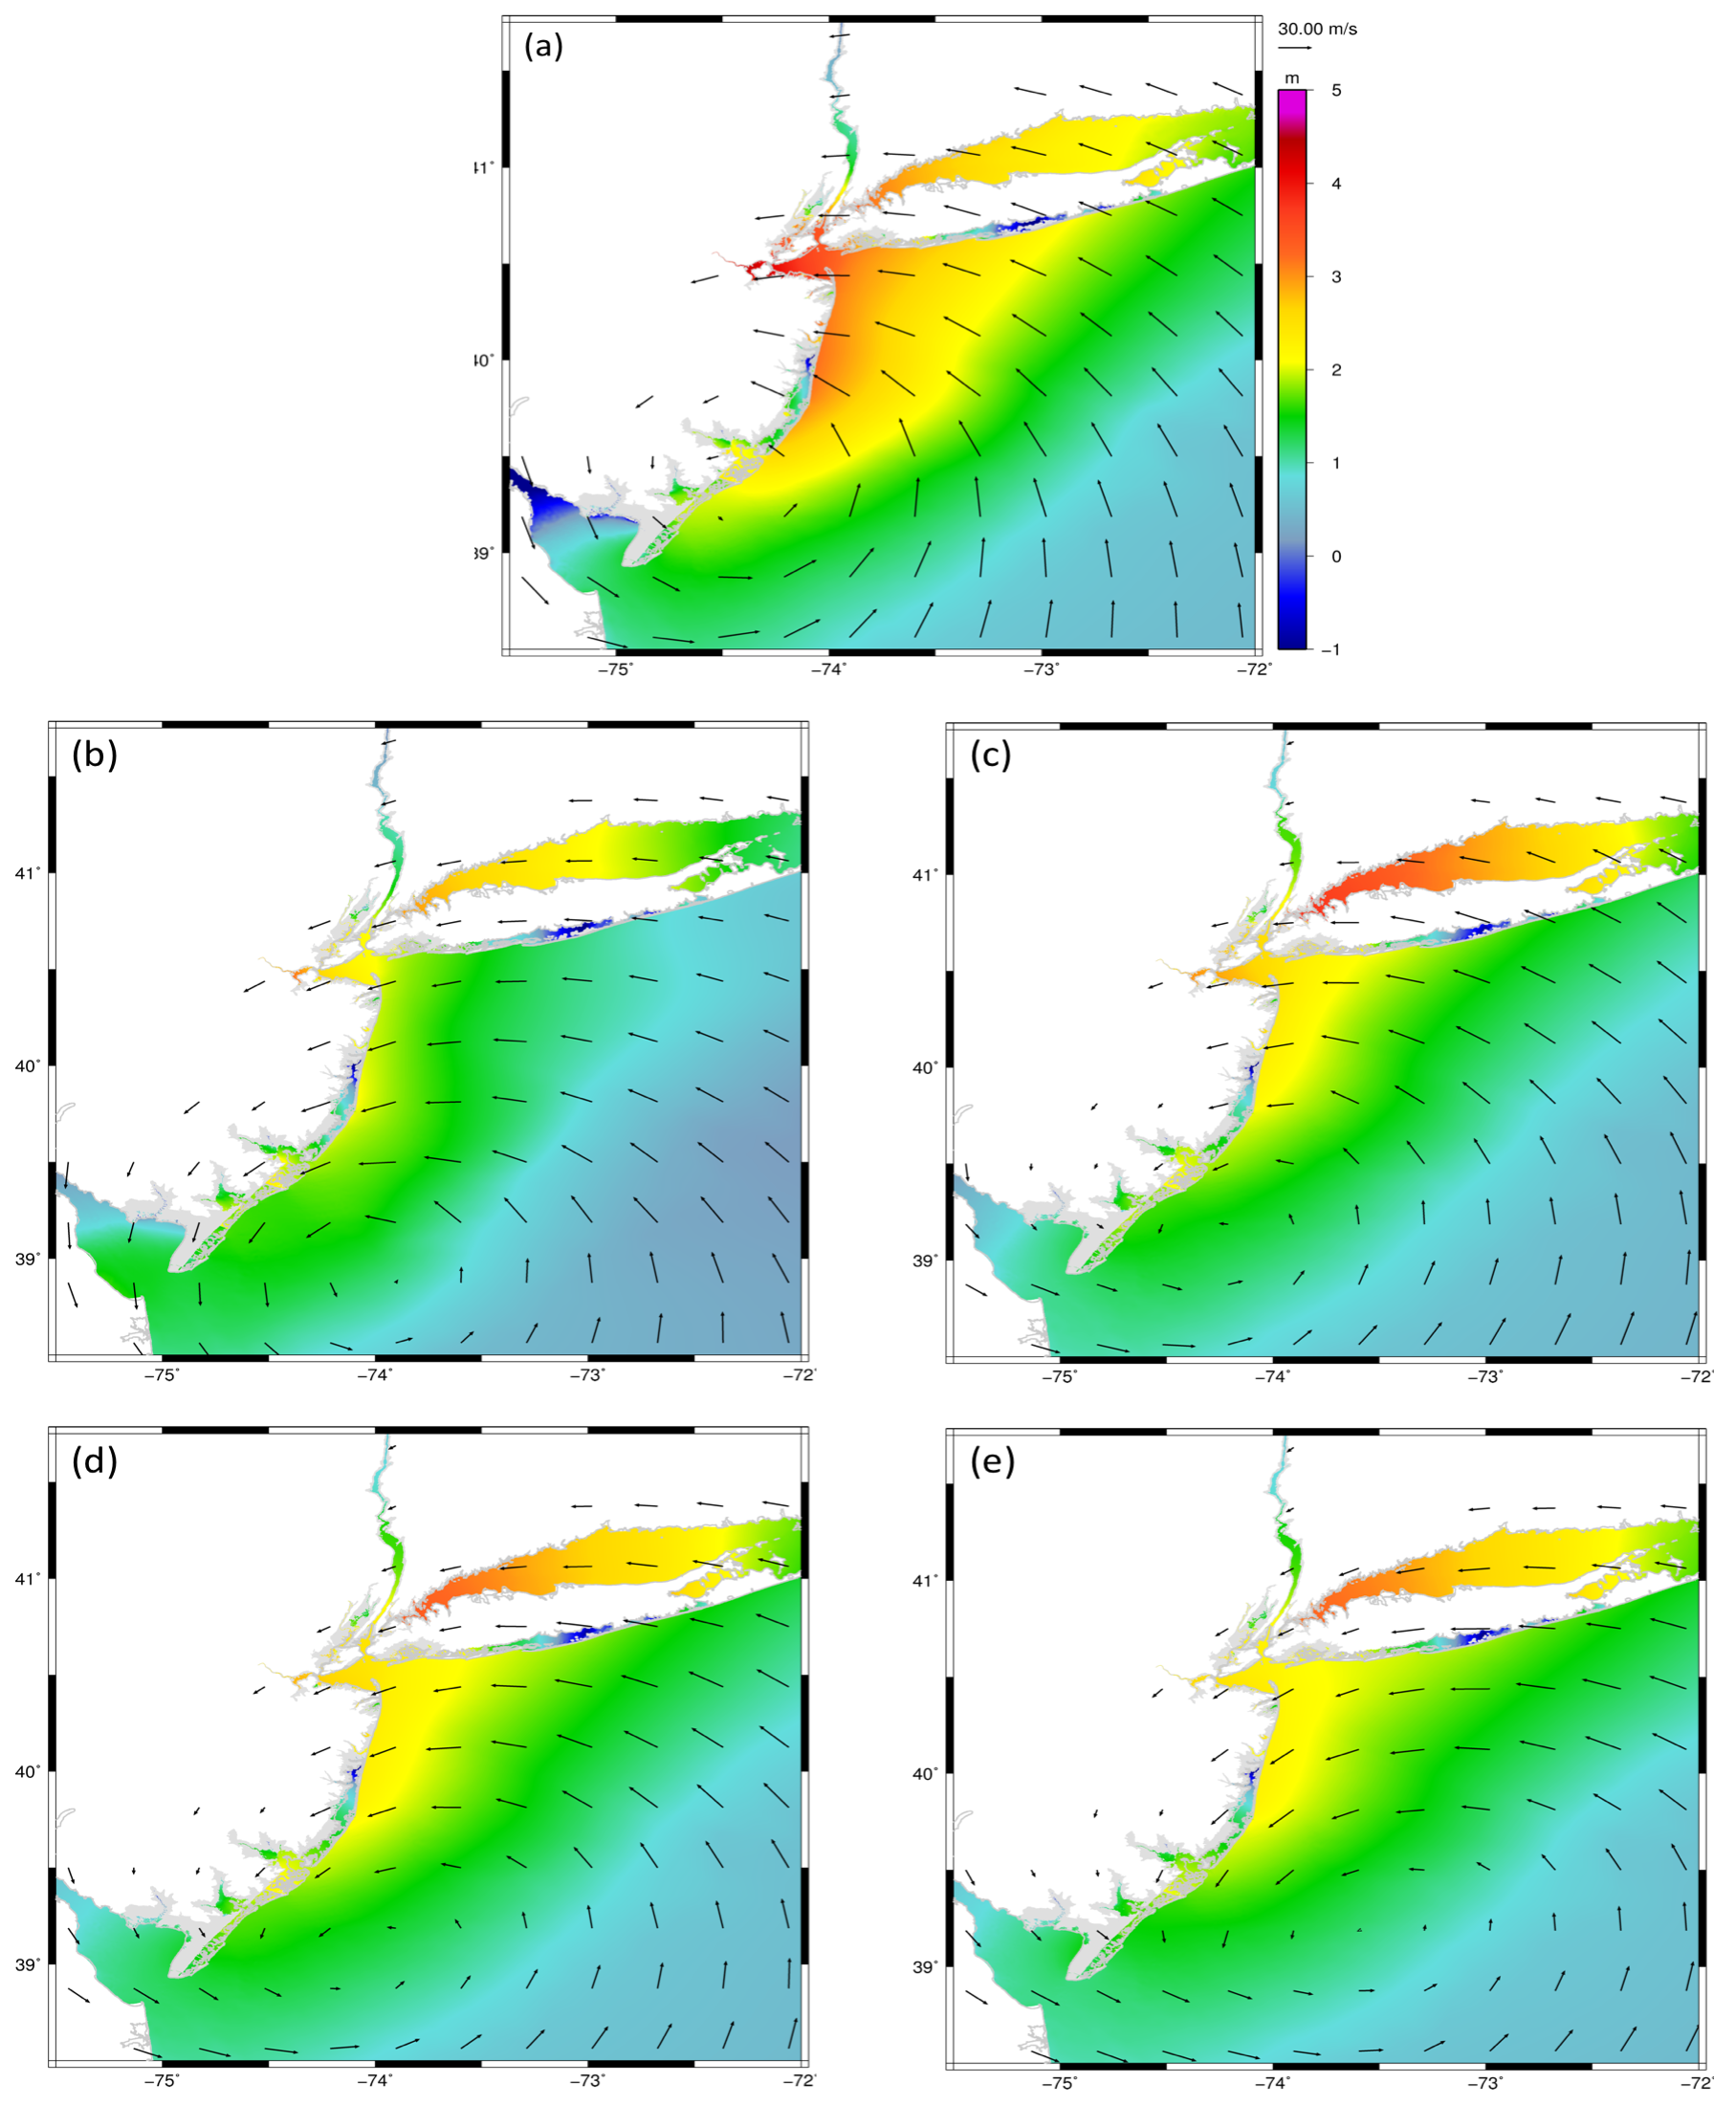
Figure 13 shows the wind vector output from ADCIRC for the CTL, SCT12-4, FWP12-4, FWP12 and FWP4 simulations for 29 October 2300 UTC. At the time of landfall, the CTL simulation shows the highest water level estimates in the NY Harbor among all five simulations (
Figure 13a). The WRF-ADCIRC simulations exhibit lower water elevation estimates at landfall. In the CTL simulation, strong winds are angled perpendicular to the coast in the direction of the New York Harbor area. This is not the case for the WRF-ADCIRC simulations, where a combination of weaker northeasterly winds prevails in the New York Harbor coastal region. Results in
Figure 13 also highlight the discrepancy in landfall timing, where the simulated TCs in the WRF-ADCIRC simulations make landfall after the observed time. This effect is more pronounced for the FWP4 simulation as observed in
Figure 13e. Another important result illustrated in
Figure 13 is the depiction of weaker winds over land for all the WRF-ADCIRC simulations. This difference in the wind field structure is not observed for CTL.
4. Discussion
Accurate meteorological data is a critical factor in effectively capturing storm surge impacts. The simulated minimum pressure and winds from the WRF simulations corresponded well with station observations for Hurricane Sandy. However, discrepancies in wind speed were seen in some meteorological stations. The station time-series analysis however, presented some limitations. The corresponding station locations in WRF are given by the closest grid point to the station, and thus our results are not precise point-to-point comparisons. Errors in distance between the WRF station location with respect to their actual location ranged between 3.3 and 6.4 km for the New York Harbor Entrance and the Bergen Point stations.
Much of the error in the coupled WRF-ADCIRC simulations can be attributed to differences in the wind representation in each of the models. In terms of the maximum water elevation, generally, higher values are observed in areas right of the storm track, as is expected for TCs given their characteristic right-of-track wind maximum pushing water ashore. ETCs however, as is the case for Hurricane Sandy, can exhibit wind maxima on both sides of the track. Given the angle at which Hurricane Sandy approached the coast near landfall, wind maxima to the left of the track forces more water away from the coast reducing the observed storm surge in the region south of landfall. This was the case for the WRF simulated TCs. Moreover, in the CTL simulation, as it was observed for Hurricane Sandy, the perpendicular direction of the winds on the right of the track, is allowing more water to be pushed onshore. As illustrated in
Figure 13, this is not the case for the WRF-ADCIRC simulations. These results motivate the need to understand what the storm surge response would have been if the winds were to be weaker or stronger and directed in alternative angles. The response of storm surge to varying TC characteristics is the subject of ongoing research.
Results from our time-series comparisons indicate a phase lag between modeled and observed data, with all WRF-ADCIRC simulations peaking 3–4 h prior to observations (
Figure 12a–c). This result is not uncommon, and it has been shown to occur in other studies. For example, Colle et al. [
5], showed that in their WRF ensemble experiment, some members predicted peak storm surge up to 12 h too soon. In our case, the WRF simulations have a lag of their own with maximum winds peaking about 6 h prior to observations (
Section 3.1). Part of this error is expected to propagate into the ADCIRC storm surge estimates. Moreover, Akbar et al. [
15] discussed the effect of bottom friction as another potential source of error in storm surge simulations. Their results show early peak arrival for simulations with decreased bottom friction parameter and the opposite effect for increased bottom friction. Results from the CTL simulation, forced with NHC-BT data, do not exhibit the shift in peak arrival. It is worth highlighting the differences in initialization time of the meteorological forcing between the CTL simulation and the WRF-ADCIRC simulations. The CTL simulation was initialized on 23 October 0000 UTC, at the start of the NHC-BT record. To minimize errors in the simulated storm the WRF simulations were initialized 5 days after on 28 October 0000 UTC, and the atmospheric forcing in ADCIRC thus began at that time. Although the time evolution of the storm is important to capture the finer storm surge details at landfall, the track errors for simulations initialized prior to the chosen date had a left-of-track bias, as was also found by Galarneau et al. [
19]. Studies have shown that for tracks that make landfall within 150 km of the observed landfall location, storm surge forecasts can be underestimated by 0.5–1.0 m [
5]. Thus, we selected the configuration that minimized this error at landfall and best depicted the characteristics of Hurricane Sandy. In our simulations, the choice of initialization time seems to be the biggest factor influencing the shift in peak surge arrival.
Based on our results, we would rank (in decreasing order) the performance of our models as follows: CTL, FWP12, FWP4, SCT12-4 and FWP12-4. The time-series analysis showed that the CTL simulation forced with NHC-BT data compared well with observations, indicating a suitable ADCIRC model setup. This implies that we can reproduce accurate storm tide estimates with the best possible meteorological data available using a simplified parametric model. Yin et al. [
33], found similar results in their storm surge assessment of Hurricane Sandy. Results showed the effectiveness of their simulation in accurately predicting the timing and magnitude of the peak surge. However, some discrepancies were observed before and after the peak surge, which they have attributed to the use of a simplified parametric vortex model for their wind field representation.
Time-series results from the WRF-ADCIRC simulations show discrepancies when compared to CTL. Discrepancies were more evident at The Battery, NY station where none of the WRF-ADCIRC simulations could accurately capture the magnitude of the peak storm surge (
Figure 12e). Colle et al. [
5], showed similar results of underestimated water levels for various of their WRF ensemble simulations. However, their control simulation which is most comparable in terms of configuration to our FWP12-4 simulation, captured the peak surge at The Battery. It overestimated the observed water elevations by 0.20 m. An important distinction between both studies is the implementation of wave coupling in their assessment, which has been neglected for the purposes of this study.
Statistical results in
Table 4 indicate that the track-forced SCT12-4 simulation has a higher average correlation coefficient and lower average RMSE than the FWP12-4 simulation. However, simulations with meteorological forcing in the form of wind and pressure fields from full-physics atmospheric models are assumed to contribute less error than track-forced simulations that make use of parametric wind models. Parametric wind models can have between 10% and 20% higher random error [
2], an assumption based on the fact that these do not account for details in the wind structure as atmospheric models do. Parametric wind models also fail to capture interactions with topography and TC dynamics and feedbacks, which are important in storm surge modeling. The FWP12 and FWP4 simulations show improvement over the track-based simulations, which leads us to conclude that the improvement of SCT12-4 over FWP12-4 is a construct of including a vortex-following nest in the WRF 12-4 km simulation. The sensitivity of storm surge simulations to atmospheric forcing resolution in the FWP simulations was also investigated. When comparing the FWP simulations, results indicate that for our case the coarser horizontal resolution simulation (WRF 12 km) is sufficient to forecast storm surge estimates and there is no need for increased resolution.
Although storm surge predictions from CTL can be considered as a standard for the real case, the values might be an overestimate, given the lack of interaction with topography acting to weaken the storm. In their study, Dietrich et al. [
10] found similar results for simulations forced with NHC advisories and implemented within GAHM. The maximum wind speed for their simulation remained relatively constant at landfall and retained a larger wind field extent when compared to HWIND. The larger wind field caused higher water elevations for the track-based simulation. The weakening of winds caused by the interaction with land and topography, is evident in the FWP12-4 simulation, as shown by decreased wind speed over land in
Figure 13c–d compared to CTL (
Figure 13a). The methodology of directly extracting the TC properties used by the parametric models from the full-physics models can, to a certain degree, reduce this limitation by adding to the realism and complexity of the TC wind field. Moreover, these results point to the utility of using full physics models for forecasting storm surge. It implicitly accounts for weakening of winds and distortion of the wind field by the interaction with land.
The results of this study are not uncommon. Bennett and Mulligan [
17] found that a 3D atmospheric model was more suitable for hindcasting the waves of Hurricane Sandy when compared to the Holland Model and the GAHM. However, one noticeable difference to our study is their use of an atmospheric model with data assimilation. A similar study by Dietrich et al. [
10] highlighted the value in using parametric vortex models for hindcasting purposes but encouraged the use of full-physics coupled models for storm surge forecasting of Hurricane Isaac. Although results have been similar for various cases and geographic regions, the studies performed are location-dependent, thus prompting the need for a systematic study of the effect in the choice of atmospheric forcing.
5. Conclusions
In this study, we compare four WRF-ADCIRC simulations to determine the best choice in meteorological forcing for storm surge studies. For real-time forecasting of storm surge or in the absence of a best track data set, it is important to identify a suitable model configuration that can provide accurate atmospheric and surge forecasts. In this work, we explore ways of improving this modeling framework.
One of the simulations consisted of using track data estimated from a full-physics WRF 12-4 km simulation as meteorological forcing for the ADCIRC model. The GAHM was then implemented within the ADCIRC model to determine the wind field in the domain. The remaining three simulations directly used the full wind and pressure field output from the full-physics WRF 12-4 km, WRF 12 km and WRF 4 km simulations as meteorological forcing. All simulations were compared to a control run using the NHC-BT data for Hurricane Sandy.
Results indicate that our initial choice of meteorological forcing for estimating storm surge would depend on data availability. A best track data set appears to be the best meteorological forcing option for our configuration of the ADCIRC model. However, when a best track is not available, our results would indicate that we could primarily rely on using full wind and pressure field output from a 12 km resolution WRF simulation.
The results of this study have encouraged the authors to further understand the sensitivity of storm surge impacts to atmospheric forcing and to varying storm characteristics. Ongoing research focuses on the sensitivity of storm surge to the track, intensity, and size of tropical cyclones in a coupled atmosphere, storm surge and wave modeling framework.

 ,
, 


