1. Introduction
Trimarans are multihull ships that include a main hull and two small side hulls with cross-deck structure. Since they have better seagoing performance and can provide wider deck area compared to monohull vessels, trimarans have received considerable attention [
1,
2,
3]. Due to their unique configuration trimarans experience severe structural loads and the fatigue problem of the cross-deck structure is particularly serious [
4]. Therefore, the fatigue strength assessment is vital for trimaran design.
Fatigue is one of the most significant failure modes for ship structures [
5]. Ships are prone to fatigue due to high-cycle fatigue loads, which are predominantly caused by varying loading conditions and waves [
6]. The
curve approach is widely used for ship structure fatigue assessment, based on experimental fatigue test data along with the Miner linear cumulative damage criteria. The
curve approach can be further subdivided into the simplified method and the spectral method [
7].
In the simplified method, the ship’s structural element long-term stress range distribution is assumed to follow the Weibull probability distribution [
8]. The Weibull scale parameter is obtained from the stress range, corresponding to exceeding a certain probability, and the shape parameter is usually obtained through empirical formulas. Then, choosing basic design
curves and according to the linear cumulative damage theory, the fatigue damage can be obtained [
9,
10].
The spectral method usually involves direct wave load calculation in the frequency domain combined with structure response analysis to establish complex stress transfer functions [
11]. On the assumption of a narrow band, the Rayleigh probability density function is used to describe the short-term stress range distribution. It can be obtained by using various orders of the stress response’s spectral moments. To reduce conservatism caused by narrow band approximation, the wide band cycle-counting correction factor is calculated using the zero-up crossing frequency and the spectral bandwidth parameter of the stress response [
12]. Then, adding all the short-term damage over all applicable sea states, the structural element’s total fatigue damage in a specific wave scatter diagram is calculated [
13]. As it considers different sea states, as well as their probabilities of occurrence, the spectral method is considered the most reliable method for a ship structure’s fatigue strength assessment. This method has been investigated by many scholars and has been widely applied [
14,
15,
16]. Kukkanen et al. applied the spectral method to marine structure fatigue strength assessment [
17]. In their study, spectral fatigue analyses were applied for the hatch cover bearing pad of a Panamax container ship. Only the vertical wave bending moment was considered as cyclic loading, which induced stresses on the bearing pad. When a ship is sailing, it encounters various wave headings and thus will be subjected to vertical and horizontal wave bending moments. Consequently, the stresses induced by these moments should all be considered in the ship’s structural details spectral fatigue analysis. Xue et al. completed a spectral fatigue analysis for the oil tankers’ and container ships’ longitudinal stiffeners and considered the combined effects of vertical as well as horizontal hull girder bending moments [
18].
Due to the unique cross-deck structure, a significant difference exists between trimaran and monohull ships, so splitting moment and transverse torsional moment should also be considered [
4]. Several investigators analyzed the motions of trimarans [
1,
2,
3], but few have studied fatigue strength problems. Peng et al. performed coarse-meshed global finite element (FE) analysis of trimaran to identify hot spots and computed fatigue damage using spectral fatigue analysis in conjunction with the hot spot stress approach [
19]. However, they did not consider the factors influencing spectral analysis, such as the wave scatter diagram and the distribution coefficient of wave heading.
To avoid fatigue, well-established rules are available for designing welded structures. However, some practical difficulties require solving when applying these rules to complex welded structures. A critical problem in fatigue assessment involves selecting suitable
curves. In particular, the
curves in the rules are obtained from fatigue testing of standard specimens or typical welded joint specimens. For the complex cross-deck structure of trimaran, no suitable curve is available in the existing rules. Therefore, to better evaluate fatigue strength, it is necessary to study the
curve characteristics of the trimaran cross-deck structure using full-scale model tests. Some scholars have used the full-scale model fatigue test method to obtain the
curves of complex ship structures. Lotsberg et al. chose the side longitudinals of a floating production storage and offloading unit (FPSO) as a full-scale model and designed five test specimens to perform a full-scale fatigue test at the Det Norske Veritas (DNV)’s structural laboratories in Oslo [
20]. The fatigue test results were compared with the
curve in the rules, then some suggestions were recommended for the design of FPSO plated structures, which are subjected to dynamic loading. Fricke et al. selected two typical ship structures for full-scale fatigue test [
21]. Three models of web frame corners typical for ro-ro ships were tested under constant amplitude loading and two models of the intersection between transverse web frames and longitudinals for container ships were tested under variable amplitude loading. Compared with numerical analyses, some conclusions were provided. Ren et al. analyzed an aluminum alloy ship’s typical structural detail with various configurations of bracket and/or stiffener, designed the optimal component, and completed fatigue testing of the panels with typical detail [
22]. According to the test data, they established the
curve of the aluminum alloy ship’s typical detail. These full-scale model fatigue tests have improved the understanding of the fatigue behavior of complex welded structures.
In the present study, to investigate the fatigue behavior of cross-deck structural details, a stochastic spectral fatigue analysis is adopted for fatigue assessment of a trimaran, which considers various factors influencing spectral analysis. Full-scale model fatigue testing is completed to investigate the fatigue behavior of cross-deck structural details and to provide curve data. Then, the effects of the factors influencing the spectral fatigue analysis of the trimaran cross-deck structural details are discussed.
4. Experiments
Selecting suitable curves is a critical problem for the fatigue assessment of ship structures. The curves in the rules are obtained from fatigue testing of standard specimens or typical welded joint specimens. For the complex cross-deck structure of a trimaran, it is more reasonable to study the curve characteristic of the trimaran cross-deck structure using full-scale model tests. The curves are usually obtained from group tests, which require many specimens. The mean values and standard deviations of fatigue lives, under different stress range levels, can be obtained from the fatigue test data. Given the limitation of conditions, it is not allowed that a lot of full-scale models are used for fatigue testing. In this paper, the maximum likelihood method is used for a limited number of full-scale fatigue tests to achieve the curve characteristic, which is based on some simplified assumptions.
4.1. Curve
Experimental curves are defined by their mean fatigue lives and standard deviation. A mean curve means that the structural detail will fail with a probability level of 50% after loading cycles for a stress level . The curve, considered in the present procedure, represents two standard deviations below the mean lines in the field of marine engineering, which corresponds to a survival probability of 97.7%.
Fatigue life is assumed to be log-normal distribution at all fatigue stress range levels in the high-cycle fatigue region. In the double logarithmic coordinates, the mean
curve and
curve are all linear. Equation (8) can be expressed as follows:
where
and
are constants obtained from the fatigue test data, which correspond to survival probabilities of 50% and 97.7%, respectively.
4.2. Maximum Likelihood Method
When the fatigue life is assumed to be log-normal distribution at a certain fatigue stress range level in the high-cycle fatigue region, we can estimate the mean curve and curve using the maximum likelihood method. In the maximum likelihood method, we only need to select several different stress range levels and complete each specimen’s fatigue testing at each stress range level. For this full-scale model test, this method is appropriate for obtaining the mean curve and curve with certain accuracy using fewer samples.
4.2.1. Maximum Likelihood Method of Mean Curve
When using the maximum likelihood method, the mean value of logarithmic fatigue life
is assumed in Equation (17). The variance of logarithmic fatigue life
is assumed to be a constant under any stress range, and it will not change when varying
.
The fatigue lives are tested under the stress ranges , then a sample of the data and is obtained. The logarithmic value of the data can be expressed as ,,…,. Then, the parameters and can be estimated by using this sample.
Given the limited test data, the slope
of the mean
curve can be determined by referring to the fatigue test results of similar structures. The statistical results of a welded structure’s fatigue tests show that the slope
of the mean
curve is close to 3 [
7]. So, the value of slope
is determined to be 3 in this study. Based on the above, only the parameter
needs to be estimated using the sample.
Under the assumption of logarithmic normal distribution, the logarithmic fatigue life
follows normal distribution for any data point. The mean value of logarithmic fatigue life
is obtained from Equation (17) as follows:
The variance of logarithmic fatigue life
can be expressed as follows:
Since the logarithmic fatigue lives
are mutually independent, the likelihood function can be expressed as follows:
According to the maximum likelihood method, the estimated value of parameter
can be obtained from
4.2.2. Maximum Likelihood Method of Curve
Substituting the fatigue test data
,
, …,
into Equation (15), we obtain a set of
, as follows:
Considering this set of
as a sample of
, the estimated value of
can be obtained using this sample:
where
is the standard normal bias corresponding to survival rate
and the value of
is 2;
is the standard deviation of
. Since the number of specimens is limited, for the value of the standard deviation
, we refer to the rules of the classification society. Due to only conceptual guidelines being provided for fatigue analysis in the LR rules, the DNV rule is chosen in this paper. The value of the standard deviation is determined to be 0.2 for this fatigue test [
8].
Substituting Equation (23) into Equation (16), the
curve of survival rate
= 97.7% is as follows:
4.3. Full-Scale Model Design
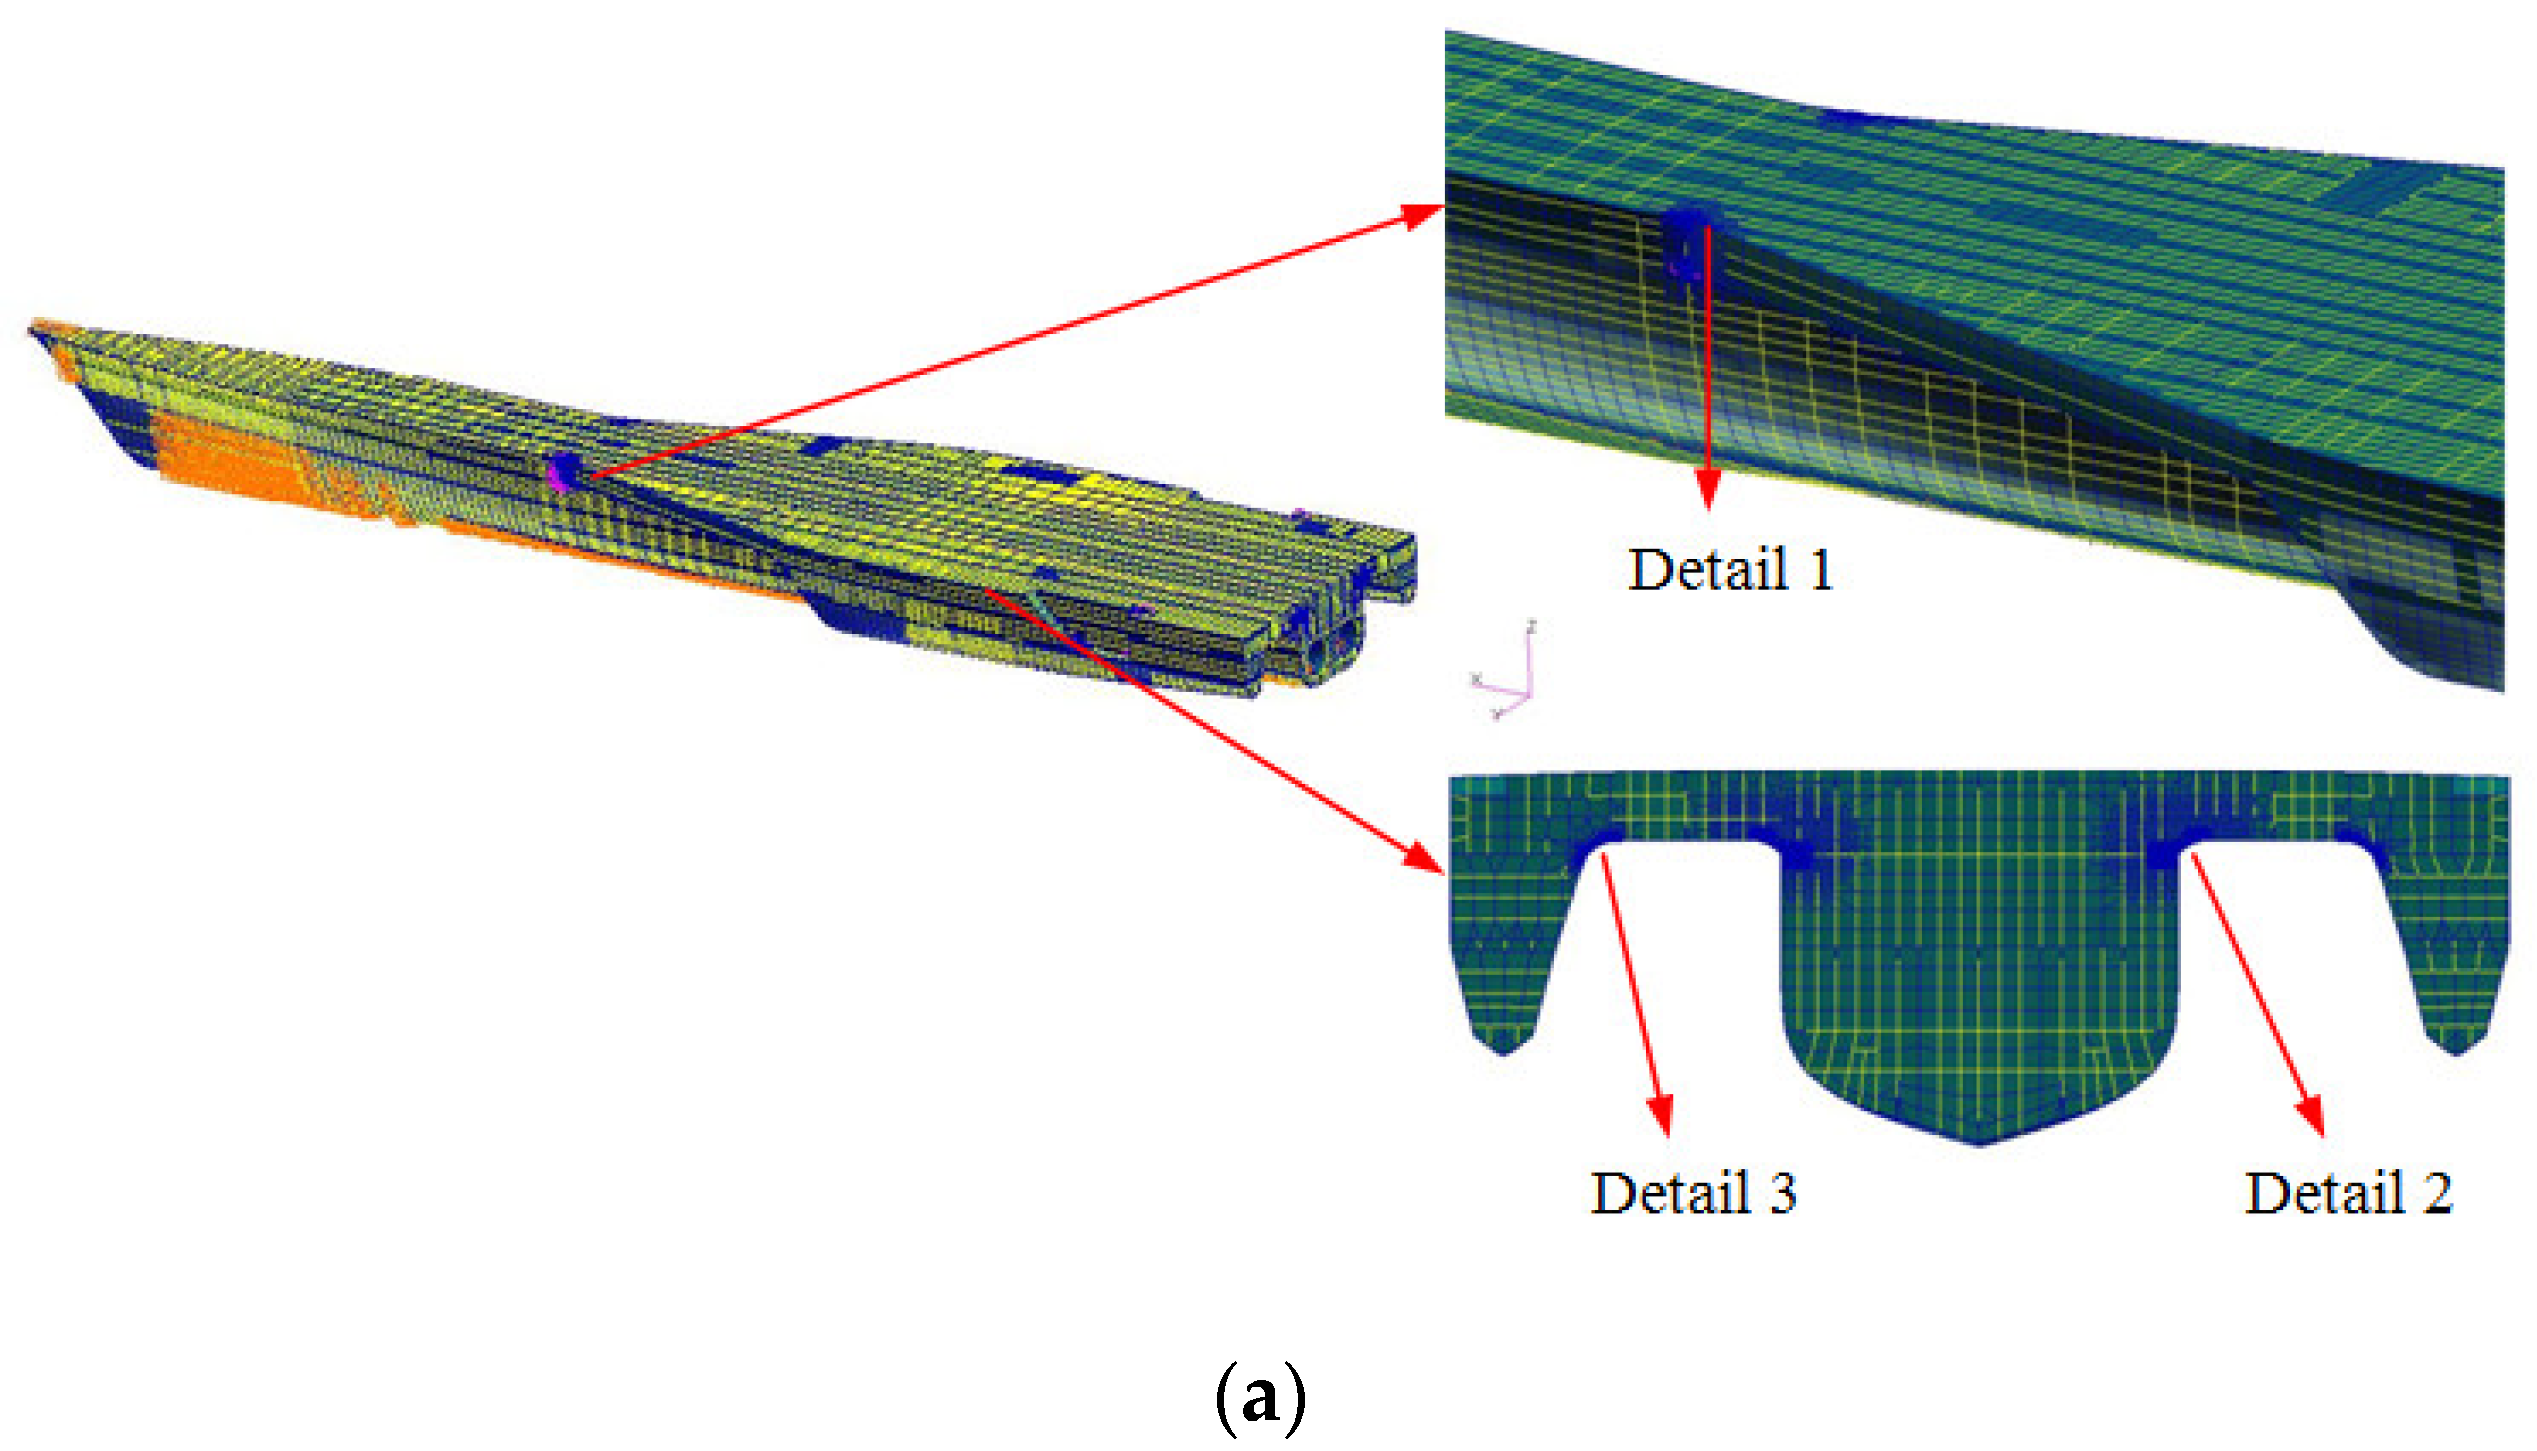
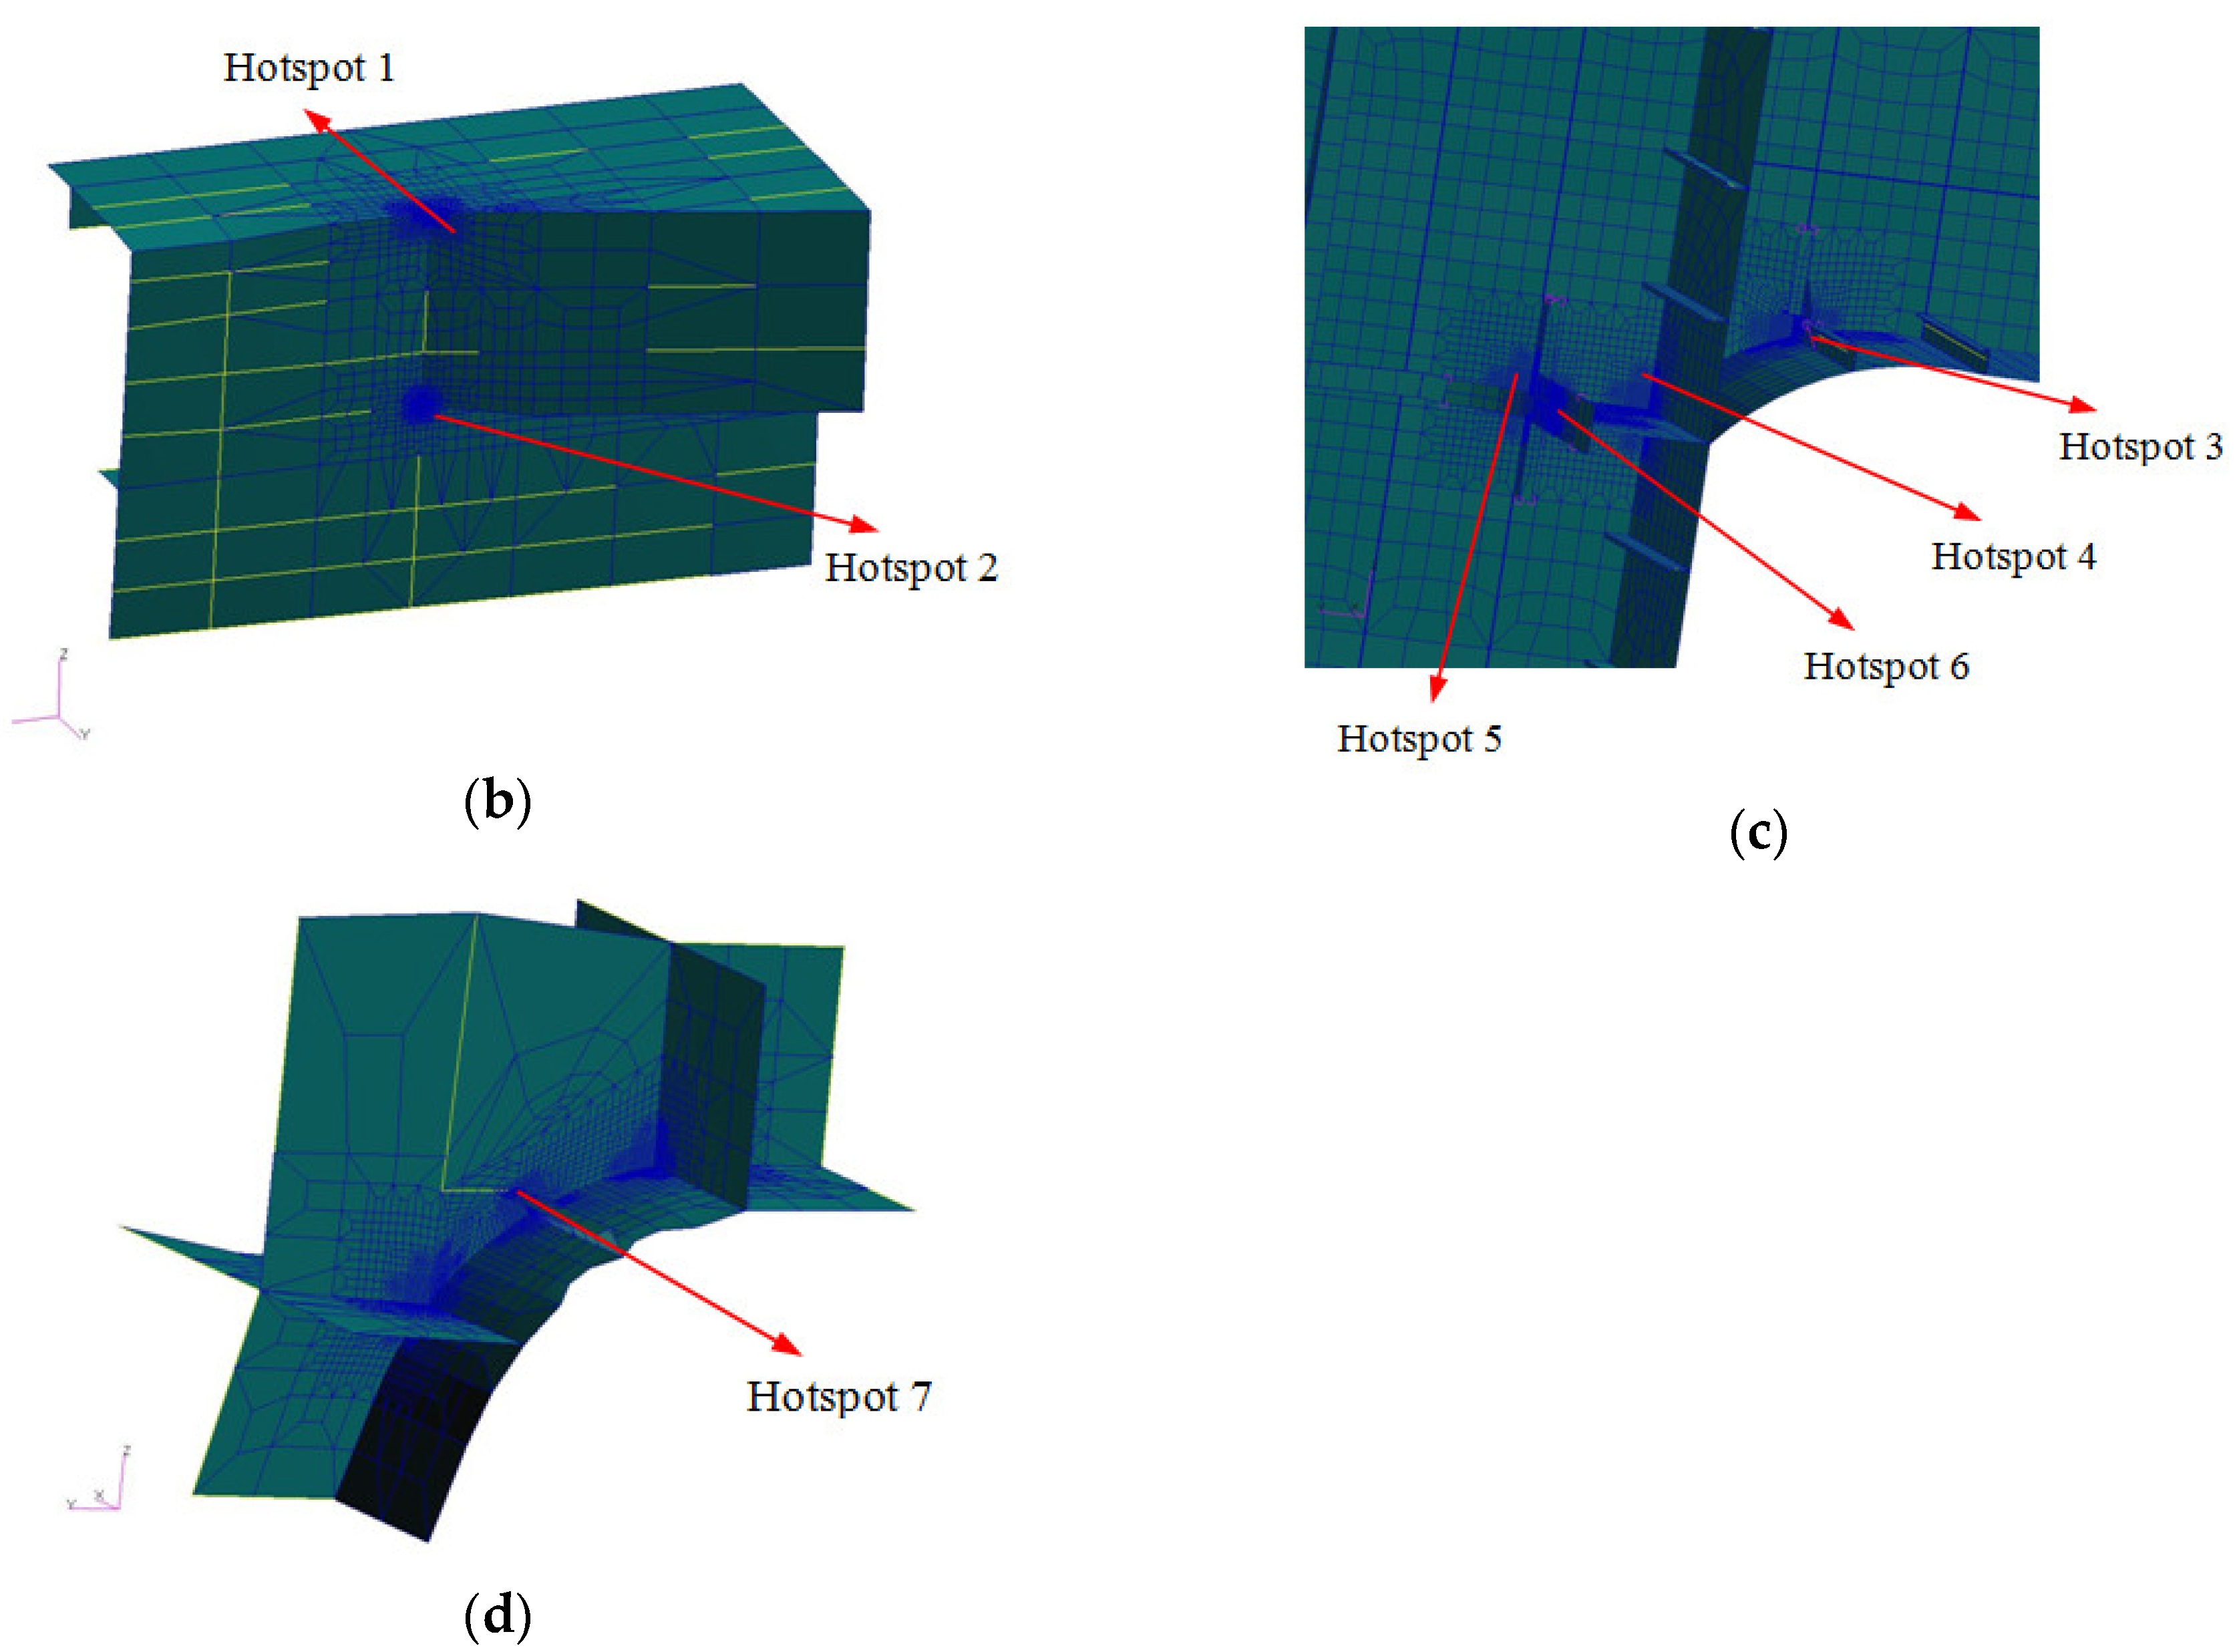
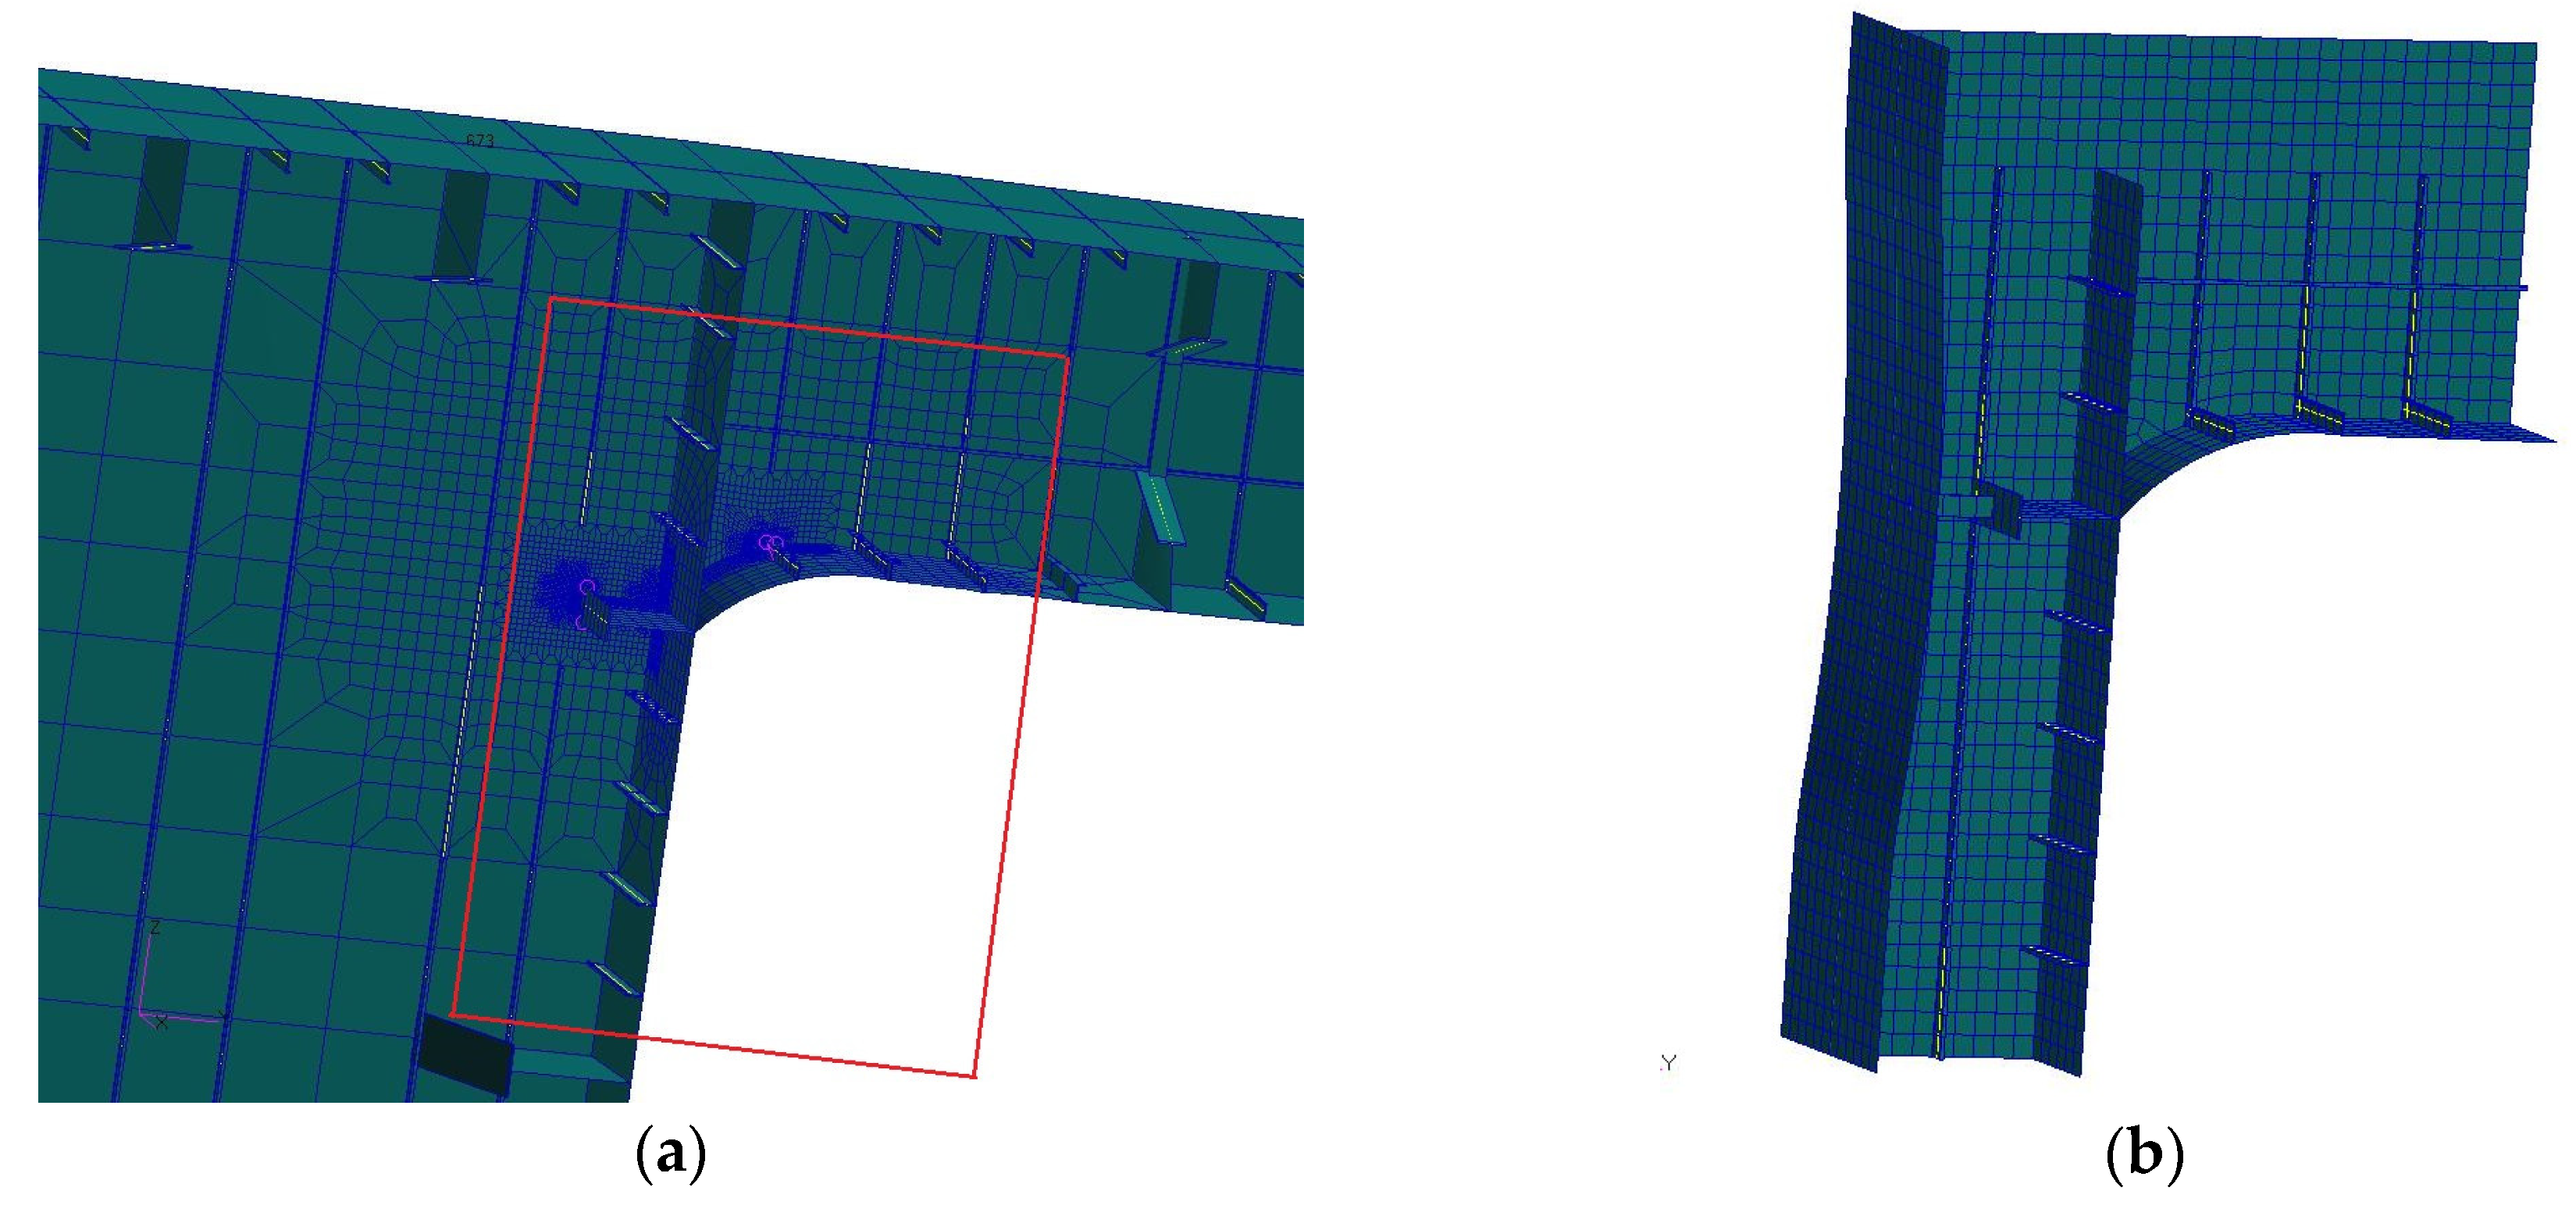
To investigate the fatigue properties of the trimaran’s cross-deck structure, full-scale models are fabricated by referring to the hull structure of a trimaran ship. According to the trimaran’s structural characteristics and results of the whole structure analysis, the connection of the main hull and cross-deck at the front (
Figure 1b, detail 1) and wet-deck in the middle (
Figure 1c, detail 2) experience serious fatigue problems [
19,
24]. So the positions of the cross-deck structure (
Figure 1b,c) are chosen for the fatigue testing. Then, structure details 2 and 1 are chosen as models 1 and 2, respectively. The scope of the full-scale models is shown in
Figure 4.
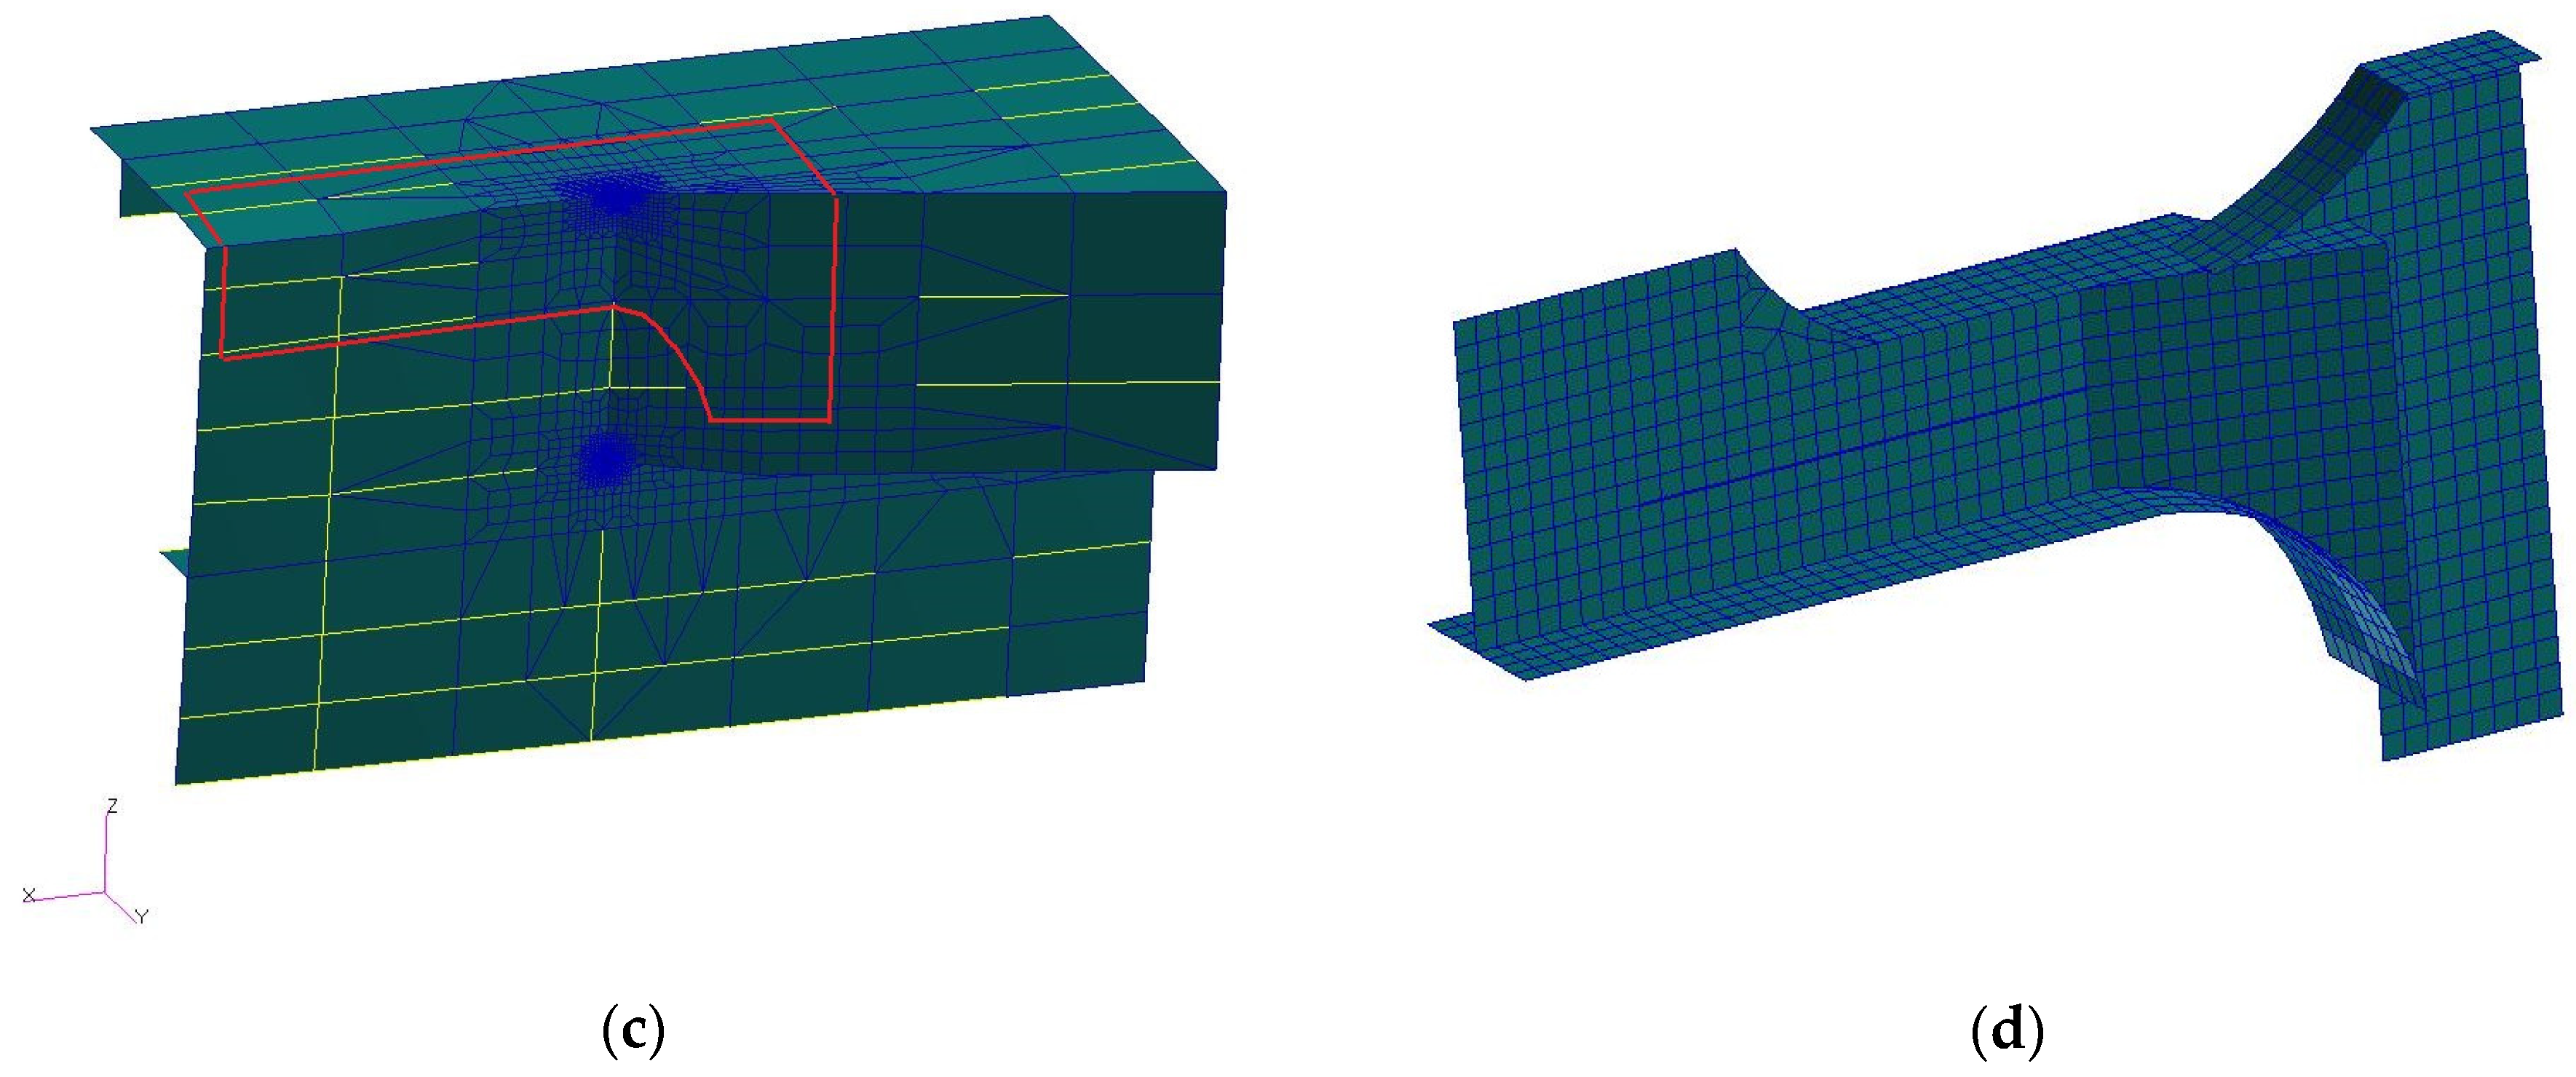
The principle dimensions of model 1 are L × B × D = 2.38 m × 0.40 m × 1.59 m, and the principle dimensions of model 2 are L × B × D = 2.38 m × 0.40 m × 1.34 m. The number of full-scale model 1 is 6 and the number of full-scale model 2 is 3. The models are fabricated from marine high-tensile AH36 steel and the welding technology and welding form are the same as that of a real ship. The experimental loading direction of model 1 mainly simulates splitting moment and the experimental loading direction of model 2 mainly simulates vertical bending moment and longitudinal torsional moment. The models’ finite element analyses results, using experimental loads, are shown in
Figure 5. The results show that the hot spot locations are consistent with the result of the analysis of the whole ship.
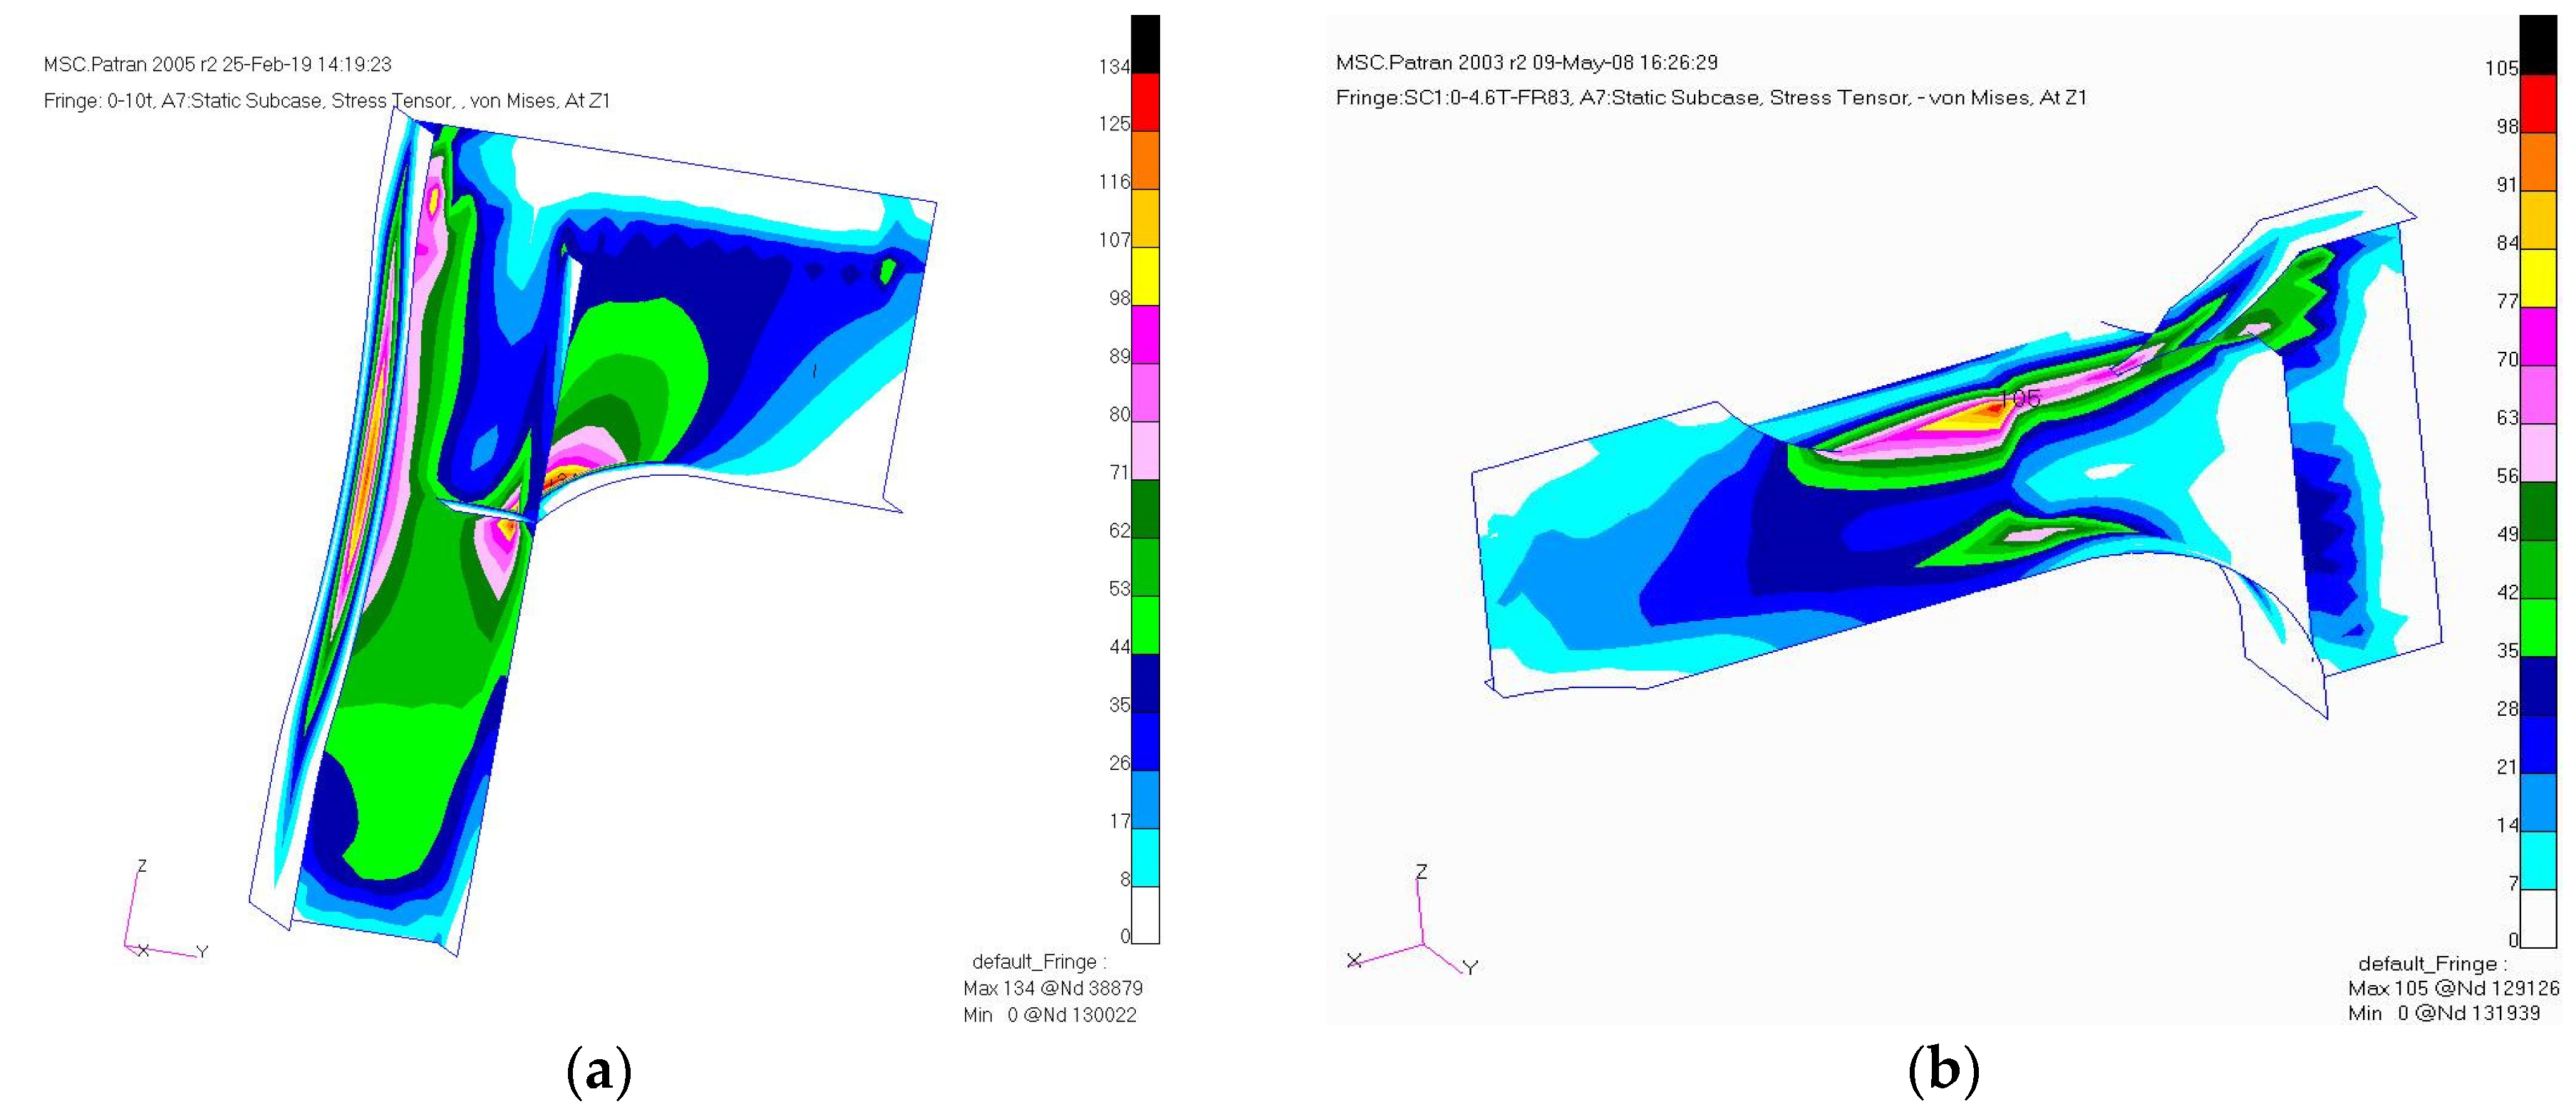
4.4. Fatigue Tests
The fatigue test equipment is an MTS multi-points loading test system. Before the fatigue test, the stress distribution near the weld toe is tested and the hot spots are identified. Constant amplitude loading is used in the experiment, under the stress ratio
R = −1 and loading frequency
f = 3 Hz. The numbers of cycles are chosen as the fatigue failure criterion when the plate thickness is penetrated. The fatigue test ground is shown in
Figure 6.
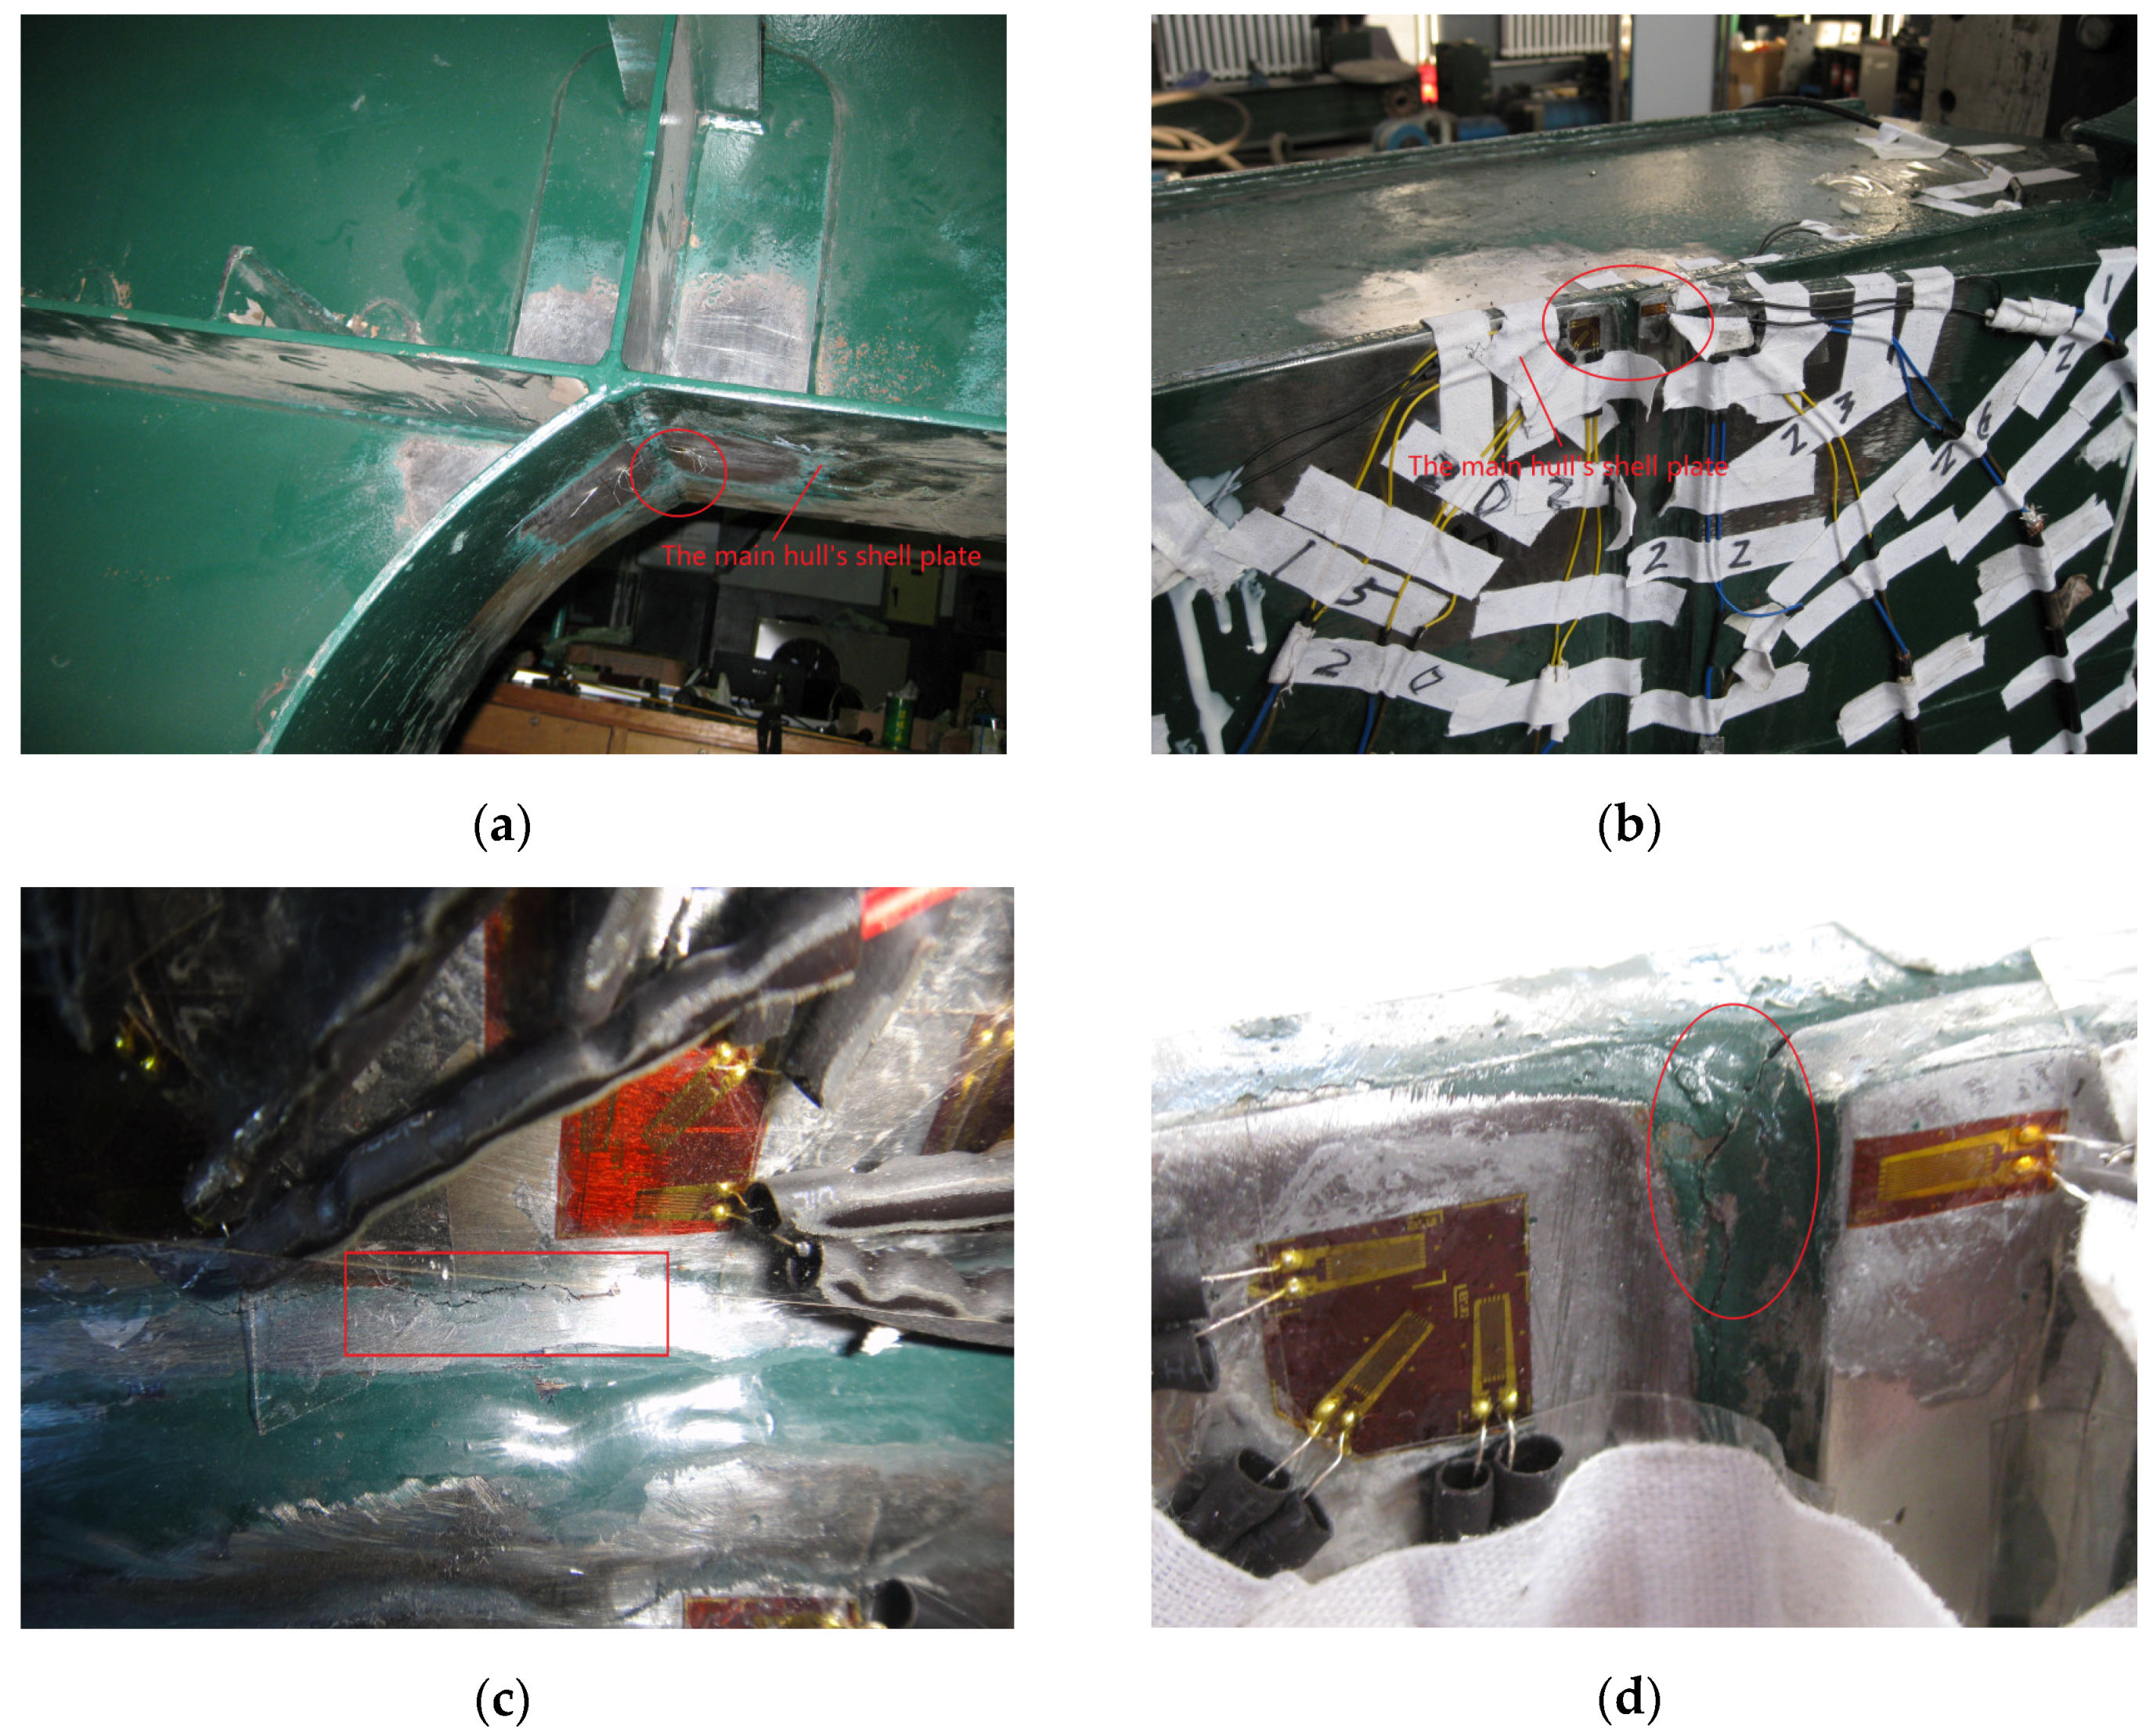
4.5. Fatigue Test Results
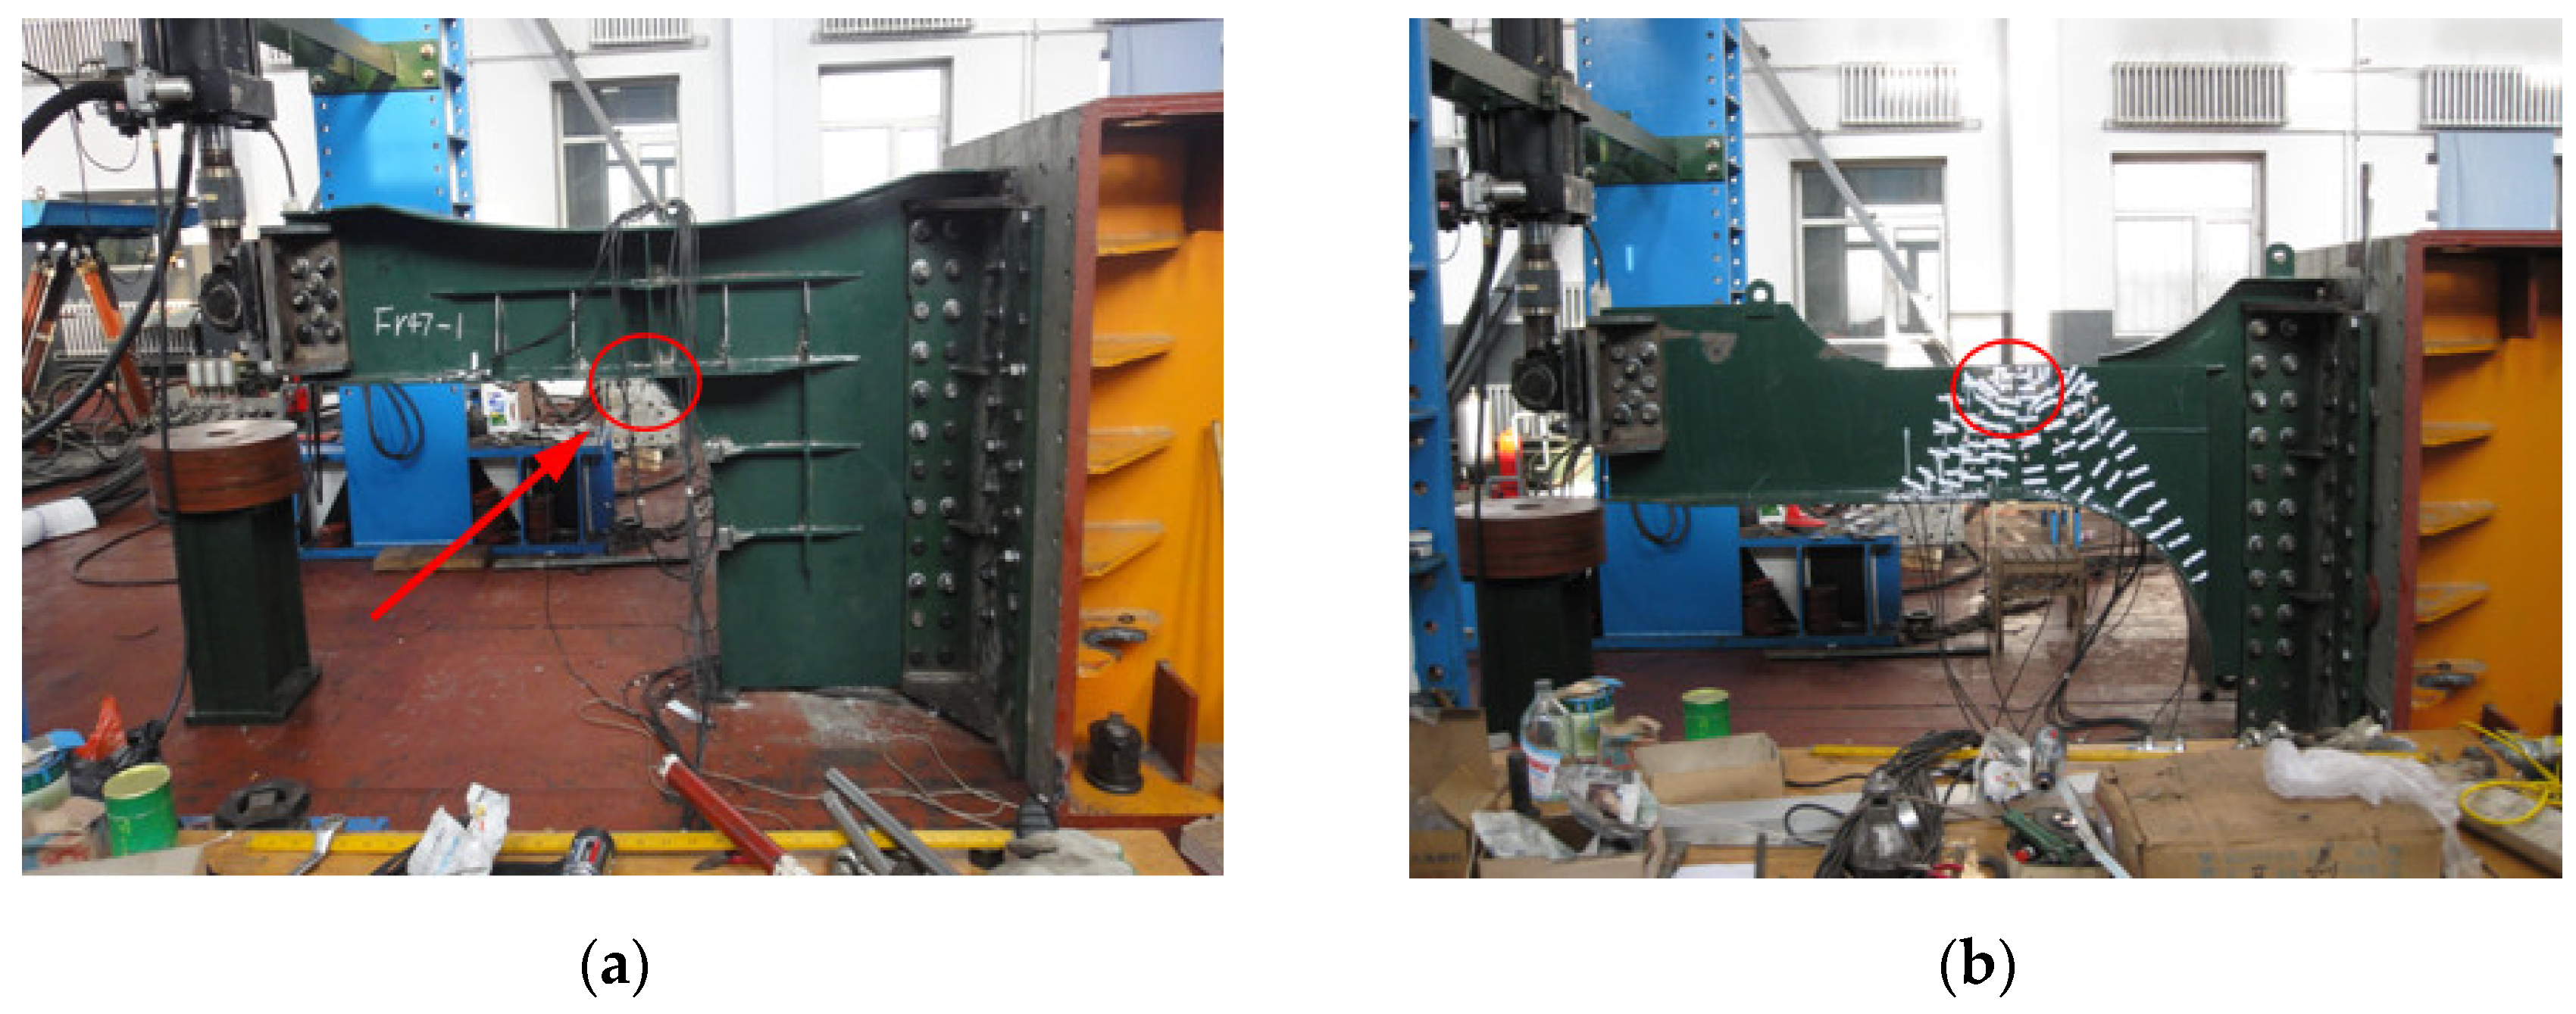
Through testing, we discover that the damaged part of model 1 is located at the weld joint at the connection of the main hull’s shell plate and wet-deck. When viewed from the direction of the arrow shown in
Figure 6a, the position of damaged part of model 1 is seen, which is shown in
Figure 7a. The damaged part of model 2 is located at the weld joint in the cross-deck, disconnected to the main hull’s shell plate, which is identified in
Figure 6b. The damage detail of model 2 is shown in
Figure 7b.
Figure 7c,d indicate the cracks of model 1 and 2, due to fatigue loads, respectively. The fatigue test results are provided in
Table 2.
The fatigue test data are analyzed using the maximum likelihood method outlined in
Section 4.2., and then the mean
curves of models 1 and 2 are obtained as follows:
The
curves of survival rate 97.7% are obtained as follows:
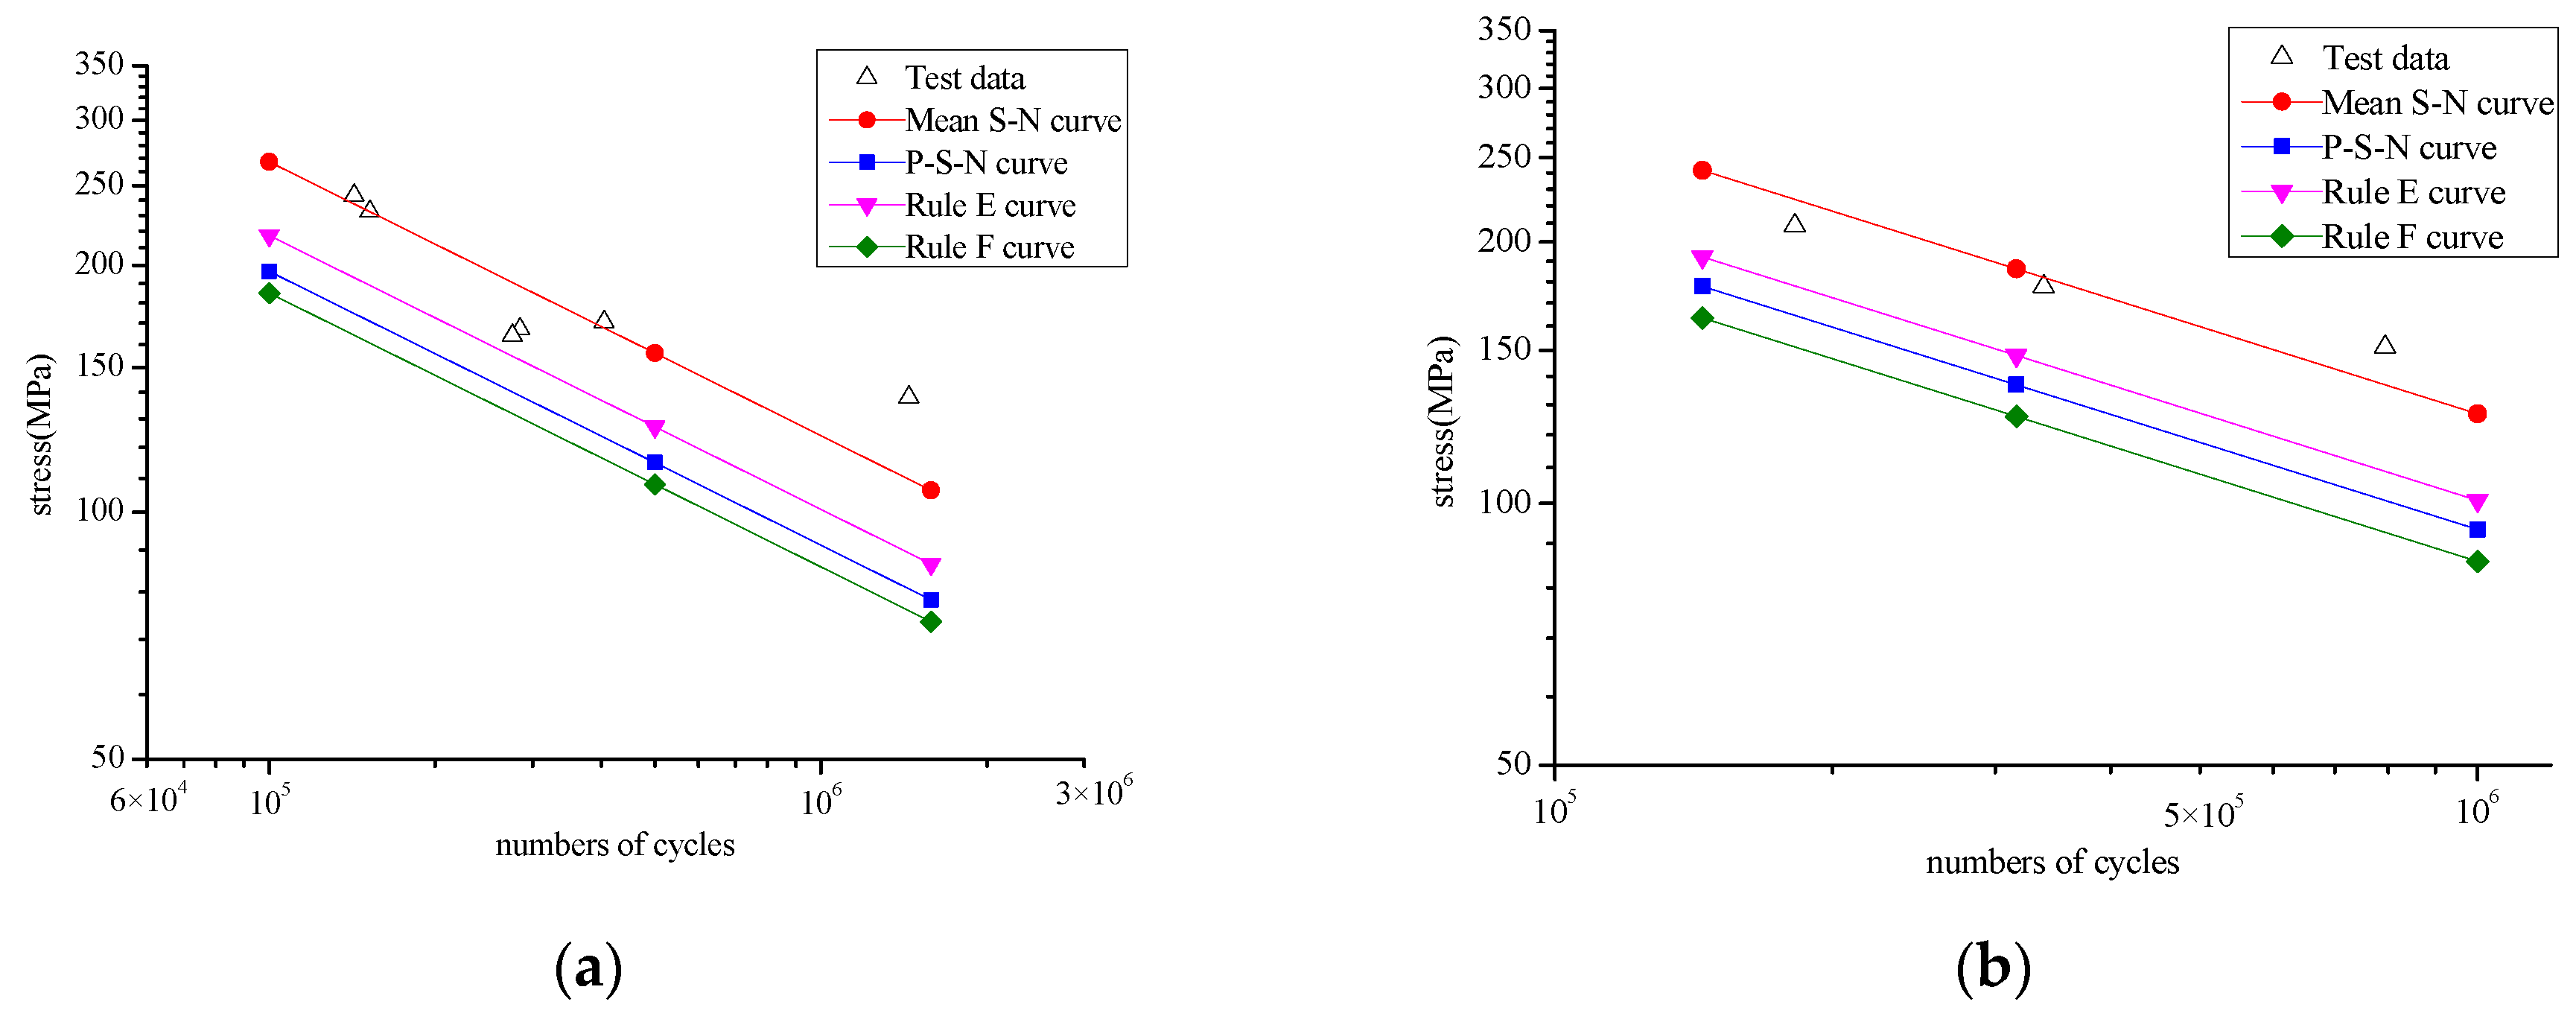
The mean
curve and
curve, obtained by the maximum likelihood method together with the E and F curves in the rules, are drawn, as shown in
Figure 8.
Figure 8 shows that the mean
curves of models 1 and 2 are above the E curve and the
curves are between the E and F curves.
5. Results and Discussion
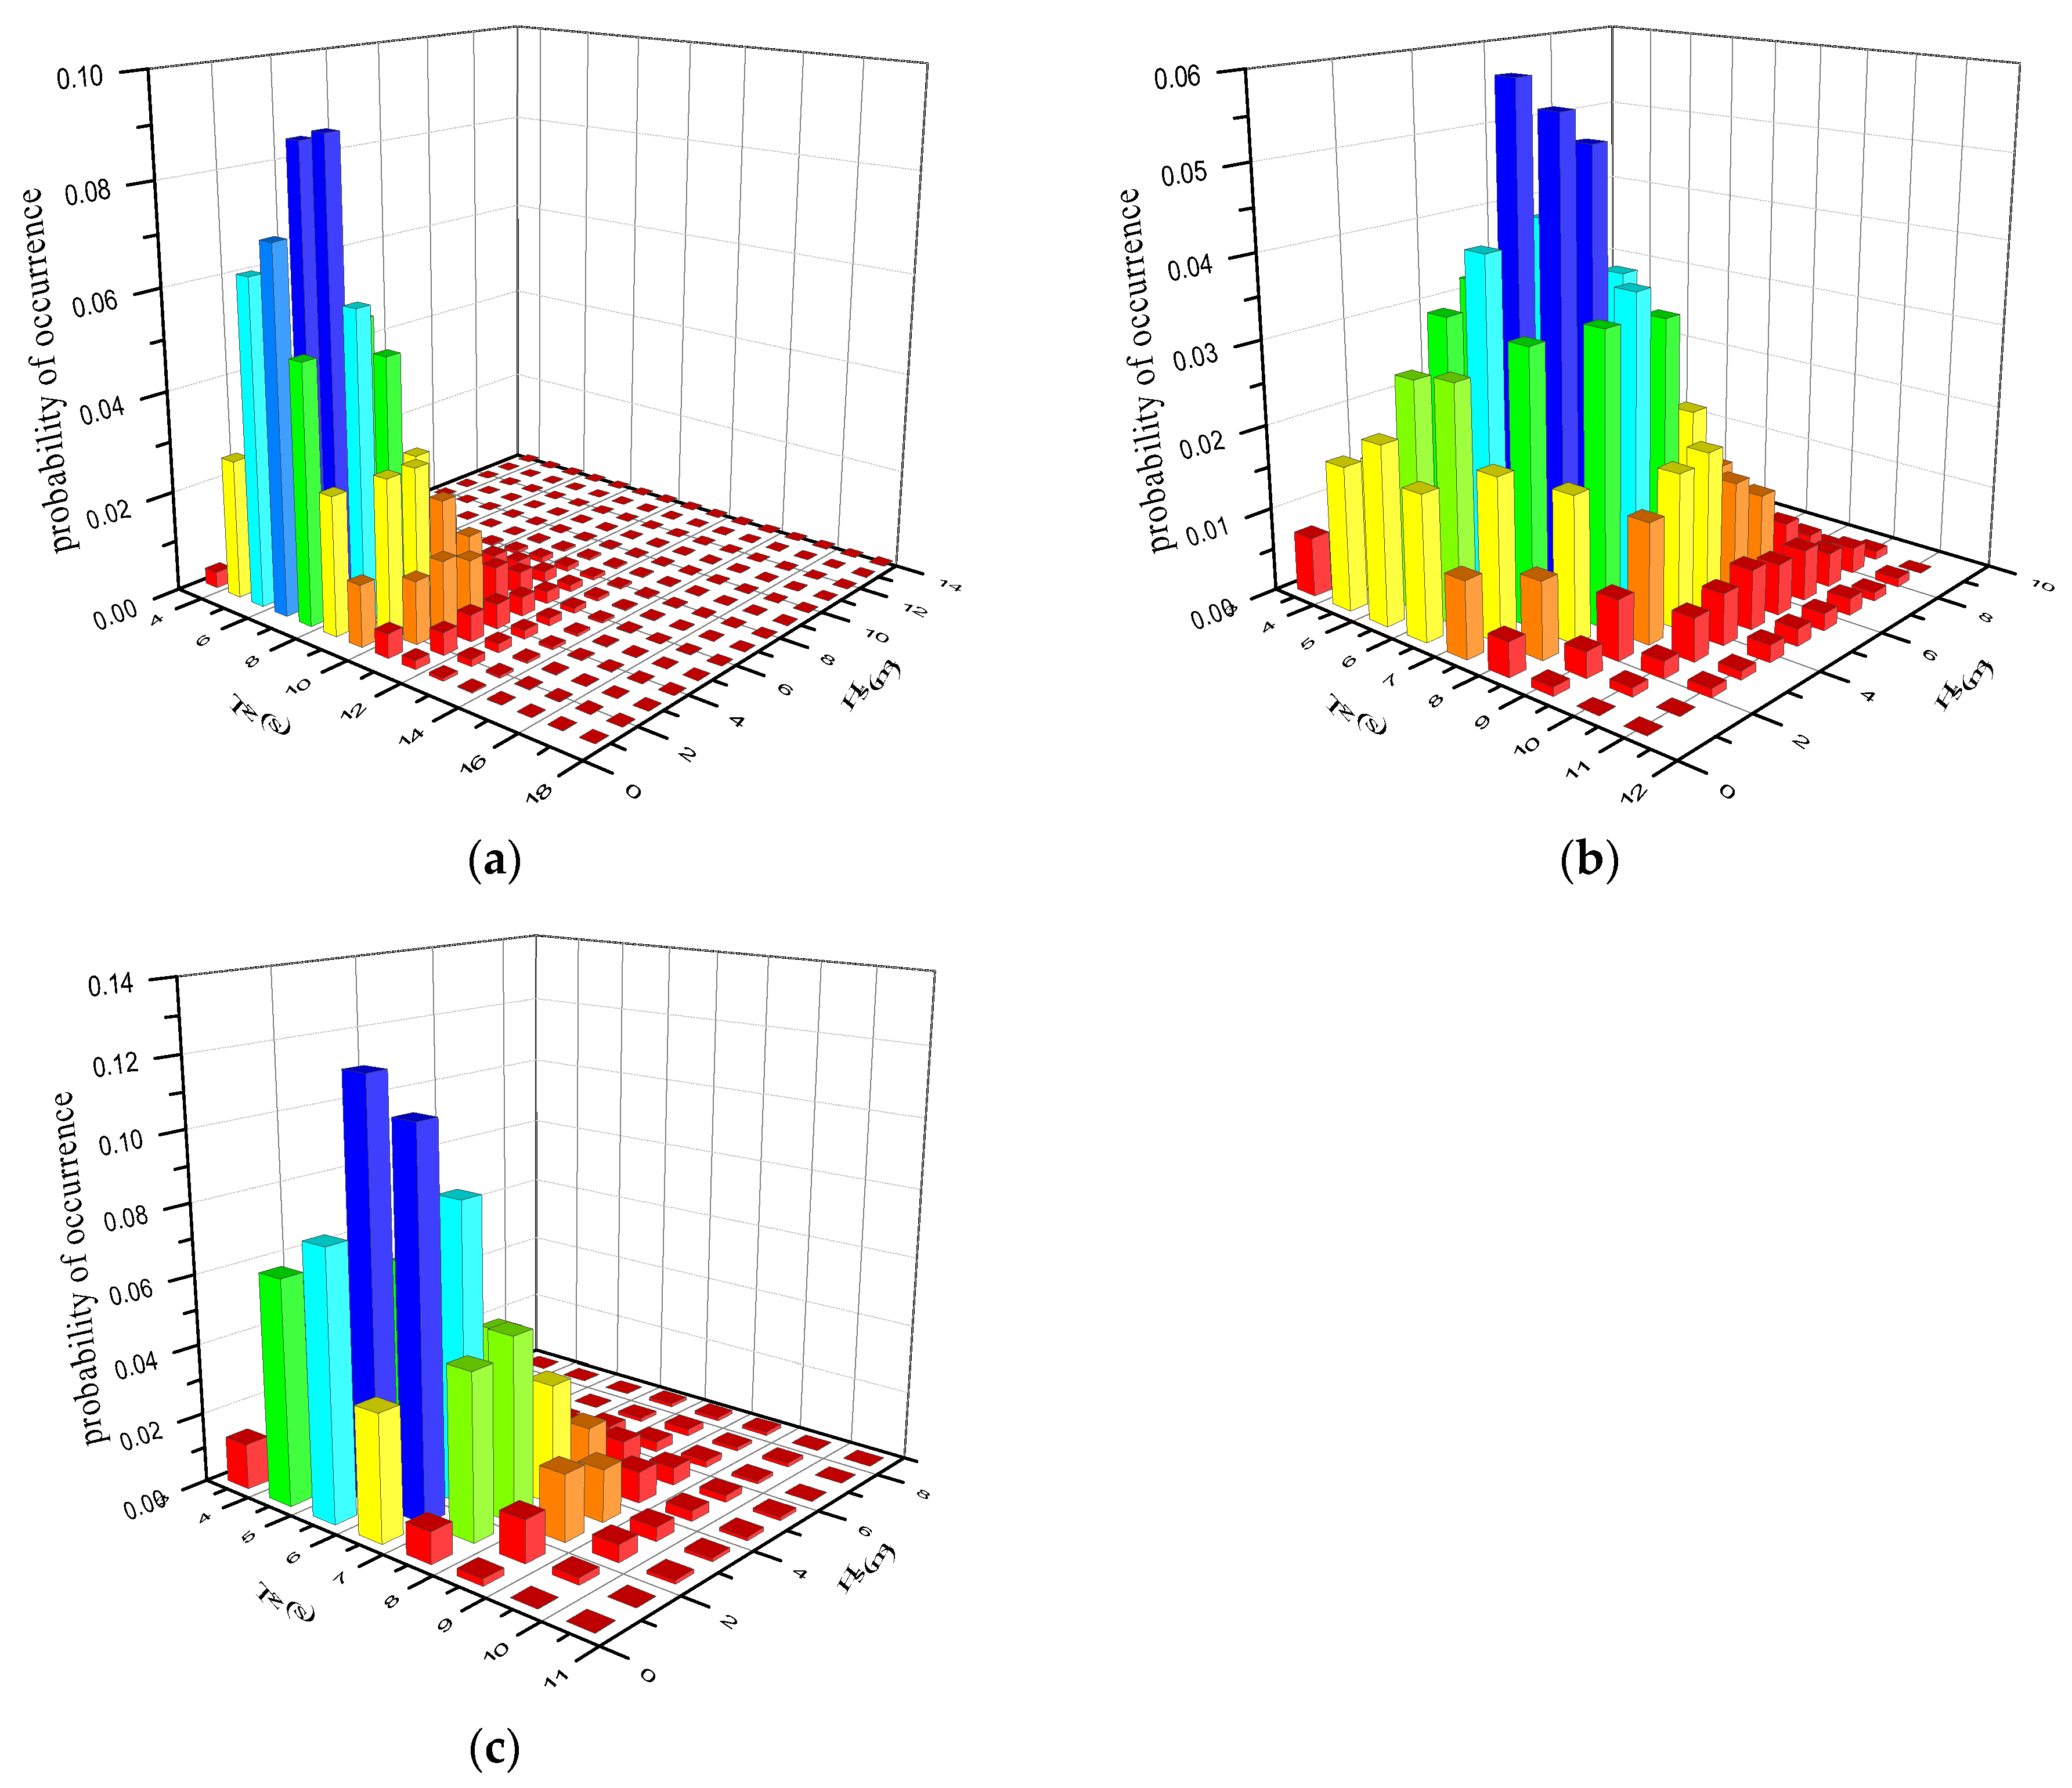
The significant wave height is the main factor influencing the ship structure’s strength. However, the fatigue damage is not only related to the significant wave height
, but also to the zero-crossing period
, the occurrence probability of the sea condition, and the response of the structure. So, the fatigue damage is sensitive to the wave scatter diagram. In this paper, fatigue damage is calculated for one base vessel loading condition using wave scatter data of World Wide Trade, Northwest Pacific, and China Coast. The wave scatter diagrams are shown in
Figure 9.
The distribution coefficient of wave headings is usually equally time-shared in spectral fatigue analysis. In actual navigation, it is more reasonable to allocate the majority of time to the conditions of head sea and following sea. As there is no clear stipulation on the distribution ratios of wave heading at present, for a similar ship type, we refer to the small water-plane area twin hull craft (SWATH) rule [
25]. Thus, the distribution of wave headings is assigned using the time allocation ratios of 50% head sea and following sea, 25% beam sea, and 25% oblique sea. To investigate the influence of time allocation ratios, the results are compared with those based on equal time-shared wave headings. In this paper, 0° is defined as head sea, 180° is defined as following sea, 90° and 270° are defined as beam sea, and others are defined as oblique sea.
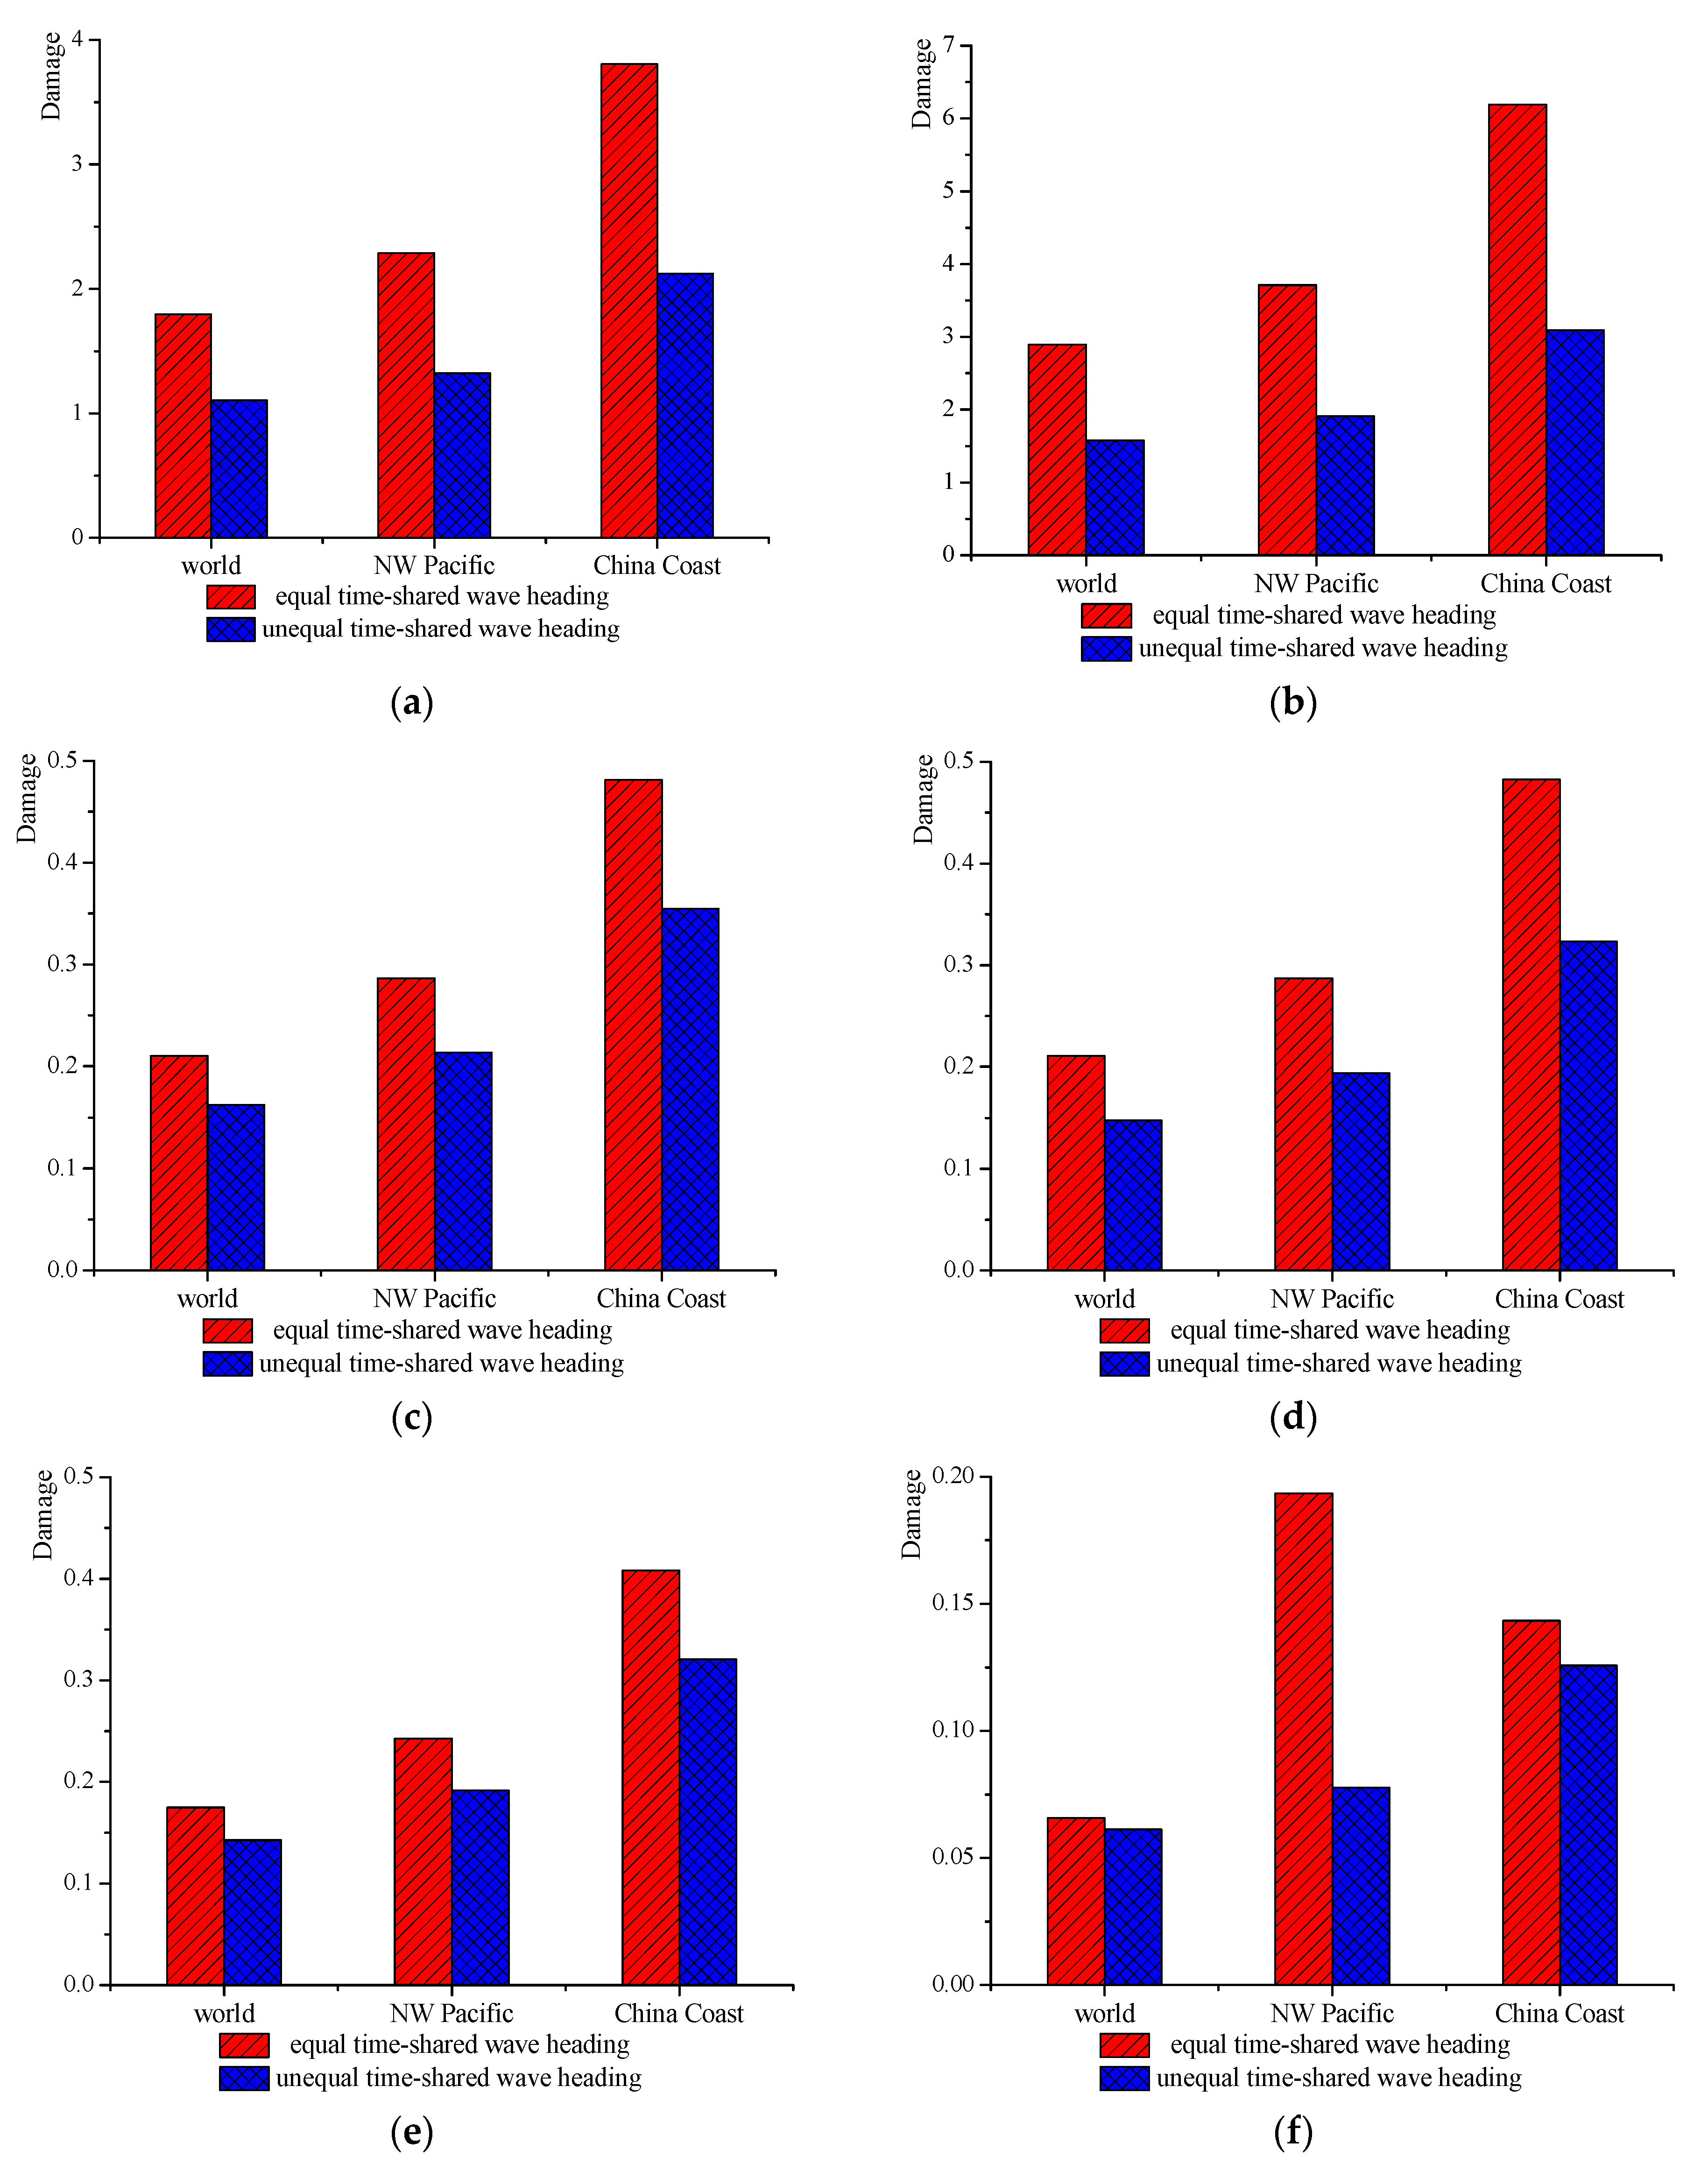
Based on the above assumptions, the fatigue damage is calculated using the E curve of the rules. The fatigue damage results of the hot spots are shown in
Figure 10.
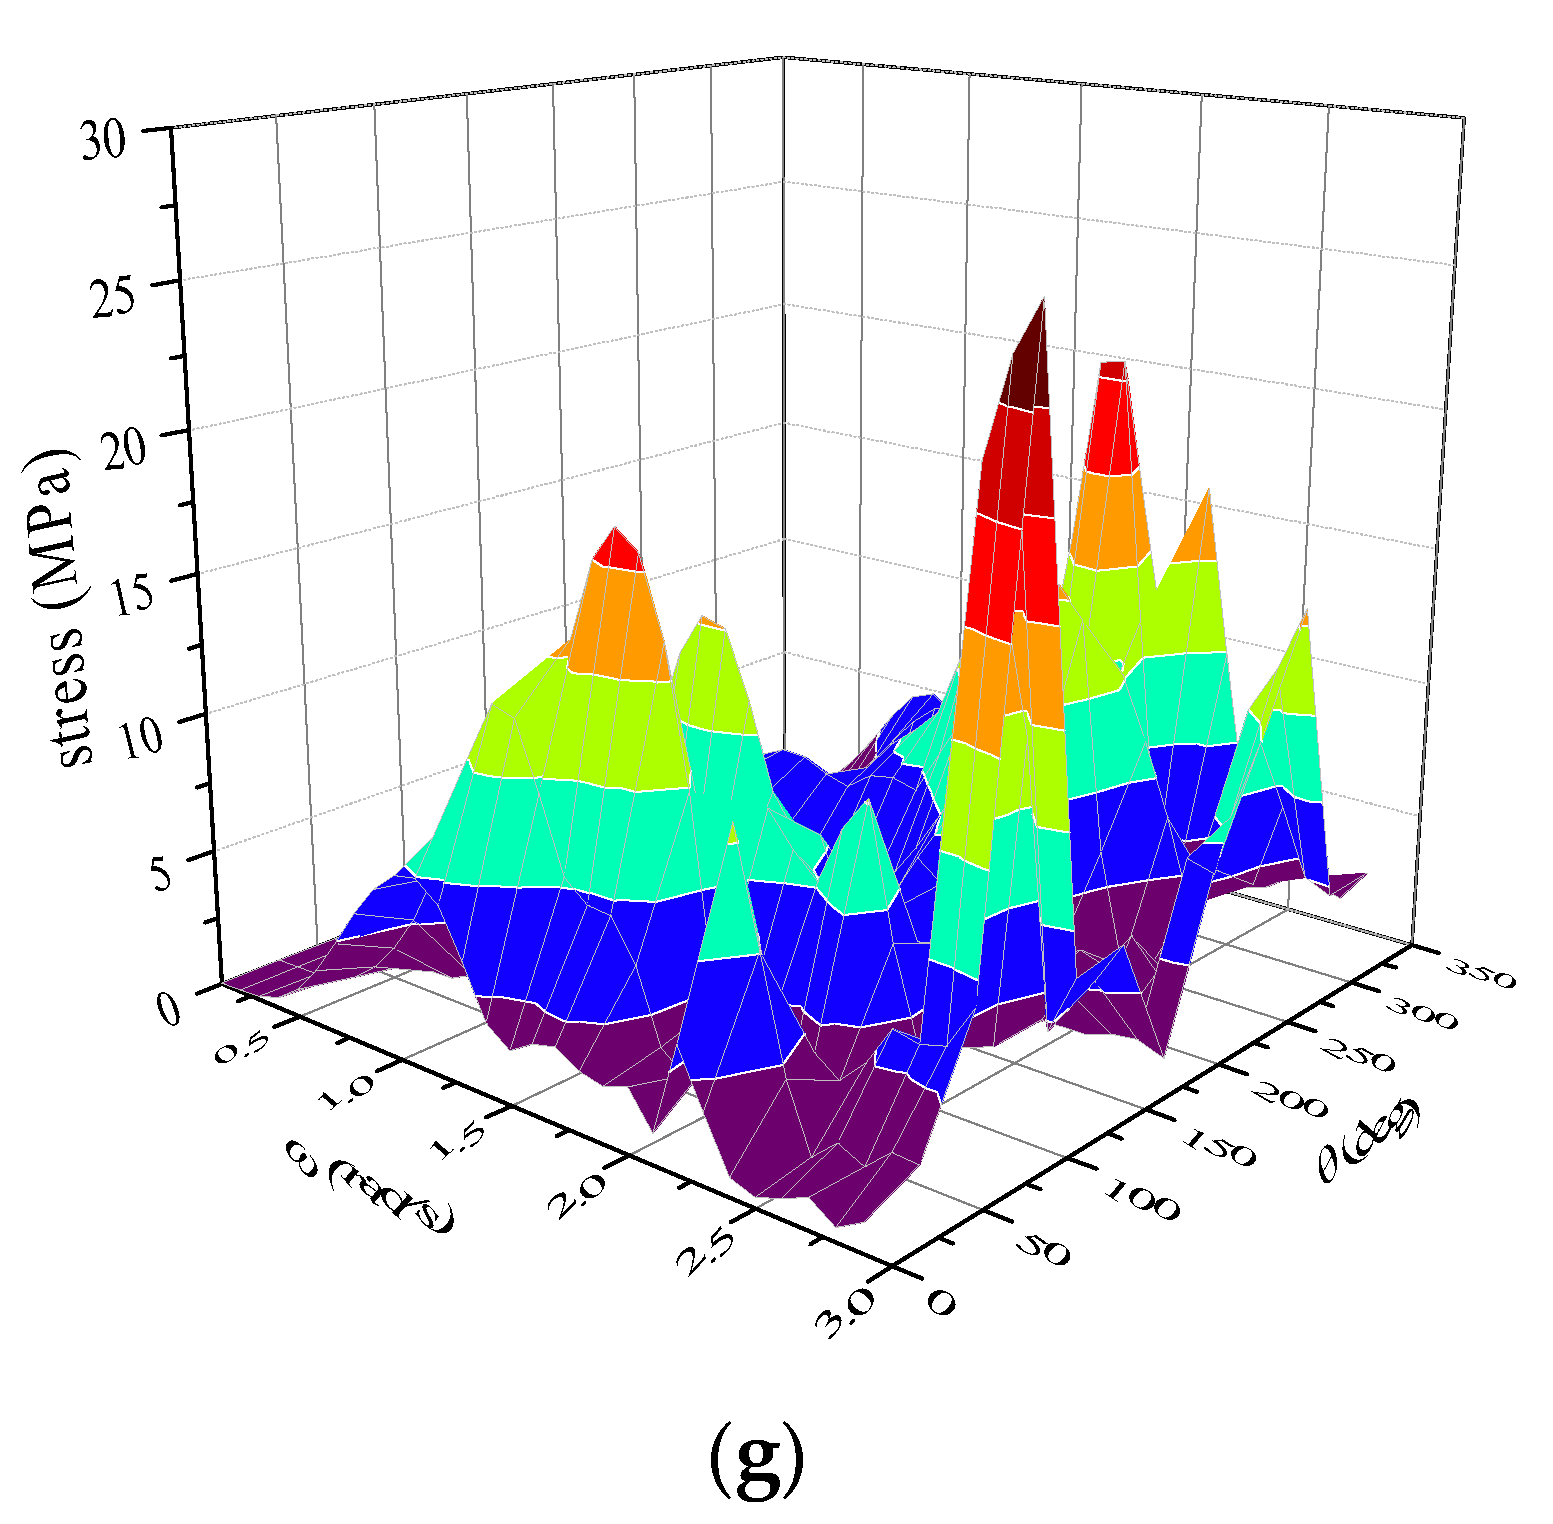
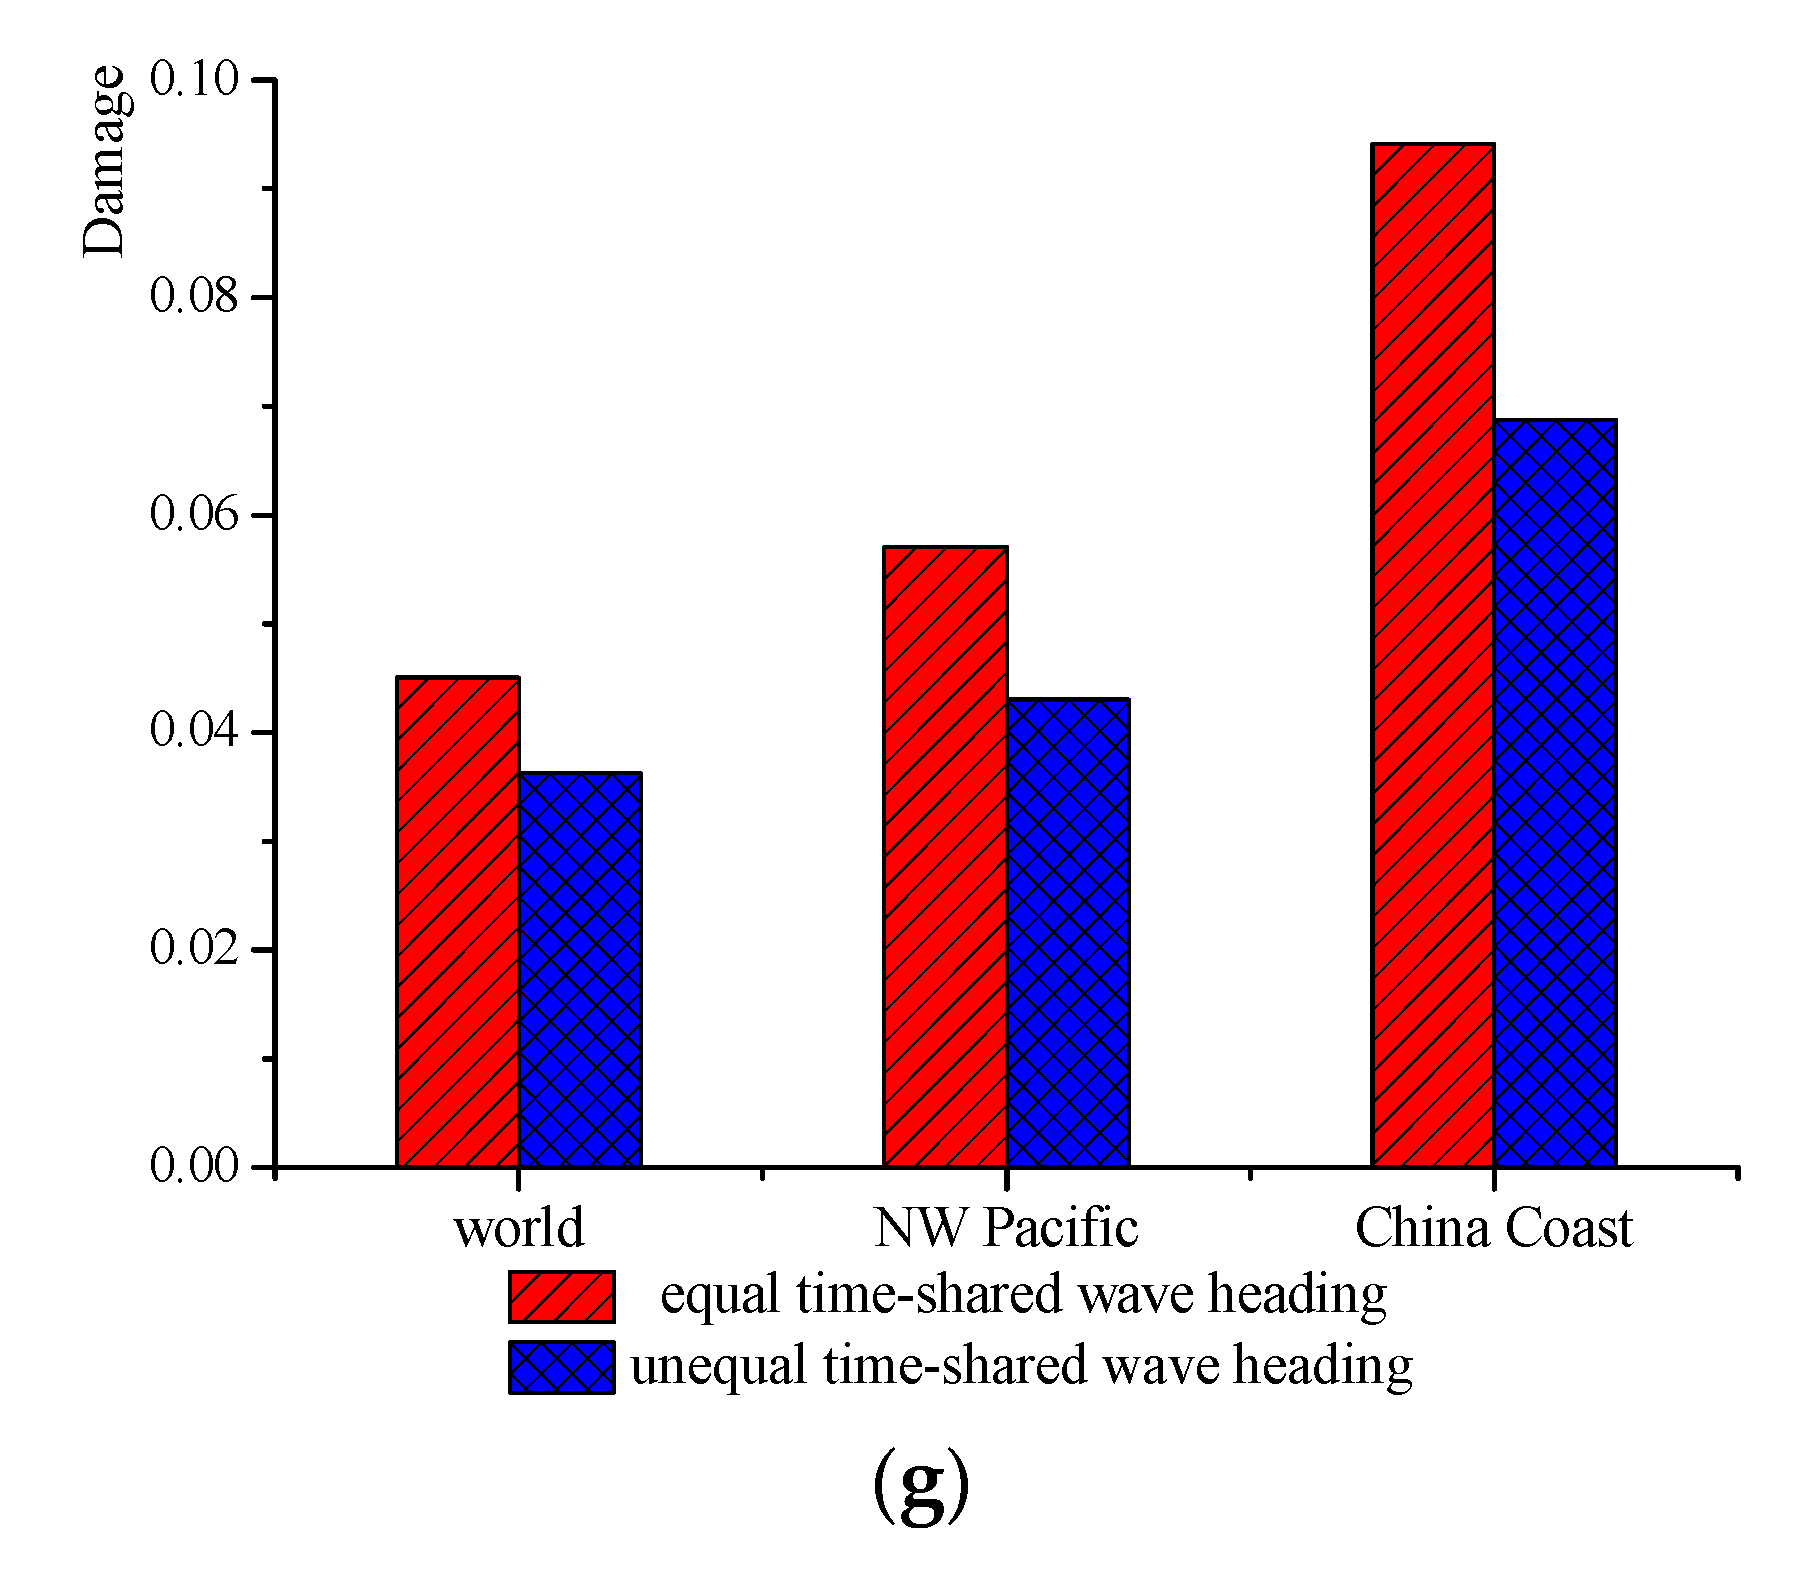
Figure 10 demonstrates that the fatigue cumulative damage values of hot spots 1 and 2 are greater than other hot spots, which indicates that the connection between the main hull and cross-deck at the front has a serious fatigue problem. Since the main hull is the main load bearing structure in the trimaran, the load on the side hulls is very small, due to its smaller hulls. The very small stress transfer function values of hot spot 7 (
Figure 3g) prove this statement. For these reasons, the cumulative fatigue damage value of hot spot 7 is the smallest of all hot spots. The fatigue cumulative damage values of hot spots 3, 4, 5, and 6 are large, which are mainly caused by the splitting moment and transverse torsional moment. This finding is different from that of a conventional ship form, which cannot be ignored.
Figure 10 shows that, under either equal or unequal time-shared wave headings, the fatigue cumulative damage values, using the China Coast wave scatter diagram, are larger than using the Northwest Pacific and World Wide Trade wave scatter diagrams. The main reason for this is that the waves along the China Coast are mainly concentrated in the medium wave level, which contributes more to fatigue damage. The characteristics of the stress transfer function (shown in
Figure 3) are another reason for the larger fatigue cumulative damage values in this area.
Figure 10 also shows that fatigue cumulative damage values, considering unequal time-shared wave heading distribution coefficients, are smaller in each wave scatter diagram. Since we use the time allocation ratio of 50% head sea and following sea, 25% beam sea, and 25% oblique sea, the beam sea and oblique sea appear to contribute more to fatigue damage. This is the specific fatigue characteristic of a trimaran due to its special cross-deck structure.
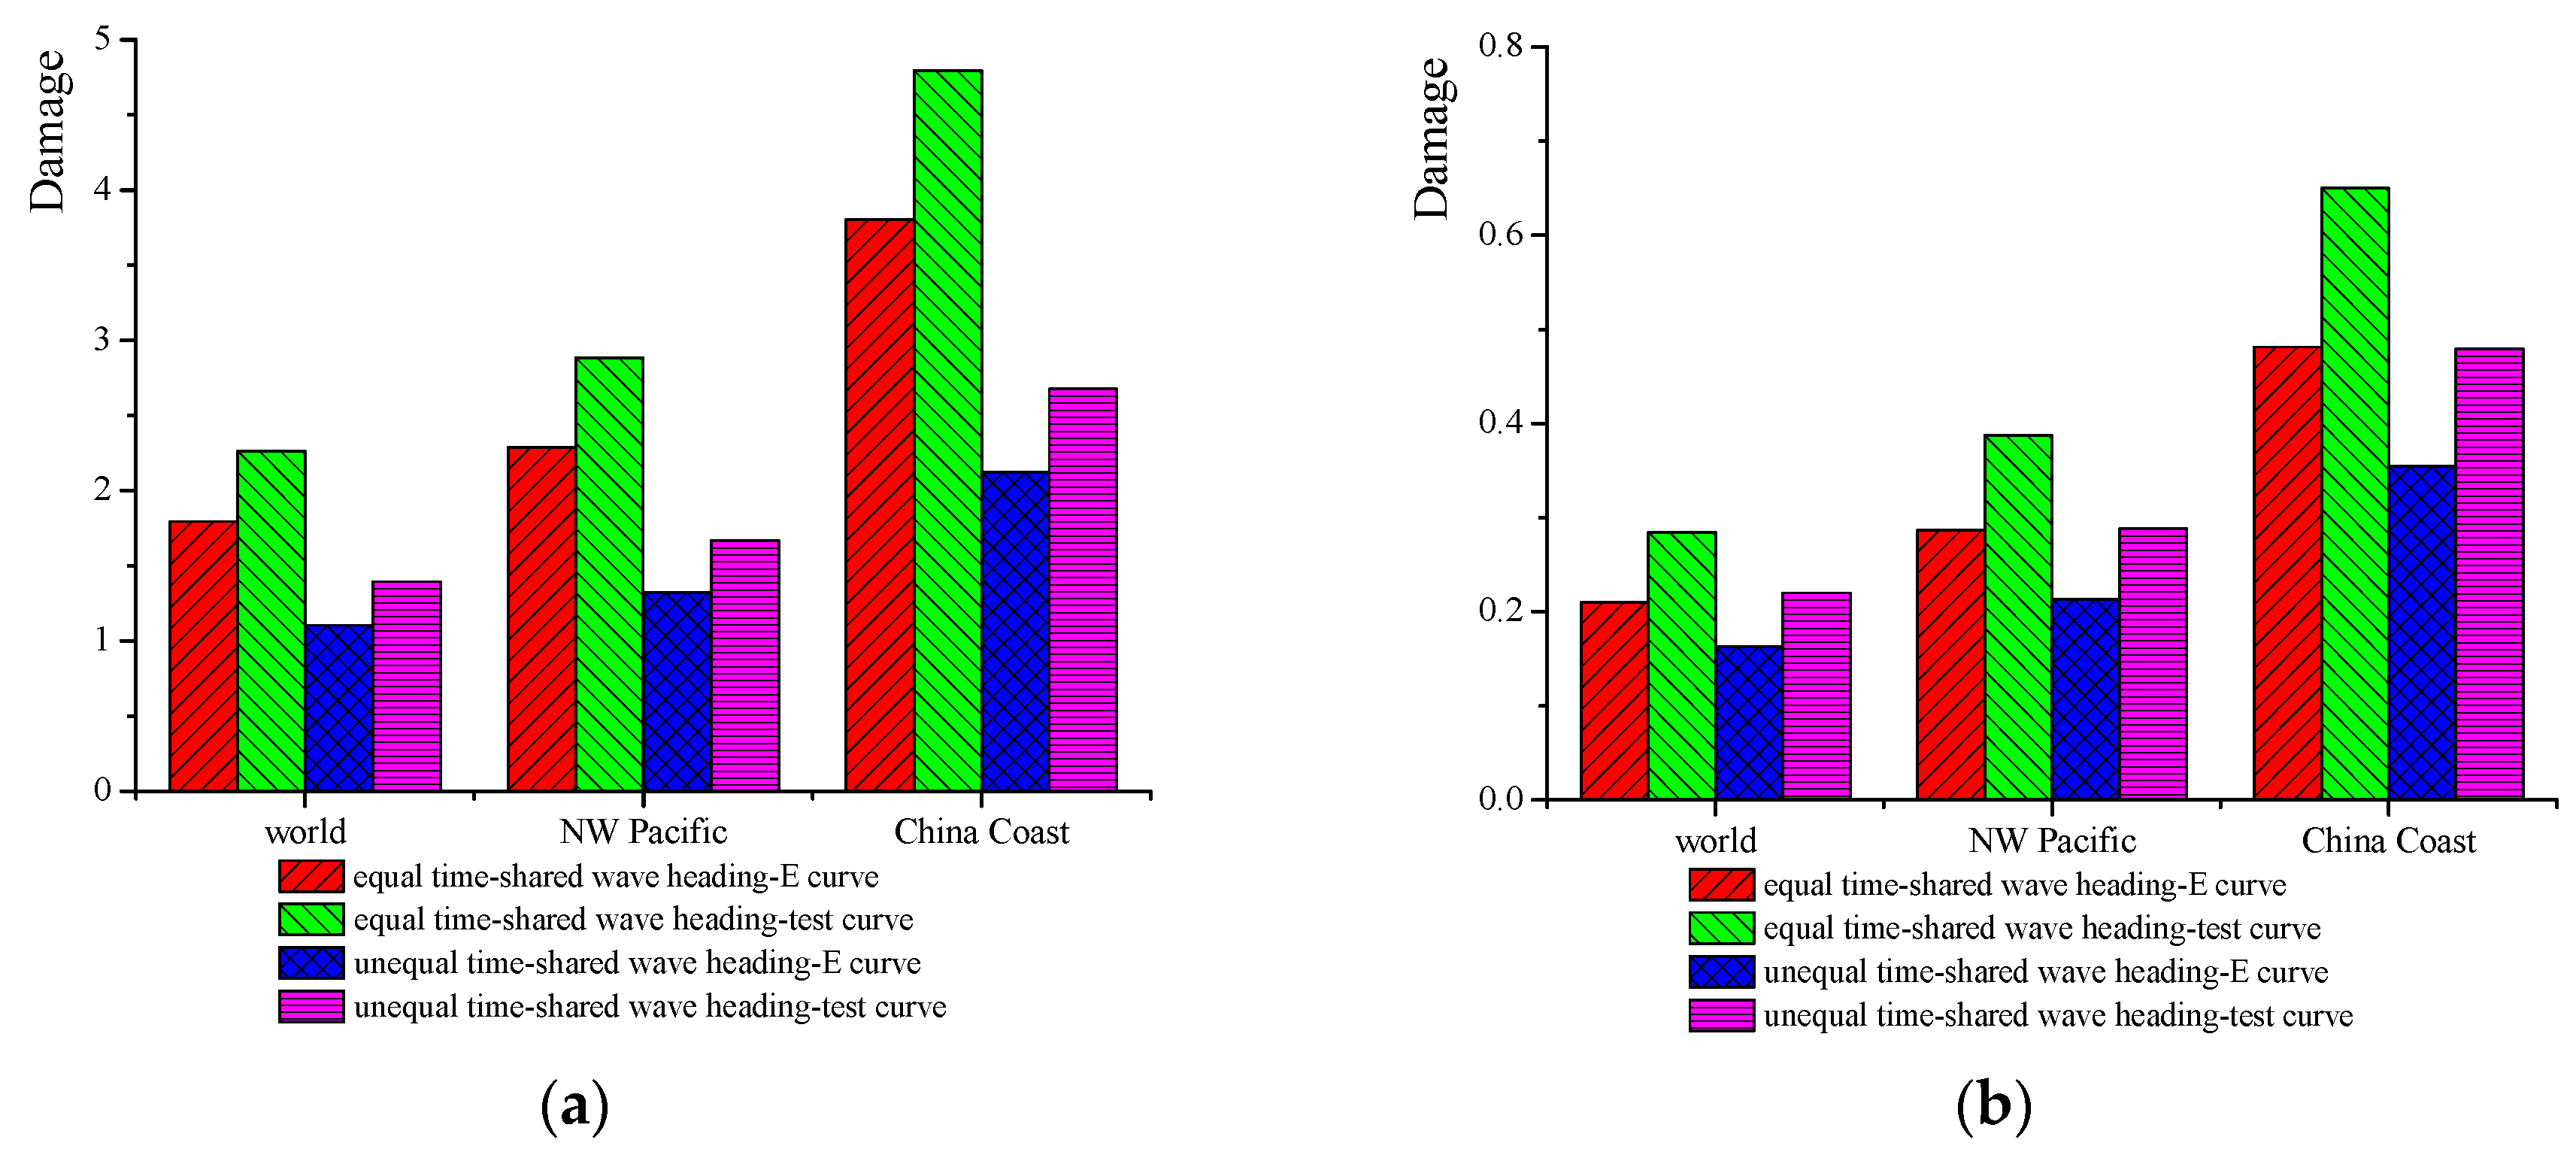
Figure 11 illustrates how the
curves of survival rate 97.7%, obtained from full-scale model fatigue testing, correlate with the cumulative fatigue damage values of hot spots 1 and 4.
Figure 11 shows that, when using the
curve, obtained from a full-scale model fatigue test, the cumulative fatigue damage values are larger in every wave scatter diagram. The results highlight that the damage values using the test
curve are 35% larger than those using the E curve in the rules for hot spot 4, which are 26% larger for hot spot 1. Therefore, when assessing the fatigue of cross-deck structures, selecting the
curve is dangerous, according to the existing rules.
6. Conclusions
The trimaran’s fatigue characteristics are different than those of conventional ships, which is the result of the combined effect of wave load and ship structure characteristics. According to the calculation results, it is found that the connection between the main hull and the cross-deck at the front suffers the most fatigue damage. The predicted fatigue damage is considerably larger than the design value, which indicates the requirement for structure strengthening and optimization at this location.
As fatigue damage is sensitive to the wave scatter diagram, the wave scatter diagram of specific navigation areas should be considered. Since the beam sea and oblique sea contribute more to fatigue damage, to reduce conservatism, we suggest adopting unequal wave heading time allocation for a trimaran when investigating fatigue damage.
When evaluating the fatigue strength of a trimaran’s cross-deck structure, it is no longer appropriate to adopt the rule’s design curve E obtained from standard specimens. The fatigue cumulative damage values are larger when using the curve obtained from a full-scale model fatigue test. Selecting the design curve E, according to the existing rules, would achieve an unconservative result for the trimaran’s cross-deck structure. It will be dangerously inaccurate for the design of the trimaran’s cross-deck structural details.


