Effects of Principal Stress Rotation on the Fluid-Induced Soil Response in a Porous Seabed


1
School of Engineering and Built Environment, Griffith University Gold Coast Campus, Queensland 4222, Australia
2
Faculty of Architectural Civil Engineering and Environment, Ningbo University, Ningbo 315211, China
3
Centre for Advanced Technologies in Rail Track Infrastructure, University of Wollongong, Wollongong 2522, Australia
*
Author to whom correspondence should be addressed.
†
These authors contributed equally to this work.
J. Mar. Sci. Eng. 2019, 7(5), 123; https://doi.org/10.3390/jmse7050123
Submission received: 22 March 2019
/
Revised: 17 April 2019
/
Accepted: 17 April 2019
/
Published: 28 April 2019
(This article belongs to the Special Issue Coastal Geohazard and Offshore Geotechnics)
Abstract
:Principal stress rotation (PSR) is an important feature for describing the stress status of marine sediments subject to cyclic loading. In this study, a one-way coupled numerical model that combines the fluid model (for wave–current interactions) and the soil model (including the effect of PSR) was established. Then, the proposed model was incorporated into the finite element analysis procedure DIANA-SWANDYNE II with PSR effects incorporated and further validated by the experimental data available in the literature. Finally, the impact of PSR on the pore-water pressures and the resultant seabed liquefaction were investigated using the numerical model, and it was found that PSR had a significant influence on the seabed response to combined wave and current loading.
1. Introduction
Recently, the physical processes of fluid–seabed interactions have attracted great attention from coastal and geotechnical engineers because of the growth in human exploration and development of offshore projects. Seabed instability due to cyclic loading, such as waves, currents, and earthquakes, is one of the main concerns of offshore geotechnical engineers involved in the design of offshore infrastructure.
It has been well known that dynamic wave pressure generated by natural hydrodynamic loading on the sea floor further induces pore-water pressure and stresses in the seabed. When the pore pressure accumulates and reaches a certain level, the effective stresses vanish and lead to soil instability as a consequence of the movement of soil particles [1,2]. Therefore, an accurate prediction of the soil response, including pore-water pressure, effective stresses, and shear stresses, is important for the design of offshore infrastructure.
On the basis of laboratory and field measurements, two mechanisms for the wave-induced soil response have been developed and reported in the literature [3,4,5], namely oscillatory and residual mechanisms. The first mechanism is the result of oscillatory excess pore-water pressures and accompanied by the attenuated amplitude and phase lag of pore-water pressure changes [6]. The second mechanism is the build-up of excess pore pressures caused by the contraction of cyclic loading [7]. As reported in Jeng and Seymour [8], the oscillatory mechanism dominates the process of liquefaction in the case of a longer wave period and small amplitude, while the residual mechanism dominates the whole process for a wave with a short wave period or large wave amplitude.
Numerous studies for the wave-induced oscillatory soil response have been carried out since the 1970s. For example, on the basis of Biot’s consolidation theory [9], Yamamoto et al. [6] derived a closed-form analytical solution for the wave-induced oscillatory soil response in an infinite seabed. The scope of this framework has been further extended to a seabed of finite thickness, a layered seabed, an inhomogeneous seabed with variable permeability, and a cross-anisotropic seabed [5]. Later, several analytical solutions were proposed that incorporated dynamic soil behavior; these models include the partial dynamic () [10] and full dynamic (FD) models [11,12]. Jeng and Cha [11] investigated the applicable range of different approximations with two non-dimensional parameters and soil permeability. This applicable range was reexamined by Ulker and Rahman [12] for different soils.
In addition to analytical approximations, several numerical models for the wave-induced oscillatory soil response for more complicated cases have been developed and applied to different offshore infrastructures. For example, Jeng and Lin [13] established a finite element model (FEM) that considers the effects of variable permeability and the shear modulus. Later, FEM models were developed for cases with different offshore infrastructures, for example, breakwaters [14], pipelines [15], and mono-pile foundations [16].
In the literature, numerous investigations of the wave-induced residual soil response are available. Using the results of direct shear tests [17], Seed and Rahman [7] proposed a 1D approximation with a source term for pore-water pressure generation. Following this framework, several analytical solutions and numerical solutions for wave-induced residual liquefaction were proposed [4,5,8]. Recently, Jeng and Zhao [18] proposed a new definition of the source term by considering the instant oscillatory shear stress; then, they extended the 1D model to two dimensions and applied it to the case of a submarine pipeline [19]. The aforementioned works were based on an inelastic model with a source term. Adopting the model proposed by Sassa et al. [20] and including the dissipation of pore-water pressures in the source term, Liao et al. [21] extended the model to two-dimensional cases. In addition to the inelastic models with a source term, a poro-elastoplastic model (DIANA-SWANDYNE II) was established by Chan [22] for earthquake-induced liquefaction by adopting the Pastor–Zienkiewicz Mark-III (PZIII) model [23]. This model was modified and applied to the problem of wave–seabed interactions around marine infrastructures, such as pipelines and breakwaters [24,25].
In natural ocean environments, the co-existence of waves and currents is a common physical phenomenon, and their interaction is an important topic in coastal and ocean engineering. The presence of a current in propagating waves directly changes the flow field and causes further changes to the soil response. On the basis of the analytical solution for wave–current interactions [26], Ye and Jeng [27] were the first to investigate the wave (current)-induced oscillatory soil response in a porous seabed. Following a similar framework, Wen et al. [28] further considered the case of a submarine pipeline by using the commercial software ABAQUS. Several analytical solutions based on different soil behaviors, such as quasi-static, partial dynamic, and full dynamic models, have been developed to describe the soil response to combined wave and current loading [29]. All of these approaches are based on the third-order analytical approximation for wave–current interactions [26]. Using the numerical model for wave–current interactions [30], Zhang et al. [31] further investigated the wave (current)-induced oscillatory pore pressures in a porous seabed. Recently, Liao et al. [32] proposed coupling models for residual seabed liquefaction subject to combined wave and current loading. Although numerous theoretical studies have been carried out since 2012, only two experimental studies for the wave (current)-induced oscillatory soil response are available in the literature [33,34]. These studies were used for the validation of the present model.
None of the aforementioned investigations have considered the effects of principal stress rotation (PSR) in a marine seabed, although the continuous rotation of principal stresses is an essential feature of soil’s dynamic response to cyclic loading. Unfortunately, because pure PSR is assumed, this process cannot be captured by a conventional elastoplastic model without changing the cyclic deviatoric stress amplitude of the plastic strain [35]. Several experimental results have confirmed that plastic strains are generated merely by altering the principal stress orientation in both monotonic and cyclic rotational shear tests [36,37]. On the basis of the generalized plasticity theory Zienkiewicz and Morz [38], as the first attempt, Sassa and Sekiguchi [35] developed a modified version of PZIII model by considering the effects of principal stress orientation. Their model defines a new major principal stress angle parameter that replaces potential plastic functions, the loading functions, and the plastic modulus. However, as Zhu et al. [39] pointed out, Sassa’s model [35] also has deficiencies; for example, it does not account for out-of-plane stress, which is a critical parameter in the determination of plastic flow conditions. Furthermore, the reloading effect is not considered in their model. Recently, Zhu et al. [39] proposed a modified constitutive model in which both the PSR and the out-of-plane stress are taken into consideration within the generalized plasticity theory framework. In contrast to Sassa’s model [35], this model was built to consider previous events during the reload by adding a discrete memory factor, and stress invariants were added at the same time to complete the optimization of the model. However, Zhu et al. [39] only considered linear wave theory in their model. The effects of PSR on the soil response to combined wave and current loading have not been reported in the literature.
In this paper, the constitutive model proposed by [39] is adopted, and the impact of PSR is included to examine the wave (current)-induced soil response in a sandy seabed. The theoretical model for both the flow model (wave–seabed interactions) and the seabed model (with PSR) are outlined first. The validation of the present model by both wave flume tests [33,34] and centrifugal tests [40] is then described. Finally, the results of the parametric study are reported to examine the effects of PSR with combined wave and current loading.
2. Theoretical Models
The present model consists of two submodels: flow and seabed submodels. A one-way coupling between the two different models is employed by the pressure continuity at the interface between the fluid and seabed domains. The fluid model is used to obtain the flow characteristics, such as wave motion, velocity field, wave pressures, etc. In the present model, the continuity of pressures is used to link the two submodels; that is, the dynamic fluid pressure is extracted and interpolated on the grid points of the solid model interface and serves as the pressure boundary condition for the seabed model. This approach has been commonly used by previous researchers [6,12,14,41,42].
The present study is based on the one-way coupling approach. Although one-way coupling has been widely used in the past and may still be effective in some cases, there are more recent approaches that effectively represent the water and bottom sediment coupled dynamics [43,44,45,46]. For example, Ran et al. [43] proposed an incompressible smoothed particle hydrodynamics (ISPH) scour model for movable bed dam break flows. Wang et al. [44] presented an ISPH simulation of scour behind seawall due to continuous tsunami overflow. Manenti et al. [45] adopted SPH model to investigate the Vajont disaster and compare their numerical simulation with 2D experiments. Wang et al. [46] further adopted their model [44] to 3D ISPH erosion model for flow passing a vertical cylinder. The technique could be further adopted to the present problem in the future.
The problem considered in this study is depicted in Figure 1. In the computation domain, the seabed thickness is h, and the water depth is d. The ocean wave propagates in the x-direction, while the z-axis is oriented upward from the seabed surface. The direction of the current can be the same as or opposite of the direction of wave propagation.
2.1. Flow Model
Recently, the open-source code OpenFOAM has become widely used for the simulation of various coastal/ocean engineering problems; for example, Waves2FOAM and IHFOAM have been used to study wave generation [47,48], wave–structure interactions, and other coastal engineering processes [49]. In this study, IHFOAM was adopted to describe the wave–current interactions. Basically, IHFOAM solves three-dimensional Volume-Averaged Reynolds-Averaged Navier–Stokes (VARANS) equations for two incompressible phases (water and air) using a finite volume discretization and volume of fluid (VOF) method. The governing equations, including mass conservation and momentum conservation equations, can be expressed as
where and are Darcy’s volume-averaging operator and the intrinsic averaging operator, respectively; is the density, computed by , in which is the indicator function defined in (4); is the velocity vector; n is the porosity; is the pseudo-dynamic pressures; is the gravitational acceleration; is the efficient dynamic viscosity, defined as , in which is the molecular dynamic viscosity and is the turbulent kinetic viscosity, given by the chosen turbulence model. In this study, the turbulence model is used. The last term in (2) represents the resistance of porous media and can be expressed as
where the factor C is less significant than factors A and B (refer to [50] for the values). A value of [kg/m] is often applied by default [51].
Each cell in the computational domain is considered a mixture of a two-phase fluid (air and water). The indicator function varies from 0 (air) to 1 (water); is defined as the quantity of water per unit of volume for each cell and calculated as follows:
Any variation of fluid properties, such as density and viscosity, can be represented using the indicator function considering the mixture properties:
where and are water and air properties, respectively, such as the density of the fluid.
The fluid’s movement can be tracked by solving the following advection equation [52]:
where , in which the default value of is 1.
The wave generation and active wave absorption in the fluid domain were implemented within IHFOAM. Several boundary conditions were introduced: (i) the inlet boundary condition allows for generating a wave according to different wave theories as well as adding different steady current flows; (ii) the outlet boundary condition applies an active wave absorption theory to prevent the re-reflection of an incoming wave; (iii) the slip boundary condition (zero-gradient) is applied on the bottom of the fluid domain and the lateral boundary of the numerical wave flume; (iv) the top boundary condition is set as the atmospheric pressure. For the details of IHFOAM, the readers can refer to Higuera et al. [48].
2.2. Seabed Model
In the literature, three different models of fluid–seabed interactions have been established on the basis of different soil behaviors: quasi-static (QS, i.e., the conventional consolidation model), partial dynamic (), and full dynamic (FD) models. All three are based on Biot’s porous theory [9,53]. Zienkiewicz et al. [54] proposed the approximation and examined the applicable range between and QS for earthquake loading. The framework has been further extended to the problem of wave–seabed interactions [10,11,12]. The applicable range of different models has been clarified for various soil types [11,12].
This paper establishes a two-dimensional model that considers the rotation of the principal stress axis to analyze the seabed response to combined dynamic loading due to wave–current interactions. The dynamic Biot’s equation proposed by Zienkiewicz et al. [54], the approximation, was adopted.
where and are the effective normal stresses in the x- and z-directions, respectively; is the shear stress; is the pore-water pressure; and represent the soil displacement in the x- and z-directions; is the gravitational acceleration; is the soil permeability; is the Laplace operator; n is soil porosity; is the average density of a porous seabed and defined by , in which is the fluid density while is the solid density.
In (9), the compressibility of the pore fluid is defined as [55]
where is the true bulk modulus of the elasticity of water (which can be taken as N/m [6]), is the degree of saturation, and is the absolute water pressure. When the soil is fully saturated (i.e., it is completely air-free), then since = 1.
The anisotropic elastic constitutive model cannot account for the directional effect of the principal stress or the dilatancy of sand. Compared with the elastic constitutive model, plastic constitutive models can more realistically simulate the stress–strain relationship of soil under dynamic load conditions and the accumulation of pore-water pressure. Therefore, Zhu et al. [39] proposed a plastic constitutive model, which was implemented in the DIANA-SWANDYNE II [22] finite element code. This code is used to analyze the seabed response of the principal stress axis to waves and ocean currents. In Zhu’s plastic constitutive model [39], the loading direction vector , the plastic flow direction vector , and plastic modulus are defined. For the theory of generalized plasticity, the loading function and plastic potential function do not need to be explicitly defined.
The elastic–plastic constitutive matrix can be expressed in tensorial notation as
where is the elastic stiffness tensor.
The loading direction vector and the plastic flow direction vector can be defined as
and
where is he control parameter to account for the effect of PSR; is the major principal stress angle; , a, and c are the principal stress orientation model parameters; and and are model parameters related to the stress ratio.
In addition, taking into account the effects of PSR, the plastic modulus is given as
where , , and are model parameters, and
where is the accumulated deviatoric plastic strain.
To consider the history of loading events throughout the reloading process, the discrete memory factor is introduced in the following:
and is the coefficient for the discrete memory factor.
The plastic modulus for unloading is
where and are original model parameters.
3. Model Verification
To validate the present model, two comparisons with previous experimental data are presented here. First, we compare the present model with the hollow cylinder apparatus (HCA) element tests [56] for the present constitutive model. Second, we compare the present model with the wave flume test for wave (current)-induced oscillatory pore-water pressures [33,34]. Third, we compare the present model with centrifugal tests [40] for the development of pore-water pressure build-up.
3.1. Comparison with Hollow Cylinder Apparatus (HCA) Element Tests
In the validation of the constitutive model with regard to PSR, the HCA elementary test is urgent in need due to its particular ability in simulation of the PSR through altering its control parameters such as axial load, torque, inner cell pressure, and outer cell pressure. Towhata and Ishihara [56] such a test with pure rotation of principal stress axis, in which the major principal stress orientation angle ranged from /4 to /4 with a constant deviatoric stress of 76.7 kPa. The main model parameters are shown in Table 1. The predicted results of the present model with PSR are plotted in Figure 2, in which the test data of Towhata and Ishihara [56] are also illustrated for comparison. It can be clearly seen that the adopted constitutive model present behaves well in capturing the effect of PSR on the development of volumetric strains with the constant amplitude of deviatoric stress. Moreover, the feasibility of the constitutive model with PSR is well validated by the good agreement between the predicted results and the measured data as shown in Figure 2.
3.2. Comparison with Laboratory Experiments for the Seabed Response to Waves and Currents
The second verification of the present model compares the present model’s results with experimental results. Qi and Gao [33] conducted a series of experiments to investigate the seabed response to different wave and current velocities around a single pile. In their experiments, a wave flume of 52 m × 1 m with a depth of 1.5 m was set over sandy soil. The depth of the sandy tank was 0.5 m. However, the data for the wave and opposite current cannot be adopted for the comparison with the numerical model because of the effect of the single pile, which was set in the middle of the experiments. Thus, only the cases of the wave alone and the wave with a following current (when waves and currents have the same direction of propagation) were used to verify the model. In their experiments, the pore-pressure build-up (i.e., residual mechanism) was not observed, i.e., the tests are in the range applicable to the oscillatory mechanism, for which the elastic model is used for comparison here.
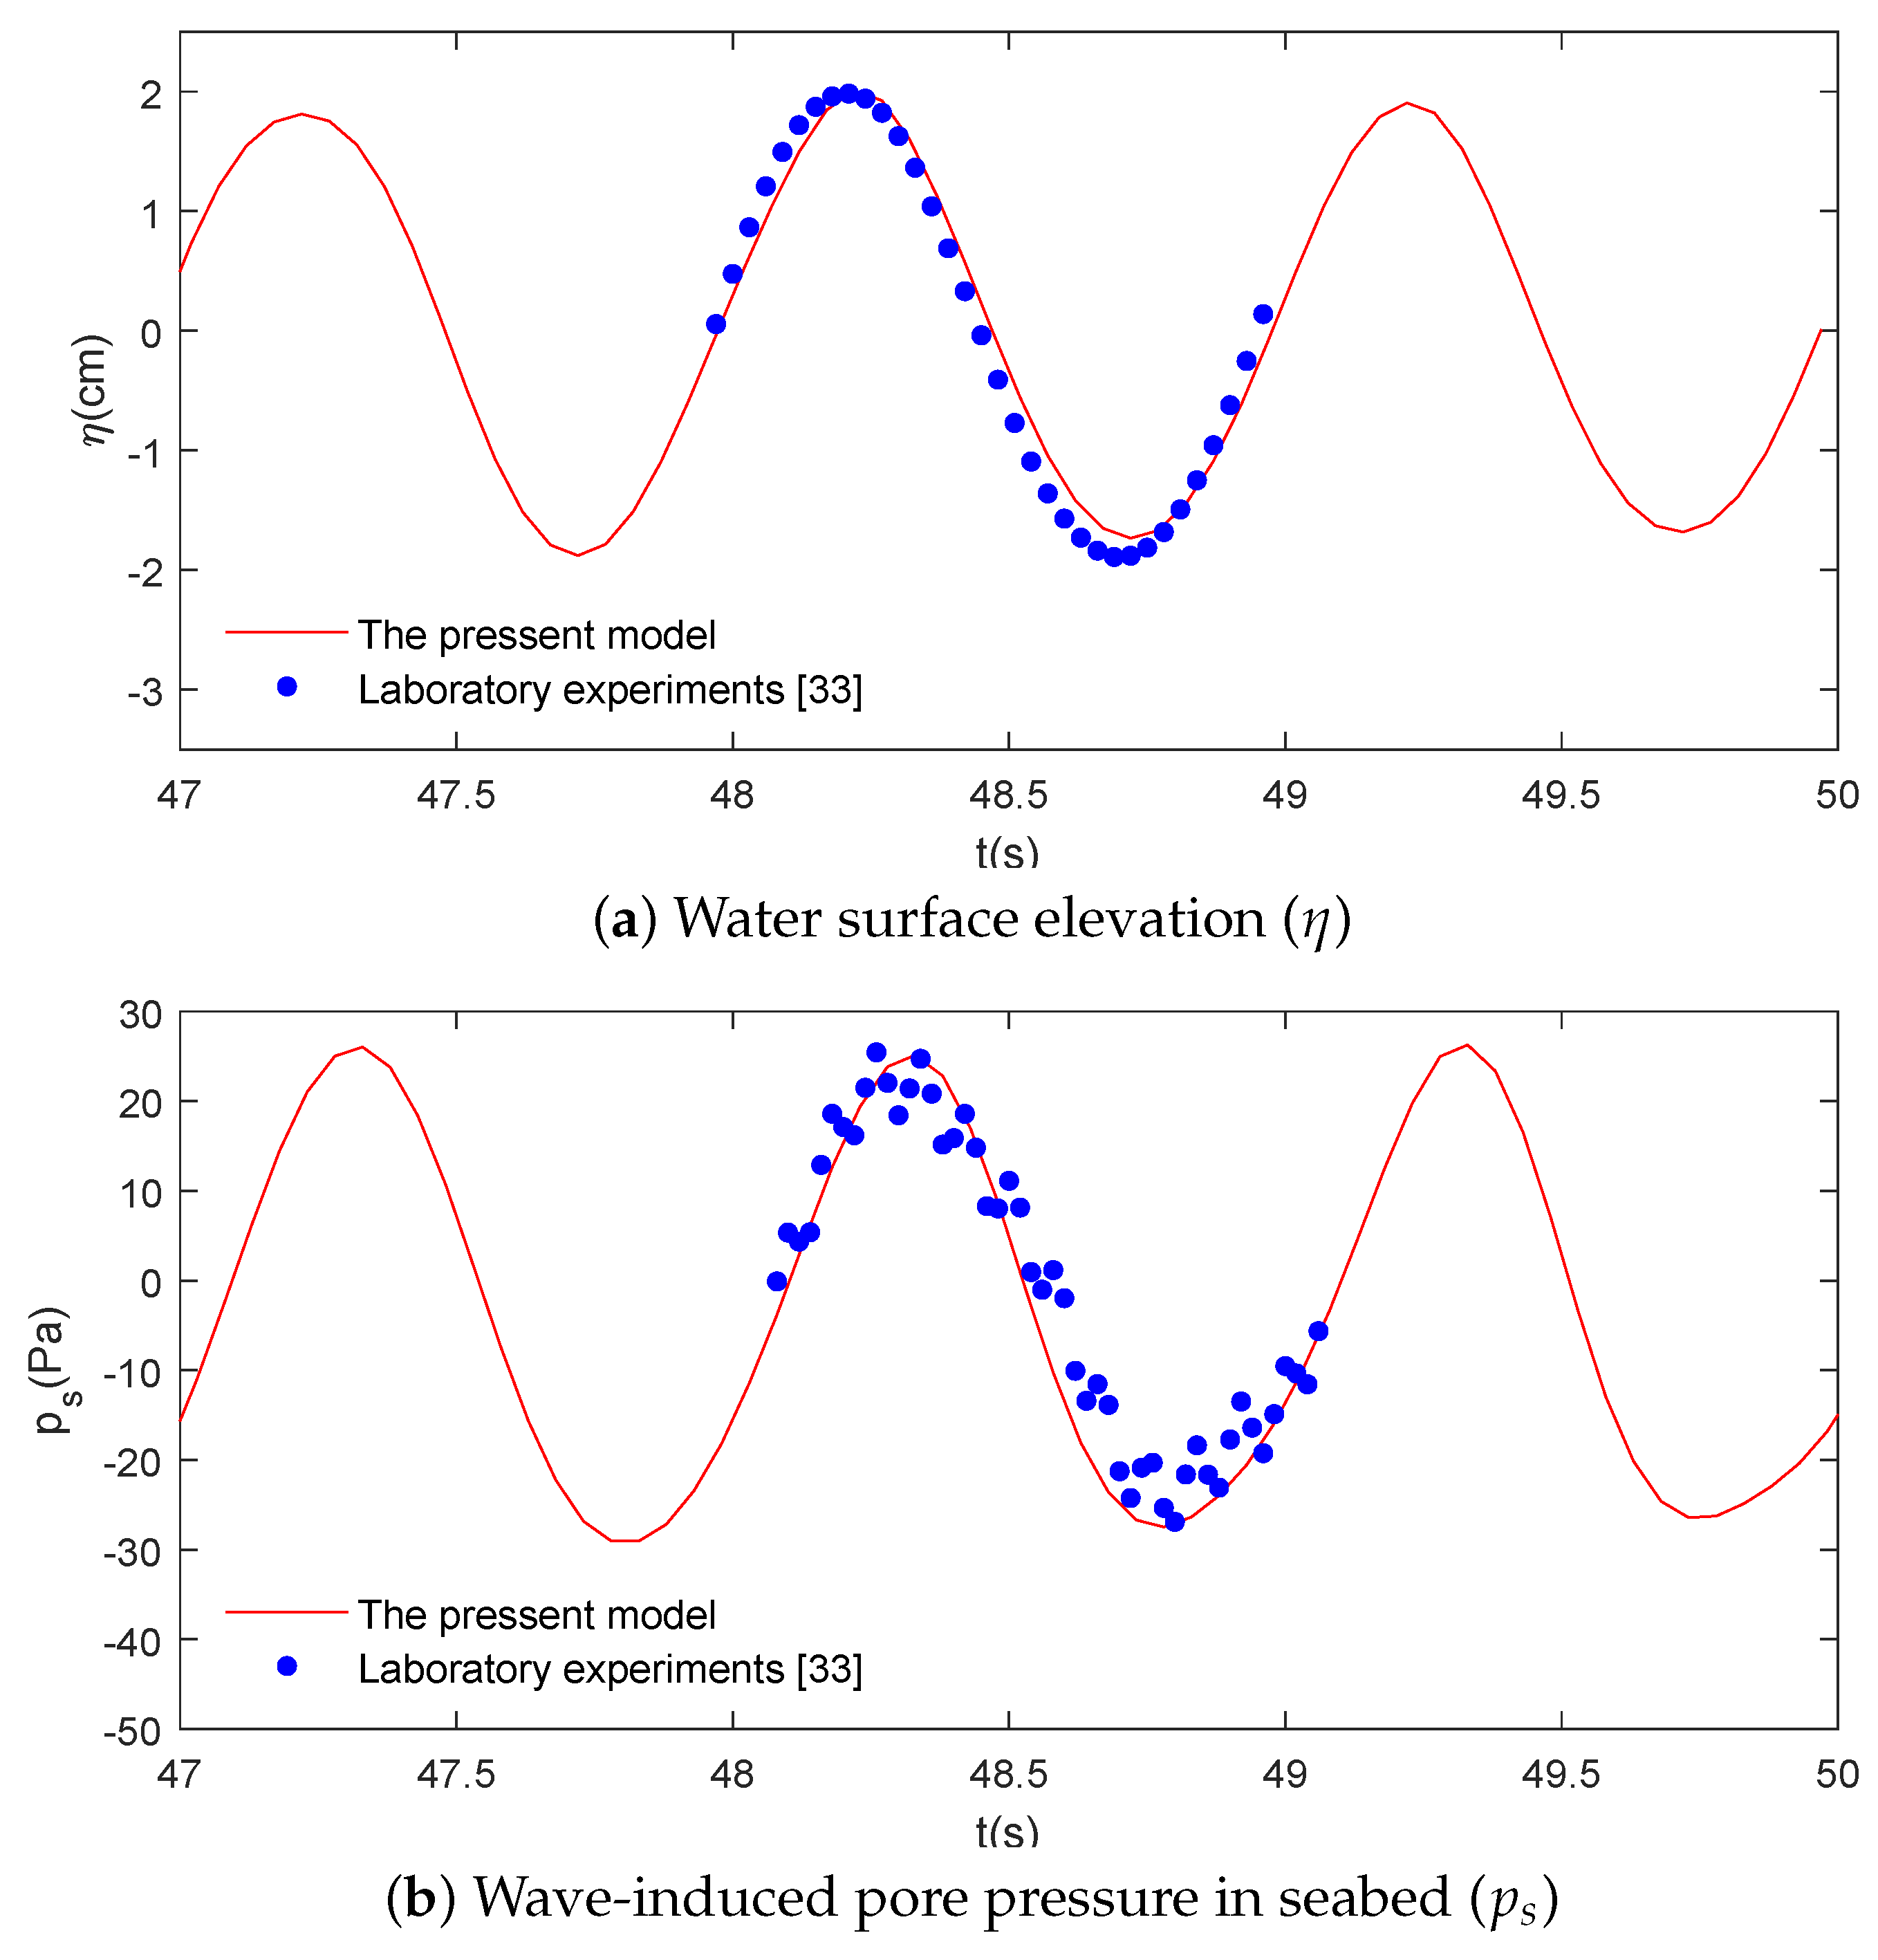
Using the same conditions as those of the wave flume tests [34], the following values are assumed: the water depth is 0.5 m; the soil model is set below the wave flume with a length of 2.4 m; and the thickness of the saturated soil layer is 0.5 m. The wave profile at the free surface and the corresponding pore-water pressure beneath 0.1 m of the seabed surface are compared. The numerical results of the wave profile and pore pressures have an overall agreement with the experimental data, as shown in Figure 3 and Figure 4.
In the above comparisons, the top subfigures show the water surface elevation and the bottom subfigures show the pore-water pressures at 10 cm beneath the seabed surface. As shown in Figure 3 and Figure 4, the present model predicts the wave profiles () well, but the pore-water pressures present some differences between the numerical results and experimental data, although the general trends are in agreement.
3.3. Comparison with Centrifuge Tests and Previous Numerical Model for the Seabed Response To Waves
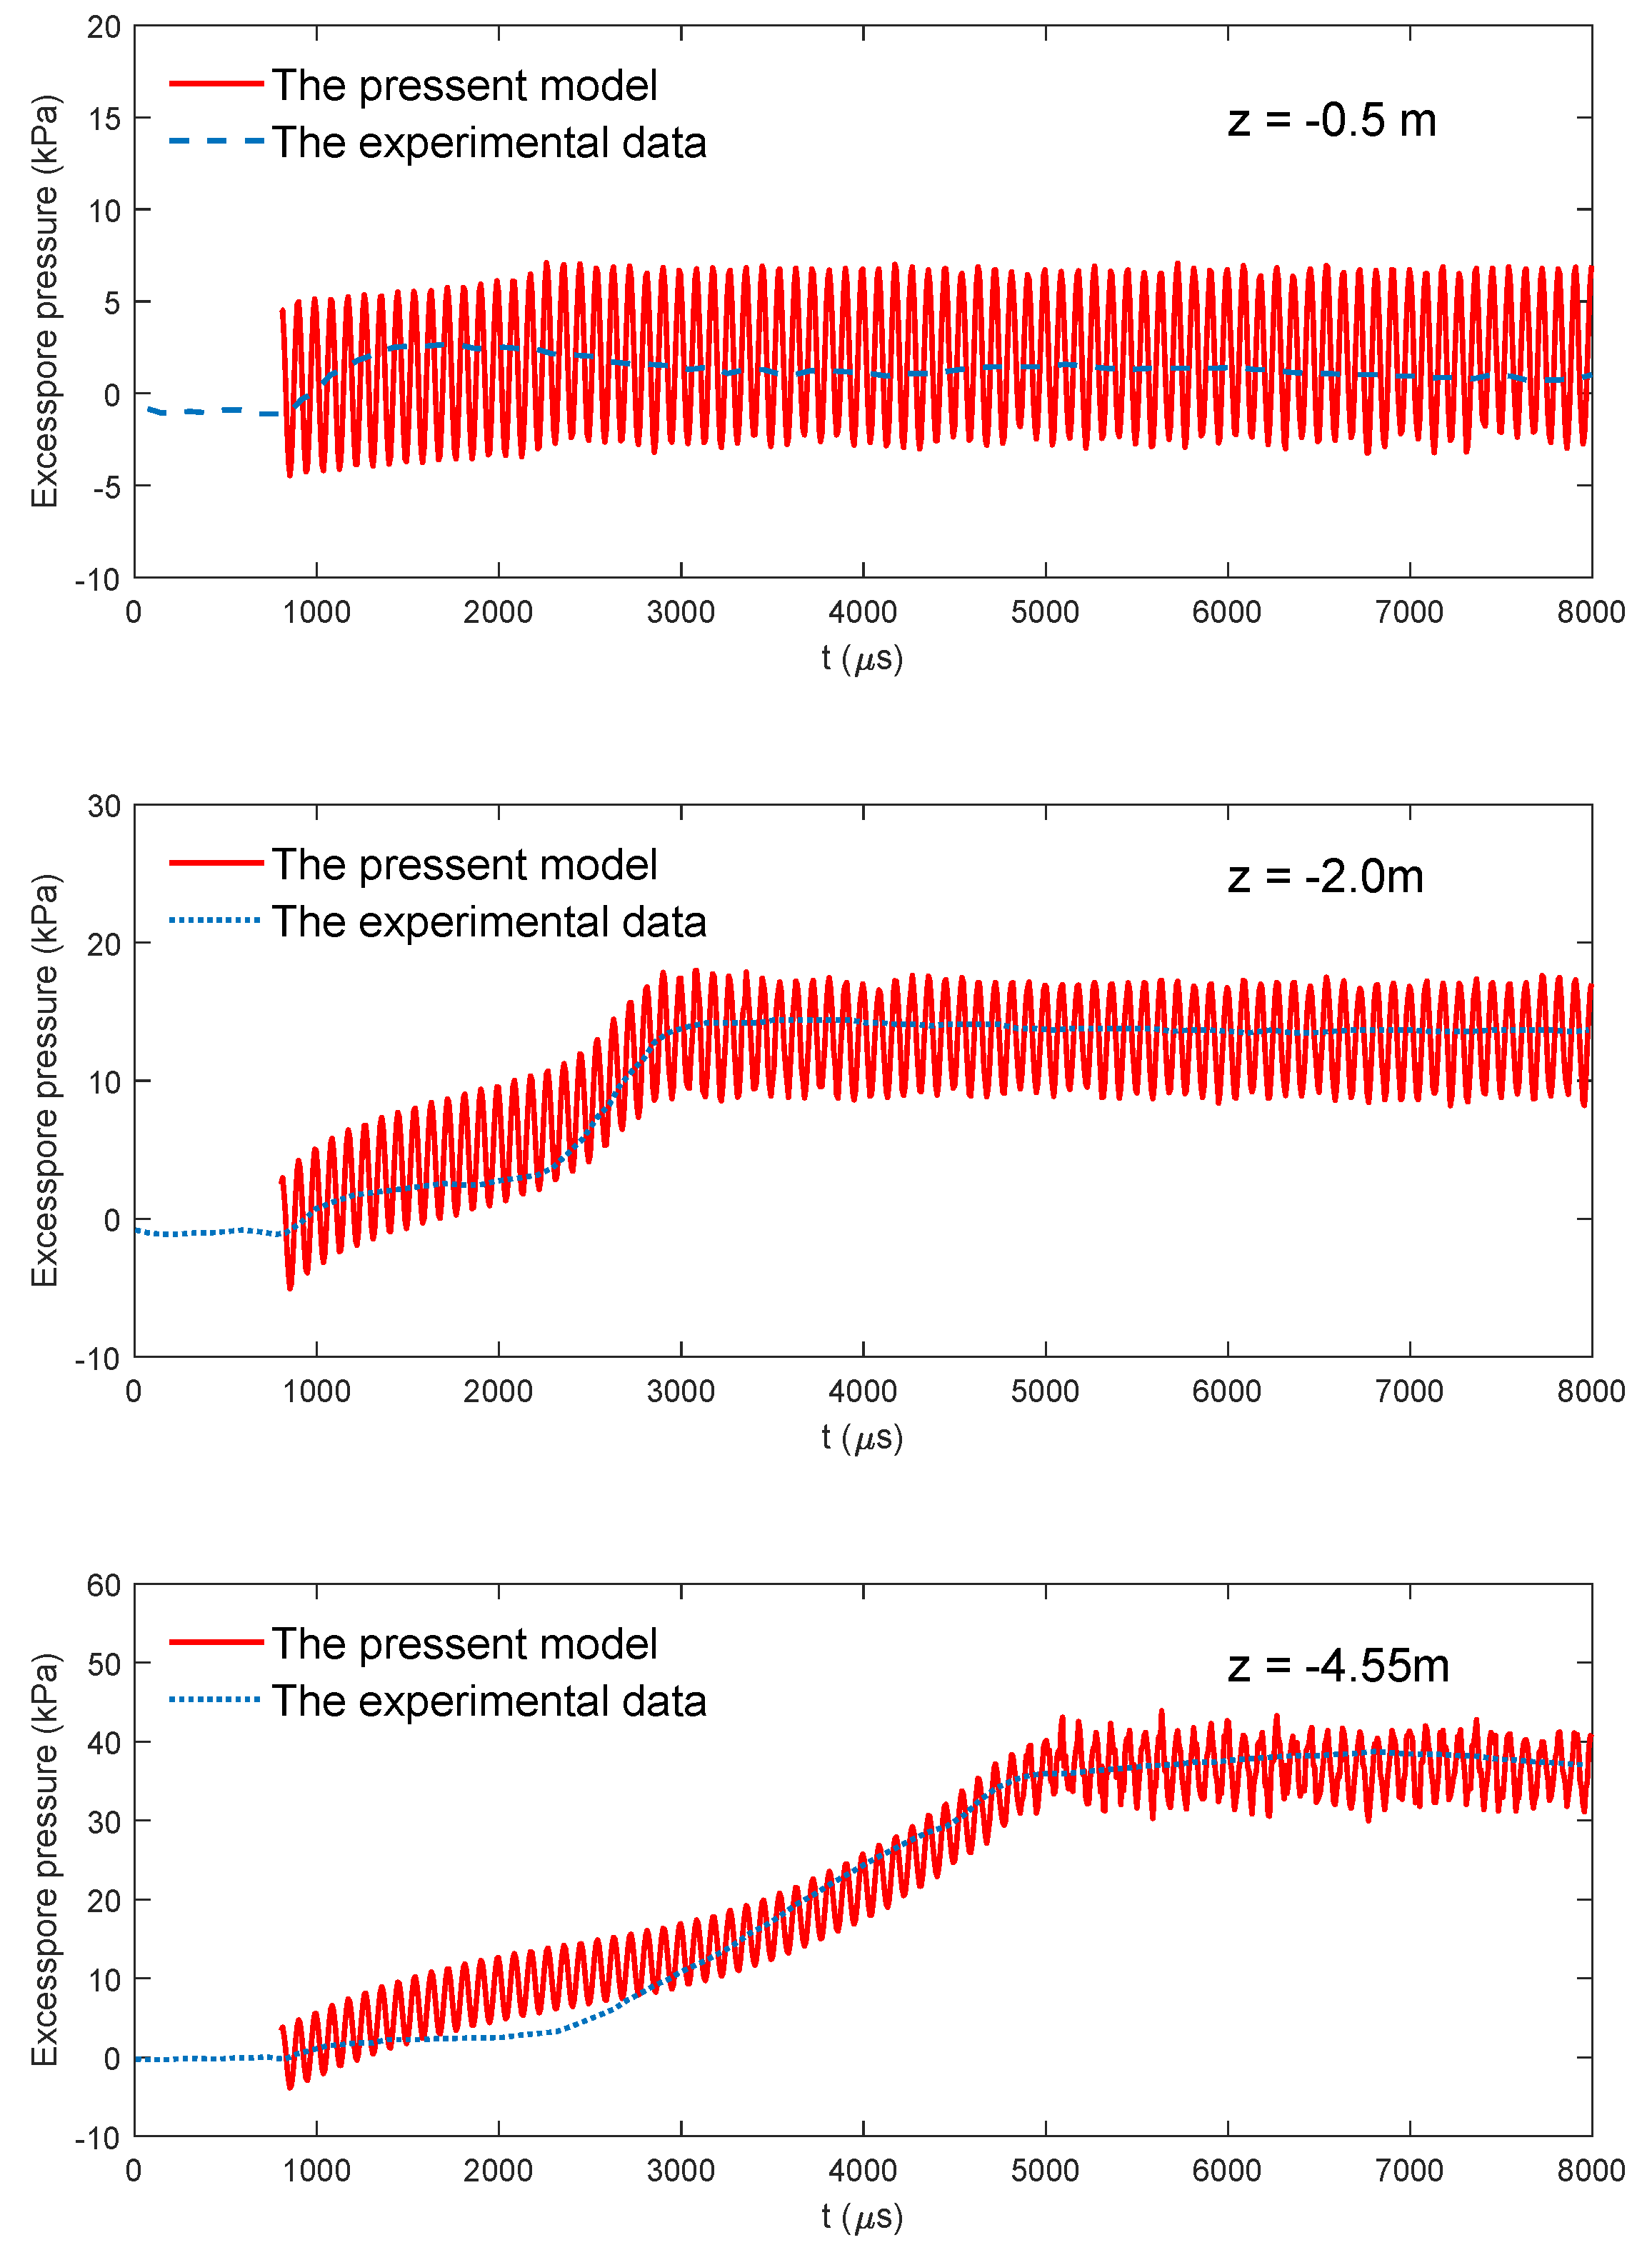
Sassa and Sekiguchi [40] carried out a series of geotechnical centrifuge tests to investigate the process of wave-induced liquefaction in a sandy seabed. To verify the present model, we reproduced the experimental conditions and compared the results with the centrifugal experimental data [40]. Their wave tests were all performed with a centrifugal acceleration of 50 g (where g is the gravitational acceleration). The soil bed was 200 mm in width and 100 mm in depth. The submerged unit weight of soil, , was equal to 425 kN/m, and the wave number, , was 12.2 m. The corresponding wave loading intensity and cyclic stress ratio () were 5.0 kPa and 0.14, respectively. Other input data are listed in Table 2. In the numerical model, we converted the problem back to an environment with a gravitational acceleration of 1. As shown in Figure 5, in general, the present model has an overall agreement with the centrifuge tests [40]. By examining the comparisons closely, we observe that the present model can capture the magnitude of the maximum pore-water pressures and the time it takes to reach the maximum pore water pressures. However, there are some differences between the numerical prediction and the centrifugal tests that occur during the pore-water pressure build-up. This implies that the present model requires further improvement. However, the magnitude of the maximum pore pressures directly affects the liquefaction depth, which is more important for practical engineering design. Therefore, the present model can provide sufficient information for engineering design.
In addition to the comparison with the centrifugal tests [40], the present model is also compared with Sassa’s numerical model [35] in Figure 6. The phenomenon of pore pressure build-up can be observed in the first several wave cycles. After a certain wave period, reaches its peak value and stabilizes because liquefaction occurs. In the present model, the calculated time it takes for the residual pore pressure to reach its peak is 1100 s, which is less than that predicted by Sassa and Sekiguchi [35] (1200 s). This is because Sassa and Sekiguchi [35] did not consider the effect of out-of-plane stress, which is important for determining the plastic flow direction [57,58,59].
4. Results and Discussion
In this study, two new features were incorporated into an existing model for soil response: (1) PSR effects and (2) the combined wave and current loading. In this section, the seabed is considered to be an elastoplastic medium, and the discussed results are from simulations using the generalized plasticity model PZIII and modified PZIII model with PSR in the finite element analysis program DIANA-SWANDYNE II. Nevada dense sand was adopted for a seabed with elastoplastic behavior, and the soil parameters, given by Sassa and Sekiguchi [40], were determined experimentally and are specified in Table 3. In the computations, the seabed length = 180 m, and seabed thickness d = 30 m. In order to ensure the numerical convergence suggested by Ye et al. [42], in the numerical model, the maximum horizontal mesh size was less than the wavelength , where is 88 m, and the maximum vertical mesh size was half of the horizontal mesh size. Therefore, the horizontal mesh size and vertical mesh size were 1 m and 0.5 m, respectively. Furthermore, the time step t was T/40, where T is the wave period and equal to 8 s in this study.
4.1. Seabed Liquefaction
Generally, the literature reports two different mechanisms of fluid-induced soil liquefaction [3]: momentary liquefaction and residual liquefaction. Momentary liquefaction normally occurs near the wave trough and in an unsaturated seabed when the upward seepage force is higher than the overlying pressure. However, the effect of momentary liquefaction is much smaller than that of residual liquefaction on the stability of offshore structures. As mentioned previously, the soil gradually loses stability as the wave spreads over the surface of the seabed. When the pore-water pressure increases, the effective stress between soil particles decreases. The condition for residual liquefaction occurs when the pore pressure reaches the maximum value and the effective stress approaches zero, at which point the soil loses its bearing capacity. The seabed’s instability is a consequence of the horizontal or vertical movement of soil particles [1]. In such a situation, the soil acquires the behavior of a liquid. The liquefaction of the seabed has an essential impact on the safety of offshore structures.
In order to quantitatively study the liquefaction characteristics of the sandy seabed involving PSR effects, a parameter called liquefaction potential is introduced, as defined below.
where is the wave (current)-induced dynamic vertical effective stress and is the initial vertical effective stress.
With the liquefaction criterion proposed by Okusa [60], the sandy seabed liquefies at . In practice, however, the value of may not reach 1. This is because sand is a non-viscous granular material and cannot withstand any tensile stress. Wu et al. [61] suggested that the adjustment coefficient should be 0.78–0.99 for liquefaction in sandy soils according to different soil characteristics. In this study, it is assumed that soil liquefaction occurs when the liquefaction potential reaches 0.9.
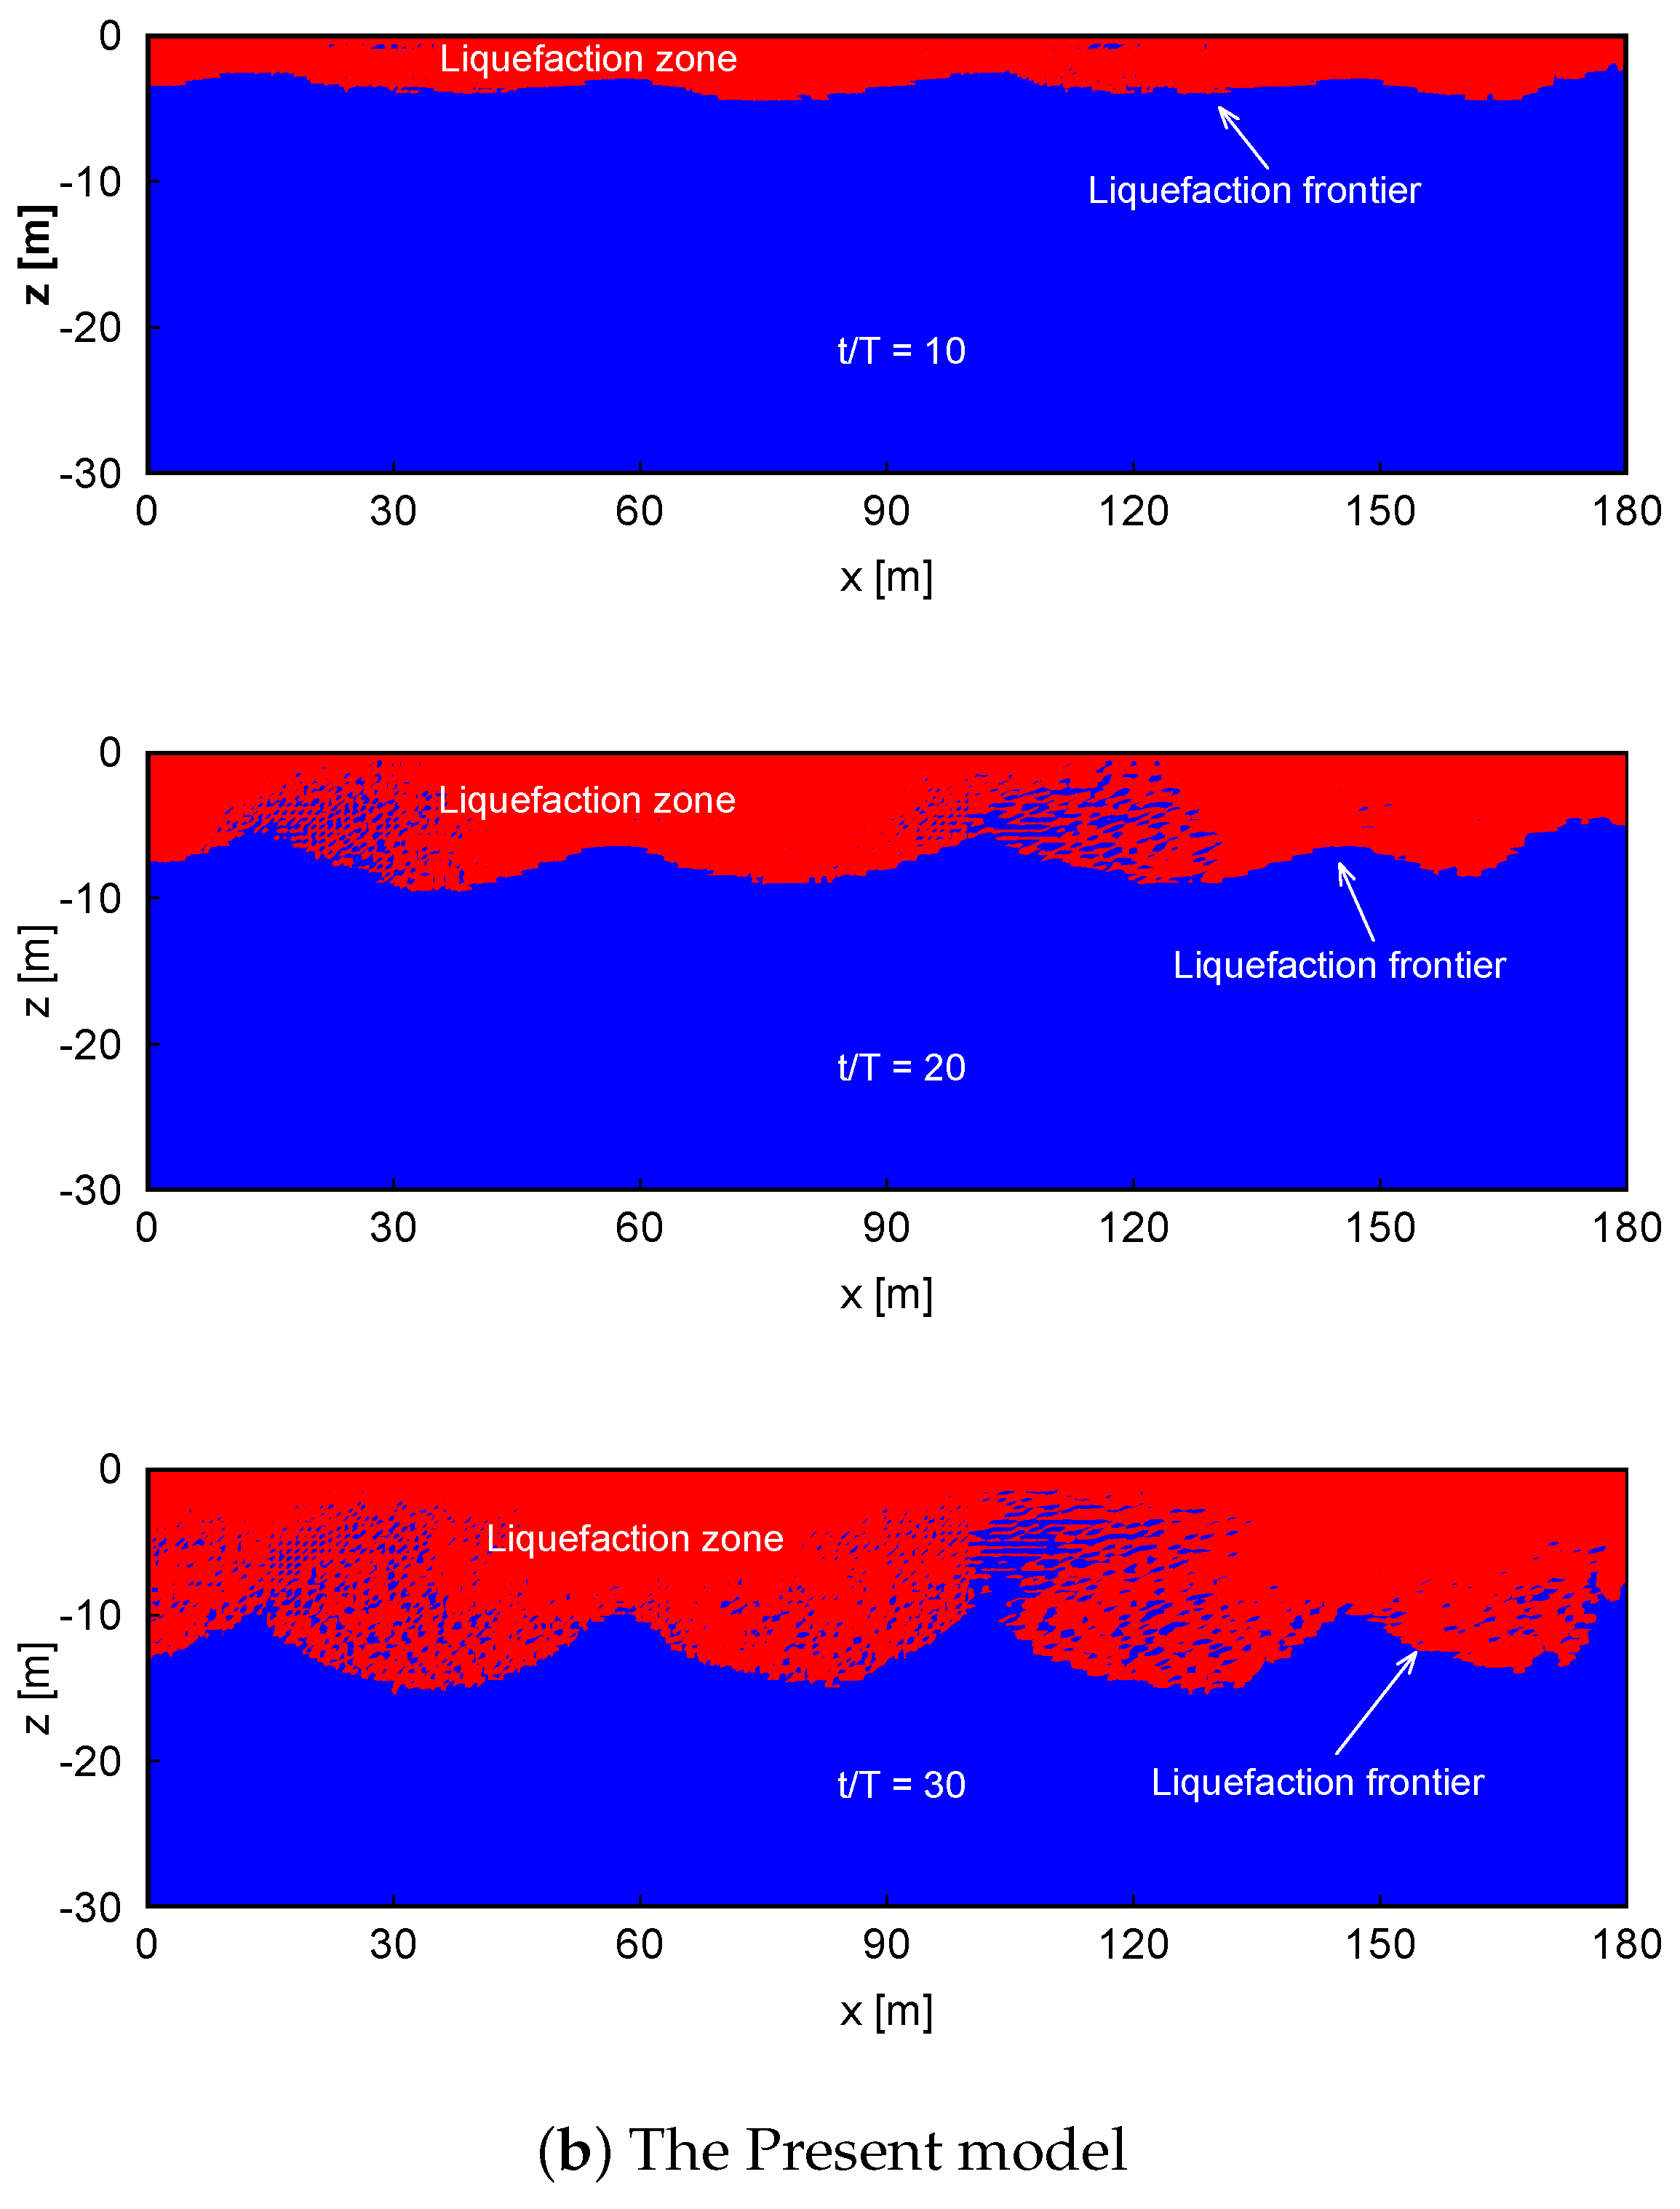
Figure 7 shows the liquefaction zone of soils at different times for the same wave condition. The numerical results for two cases—with and without PSR taken into account—are included. As shown in the figure, after 10 wave cycles, the seabed in the original PZIII model just begins to liquefy, and the liquefaction depth is less than 1 m. However, the seabed in the PSR model is markedly liquefied, and the depth is about 4 m. After 20 cycles of continuous wave action on the seabed surface, the depth of soil liquefaction changes slightly in the original PZIII model. However, in the present model, the liquefaction depth increases from 4 meters to 8 m. At the end of the simulation, the soil liquefaction depth in the original PZIII model is about 2 m. However, when considering the effect of PSR, the liquefaction depth increases to 14 m in the present model. It can be inferred that PSR plays a vital role in the stability of the seabed, and it also has an essential influence on the liquefaction depth. If the influence of PSR is neglected, the likelihood of the liquefaction of a sandy seabed is seriously underestimated, which poses a significant threat to coastal engineering.
Please note that the present model does not consider the process of progressive liquefaction (i.e., post-liquefaction). This is why the predicted liquefaction depth in Figure 7 is large (up to 14 m). As reported in the literature regarding wave-induced post-liquefaction [20,62], the maximum liquefaction depth approaches a constant value when the concept of progressive liquefaction is taken into account. However, this concept is not included in the present model. Therefore, the predicted liquefaction depth at = 30 may be overestimated. This indicates that the existing model requires further improvement.
4.2. Effect of Currents
Waves and currents usually coexist in the natural marine environment, and the effects of currents on the seabed cannot be ignored. Currents not only change the length and direction of wave propagation but also affect the stability of the seabed. In this section, to demonstrate the effects of currents with PSR on the seabed response, a velocity of 1 m/s for both following and opposing currents was added to the present model to compare the soil response with the principal stress axis rotation (subject to combined wave and current loading). The term “following current” means that waves and currents propagate in the same direction, and the term “opposing current” indicates the opposite direction of waves and currents.
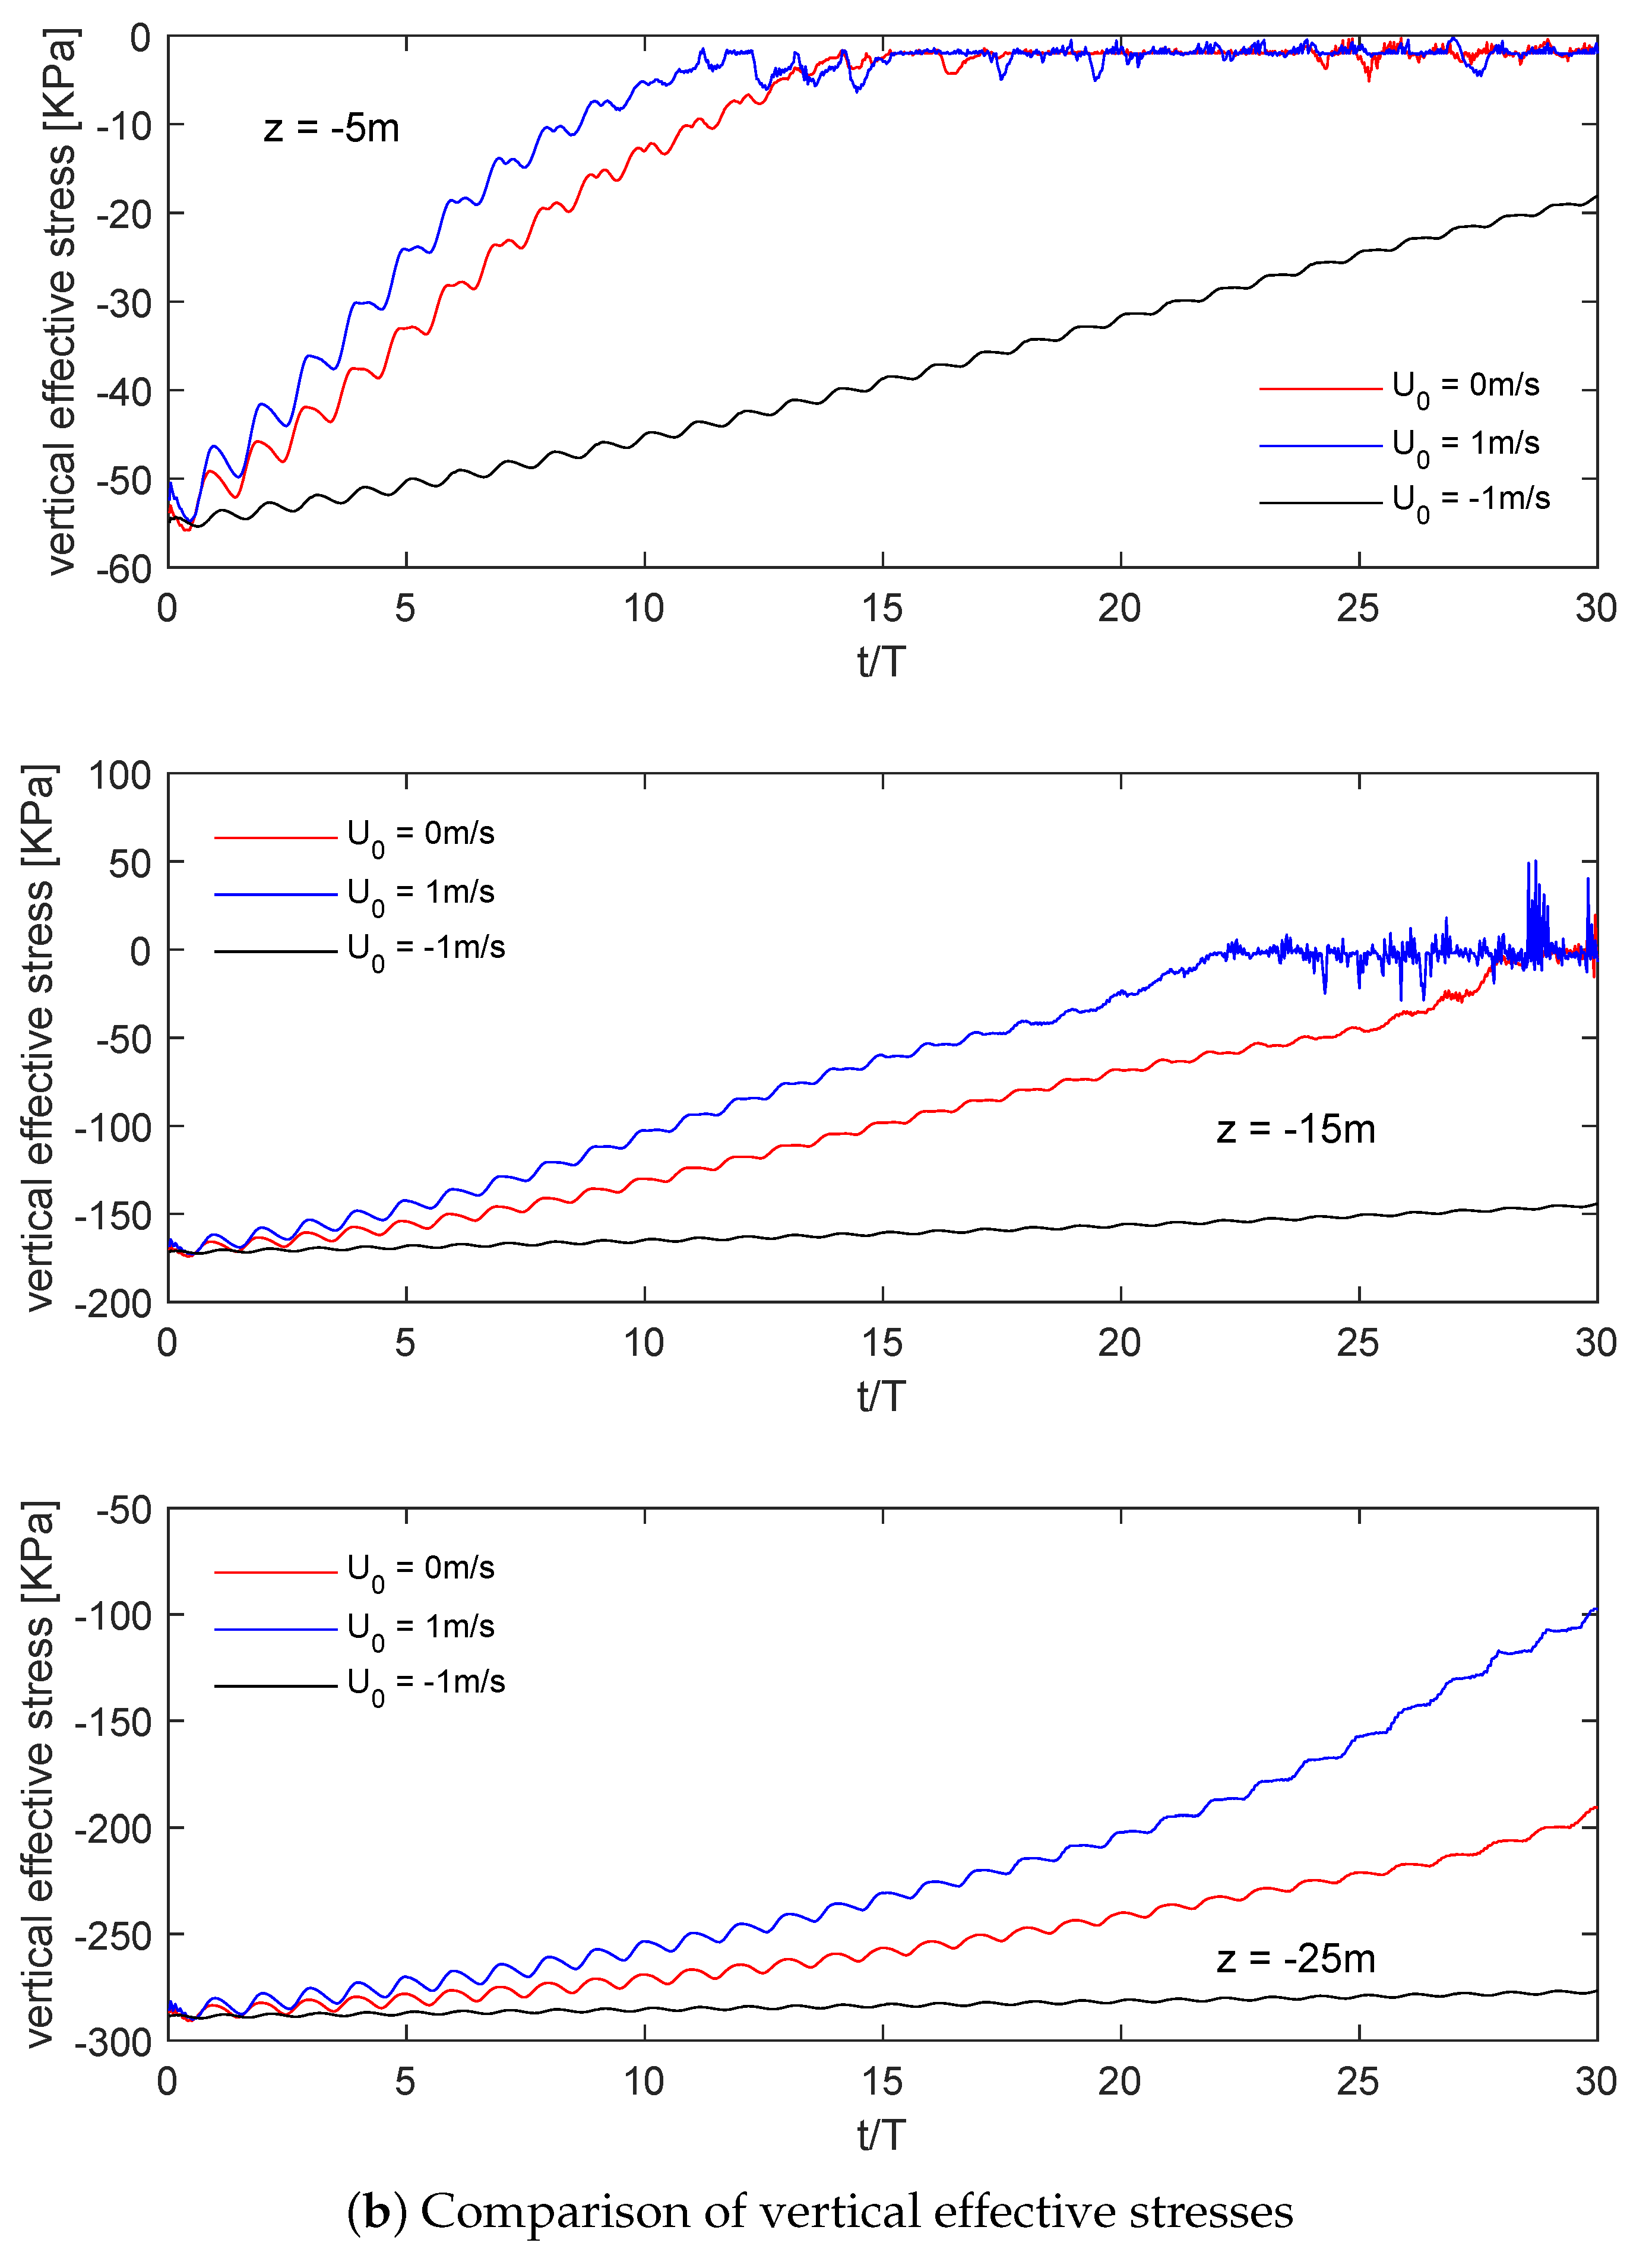
Figure 8 plots the variation in pore-water pressure and effective stress between soil particles for different current directions (following current = 1 m/s, no current = 0, and opposing current = −1 m/s). As seen from the figure, among the three cases, the soil for which the direction of current propagation is the same as that of wave propagation is liquefied first. When the current’s direction is opposite of the wave propagation direction, the instability of soil liquefaction is effectively prevented. It is also noted that the pattern of the liquefaction zone is wave-like in appearance. A possible explanation is that the water particles move in the horizontal direction with combined wave and current loading, causing the wave pattern in the liquefaction zone. Unfortunately, there is no experimental evidence available to confirm these two findings. More detailed experimental works are required in the future. As shown in the figure, for the case with a following current, the seabed at z = −15 m is liquefied after 22 wave cycles, while liquefaction occurs after 28 wave cycles for the case without a current. However, the soil with reverse current experiences 30 wave cycles and does not show liquefaction.
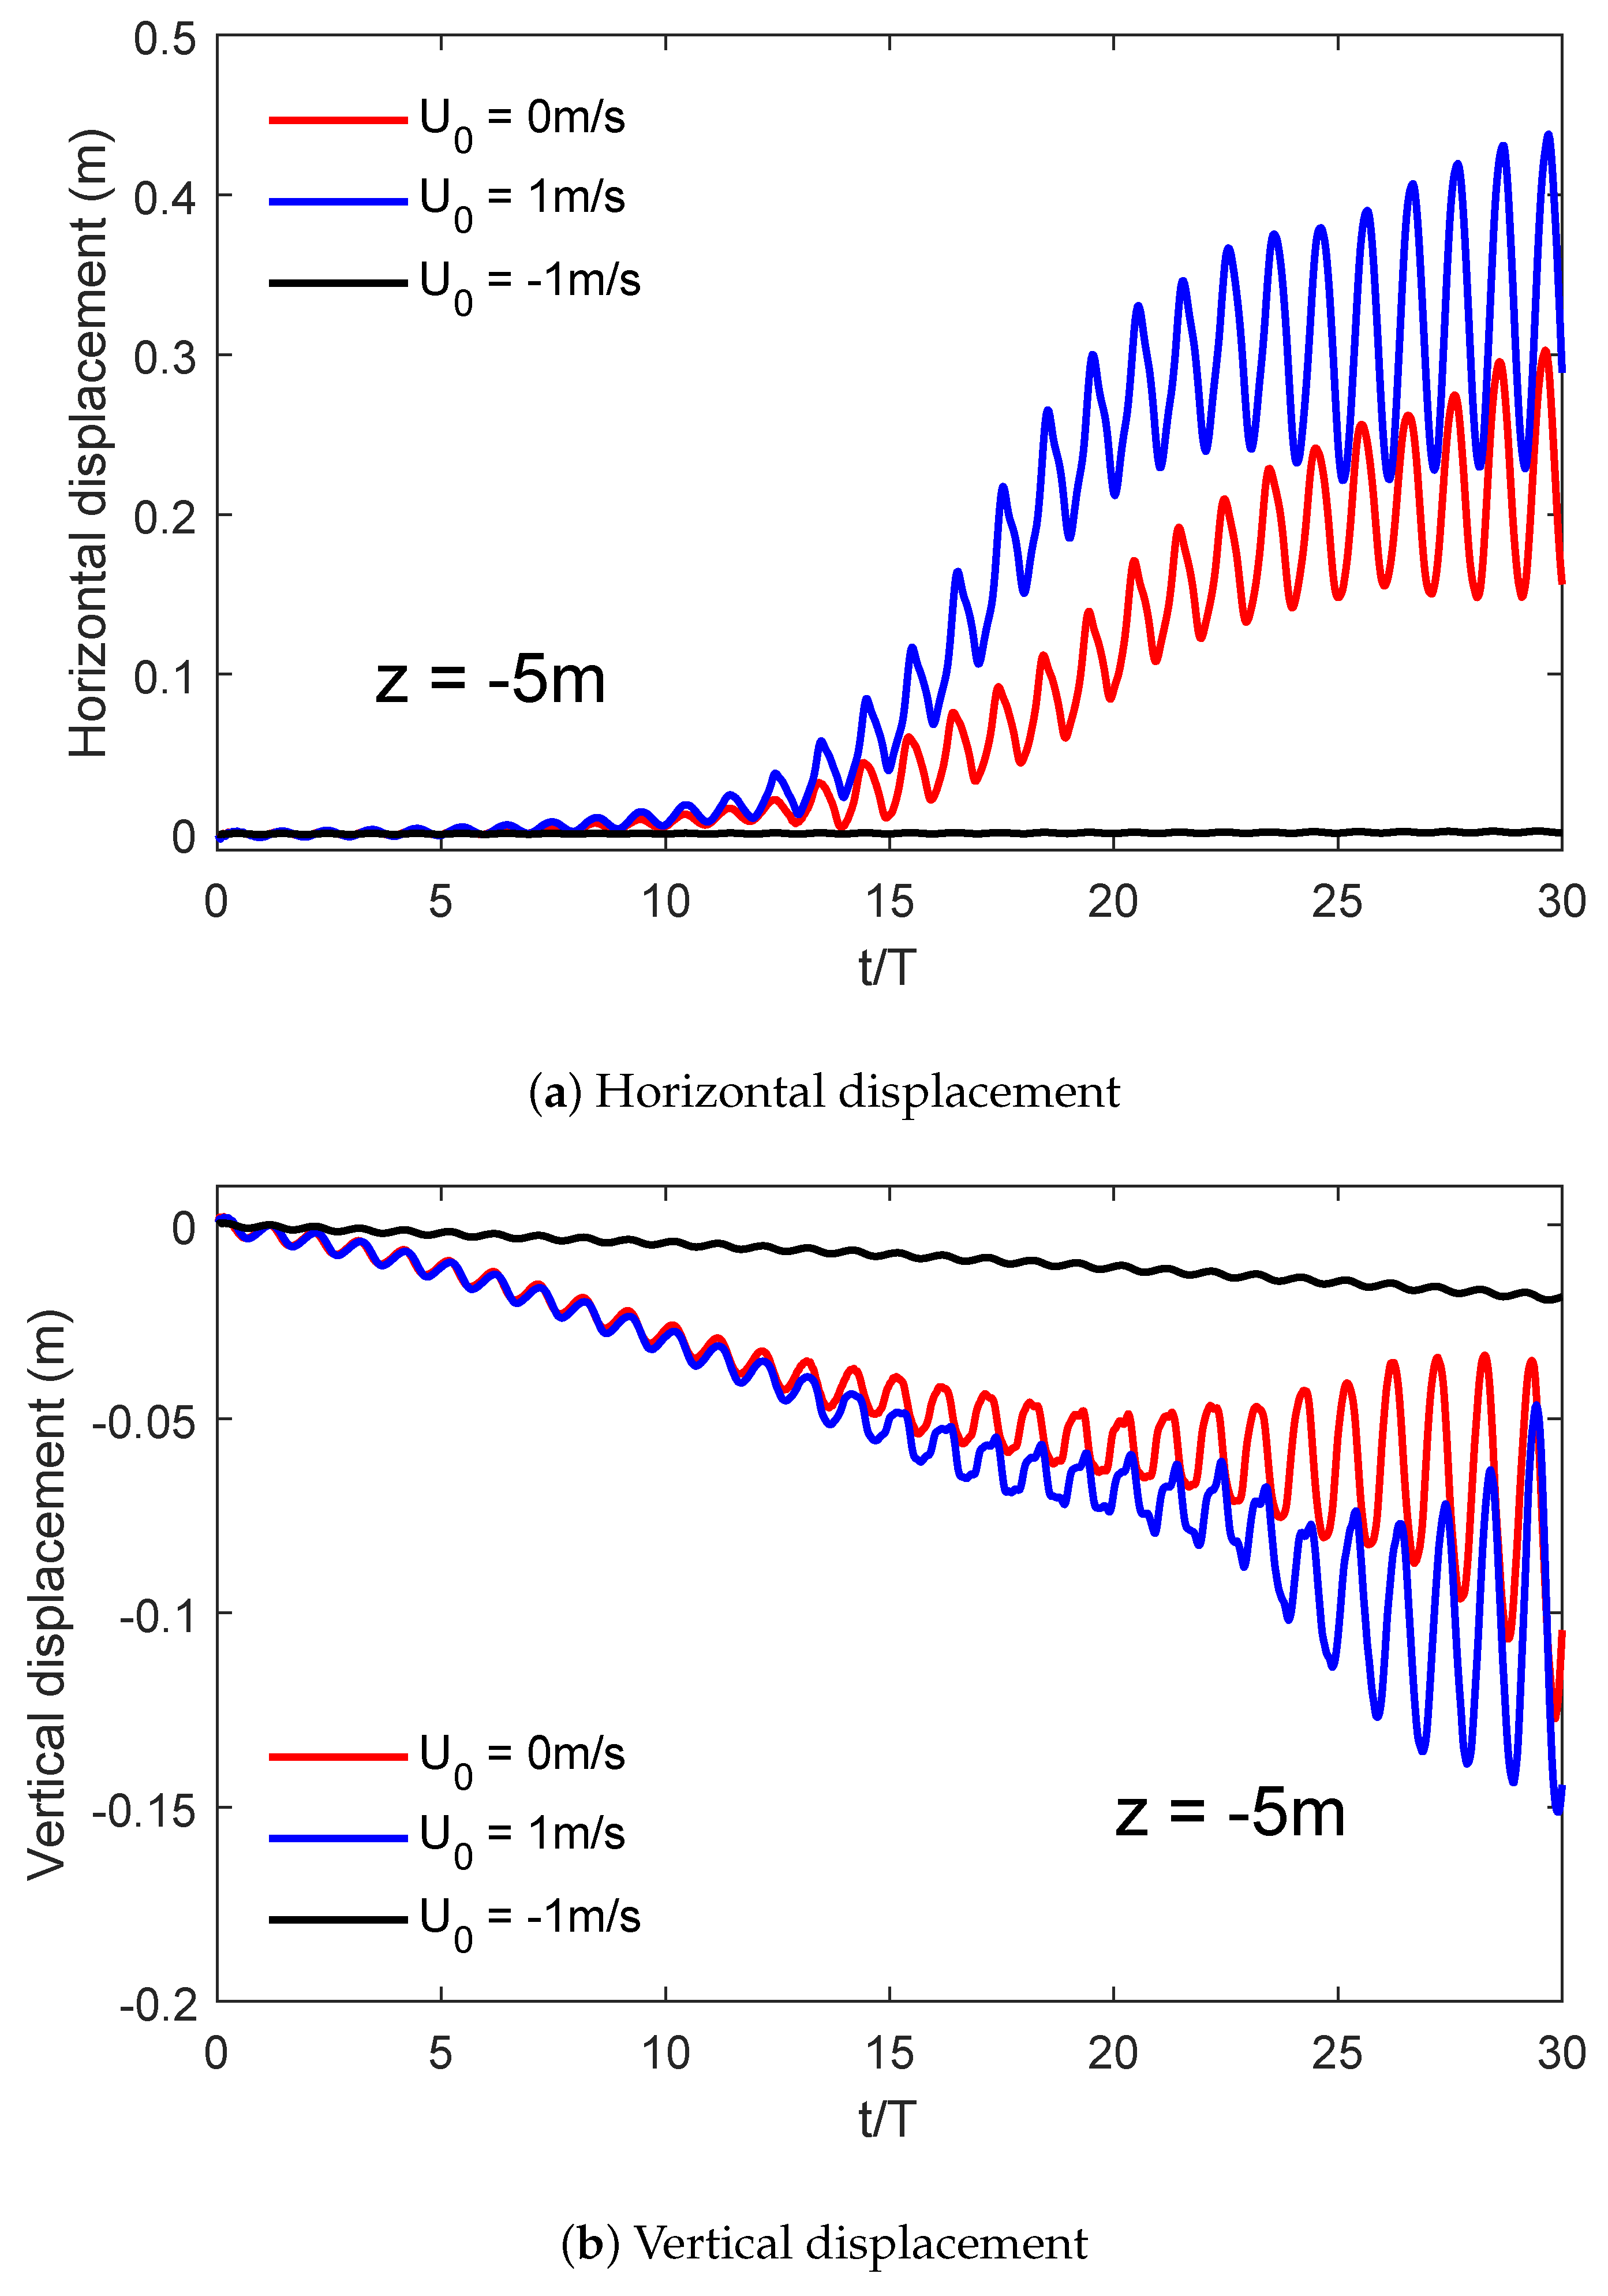
Figure 9 shows the horizontal and vertical displacements of soil particles for different directional currents at a depth of 5 m. It can be seen from the figure that the lateral displacement of soil remains almost unchanged before soil liquefaction, but the vertical displacement increases continuously. After 13 wave cycles, the liquefaction of soils occurs for both cases (with following current and no current), and the transverse displacement increases rapidly with time. This trend is more evident in the presence of the following current. In the vertical direction, the vibration amplitude of soil displacement is gentle, but when the soil is liquefied, the vibration of vertical displacement is significant. This phenomenon shows that before soil liquefaction, soil particles are continuously compressed, and pore-water pressure gradually rises but does not dissipate. These conditions eventually lead to soil liquefaction when pore pressure is higher than the vertical effective stress. When the soil loses its stability after liquefaction, the transverse and vertical displacements change significantly.
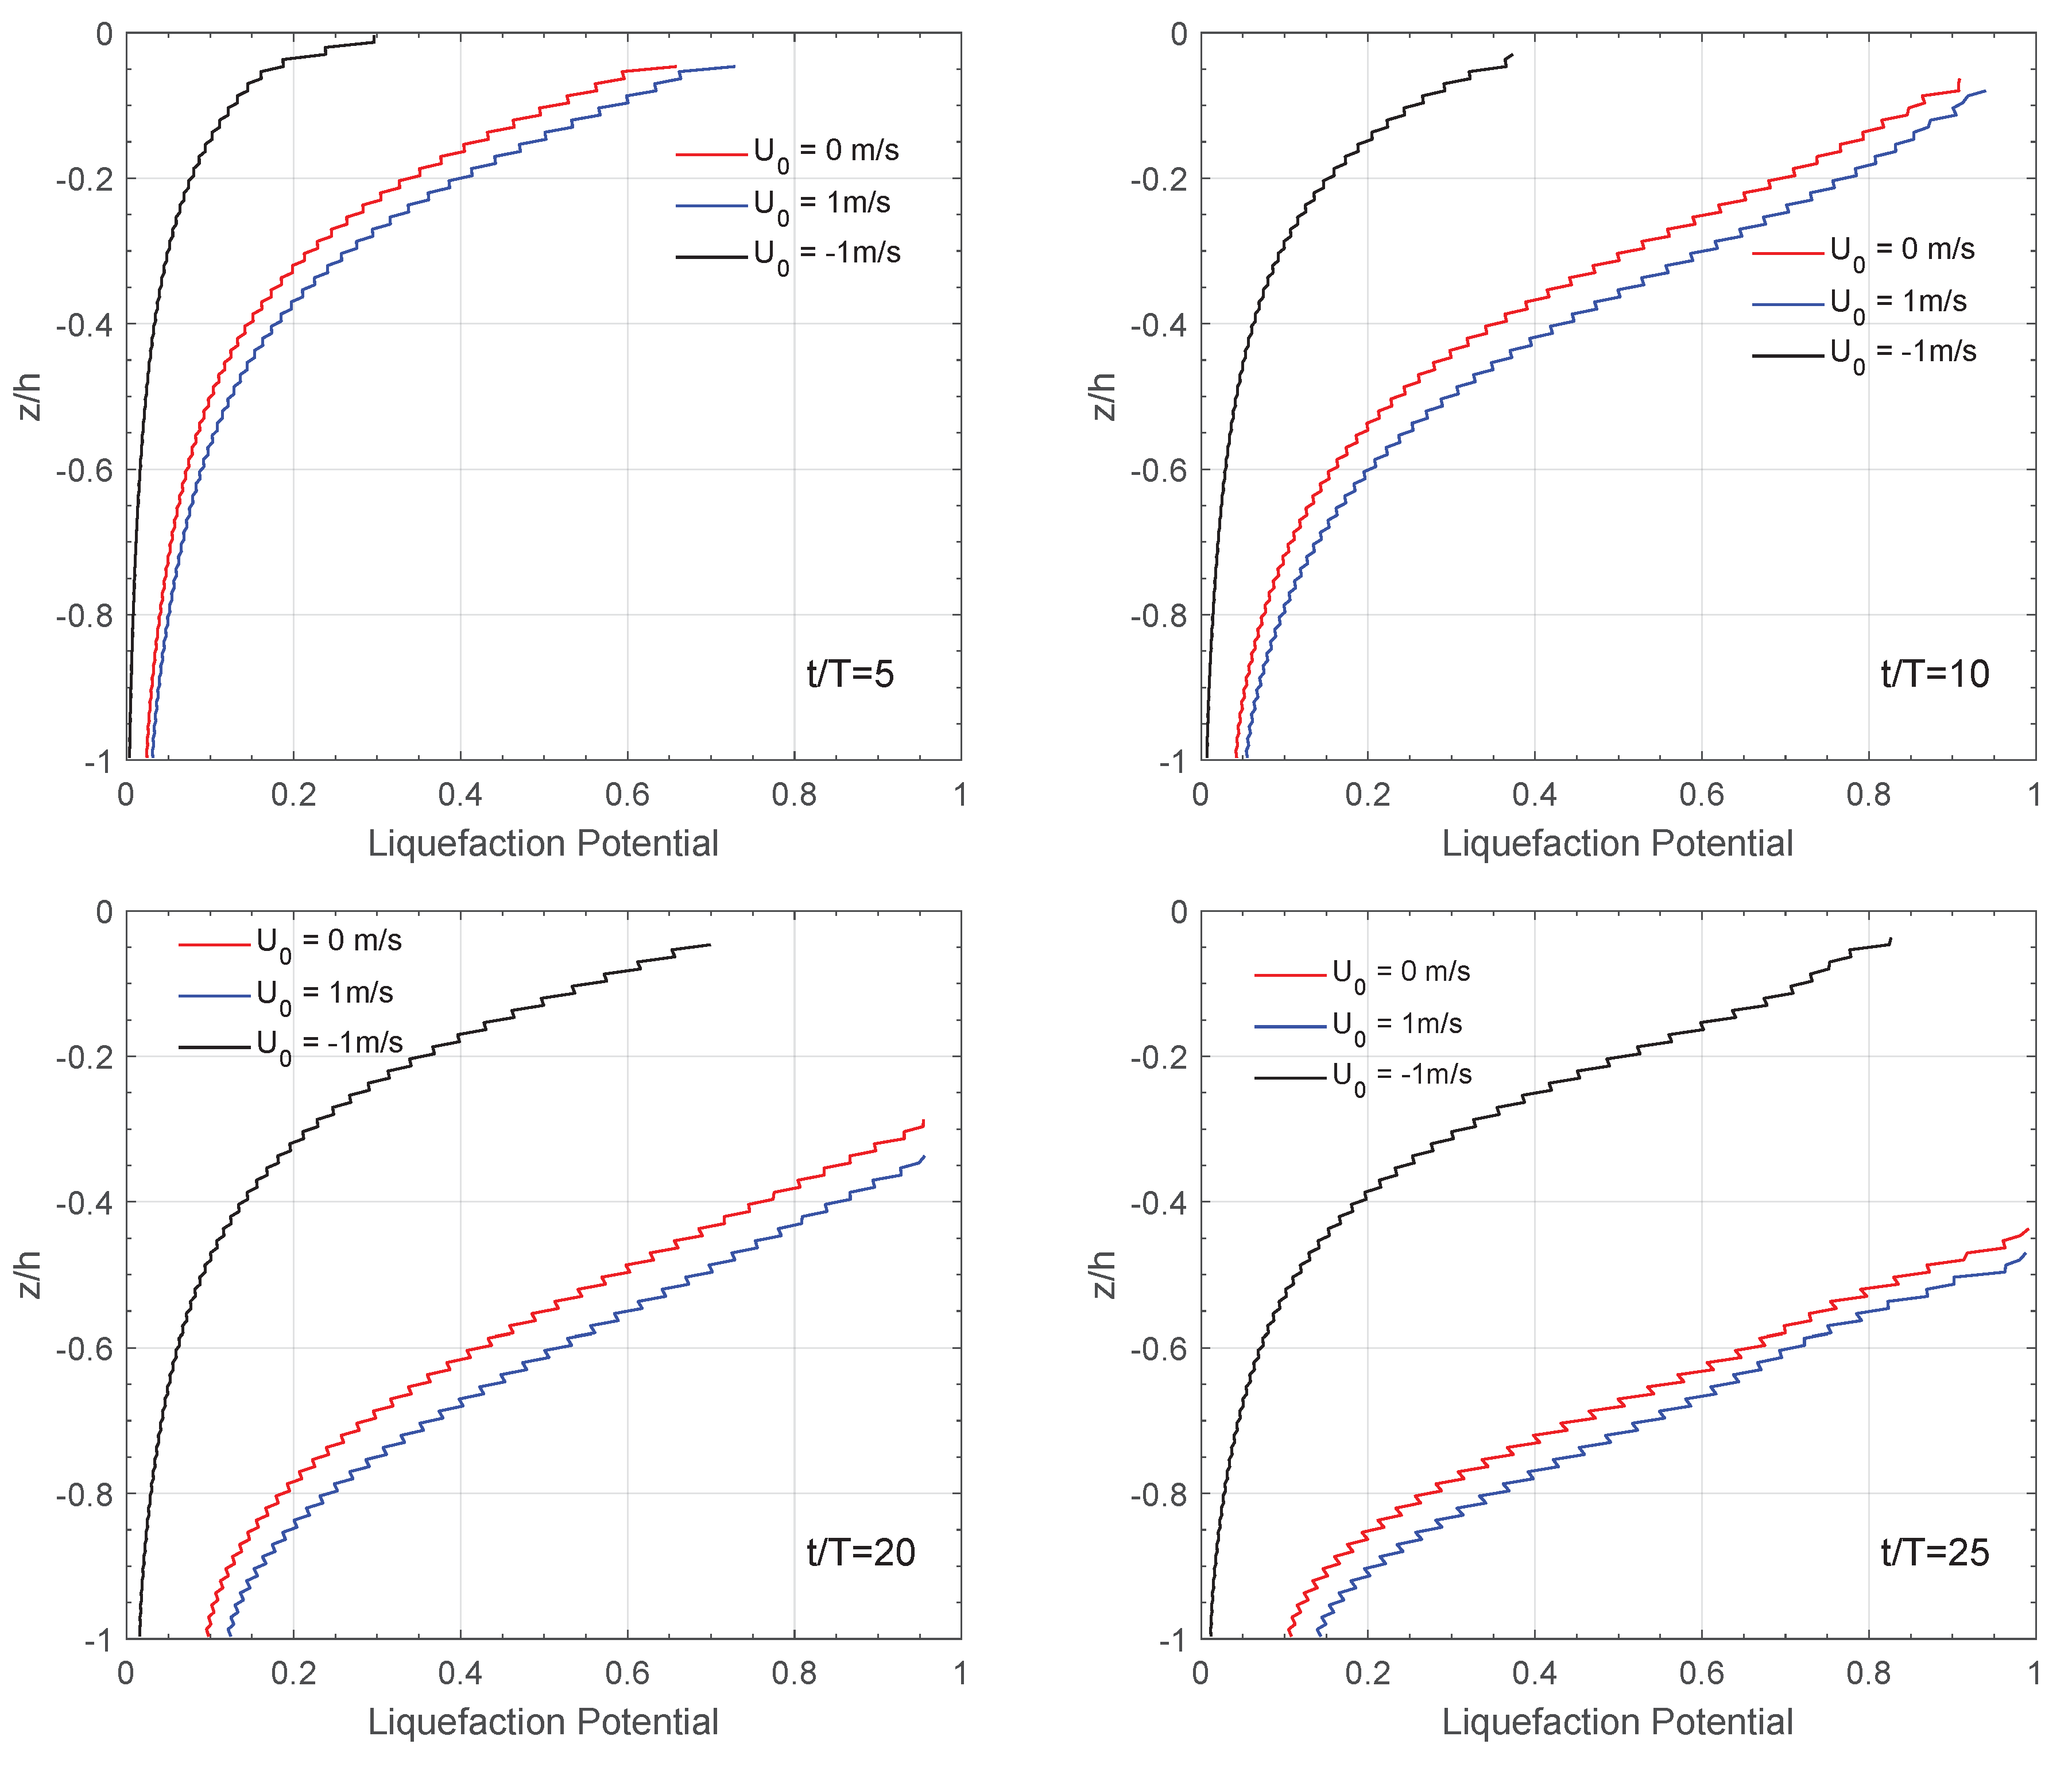
Figure 10 illustrates the distribution of liquefaction potential when considering the impact of PSR in the vertical direction of soil for different current conditions. It clearly shows that the soil near the surface is more prone to liquefaction. Moreover, the depth of soil liquefaction gradually increases. It also shows that when the soil depth is the same, the liquefaction potential in the following current case is the most significant, so soil liquefaction occurs more easily. On the other hand, when the liquefaction potential is the same, the maximum soil liquefaction depth in the following current situation is greater than the others. In other words, this result shows that the following current accelerates the process of soil instability, making soil liquefaction more likely to occur. Reverse currents have an opposite effect, so they are conducive to soil stability.
4.3. Effect of Principal Stress Rotation with Various Wave and Soil Parameters
It is well known that when waves propagate on a porous seabed, wave parameters, including wave height and wave period, are closely related to the liquefaction of the seabed [4]. Generally, with a longer wavelength and higher wave height , the seabed liquefaction depth is more obvious. Furthermore, different soil parameters, including soil permeability and saturation rate , have a significant impact on seabed liquefaction. This section compares the effects of different wave periods, wave heights, soil permeabilities, and saturation levels on soil liquefaction with and without consideration of PSR. Four different time stages are used to illustrate the relationship between the vertical direction of soil and the liquefaction potential.
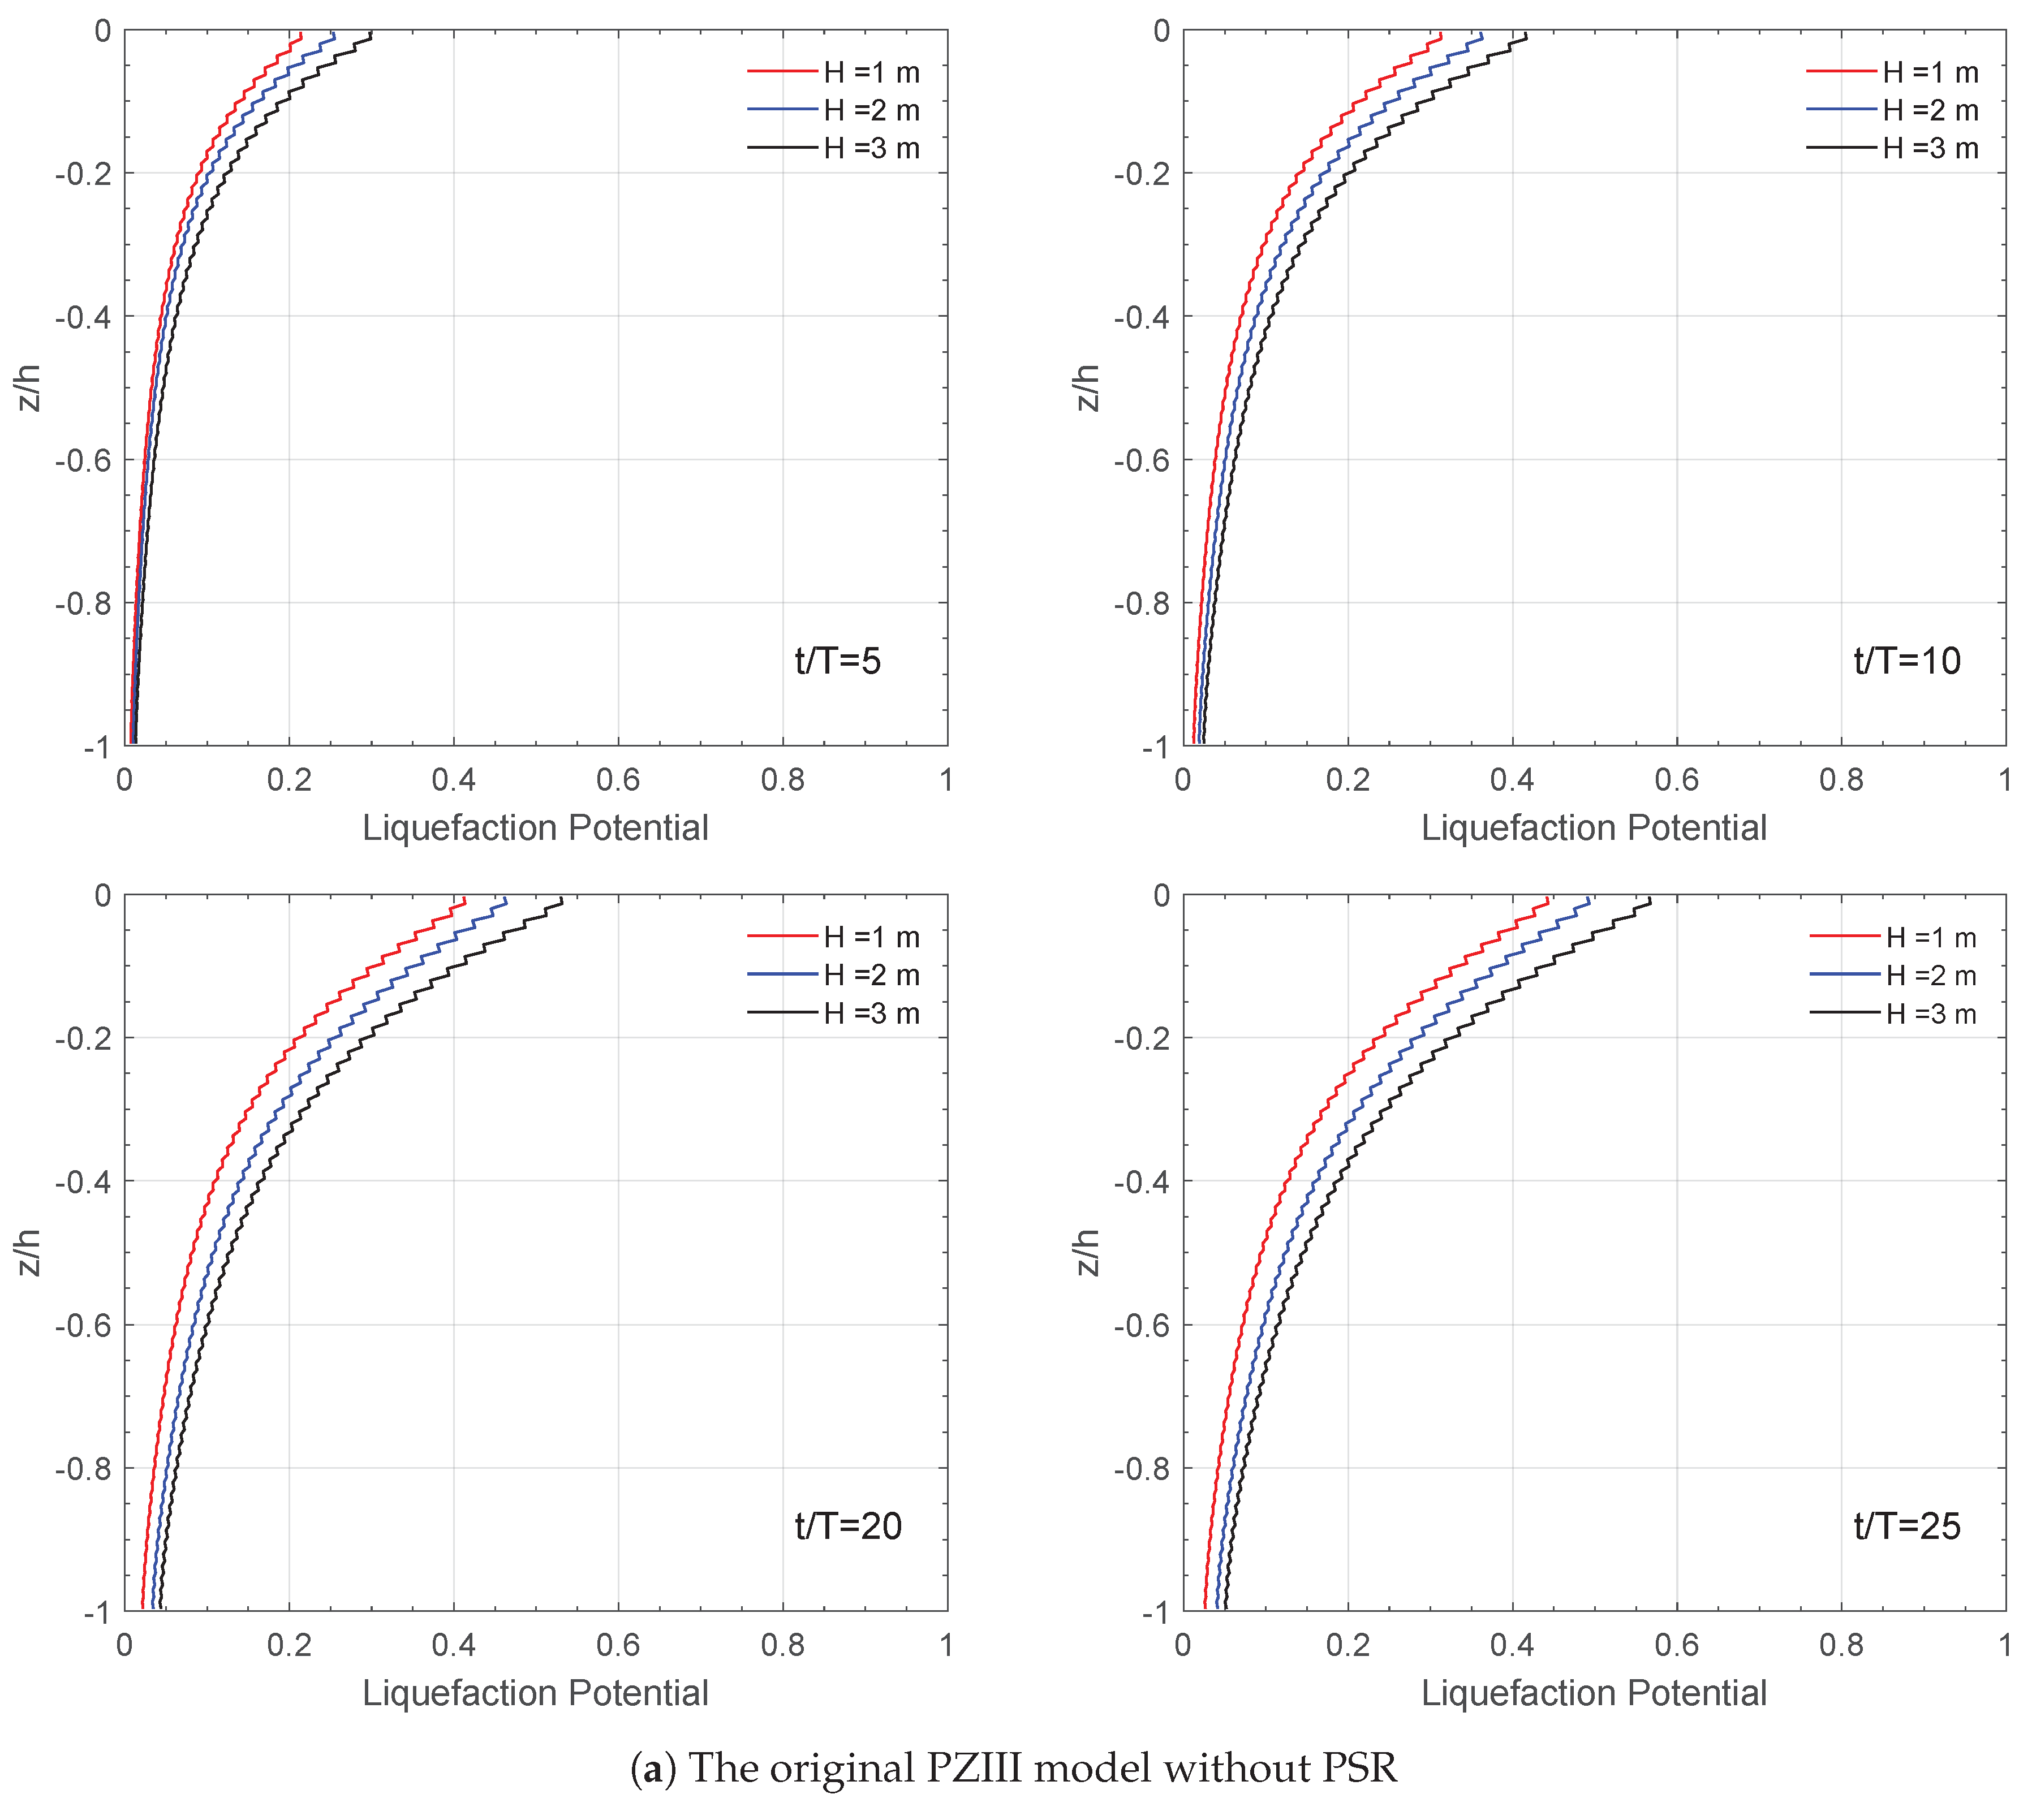
Figure 11 shows the effects of wave height on the vertical distribution of wave (current)-induced liquefaction potential with and without consideration of PSR conditions. As can be seen from the figure, in both situations, the liquefaction potential becomes more significant with increasing wave height. Also, the depth of soil liquefaction gradually increases over time. When = 10 and = 0.2, the value of increases from 0.25 to 0.82 with an increase in wave height from 1 m to 3 m when considering PSR. However, the liquefaction potential value increases from 0.15 m to 0.2 m when the effects of PSR are not considered.
Figure 12 illustrates the relationship between liquefaction potential and wave period with the change in soil depth. It can be seen in the figures that as the wave period increases, the value of the liquefaction potential increases and the soil is more liable to liquefy. This phenomenon is due to the increase in wavelength or wave height, both of which result in more energy. It can strengthen the interaction between the wave and seabed foundation. Also, at the same soil depth, the value of the liquefaction potential increases more significantly when PSR is taken into account. Therefore, it can be said that given different wave parameters, PSR increases the liquefaction depth and liquefaction potential of the soil.
Figure 13 shows the impact of soil permeability on the liquefaction potential along the vertical direction in the sandy seabed. Similarly, there is a steady increase in the liquefaction potential with the wave propagation for 35 wave periods. Also, the results of m/s and m/s are almost indistinguishable. Compared with m/s, when soil permeability is lower, the soil is more likely to liquefy. This is because the permeability of the soil is large, and the pore pressure between the soil particles dissipates rapidly during the wave propagation and does not increase cumulatively. Thus, the effective stress between soil particles is sufficient to maintain the stability of the soil, and this stability prevents the occurrence of soil liquefaction. When the permeability of the soil is relatively low, the pore-water pressure between soils does not dissipate efficiently along with wave propagation, resulting in the faster accumulation of pressure. Therefore, soil liquefaction easily occurs when soil permeability is small. When considering the existence of PSR, the liquefaction potential increases rapidly in the same situation. Therefore, it can be concluded that PSR has a considerable impact on soil liquefaction for different permeabilities.
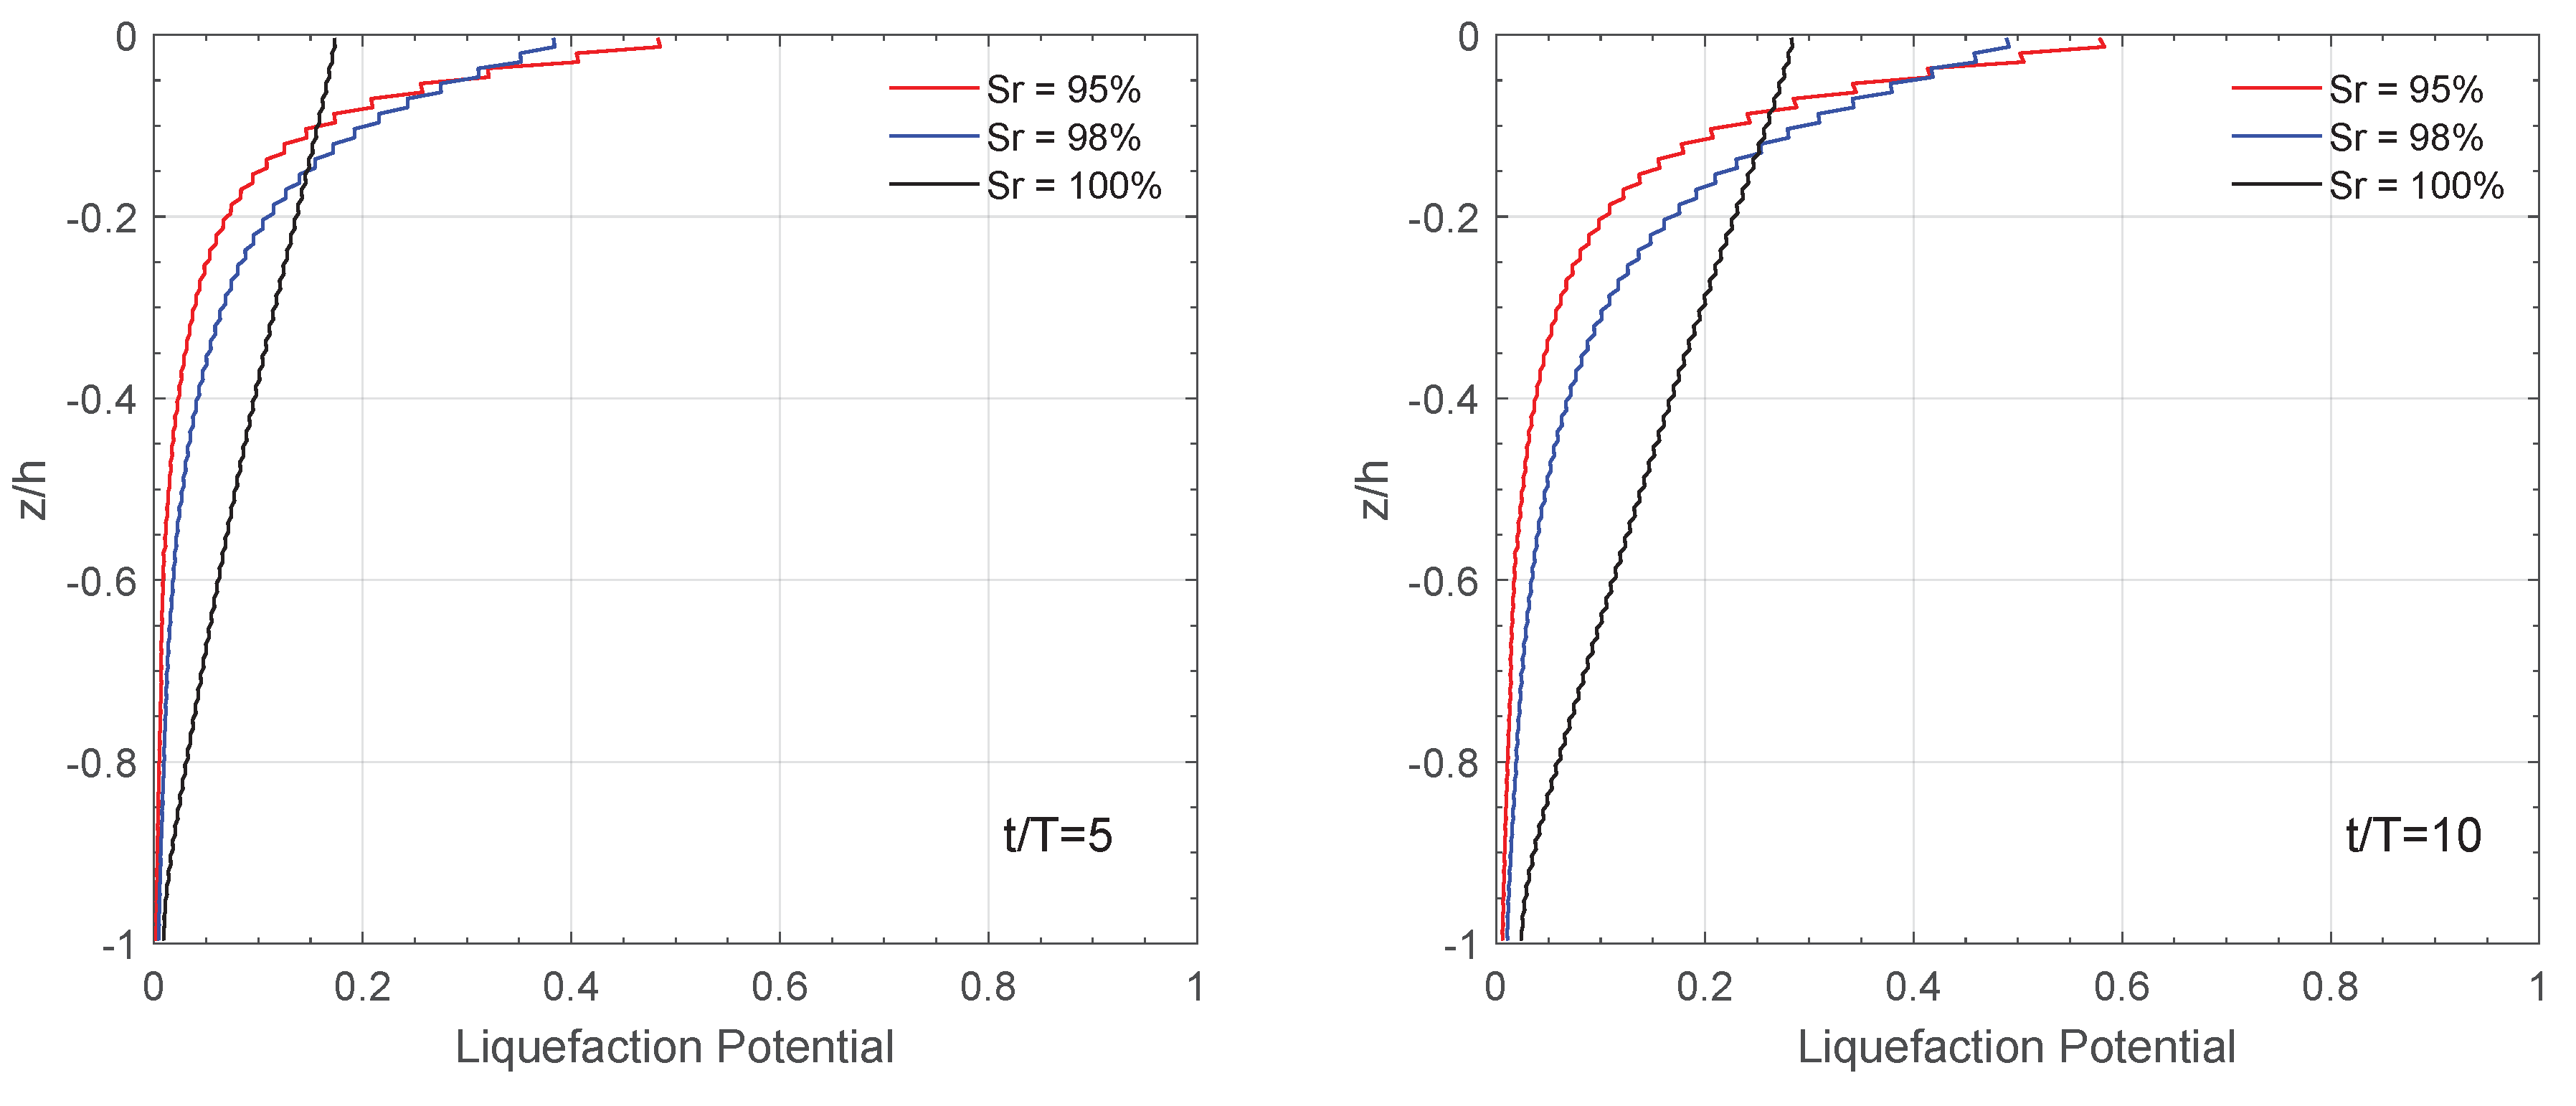
Figure 14 presents the variation trend of the liquefaction potential with soil depth at different saturation levels at four typical time points. On the whole, the relationship between and different saturation levels shows the opposite trend, with a certain soil depth as the limit. Since the liquefaction potential is set near , the region with low values effectively means that there is no liquefaction at all. Therefore, we only need to investigate the region near the seabed surface. In the surface layer of the soil, the liquefaction potential decreases with increasing saturation.
5. Conclusions
Principal stress rotation (PSR) is an important factor in the evaluation of wave (current)-induced seabed instability. In this study, a one-way coupled numerical model that incorporates a wave model and soil model was developed to investigate the effect of PSR on the wave (current)-induced dynamic response of an elastoplastic seabed foundation. The comparisons show that the proposed model agrees well with laboratory wave flume tests, geotechnical centrifuge tests, and previous numerical results. On the basis of the numerical examples, the effects of PSR and currents with various soil parameters were examined, and the following conclusions are drawn:
- (1)
- Principal stress rotation (PSR) has a significant effect on the soil liquefaction depth. It accelerates the growth of pore pressures and reduces the vertical effective stress, so that the soil is easier to liquefy.
- (2)
- The existence of ocean currents has an important impact on the development of the liquefaction potential of a seabed foundation. When considering the interactions between waves and currents, the soil pore pressure and effective force change significantly and have a significant impact on soil liquefaction. The following current aggravates the soil reaction and promotes soil liquefaction. On the contrary, the opposing current reduces soil instability and plays a positive role in soil stability.
- (3)
- With the combined action of waves and current, the seabed with porous media shows pronounced lateral expansion and vertical settlement.
- (4)
- The liquefaction potential of the elastoplastic seabed foundation increases with time and decreases with depth. This indicates that liquefaction is more likely to occur in the upper layer of the seabed foundation.
Please note that the above conclusions are based on the numerical examples presented in this manuscript, and comparable experimental data are not available in the literature. The above findings require further confirmation by experimental evidence in the future.
Author Contributions
Conceptualization, D.-S.J.; methodology, J.-F.Z., H.Z. & Z.L.; validation, J.-F.Z. & Z.L.; formal analysis, Z.L.; writing—original draft preparation, Z.L.; writing—review and editing, D.-S.J., J.-F.Z. & H.Z.; supervision, D.-S.J.
Funding
This research was funded by the National Nature Fund of China (Grant No. 51879133).
Acknowledgments
The first author is grateful for the support of the High Performance Computing Cluster “Gowanda” to complete this research and the support of a scholarship from Griffith University. The third author is grateful for the support from the National Nature Fund of China (Grant No. 51879133), who are acknowledged for their financial support. The authors express their gratitude to WG Qi and Professor FP Gao at the Institute of Mechanics, Chinese Academy of Sciences, for their experimental data.
Conflicts of Interest
The authors declare no conflict of interest.
References
- Sumer, B.M. Liquefaction around Mainre Structures; World Scientific: Hackensack, NJ, USA, 2014. [Google Scholar]
- Jeng, D.S. Mechanics of Wave-Seabed-Structure Interactions: Modelling, Processes and Applications; Cambridge University Press: Cambridge, UK, 2018. [Google Scholar]
- Zen, K.; Yamazaki, H. Mechanism of wave-induced liquefaction and densification in seabed. Soils Found. 1990, 30, 90–104. [Google Scholar] [CrossRef]
- Sumer, B.M.; Fredsøe, J. The Mechanics of Scour in the Marine Environment; World Scientific Publishing Co. Pte. Ltd.: Singapore, 2002. [Google Scholar]
- Jeng, D.S. Porous Models for Wave-Seabed Interactions; Springer: Berlin/Heidelberg, Germany, 2013. [Google Scholar]
- Yamamoto, T.; Koning, H.; Sellmeijer, H.; Hijum, E.V. On the response of a poro-elastic bed to water waves. J. Fluid Mech. 1978, 87, 193–206. [Google Scholar] [CrossRef]
- Seed, H.B.; Rahman, M.S. Wave-induced pore pressure in relation to ocean floor stability of cohesionless soils. Mar. Geotechnol. 1978, 3, 123–150. [Google Scholar] [CrossRef]
- Jeng, D.S.; Seymour, B.R. A simplified analytical approximation for pore-water pressure build-up in a porous seabed. J. Waterw. Port Coast. Ocean Eng. ASCE 2007, 133, 309–312. [Google Scholar] [CrossRef]
- Biot, M.A. General theory of three-dimensional consolidation. J. Appl. Phys. 1941, 26, 155–164. [Google Scholar] [CrossRef]
- Jeng, D.S.; Rahman, M.S. Effective stresses in a porous seabed of finite thickness: Inertia effects. Can. Geotech. J. 2000, 37, 1383–1392. [Google Scholar] [CrossRef]
- Jeng, D.S.; Cha, D.H. Effects of dynamic soil behavior and wave non-linearity on the wave-induced pore pressure and effective stresses in porous seabed. Ocean Eng. 2003, 30, 2065–2089. [Google Scholar] [CrossRef]
- Ulker, M.; Rahman, M.S. Response of saturated and nearly saturated porous media: Different formulations and their applicability. Int. J. Numer. Anal. Methods Geomech. 2009, 33, 633–664. [Google Scholar] [CrossRef]
- Jeng, D.S.; Lin, Y.S. Finite element modelling for water waves–soil interaction. Soil Dyn. Earthq. Eng. 1996, 15, 283–300. [Google Scholar] [CrossRef]
- Jeng, D.S.; Ye, J.H.; Zhang, J.S.; Liu, P.L.F. An integrated model for the wave-induced seabed response around marine structures: Model verifications and applications. Coast. Eng. 2013, 72, 1–19. [Google Scholar] [CrossRef]
- Lin, Z.; Guo, Y.K.; Jeng, D.S.; Liao, C.C.; Rey, N. An integrated numerical model for wave–soil–pipeline interaction. Coast. Eng. 2016, 108, 25–35. [Google Scholar] [CrossRef]
- Zhao, H.Y.; Jeng, D.S.; Liao, C.C. Three-dimensional modeling of wave-induced residual seabed response around mono-pile foundation. Coast. Eng. 2017, 128, 1–21s. [Google Scholar] [CrossRef]
- Seed, H.B.; Martin, P.O.; Lysmer, J. The Generation and Dissipation of Pore Water Pressure During Soil Liquefaction; Technical Report; College of Engineering, University of California: Berkeley, CA, USA, 1975. [Google Scholar]
- Jeng, D.S.; Zhao, H.Y. Two-dimensional model for pore pressure accumulations in marine sediments. J. Waterw. Port Coast. Ocean Eng. ASCE 2015, 141, 04014042. [Google Scholar] [CrossRef]
- Zhao, H.; Jeng, D.S.; Guo, Z.; Zhang, J.S. Two-dimensional model for pore pressure accumulations in the vicinity of a buried pipeline. J. Offshore Mech. Arct. Eng. ASME 2014, 136, 042001. [Google Scholar] [CrossRef]
- Sassa, S.; Sekiguchi, H.; Miyamamot, J. Analysis of progressive liquefaction as moving-boundary problem. Géotechnique 2001, 51, 847–857. [Google Scholar] [CrossRef]
- Liao, C.C.; Zhao, H.Y.; Jeng, D.S. Poro-elastoplastic model for wave-induced liquefaction. J. Offshore Mech. Arct. Eng. ASME 2015, 137, 042001. [Google Scholar] [CrossRef]
- Chan, A.H.C. User Mannual for DIANA-SWANDYNE II-Dynamic Interaction and Nonlinear Analysis Swansea Dynamic Program Version II; Technical Report; School of Civil Engineering, University of Birmingham: Birmingham, UK, 1995. [Google Scholar]
- Pastor, M.; Zienkiewicz, O.C.; Chan, A.H.C. Generalized plasticity and the modeling of soil behaviour. Int. J. Numer. Anal. Methods Geomech. 1990, 14, 151–190. [Google Scholar] [CrossRef]
- Dunn, S.L.; Vun, P.L.; Chan, A.H.C.; Damgaard, J.S. Numerical Modeling of Wave-induced Liquefaction around Pipelines. J. Waterw. Port Coast. Ocean Eng. ASCE 2006, 132, 276–288. [Google Scholar] [CrossRef]
- Jeng, D.S.; Ou, J. 3-D models for wave-induced pore pressure near breakwater heads. Acta Mech. 2010, 215, 85–104. [Google Scholar] [CrossRef]
- Hsu, H.C.; Chen, Y.Y.; Hsu, J.R.C.; Tseng, W.J. Nonlinear water waves on uniform current in Lagrangian coordinates. J. Nonlinear Math. Phys. 2009, 16, 47–61. [Google Scholar] [CrossRef]
- Ye, J.; Jeng, D.S. Response of seabed to natural loading-waves and currents. J. Eng. Mech. ASCE 2012, 138, 601–613. [Google Scholar] [CrossRef]
- Wen, F.; Jeng, D.S.; Wang, J.H. Numerical modeling of response of a saturated porous seabed around an offshore pipeline considering non-linear wave and current interactions. Appl. Ocean Res. 2012, 35, 25–37. [Google Scholar] [CrossRef]
- Zhang, Y.; Jeng, D.S.; Gao, F.P.; Zhang, J.S. An analytical solution for response of a porous seabed to combined wave and current loading. Ocean Eng. 2013, 57, 240–247. [Google Scholar] [CrossRef] [Green Version]
- Zhang, J.S.; Zhang, Y.; Jeng, D.S.; Liu, P.L.F.; Zhang, C. Numerical simulation of wave-current interaction. Ocean Eng. 2014, 75, 157–164. [Google Scholar] [CrossRef]
- Zhang, J.S.; Zhang, Y.; Zhang, C.; Jeng, D.S. Numerical modeling of seabed response to the combined wave-current loading. J. Offshore Mech. Arct. Eng. ASME 2013, 135, 031102. [Google Scholar] [CrossRef]
- Liao, C.C.; Jeng, D.-S.; Lin, Z.; Guo, Y.; Zhang, Q. Wave (Current)-Induced Pore Pressure in Offshore Deposits: A Coupled Finite Element Model. J. Mar. Sci. Eng. 2019, 6, 83. [Google Scholar] [CrossRef]
- Qi, W.G.; Gao, F.P. Physical modelling of local scour development around a large-diameter monopile in combined waves and current. Coast. Eng. 2014, 83, 72–81. [Google Scholar] [CrossRef]
- Qi, W.G.; Li, C.F.; Jeng, D.S.; Gao, F.P.; Liang, Z.D. Combined wave-current induced excess pore-pressure in a sandy seabed: Flume observations and comparisons with analytical solution. Coast. Eng. 2019, 147, 89–98. [Google Scholar] [CrossRef]
- Sassa, S.; Sekiguchi, H. Analysis of wave-induced liquefaction of sand beds. Géotechnique 2001, 51, 115–126. [Google Scholar] [CrossRef]
- Jafarian, Y.; Towhata, I.; Baziar, M.H.; Noorzaid, A. Strain energy based evaluation of liquefaction and residual pore water pressure in sands using cyclic torsional shear experiment. Soil Dyn. Earthq. Eng. 2012, 35, 13–28. [Google Scholar] [CrossRef]
- Konstadinou, M.; Georgiannou, V.N. Cyclic behaviour of loose anisotropically consolidated Ottawa sand under undrained torsional loading. Géotechnique 2013, 63, 1144–1158. [Google Scholar] [CrossRef]
- Zienkiewicz, O.C.; Morz, Z. Generalized plasticity formulation and applications to geomechanics. Mech. Eng. Mater. 1984, 44, 655–680. [Google Scholar]
- Zhu, J.F.; Zhao, H.Y.; Jeng, D.S. Effects of principal stress rotation on wave-induced soil response in a poro-elastoplastic sandy seabed. Acta Geotech. 2019. [Google Scholar] [CrossRef]
- Sassa, S.; Sekiguchi, H. Wave-induced liquefaction of beds of sand in a centrifuge. Géotechnique 1999, 49, 621–638. [Google Scholar] [CrossRef]
- Hsu, J.R.C.; Jeng, D.S. Wave-induced soil response in an unsaturated anisotropic seabed of finite thickness. Int. J. Numer. Anal. Methods Geomech. 1994, 18, 785–807. [Google Scholar] [CrossRef]
- Ye, J.H.; Jeng, D.S.; Wang, R.; Zhu, C. Validation of a 2-D semi-coupled numerical model for fluid-structure- seabed interaction. J. Fluids Struct. 2013, 42, 333–357. [Google Scholar] [CrossRef]
- Ran, Q.; Tong, J.; Song, S.; Fu, X.; Xu, Y. Incompressible SPH scour model for movable bed dam break flows. Adv. Water Resour. 2015, 82, 39–50. [Google Scholar] [CrossRef] [Green Version]
- Wang, D.; Li, S.; Arikawa, T.; Gen, H. ISPH simulation of scour behind seawall due to continuous tsunami overflwo. Coast. Eng. J. 2016, 58, 1650014. [Google Scholar] [CrossRef]
- Manenti, S.; Pierobon, E.; Gallati, M.; Sibilla, S.; D’Alpaos, L.; Macchi, E.; Todeschini, S. Vajont disaster: Smoothed particle hydrodynamics modelling of the postevent 2D experiments. J. Hydraul. Eng. ASCE 2016, 142, 05015007. [Google Scholar] [CrossRef]
- Wang, D.; Shao, S.; Li, S.; Shi, Y.; Arikawa, T.; Zhang, H. 3D ISPH erosion model for flow passing a vertical cylinder. J. Fluids Struct. 2018, 78, 374–399. [Google Scholar] [CrossRef]
- Jacobsen, N.G.; Fuhrman, D.R.; Fredsøe, J. A wave generation toolbox for the open-source CFD library: OpenFOAM. Int. J. Numer. Methods Fluids 2012, 70, 1073–1088. [Google Scholar] [CrossRef]
- Higuera, P.; Lara, J.L.; Losada, I.J. Realistic wave generation and active wave absorption for Navier-Stokes models: Application to OpenFOAM. Coast. Eng. 2013, 71, 102–118. [Google Scholar] [CrossRef]
- Higuera, P.; Lara, J.L.; Losada, I.J. Three-dimensional interaction of waves and porous coastal structures using OpenFOAM. Part II: Application. Coast. Eng. 2014, 83, 259–270. [Google Scholar] [CrossRef]
- Engelund, F. On the Laminar and Turbulent Flows of Ground Water Through Homogeneous Sand; Danish Academy of Technical Sciences; Akademie for de Tekniske Videnskaber: Koebenhavn, Denmark, 1953. [Google Scholar]
- De Jesus, M.; lara, J.L.; Losada, I.J. Three-dimensional interaction of waves and porous coastal structures: Part I: Numerical model formulation. Coast. Eng. 2012, 64, 57–72. [Google Scholar] [CrossRef]
- Higuera, P. Application of Computational Fluid Dynamics to Wave Action On Structures. Ph.D. Thesis, Universidade de Cantabria, Cantabria, Spain, 2015. [Google Scholar]
- Biot, M.A. Theory of propagation of elastic waves in a fluidsaturated porous solid, Part I: Low frequency range. J. Acoust. Soc. Am. 1956, 28, 168–177. [Google Scholar] [CrossRef]
- Zienkiewicz, O.C.; Chang, C.T.; Bettess, P. Drained, undrained, consolidating and dynamic behaviour assumptions in soils. Géotechnique 1980, 30, 385–395. [Google Scholar] [CrossRef]
- Verruijt, A. Flow Through Porous Media; Academic Press: London, UK, 1969; Chapter Elastic Storage of Aquifers; pp. 331–376. [Google Scholar]
- Towhata, I.; Ishihara, K. Undrained strength of sand undergoing cyclic rotation of principal stress axes. Soils Found. 1985, 25, 135–147. [Google Scholar] [CrossRef]
- Rodriguea, N.M.; Lade, P.V. Non-coaxiality of strain increment and stress directions in cross-anisotropic sand. Int. J. Soild Struct. 2014, 51, 1103–1114. [Google Scholar] [CrossRef] [Green Version]
- Ong, D.E.L.; Choo, C.S. Assessment of non-linear rock strength parameters for the estimation of pipe-jacking forces. Part 1. Direct shear testing and backanalysis. Eng. Geol. 2018, 244, 159–172. [Google Scholar] [CrossRef]
- Ong, D.E.L.; Sim, Y.S.; Leung, C.F. Performance of Field and Numerical Back-Analysis of Floating Stone Columns in Soft Clay Considering the Influence of Dilatancy. Int. J. Geomech. ASCE 2018, 18, 04018135. [Google Scholar] [CrossRef]
- Okusa, S. Wave-induced stress in unsaturated submarine sediments. Géotechnique 1985, 35, 517–532. [Google Scholar] [CrossRef]
- Wu, J.; Kammerer, A.; Riemer, M.; Seed, R.; Pestana, J. Laboratory study of liquefication triggering criteria. In Proceedings of the 13th World Conference on Earthquake Engineeirng, Vancouver, BC, Canada, 1–6 August 2004; p. 2580. [Google Scholar]
- Liu, Z.; Jeng, D.S.; Chan, A.H.; Luan, M.T. Wave-induced progressive liquefaction in a poro-elastoplastic seabed: A two-layered model. Int. J. Numer. Anal. Methods Geomech. 2009, 33, 591–610. [Google Scholar] [CrossRef]
- Liu, P.; Wang, Z.; Li, X.; Chan, A.H.C. Calibration and validation of a sand model considering the effects of wave-induced principal stress axes rotation. Acta Oceanol. Sin. 2015, 34, 105–115. [Google Scholar] [CrossRef]
Figure 1.
Sketch of wave (current)–seabed interaction.

Figure 2.
Comparison of the present model with the HCA tests [56] under continuous rotation of the major principal stress axis.
Figure 2.
Comparison of the present model with the HCA tests [56] under continuous rotation of the major principal stress axis.

Figure 3.
Validation of the present model with the experimental data [33] (wave only): (a) water surface elevation () and (b) the wave-induced pore pressure in seabed (). Input data: wave height (H) = 5 cm, wave period (T) = 1 s, water depth (d) = 50 cm, seabed thickness (h) = 50 cm, degree of saturation () = 1, Shear modulus (G) = 10 N/m, Poisson’s ratio () = 0.3, soil permeability () = 1.88 × 10 m/s, and soil porosity () = 0.771.

Figure 4.
Validation of the present model with experimental data resulting from combining the wave and the following current loading [33]: (a) water surface elevation () and (b) the wave-induced pore pressure in seabed (). Input data: H = 5 cm, T = 1 s, d = 50 cm, h = 50 cm, = 1, G = 10 N/m, = 0.3, = 1.88 m/s, = 0.771, current velocity (U) = 0.05 m/s.

Figure 5.
Comparison of the distribution of excessive pore pressure between the present model (solid line) and the centrifuge tests (dashed line) [40].
Figure 5.
Comparison of the distribution of excessive pore pressure between the present model (solid line) and the centrifuge tests (dashed line) [40].

Figure 6.
Excess pore pressure at point A subject to progressive wave loading. Notation: red lines = the present model, blue lines = Sassa’s model [35].
Figure 6.
Excess pore pressure at point A subject to progressive wave loading. Notation: red lines = the present model, blue lines = Sassa’s model [35].

Figure 7.
Liquefaction process in a sandy seabed according to (a) the original PZIII (Pastor–Zienkiewicz Mark-III) model and (b) the present model.
Figure 7.
Liquefaction process in a sandy seabed according to (a) the original PZIII (Pastor–Zienkiewicz Mark-III) model and (b) the present model.


Figure 8.
Cyclic response of seabed under various current conditions at different locations: (a) pore pressures; (b) vertical effective stresses.
Figure 8.
Cyclic response of seabed under various current conditions at different locations: (a) pore pressures; (b) vertical effective stresses.


Figure 9.
Displacements under different current conditions: (a) horizontal displacement, (b) vertical displacement.
Figure 9.
Displacements under different current conditions: (a) horizontal displacement, (b) vertical displacement.

Figure 10.
Effect of currents on the vertical distribution of liquefaction potential on z = −5 m at four typical time points.
Figure 10.
Effect of currents on the vertical distribution of liquefaction potential on z = −5 m at four typical time points.

Figure 11.
Effect of wave height H on the vertical distribution of liquefaction potential on −5 m at four typical time points. (a) The original PZIII model without PSR (principal stress rotation) and (b) the present model with PSR.
Figure 11.
Effect of wave height H on the vertical distribution of liquefaction potential on −5 m at four typical time points. (a) The original PZIII model without PSR (principal stress rotation) and (b) the present model with PSR.


Figure 12.
Effect of wave period T considering PSR on the vertical distribution of liquefaction potential on −5 m at four typical time points. (a) The original PZIII model without PSR and (b) the present model with PSR.
Figure 12.
Effect of wave period T considering PSR on the vertical distribution of liquefaction potential on −5 m at four typical time points. (a) The original PZIII model without PSR and (b) the present model with PSR.


Figure 13.
Effect of soil permeability considering PSR on the vertical distribution of liquefaction potential on −5 m at four typical time points. (a) The original PZIII model without PSR and (b) the present model with PSR.
Figure 13.
Effect of soil permeability considering PSR on the vertical distribution of liquefaction potential on −5 m at four typical time points. (a) The original PZIII model without PSR and (b) the present model with PSR.


Figure 14.
Effect of the degree of considering PSR on the vertical distribution of liquefaction potential on −5 m at four typical time points. (a) The original PZIII model without PSR and (b) the present model with PSR.
Figure 14.
Effect of the degree of considering PSR on the vertical distribution of liquefaction potential on −5 m at four typical time points. (a) The original PZIII model without PSR and (b) the present model with PSR.


Table 1.
Present constitutive model’s parameters for comparison with the HCA (Hollow Cylinder Apparatus) element test of sand [56].
Table 1.
Present constitutive model’s parameters for comparison with the HCA (Hollow Cylinder Apparatus) element test of sand [56].
| (kPa) | 24,727.3 | (kPa) | 34,000 |
| 0.3 | 5.5 | ||
| (kPa) | 600 | (kPa) | 1000 |
| 6.0 | 0.7 | ||
| 0.42 | 0.005 | ||
| a | 0.25 | b | 0.65 |
| (kPa) | 4 |
Table 2.
Parameters used for comparison between the centrifugal test and numerical model.
| Wave and Seabed Characteristics | Parameters for PZIII Model | ||
|---|---|---|---|
| T (s) | 4.55 | (kPa) | 700 |
| h (m) | 1.7 | (kPa) | 1000 |
| d (m) | 4.5 | (kPa) | 660.8 |
| (m) | 25 | (kPa) | 770.0 |
| H (m) | 5.0 | 6.0 | |
| (%) | 100 | 4.0 | |
| (m/s) | 0.00015 | 1.2124 | |
| 0.2 | |||
| 2.5 | |||
| 0.75 | |||
| 0.01 | |||
| (kPa) | 4 | ||
| a | 0.3 | ||
| c | 0.5 | ||
# PZIII is the Pastor–Zienkiewicz Mark-III.
Table 3.
Parameters used in dynamic constitutive model for parametric study.
| Parameters | Original PZIII | The Present Model | Unit |
|---|---|---|---|
| 2000 | 2000 | kPa | |
| 2600 | 2600 | kPa | |
| 4.0 | 4.0 | kPa | |
| 1.32 | - | - | |
| 1.3 | - | - | |
| 0.45 | - | - | |
| 0.45 | - | - | |
| 4.2 | 4.2 | - | |
| 0.2 | 0.2 | - | |
| 750 | 750 | kPa | |
| 40,000 | 40,000 | kPa | |
| 4 | 4 | - | |
| 0.98 | 0.98 | - | |
| n | 0.397 | 0.397 | - |
| - | 1.32 | - | |
| - | 1.3 | - | |
| - | 0.45 | - | |
| a | - | 0.1 | - |
| c | - | 0.1 | - |
| - | 0.4286 | - |
© 2019 by the authors. Licensee MDPI, Basel, Switzerland. This article is an open access article distributed under the terms and conditions of the Creative Commons Attribution (CC BY) license (http://creativecommons.org/licenses/by/4.0/).
Share and Cite
MDPI and ACS Style
Li, Z.; Jeng, D.-S.; Zhu, J.-F.; Zhao, H. Effects of Principal Stress Rotation on the Fluid-Induced Soil Response in a Porous Seabed. J. Mar. Sci. Eng. 2019, 7, 123. https://doi.org/10.3390/jmse7050123
AMA Style
Li Z, Jeng D-S, Zhu J-F, Zhao H. Effects of Principal Stress Rotation on the Fluid-Induced Soil Response in a Porous Seabed. Journal of Marine Science and Engineering. 2019; 7(5):123. https://doi.org/10.3390/jmse7050123
Chicago/Turabian StyleLi, Zhengxu, Dong-Sheng Jeng, Jian-Feng Zhu, and Hongyi Zhao. 2019. "Effects of Principal Stress Rotation on the Fluid-Induced Soil Response in a Porous Seabed" Journal of Marine Science and Engineering 7, no. 5: 123. https://doi.org/10.3390/jmse7050123
Note that from the first issue of 2016, this journal uses article numbers instead of page numbers. See further details here.