Dynamic Response of Offshore Open-Ended Pile under Lateral Cyclic Loadings
by
Junwei Liu
1,2, 
Zhen Guo
3,*,
Na Zhu
1,
Hui Zhao
1,
Ankit Garg
4,
Longfei Xu
1,
Tao Liu
5 and
Changchun Fu
6 1
School of Civil Engineering, Qingdao University of Technology, Qingdao 266033, China
2
Postdoctoral research fellow, Hydraulic Engineering Post-doctoral Scientific Research Station, Zhejiang University, Hangzhou 310058, China
3
Key Laboratory of Offshore Geotechnics and Material of Zhejiang Province, Research Center of Coastal and Urban Geotechnical Engineering, Zhejiang University, Hangzhou 310058, China
4
Department of Civil and Environmental Engineering, Shantou University, Shantou 515063, China
5
College of Environmental Science and Engineering, Ocean University of China, Qingdao 266100, China
6
Qingjian Group Co., Ltd, Qingdao 266071, China
*
Author to whom correspondence should be addressed.
J. Mar. Sci. Eng. 2019, 7(5), 128; https://doi.org/10.3390/jmse7050128
Submission received: 28 March 2019
/
Revised: 28 April 2019
/
Accepted: 30 April 2019
/
Published: 3 May 2019
(This article belongs to the Special Issue Coastal Geohazard and Offshore Geotechnics)
Abstract
:Foundations for offshore wind turbines (OWTs) are mainly open-ended piles that are subjected to cyclic loadings caused by winds, waves and currents. This study aims to investigate the dynamic responses of open-ended pipe pile under lateral cyclic loadings, as well as the characteristics of the soil plug and surrounding soil. Both large-scale indoor model test and discrete element simulation were adopted in this study. The test results show that the resistance of each part of the pipe pile increases linearly with depth during the process of pile driving. The pile side resistance degradation effect was also observed along with the friction fatigue. The soil plug formation rate decreases gradually with an increase in the pile depth. The influence range in the surrounding soil is about 5~6 times of the pile diameter. The cumulative displacement of the pile head increases with the number of cycles. Lateral tangential stiffness and lateral ultimate bearing capacity decreases with an increase in number of cycles. The severe disturbance range of soil around the pile is 2~3 times of the pile diameter. The center of rotation of the pile body is about 0.8 times of the pile body depth. The side frictional resistance and lateral pressure of the pile body is found to fluctuate along the pile body. Additionally, the lateral pressure and side friction resistance decreases gradually with decreasing tendency of the former more than the latter.
1. Introduction
The open-ended pile is a common option of foundations for offshore wind turbines (OWTs). In the offshore environment, the piles are subjected to not only the vertical static load (e.g., its own weight), but also the lateral cyclic loadings caused by winds, waves and currents. The deformation characteristics of pile foundations under cyclic loadings are important for the safety of OWTs. There has been a number of theoretical and experimental researches about the offshore structures [1,2,3,4,5,6,7,8,9,10,11]. Matlock [1] proposed the p-y curve calculation method, which was adopted by the US American Petroleum Institute (API). The p-y curve is the embodiment of the laterally loaded pile-soil interaction, where the soil resistance of the pile is gradually exerted with the application of lateral load. Reese et al. [2,3] developed and made some corrections on the calculation method of the p-y curve, which still is the most widely used calculation method for pile foundations under lateral loading. Rosquoet et al. [12] carried out a series of cyclic lateral loading tests of the pile foundation in sand, and proposed the calculation formula of the cyclic deformation of the pile body related to the cyclic load size. Leblanc et al. [13] carried out the centrifugal model test in sand to study the cumulative deformation of pile foundations under lateral cyclic loading. A series of indoor model test of pile foundations was performed to study the mechanical principle and deformation characteristics of rigid piles under different cyclic loads [14,15,16,17]. Li et al. [18] investigated weakening characteristics of offshore platform pile foundations under long-term cyclic loading, as well as used the pore-pressure development model to establish the residual soil shear strength model.
In addition, large amounts of research concerning the large-scale pile group have been conducted. These studies include not only the extensive experimental tests subjected to cyclic lateral loading [19,20,21,22], which reveals the highly nonlinear nature of the pile-soil-pile interaction, but also the analysis method for laterally loaded pile groups, that takes into account the non-linear behavior of the soil and the non-linear response of reinforced concrete pile sections simultaneously by the newly proposed Boundary Element Method (BEM) approach [23]. Recently, considering the limitations of test facilities and high costs for prototype (large-scale) tests, a series of cyclic lateral load tests was conducted on a stainless steel mono-pile in the centrifuge [24,25].
The aforementioned studies have significantly advanced the understanding of the response of pile under lateral cyclic loads. But there are few studies regarding the distinctive behaviors of open-ended piles due to the installation effect compared to that of the equivalent close-ended pile [26]. Thus, the dynamic response of the open-ended pile, particularly the soil plug inside the pile, still has considerable uncertainty. Moreover, understanding the micro-mechanisms is essential to interpret the macro-behavior in complex geotechnical issues [27]. In this paper, both the numerical simulation and model test were used to the reveal the comprehensive responses of the soil-pile system during the long-term lateral loading, including the micro-mechanisms and macro-behaviors both inside and outside the pile. A double-walled pile system was applied in both the tests and numerical simulation to separate the internal and external frictions.
2. Model Test Design
2.1. Model Box and Soil Sample Preparations
Figure 1 shows the model box utilized for testing of the open-ended pile. The inner dimensions of the model box are 3 m × 3 m × 2 m (length × width × height). The model box is provided with an unloading port system as well as visual windows. Figure 2 shows the mold particle gradation curve. The sand sample median grain size, non-uniformity coefficient and coefficient of curvature are 0.72 mm, 4.25 and 1.47, respectively. The soil sample is controlled by the sub-lamination compaction.
2.2. Model Pile and Sensor Layout
The double-layer pipe wall pile model consists of two concentric pipes of 6063 aluminum alloy material. The outer diameter, inner diameter, wall thickness and the pile length are 140 mm, 120 mm, 10 mm and 1000 mm, respectively. Both the inner and outer tubes are instrumented with a fiber optic sensor. The outer tube in addition is also instrumented with a soil pressure sensor (Figure 3). Six installed soil pressure sensors are arranged in order from the pile bottom to the pile-top to measure the soil pressure in the pile-soil interface.
2.3. Test Programme
Figure 4 shows that pile driving is proceeded using the step loading method by the lateral servo loading equipped and cyclic loading (refer to Figure 4 for illustration). According to the proposed damage standard of laterally loaded pile [28], the ultimate bearing capacity (PR) of a single pile foundation under the lateral static load conditions is the corresponding load when the pile top displacement reaches 0.1 times the pile diameter. Based on static the loading test, the lateral ultimate bearing capacity of the pipe pile is 1587 N. Leblanc et al. [13] defines two coefficients and to represent the characteristics of cyclic loading (Refer to Equations (1) and (2). is cyclic load ratio, is the ratio of minimum load Pmin to maximum load Pmax.
Loads in ocean environment are usually complicated and irregular. For simplifications, the cyclic loading form in model tests is shown in Figure 5. In this study, two types of cyclic loadings, i.e., Rc = 0.0 and Rb = 0.5 are simulated (according to Figure 5). Table 1 summarizes the testing program for this study. Among them, three tests on the open-ended pipe pile were subjected to biaxial loading while the other one was subjected to uniaxial loading. The load amplitudes adopted in this study are 200 N, 500 N, and 800 N, respectively, and the cyclic load ratios (, refer to Equation (1) and PR = 1587 N) are 0.126, 0.315, and 0.504, respectively. The uniaxial cyclic load ratio is 0.113.
3. Discrete Element Simulations
The experimental program was established to quantify deformation characteristics, that will help in evaluating the performance of open-ended pipe pile under various loading conditions (refer to Table 1). In addition to the experimental program, the numerical simulation plan was also designed so as to understand the mechanism, which will help in the interpretation of measured deformation characteristics from the experimental program. Below is the description of the adopted numerical program and procedures in this study.
3.1. Soil Sample Preparation
The size of the model is 2.4 m × 2.4 m (width × height) (refer to Figure 6). The a modified particle generation method, referred to as the Grid-Method (GM), was used to generate soil samples [29]. The model was divided into 24 small squares. The soil layers were defined by simulating one-side particles from left to right and from bottom to top. This method effectively avoids the pressure realization in the process of soil formation. The maximum particle size, minimum particle size, median diameter (D50) and uneven coefficient (Cu) are 3.52 mm, 2.25 mm, 2.92 mm and 1.26, respectively.
3.2. Numerical Simulation Model
The model pile has a diameter of 45 mm, a length of 0.5 m and a wall thickness of 2.475 mm. The model pile consists of particles with a radius of 1.125 mm. The particles overlap with each other. The distance between the centers of two adjacent particles is dpp (0.2 R) [30], as shown in Figure 7. In this simulation, the diameter of the particles forming the pile is much smaller than the diameter of the pile. Further, the distance between the particles is short. The roughness is close to the initial set value. The direction of the contact force between the particles and the pile is the same as the axial direction of the pile. With this, the axis resistance calculations are easier and more accurate. Since the proposed GM uses the explosive method for particle generation. Particles are created at their final radii in specify numbers to achieve the desired porosity and the number of every type size are calculated in advance. The following Equations (3)–(6) will be used for the calculation of the initial porosity einitial and particle number in every grid. Am is the area of the model, Api and N(i) is the total particles area of the same specific diameter r(i) and the quantity of the corresponding diameter particles. The final selection of soil samples is shown in Table 2.
3.3. Numerical Simulation Programme
An open-ended rigid pipe pile has an outer diameter of 45 mm and a length of 0.5 m and a wall thickness of 2.475 mm. In order to better observe the soil sample deformation, the soil samples are set to different colors. The depth of the pile model test is 0.4 m, and the model pile is placed on the centerline of the model box. The minimum distance between the model pile and the model box wall is more than 7D (D is the pile diameter), and the distance between the pile end and the bottom of the box is more than 4D. This configuration avoids any boundary effects [31]. The horizontal load test is carried out and results show that the horizontal ultimate bearing capacity of the pipe pile is 8118 N. The specific parameters adopted in the numerical simulation program are summarized in Table 3.
4. Test Results and Discussions
4.1. Measured Pile Top Cumulative Displacement under Lateral Cyclic Loadings
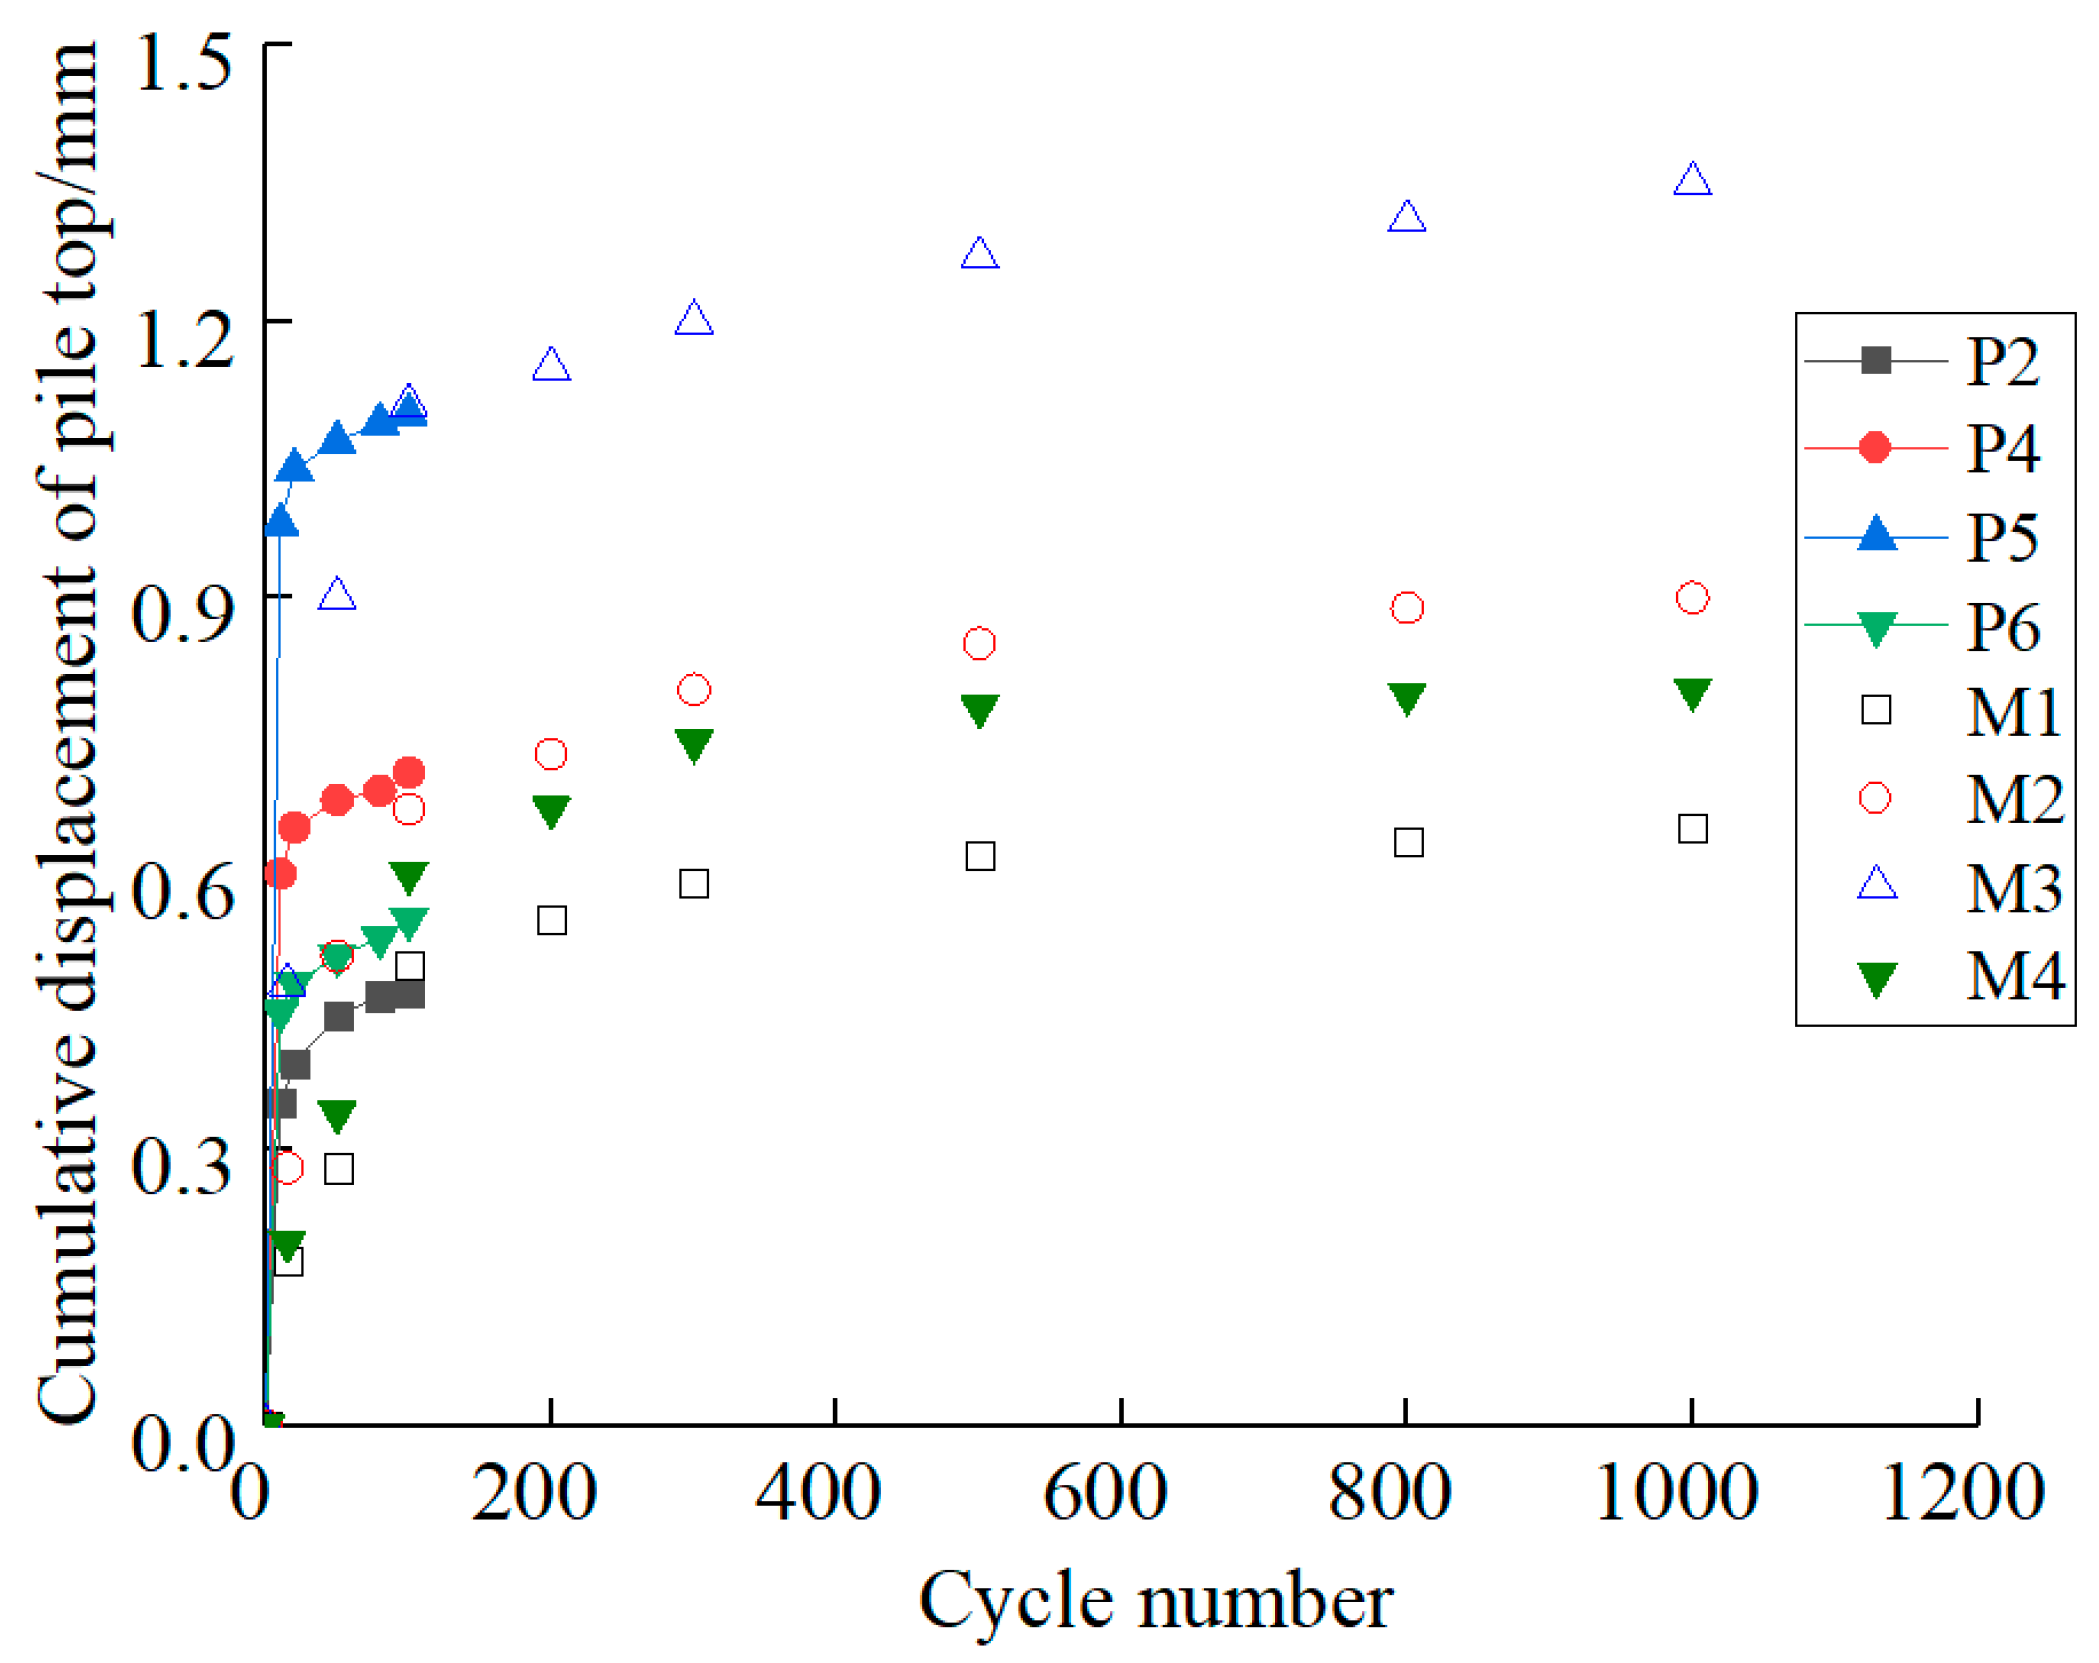
Figure 8 shows the variation in the horizontal displacement with time for all different loading conditions (refer to open-ended pipe pile cases, M1-M4 in Table 1). It can be observed that trends of the displacement curves of the pile top are consistent under different cyclic loading modes. With the application of the sinusoidal load, the displacement of the pile also changes sinusoidally over time.
The total displacement for tests M1, M2, M3 and M4 are 0.65 mm, 0.9 mm and 1.35 mm, 0.8 mm, respectively. As observed from Figure 8, the maximum cumulative displacement of the pile top gradually increases with an increase in the number of cycles and then gradually stabilizes beyond 100 cycles. The increase in the horizontal displacement is much faster in the first 100 cycles as compared to beyond. The displacement in the first 100 cycles for M1, M2, M3 and M4 are about 76.9%, 74.4%, 81.4%, 78.9% of the total displacement, respectively. The cumulative displacement for M2 and M3 increases higher than M1 by 27.7% and 51.8%, respectively. This is obviously due to an increase in load. It can be also observed that the cumulative displacement in the case of uniaxial loading is 18.75% higher than biaxial loads.
In this study, the cumulative displacement under the lateral cyclic loading is predicted mainly by establishing the relationship (refer to Equation (7)) between the displacement of the pile and the number of cycles. Hettler [32] carried out the cyclic triaxial test and model pile test in dry sand. It is considered that the relationship between the ratio of the lateral displacement (yN) of the pile under the cyclic load and the displacement y1 of the pile after the first cycle and the number of cycles N are as follows:
where yN is the horizontal displacement after N cycles, CN is the weakening coefficient. For cohesion-less soil, CN is usually 0.2. The weakening coefficients for M1, M2, M3 and M4 are found to be 0.159, 0.173, 0.181, and 0.186, respectively. The weakening coefficient is similar to that obtained by Zhu et al. [33].
4.2. Measured Load-displacement Curve under Lateral Cycling Load
Figure 9a–d shows the pile top load-displacement curves for cases M1-M4 under the lateral cyclic loading. The ratio of the maximum load and the change in the lateral displacement of the pile top is the lateral secant stiffness of the pile foundation. The stiffness of the soil around the pile changes under the cyclic load.
As shown in the figures, there exists a hysteresis loop in load displacement curves of the pile top with each of its cycle overlapping partially. Generally for all the cases, the hysteresis loop is relatively small during the first ten cycles of loading. The hysteresis loop gradually tilts toward the displacement axis. The area within the hysteresis loop curve is gradually reduced with an increase in cycles. Ultimately, the load displacement curve seems stabilized. The lateral stiffness for M1, M2, M3 and M4 decreases by 11.6%, 14.0%, 17.2%, and 12.8% at the end of 1000 cycles. However, it should be noted that the major decrease in lateral stiffness for M1, M2, M3 and M4 are 6.97%, 9.9%, 13.5% and 8.01%, respectively in the first 100 cycles. These account for more than 60% of the overall decrease. It shows that cyclic loading can reduce the lateral secant stiffness of the pile foundation. To a certain extent, cyclic loading can reduce the lateral deformation modulus of the soil. This is similar to the law obtained by Zhang et al. [34]. As per their law, the soil around the pile will “plastically” deform and gradually deflect with an increase in loading cycles. The gradual deformation of the soil will cause the weakening of the pile-soil system.
4.3. Measured Surface Displacement under Lateral Cyclic Loading
Figure 10 shows the variation in surface displacements (at points 1–6; refer to the experimental set up in Figure 4) for case M1 (refer to Table 1). It can be observed that there was a rapid increase in the displacement in the initial stage of application of the cyclic load. However, the rate of increase reduces after around 5 s. The displacement for point 2 (gauge no. 2; refer to Figure 4) on the right side of the pile is the largest, while on the left side, the displacement for gauge no. 5 is the largest. It can be observed that under the cyclic load, the soil will settle down in the range of 0.1 m near the pile. Between the range of 0.1 m~0.25 m, the soil uplift will occur on both sides of the pile.
The displacement on the left side of the pile is larger than that on the right side, where the active pressure area is larger than the passive pressure area. The comparison shows that the maximum surface displacement of the pile under different loading conditions such as M1, M2, M3 and M4 are 0.25 mm, 0.35 mm, 0.4 mm, 0.28 mm, respectively. With an increase in the cyclic load, the surface displacement increases gradually. Also, the displacement under the uniaxial cyclic load is larger than the biaxial cyclic load. This law is similar to the cumulative displacement of the pile top (refer to Figure 9). The disturbance range of the soil around the pile is 2~3 times the diameter of the pile.
4.4. Measured Pile Friction under Lateral Cyclic Loading
Inclination occurs to the pile under the application of the lateral cyclic load to the soil around the pile. The lateral cyclic load makes changes to the direction of the pile, where the friction and lateral pressure of the pile differs from the traditional vertical loaded pile. The friction law of the pile body is similar under different loading conditions. This study provides mainly the curve of the frictional force of the pile body (for case M1 only) with the cycle period (as shown in Figure 11). As observed from Figure 11, the unit friction force near the pile bottom decreases with an increase in the number of cycles. The frictional force near the pile top tends to increase during the first 100 cycles. However, the change in the frictional force is minimal in the middle of the pile body during the first 100 cycles. The friction at the pile bottom is generally weakened by about 3.8%, and the friction at the pile top is increased by about 3.4%. The friction of the pile body is generally found to reduce with the application of the lateral cyclic load; nevertheless, the decay rate is about 3.8%, where the degradation degree mainly accounts for more than 70% of the total degradation degree in the first 100 cycles.
The comparative analysis shows that the friction of the pile body is generally reduced with an application of the lateral cyclic load. The reduction tendency of the friction is found to slow down with an increase in the number of cycles. The overall reduction ranges of frictional forces for M1, M2, M3 and M4 are 3.6%, 3.8%, 4.2%, and 3.7%, respectively. As the magnitude of the cyclic load increases, the frictional decay amplitude increases, and the frictional force in the case of the axial cycle becomes weaker than the biaxial cycle. The friction inside the pile is mainly concentrated in the range of two times the pile diameter above the pile end, which can be called the “developing height” of the soil plug. In the range of the “developing height” of the soil plug, the frictional force in the pile changes more obviously. The disturbance of the soil plug at the end of the pile is directly proportional to the load amplitude. Moreover, the attenuation of the friction on the inner wall surface increases with the load amplitude.
4.5. Measured Lateral Pressure of Pile under Lateral Cycling Load
Figure 12a–d variation of the soil pressure with depth for different loading conditions (M1-M4, refer to Table 1). From Figure 12a, it is clear that the change in the lateral pressure at a depth of 0.58 m is zero. In general for all cases, the lateral soil pressure above the depth of 0.58 m increases under the cyclic load, while it decreases below the depth of 0.58 m. Hence, the depth of around 0.58 m is the center of the pile rotation. The center of the pile rotation is located approximately at about 0.8 times of the pile depth. During the cyclic loading process, the soil pressure sensor of the pile body is positioned in the “active zone”, and a part of the sensor is located in the “passive zone”. The definition of “active zone” and “passive zone” are established during the first cycle loading process. More specifically, when applying the horizontal loading in the first half cycle, the piles incline to the right around a rotation center, which brings about an “active zone” on the left of the pile while a “passive zone” on the right side. Herein, three soil press sensors (4#, 5# and 6#), above the rotation center, are located in the “passive zone”; on the contrary, 1# and 2# sensors are placed in the “active zone”.
The lateral pressure of the active zone increases with the cyclic loading, while the lateral pressure of the passive zone decreases. The pressure in the passive zone increases with an increase in the number of cycles. The major increase occurs during the first 100 cycles, accounting for more than 70% of the total. The lateral pressure of the active zone shows a decreasing trend. The analysis shows that the overall lateral pressure for M1, M2, M3 and M4 are attenuated by 6.9%, 7.5%, 8.8% and 7.3%, respectively.
4.6. Measured Static p-y Curve under Lateral Cyclic Loadings
In this study, the American Petroleum Institute API [35] and Reese [3] sand p-y curve models are used to calculate the horizontal load and displacement of single piles. Figure 13 shows the variation of the calculated load-displacement in the horizontal direction. As observed from Figure 13, the results obtained by the two above-mentioned methods are relatively more close to those of the static calculation (i.e., before the test cycle loading). With the application of the cyclic load, the soil around the pile is disturbed and the ultimate bearing capacity of the soil after the cyclic loading is reduced. The ultimate bearing capacity of the soil for cases M1, M2, M3 and M4 are reduced by about 11%, 14%, 17% and 13%, respectively. After 100 cycles, the results calculated by the two methods are quite different from the test results, indicating that the two static calculation methods cannot reflect accurately the influence of cyclic loading on the displacement of piles.
5. Numerical Simulation Results
5.1. Computed Cumulative Displacement of Pile Top
Figure 14 illustrates the maximum computed cumulative displacement curve of the pile top. Clearly, the cumulative displacement of the pile top under different loading conditions are similar. In all the cases (P2–P6), the displacement first increases rapidly during the initial 10 cycles and then gradually stabilizes. After 10 cycles, the displacements of P2, P4, P5 and P6 (Refer to Table 3 for numerical plan) were 0.35 mm, 0.6 mm, 0.98 mm and 0.45 mm, respectively. After the end of the cycle, the maximum cumulative displacement of the pile top for P2, P4, P5 and P6 are 0.41 mm, 0.71 mm, 1.13 mm and 0.55 mm, respectively.
Obviously, the maximum cumulative displacement of the pile top gradually increases with the increase in the cycle period. The rate of change in the first 10 cycles is faster, and the velocity gradually becomes slower after 20 cycles. The cumulative displacement mainly occurs in the first 10 cycles. The displacement is about 74.5%, 84.5%, 88.2%, and 81.8% of the total displacement. The cumulative displacement of the pile top increases with the increase of the cyclic load ratio, which increases by 33.8% and 57.7%, respectively. After the axial cyclic loading, the cumulative displacement around the pile is increased by 14.6% over the biaxial.
The computed and measured cumulative displacement of the pile top seems to be similar. The cumulative displacement gradually increases with the increase of the period, and the increasing rate of increase gradually becomes slower. The computed weakening coefficient is slightly larger than the experimental weakening coefficient.
5.2. Computed Load-displacement Curves
Under the lateral cyclic loading, the interaction between the pile and soil is weakening. Carrying the normalization analysis through the test and simulation results, the corresponding load amplitude divides the lateral load, and the lateral displacement is divided by the maximum cumulative displacement. Figure 15 illustrates the load-displacement curves under normalized cyclic loading conditions. The curves basically resemble the hysteresis loop. As the cycle period increases, the area of the loop gradually increases, indicating the increase in the displacement of the pile top as well as the reduction in the lateral stiffness.
The lateral secant stiffness k1 of the first cycle for P2, P4, P5 and P6 are 6.67 kN/mm, 8.57 kN/mm, 9.09 kN/mm, 5.88 kN/mm, respectively. The lateral secant stiffness k10 in the 10th cycle for P2, P4, P5 and P6 are 6.18 kN/mm, 7.65 kN/mm, 7.32 kN/mm, 5.21 kN/mm, respectively. The lateral tangential stiffness k100 in the 100th cycle for P2, P4, P5 and P6 are 5.88 kN/mm, 7.32 kN/mm, 6.94 kN/mm, 4.84 kN/mm, respectively. The overall reduction is 11.8%. 14.6%, 23.6%, and 17.7%, mainly occurred in the first 10 cycles, accounting for 62.0%, 73.6%, 82.3%, and 64.4% of the total.
5.3. Computed Displacement Around Soil
Figure 16 illustrates a computed displacement vector diagram and a displacement cloud diagram of soil around the P2 pile. As observed from the figure, with the application of the lateral load, the particles around the pile are disturbed, and the pile body is tilted in the direction of the loading force.
It can be seen from Figure 16a that the particle motion range of the soil in front of the pile and the soil behind the pile appears to be opposite. The direction of the movement of the soil plug is generally upward. It can be seen from Figure 16b that the influence range of the soil around the pile is the “butterfly” type. The soils around the pile can be approximately divided into different disturbance zones. The soil displacement in the pile top range is larger, whereas, the soil particle displacement in the pile bottom range is smaller. The displacement of the active zone is greater than the passive zone. Based on the figure, the displacement of soil particles is the largest in the range of four to five times of the pile diameter. The farther the distance from the pile, the smaller the particle displacement. The comparison test results show that the critical influence zone in the test lies at around 2~3 times of the pile diameter. The computed zone is slightly smaller than that measured in experiments.
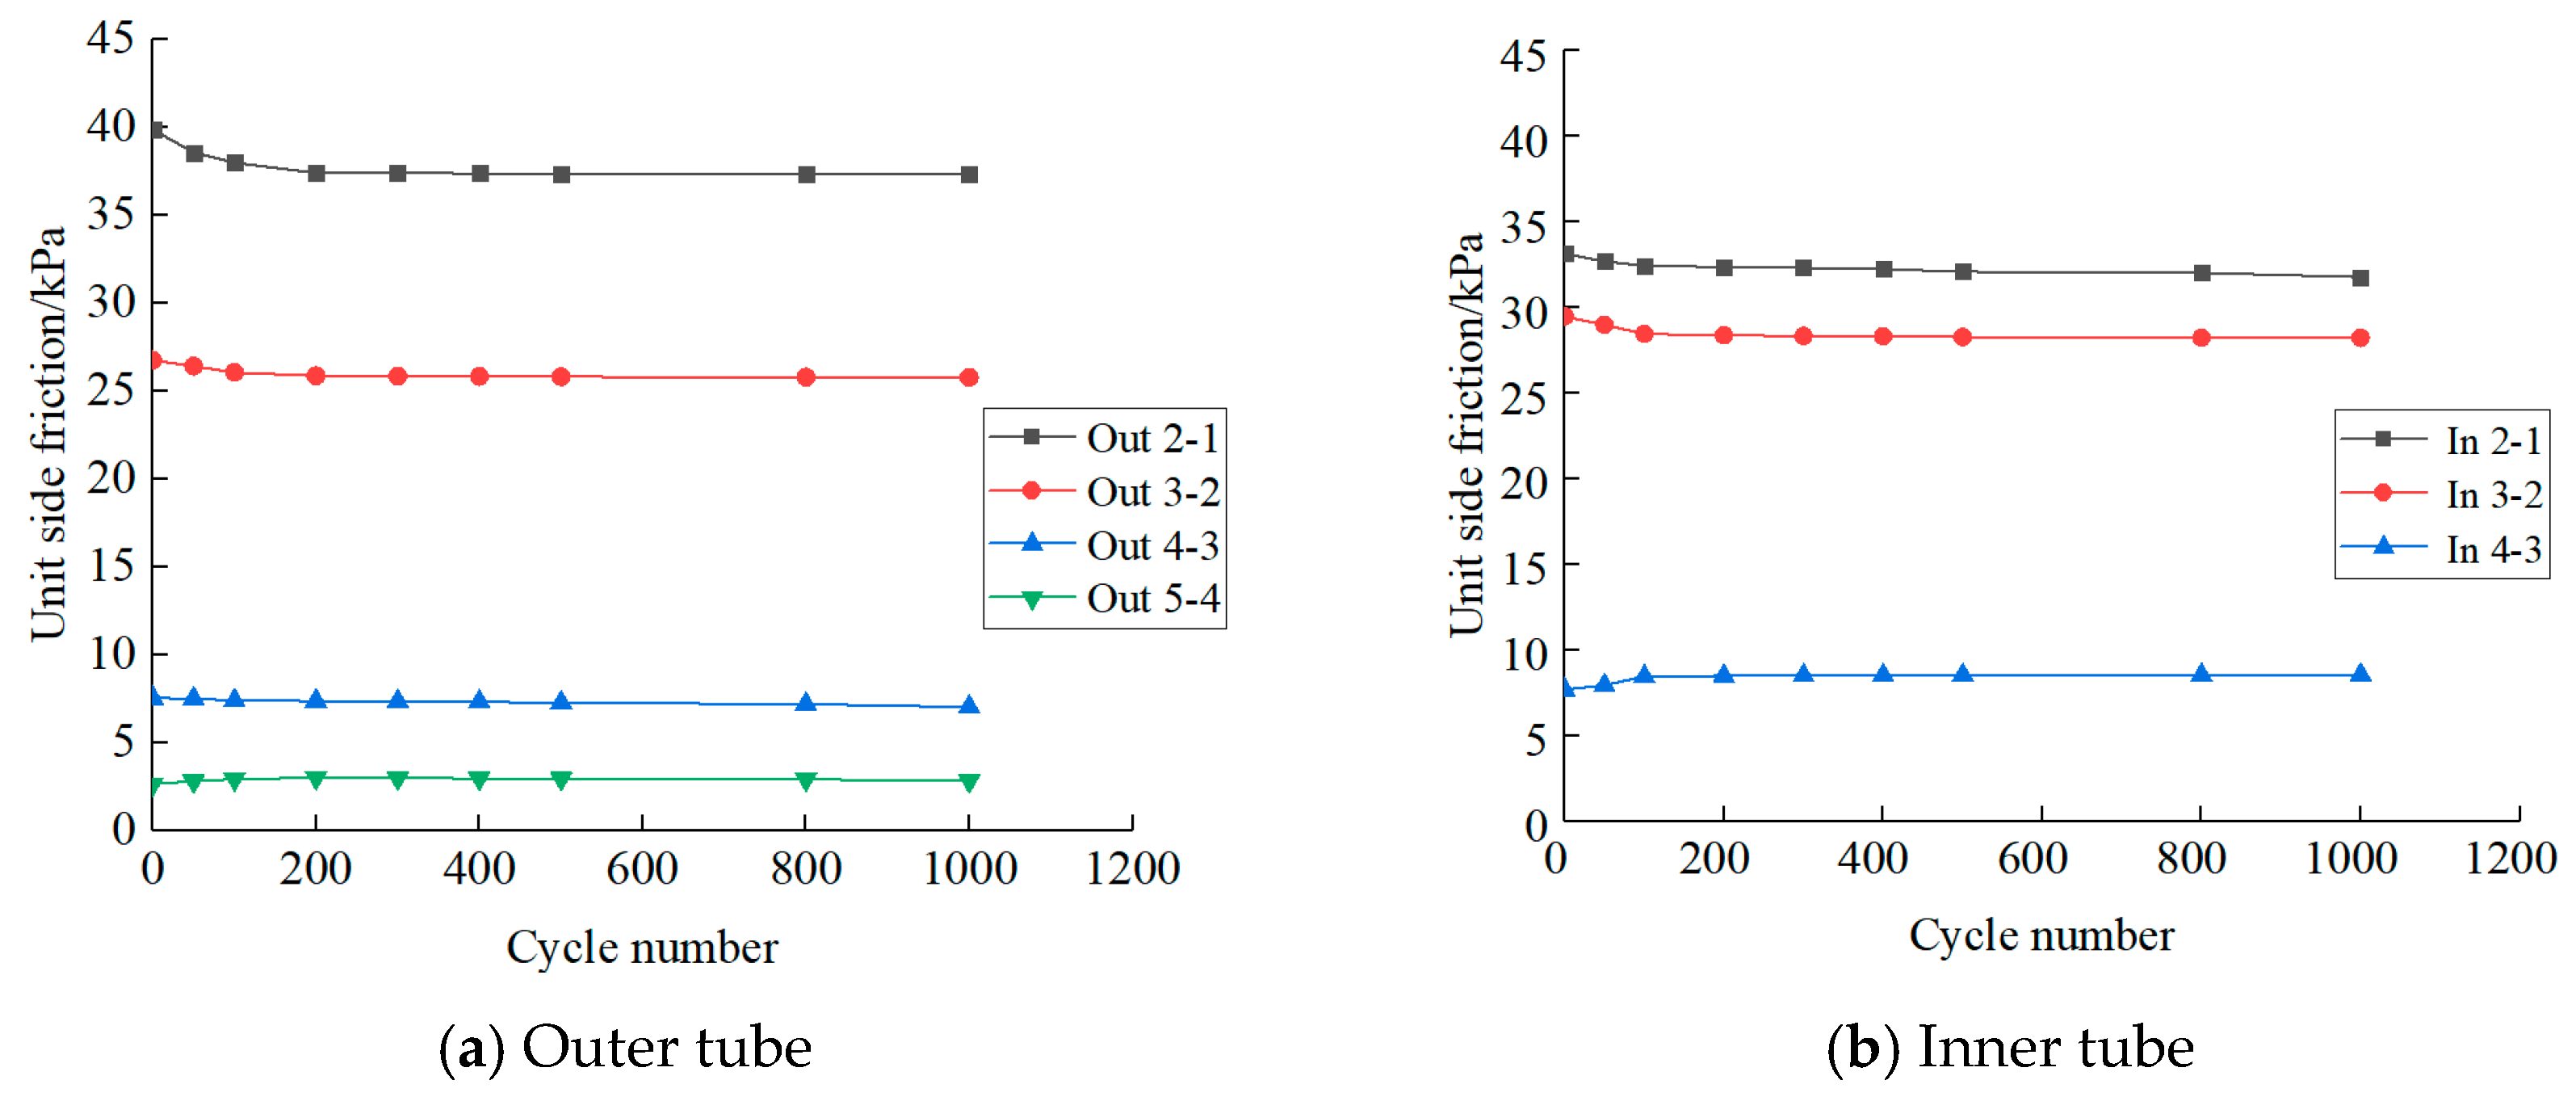
5.4. Computed Pile Side Friction
Figure 17a,b shows the variation of the pile frictional resistance with depth for outer and inner tubes, respectively for case P2. The axial side frictional resistance appears to increase along the depth with some fluctuations for both the outer and inner tubes of the pile. It can be seen from Figure 17a that the side frictional resistance on the left side of the pile decreases at the vicinity of the pile top. The decreasing rate gradually becomes slower with the number of cycles. The side frictional resistance of the pile bottom tends to increase under the application of the load. The pile body rotates to the right around the center of rotation, and the friction between the soil and the pile on the left side of the pile top is reduced. The analysis of Figure 17a shows that the outer side frictional resistance above the center of rotation decreases. However, there is an increasing trend observed below the center of rotation. Variations in both these trends occur mainly during the first 10 cycles. The outer side frictional resistance on the right side of the pile is opposite to the left side. As compared to Figure 17a, the side frictional resistance (Figure 17b) on the left and right sides of the pile changes minimally during the period. Compared with the inner and outer frictional resistance, the side frictional resistance of the right side is greater than the side frictional resistance of the left side. The comparative analysis shows that the variation in the lateral frictional resistance is the highest in pile P5, while it is lowest for pile P2. For all the piles (P2, P4 and P5), the variations (i.e., gradually increase) of the lateral frictional resistance occur mainly during the first 10 cycles of loading. Additionally, it can be stated that the lateral frictional resistance of the pile (based on P2 and P6) is more under the axial cyclic load than the biaxial cyclic load.
Figure 18 shows the variation of the side frictional resistance of P2, P4, P5 and P6 with the number of cycles. As the number of cycles increase, the total side frictional resistance of the pile body decreases. The overall decrease for P2, P4, P5 and P6 are 3.4%, 3.8%, 5.1%, and 3.5%, respectively. Generally, for all the cases (P2, P4, P5 and P6), the main decline in the side frictional resistance in the first 10 cycles accounted for more than 77% of the total.
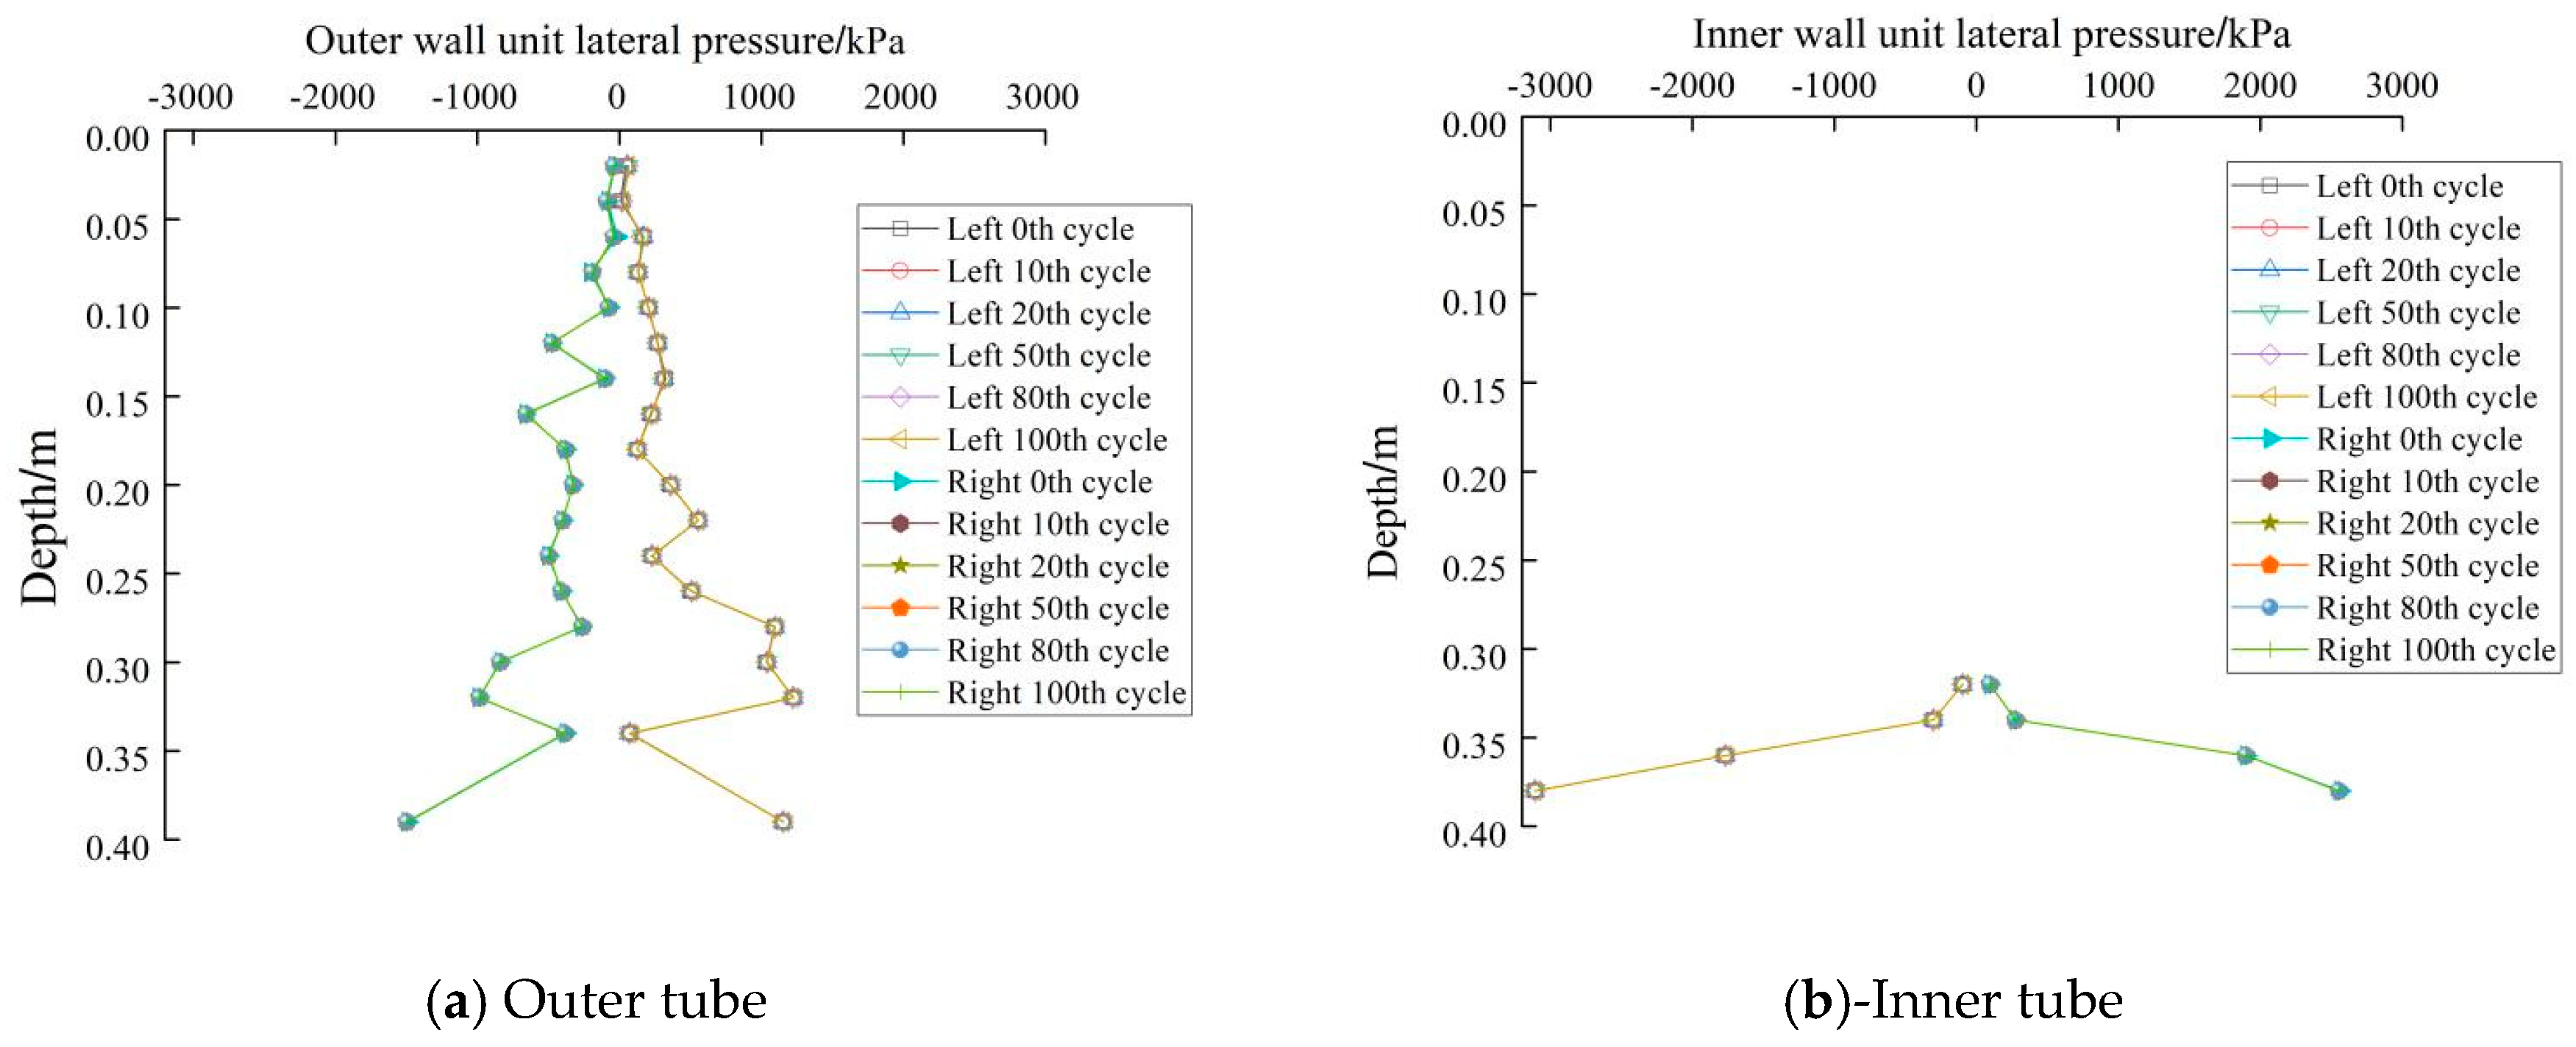
5.5. Computed Lateral Pressure of the Pile Body
Figure 19a,b shows the variation of the lateral pressure distribution along with the depth for the outer and inner tube, respectively of the pile (P2). It can be observed that despite fluctuations, there is an increase in the lateral pressure along with the depth. Further, it can be observed that the outer lateral pressure on the left side of the pile is a positive value, while, the outer lateral pressure on the right side of the pile is a negative value. The difference among them tends to increase along with the depth.
The pressure on the left side of the pile near the pile top decreases due to cyclic loadings, while the pressure on the left side near the pile end increases. The lateral pressure on the right side of the pile changes inversely to the left side. The lateral pressure near the center of rotation varies minimally during the loading period. It can be seen from Figure 19b that the sign of the lateral pressure on the inside of the pile is opposite to the outside. Overall, there is an increase in the lateral pressure along with the depth. The fluctuations are relatively smaller. The difference in pressures between the inside and outside of the pile increases with the depth. The maximum pressures on surfaces of the inner tube are approximately twice that of the outer tube. It indicates that the inner tube experiences larger lateral pressures than the outer tube. Among P4, P5, P6 and P2, the lateral pressure change mainly occurs in the first 10 cycles and then gradually stabilizes. However, the change extents are different for the different piles due to different load ratios, loading methods and loading amplitude.
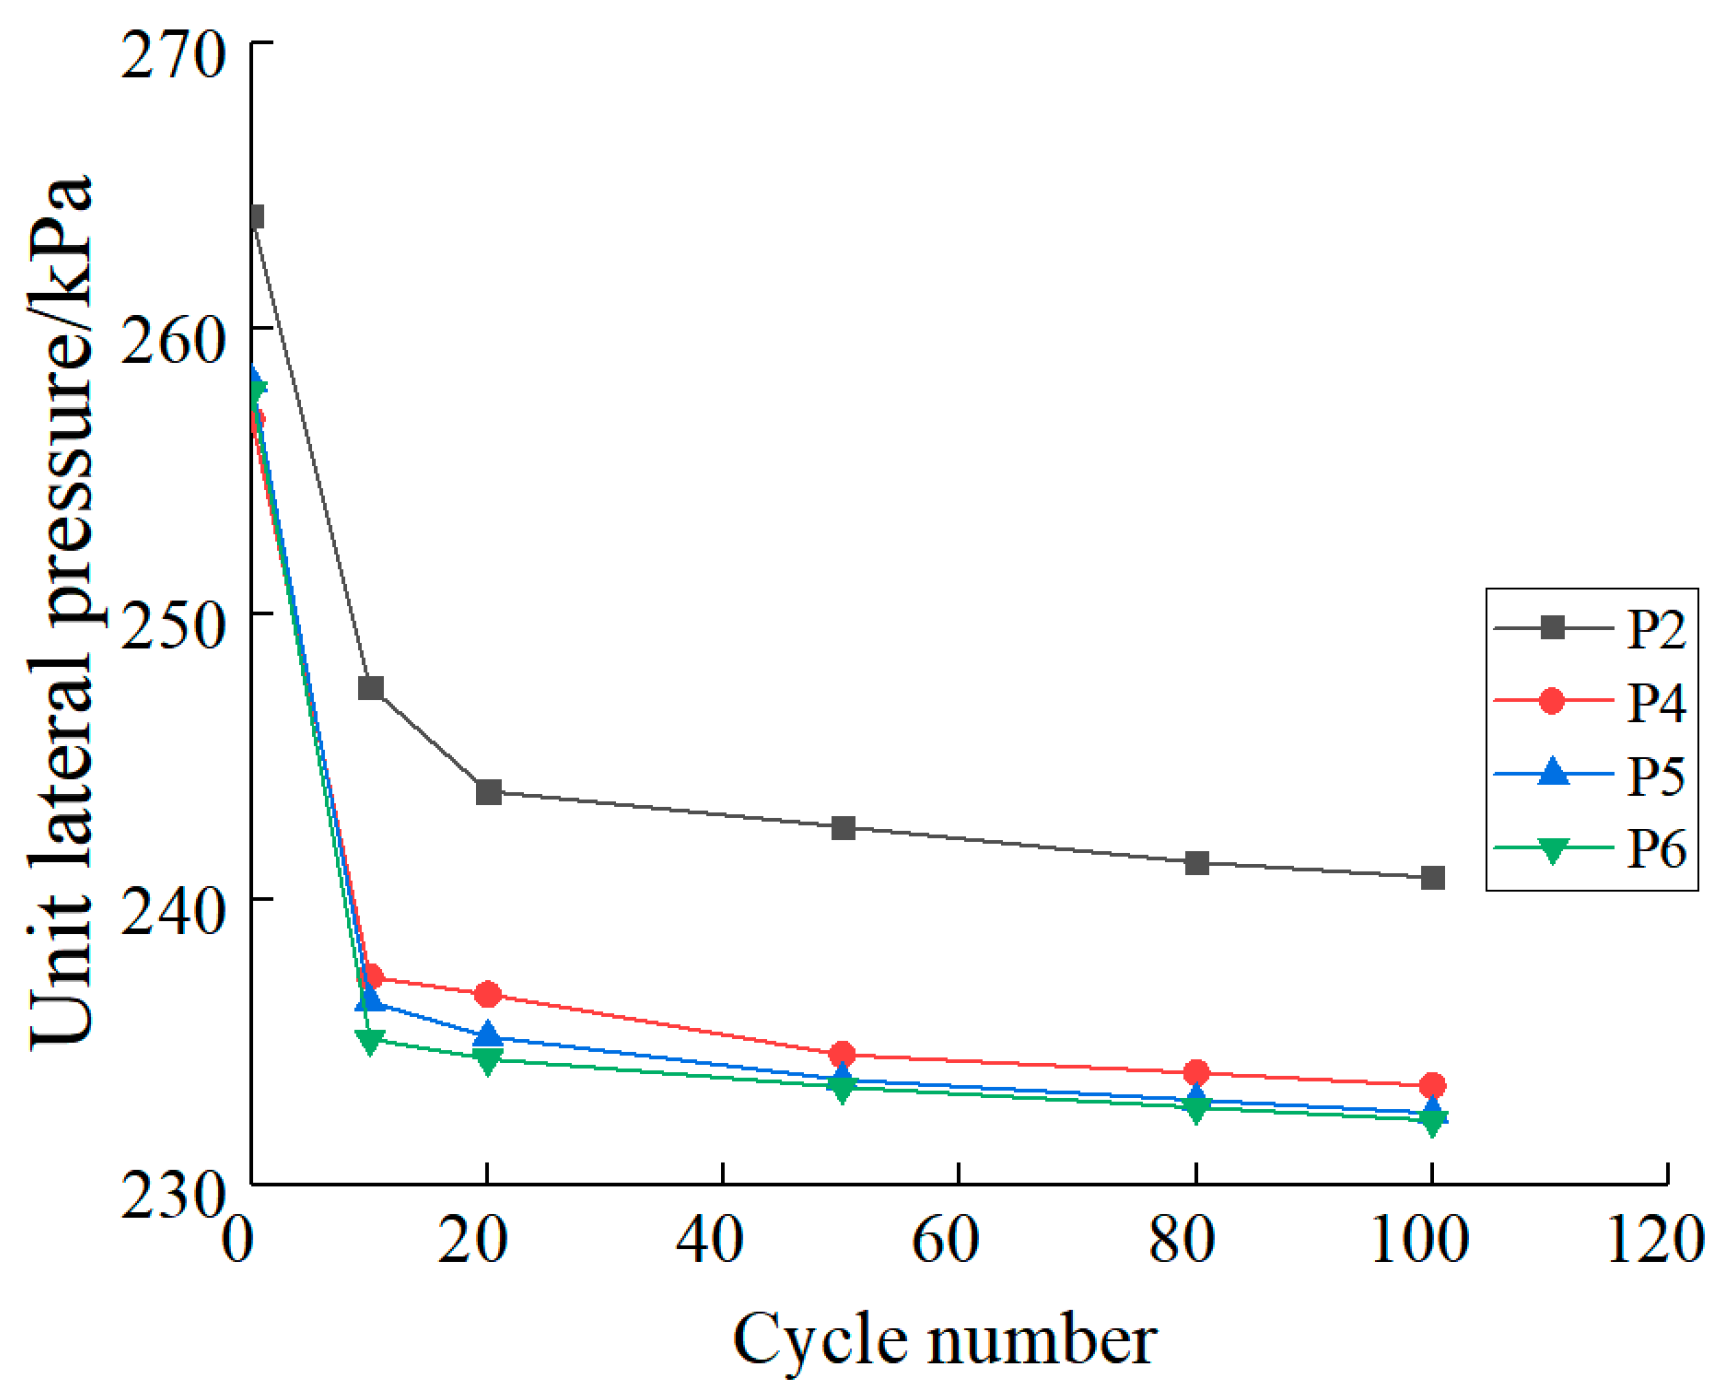
Figure 20 compares the distribution of the total lateral pressure between piles P2, P4, P5, and P6 piles. It can be observed that the pressure of the pile-soil interface under axial and biaxial cyclic loading shows a reducing trend. An overall decrease of 8.9%, 9.3%, 10.1%, and 9.7% was observed for piles P2, P4, P5 and P6, respectively. The major change in soil pressure occurs mainly in the first 10 cycles, accounting for more than 74% of the total. Similar to the experimental results, the lateral pressure decreases with the number of cycles. The major change occurs in the first 100 cycles accounting for more than 70% of the total. The lateral pressure of the active zone shows a decreasing trend. The comparative analysis showed that the overall lateral pressure for piles P2, P4, P5 and P6 was attenuated by 6.9%, 7.5%, 8.8%, and 7.3%. It can be seen that the magnitude of the decline increases with an increase of the cyclic load ratio (i.e., lateral pressure higher in the case of axial loading than biaxial).
Figure 21 shows the comparison of static calculation curves before and after cyclic loading between piles P2, P4, P5 and P6. It can be seen from Figure 21 that under the application of different cyclic loading modes, the lateral ultimate bearing capacity of P2, P4, P5 and P6 is reduced by 11.7%, 14.5%, 23.5%, and 17.7%, respectively. The comparative analysis shows that the cyclic load can reduce the lateral bearing capacity of the pile foundation. The magnitude of the reduction under different loading conditions is different. The rate of decrease of the amplitude is enhanced with the cyclic load ratio. The rate of decrease of the amplitude is higher in the case of uni-directional loading than biaxial loading.
Both measured and computed static load curves for all types of loading conditions were normalized by dividing the actual value (load or displacement) with the corresponding maximum value. Figure 22 shows the comparison of measured as well as computed normalized static load curves. It can be seen from the test results that with the application of the cyclic load, the soil around the pile is disturbed, and the ultimate bearing capacity of the soil after circulation is reduced. The ultimate bearing capacity for M1, M2, M3 and M4 cycle is reduced by about 11%, 14%, 17%, 13%, respectively. In the simulation results, the lateral ultimate bearing capacity of the piles decreased by 11.7%, 14.5%, 23.5%, and 17.7% after 100 cycles. The ultimate bearing capacity increases with the cyclic load ratio. The decreasing amplitude is gradually increased, and the reduction of the bearing capacity in the case of axial cyclic loading is more than the reduction of biaxial cyclic loading.
6. Conclusions
In this study, the dynamic response of open-ended pipe piles under lateral cyclic loadings is studied by large-scale indoor model tests and discrete element simulations. The main findings can be summarized as follows:
(1) Both the increases of cumulative displacement on the pile top and the decrease of the lateral secant stiffness occur mainly in the first 100 cycles, which is in the range of 10~25% but varies greatly with the change of the loading mode. Uni-axial cyclic loading causes more lateral displacement than biaxial loading. The ultimate bearing capacity of the pile decrease logarithmically with the increase of the period, and the weakening coefficients are different for loading modes but all in the range of 0.15~0.2.
(2) The cumulative displacement on the pile top increases with the increasing cyclic load ratio, but its increasing extent is less than that of the cyclic load ratio. The cumulative displacement reaches to around 1% of the pile diameter when the cyclic load ratio increases to about 0.5.
(3) The influence range of the soil around the pile under lateral loadings is the “butterfly” type. The surrounding clear disturbance range of the soil is 2~3 times of the pile diameter, and the rotation center position of the pile body is about 0.8 times of the buried depth of the pile body.
(4) Both the soil plug and outer friction contributed significantly to the pile lateral resistance, the “developing height” of the soil plug under lateral loading is in the range of two times the pile diameter above the pile end. The lateral pressure and frictional resistance of the active zone increases with the cyclic loading, while the lateral pressure and frictional resistance of the passive zone decreases with lateral loadings.
Author Contributions
Conceptualization and methodology, J.L. and Z.G.; software, N.Z.; validation, J.L., H.Z. and A.G.; formal analysis, J.L., Z.G. and A.G.; writing—original draft preparation, J.L. and Z.G.; writing—review and editing and visualization, L.X., T.L. and C.F.
Funding
This research was funded by National Natural Science Foundation of China (41772318), Shandong Key Research and Development Plan (2017GSF20107), Cooperative Innovation Center of Engineering Construction and Safety in Shandong Blue Economic Zone, Open Fund of State key Laboratory of Coastal and Offshore Engineering (LP1712), and National Key Foundation for Exploring Scientific Instrument Program (41627801).
Conflicts of Interest
The authors declare no conflict of interest.
References
- Matlock, H. Correlations for design of laterally loaded piles in soft clay. In Proceedings of the 2nd Offshore Technology Conference, Houston, TX, USA, 22–24 April 1970; pp. 577–594. [Google Scholar] [CrossRef]
- Reese, L.C.; Welch, R.C. Lateral loading of deep foundations in stiff clay. J. Geotech. Geoenviron. Eng. 1975, 101, 633–649. [Google Scholar]
- Reese, L.C.; Cox, W.R.; Koop, F.D. Analysis of laterally loaded piles in sand. In Proceedings of the Offshore Technology Conference; University of Houston: Houston, TX, USA, 1974; pp. 95–105. [Google Scholar] [CrossRef]
- O’Neill, M.W.; Murchison, J.M. An Evaluation of p-y Relationships in Sands; University of Houston: Houston, TX, USA, 1983. [Google Scholar]
- Murchinson, J.M.; O’Neill, M.W. Evaluation of p-y relationships in cohesionless soils. In Proceedings of the Analysis and Design of Pile Foundations, San Francisco, CA, USA, 1–5 October 1984; pp. 174–191. [Google Scholar]
- Georgiadis, M.; Anagnostopoulos, C.; Saflekou, S. Centrifugal testing of laterally loaded piles in sand. Can. Geotech. J. 1992, 29, 208–216. [Google Scholar] [CrossRef]
- Li, W.; Igoe, D.; Gavin, K. Evaluation of CPT-based p-y models for laterally loaded piles in siliceous sand. Geotech. Lett. 2014, 4, 110–117. [Google Scholar] [CrossRef]
- Guo, Z.; Jeng, D.S.; Zhao, H.Y.; Guo, W.; Wang, L.Z. Effect of seepage flow on sediment incipient motion around a free spanning pipeline. Coast. Eng. 2019, 143, 50–62. [Google Scholar] [CrossRef]
- Li, K.; Guo, Z.; Wang, L.Z.; Jiang, H.Y. Effect of seepage flow on shields number around a fixed and sagging pipeline. Ocean Eng. 2019, 172, 487–500. [Google Scholar] [CrossRef]
- Achmus, M. Design of axially and laterally loaded piles for the support of offshore wind energy converters. In Proceedings of the Indian Geotechnical Conference GEOtrendz-2010, Mumbai, India, 16–18 December 2010; pp. 92–102. [Google Scholar]
- Jardine, R.; Chow, F.; Overy, R.; Standing, J. ICP Design Methods for Driven Piles in Sands and Clays; Thomas Telford: London, UK, 2005. [Google Scholar]
- Rosquoet, F.; Thorel, L.; Garnier, J. Lateral cyclic loading of sand-installed piles. Soils Found. 2007, 47, 821–832. [Google Scholar] [CrossRef]
- Leblanc, C.; Houlsby, G.T.; Byrne, B.W. Response of stiff piles in sand to long-term cyclic lateral loading. Géotechnique 2010, 60, 79–90. [Google Scholar] [CrossRef]
- Chen, R.P.; Ren, Y.; Chen, Y.M. Experimental investigation on a single stiff pile subjected to long-term axial cyclic loading. Chin. J. Geotech. Eng. 2011, 33, 1926–1933. (In Chinese) [Google Scholar]
- Zhang, Y.; Wang, Z.G.; Zhao, S.Z. Centrifugal tests of single pile’s bearing capacity subjected to bidirectional cyclic lateral loading. J. Water Resour. Archit. Eng. 2014, 12, 27–31. (In Chinese) [Google Scholar]
- Liu, H.J.; Zhang, D.D.; Lv, X.H. A Methodological Study on the Induction of Triploidy Oyster with Different Salinities; Periodical of Ocean University of China: Beijing, China, 2015; Volume 1, pp. 76–82. (In Chinese) [Google Scholar]
- Liang, F.Y.; Qin, C.R.; Chen, S.Q. Model test for dynamic p-y backbone curves of soil-pile interaction under cyclic lateral loading. China Harb. Eng. 2017, 37, 21–26. (In Chinese) [Google Scholar]
- Li, J.Z.; Wang, X.L.; Zhang, H.R. P-Y curve of weakening saturated clay under lateral cyclic load. China Offshore Platf. 2017, 32, 36–42. (In Chinese) [Google Scholar]
- Brown, D.A.; Reese, L.C.; O’Neill, M.W. Cyclic lateral loading of a large-scale pile group. J. Geotech. Eng. 1987, 113, 1326–1343. [Google Scholar] [CrossRef]
- Little, R.L.; Briaud, J.L. Full Scale Cyclic Lateral Load Tests on Six Single Piles in Sand; No. TAMU-RR-5640; Texas A and M University College Station Department of Civil Engineering: College Station, TX, USA, 1988. [Google Scholar]
- Brown, D.A.; Reese, L.C. Behavior of a Large-Scale Pile Group Subjected to Cyclic Lateral Loading; Texas University at Austin Geotechnical Engineering Center: Austin, TX, USA, 1988. [Google Scholar]
- Van Impe, W.F.; Reese, L.C. Single Piles and Pile Groups under Lateral Loading; CRC Press: London, UK, 2010. [Google Scholar]
- Stacul, S.; Squeglia, N. Analysis Method for Laterally Loaded Pile Groups Using an Advanced Modeling of Reinforced Concrete Sections. Materials 2018, 11, 300. [Google Scholar] [CrossRef] [PubMed]
- Li, Z.; Haigh, S.K.; Bolton, M.D. Centrifuge modelling of mono-pile under cyclic lateral loads. Phys. Model. Geotech. 2010, 2, 965–970. [Google Scholar]
- Kirkwood, P.B.; Haigh, S.K. Centrifuge testing of monopiles subject to cyclic lateral loading. In Proceedings of Physical Modelling in Geotechnics; Taylor and Francis: London, UK, 2014; pp. 827–831. [Google Scholar]
- Paik, K.; Salgado, R.; Lee, J.; Kim, B. Behavior of open-and closed-ended piles driven into sands. J. Geotech. Geoenviron. Eng. 2003, 129, 296–306. [Google Scholar] [CrossRef]
- Bolton, M.D.; Cheng, Y.P. Micro-geomechanics. In Constitutive and Centrifuge Modelling: Two Extremes (SM Springman); CRC Press: Boca Raton, FL, USA, 2001; pp. 59–74. [Google Scholar]
- Cuéllar, P. Pile Foundations for Offshore Wind Turbines: Numerical and Experimental Investigations on the Behaviour under Short-Term and Long-Term Cyclic Loading; University of Technology Berlin: Berlin, Germany, 2011. [Google Scholar]
- Duan, N.; Cheng, Y.P.; Liu, J.W. DEM analysis of pile installation effect: Comparing a bored and a driven pile. Granul. Matter 2018, 20, 36. [Google Scholar] [CrossRef]
- Duan, N. Mechanical Characteristics of Monopile Foundation in Sand for Offshore Wind Turbine; University College London: London, UK, 2016; Available online: http://discovery.ucl.ac.uk/id/eprint/1529635 (accessed on 23 December 2016).
- Xu, G.M.; Zhang, W.M. A study of size effect and boundary effect in centrifugal tests. Chin. J. Geotech. Eng. 1996, 18, 80–85. (In Chinese) [Google Scholar]
- Hettler, A. Verschiebung Starrer und Elastischer Gründungskörper in Sand bei Monotoner und Zyklischer Belastung; Ver”oentlichungen des Institutes für Bodenmechanik und Felsmechanik der Universität Fridericiana in Karlsruhe: Engler-Bunte-Ring, Germany, 1981; Heft 90. [Google Scholar]
- Zhu, B.; Xiong, G.; Liu, J.C. Centrifuge modelling of a large-diameter single pile under lateral loads in sand. Chin. J. Geotech. Eng. 2013, 35, 1807–1815. (In Chinese) [Google Scholar]
- Zhang, C.R.; Yu, J.; Huang, M.S. P-Y curve analyses of rigid short piles subjected to lateral cyclic load in soft clay. Chin. J. Geotech. Eng. 2011, 33, 78–82. (In Chinese) [Google Scholar]
- American Petroleum Institute. Recommended Practice for Planning, Designing and Constructing Fixed Offshore Platforms-Working Stress Design, 21st ed.; American Petroleum Institute: Washington, DC, USA, 2000. [Google Scholar]
Figure 1.
Model test arrangement.

Figure 2.
Soil particle gradation curve.

Figure 3.
Instrumentation of model pile sensor layout for measuring strain and pressure.

Figure 4.
Cyclic loading control (Note: 1–6 is the displacement meter number; and the displacement from the pile is 0.1 m, 0.25 m and 0.6 m).
Figure 4.
Cyclic loading control (Note: 1–6 is the displacement meter number; and the displacement from the pile is 0.1 m, 0.25 m and 0.6 m).

Figure 5.
Schematic diagram of cyclic loading.

Figure 6.
Preparation of soil samples by the GM method.

Figure 7.
Pile composition.

Figure 8.
Pile top cumulative displacement.

Figure 9.
Load-displacement curve of pile top of Pile M1-M4.
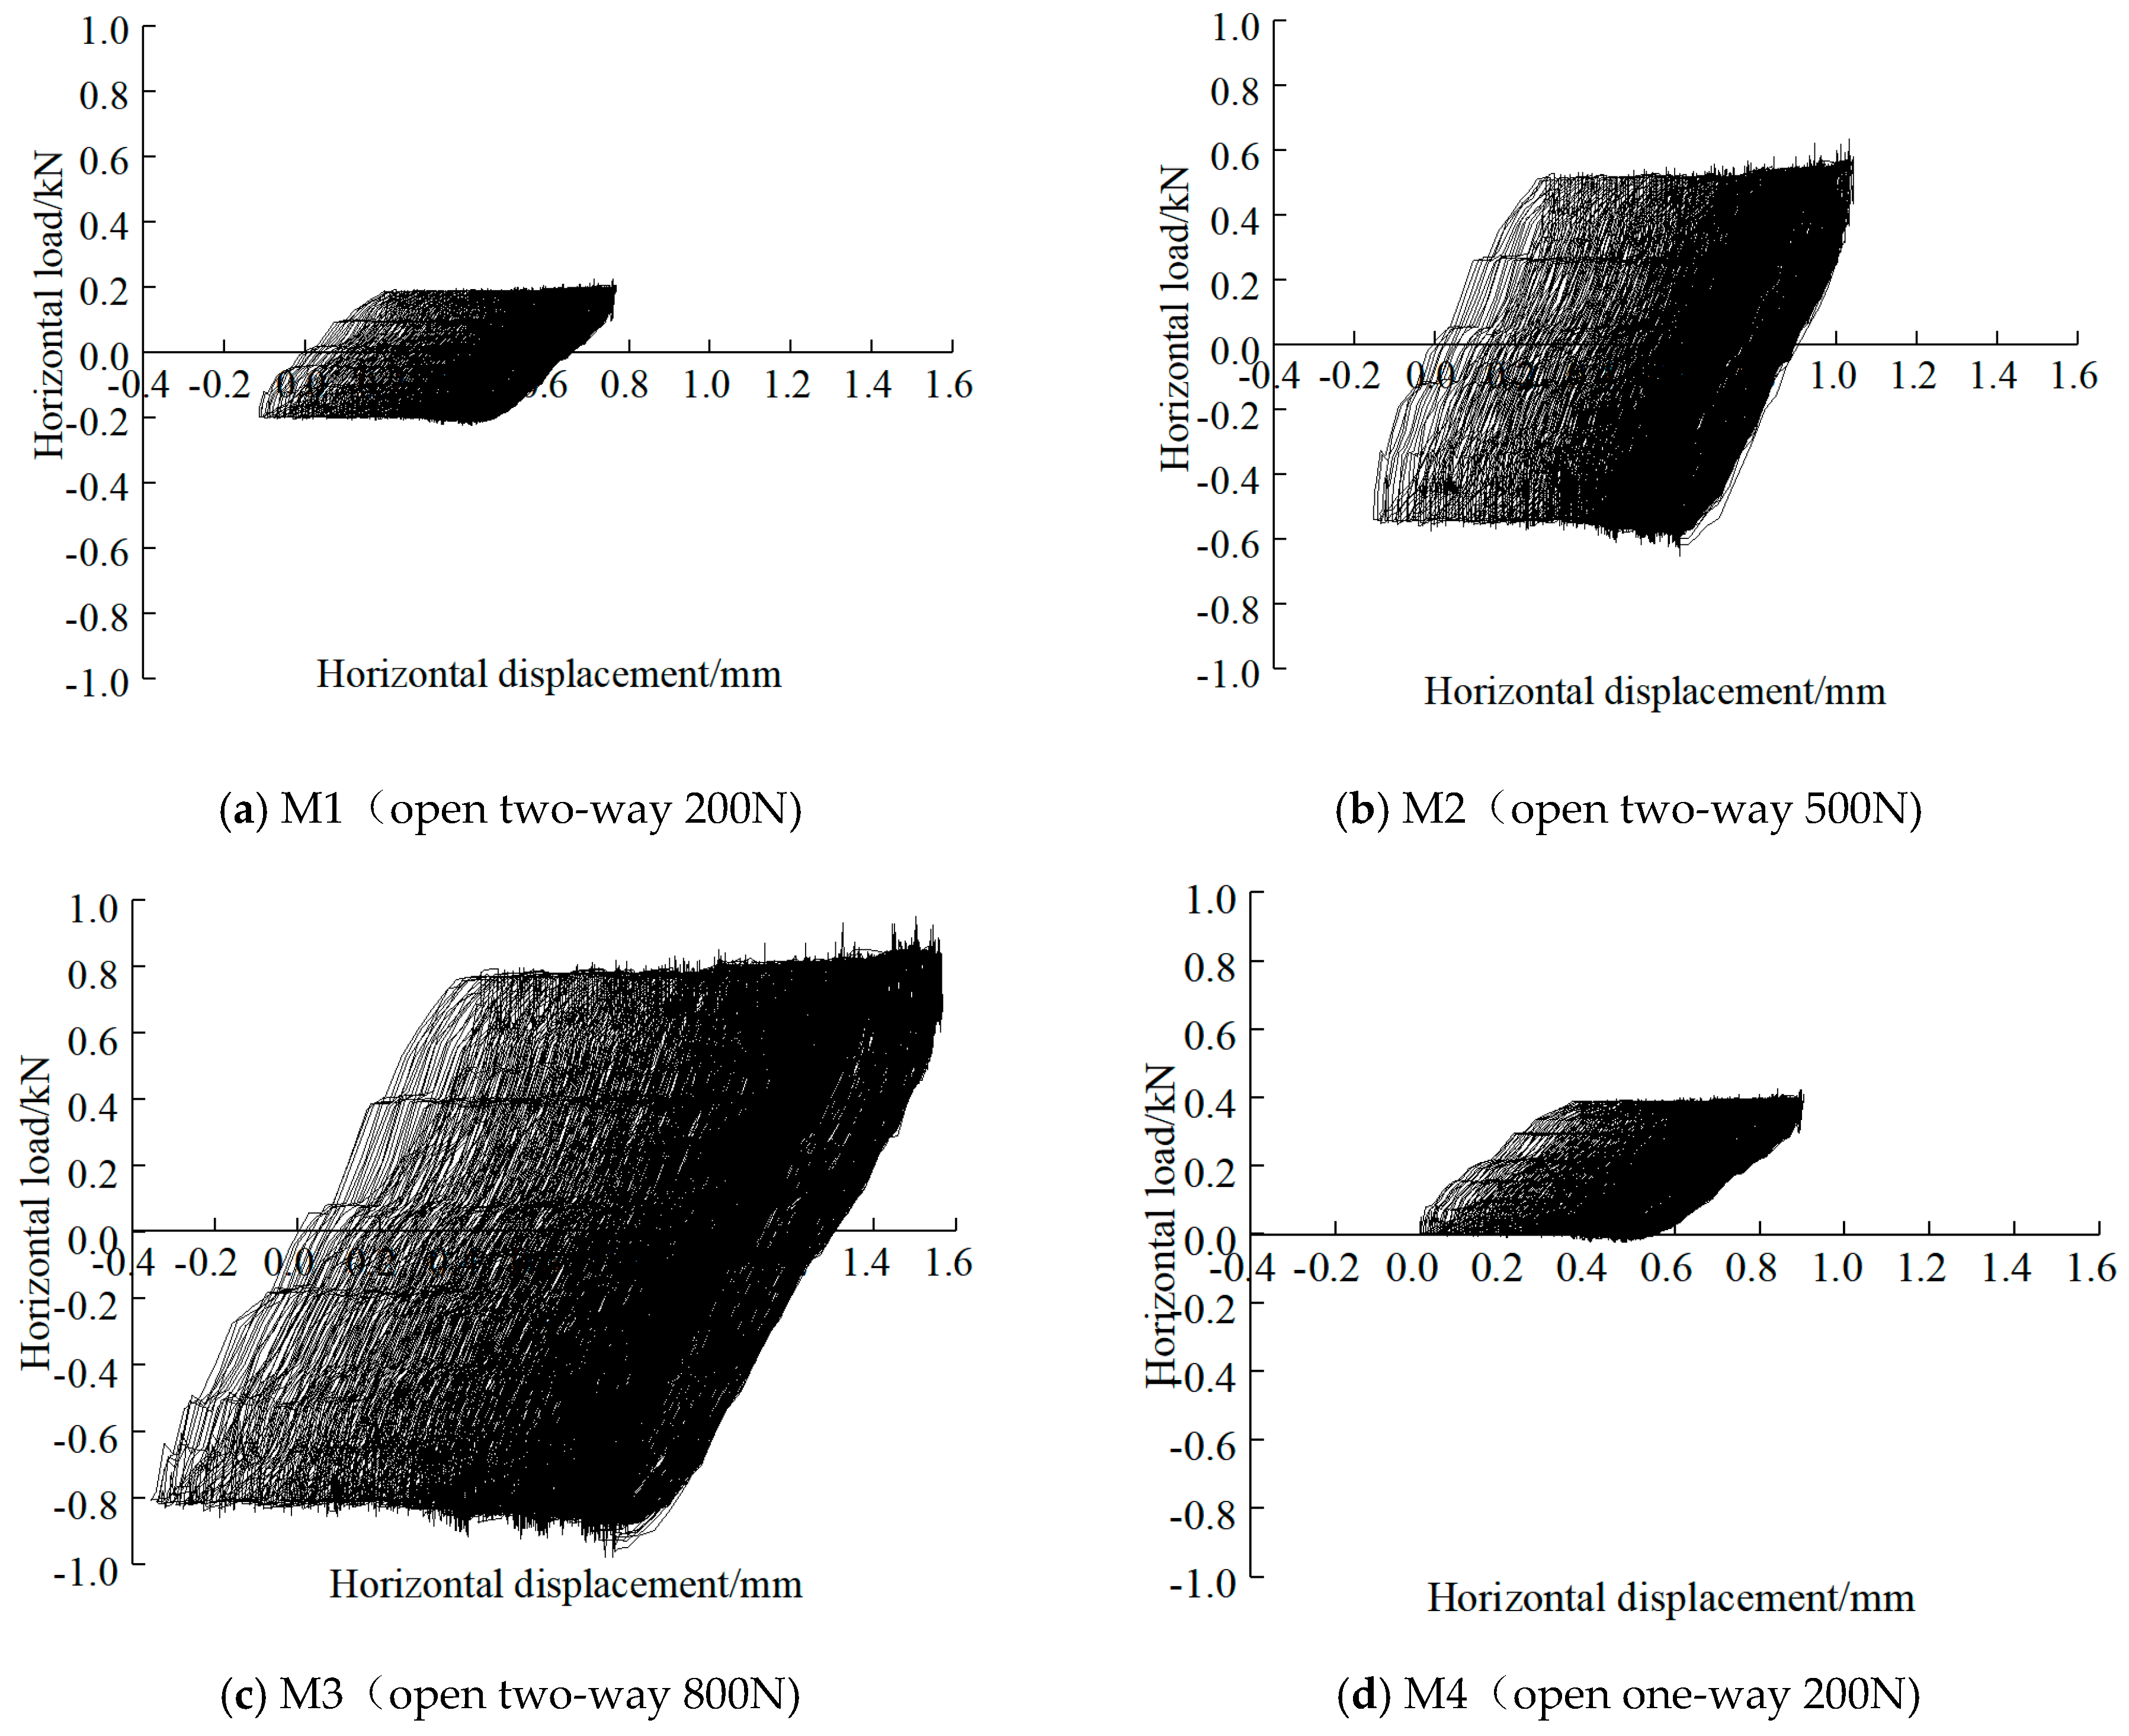
Figure 10.
Variation of surface displacement with time under lateral cyclic loading for case M1.

Figure 11.
Unit side friction for case M1 (refer to Table 1).
Figure 11.
Unit side friction for case M1 (refer to Table 1).

Figure 12.
Variation of lateral soil pressures with depth for various loading conditions of Pile M1-M4.
Figure 12.
Variation of lateral soil pressures with depth for various loading conditions of Pile M1-M4.


Figure 13.
Static p-y curve based on p-y models proposed by API [26] and Reese [3] compared with physical model test results.

Figure 14.
Displacement of the pile top According to Equation (7), the weakening coefficients of P2, P4, P5, and P6 after fitting are 0.22, 0.24, 0.26, and 0.27, respectively. It can be seen that as the cyclic load ratio increases, the weakening coefficient also increases gradually. The axial cyclic load-weakening coefficient reaches its peak value at a much faster rate with an increase in the cyclic load ratio.

Figure 15.
Load vs. displacement curves for various loading conditions of Pile P2, P4, P5 and P6.
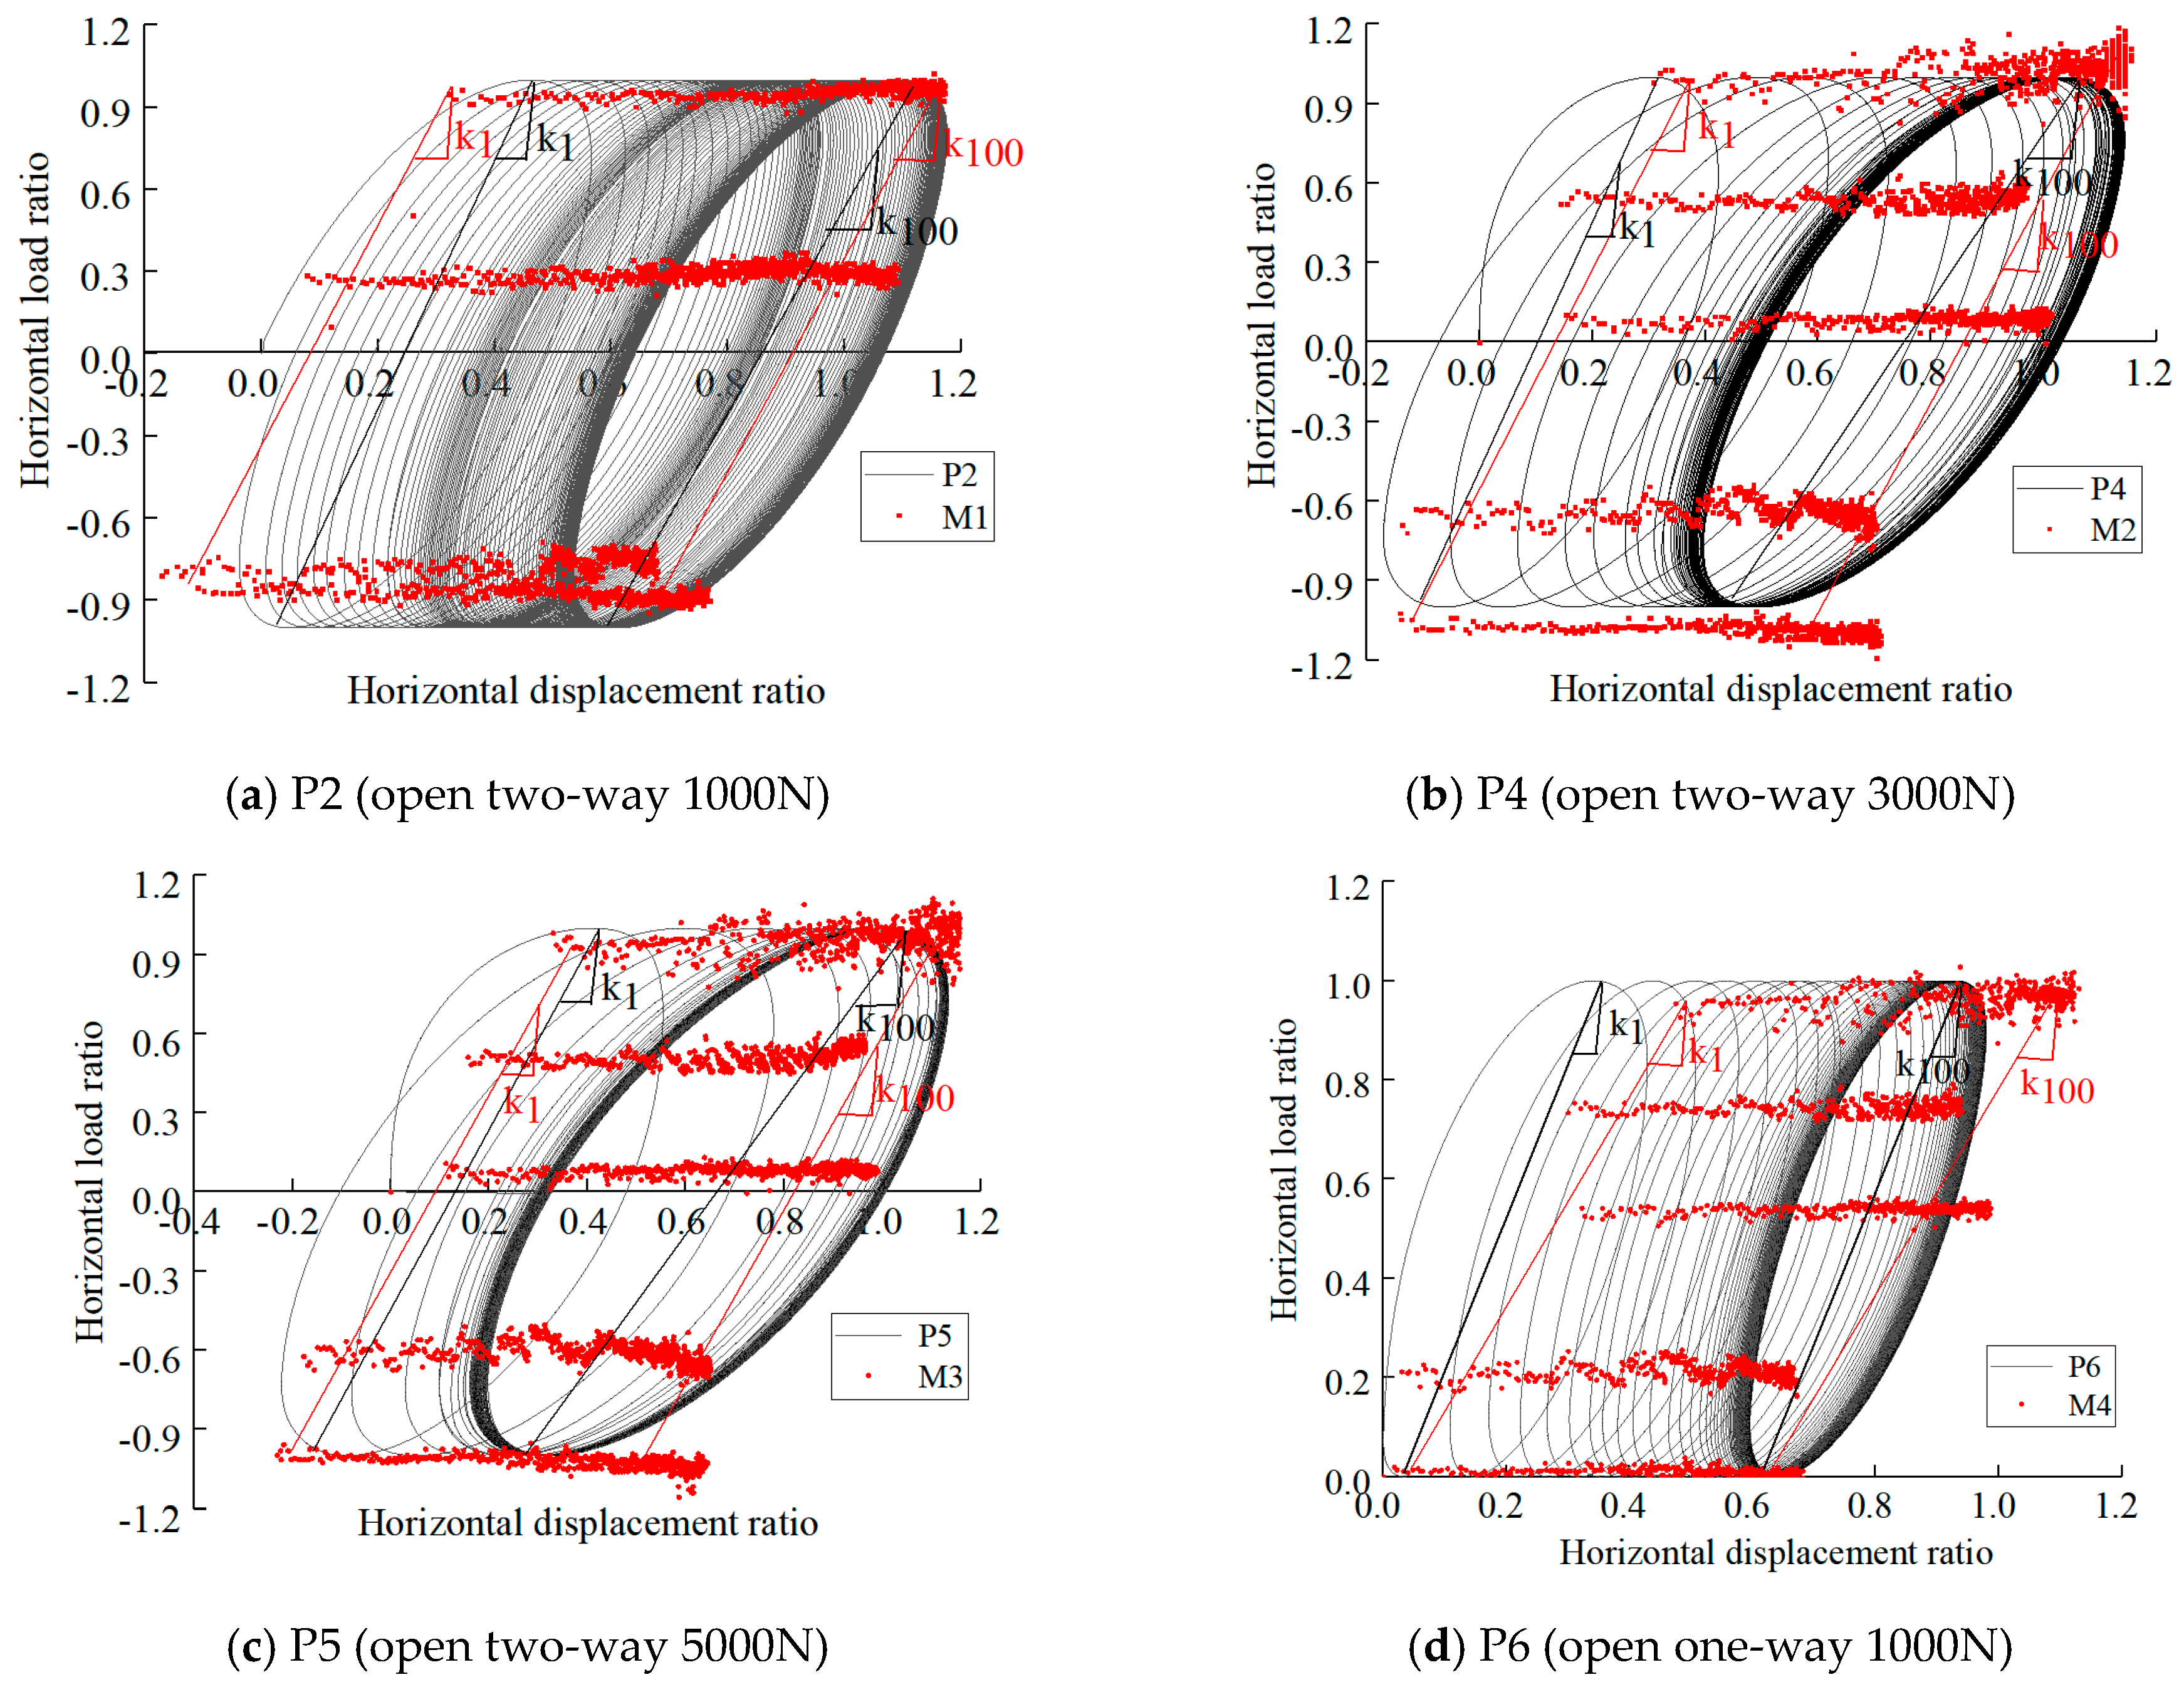
Figure 16.
Displacement vector and Displacement cloud of surrounding soilaround P2 pile.

Figure 17.
Pile (P2) side frictional resistance at (a) outer tube and (b) inner tube.

Figure 18.
Unit side frictional resistance of pile body.

Figure 19.
Distribution of lateral outside and inside pressure of Pile P2 ((a) outer pressure; (b) inside pressure).
Figure 19.
Distribution of lateral outside and inside pressure of Pile P2 ((a) outer pressure; (b) inside pressure).

Figure 20.
Comparison of computed unit lateral pressure distribution with cycles between P2, P4, P5 and P6.
Figure 20.
Comparison of computed unit lateral pressure distribution with cycles between P2, P4, P5 and P6.

Figure 21.
Comparison of simulated static load curves between P2, P4, P5 and P6 after cyclic loading.
Figure 21.
Comparison of simulated static load curves between P2, P4, P5 and P6 after cyclic loading.

Figure 22.
Comparison of measured and computed normalized static loads between various loading conditions.
Figure 22.
Comparison of measured and computed normalized static loads between various loading conditions.


Table 1.
Test programme.
| Test Number | Pile Diameter/mm | Pile End | Loading Method | Amplitude/N |
|---|---|---|---|---|
| M1 | 140 | open | two-way | 200 |
| M2 | 140 | open | two-way | 500 |
| M3 | 140 | open | two-way | 800 |
| M4 | 140 | open | one-way | 200 |
* Buried depth = 0.74 m; Frequency = 4 Hz; Cycles = 1000.
Table 2.
Numerical simulation of the physical parameters of soil samples.
| Physical Parameter | Value |
|---|---|
| Sand particle density (kg/m3) | 2650 |
| Pile density (kg/m3) | 66.65 |
| Acceleration of gravity (m/s2) | 9.8 |
| Median grain size of particle, d50 (mm) | 5.85 |
| Model pile diameter dpile (mm) | 45 |
| Model pile length (mm) | 500 |
| Model pile wall thickness dpw (mm) | 2.475 |
| Model box width (mm) | 2400 |
| Model box depth D (mm) | 2400 |
| Friction coefficient between particles, μ | 0.5 |
| Young’s modulus of particles, Ep (Pa) | 4 × 10⁷ |
| Contact normal stiffness of particles, kn(N/m) | 8 × 10⁷ |
| contact shear stiffness of particles, ks (N/m) | 2 × 10⁷ |
| particle stiffness ratio (ks/kn) | 0.25 |
| Wall normal contact stiffness, kn (N/m) | 6 × 10¹² |
| Initial average porosity | 0.25 |
| Final average porosity (Ultimate balance) | 0.185 |
Table 3.
Numerical simulation program emphasizing input parameters.
| Test Number | Pile Diameter /mm | Buried Depth/m | Loading Method | Amplitude /N | Frequency /Hz | Cycle |
|---|---|---|---|---|---|---|
| P2 | 45 | 0.4 | two-way | 1000 | 40 | 100 |
| P4 | 45 | 0.4 | two-way | 3000 | 40 | 100 |
| P5 | 45 | 0.4 | two-way | 5000 | 40 | 100 |
| P6 | 45 | 0.4 | one-way | 1000 | 40 | 100 |
© 2019 by the authors. Licensee MDPI, Basel, Switzerland. This article is an open access article distributed under the terms and conditions of the Creative Commons Attribution (CC BY) license (http://creativecommons.org/licenses/by/4.0/).
Share and Cite
MDPI and ACS Style
Liu, J.; Guo, Z.; Zhu, N.; Zhao, H.; Garg, A.; Xu, L.; Liu, T.; Fu, C. Dynamic Response of Offshore Open-Ended Pile under Lateral Cyclic Loadings. J. Mar. Sci. Eng. 2019, 7, 128. https://doi.org/10.3390/jmse7050128
AMA Style
Liu J, Guo Z, Zhu N, Zhao H, Garg A, Xu L, Liu T, Fu C. Dynamic Response of Offshore Open-Ended Pile under Lateral Cyclic Loadings. Journal of Marine Science and Engineering. 2019; 7(5):128. https://doi.org/10.3390/jmse7050128
Chicago/Turabian StyleLiu, Junwei, Zhen Guo, Na Zhu, Hui Zhao, Ankit Garg, Longfei Xu, Tao Liu, and Changchun Fu. 2019. "Dynamic Response of Offshore Open-Ended Pile under Lateral Cyclic Loadings" Journal of Marine Science and Engineering 7, no. 5: 128. https://doi.org/10.3390/jmse7050128
Note that from the first issue of 2016, this journal uses article numbers instead of page numbers. See further details here.