Experimental Study of Supercavitation Bubble Development over Bodies in a Duct Flow

Faculty of Aerospace Engineering, Technion—Israel Institute of Technology, Haifa 32000, Israel
*
Author to whom correspondence should be addressed.
J. Mar. Sci. Eng. 2020, 8(1), 28; https://doi.org/10.3390/jmse8010028
Submission received: 18 December 2019
/
Revised: 5 January 2020
/
Accepted: 6 January 2020
/
Published: 8 January 2020
(This article belongs to the Special Issue Selected Papers from the Sixth International Symposium on Marine Propulsors)
Abstract
:Understanding the development and geometry of a supercavitation bubble is essential for the design of supercavitational vehicles as well as for prediction of bubble formation within machinery-related duct flows. The role of the cavitator (nose) of a body within the flow is significant as well. This research studied experimentally supercavitation bubble development and characteristics within a duct flow. Tests were conducted on cylindrical slender bodies (3 mm diameter) within a duct (about 20 mm diameter) at different water flow velocities. A comparison of supercavitation bubbles, developing on bodies with different nose geometries, was made. The comparison referred to the conditions of the bubbles’ creation and collapse, as well as to their shape and development. Various stages of the bubble development were examined for different cavitators (flat, spherical, and conical nose). It was found that the different cavitators produced similar bubble geometries, although at different flow velocities. The bubble appeared at the lowest velocity for the flat nose, then for the spherical nose, and at the highest velocity for the conical cavitator. In addition, a hysteresis phenomenon was observed, showing different bubble development paths for increasing versus decreasing the water flow velocity.
1. Introduction
The geometry of supercavitation bubbles has been studied for decades, using diverse tools and methods, because of its significance for the design of supercavitation vehicles and applications. In particular, comprehensive studies have examined axisymmetric supercavitation bubbles, proposing methods of calculation and presenting relations between the bubble dimensions and the flow conditions [1,2,3,4,5]. Other studies have analyzed the wall effect in channels on the bubble dimensions as well as the values of the cavitation number of fully developed cavitation bubbles [6]. Some experimental works showed the development of axially symmetric supercavities in bounded and unbounded flows and examined the bubble characteristics relating to natural and artificial supercavitation [7,8]. These studies are significant for hydraulic machinery in which the appearance and development of cavitation play a key role in the performance of the system. One of the most significant topics in the field is the role of the cavitator in determining the bubble shape and size. This has been examined analytically for 2D flows [9] and numerically for 3D flows for more accurate results and for specific geometries [10]. Numerical results have shown that the bubble dimensions are dependent on the cavitator shape [11]. In addition, some estimations and predictions have been done, mainly for unbounded bubbles [12,13,14,15,16,17,18]. Other experimental investigations have described the bubbles formed on different bodies, examining the gravitation effect, the closing modes, the separation point, etc. Many of them were summarized by Franc and Michel (2004) [19].
The objective of the present study was to investigate supercavitation bubble development over bodies in a duct water flow. We examined experimentally the influence of different cavitator geometries on axisymmetric cylindrical bodies, finding the relations between the dimensions of the bubble and the cavitation number. We also revealed and investigated a hysteresis phenomenon in naturally developed supercavitation bubbles. Previous studies have discussed this phenomenon for ventilated (artificial) bubbles. Semenenko (2001) [3] examined hysteresis found in bubbles closing on a solid body, investigating the angle of the bubble closure on the solid surface as well as the required gas supply to the bubble for maintaining its size. Wosnik and Arndt (2009) [20] examined hysteresis for different bodies in ventilated bubbles. In our research, we observed hysteresis in naturally formed bubbles that do not close on a solid body.
2. Problem Description
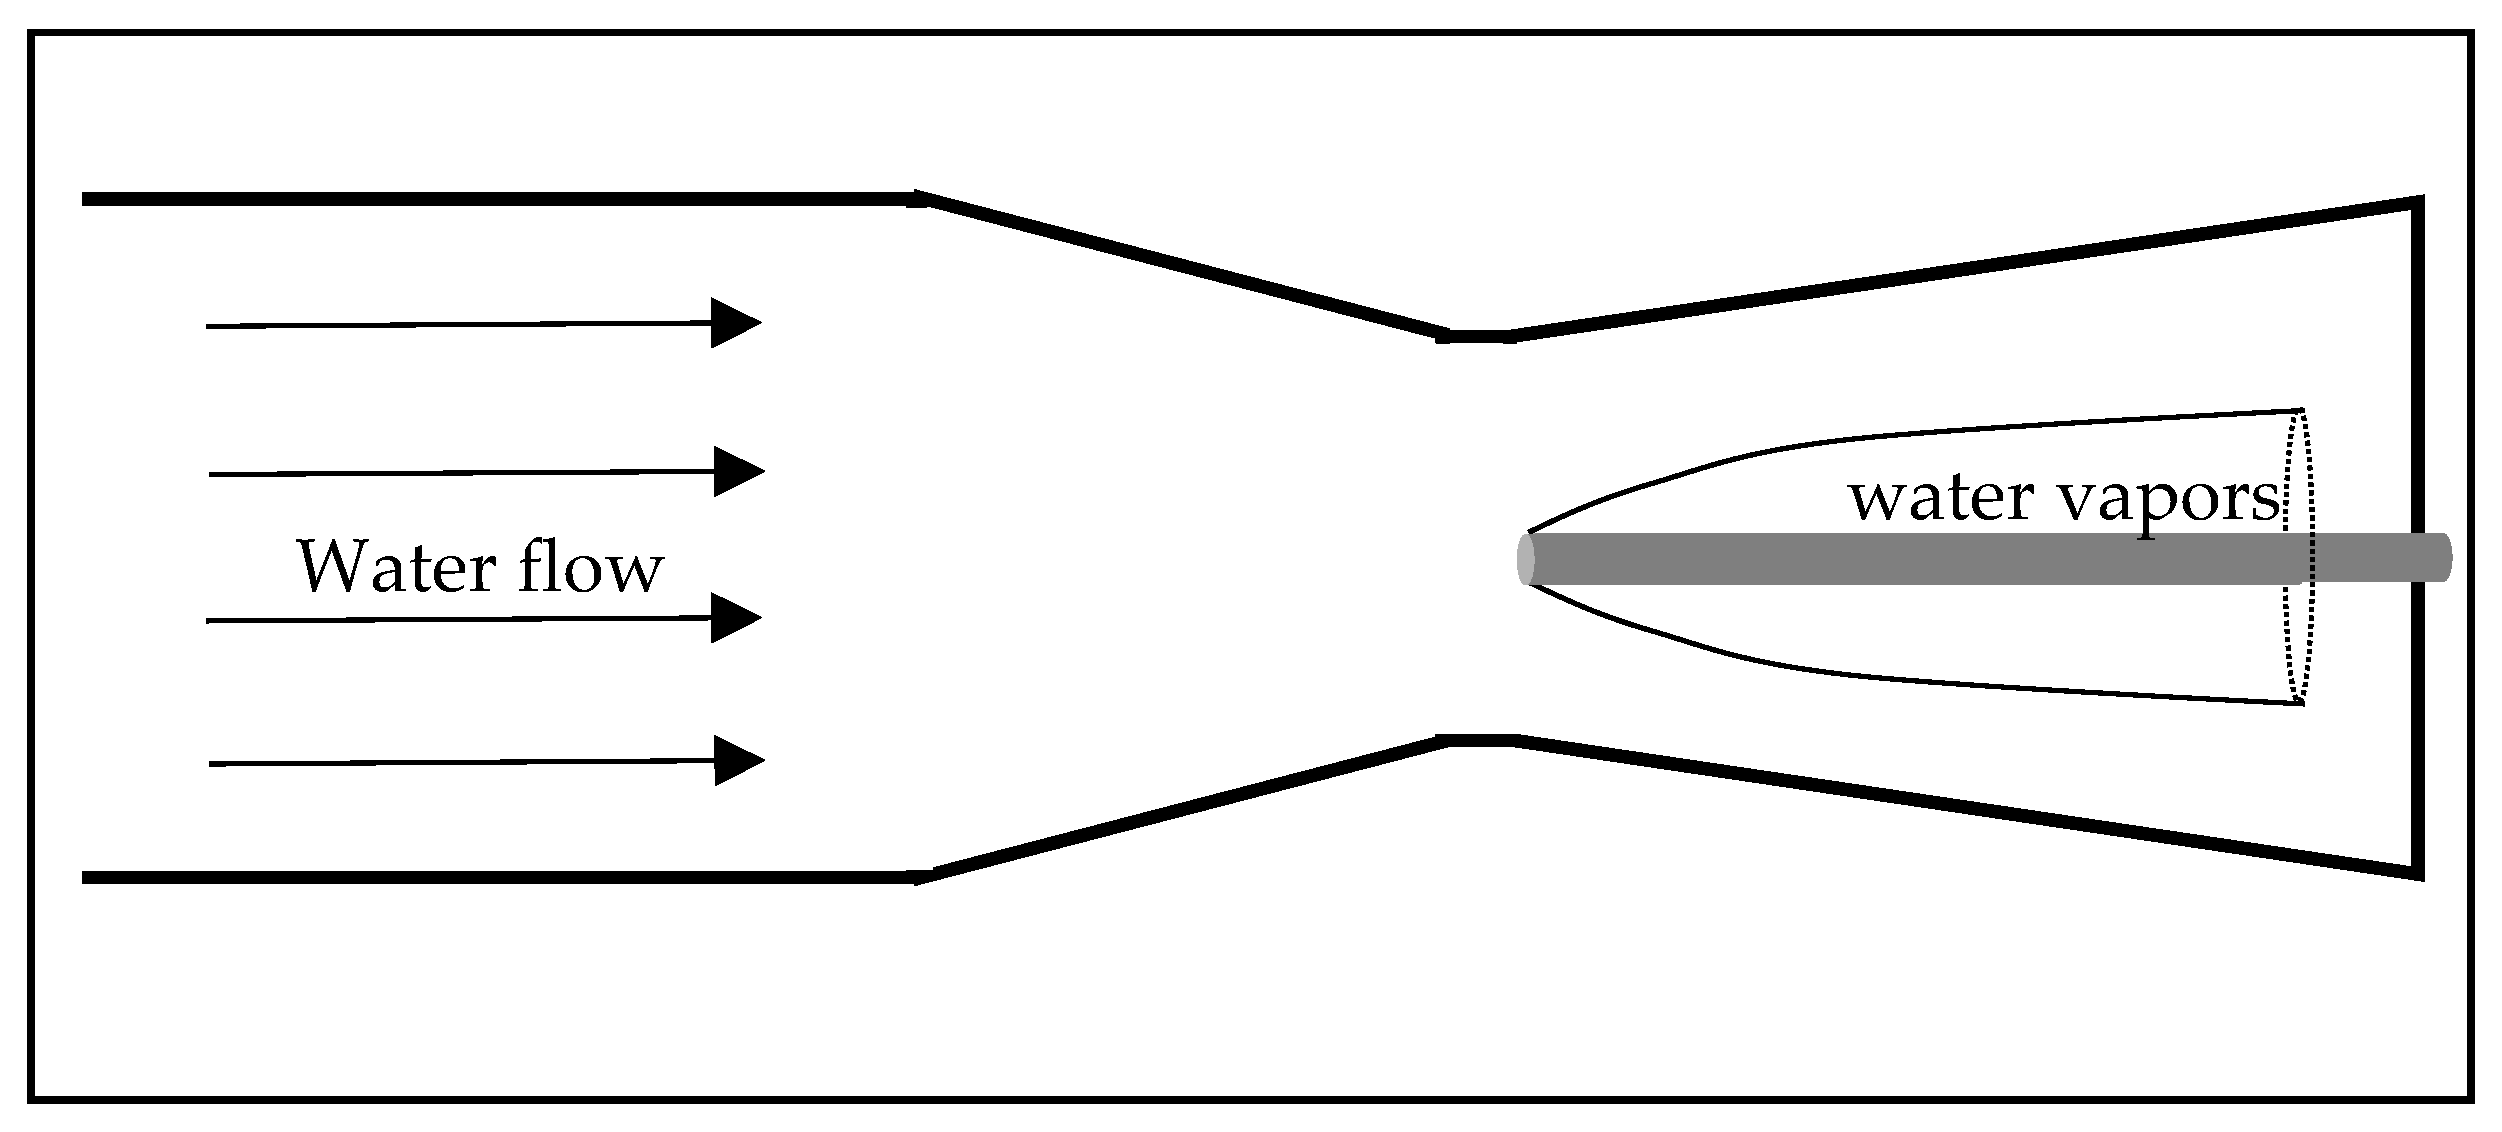
We considered axisymmetric supercavitation bubbles developing along a cylindrical object in a uniform flow of water within a convergent-divergent nozzle. Slender cylindrical bodies with different nose (cavitator) geometries were examined. The front edge nose causes velocity change, flow separation, and pressure drop. When the pressure decreases below the equilibrium vapor pressure of the liquid, the water starts to evaporate, developing a supercavitation bubble over the body. As the flow velocity increases, the pressure decreases, and the bubble grows and can envelope the entire body (see Figure 1). The geometry of the body, and especially its front edge, is the main factor that determines the flow field and the supercavitation bubble creation and development.
3. The Experimental System and Flow Conditions
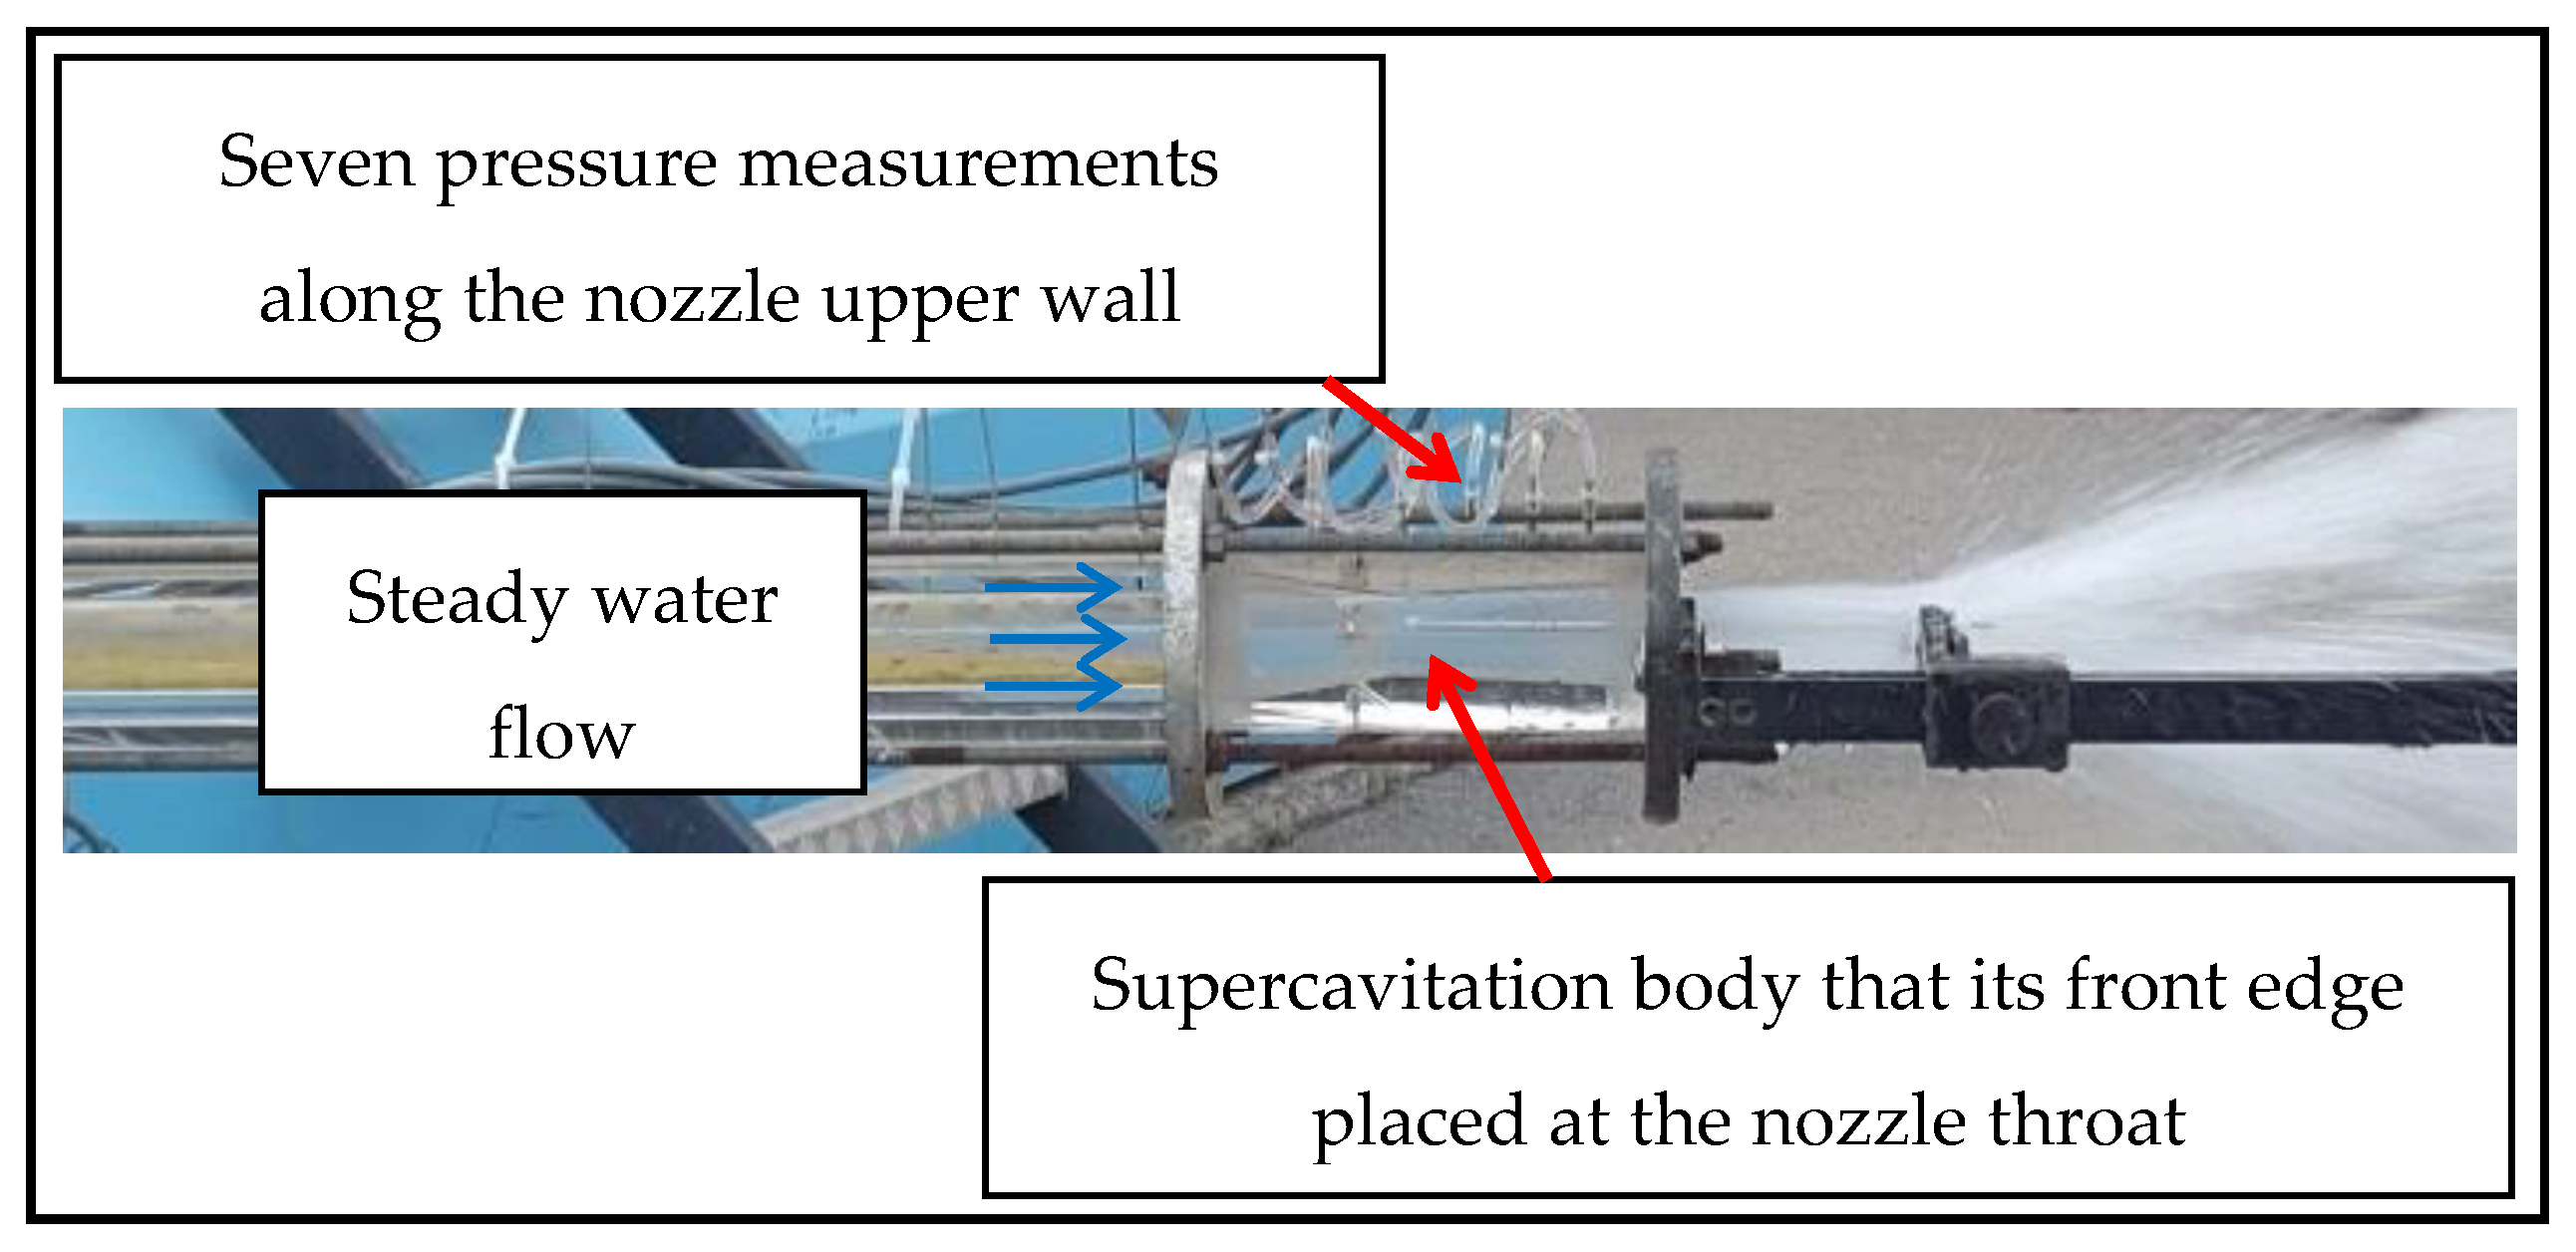
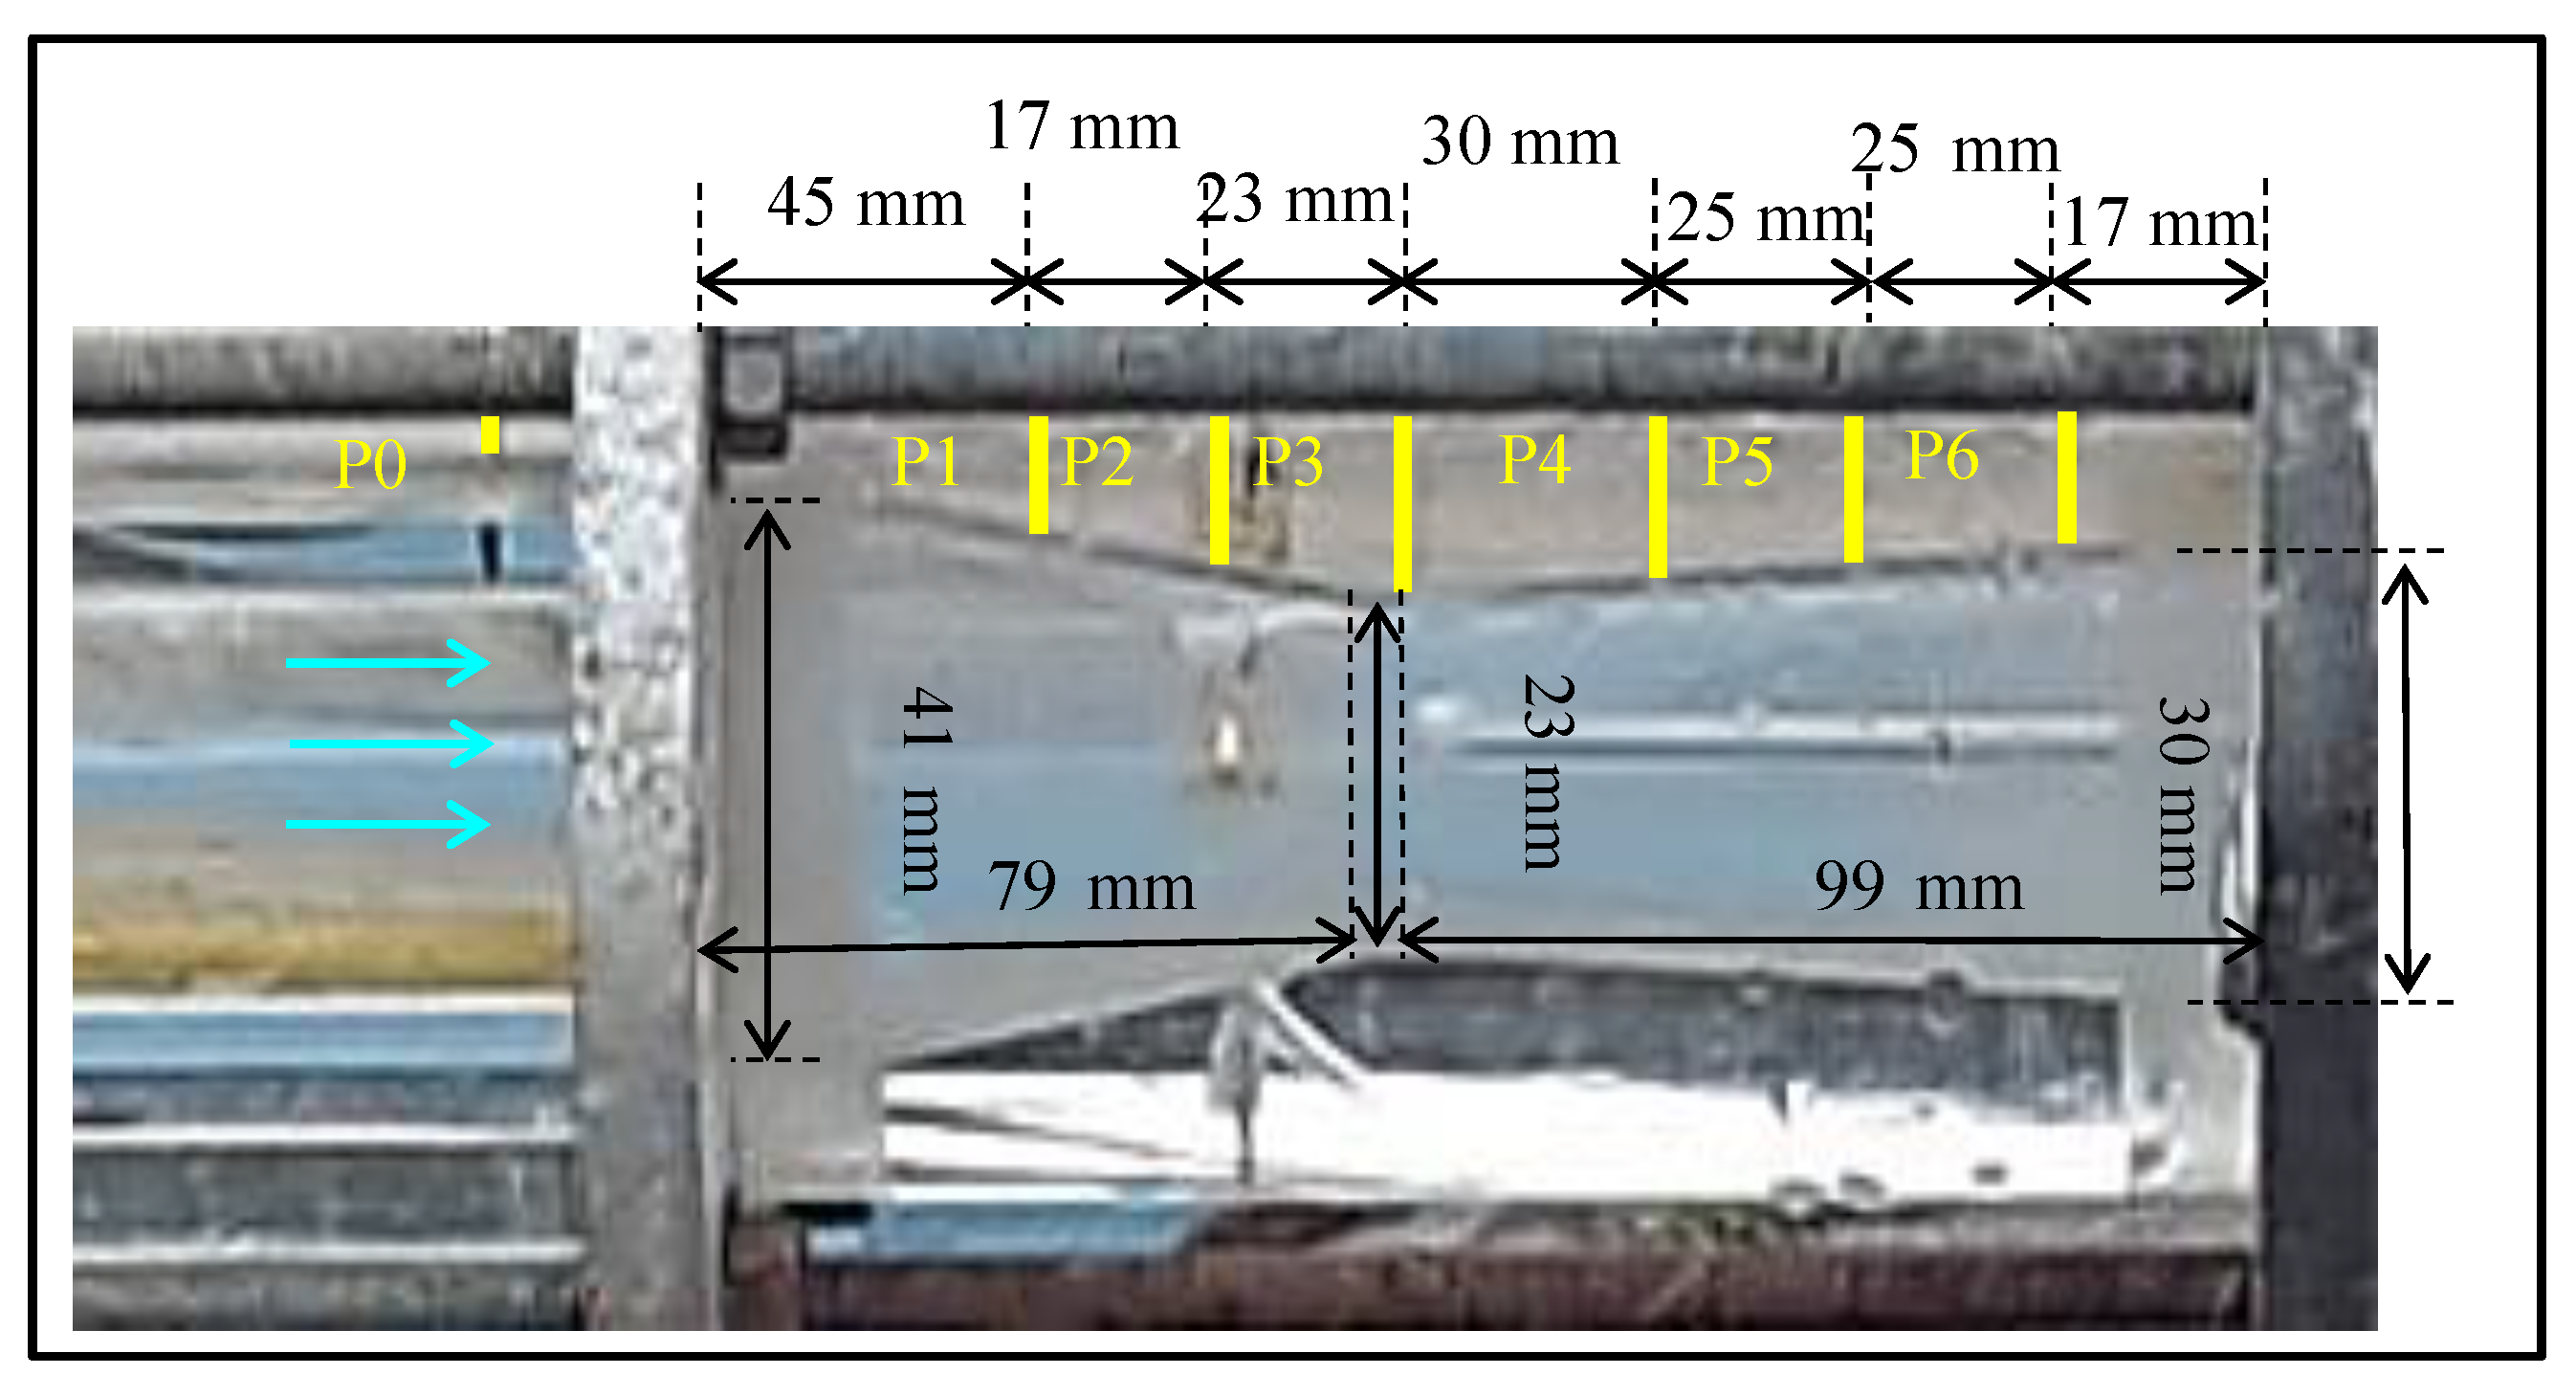
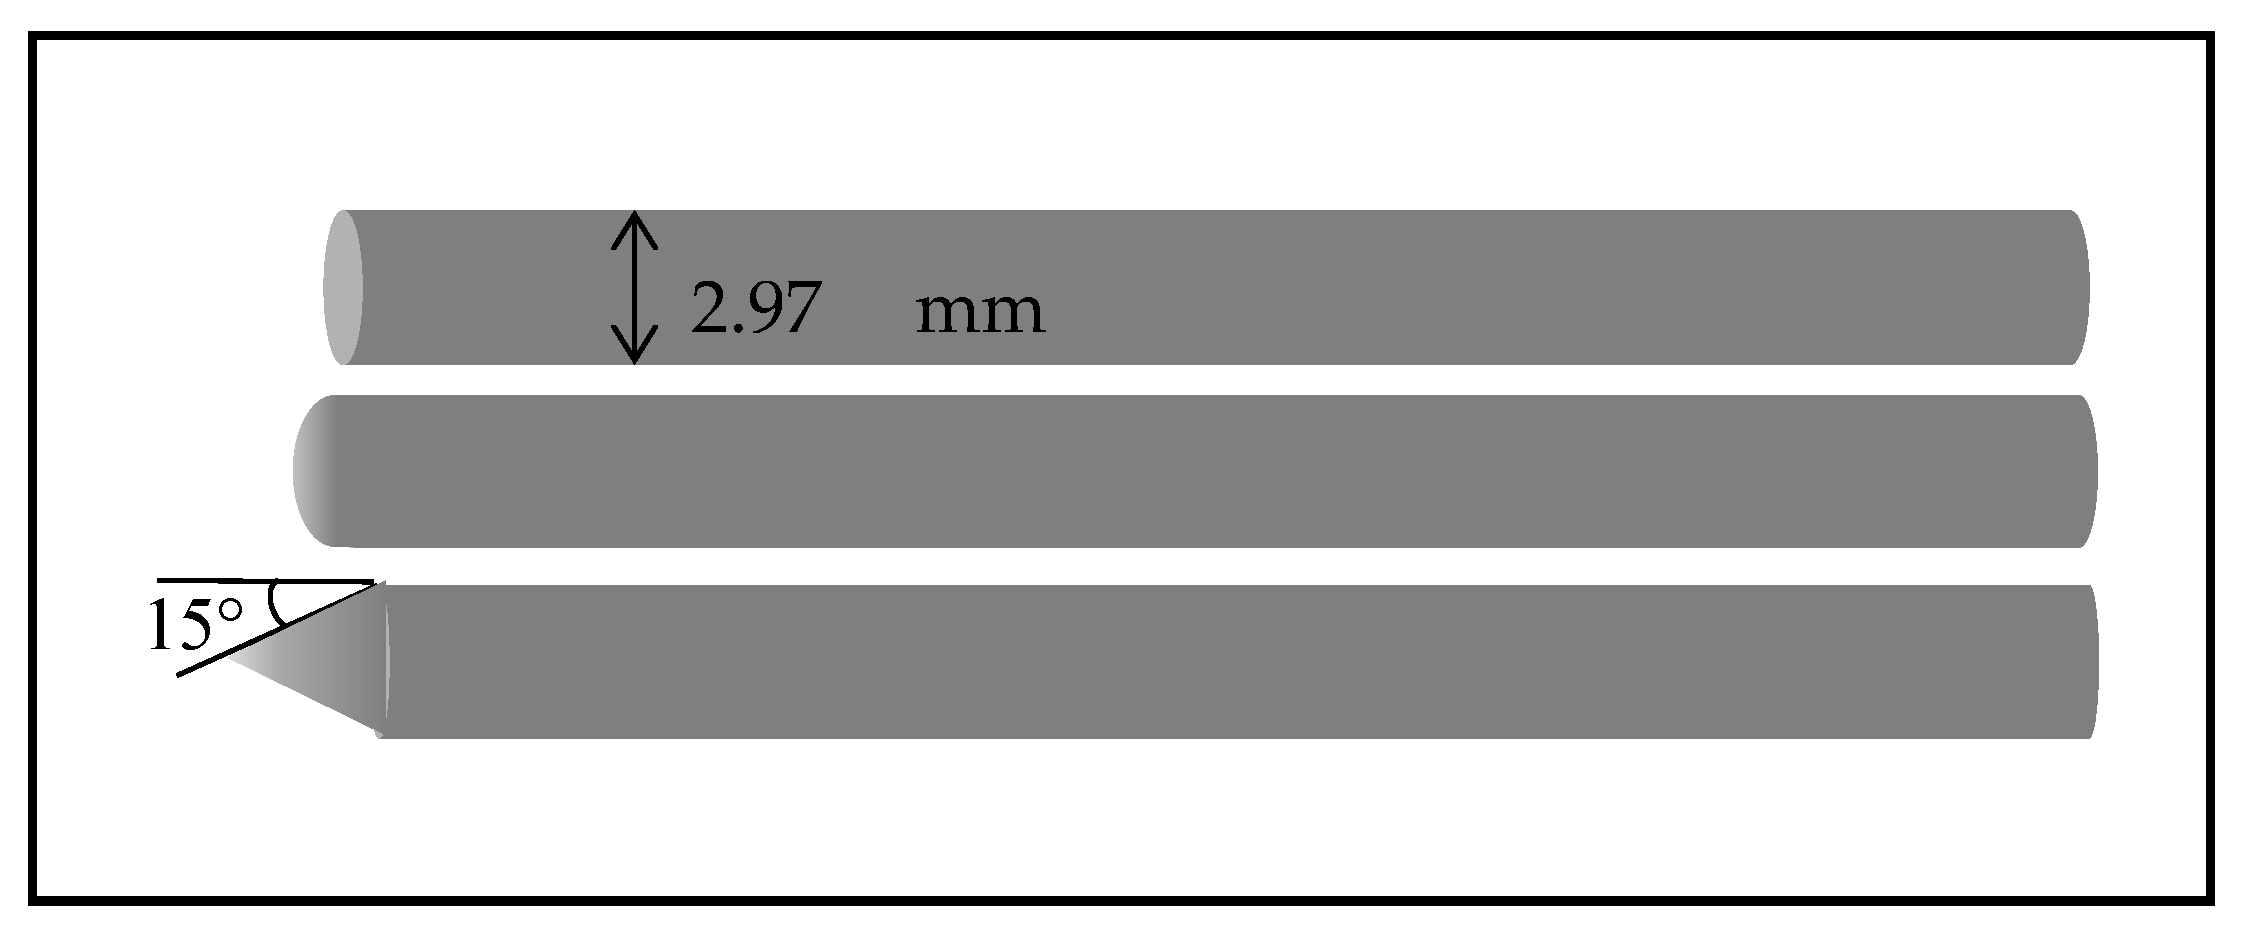
The experimental system included a converging–diverging nozzle (converging angle 6.5°, diverging angle 2°), connected to a straight pipe from which the water flowed uniformly in a constant temperature of about 20 °C (Figure 2). The nozzle accelerated the flow to the appropriate speed in which cavitation could be created. A valve was used to adjust the water flow rate. The supercavitation body was placed right after the nozzle throat (Figure 3). Three slender cylindrical bodies of 2.97 mm diameter with different cavitators (noses) were tested: a flat cavitator, a spherical cavitator, and a conical cavitator with an angle of 15° (Figure 4). The bubble created over the body was examined while increasing the water flow rate. Seven pressure measurement taps were placed along the wall: one at the wall of the pipe before the entrance to the nozzle; two at the converging section of the nozzle; one at the nozzle throat, where the cavitator nose was placed (the location where the initial creation of the cavitation bubble was expected); and three additional gauges at the diverging section, along the supercavitation bubble (see again Figure 3). The Reynolds number of the flow, calculated with a relation to the object as well as the duct, was higher than 30,000 for all flow-rates tested.
4. Results
4.1. Stages of Bubble Development
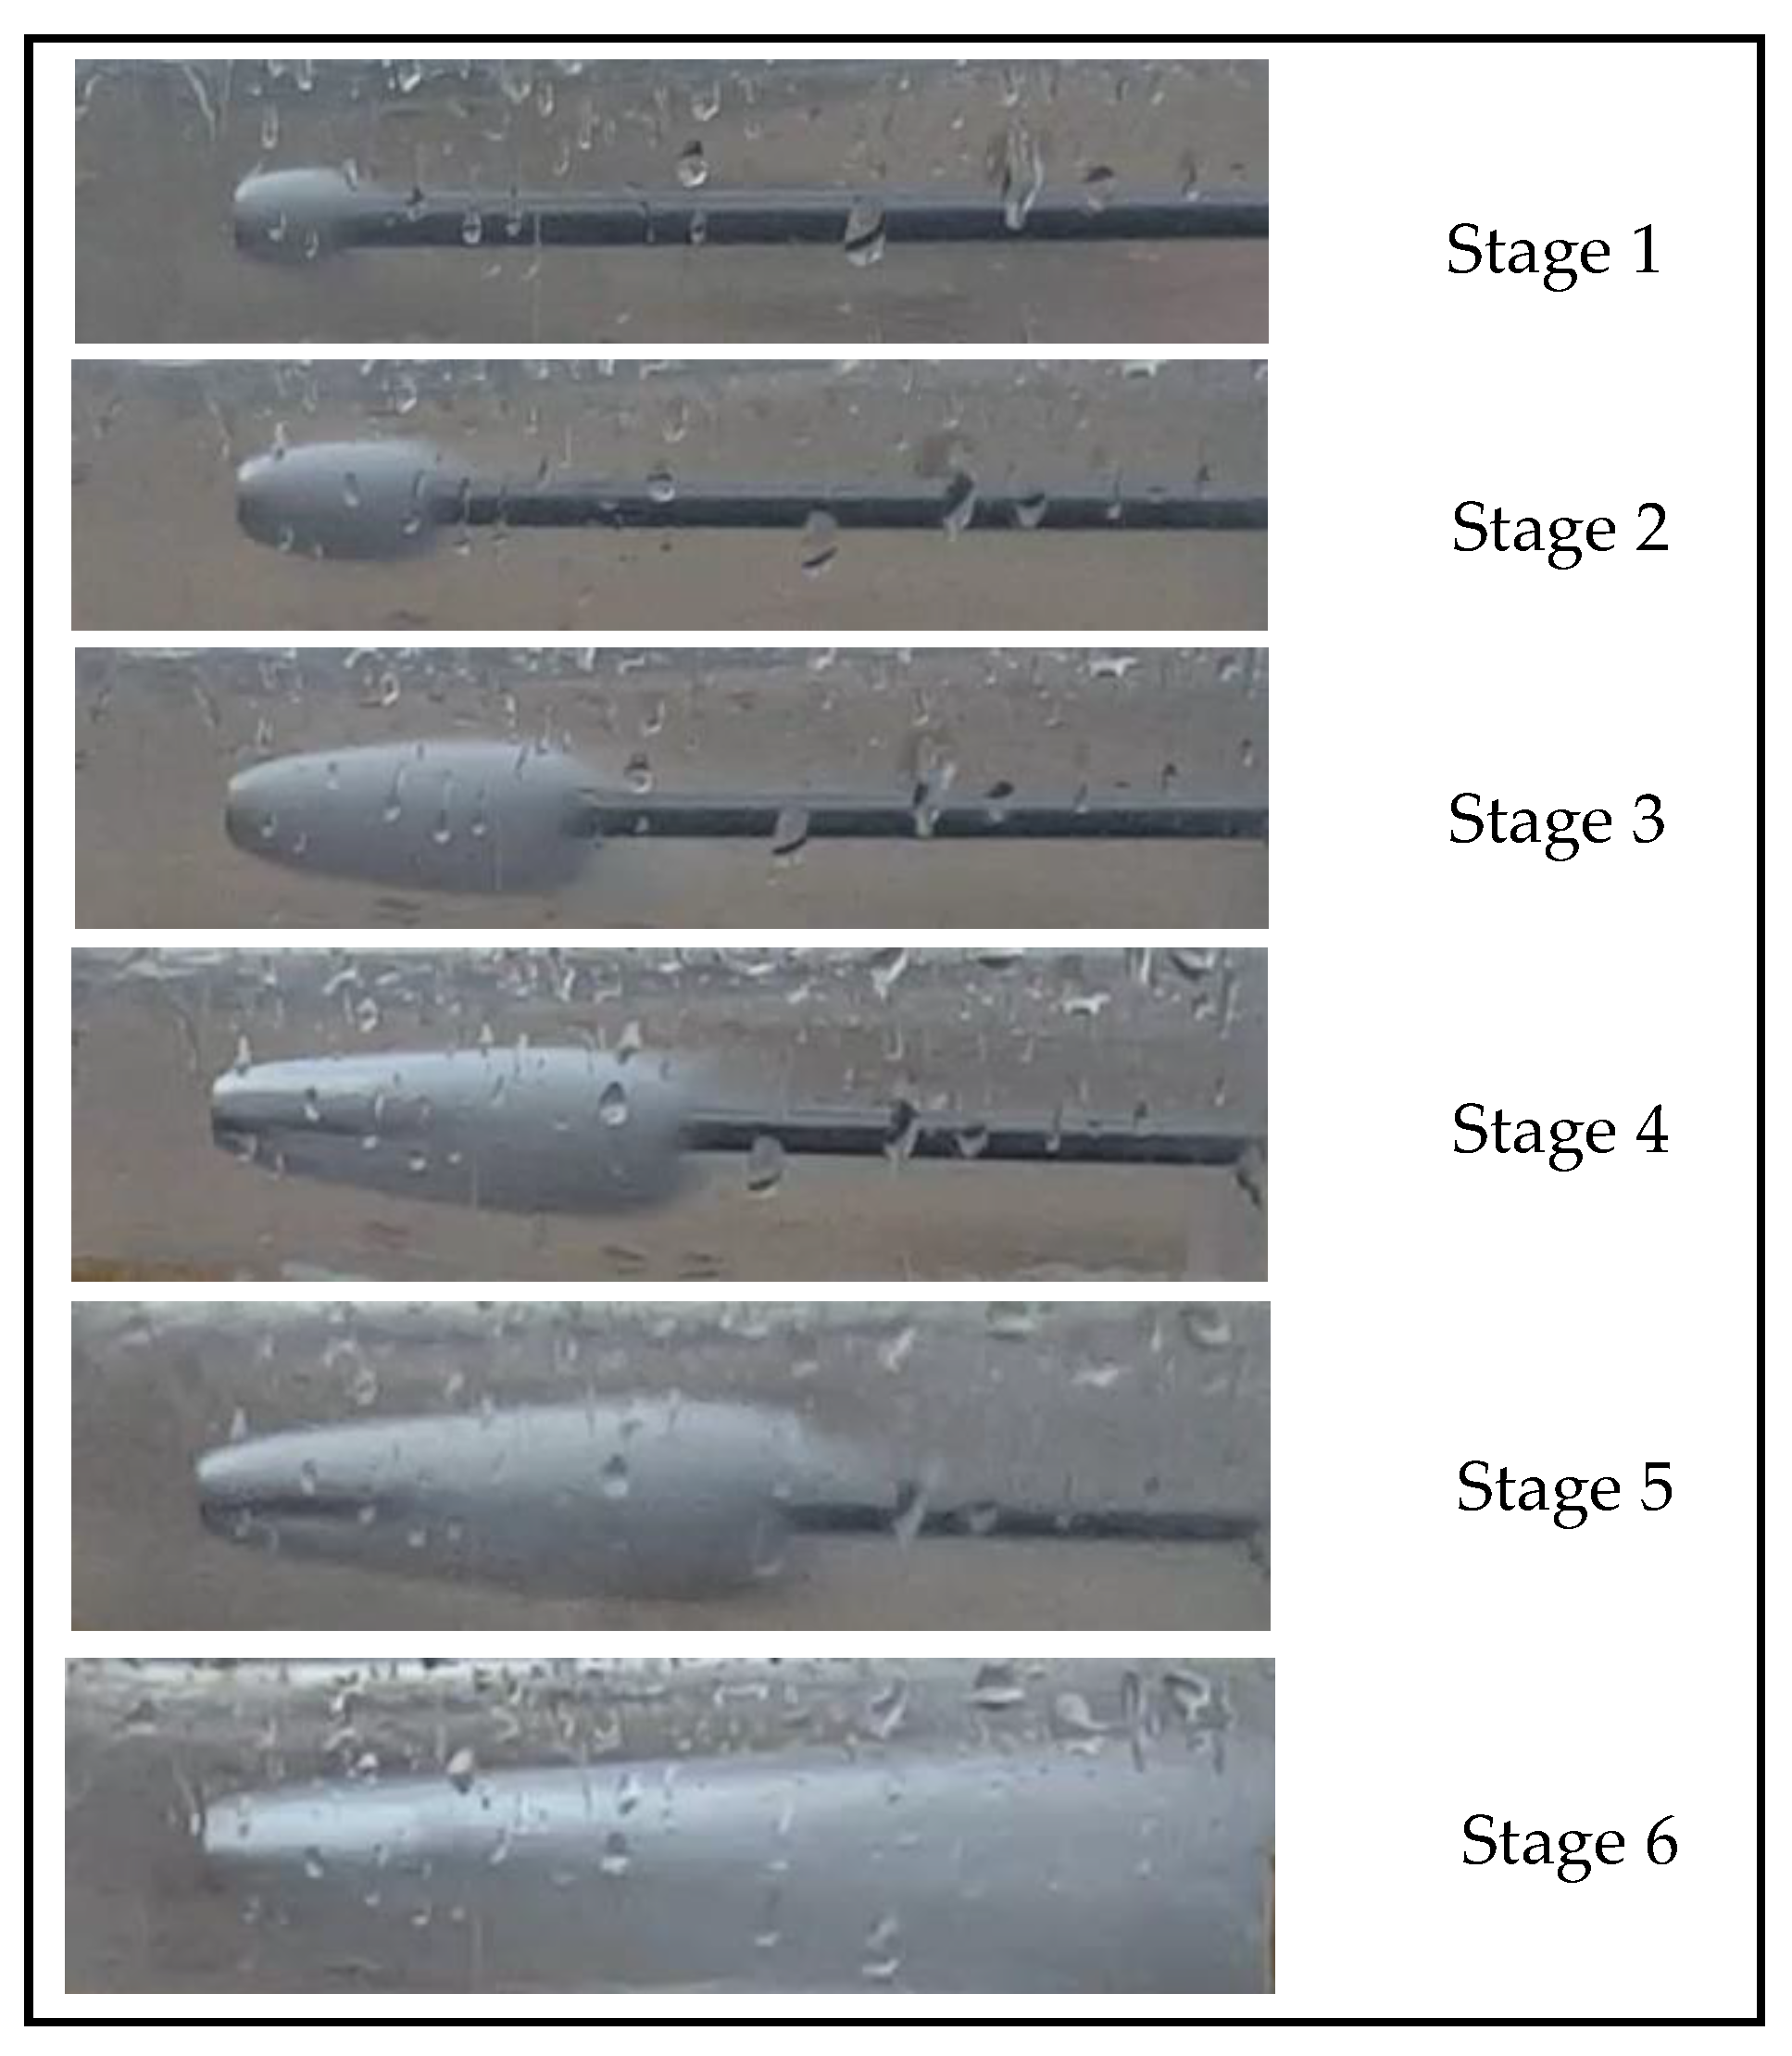
The different stages in the bubble development along the body with increasing flow velocity are presented in Figure 5 for the flat cavitator. The observed geometries of the bubbles were practically similar for the three different cavitators. In every stage of the flow, the bubble did not close on the body, and it remained open in its back edge. At low velocities, the geometry of the bubble surface could be expressed by the function described in Equation (1):
where d is the cavitator diameter. z is the coordinate of the axis of symmetry expressed with the same length units as d. This expression of the bubble geometry was used by Semenenko (2001) [3] based on Logvinovich empiric results (1973) [16].
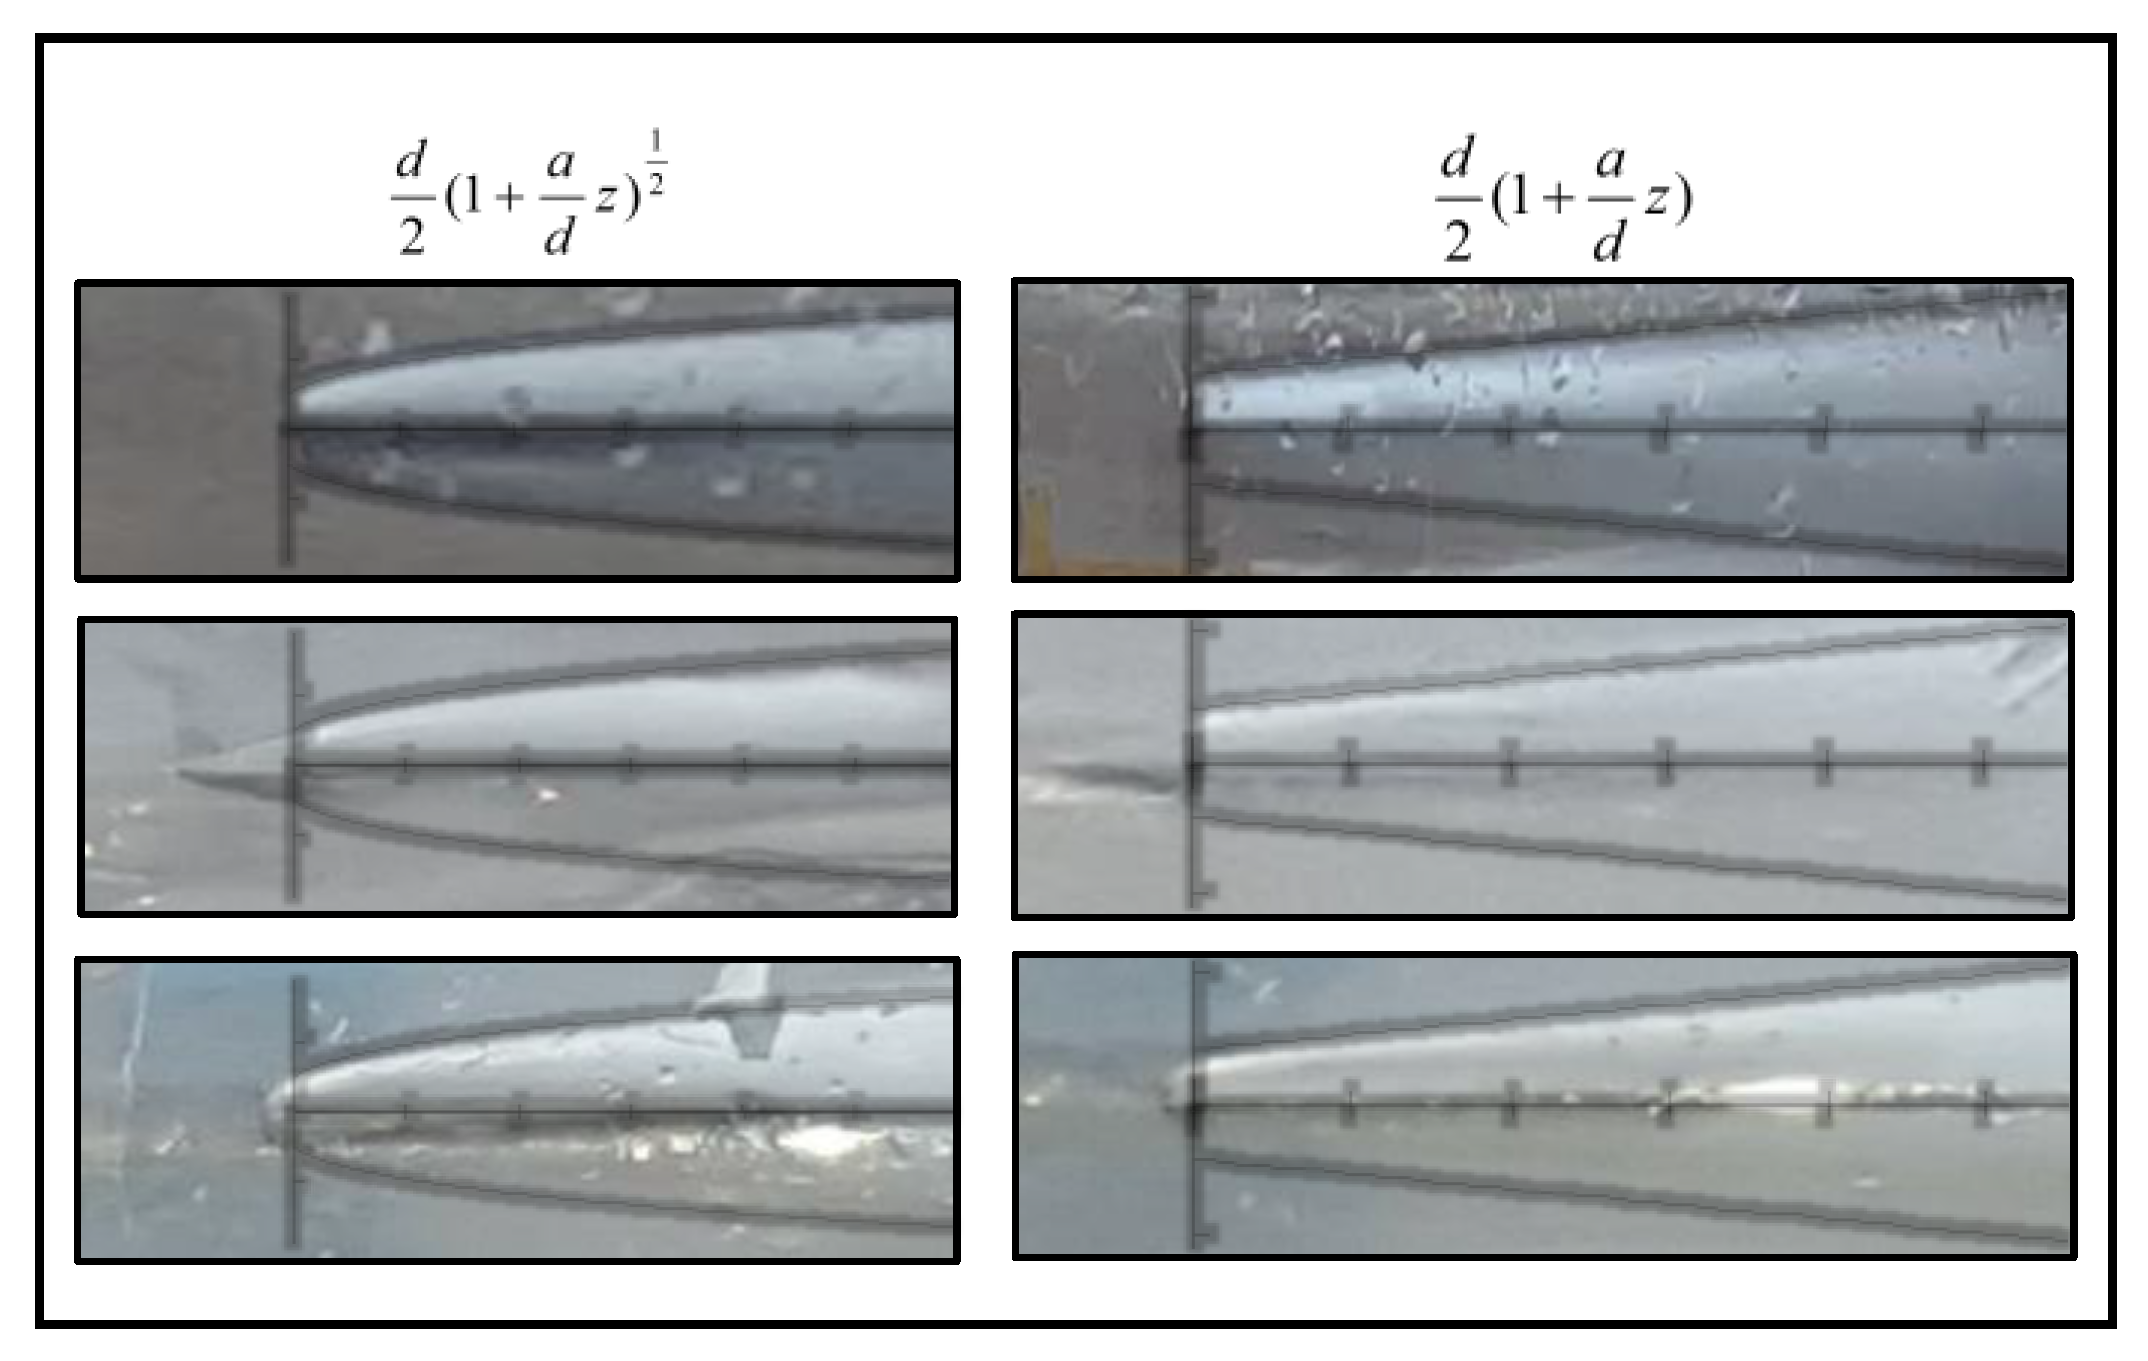
When increasing the velocity, the function convexity changed, and the geometry of the bubble surface could be expressed by the function described in Equation (2):
where a is a constant factor, depending on the geometry of the nozzle and of the body. When the velocity was further increased, the geometry of the bubble surface could almost be described as an open cone, with the function in Equation (3):
In general, the convexity of the bubble decreases as the velocity increases in its front and in its back edges together. The two last functions, describing the bubble geometries in the later stages of development, are presented in Figure 6, revealing practically the same shape for all three cavitators.
Although the stages of development are similar for all three cavitators, the velocity at which the bubble starts as well as the characteristic velocity for each stage of development are different for the different cavitators. Table 1 presents the velocities of the flow at the front edge of the cavitator for the three cavitators in the six stages of the bubble development presented in Figure 5. The velocities were calculated from the water volume flow rate divided by the flow cross-section just before the cavitator.
4.2. The Pressure Field
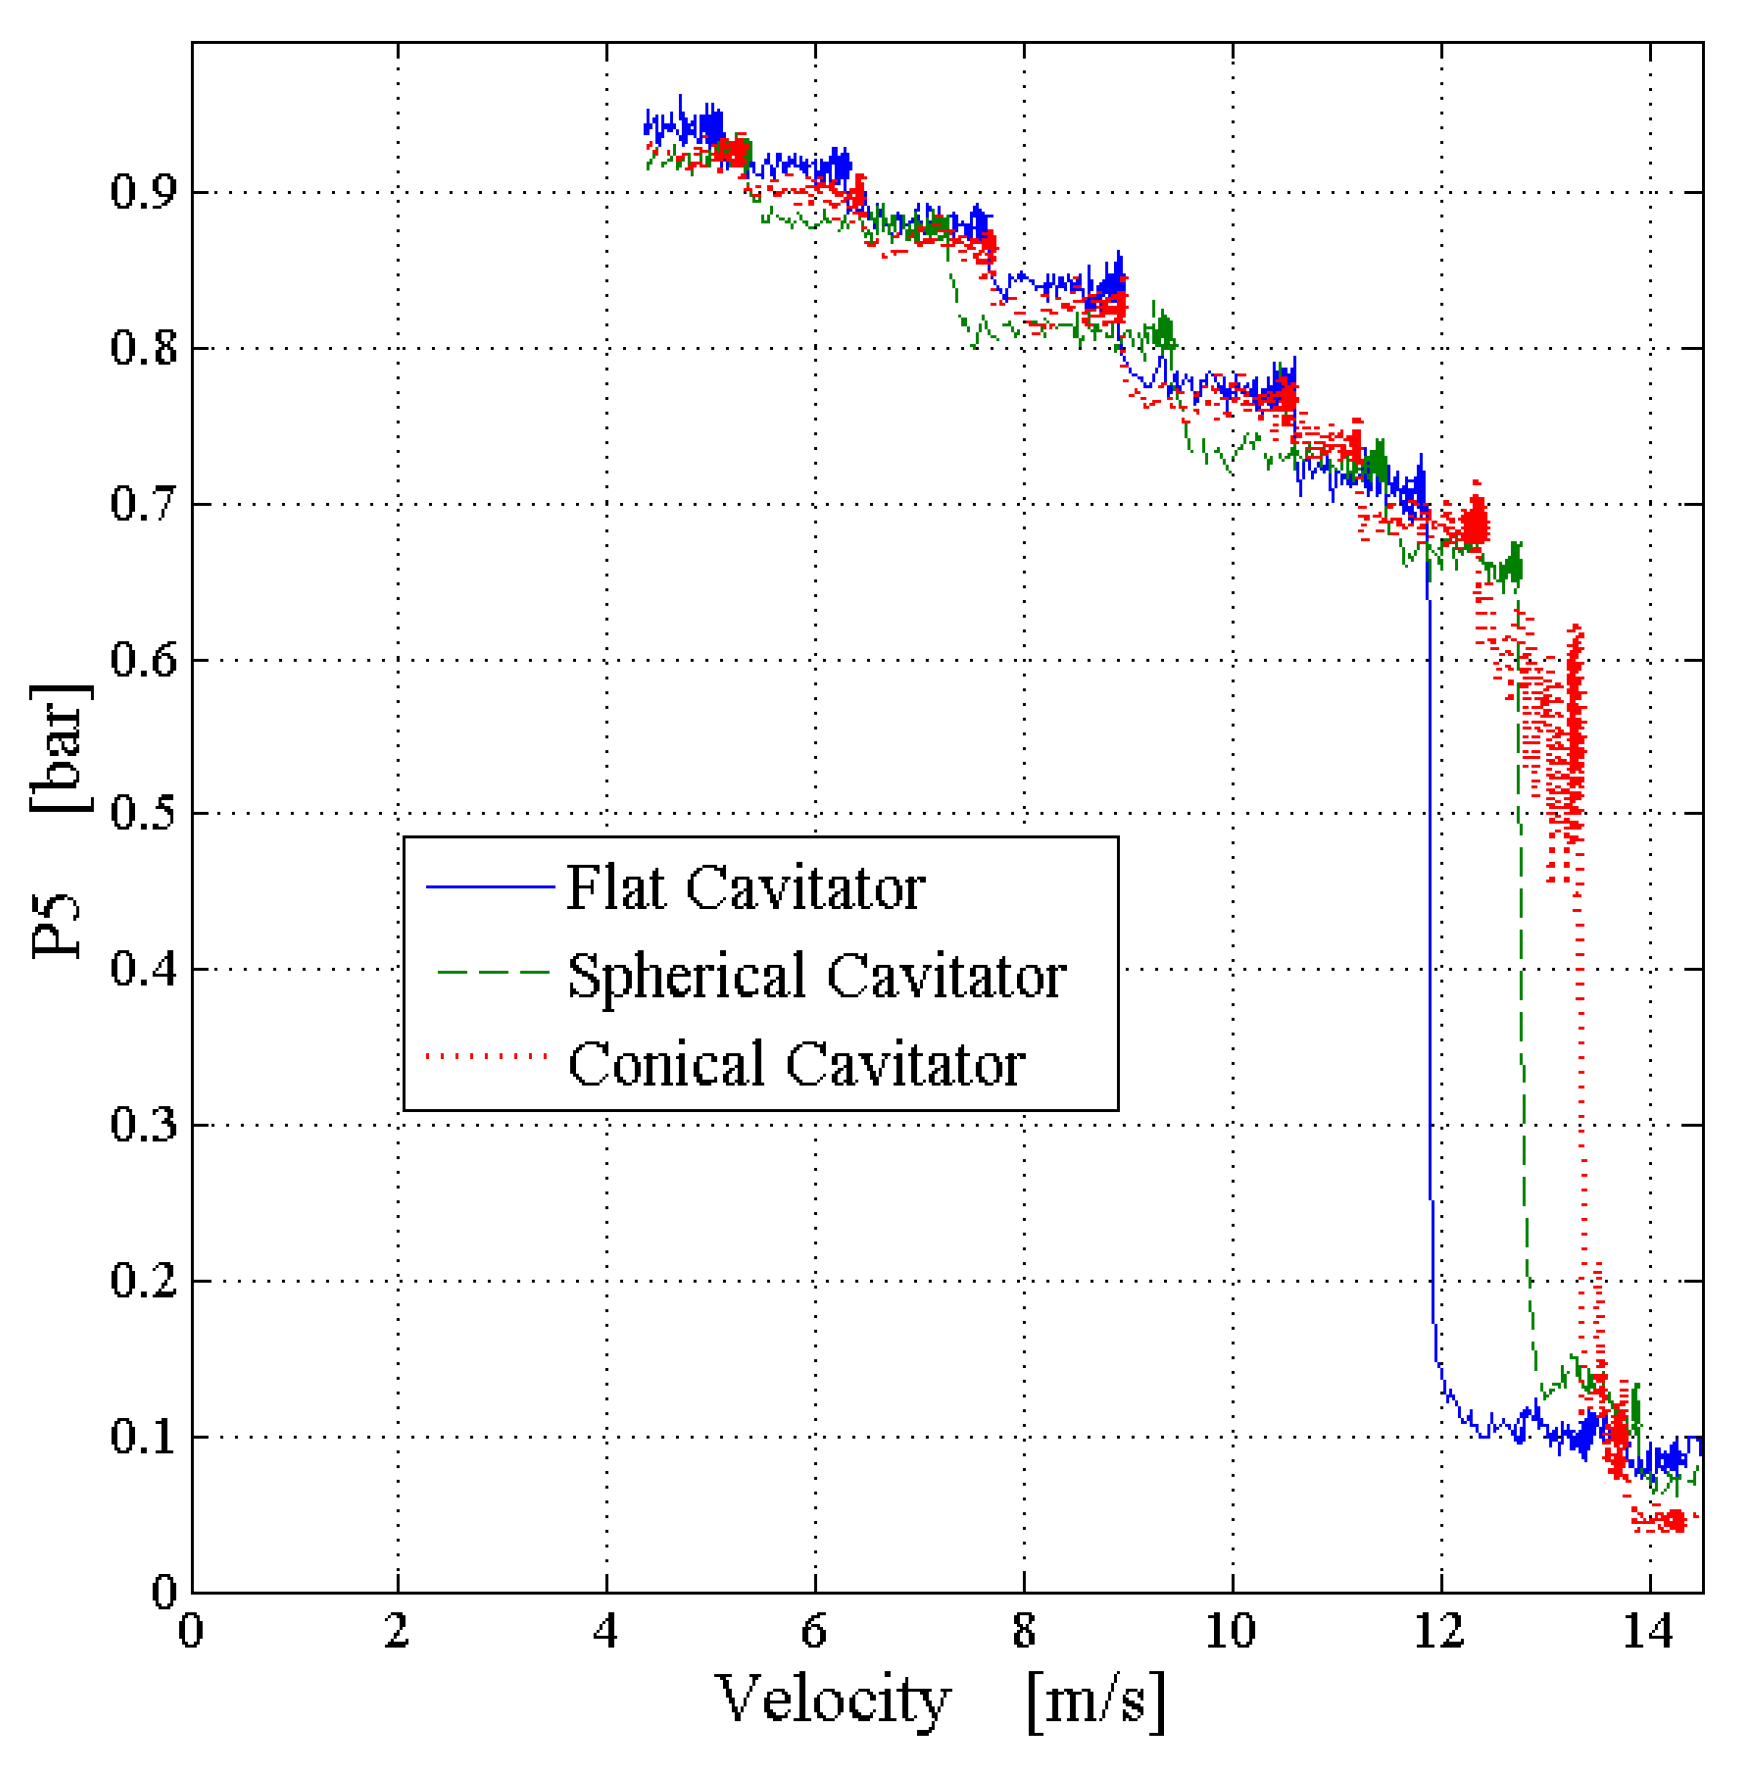
The change in the pressure was measured on the nozzle walls. The pressure decreases moderately with the increase of the flow velocity for each of the cavitators. A rapid decrease was detected when the cavitation bubble grew and extended, reaching the section of the gauge. Similar to the order that the beginning of the bubble creation appeared, the process took place at the lowest velocity for the flat cavitator, then for the spherical cavitator, and finally at the highest velocity for the conical cavitator (see measurements of P5 located at the divergent part of the nozzle where the bubble is extending in Figure 7).
The results of the measurements of P5 show that there are pressure fluctuations in the system. The largest fluctuations occur for the conical cavitator, where the system is the least stable; the slender body undergoes mechanical vibrations caused by the high flow rate in the pipe required for the creation and development of the supercavitation bubble. The lowest fluctuations in the graph appear for the flat cavitator, in which the bubble is created and developed at the lowest flow velocities. The lowest static wall pressure (the same for the three cavitators) measured by P4 and P5 was 0.065 and 0.07 bar (with an uncertainty of ±0.025 bar), respectively. These values were somewhat higher than the theoretical equilibrium vapor pressure (0.023 bar at 20 °C), presumably existing within the cavitation bubble. The magnitude of the pressure drop was similar for all cavitators. In addition, the pressure change was similar in all cavitators for every stage of the bubble development.
4.3. Comparison of Results with Theoretical Analysis
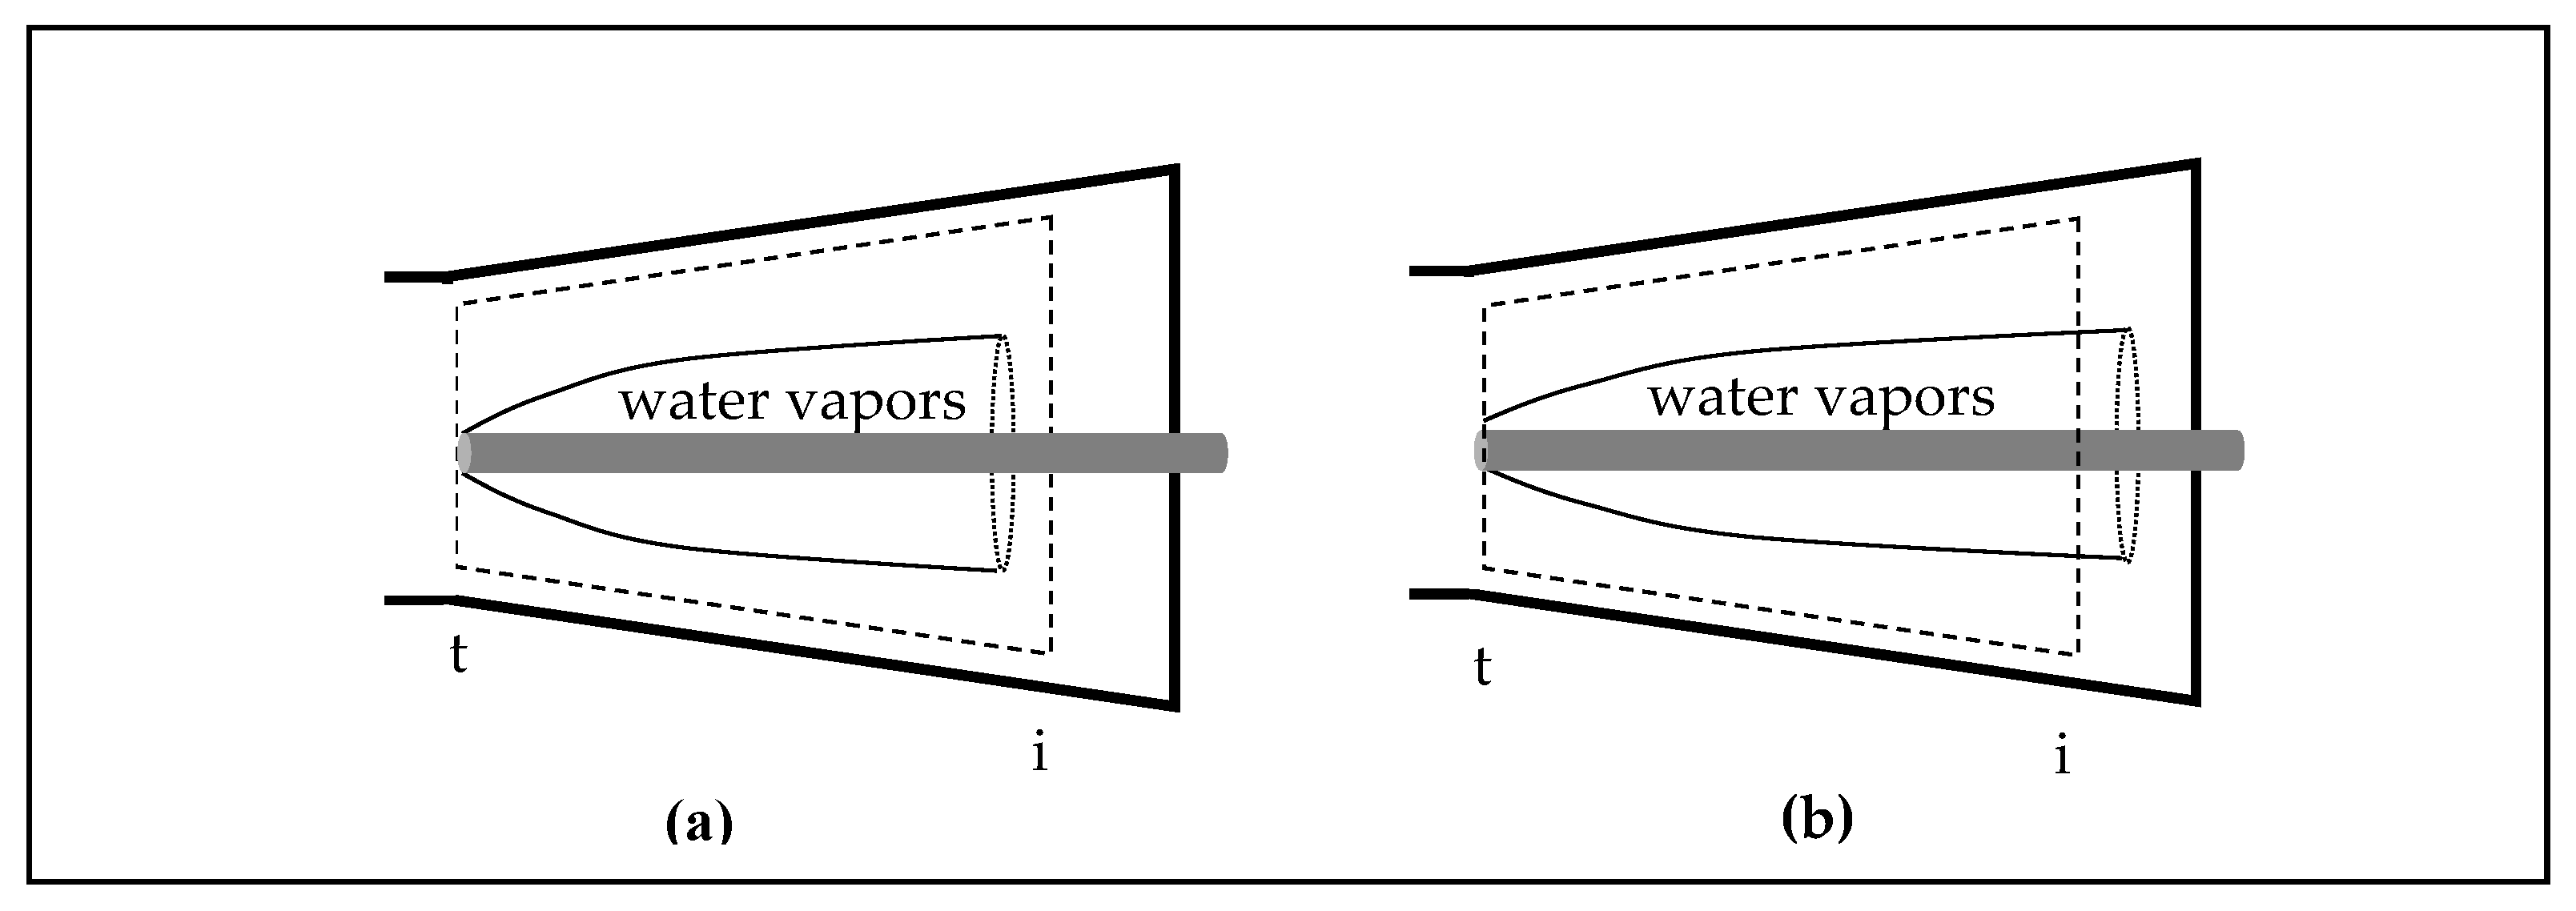
A control volume analysis was done (Figure 8) to calculate the pressure at a cross section i with relation to the conditions at the nozzle throat t (where the front edge of the cavitator is placed), assuming a one-dimensional flow with negligible viscosity effects. The theoretical calculation was compared with the experimental data. From conservation of mass, one can find the relation between the velocities at i and t cross-sections:
where and are the flow velocity and cross-section area, respectively, at the location of gauge , and are the corresponding values at the nozzle throat. Using Bernoulli equation on a flow streamline at the wall between the throat and a cross section i of the gauge and substituting Equation (4), we derive the pressure difference between section and the nozzle throat:
where are the pressures in section and in the nozzle throat, correspondingly, is the gravitational acceleration, is the density of the water, and is the height difference calculated in Equation (6) for the divergence angle of 2°:
where is the distance from the throat cross-section to section of gauge . As the height contribution is three orders of magnitude smaller than the dynamic pressure, , this term in Equation (5) can be neglected.
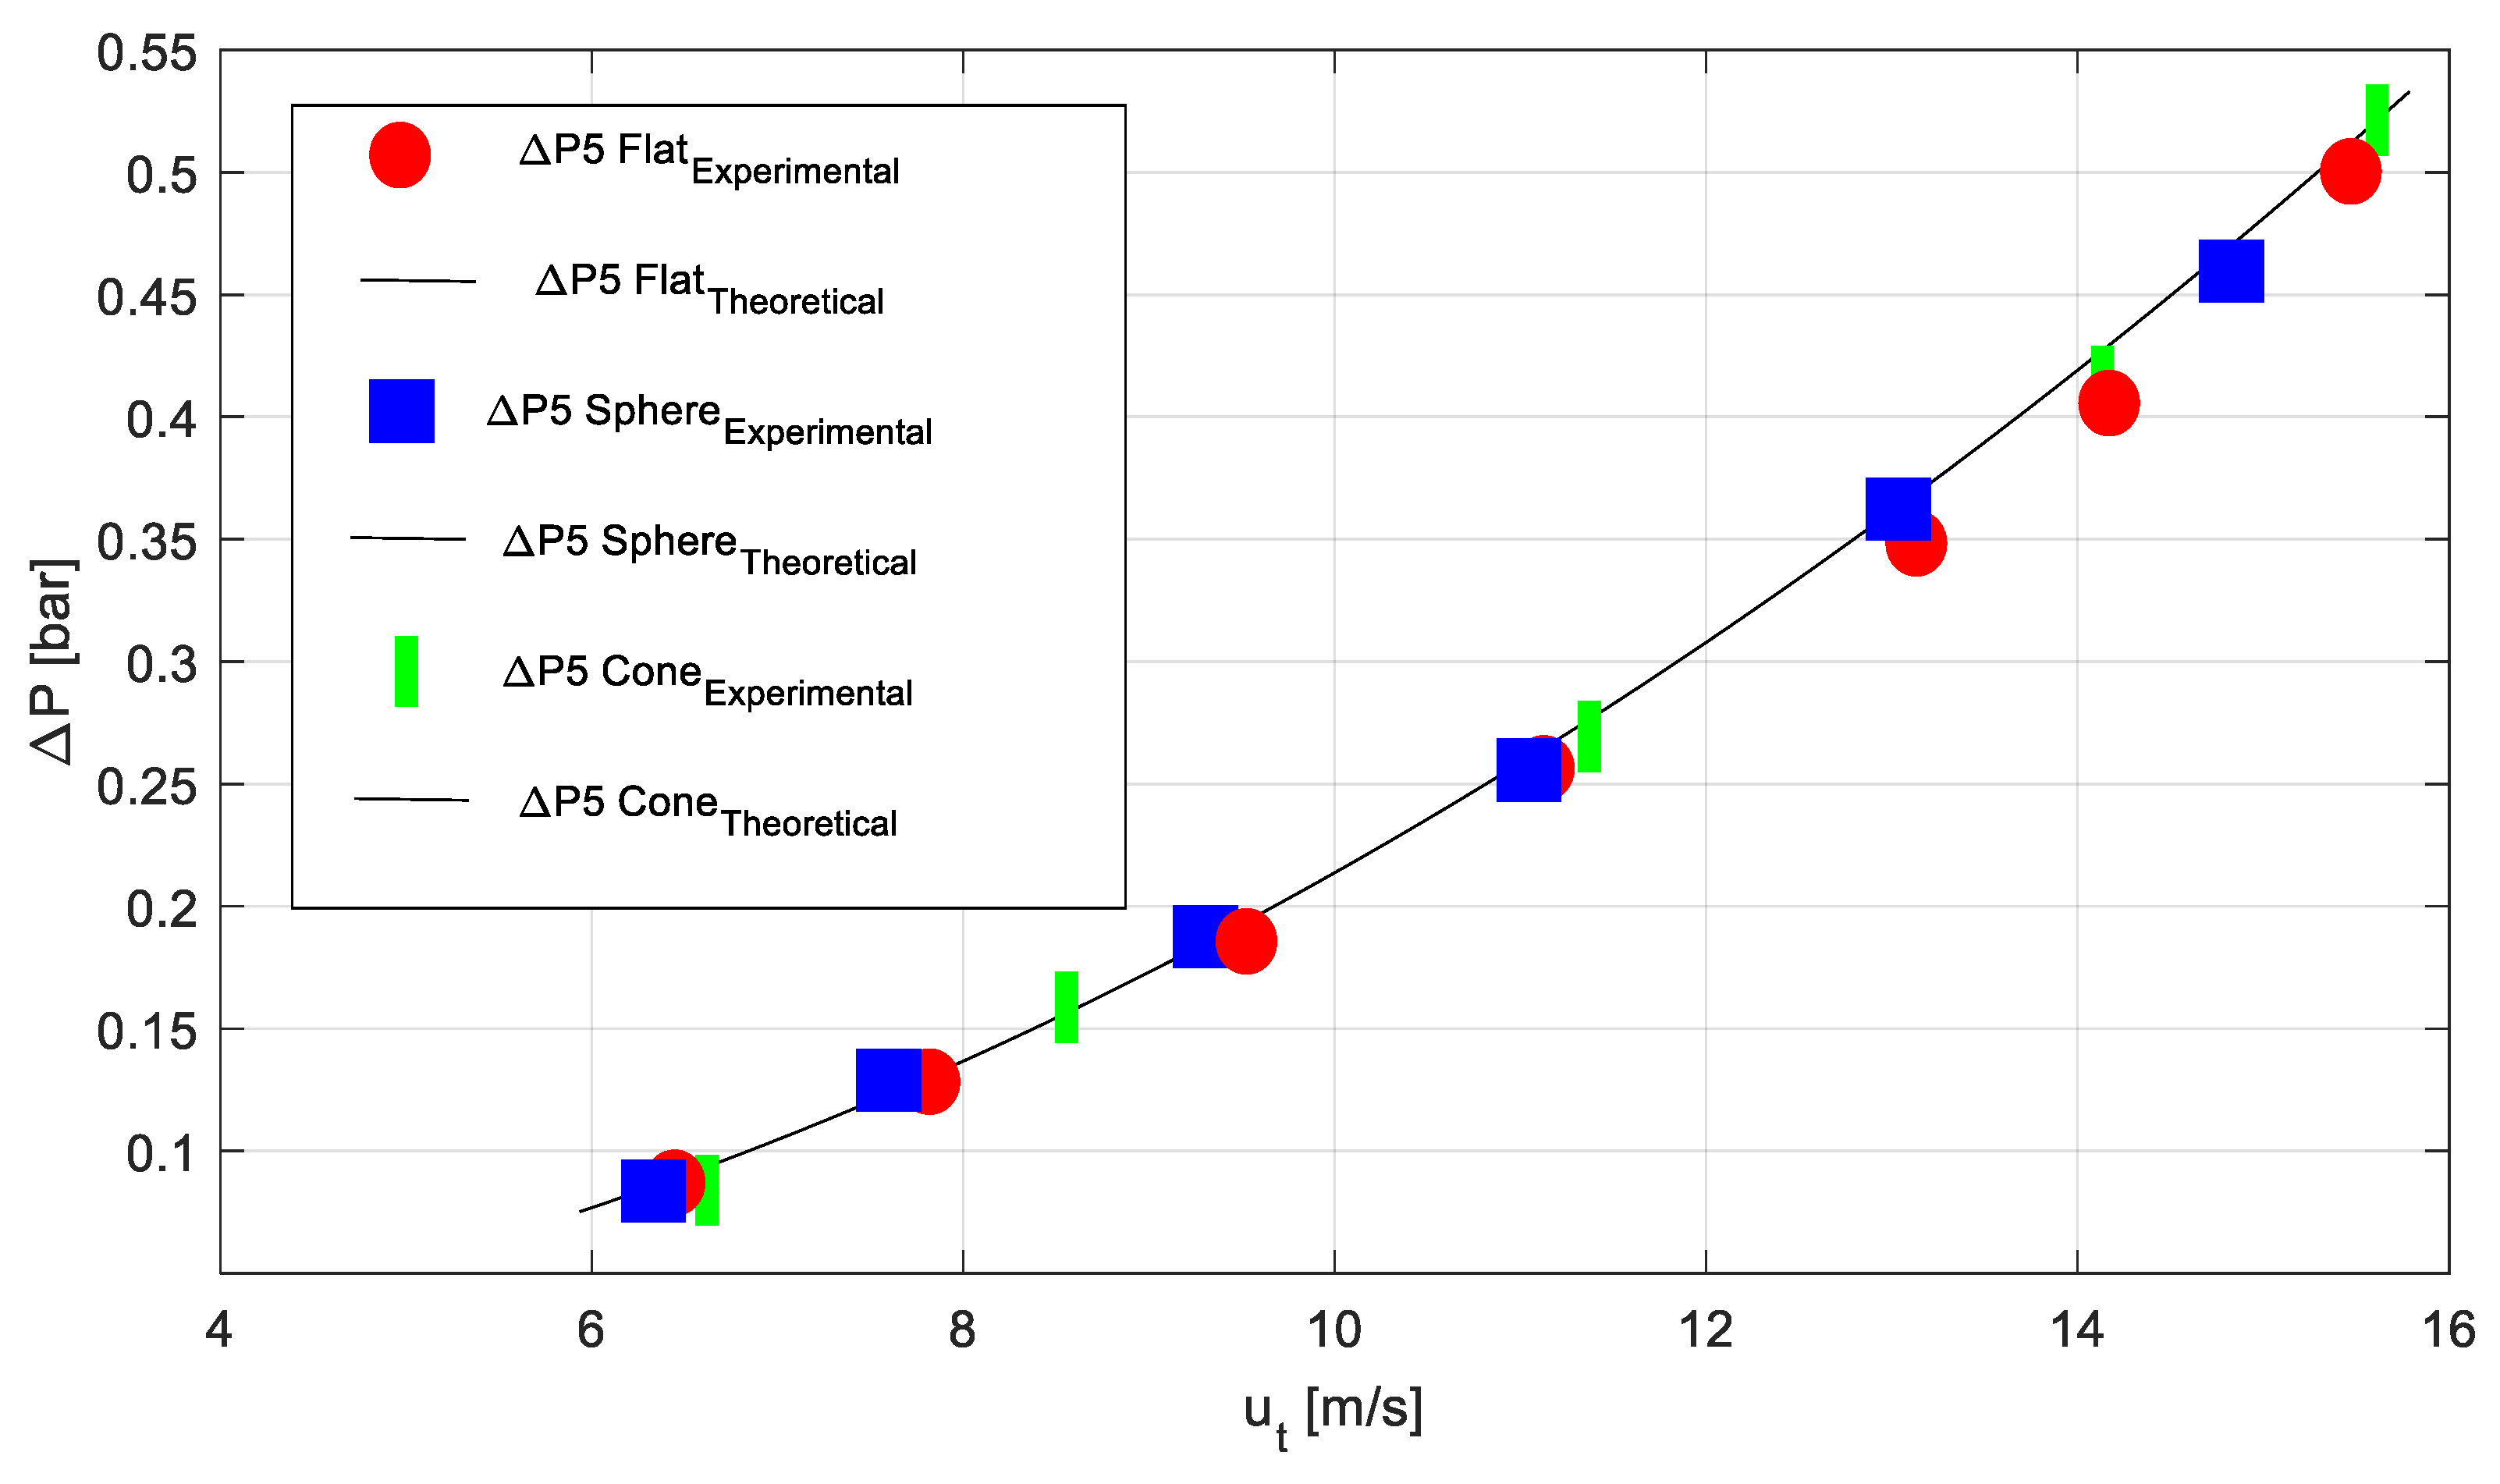
Figure 8a,b presents a situation where the cavitation bubble has not reached cross-section i and a situation where cross-section i is already within the bubble domain, respectively. In the former, the cross-section for the water flow at i is , whereas the cross section for the water flow at t is . The theoretical pressure difference between i and t cross-sections, , should be derived from Equation (5). Figure 9 shows the theoretical line and experimental points versus the water flow velocity at cross section t for such a case, revealing very good agreement to within ±0.05 bar.
Figure 8b shows a further developed bubble, exceeding section i. One can assume that the pressure within the naturally developed supercavitation bubble is equal to the equilibrium vapor pressure throughout the bubble. We can further assume that the pressure in a cross-section is more or less constant (meaning that, along the bubble, the pressure field is uniform and practically equal to the vapor pressure). Bernoulli equation implies that, to keep a uniform pressure along the flow path, the flow velocity should be constant, meaning the available cross section for the water flow should be constant. With the assumption that the water bypasses the contour of the vapor bubble, we obtain:
where, in our case, the nozzle divergence angle is 2°, is the cavitation bubble diameter, and
Equation (7) means that the shape of the bubble in a bounded duct (nozzle) is dictated by the shape of the nozzle to practically keep a constant cross-section for the water flow between the supercavitation bubble boundary and the nozzle walls. It explains the finding in this research that the different cavitators (of different nose shape, but the same diameter) exhibited the same bubble shape. The function describing the bubble geometry was obtained as:
where . For small z, Equation (9) narrows to Equation (2) with the geometric factor:
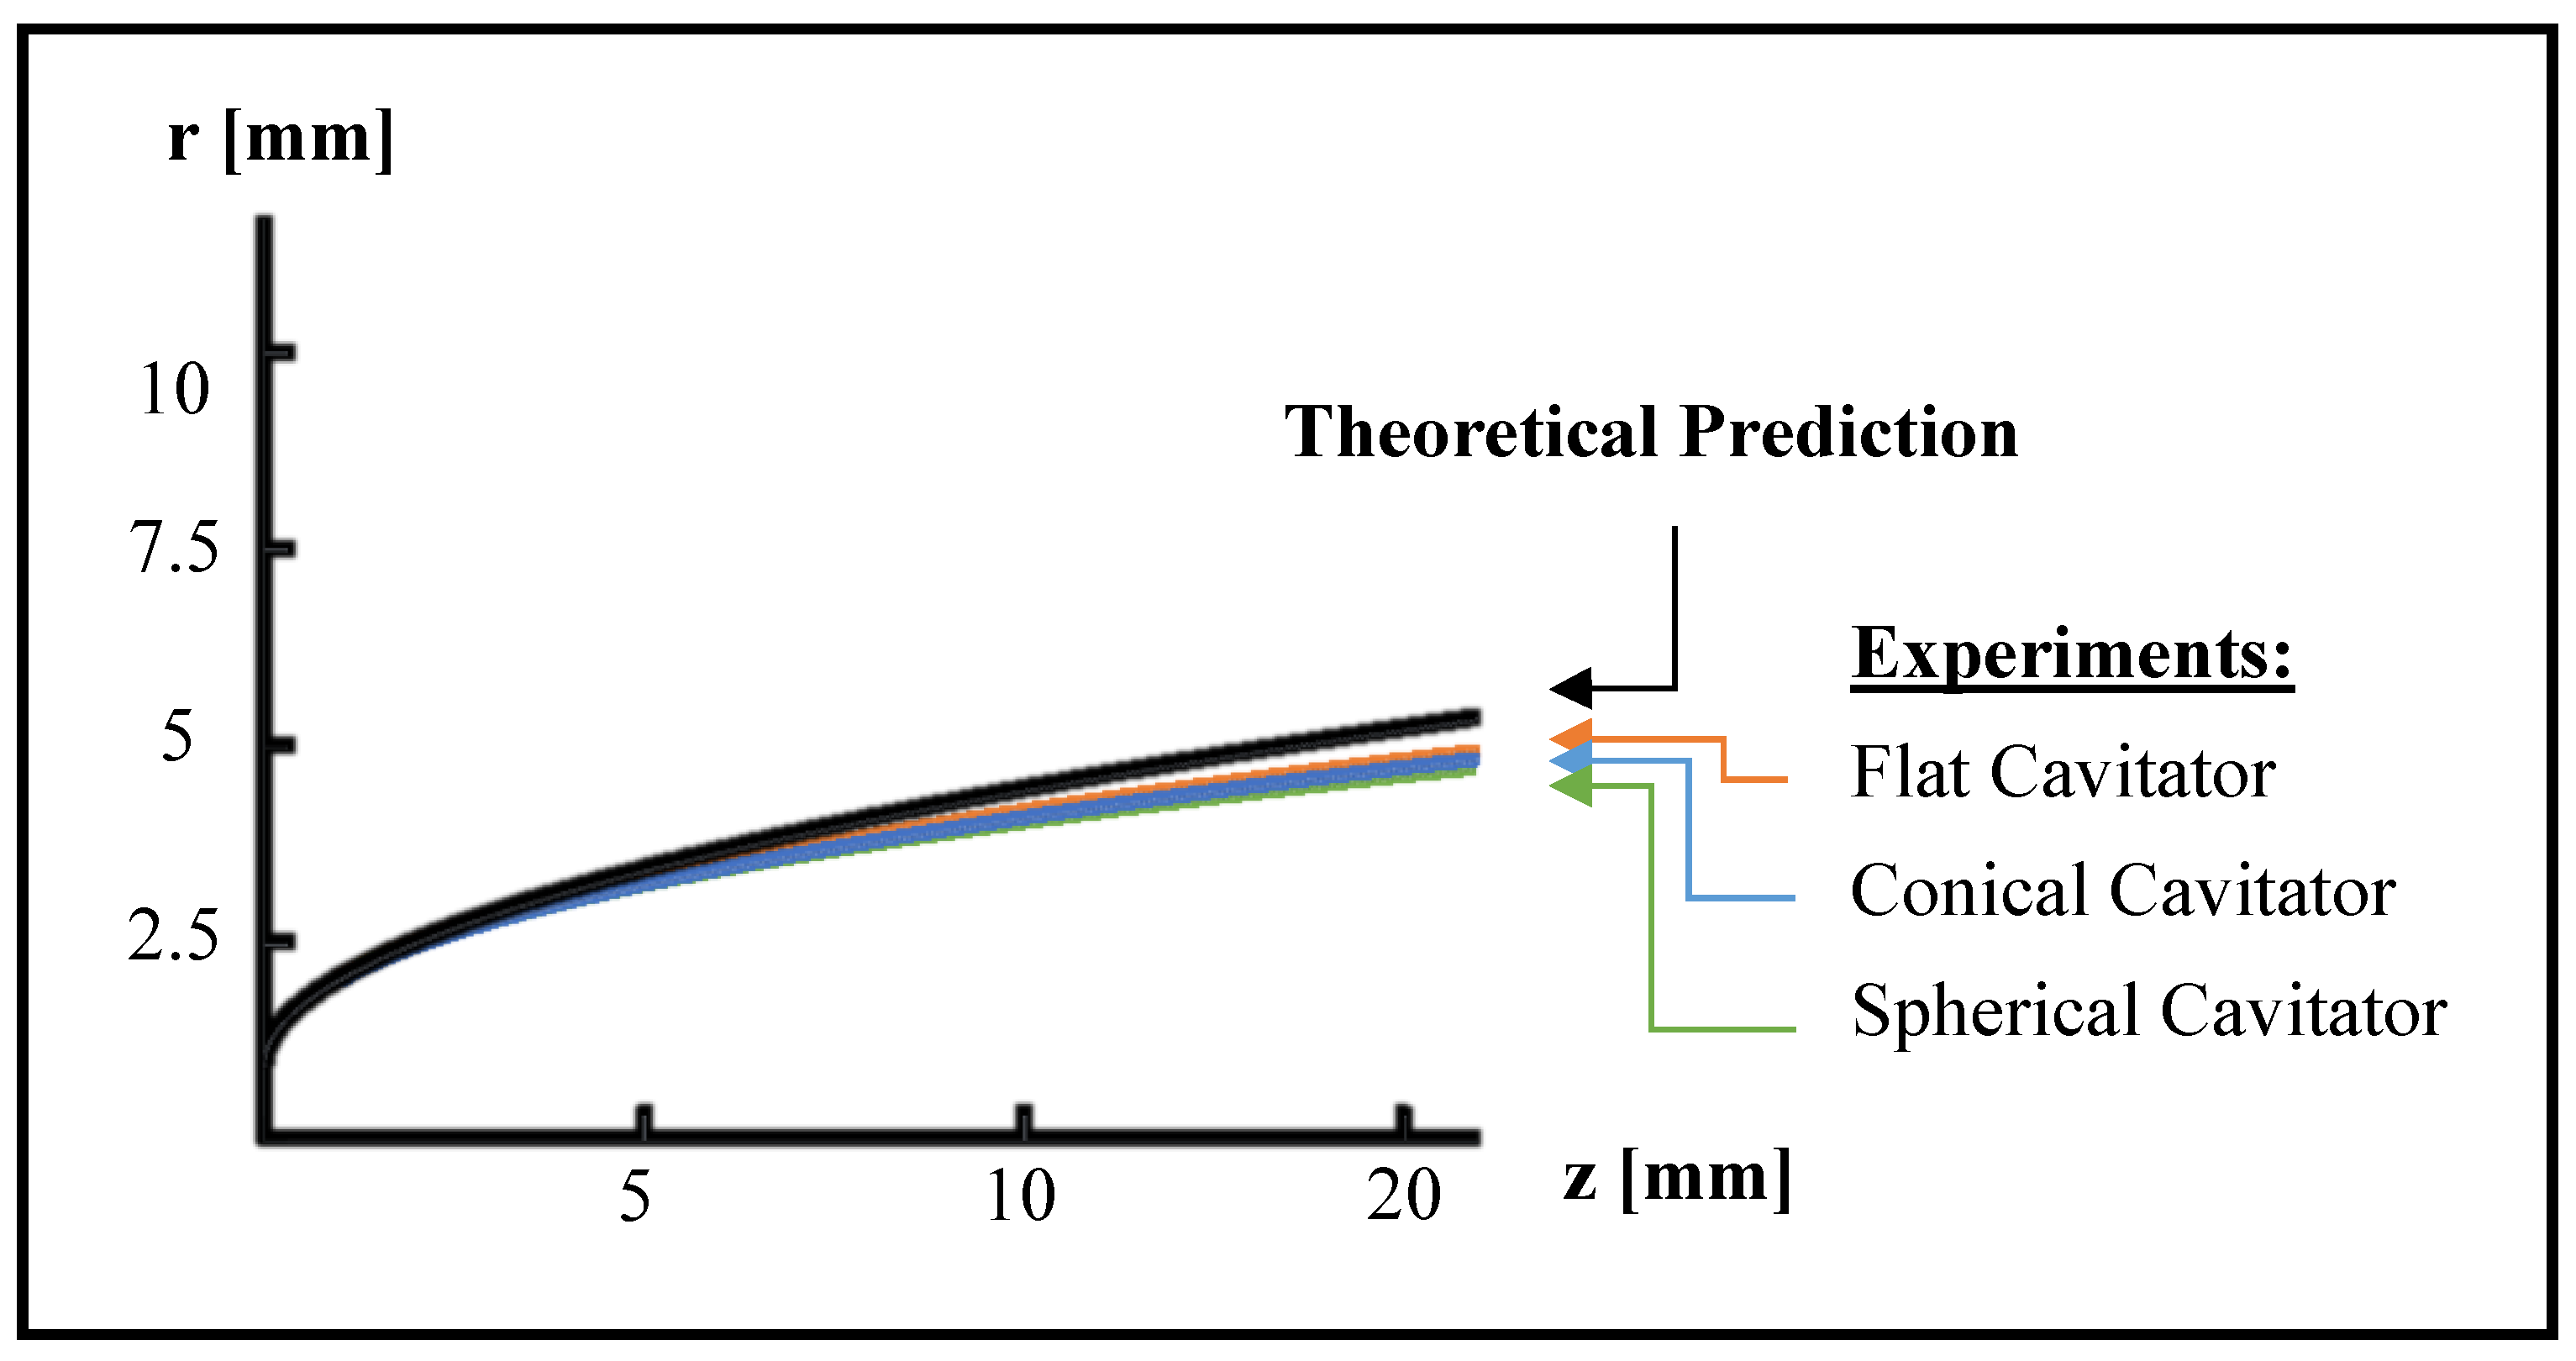
A comparison between the bubble geometry predicted in Equation (9) and the experimental results for all three cavitators is described in Figure 10, showing agreement within about 3%. The experimental results are related to Stage 5 of the bubble development.
4.4. The Bubble Dimensions
Based on the experiments, a relation between the supercavitation bubble dimensions and the cavitation number of the flow was deduced for all three cavitators (Figure 11), according to Equation (11):
where is the bubble length; is the diameter of the body; are constants depending on the flow conditions, bubble position, and form; and is the cavitation number of the flow calculated according to Equation (12):
where is the atmospheric pressure, is the vapor pressure of the water, is the water density, and is the water velocity.
All curves reveal the same general trend of decreasing the ratio of the bubble length to body diameter when increasing the cavitation number. The two cavitators with the gradually changing front shape, namely, the conical and spherical cavitators, exhibit very similar curves, both in slope and in magnitude. This could be expected as they generated similar bubble shapes at only slightly different flow velocities. The flat cavitator, however, showed bubble formation and development at substantially lower flow velocities, causing different slope and level of the curve. One may assume that the reason should be flow separation due to the abrupt change from the flat nose to the cylindrical body shape.
5. “Hysteresis”
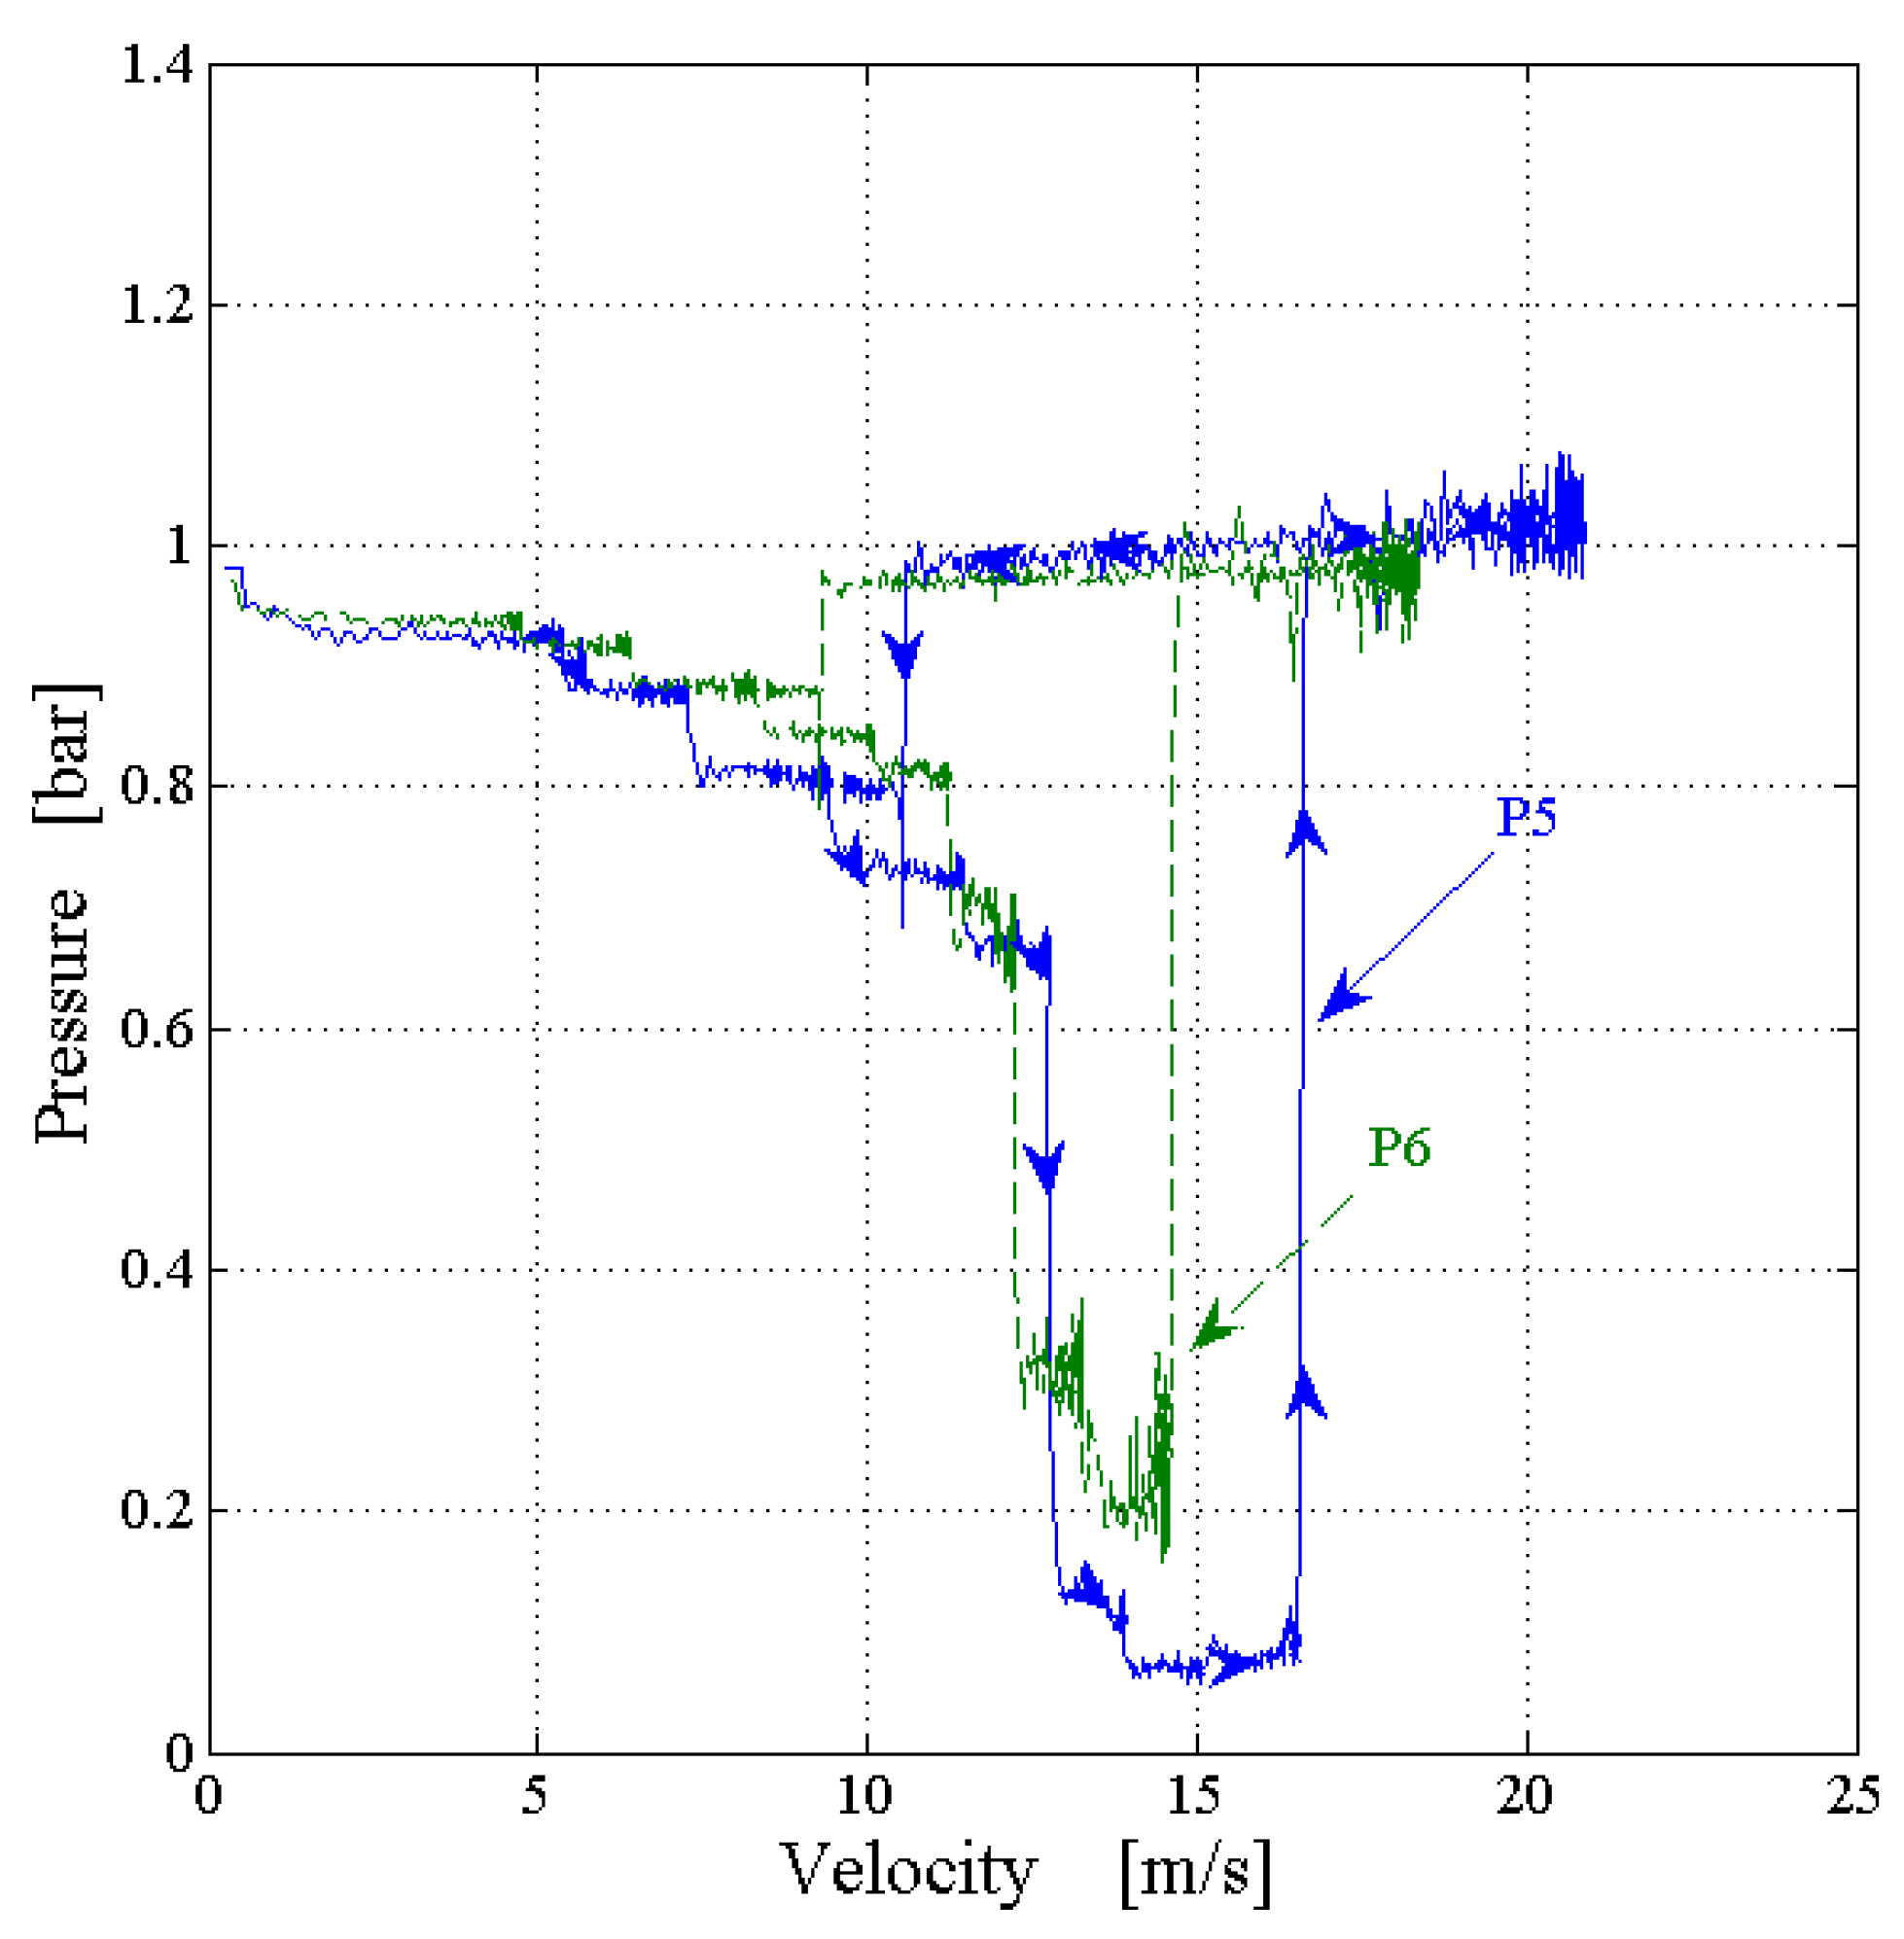
Increasing the flow rate, the bubble grew and extended along the body until it reached the rear edge of the nozzle, which was open to the atmosphere. When opening to the atmosphere, the pressure measured at the wall grew rapidly becoming equal to the outside pressure (one atmosphere). Further increase of the flow rate did not change the pressure. Examining the situation when gradually decreasing the water flow rate revealed that initially the pressure stayed constant and the bubble had the same size and shape. Further decrease in the flow rate, dropping the flow velocity much below the value that initially caused the bubble creation, led to a sudden collapse of the bubble. Detecting the bubble size and shape as well as the wall pressure during the process, one could see a hysteresis-like phenomenon, although the physical processes were not utterly reversed. Figure 12 shows the different paths of P5 and P6 wall pressure variation for the spherical cavitator, for the two parts of the experiment (a velocity increase followed by a velocity decrease). The first part of the experiment revealed a gradual pressure decrease followed by a substantial drop, when the bubble reached the gauge section (as described in Section 4.2), and then an abrupt increase to the atmospheric pressure when reaching the nozzle exit. In the second part of the experiment, when decreasing the flow velocity, the bubble and the pressure remained steady until the bubble collapsed (with only a slight change in pressure). The hysteresis that we observed is for a naturally developed vapor bubble, which was influenced by the opening of the bubble to the atmosphere. At that stage, the bubble contained a mixture of water vapors and atmospheric air. It showed a similar behavior to that of an artificial cavity resulting from a gas supply.
6. Conclusions
In a duct water flow, the wall has a significant influence on the flow regime and on the development of a supercavitation bubble on an object within the flow. The cavitator role in determining the bubble shape and dimensions becomes significantly smaller and its main impact is on the conditions (flow rate and velocity) of the bubble creation and collapse. It was found that different cavitators could produce similar bubble geometries, although at somewhat different flow velocities. Testing three different cavitators at the same flow conditions and examining the bubble development for each of the cavitators, one observes that a supercavitation bubble is created at the lowest flow velocity by a cavitator generating the largest disturbance in the flow, implying a more rapid change in the flow regime. This was the flat cavitator for which the bubble was created at a flow velocity of only 9.9 m/s. A bubble was created at the highest flow velocity for the cavitator causing the least and more moderate disturbance in the flow. This was the conical cavitator, for which the bubble was created at a velocity of 14.8 m/s (50% larger than for the flat cavitator). Another phenomenon observed was hysteresis. When increasing and decreasing the flow rates, the bubble as well as the pressure variations of growth and decrease underwent different paths. Supercavitation is a fluid dynamics phenomenon, depending mainly on the flow and pressure fields. The water quality, such as salt concentration (seawater vs. tap water), may have a small effect through the dependence of the vapor pressure. The vapor pressure of saline water is slightly lower than for pure water. For instance, at 20 °C, vapor pressure of pure water is 0.0234 bar, and that of seawater is 0.0229 bar. This small difference would practically not change the results but might cause a slight change in the velocity value for each stage of supercavitation bubble development.
Author Contributions
This academic research was conducted in full collaboration and involvement of both authors, as is commonly done by a PhD student (L.A.L.) and thesis Advisor (A.G.), with regards to conceptualization, evaluation, and presentation of the results. All authors have read and agreed to the published version of the manuscript.
Funding
This research received no external funding.
Conflicts of Interest
The authors declare no conflict of interest.
References
- Logvinovich, G.V.; Serebryakov, V.V. On methods of calculating a shape of slender axisymmetric cavities. Hydromechanics 1975, 32, 47–54. [Google Scholar]
- Serebryakov, V.V. Asymptotic solutions of axisymmetric problems of the cavitational flow under slender body approximation. In Hydrodynamics of High Speeds; Chuvashian State University: Cheboksary, Russia, 1990; pp. 99–111. [Google Scholar]
- Semenenko, V.N. Artificial Supercavitation. Physics and Calculation. In Proceedings of the RTO Lecture Series 005 on Supercavitating Flows, Brussels, Belgium, 12–16 February 2001. [Google Scholar]
- Serebryakov, V.V. The models of the supercavitation prediction for high speed motion in water. In Proceedings of the International Scientific School: HSH-2002, Chebocsary, Russia, 16–23 June 2002. [Google Scholar]
- Savchenko, Y. Supercavitation-problems and perspectives. In Proceedings of the 4th International Symposium on Cavitation (CAV 2001), California Institute of Technology, Pasadena, CA, USA, 20–23 June 2001. [Google Scholar]
- Wu, T.Y.T.; Whitney, A.K.; Brennen, C. Cavity-flow wall effects and correction rules. J. Fluid Mech. 1971, 49, 223–256. [Google Scholar] [CrossRef] [Green Version]
- Ahn, B.K.; Lee, T.K.; Kim, H.T.; Lee, C.S. Experimental investigation of supercavitating flows. Int. J. Nav. Archit. Ocean Eng. 2012, 4, 123–131. [Google Scholar] [CrossRef] [Green Version]
- Ahn, B.K.; Jeong, S.W.; Kim, J.H.; Shao, S.; Hong, J.; Arndt, R.E. An experimental investigation of artificial supercavitation generated by air injection behind disk-shaped cavitators. Int. J. Nav. Archit. Ocean Eng. 2017, 9, 227–237. [Google Scholar] [CrossRef] [Green Version]
- Fridman, G.M.; Achkinadze, A.S. Review of Theoretical Approaches to Nonlinear Supercavitating Flows; Report No. ADP012079, Ship Theory Department, Saint Petersburg State Marine Technical University: St Petersburg, Russia, 2001. [Google Scholar]
- Kirschner, I.I.; Chamberlin, R.; Arzoumanian, S.A. simple approach to estimating three-dimensional supercavitating flow fields. In Proceedings of the 7th International Symposium on Cavitation (CAV2009), Ann Arbor, MI, USA, 16–20 August 2009. [Google Scholar]
- Kwack, Y.K.; Ko, S.H. Numerical analysis for supercavitating flows around axisymmetric cavitators. Int. J. Nav. Archit. Ocean Eng. 2013, 5, 325–332. [Google Scholar] [CrossRef] [Green Version]
- Brennen, C. A numerical solution of axisymmetric cavity flows. J. Fluid Mech. 1969, 37, 671–688. [Google Scholar] [CrossRef] [Green Version]
- Kinnas, S.A. The prediction of unsteady sheet cavitation. In Proceedings of the 3rd International Symposium on Cavitation, Grenoble, France, 7–10 April 1998. [Google Scholar]
- Scardovelli, R.; Zaleski, S. Direct numerical simulation of free-surface and interfacial flow. Annu. Rev. Fluid Mech. 1999, 31, 567–603. [Google Scholar] [CrossRef] [Green Version]
- Vasin, A.D. The Principle of Independence of the Cavity Sections Expansion (Logvinovich’s principle) as the Basis for Investigation on Cavitation Flows; Central Aerodynamics Institute (TSAGI): Moscow, Russia, 2001. [Google Scholar]
- Shi, H.H.; Wen, J.S.; Zhu, B.B.; Chen, B. Numerical simulation of the effect of different object nose shapes on hydrodynamic process in water entry. In Proceedings of the 10th International Symposium on Cavitation (CAV2018), Baltimore, MD, USA, 14–17 July 2018. [Google Scholar]
- Logvinovich, G.V. Hydrodynamics of Flows with Free Boundaries; Naukova Dumka Publishing House: Kiev, Ukraine, 1973. [Google Scholar]
- Ahn, B.K.; Jeong, S.W.; Park, S.T. An experimental investigation of artificial supercavitation with variation of the body shape. In Proceedings of the 10th International Symposium on Cavitation (CAV2018), Baltimore, MD, USA, 14–17 July 2018. [Google Scholar]
- Franc, J.P.; Michel, J.M. Fundamentals of Cavitation; Kluwer Academic Publishers: Dordrecht, The Netherlands, 2004. [Google Scholar]
- Wosnik, M.; Arndt, R.E.A. Control experiments with a semi-axisymmetric supercavity and a supercavity-piercing fin. In Proceedings of the 7th International Symposium on Cavitation, Ann Arbor, MI, USA, 17–22 August 2009. [Google Scholar]
| 1 |
Figure 1.
A scheme of the physical problem.

Figure 2.
The experimental system.

Figure 3.
The nozzle geometry and the pressure measurement locations.

Figure 4.
The supercavitation bodies.

Figure 5.
Stages of the bubble development for a flat cavitator.

Figure 6.
The geometries of the supercavitation bubble for three different cavitators.

Figure 7.
The wall pressure in P5 vs. the velocity in this section for the three cavitators 1.
Figure 7.
The wall pressure in P5 vs. the velocity in this section for the three cavitators 1.

Figure 8.
Control volume for theoretical analyses. (a) the cavitation does not reach the cross-section (b) the cavitation reaches the cross-section.
Figure 8.
Control volume for theoretical analyses. (a) the cavitation does not reach the cross-section (b) the cavitation reaches the cross-section.

Figure 9.
Comparison between the theoretical and experimental values of vs. the velocity at the nozzle throat for the different cavitators.
Figure 9.
Comparison between the theoretical and experimental values of vs. the velocity at the nozzle throat for the different cavitators.

Figure 10.
Comparison between the theoretical prediction and experimental results of the bubble geometry for the three cavitators.
Figure 10.
Comparison between the theoretical prediction and experimental results of the bubble geometry for the three cavitators.

Figure 11.
The measured supercavitation bubble dimension ratio vs. the cavitation number for the three cavitators.
Figure 11.
The measured supercavitation bubble dimension ratio vs. the cavitation number for the three cavitators.

Figure 12.
Wall pressure at the diverging part of the nozzle vs. the velocity for the spherical cavitator during a cycle including an increase followed a decrease of the flow velocity.
Figure 12.
Wall pressure at the diverging part of the nozzle vs. the velocity for the spherical cavitator during a cycle including an increase followed a decrease of the flow velocity.


Table 1.
Flow velocity at the front edge of the cavitator in Stages 1–6 of the bubble development for the three cavitators.
Table 1.
Flow velocity at the front edge of the cavitator in Stages 1–6 of the bubble development for the three cavitators.
| Stage of Development | Conical Cavitator | Spherical Cavitator | Flat Cavitator |
|---|---|---|---|
| Stage 1 | 14.8 m/s | 13.5 m/s | 9.9 m/s |
| Stage 2 | 16.4 m/s | 15.8 m/s | 11.7 m/s |
| Stage 3 | 17.2 m/s | 16.8 m/s | 13.8 m/s |
| Stage 4 | 17.8 m/s | 17.3 m/s | 15.5 m/s |
| Stage 5 | 19.7 m/s | 18.3 m/s | 17.7 m/s |
| Stage 6 | 20.7 m/s | 19.8 m/s | 18.8 m/s |
© 2020 by the authors. Licensee MDPI, Basel, Switzerland. This article is an open access article distributed under the terms and conditions of the Creative Commons Attribution (CC BY) license (http://creativecommons.org/licenses/by/4.0/).
Share and Cite
MDPI and ACS Style
Arad Ludar, L.; Gany, A. Experimental Study of Supercavitation Bubble Development over Bodies in a Duct Flow. J. Mar. Sci. Eng. 2020, 8, 28. https://doi.org/10.3390/jmse8010028
AMA Style
Arad Ludar L, Gany A. Experimental Study of Supercavitation Bubble Development over Bodies in a Duct Flow. Journal of Marine Science and Engineering. 2020; 8(1):28. https://doi.org/10.3390/jmse8010028
Chicago/Turabian StyleArad Ludar, Lotan, and Alon Gany. 2020. "Experimental Study of Supercavitation Bubble Development over Bodies in a Duct Flow" Journal of Marine Science and Engineering 8, no. 1: 28. https://doi.org/10.3390/jmse8010028
Note that from the first issue of 2016, this journal uses article numbers instead of page numbers. See further details here.