Experimental and Numerical Study of Pre-Swirl Stators PSS


1
Department of Ship and Ocean Structures, SINTEF Ocean AS, 7465 Trondheim, Norway
2
SkaMik AS, 7940 Ottersøy, Norway
*
Author to whom correspondence should be addressed.
J. Mar. Sci. Eng. 2020, 8(1), 47; https://doi.org/10.3390/jmse8010047
Submission received: 18 December 2019
/
Revised: 10 January 2020
/
Accepted: 13 January 2020
/
Published: 16 January 2020
(This article belongs to the Special Issue Selected Papers from the Sixth International Symposium on Marine Propulsors)
Abstract
:Energy saving within shipping is gaining more attention due to environmental awareness, financial incentives, and, most importantly, new regional and international rules, which limit the acceptable emission from the ships considerably. One of the measures is installation of energy saving devices (ESD). One type of such a device, known as pre-swirl stator (PSS), consists of a number (usually 3 to 5) of fins, which are mounted right in front of the propeller. By modifying the inflow and swirl into the propeller, the fins of a PSS have the possibility to increase the total propulsion efficiency. However, at the same time, they may introduce additional resistance either due to changes in pressure distribution over the aft ship or due to its own resistance of fins. In this paper, the authors present experimental and numerical investigation of a PSS for a chemical tanker. Numerical analysis of the vessel with and without PSS is performed in the model and full scale. Model testing is performed with and without PSS to verify the power savings predicted numerically. Among other quantities, 3D wake field behind the hull is densely measured at different planes, starting from the PSS plane to the rudder stock plane. 3D wake measurements are also conducted with a running propeller. The measurements show considerable improvement in the performance of the vessel fitted with PSS. On the numerical side, analyses show that scale effect plays an important role in the ESD performance. Investigation of the scale effect on the vessel equipped with an ESD provides new insight for the community, which is investing more into the development of energy saving devices, and it offers valuable information for the elaboration of scaling procedures for such vessels.
1. Introduction
Energy Saving Devices (ESDs) represent the technology equally suitable for both the new and retrofit ships. The Propulsion Improving Devices occupy the greatest place on today’s ESD market, and they show well-documented power savings over a large range of vessels (ABS [1]), (Mewis [2]). These ESDs are normally classified by their working principle regarding the mechanism that they use to modify the flow around the propeller operating in the wake behind hull, including Wake Equalizing and Flow Separation Alleviating Devices, Pre-Swirl Devices, Post-Swirl Devices, and High-Efficiency Propellers and Ducts. More than one device can be employed as components of an ESD installation, and some devices obtain the benefit of several flow modification mechanisms, such as the Mewis Duct® (Guiard et al. [3]), (Mewis [2]).
The present study is focused on the experimental and numerical investigation of the ESD type known as Pre-Swirl Stator (PSS) as a possible solution for retrofitting of a chemical tanker. A PSS may consist of a number (usually 3 to 5) fins, which are mounted upstream of the propeller. By modifying the axial and tangential velocity components of the inflow on the propeller, a properly designed PSS should recover part of the kinetic energy losses in the system of the ship hull with an operating propeller. The greatest part of energy saving by PSS comes from utilizing the kinetic energy associated with tangential velocities, which is due to the effect of pre-swirl. The PSS fins may also be used in combination with a duct or a shroud. Ducted configurations known as Pre-Ducts with Stator (PDS) are widely employed (Dang et al. [4]), (Mewis [2]), (Kim et al. [5]). They combine the effect of pre-swirl with the effect of flow equalization. Since the duct may accelerate the inflow on the propeller, which counteracts the effect of flow retardation by the fins, PDSs show usually higher power savings compared to PSS except the range of light propeller loading, where approximately CTh < 1.25. The benefits of duct installation increase with the rise of loading. Shrouds connecting the stator fins may be employed to improve structural integrity, and to reduce tip losses (Voermans [6]). Voermans investigated the determination of hydrodynamic loads on a PSS experimentally and validated a prediction methodology for design loads (Voremans [7]). Zhai studied hull pressure fluctuations numerically with an energy saving device known as the Pre-Shrouded Vane (Zhai et al. [8]). Recently, Controllable Pre-Swirl Fins (CPSF) were introduced. These are mounted in front of the propeller in such a way that they can be adapted to different operating conditions by optimizing their pitch and flap settings (Nielsen et al. [9]). In the present work, only the PSS without duct/shroud is investigated. For the design and performance optimization of the PSS, a Computational Fluid Dynamics CFD-based approach is employed, where a number of design parameters defining configuration of the fins are systematically investigated through a self-propulsion calculation. The objective is to maximize power savings at the true vessel self-propulsion point due to the installation of ESD with the given propeller design. The design is performed for full-scale conditions at the chosen design speed and draught, and the final design is checked in a relevant speed range around the design point. Model tests are performed for the validation of the numerical method and verification of ESD performance. In particular, extensive 3D wake measurements are conducted at different planes starting from the PSS plane in front of the propeller to rudder stock plane aft of the propeller. These measurements are conducted with a running propeller.
2. General Considerations Regarding ESD Design
When designing a PSS to retrofit a single-screw displacement vessel, one needs to take into consideration the following aspects.
The energy losses due to flow rotation induced by the propeller operating behind the hull are greater than energy losses due to flow acceleration, which is opposite of the case of the propeller operating in open water conditions. Hence, one needs to work on the modification of a tangential velocity component.
Depending on the direction of the propeller rotation, the PSS fins should be installed either on the portside or starboard, where the prevailing direction of transverse flow is in the direction of the propeller rotation.
If large vortices develop on the ship hull as a result of flow separation in the stern region, the PSS fins may break those vortices and, to a certain degree, serve the purposes of flow redirection and equalization. If this is of importance, one may consider placing additional fins on the opposite side of the ship as well, even though they may not give any considerable contribution to pre-swirl, or they may even reduce the pre-swirl effect already existing in a non-modified wake.
The shape of fins and their location with respect to hull and propeller should be chosen to maximize the desired effect of pre-swirl, and, at the same time, to minimize separation, vortex shedding, and strength of the tip vortex on the fins. The said phenomena led to energy losses that cannot be regained. This prompts the distributions of pitch (twist angle) and camber along the span, which should, in theory, be derived individually for each fin, which makes the fins adapt to local flow features.
The rudder installed downstream of the propeller utilizes a certain amount of rotational energy in a propeller slipstream, which would reduce the overall positive effect of pre-swirl by PSS. At the same time, since PSS recovers part of the rotational energy and reduces the tangential velocity in the slipstream, one may expect an increase in rudder resistance compared to the case without PSS.
The PSS may be designed to produce an additional thrust. However, this thrust would result in an increase of the thrust deduction force on the hull, so that one cannot expect significant gains in the net thrust. Designing a neutral PSS (regarding the axial force it develops) may, therefore, be the preferred strategy as such a stator would also be less likely to suffer from flow separation, and it would pose less risk to have a negative effect on the flow over stern.
The previously mentioned points indicate the importance of using a system approach to the ESD design, considering the whole system consists of a ship hull, ESD, propeller, and rudder. The choice of a correct objective function for the ESD design is equally important. The maximum achievable reduction of the shaft delivered power, PD, or a maximum increase of propulsive efficiency are the criteria adequate for the purpose. These quantities are representative of the efficiency of an ESD designed for a given ship, when they are defined at the ship self-propulsion point. For comparing ESDs installed on different ships and working under different conditions, additional criteria such as the ESD Quality Index suggested in Voermans [6] may be employed.
Since, for single-screw ships, the scale effect on wake field is considerable, full-scale effective inflow on the propeller needs to be accounted for in the ESD design process.
While the actual design is normally performed for one design condition (ship speed and draft), one needs to verify the performance of the vessel equipped with the designed ESD at other speeds and drafts, since these parameters may have influence on the inflow experienced by the ESD and propeller.
The above considerations, and, in particular, those related to a system design approach and realistic full-scale conditions, suggest that a CFD-based design may be an adequate method of choice. Verification by model tests is, however, important in the light of known deficiencies of the CFD RANS methods related to capturing an anisotropic pattern of turbulence in the wake field and dependency of results on mesh resolution.
The discussion presented in this section is focused on the hydrodynamic aspects of ESD design. Before the design is finalized, one needs to check the structural characteristics of the ESD such as fin stiffness, stress levels, avoidance of resonance, fatigue loads, and connections with the ship hull.
3. Numerical Method and its Validation
The numerical method employed as the main solver in the design exploration procedure is based on the unsteady RANS approach, using the Sliding Mesh technique to fully account for the interaction between the ship hull, ESD, propeller, and rudder. The commercial CFD software STAR-CCM+ (version 12.04) is used for this purpose. STAR-CCM+ provides a powerful design exploration and optimization engine called Design Manager where setups with a different degree of automation can be realized.
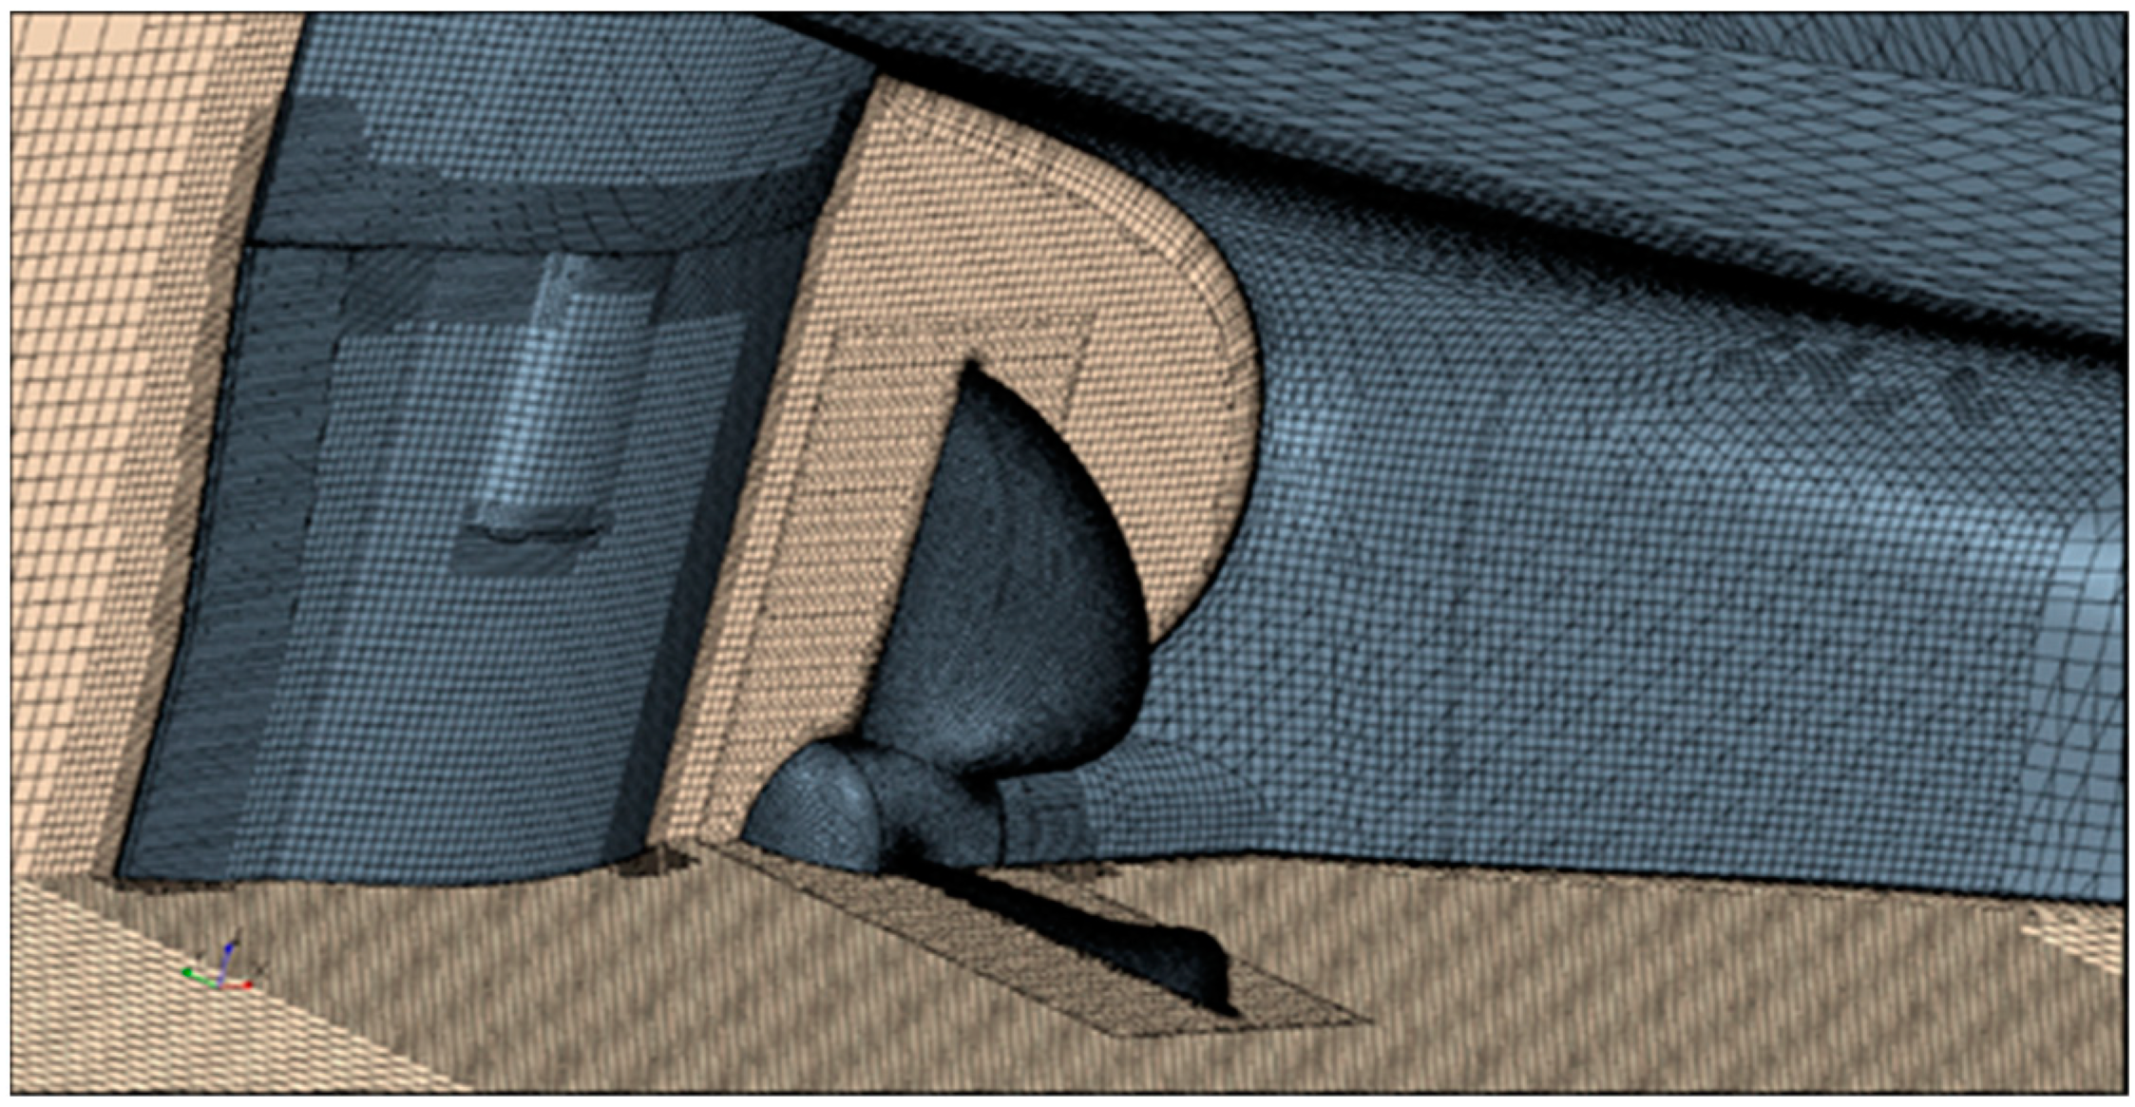
When modeling the geometry and generating mesh for the CFD solution, attention is paid to accurate representation of all the main components of the system. The examples of computation mesh in the vessel stern region are shown in Figure 1 and Figure 2. The mesh in the main fluid region containing the ship hull, rudder, and, eventually, ESD, is produced using Trimmer, a predominantly hexahedral mesh where the cells next to the surfaces are trimmed to accommodate the input geometries.
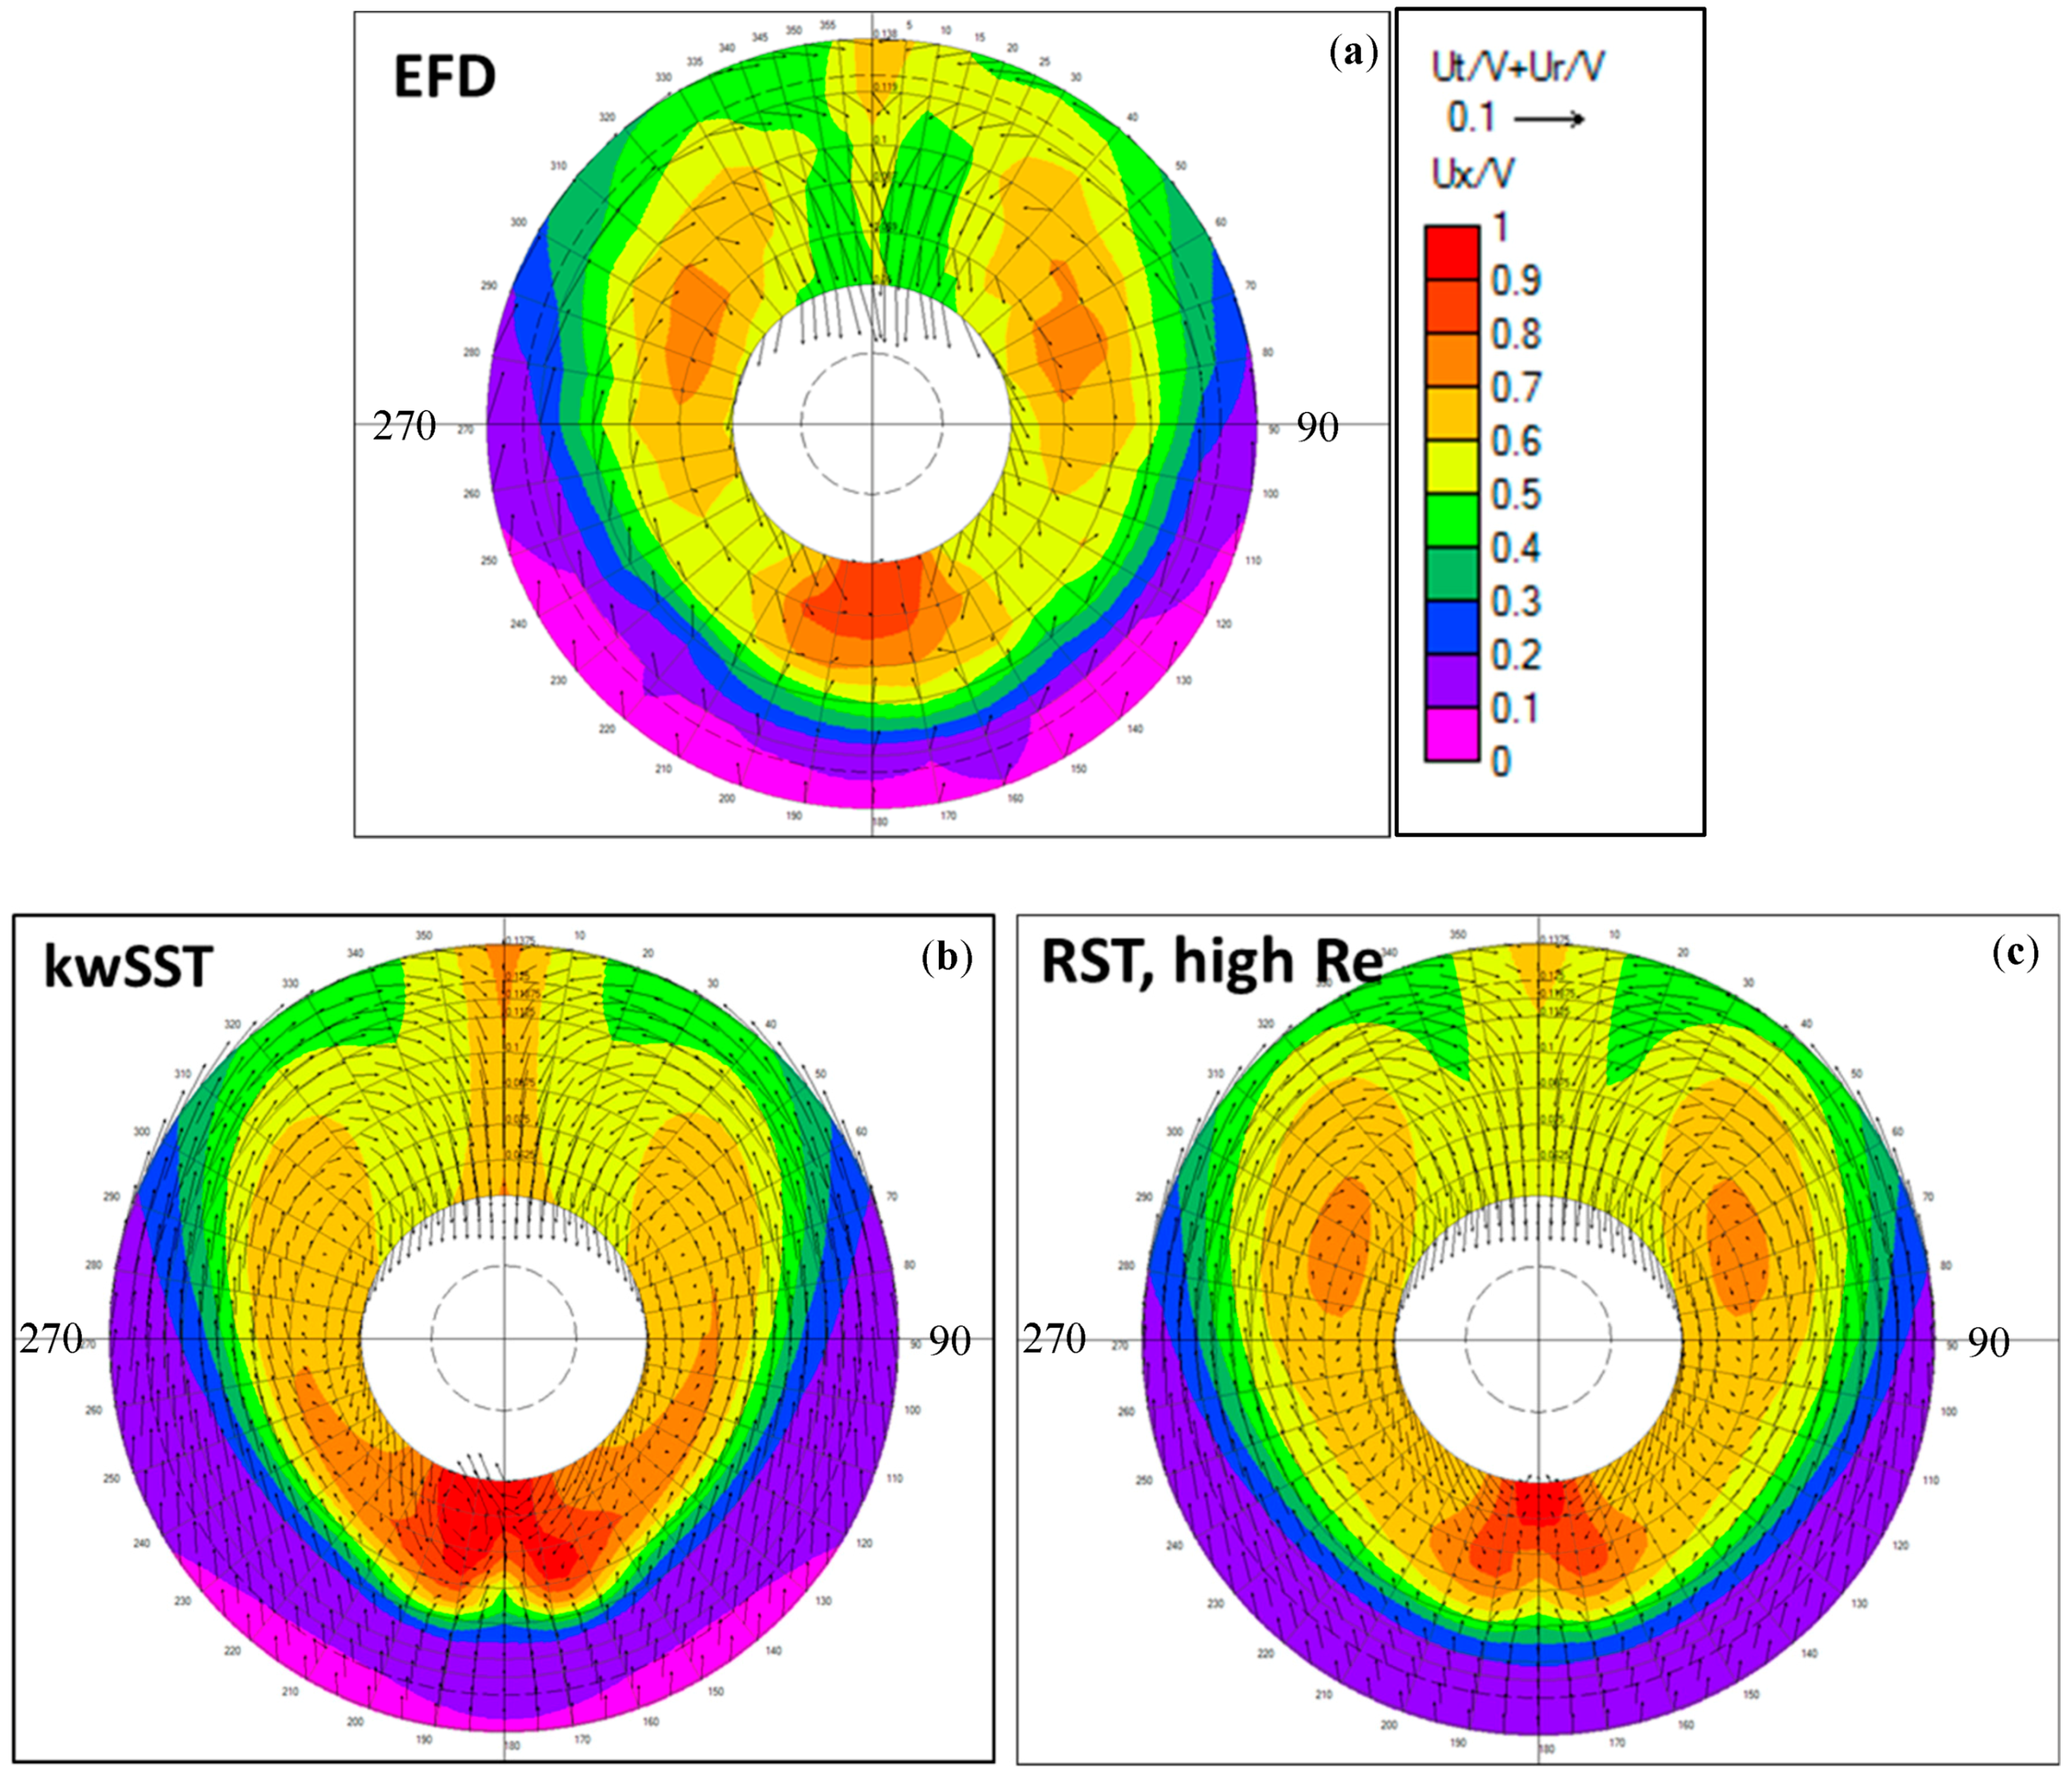
In the rotating propeller region, a polyhedral mesh is generated. Along all the wall boundaries, a prism layer mesh is generated to resolve velocity profiles in the boundary layer and meet the desired Wall Y+ levels. In the full-scale calculations, 12 prism layers are arranged along the hull, rudder, and ESD surface. Additionally, 10 prism layers are arranged on the propeller blades and hub. The averaged target Y+ values are 150 on the hull surface, and 90 on the rudder and ESD surfaces. The Y+ on propeller blades ranges between 30 and 80, with most of the blade area being close to the lower boundary of this range. Thus, a high-Re near-wall resolution is aimed for on the wall boundaries to reduce computational effort, which is essential in design exploration studies where many variants need to be evaluated. The main turbulence model used in the RANS solution is k-ω SST. However, other turbulence models such as realizable k-ε and RST (Linear Pressure Strain formulation) models were also investigated. The numerical solution for the free surface is obtained using the Volume of Fluid VOF method, using the Flat VOF Wave model and HRIC interface capturing scheme. Considering the importance of sufficiently accurate resolution of the flow past ship stern, around the propeller, ESD, and rudder, the mesh in that region is refined to provide an average cell size (in both the fluid region and propeller region) about 1.35% of the propeller diameter Dp. The target surface cell size on propeller blades, rudder, and ESD fins is twice smaller than 0.675% of Dp. Further refinement of 0.084375% of Dp is applied along the edges and tips of respective parts. With these settings, the cell count in the propeller region is about 4 million (1 million cells per blade), and the cell count of the fluid region is about 11.6 million without ESD and 14.5 with ESD. A grid sensitivity study was conducted prior to the aforementioned mesh recommendations where the volume cell size in the mesh control surrounding the ship stern, ESD, propeller, and rudder (this control is seen in Figure 1 as the zone of refined mesh) varied as 2%, 1.5%, and 1.0% of Dp. The surface cell size on the geometry parts was scaled accordingly. The changes in integral characteristics of propeller due to mesh refinement were found to be within 0.5%. The final cell size value of 1.35% of Dp was assigned to optimize total cell count due to the feature of the Trimmer meshing template where cell size changes by multiples of two from the base size, which, in this case, was equal to the vessel LPP. The influence of hull surface roughness is included in the CFD model by means of modified wall functions. The assumed equivalent height of sand roughness grains is equal to 60 μm. The studied vessel has one bow tunnel thruster and bilge keels. These design features as well as the superstructure are not included explicitly in the CFD model. Their influence on resistance is accounted for by means of standard corrections, which are used in the experimental predictions. The present setup has earlier been validated against the benchmark full-scale dataset of the Lloyd’s Register 2016 CFD Workshop (Ponkratov [10]). Additional validation exercises have been conducted in the present work with the vessel used in the ESD optimization study. Table 1 presents a comparison between the CFD predictions, full-scale prognosis based on model tests, and full-scale trial data. In this table and below, n is the propeller rate of revolution, TB is the propeller thrust behind the hull (at the self-propulsion point), Vs is the ship speed, PD is the shaft delivered power, and PB is the brake power. The propulsion coefficients (wake fraction WT, thrust deduction factor t, relative rotative efficiency ηr, and quasi-propulsive efficiency ηD) are compared between the experimental and numerical predictions. Good agreement between the prognosis based on model tests and full-scale trial data is achieved. The CFD prediction also agree well with the experimental prognosis, especially the results obtained with the anisotropic (seven equations) turbulence model RST. This result is mainly explained by the fact that the RST model allows for a more accurate and detailed resolution of the hull wake features. Regarding nominal wake in model scale conditions, this is illustrated by Figure 3 and Figure 4 for the sections at the propeller plane and ESD location, respectively.
Since the RST model solves seven equations for turbulence transport instead of two used by the k-ω SST, it carries considerable computational overhead. In addition to that, the solution with the RST model may experience stability issues, and it is, therefore, desired to initialize it with a converged k-ω SST solution. For these reasons, the RST model becomes rather expensive in the design exploration studies involving many repetitive runs. Therefore, in spite of its limitations and somewhat lower accuracy, the k-ω SST was used in the ESD design studies conducted in the present work. In order to reduce the computational effort even further, it was decided to neglect the presence of free surface in self-propulsion calculations.
The computation domain was restricted by the symmetry plane at the level of design waterline, while the resistance components due to wave making and dynamic vessel sinkage and trim were introduced, along with other additional resistance corrections, into the force balance equation as follows.
where TBX is the axial component of the propeller thrust (accounts for vessel trim and, if present, propeller shaft inclination), Rts is the ship resistance with an operating propeller (includes contributions from hull, rudder, appendages, and ESD). ∆R is the correction accounting for resistance contributions that are not modelled explicitly in the CFD model (in the present case, tunnel thruster, bilge keels, aerodynamic resistance of superstructure, and resistance due to wave making), and ε is the tolerance with which the self-propulsion condition is satisfied (in the present calculations, it was set to 0.5% of propeller thrust TB).
The validity of the assumption about negligible effect of the free surface on propeller inflow is dependent on simulated conditions. In the present case of design speed and draught, the influence of a free surface was very small, as illustrated by Figure 5, which shows the wake fields on the propeller plane computed with and without a free surface. In this case, the relative difference in averaged axial coefficient of nominal wake, WTN, amounted to about 1.5%. For shallower sitting vessels and higher Froude numbers, this may not be the case, so that the said assumption needs to be checked in each case.
Comparing the wake field computed in model scale (Figure 3) and full scale (Figure 5), one can notice a significant effect of Reynolds number (scale effect). Thus, an ESD installed behind the ship hull would operate in very different conditions on a full scale and on a model scale. Since the ultimate goal is to design an ESD for the full-scale ship, it is natural to use the full-scale CFD setup. At the same time, it needs to be cautioned that uncertainties associated with a full-scale wake prediction may, however, affect the numerical results (Guiard et al. [3]). They are primarily related to the resolution of wake turbulence and influence of hull roughness. Separate tests were performed in the present study to assess the influence of the turbulence model on the predicted magnitude of the scale effect on a nominal wake field. Calculations were done on a model scale and full scale using the k-ω SST model, the RST high-Re model, and the RST 2-Layer (All Y+) model. The relative differences in a nominal wake fraction WTN between full scale and model scale cases amounted to −31%, −30%, and −29%, respectively. The patterns of predicted full-scale wakes were also found quite comparable between the turbulence models. Nevertheless, in view of the known uncertainties and lack of direct validation data for full-scale wake fields, experimental verification of the numerical ESD design is still very important.
4. Design Exploration
The approach used for the design of PSS implies systematic variation of selected geometrical parameters to study their effect on vessel propulsion efficiency. These parameters include:
Fin geometry parameters—fin radius at the tip (determines fin length), distributions of chord length, thickness, pitch, and camber of fin cylindrical sections (chord length and thickness distributions are assumed identical for all fins, while pitch and camber distributions are individual for each fin), and the fin section profile (the same normalized profile applies along the fin span, and for all fins);
Fin installation parameters—position of PSS plane, number of fins, angular positions of fins, and fin installation angles (angles about the fin reference line that passes through a fin root section and is perpendicular to the propeller shaft axis).
The main idea behind the present design workflow is to provide user-driven design exploration with partial automation of some optimization steps. Clearly, the initial number of design variables is very large, and some of their values, or ranges of interest, can be defined from the experience. A limited number of preliminary calculations can also narrow down the design space considerably, so that only the most important parameters and most promising ranges are left for the formal optimization exercise.
For the present study, the PSS configuration with three fins have been selected. The fin geometry was produced using the SINTEF Ocean propeller design/analysis software AKPA, where fin geometry was defined in a parametric form, after the fashion of the conventional propeller blade definition. The Wageningen Duct 7 profile with thickness increased toward the trailing edge used as the basis fin section. This profile would also eventually be suitable to design a shroud connecting the tips of PSS fins. Thickness and camber distributions along the chord were presented in normalized form, so that one can apply the desired maximum thickness-to-chord and camber-to-chord ratios. The initial value of fin radius was given equal to Rf/Rp = 0.923. The initial distributions of chord length, pitch, and camber along the span were assigned as constant functions. This preliminary configuration was meant to eventually serve the purpose of both the PSS (open pre-swirl stator) and PSD (ducted pre-swirl stator) designs. Thus, produced fins were converted to CAD geometry parts in the 3D-CAD tool of STAR-CCM+. As mentioned in the Introduction, only the open PSS configuration was explored further in this study. In 3D-CAD, a number of design parameters were defined, including the position of the PSS plane, the angular positions of fins, and fin installation angles. These parameters were exposed to the STAR-CCM+ solver, and they were used in the design exploration studies with the initial fin geometries. CFD calculations to determine self-propulsion performance of the ship equipped with ESD were done in full-scale conditions. Once the best values for each parameter were established, which resulted in maximum predicted power savings by the PSS (PSS-Var-1), we returned back to the AKPA software to modify chord length, pitch, and camber distributions, in order to align each fin with local flow and minimize separation, while still producing the required amount of pre-swirl on the propeller. The length of fins was increased to Rf/Rp = 1.077, while fins were tapered toward the tip, and tip rounding was applied. With the modified geometry of the fins, a new round of design exploration exercises has been undertaken, varying only the design parameters responsible for the fin installation angle, in a much narrower range than at the first step. The described loop was repeated several times, before the final geometry of the PSS fins was established (PSS-Var-5), which satisfies the criteria of desired power saving (about 4%) and alignment of fins with the flow. This allowed avoiding significant flow separation. After the preliminary design (PSS-Var-1), the fin installation angles remained nearly unchanged with the following fin geometry iterations, which indicates that reliable values of these parameters were found. An overall flowchart illustrating the described design workflow is presented in Figure 6.
Table 2 shows the main particulars of the ship and propeller for which the retrofit PSS design was carried out. Table 3 presents the design conditions. Figure 7 illustrates the evolution of PSS design in the process of design exploration, according to the described method. Only the “final” designs of the three design families (groups of designs with similar design properties) are presented in this figure. The main properties of these designs are reduced in Table 4. In total, about 70 design alternatives grouped in six design families have been evaluated. As mentioned above, the distributions of pitch and camber are variable along the fin span, and they are derived individually for each of the three fins. Table 5 shows the results of the CFD evaluation of the three selected PSS designs. It can be seen that all three designs offer power savings of more than 3%. However, the variants Var-3 and Var-5, featuring longer and thinner fins with tapering towards the tip, allow for greater power savings, which is about 4%. The pre-swirl action of the PSS can be judged from the values of tangential velocity Vt/V, which are presented for the three slipstream sections in the last three rows of Table 5. The section “Sect 1” is located immediately upstream of the propeller (X/Dp = 0.1 from propeller plane), section “Sect 2” is located in the middle between the propeller and rudder (X/Dp = −0.246 from propeller plane), and section “Sect 3” is located downstream of the rudder (X/Dp = −1.308 from the propeller plane). The tangential velocity is averaged over the slipstream section area. Positive tangential velocity is in the direction of propeller rotation. One can see that, at section “Sect 1,” in the wake of the ship without ESD, the averaged amount of swirl is quite close to zero, since the tangential velocities of an opposite direction on the two sides of the ship tend to cancel each other out.
The tangential velocity induced at this section by the propeller is very small. At the section “Sect 2,” the slipstream is swirled in the direction of propeller rotation by the action of the propeller. Positive averaged amount of swirl remains at section “Sect 3” while it is reduced by 70% by the presence of a rudder. Installation of PSS results in an increase of negative tangential velocity (pre-swirl) in front of the propeller, and reduction of positive tangential velocity at the sections downstream of the propeller and downstream of the rudder.
The assessment of swirl alone is representative of the recovery of kinetic energy associated with tangential flow, but it is not sufficient for the analysis of ESD performance, since an ESD acts on the axial flow. For example, one can see that all ESD designs presented in Table 5 result in an increase of the axial wake fraction WT, i.e., they slow down the inflow on the propeller. Therefore, the operation point of the propeller (“effective” advance coefficient, JA) moves toward heavier loading. The increase of propeller thrust and torque coefficients for the cases with PSS is, thus, due to both the pre-swirl and heavier axial wake produced by the ESD. A better adaptation of PSS fins to the local flow implemented in the design variant Var-5 allows for a slightly greater power savings than in the variant Var-3 due to the reduction of axial wake on the propeller, which moves the propeller operation point in the direction of higher efficiency. This is in spite of the fact that the design Var-5 produces less pre-swirl, and, hence, recovers less tangential flow energy compared to the design Var-3. The above result illustrates the importance of careful adaptation of the ESD to the flow in the system of the ship hull and propeller.
The averaged flow characteristics presented in Table 5 are representative of the integral performance of an ESD. More detailed insight into the influence of ESD on the flow around the propeller can be obtained from the distributions of the tangential velocity presented as colored vectors in Figure 8, and distributions of the axial velocity presented as contours in Figure 9. These are instantaneous images corresponding to the propeller key blade position at 0 degrees (12 o’clock). One can notice the reduction of a positive swirl produced by the PSS on the portside of the vessel, where the PSS is installed. While the PSS is installed on the portside, it also has a favorable effect on the pre-swirl on the starboard, which is seen from the reduction of a positive swirl near the hub, and from the increase of a negative swirl at the outer sections. The axial velocity component undergoes smaller changes by the action of PSS compared to the tangential component. Its overall distribution remains similar to the case without PSS, but an increase of flow retardation (lower axial velocity) in front of the propeller is clearly visible.
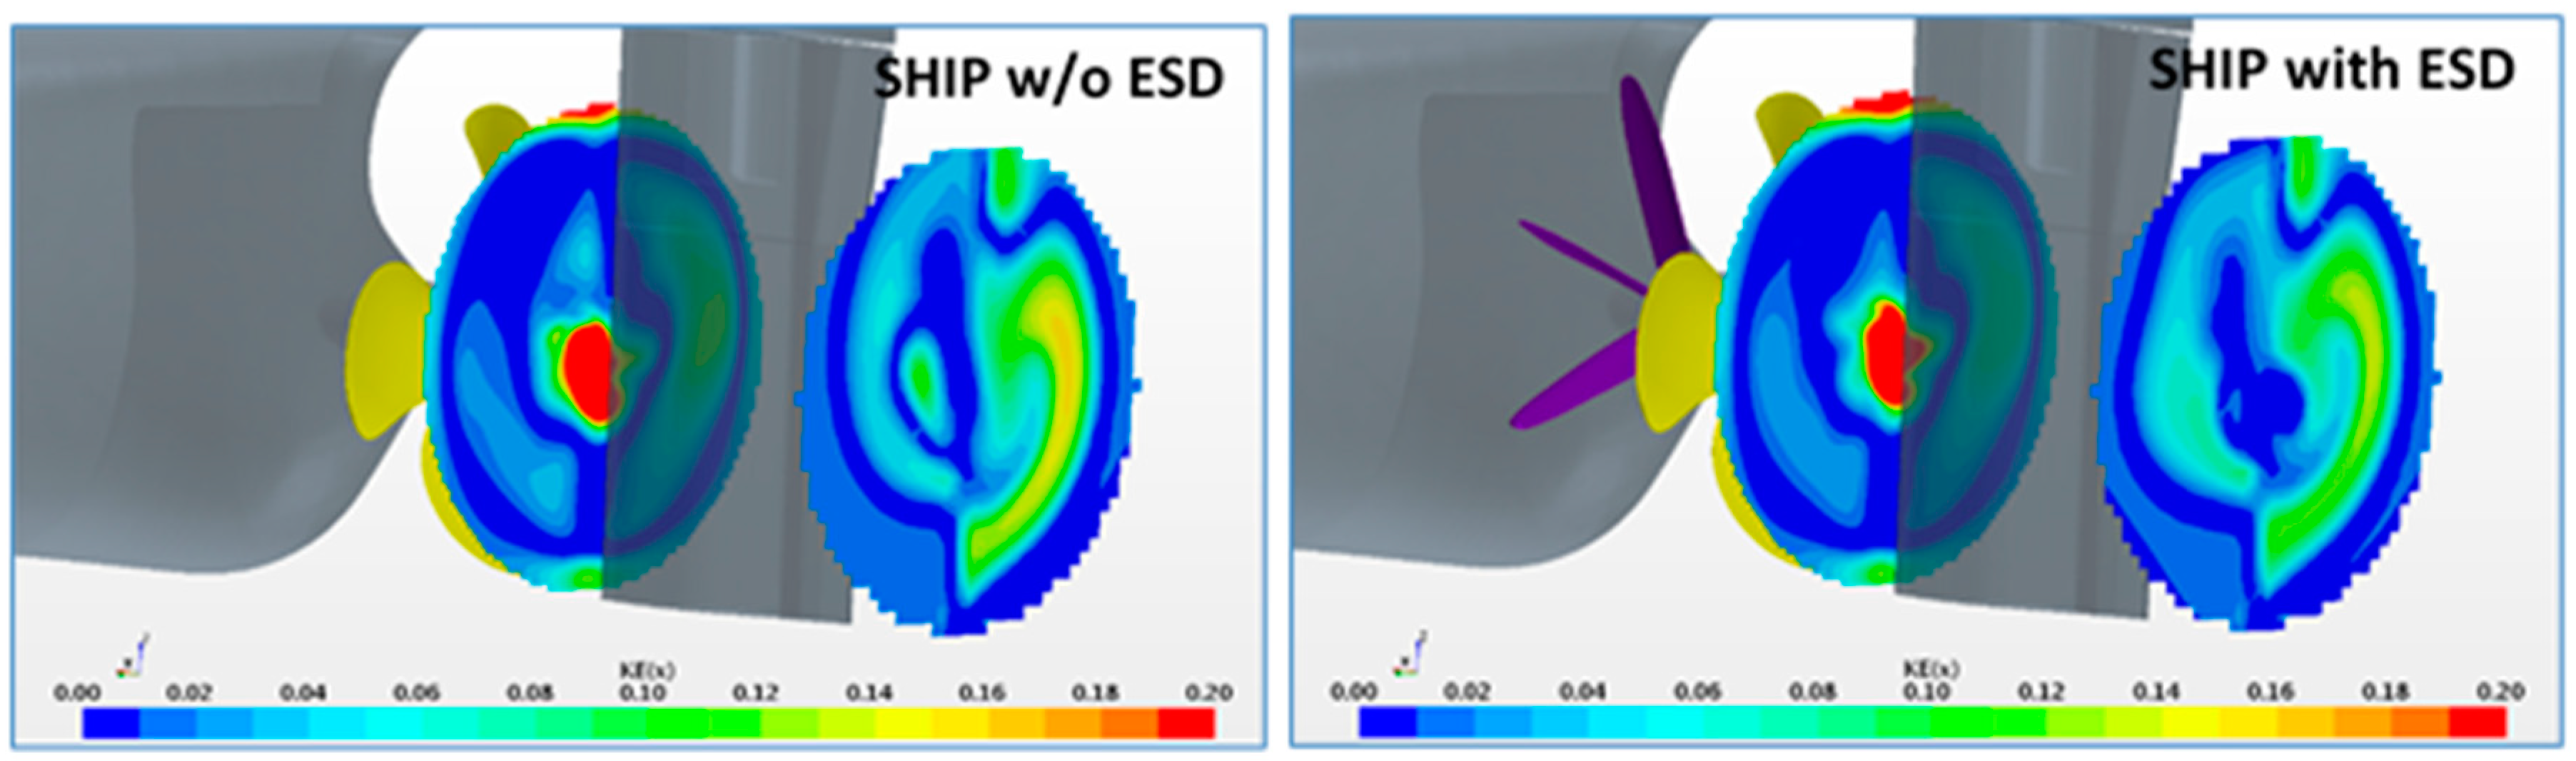
In order to present a more complete and formal analysis of energy savings, one can consider the distributions of kinetic energy associated with the transverse and axial flows. Such distributions are presented in dimensionless form for the downstream sections “Sect 2” and “Sect 3” in Figure 10 and Figure 11. The corresponding averaged values of kinetic energy are given in dimensionless form in Table 6. Both the transverse flow energy and axial flow energy are reduced by the action of the PSS, which results in power savings in the whole system, as presented above. The largest portion of energy saving comes from the utilization of tangential flow energy, in particular, energy contained in the portside of the flow. However, the contribution from the axial kinetic energy is also important, as its amount is about one-fourth of total energy saved in the section between the propeller and rudder, and more than one-third of energy saved in the section downstream of the rudder.
The ratio between KE(x) and KE(tr) is different at these two sections. At section “Sect 2,” which is downstream of the propeller, the amount of transverse flow energy is greater than the amount of axial flow energy, but at section “Sect 2,” the amount of axial flow energy is slightly larger.
This is explained by the action of rudder that destroys the swirl of propeller slipstream and utilizes a significant portion of tangential flow energy. In the presence of PSS, the amount of swirl coming on the rudder is reduced, and, thus, the rudder can utilize less rotation energy. It results in an additional small penalty seen in the increase of rudder resistance (see Table 5). From the kinematics standpoint, it is explained by the reduction of local angles of attack of the rudder section, and, hence, reduction of section lift, which counteracts drag. In the present case, with the PSS-Var-5, the increase of rudder resistance amounted to about 3.75% compared to the case without PSS. The proportion of rudder resistance in the total resistance of the ship does not change significantly, and it amounts to approximately 4.5% in the present case. From the analysis of flow kinetic energy, one can conclude that there is still potential for further energy savings through a better utilization of both the axial and tangential flows. In particular, the area downstream of the propeller hub holds a considerable amount of both KE(x) and KE(tr). It can be utilized by the implementation of post-swirl measures such as Propeller Boss Cap Fins (PBCF) or modification of the rudder design.
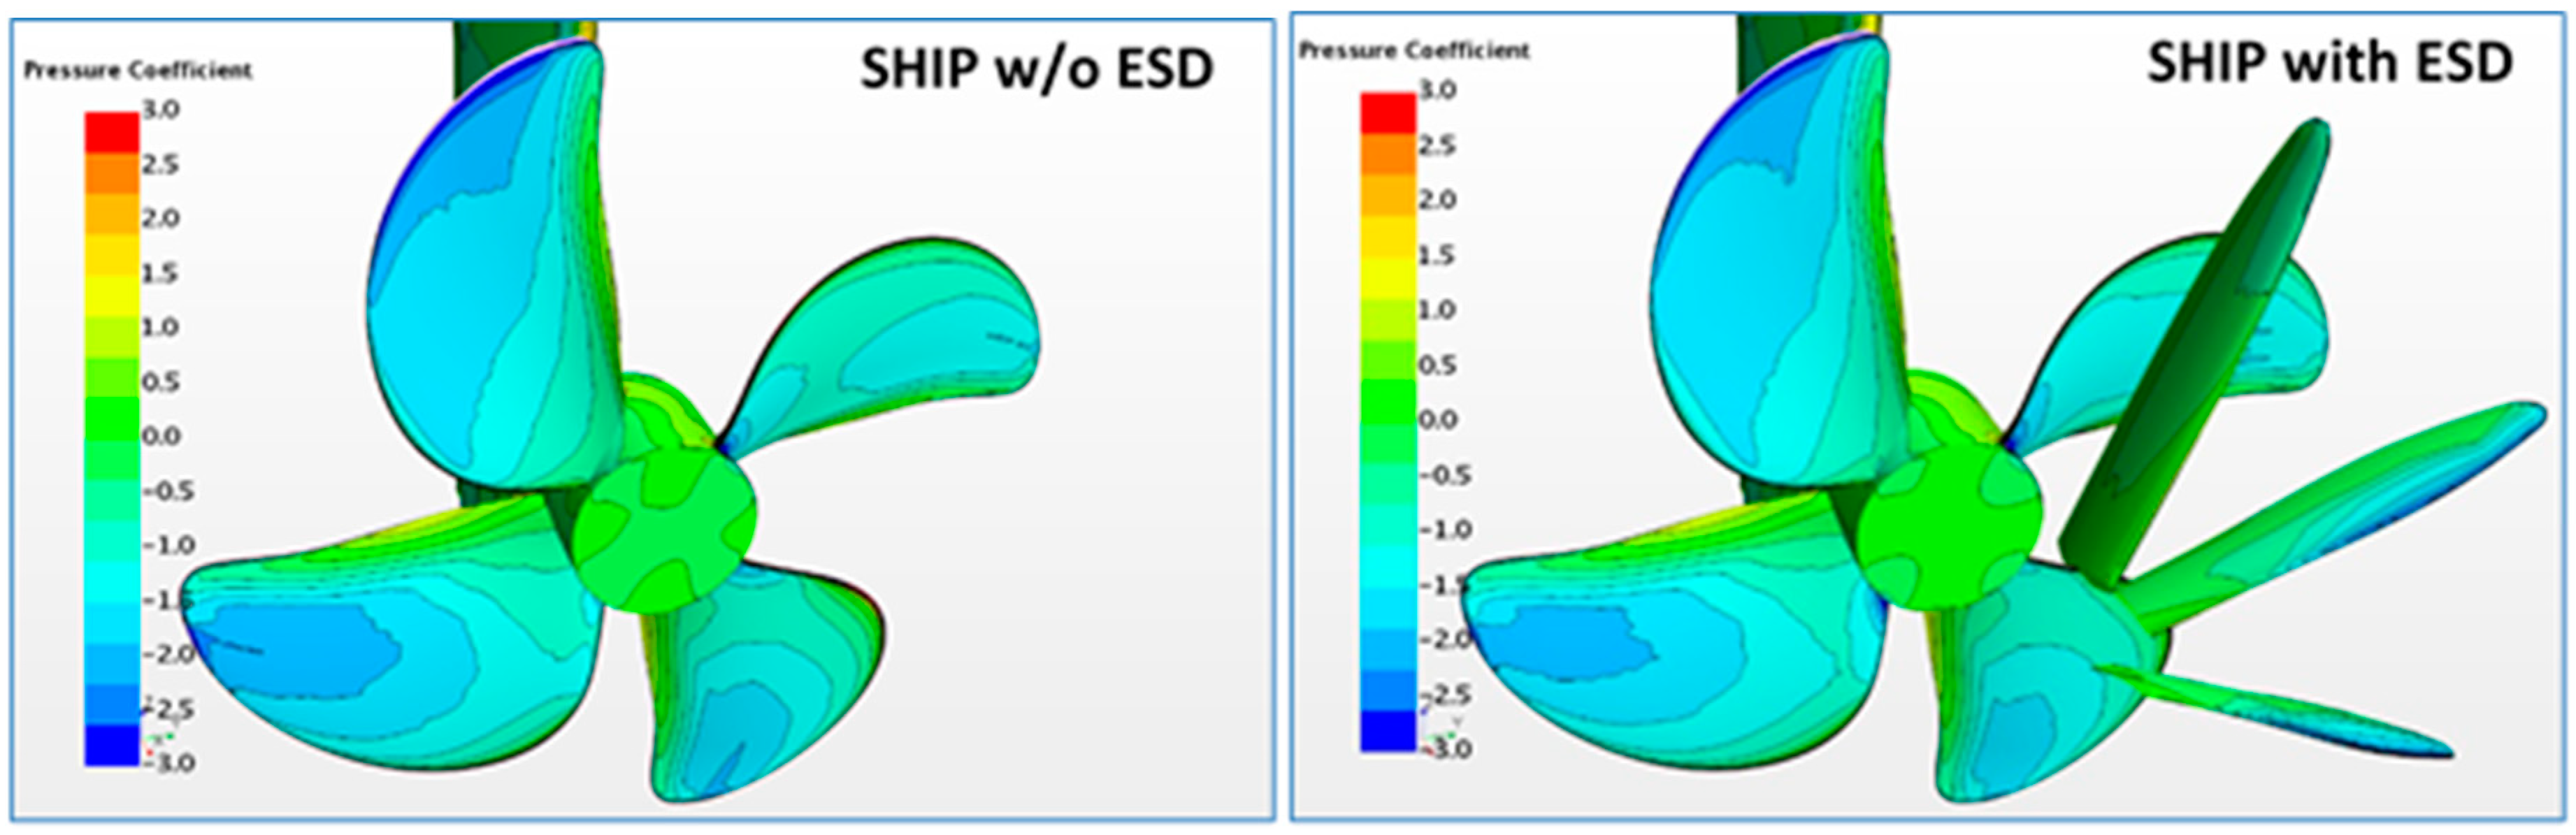
Using properly designed PBCF, one can expect additional power savings of an order of 1%–1.5%. These estimated figures are lower than power savings achieved reportedly with PBCF on propellers without pre-swirl ESDs (Mewis [2]) since part of the available energy is already utilized by the PSS. Figure 12 shows pressure distribution over the aftship, constrained streamlines on the hull, and flow streamlines released from the propeller hub (colored by vorticity magnitude) with and without PSS. In particular, one can notice that, in presence of the PSS, the strength of the hub vortex is reduced, and the trajectory of the vortex is more aligned with the shaft axis. The analysis of pressure distribution on the hub reveals a more uniform pattern when the PSS is installed. The pressure reduction in the hub vortex core is also considerably lower than in the case without ESD, even though propeller loading is heavier (see Figure 13). This is a favorable result as far as the rudder operation is concerned.
The axial wake fraction, WT, is derived based on propeller open water characteristics using the thrust identity method.
where JV is the advance coefficient defined based on ship speed, and JA is the advance coefficient where the thrust identity KT0 (J) = KTB (J) is met, with KT0 being the propeller thrust coefficient in open water and KTB being the propeller thrust coefficient behind the hull. The thrust deduction factor, t, presented in Table 7 is calculated by considering the ESD as a part of the propulsor.
Table 7 presents the propulsion coefficients of the vessel without ESD and with the designed PSS derived from self-propulsion simulations at the three ship speeds around the design condition.
The propulsion efficiency, ηD, represents the ratio between the effective power, PE, and shaft delivered power, PD, at the vessel self-propulsion point.
It is observed that the installation of PSS results in an increase of axial wake fraction of the order of 18%–21%, and an increase of thrust deduction of the order of 5%–6%. The relative rotative efficiency remains almost unchanged. The increase of propeller loading due to heavier wake and effect of pre-swirl, as discussed above, results in a larger thrust deduction factor. The predicted trends in changes of propulsion factors due to the installation of ESD correlate well with the findings from the studies by other authors done with similar installations, e.g., (Dang et al. [4]), (Kim et al. [5]).
Table 8 presents relative changes due to the installation of PSS in the propeller rate of revolution, shaft delivered power, and propulsive efficiency for the same speed range. These figures confirm that comparable energy savings are achieved by the designed PSS for all vessel speeds, in the range of interest around the design condition.
In order to evaluate the influence of PSS on the cavitation characteristics of the propeller, additional comparisons were performed for the design speed of 14 kn as shown in Figure 14 and a higher speed of 16 kn as presented in Figure 15. Since propeller cavitation is not evident at the design draught, these comparisons were done for the ballast draught where the cavitation number was estimated based on propeller submergence at even keel, without free surface deformation.
5. Experimental Investigation
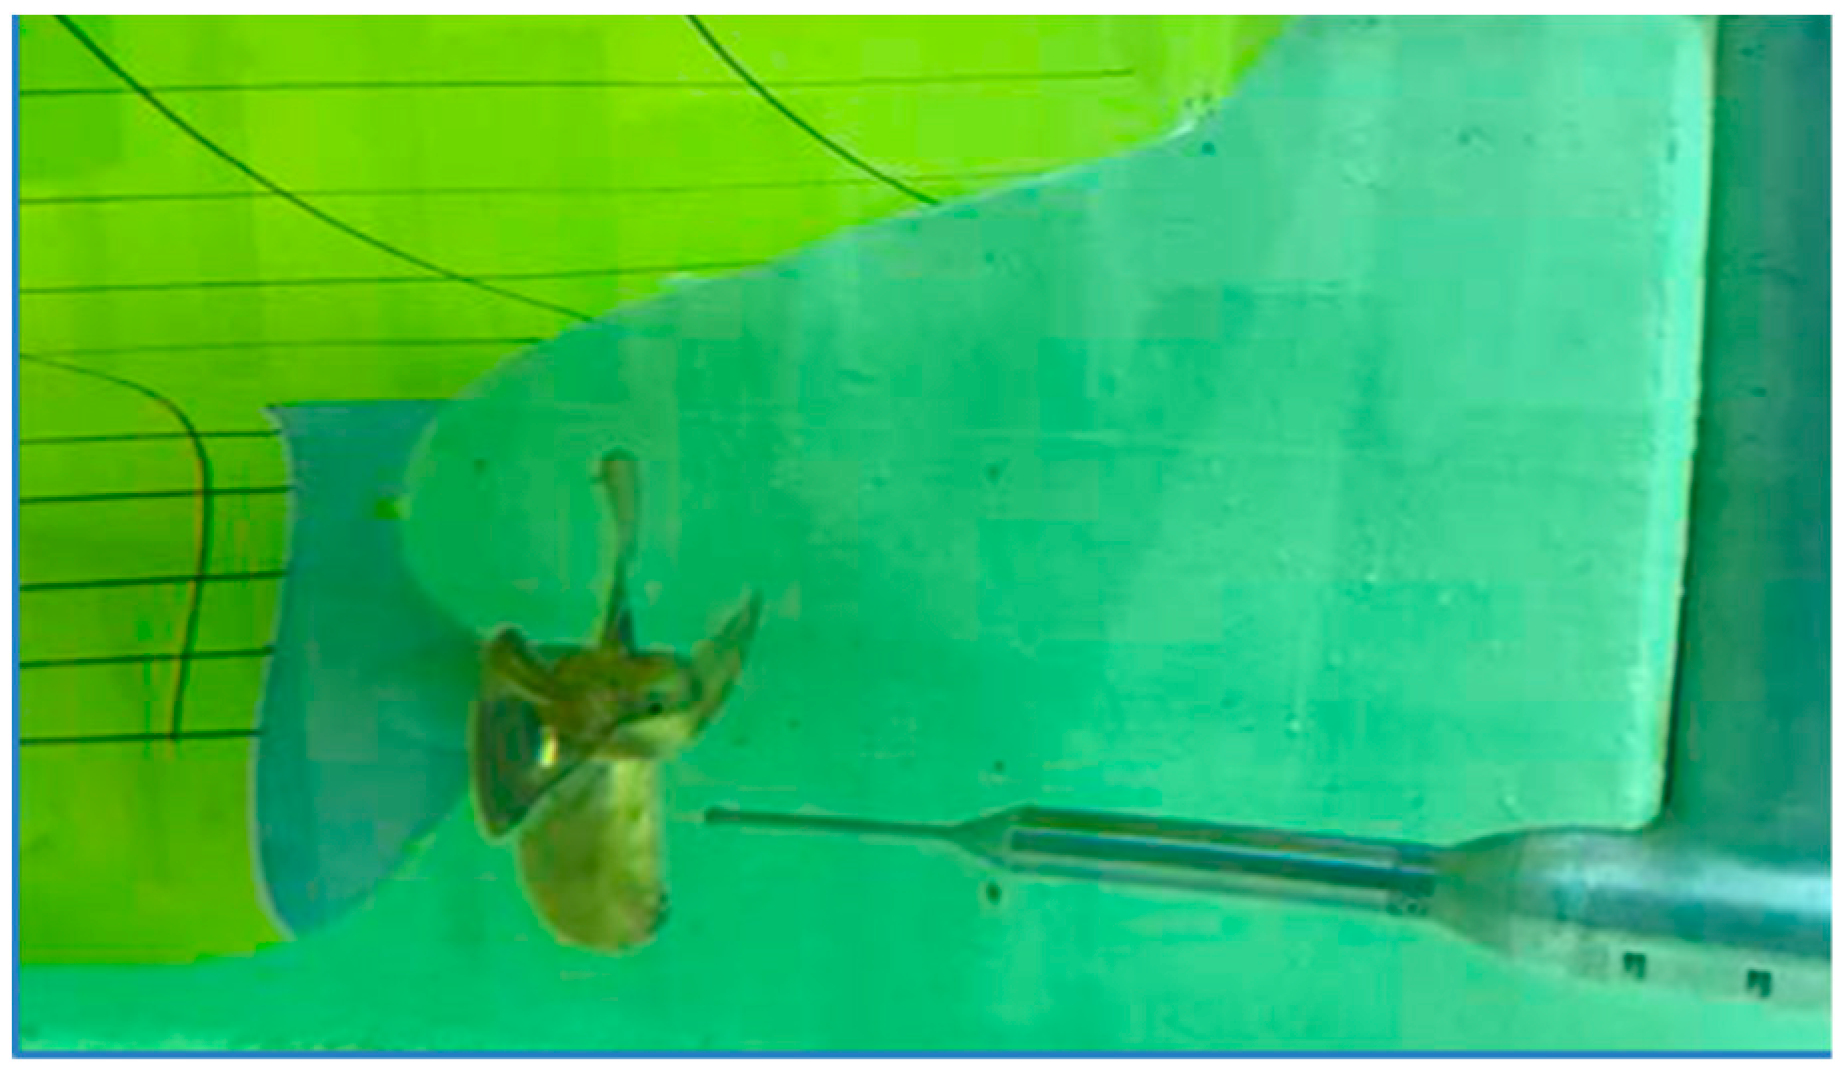
In the wake survey tests, the setup shown in Figure 16 was used. The rudder and rudder headbox were removed from the setup. In the measurements with an operating propeller, the model was self-propelled, according to the conditions defined from the propulsion test at the vessel speed and draft corresponding to the design point: Vs = 14 (kn), T = 11.846 (m). The data acquired from the first phase of the test campaign were used in the validation studies with the numerical method. Selected validation results are presented in Section 3 of this paper. After the ESD design exploration studies were completed, and the design variant PSS-Var-5 was chosen, the second phase of the test campaign was realized to verify power savings predicted from the numerical investigations. Figure 17 shows the propulsion test setup with the designed PSS. In addition to the resistance and propulsion tests, 3D wake measurements were repeated with the PSS installed, for the same locations as in the first phase, except the ESD plane. As an example, Figure 18 shows wave profile photographed during resistance tests with PSS mounted at 14 kn.
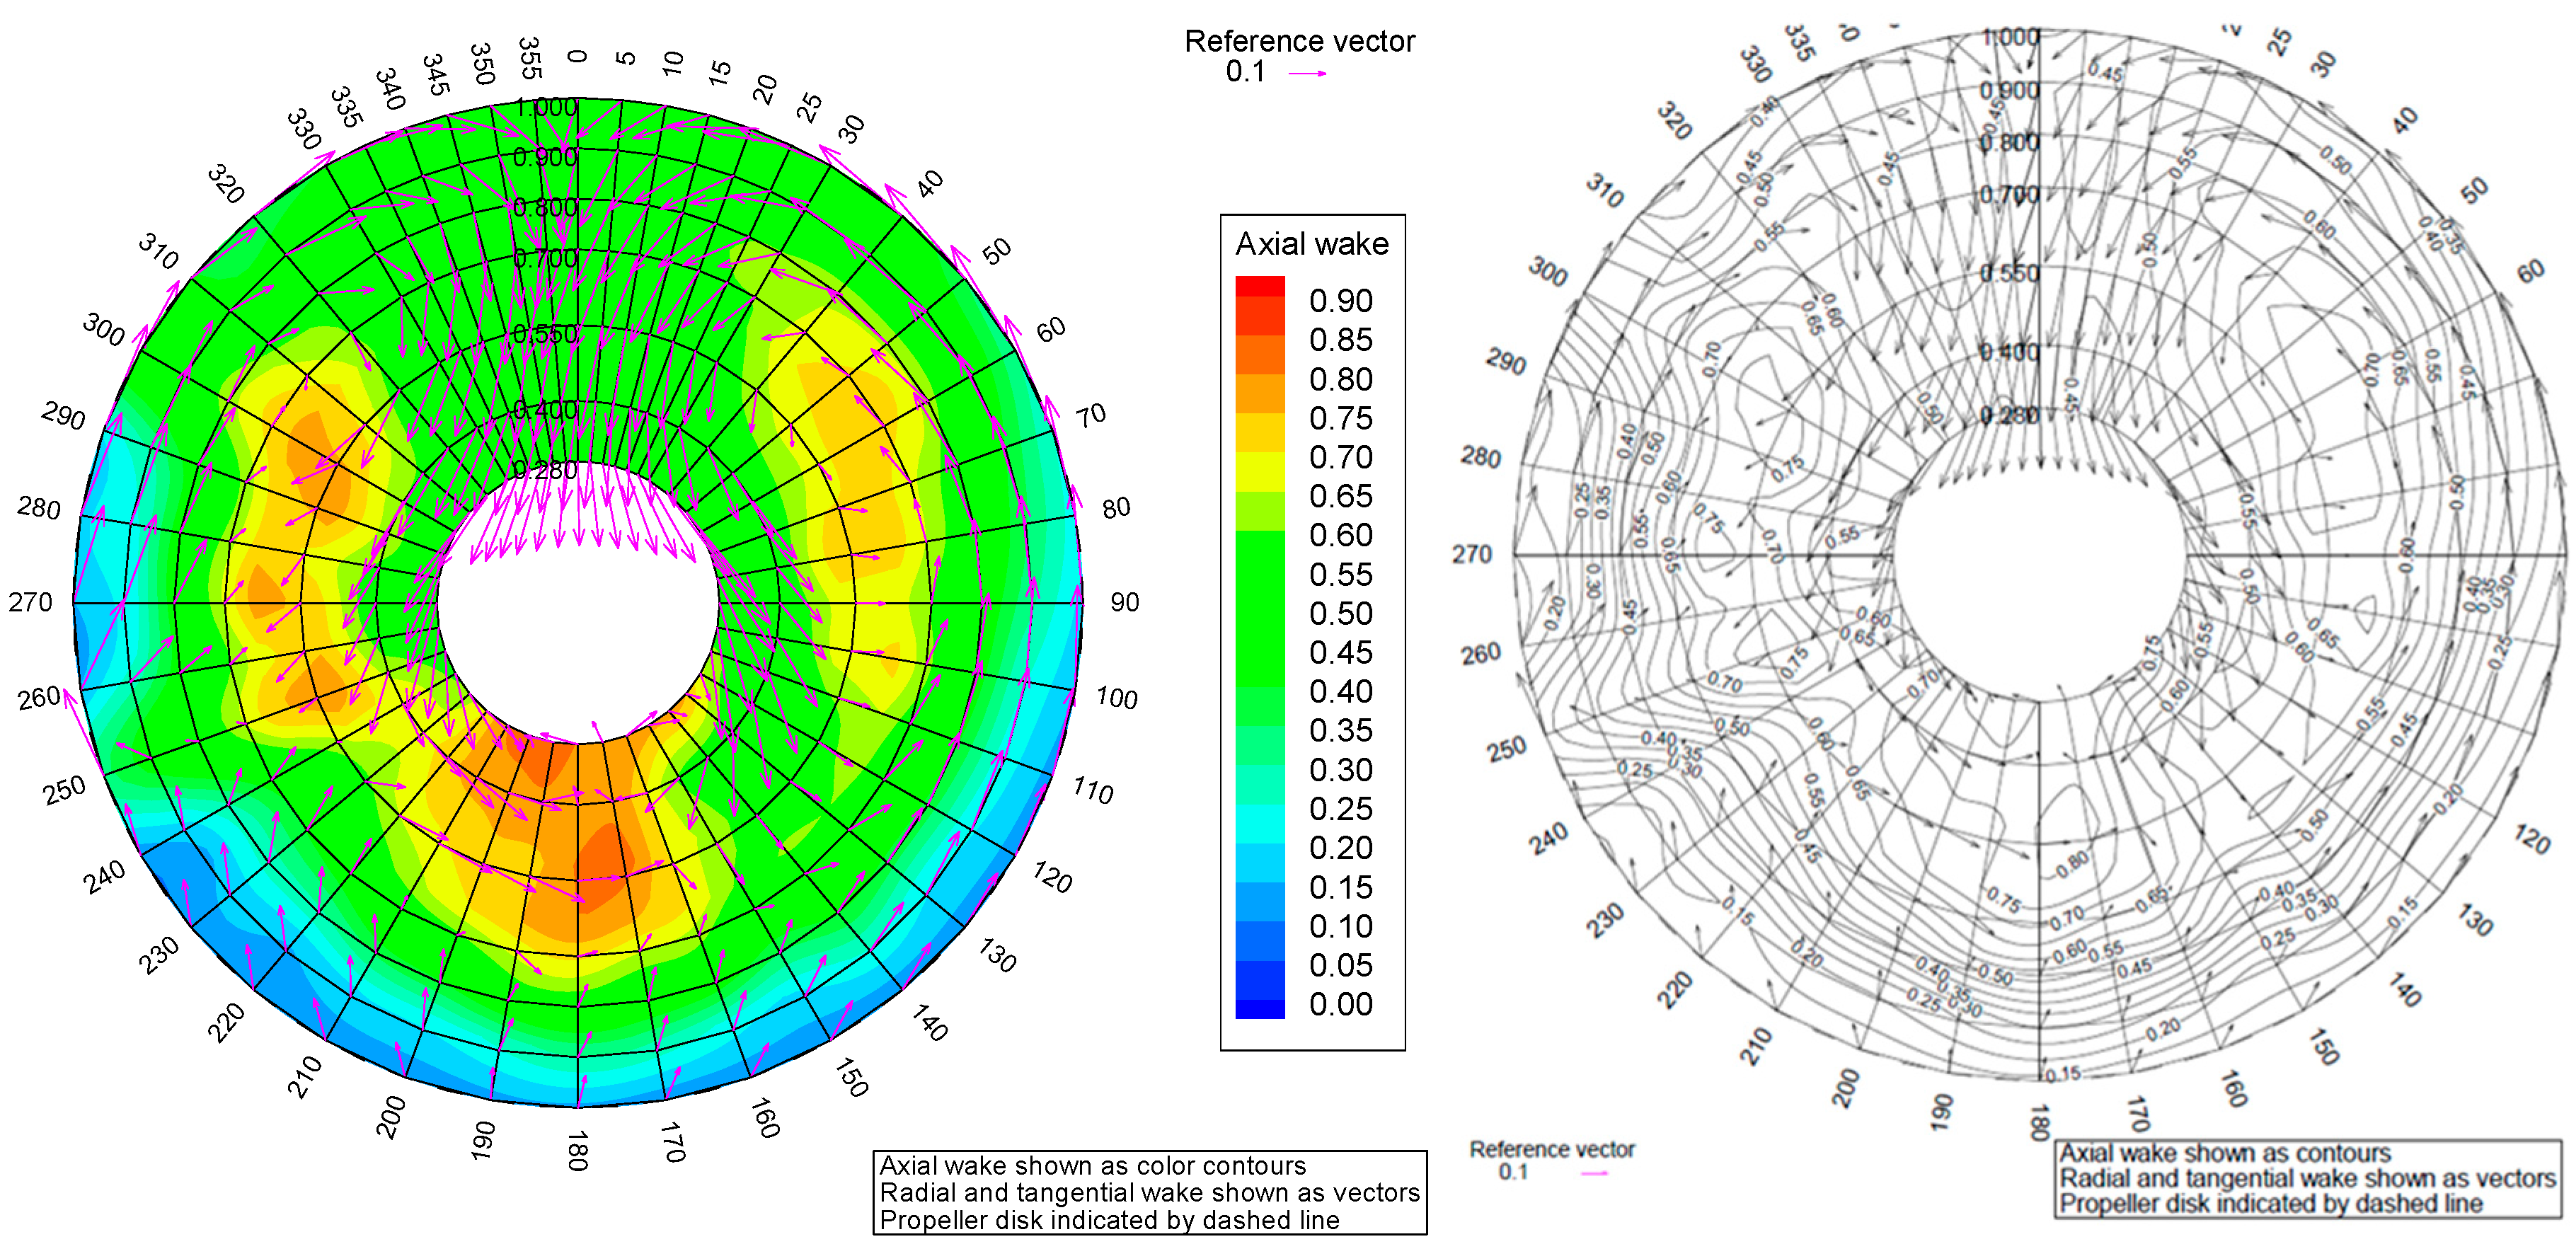
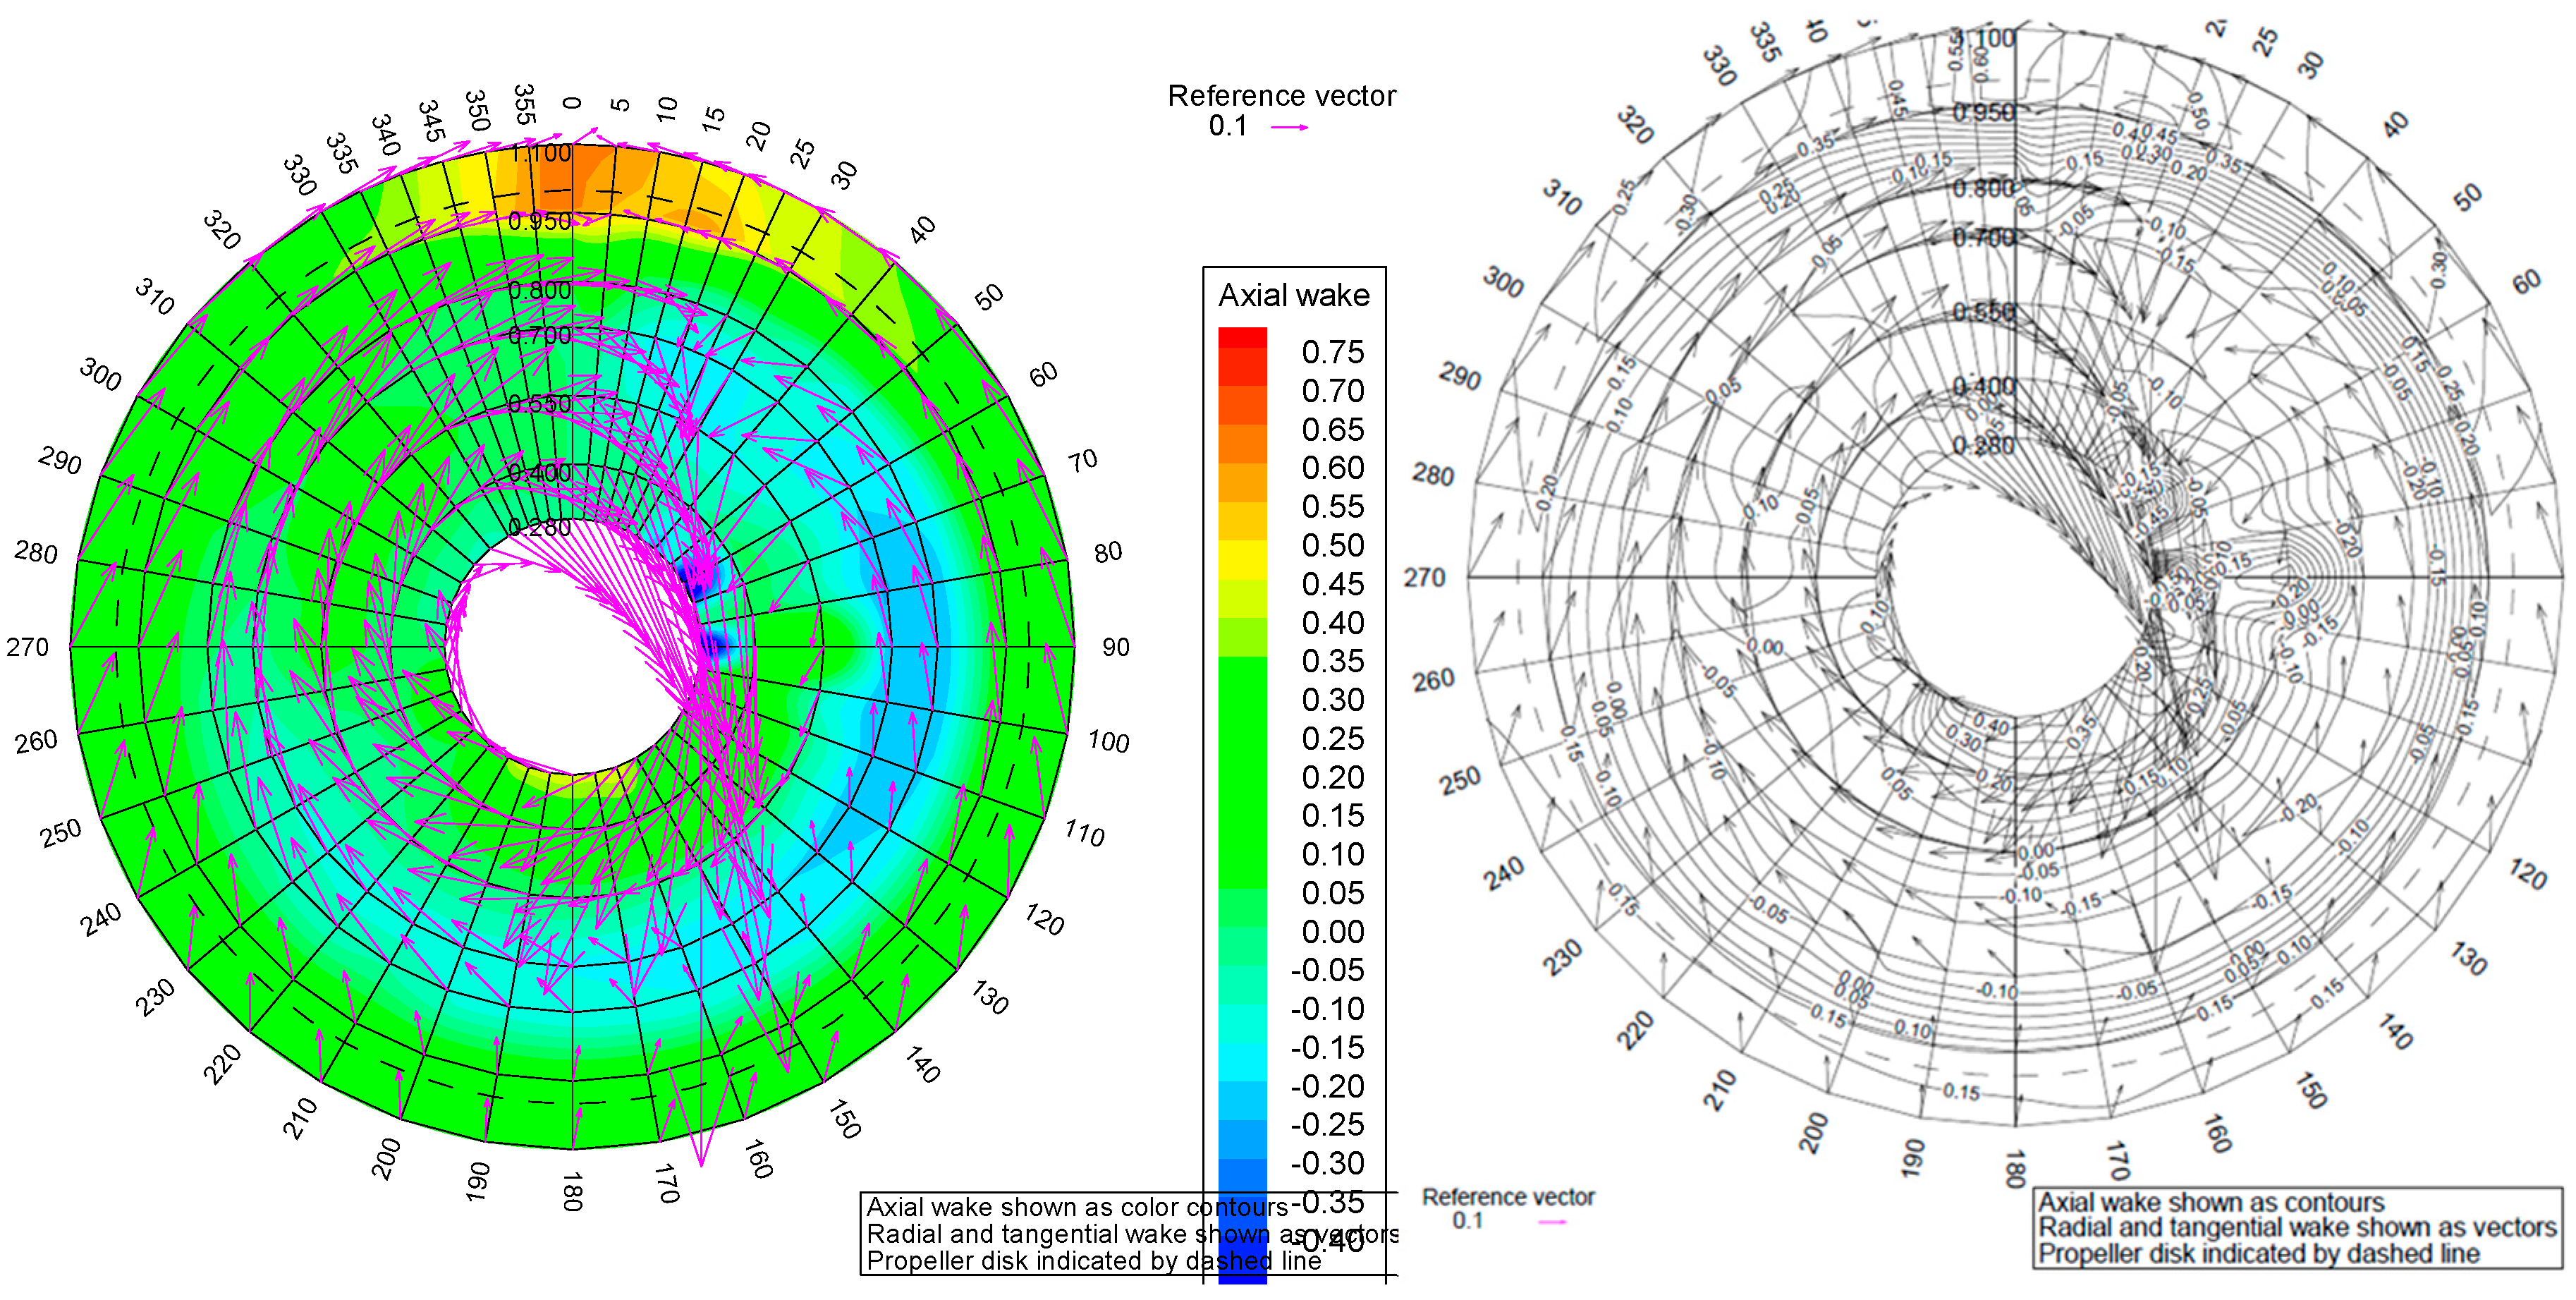
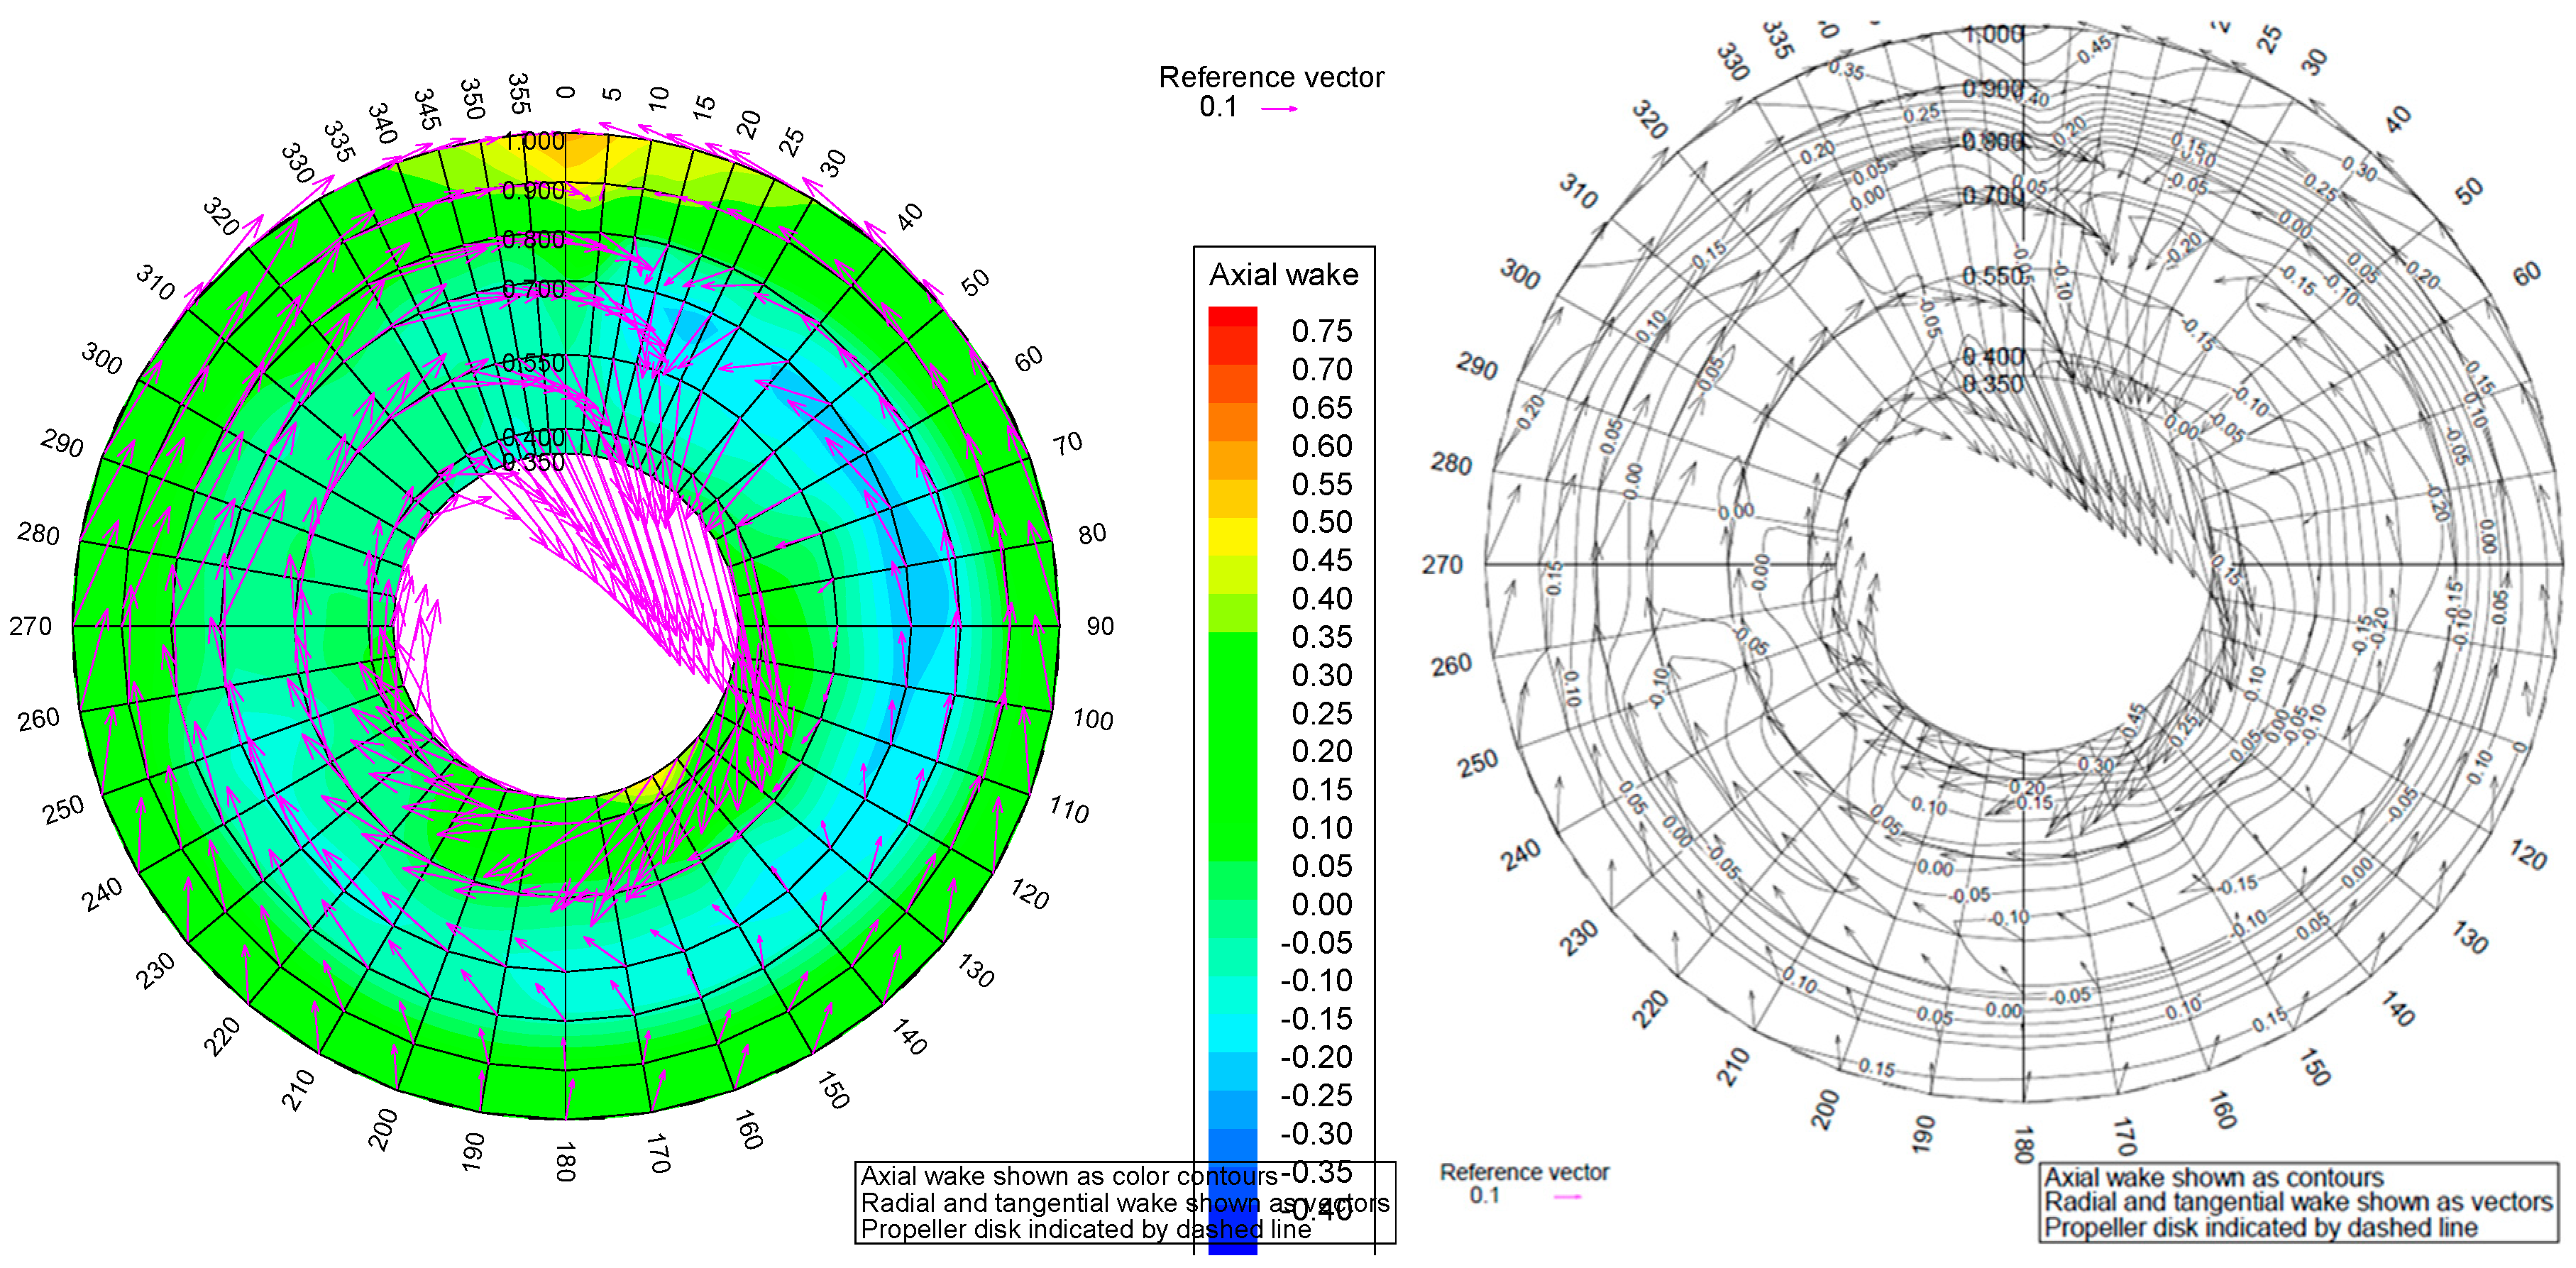
Figure 19 and Figure 20 show 3D nominal wake survey at the propeller plane without and with PSS, respectively. Fins installation angles in this angular coordinate system are 247.5°, 293°, and 338°. Fins are clearly affecting the axial, tangential, and radial velocities as intended, which are discussed earlier in this publication.
Figure 21 and Figure 22 show effective 3D wake measurements behind the working propeller, midway between the propeller and rudder leading edge, without and with PSS, respectively. Additionally, in this case, the presence of fins affect axial, tangential, and radial velocities. The propeller stream results in strong tangential flow.
Results of 3D wake survey without PSS at a rudder stock plane with working propeller are presented in Figure 23. Figure 24 shows results of the 3D wake survey at a rudder stock plane with a working propeller and mounted PSS. In this survey, measurements included the area close to the propeller centerline, where strong radial and tangential velocities are present. This indicates a strong hub vortex. This leads to the conclusion that, even with presence of PSS, there can be some improvement potential by installing propeller boss cap fins (PBCF). The bilge keel vortex can still be traced on the starboard side, even with a working propeller. A comparison of results without PSS mounted (Figure 23) and with PSS (Figure 24) shows clearly the effect of PSS fins on axial, radial, and tangential components of the wake while the propeller is running.
6. Verification of PSS Design by Model Tests
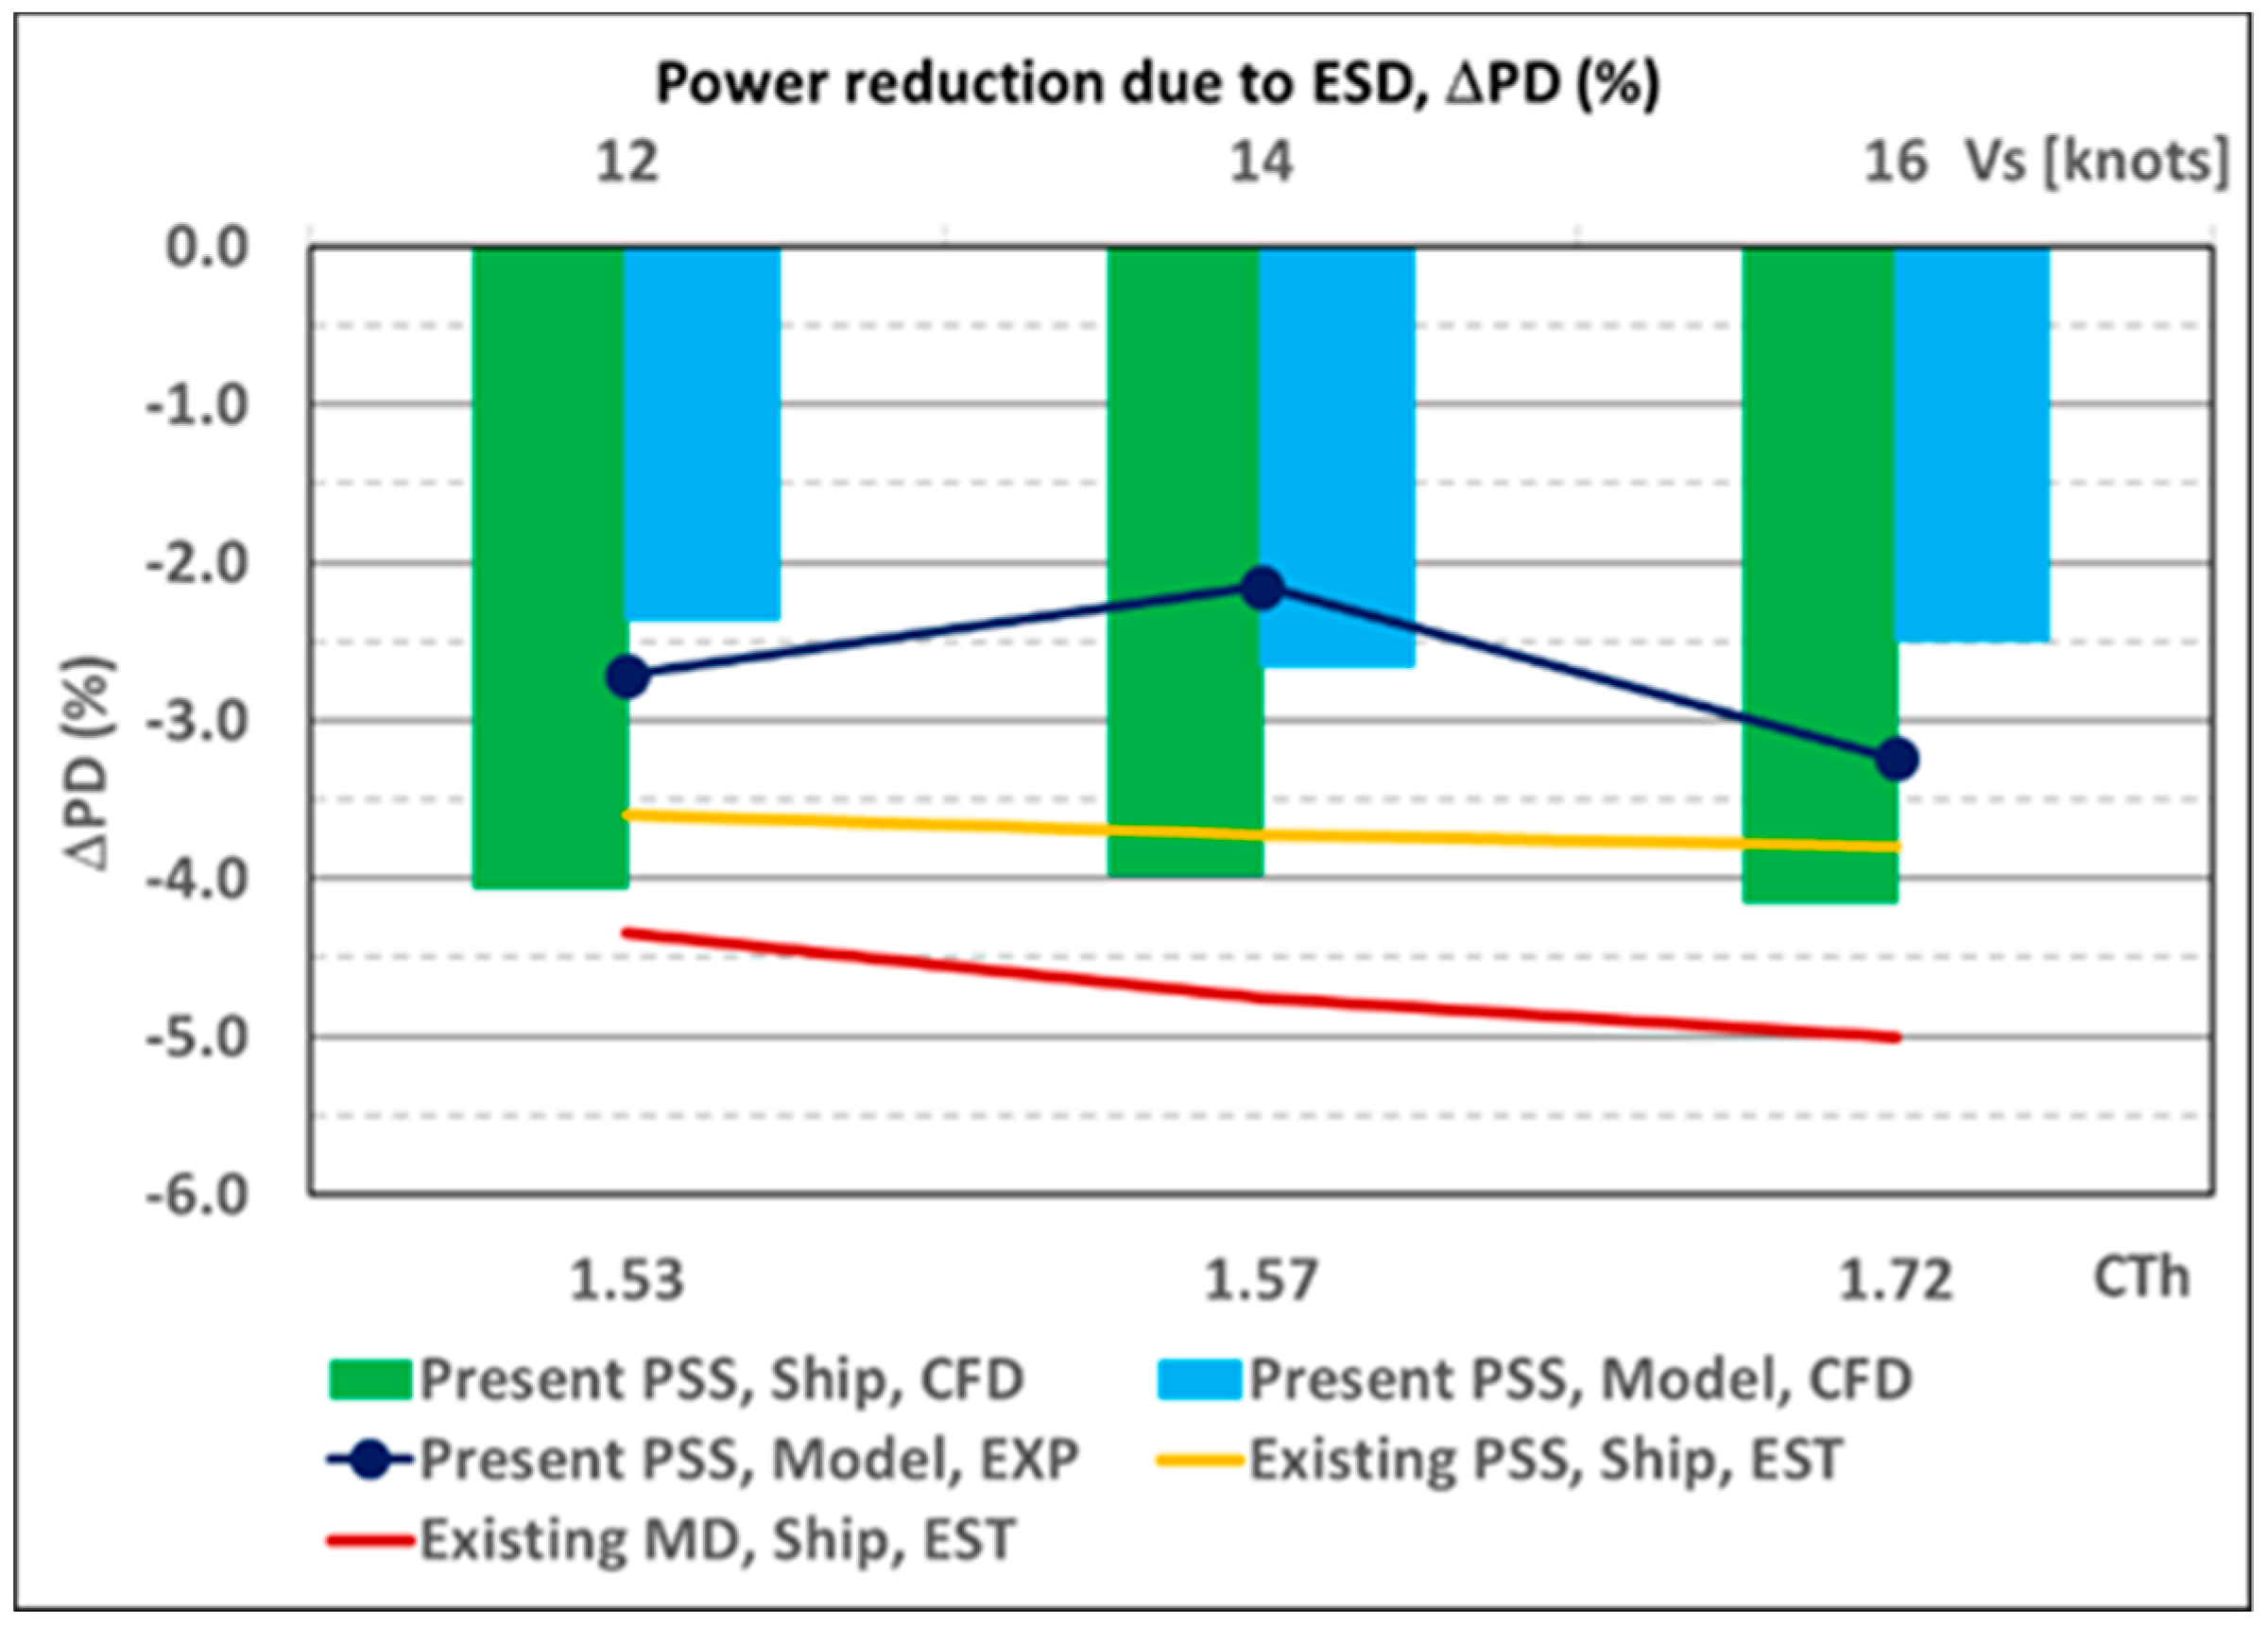
Figure 25 shows the power savings achieved with the PSS installation on a model scale (CFD and test results) and on a full scale (CFD results). For comparison, statistical data regarding the full-scale performance of PSS and PSD (Mewis Duct®) installations are also plotted using the data presented in Mewis [2].
It can be seen that, in the model scale, CFD calculations with the designed PSS predict 1.5% lower power savings than on a full scale. On average, the results are 2.5% in the model scale vs. 4% in the full scale. Power savings of the same level (2.2%–3.2%) are reported from model tests. Similar conclusions about better performance of a PSS-type of ESD on a full scale was reported in Park et al. [11]. However, the mentioned work did not present the details about how the PSS was designed. With regard to the present study, a better performance of the PSS on a full scale is explained by the fact that it was designed for full-scale conditions. From the images of the vorticity field presented in Figure 26, one can see that, on a full scale, a smaller part of the ESD fin appears in the hull boundary layer compared to the model scale. The flow separation is delayed on a full scale, and, as a result of overall wake contraction, the large-scale vortices detached from bilges in the stern area shift upwards, above the shaft line, and closer to the center plane. These changes in the vorticity pattern cause differences in the distribution of tangential velocity between the model scale and full-scale conditions. The fins of the PSS designed for full-scale conditions perform better work utilizing the tangential kinetic energy of a full-scale flow. In general, the model scale flow past the ship hull without ESD is less favorable from the standpoint of propeller efficiency, and, hence, it holds a greater potential for energy saving. However, in order to utilize it, the fins need to be adapted to the model scale wake field.
Table 9 shows the variation with the scale of propulsion coefficients for the vessel with and without ESD. In the case of the ship with ESD, the values found from the experiment are presented only for the wake fraction, WT, and relative rotative efficiency, ηr, since the thrust deduction factor, t, was defined differently in the CFD calculations (ESD is part of the propulsor, Equation (3)) and in the tests (ESD is the hull appendage). The agreement between the values of WT derived from the model test and CFD calculations in the model scale is very close. In addition, the tests and CFD calculations predict a comparable increase of WT due to the PSS installation. However, larger differences are noticed in full-scale predictions of WT. The approach employed for scaling of WT in the experimental predictions is based on the “Method B” proposed in ITTC [12] for performance prediction of ships with PSS. Since scaling of WT is an essential part of the scaling procedure, this question deserves further investigation, where CFD analyses can be of great help. CFD predictions on a full scale require more validation material. Acquiring reliable full-scale data regarding the wake field with an operating propeller is, therefore, of paramount importance.
The thrust deduction coefficients derived from the tests and CFD calculations are found to be at comparable levels. A minor increase of t on a full scale is predicted by the calculations. The installation of ESD results in an increase of t as a penalty for thrust increase. The relative rotative efficiency predicted by CFD is only about 1.3% lower compared to the experimental values. This quantity does not vary significantly with scale, and it shows a slight decrease when the PPS is installed. The presented findings from the CFD analyses justify the assumption of the scaling procedure about t and ηr being weakly influenced by the scale effect.
7. Conclusions
The interaction phenomena in the system hull-ESD-propeller-rudder and the realistic operation conditions on a full scale are essential for successful design of ship ESDs. The CFD-based approach to ESD design is, therefore, found to be an efficient and robust tool. The design workflow can be automated considerably using the design exploration tools such as the Design Manager of STAR-CCM+. It can also be used conveniently in connection with external tools such as potential propeller codes for quick geometry generation or design of wake-adapted propellers. The use of adequate optimization criteria is very important. Power savings, or increase in propulsive efficiency, predicted at the ship self-propulsion point are recommended as such criteria. The analyses of kinetic flow energy in the propeller slipstream is found to be very useful for a deeper understanding of the ESD working principle as well as a source of new ideas regarding other possible energy saving measures.
The Pre-Swirl Stator (PSS) designed in the present work with the proposed method is the result of systematic evaluation of about 70 alternative solutions. According to CFD predictions, it provides about 4% of power savings through the speed range around the design point. Additional power savings can be achieved by designing a propeller wake-adapted for the operation behind the PSS, or by installation of a post-swirl device such as PBCF (Propeller Boss Cap Fins) on the propeller hub.
The verification of the PSS design by model tests confirms power savings of 2.2%–3.2%. These numbers agree well with CFD predictions on a model scale showing 2.5% savings. A better performance of PSS on a full scale is explained by the customization of fins design to full-scale wake conditions.
The propulsion factors of the ship without and with ESD found from model tests and CFD analyses are, in general, in good agreement. The thrust deduction factor and relative rotative efficiency do not change significantly with scale. Larger differences between EFD and CFD predictions are found in full-scale values of wake fraction WT. CFD results predict a larger scale effect and stronger influence of the PSS. Since determination and scaling of WT is the essential part of the scaling procedure for vessels equipped with ESDs, this problem requires further investigations. Acquiring reliable full-scale data regarding wake field with an operating propeller is, therefore, of paramount importance for both the CFD validation and improvement of scaling methods.
Author Contributions
All authors participated in the discussions and review of the article. L.S. participated in the discussions and review of the manuscript. V.K. and K.K. wrote the article. V.K. contributed a numerical investigation and analyses. K.K. and M.N. contributed with experimental methodology, analyses, and data. S.S. contributed with set-up for numerical optimisation. K.K. contributed with project management. All authors have read and agreed to the published version of the manuscript.
Funding
This research was funded by Norges Forsknigsråd, grant number 254797. In addition, industrial partners Odfjell Management and MAN Energy Solutions provided additional funding.
Acknowledgments
The work presented in this paper has been conducted within the frameworks of the R&D Project “NorSingProp” with funding from the Joint Program in Maritime Research between Singapore and Norway, Call 2015. The “NorSingProp” Consortium includes SINTEF Ocean (Norway), Odfjell Management (Norway), IHPC A*STAR (Singapore), SembCorp Marine (Singapore), and MAN Energy Solutions (Denmark). The support received from the Research Council of Norway for the Norwegian part of the project is greatly appreciated.
Conflicts of Interest
The authors declare no conflict of interest.
References
- ABS. Ship Energy Efficiency Measures Advisory. Available online: https://ww2.eagle.org/content/dam/eagle/advisories-and-debriefs/ABS_Energy_Efficiency_Advisory.pdf (accessed on 12 December 2019).
- Mewis, F. Six Years Mewis Duct®—Six years of hydrodynamic development. In Jahrbuch der Schiffbautechnischen Gesellschaft; Bohn, A., Ed.; Schiffahrts-Verlag Hansa GmbH & Co. KG.: Hamburg, Germany, 2014; Volume 108, pp. 157–164. [Google Scholar]
- Guiard, T.; Leonard, S.; Mewis, F. The Becker Mewis Duct®—Challenges in full-scale design and new developments for fast ships. In Proceedings of the 3rd International Symposium on Marine Propulsors smp’13, Launceston, Australia, 5–7 May 2013. [Google Scholar]
- Dang, J.; Dong, G.; Chen, H. An exploratory study on the working principles of energy saving devices (ESDs)—PIV, CFD investigations and design guidelines. In Proceedings of the 31st International Conference on Ocean, Offshore and Arctic Engineering OMAE 2012, Rio de Janeiro, Brazil, 1–6 July 2012. [Google Scholar]
- Kim, J.-H.; Choi, J.-E.; Choi, B.-J.; Chung, S.-H.; Seo, H.-W. Development of energy-saving devices for a full slow-speed ship through improving propulsion performance. Int. J. Nav. Archit. Ocean Eng. 2015, 7, 390–398. [Google Scholar] [CrossRef] [Green Version]
- Voermas, A. Development of the Wärtsilä EnergoFlow: An innovative energy saving device. In Proceedings of the 5th International Symposium on Marine Propulsors smp’17, Launceston, Finland, 12–15 June 2017. [Google Scholar]
- Voermas, A. Experimental determination of hydrodynamic loads on the Wärtsilä pre-swirl stator EnergoFlow and validation of a prediction methodology for design loads. In Proceedings of the 6th International Symposium on Marine Propulsors smp’19, Rome, Italy, 26–30 May 2019. [Google Scholar]
- Zhai, S.; Liu, D.; Hang, Y. Numerical study of hull pressure fluctuation with energy saving device PSV. In Proceedings of the 6th International Symposium on Marine Propulsors smp’19, Rome, Italy, 26–30 May 2019. [Google Scholar]
- Nielsen, J.R.; Jin, W. Pre-swirl fins adapted to different operation conditions. In Proceedings of the 6th International Symposium on Marine Propulsors smp’19, Rome, Italy, 26–30 May 2019. [Google Scholar]
- Ponkratov, D. 2016 Workshop on Ship Scale Hydrodynamic Computer Simulation. Lloyd’s Register. 10 February 2017. Available online: http://info.lr.org/l/12702/2017-02-20/3m372v/12702/156863/Proceedings.zip (accessed on 12 December 2019).
- Park, S.; Oh, G.; Rhee, S.H.; Koo, B.-Y.; Lee, H. Full scale wake prediction of an energy saving device by using computational fluid dynamics. Ocean Eng. 2015, 101, 254–263. [Google Scholar] [CrossRef]
- ITTC. The Specialist Committee on Unconventional Propulsors; Final Report and Recommendations to the 22nd ITTC; ITTC: Zurich, Switzerland, 1999; Available online: https://ittc.info/media/1516/specialist-committee-on-unconventional-propulsion.pdf (accessed on 12 December 2019).
Figure 1.
Fragment of computation mesh in the vessel stern region.

Figure 2.
Details of computation mesh around the propeller blade tip.

Figure 3.
Measured and computed nominal wake field on the propeller plane. (Model scale, Vs = 14 kn, without ESD). (a) measured results. (b) CFD results using kwSST. (c) CFD results using RST, high Re.
Figure 3.
Measured and computed nominal wake field on the propeller plane. (Model scale, Vs = 14 kn, without ESD). (a) measured results. (b) CFD results using kwSST. (c) CFD results using RST, high Re.

Figure 4.
Measured and computed nominal wake field around the ESD location. (Model scale, Vs = 14 kn, without ESD). (a) measured results. (b) CFD results using kwSST. (c) CFD results using RST, high Re.
Figure 4.
Measured and computed nominal wake field around the ESD location. (Model scale, Vs = 14 kn, without ESD). (a) measured results. (b) CFD results using kwSST. (c) CFD results using RST, high Re.

Figure 5.
Nominal wake field on the propeller plane, (a) computed with and (b) without a free surface. (Full scale, Vs = 14 kn, w/o ESD). (same color scale as in Figure 4).
Figure 5.
Nominal wake field on the propeller plane, (a) computed with and (b) without a free surface. (Full scale, Vs = 14 kn, w/o ESD). (same color scale as in Figure 4).

Figure 6.
Overall flow chart of the ESD design workflow.

Figure 7.
Evolution of PSS design in the process of design exploration.

Figure 8.
Distribution of the tangential velocity on section “Sect 1” in front of the propeller, seen from upstream (PSS-Var-5, full scale, Vs = 14 kn).
Figure 8.
Distribution of the tangential velocity on section “Sect 1” in front of the propeller, seen from upstream (PSS-Var-5, full scale, Vs = 14 kn).

Figure 9.
Distribution of the axial velocity on section “Sect 1” in front of the propeller, seen from upstream (PSS-Var-5, full scale, Vs = 14 kn).
Figure 9.
Distribution of the axial velocity on section “Sect 1” in front of the propeller, seen from upstream (PSS-Var-5, full scale, Vs = 14 kn).

Figure 10.
Distribution of the kinetic energy of transverse flow on sections “Sect 2” and “Sect 3” downstream of the propeller (PSS-Var-5, full scale, Vs = 14 kn).
Figure 10.
Distribution of the kinetic energy of transverse flow on sections “Sect 2” and “Sect 3” downstream of the propeller (PSS-Var-5, full scale, Vs = 14 kn).

Figure 11.
Distribution of the kinetic energy of axial flow on sections “Sect 2” and “Sect 3” downstream of the propeller (PSS-Var-5, full scale, Vs = 14 kn).
Figure 11.
Distribution of the kinetic energy of axial flow on sections “Sect 2” and “Sect 3” downstream of the propeller (PSS-Var-5, full scale, Vs = 14 kn).

Figure 12.
Pressure distribution and flow streamlines past the aft ship. (PSS-Var-5, full scale, Vs = 14 kn).
Figure 12.
Pressure distribution and flow streamlines past the aft ship. (PSS-Var-5, full scale, Vs = 14 kn).

Figure 13.
Pressure distribution on the hub and pressure side of propeller blades (PSS-Var-5, full scale, Vs = 14 kn).
Figure 13.
Pressure distribution on the hub and pressure side of propeller blades (PSS-Var-5, full scale, Vs = 14 kn).

Figure 14.
Cavitation domains on propeller and ESD. (PSS-Var-5, full scale, Vs = 14 kn, ballast draught).
Figure 14.
Cavitation domains on propeller and ESD. (PSS-Var-5, full scale, Vs = 14 kn, ballast draught).

Figure 15.
Cavitation domains on the propeller and ESD. (PSS-Var-5, full scale, Vs = 16 kn, ballast draught).
Figure 15.
Cavitation domains on the propeller and ESD. (PSS-Var-5, full scale, Vs = 16 kn, ballast draught).

Figure 16.
3D wake measurements setup.

Figure 17.
Propulsion test setup with the designed PSS.

Figure 18.
Wave profile during the resistance test with PSS at 14 kn.

Figure 19.
3D wake measurements at the propeller plane, without PSS, at 14 kn.

Figure 20.
3D wake measurements at the propeller plane, with PSS, at 14 kn.
Figure 21.
3D wake measurements at a plane midway between the propeller and rudder, with a working propeller, without PSS, at 14 kn.
Figure 21.
3D wake measurements at a plane midway between the propeller and rudder, with a working propeller, without PSS, at 14 kn.

Figure 22.
3D wake measurements at a plane midway between the propeller and rudder, with a working propeller, with PSS, at 14 kn.
Figure 22.
3D wake measurements at a plane midway between the propeller and rudder, with a working propeller, with PSS, at 14 kn.

Figure 23.
3D wake measurements at a rudder stock plane (AP), with a working propeller, without PSS, at 14 kn.
Figure 23.
3D wake measurements at a rudder stock plane (AP), with a working propeller, without PSS, at 14 kn.

Figure 24.
3D wake measurements at a rudder stock plane (AP), with a working propeller, with PSS, at 14 kn.
Figure 24.
3D wake measurements at a rudder stock plane (AP), with a working propeller, with PSS, at 14 kn.
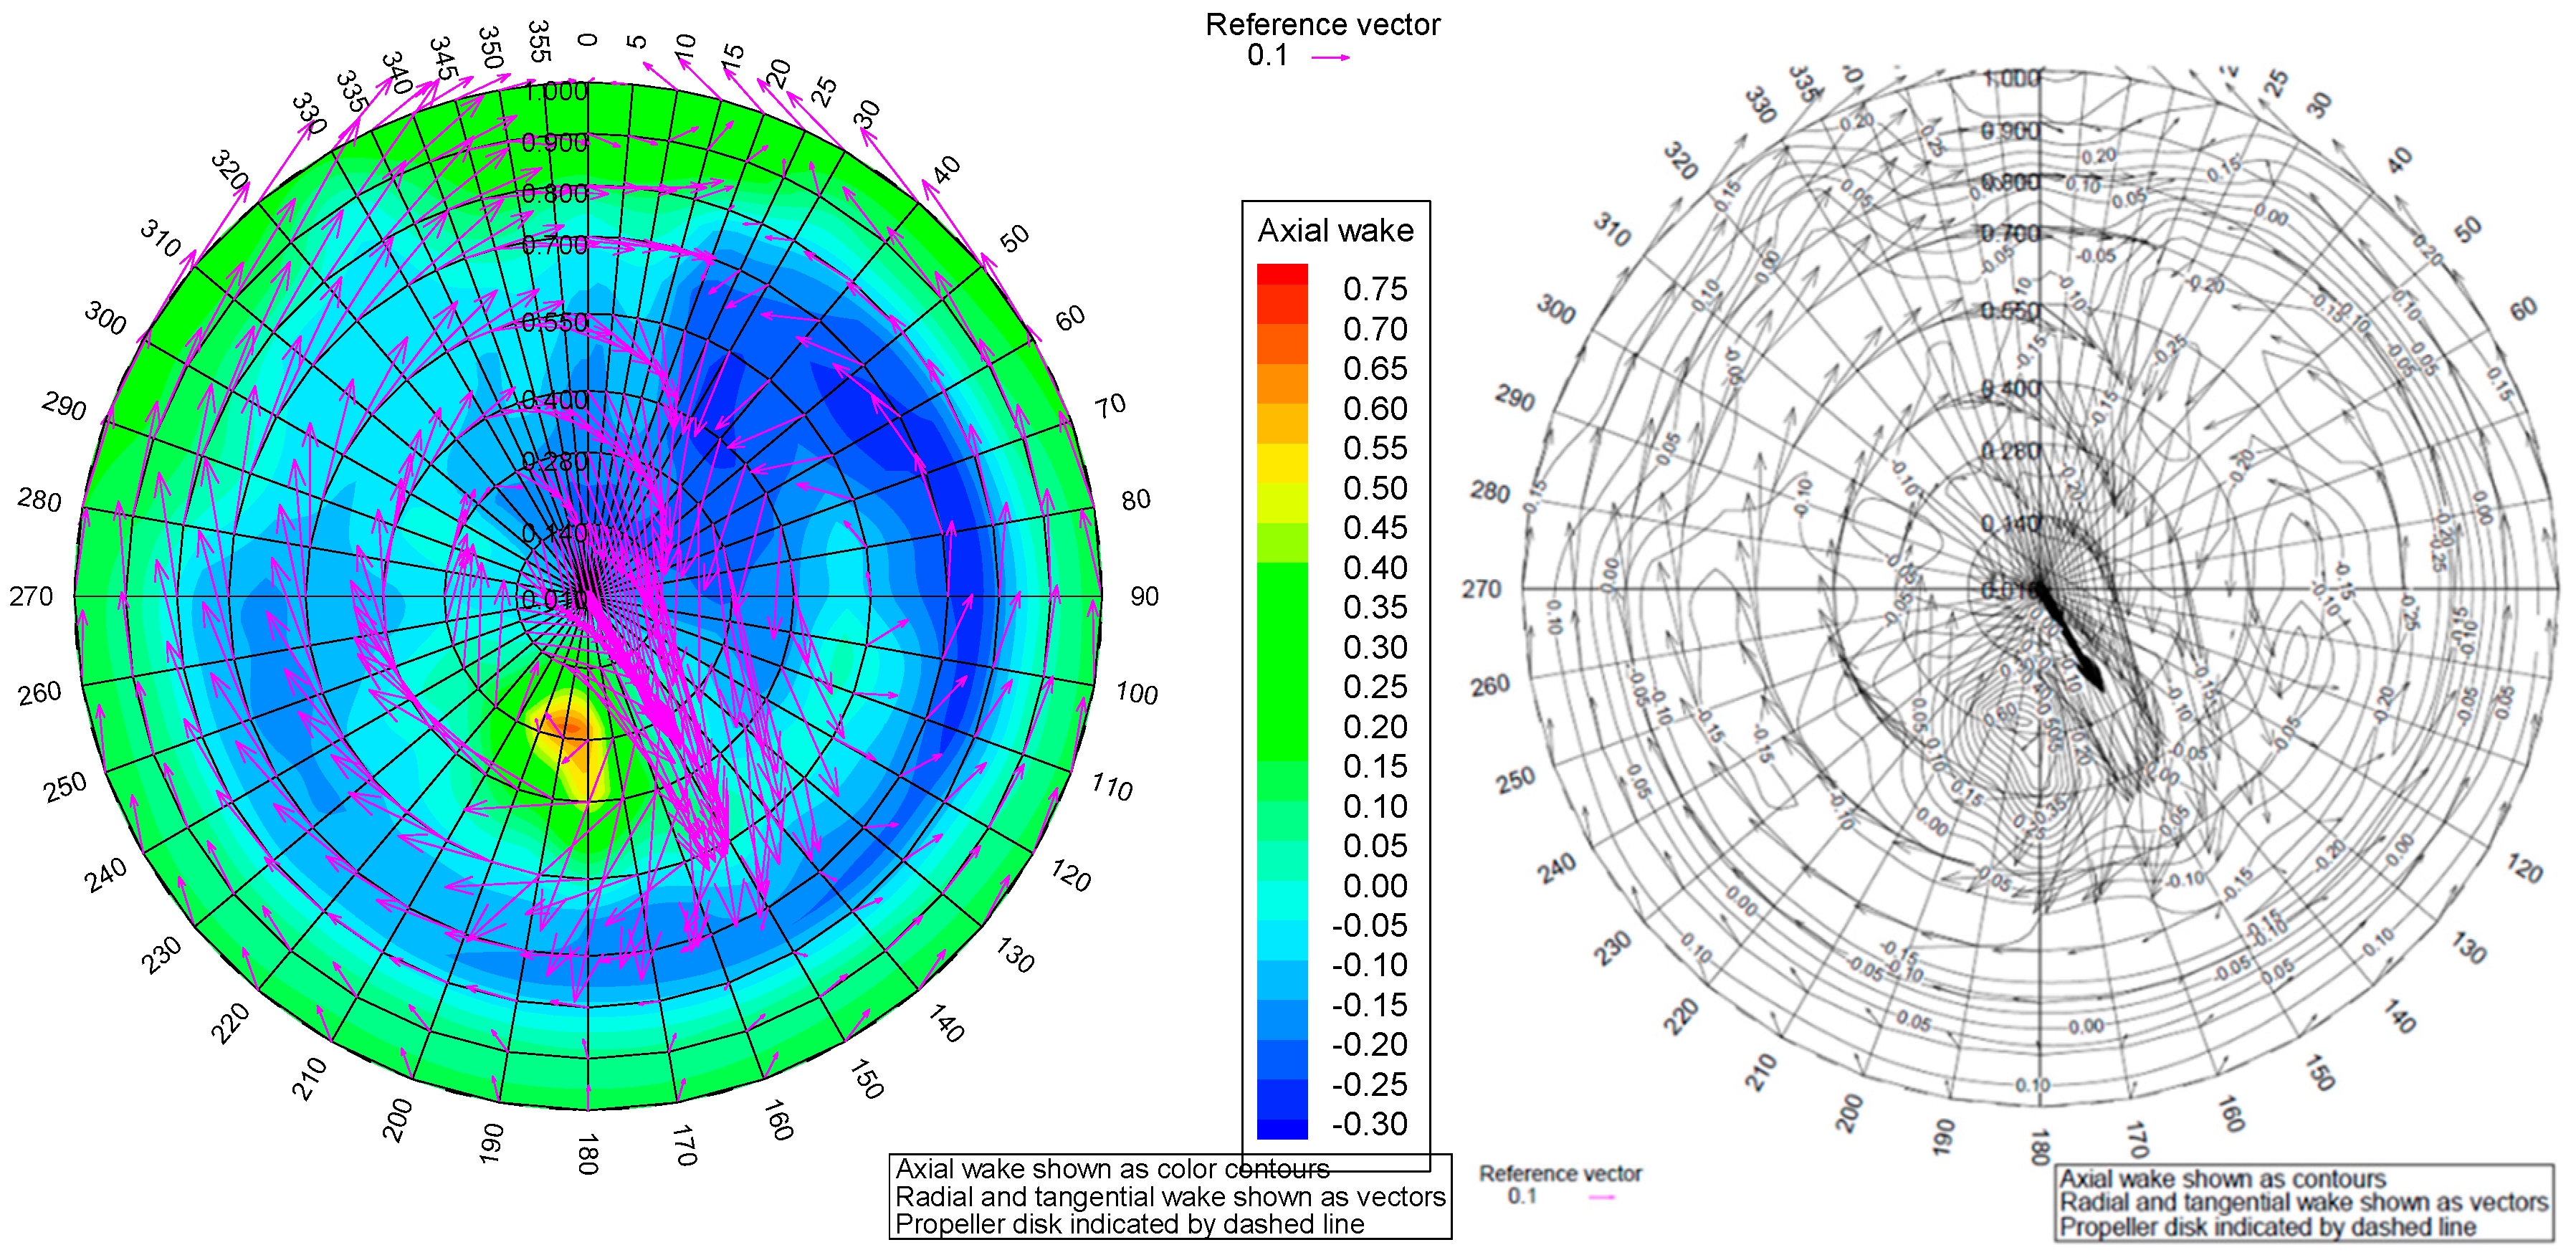
Figure 25.
Comparison of power savings due to ESD installation.

Figure 26.
Vorticity field in the ship wake around ESD and propeller location on a full scale and a model scale. (Vs = 14 kn).
Figure 26.
Vorticity field in the ship wake around ESD and propeller location on a full scale and a model scale. (Vs = 14 kn).

Table 1.
Comparison of propulsion characteristics between the numerical and experimental predictions and full-scale trial data for the vessel without ESD.

(a) Numerical (CFD) vs. experimental (EFD) predictions, 14 (kn), without a sea margin.
| EFD Prediction | CFD kwSST | Δ, % | CFD RST | Δ, % | |
|---|---|---|---|---|---|
| n (rps) | 1.44 | 1.472 | 2.22 | 1.453 | 0.90 |
| TB (kN) | 690.72 | 695.57 | 0.70 | 689.72 | −0.15 |
| PD (kW) | 5596.68 | 5820.38 | 4.00 | 5671.31 | 1.33 |
| t | 0.195 | 0.197 | 1.04 | 0.168 | −13.77 |
| WT | 0.312 | 0.294 | −5.77 | 0.311 | −0.32 |
| ηr | 1.006 | 0.991 | −1.49 | 0.990 | −1.59 |
| ηD | 0.715 | 0.708 | −1.04 | 0.724 | 1.14 |
(b) Experimental predictions vs. sea trial data with a 15% sea margin.
| Sea Trials | EFD Prediction | Δ, % | |
|---|---|---|---|
| PB (kW) | 10,170 | 10,170 | 0.00 |
| n (rps) | 1.745 | 1.717 | −1.60 |
| Vs (kn) | 15.95 | 15.69 | −1.63 |
Table 2.
Main particulars of the ship and propeller.
| Ship | Propeller | ||
|---|---|---|---|
| Length between PP, LPP (m) | 175.6 | Diameter, Dp (m) | 6.5 |
| Breadth moulded, B (m) | 32.229 | Number of blades, Z | 4 |
| Draught at LPP/2, T (m) | 11.846 | Blade area ratio, AE/A0 | 0.52 |
| Displacement, Δ (t) | 56,147.7 | Pitch, P (0.7)/Dp | 0.821 |
| Block coefficient, CB | 0.8123 | Hub ratio, dH/Dp | 0.205 |
| Prismatic coefficient, CP | 0.8096 | Direction of rotation | Right-handed |
Table 3.
Conditions for PSS design.
| Ship Speed, Vs (kn) | 14.0 |
| Froude number, Fr | 0.1735 |
| Draught at LPP/2, T (m) | 11.846 |
| Propeller loading, CTh (without ESD) | 1.57 |
Table 4.
Conditions for PSS design.
| PSS-Var-1 | PSS-Var-3 | PSS-Var-5 | |
|---|---|---|---|
| Number of Fins | 3 | 3 | 3 |
| Profile | Duct 7 | Duct 7 | Duct 7 |
| Fin radius, Rf/Rp | 0.923 | 1.077 | 1.077 |
| Maximum thickness, t0/c | 0.12 | 0.130 | 0.135 |
| Chord length, c/Rf, its distribution | 0.3, constant, no rounding | 0.257, taper from 0.685Rf, tip rounding | 0.1, taper from 0.55Rf, tip rounding |
| ESD plane from AP, X (m) | 6.1 | 6.1 | 6.1 |
| Angular positions of fins 1/2/3 (deg), from the Y-axis | −22/23.6/69 | −22.5/23/68 | −22.5/23/68 |
| Installation angles of fins 1/2/3 (deg) | 65/72/88 | 68/77.5/91 | 68/77.5/91 |
Table 5.
Performance characteristics of the ship equipped with the three PSS designs. CFD predictions at design speed (14 knots) on a full scale.
Table 5.
Performance characteristics of the ship equipped with the three PSS designs. CFD predictions at design speed (14 knots) on a full scale.
| No ESD | PSS-Var-1 | PSS-Var-3 | PSS-Var-5 | |
|---|---|---|---|---|
| n (rps) | 1.472 | 1.434 | 1.422 | 1.4255 |
| PD (kW) | 5820.38 | 5632.57 | 5595.35 | 5589.33 |
| (−3.23%) | (−3.87%) | (−3.97%) | ||
| KTB | 0.1753 | 0.18725 | 0.19113 | 0.18951 |
| KQB | 0.0244 | 0.02554 | 0.02602 | 0.02580 |
| Ct, ship | 0.002976 | 0.003003 | 0.003032 | 0.003023 |
| Ct, rud | 0.000133 | 0.000136 | 0.000141 | 0.000138 |
| Ct, ESD | --- | 0.000012 | −0.000008 | −0.000008 |
| WT | 0.294 | 0.350 | 0.366 | 0.357 |
| Vt/V (Sect 1) | −0.000237 | −0.02157 | −0.032959 | −0.02899 |
| Vt/V (Sect 2) | 0.089347 | 0.071418 | 0.061025 | 0.064009 |
| Vt/V (Sect 3) | 0.026384 | 0.022593 | 0.017588 | 0.018427 |
Table 6.
Averaged magnitudes of kinetic energy on the sections downstream of the propeller (“Sect 2”) and downstream of the rudder (“Sect 3”). Full scale, Vs = 14 kn.
Table 6.
Averaged magnitudes of kinetic energy on the sections downstream of the propeller (“Sect 2”) and downstream of the rudder (“Sect 3”). Full scale, Vs = 14 kn.
| Section “Sect 2” | Section “Sect 3” | |||||
|---|---|---|---|---|---|---|
| without ESD | PSS-Var-5 | Δ, % | without ESD | PSS-Var-5 | Δ, % | |
| KE(x) | 0.0442 | 0.0408 | −7.69 | 0.0395 | 0.0368 | −6.84 |
| KE(tr) | 0.1120 | 0.0708 | −36.79 | 0.0325 | 0.0238 | −26.77 |
| KE(tot) | 0.1562 | 0.1116 | −28.55 | 0.0720 | 0.0606 | −15.83 |
Table 7.
Computed propulsion coefficients of the vessel without ESD and with the designed PSS. (PSS-Var-5, full scale).
Table 7.
Computed propulsion coefficients of the vessel without ESD and with the designed PSS. (PSS-Var-5, full scale).
| Without ESD | With PSS | |||||||
|---|---|---|---|---|---|---|---|---|
| Vs (kn) | WT | t | ηr | ηD | WT | t | ηr | ηD |
| 12 | 0.297 | 0.193 | 0.992 | 0.712 | 0.359 | 0.203 | 0.991 | 0.742 |
| 14 | 0.294 | 0.197 | 0.991 | 0.708 | 0.357 | 0.209 | 0.990 | 0.737 |
| 16 | 0.295 | 0.2085 | 0.993 | 0.703 | 0.357 | 0.218 | 0.991 | 0.733 |
Table 8.
Relative changes in propeller RPM, shaft delivered power, and propulsive efficiency due to the installation of PSS. (PSS-Var-5, full scale).
Table 8.
Relative changes in propeller RPM, shaft delivered power, and propulsive efficiency due to the installation of PSS. (PSS-Var-5, full scale).
| Vs (kn) | Δn, % | ΔPD, % | ΔηD, % |
|---|---|---|---|
| 12 | −3.21 | −4.06 | 4.21 |
| 14 | −3.16 | −3.97 | 4.10 |
| 16 | −3.20 | −4.14 | 4.27 |
Table 9.
Relative changes in propeller RPM, shaft delivered power, and propulsive efficiency due to the installation of PSS. (PSS-Var-5, full scale).
Table 9.
Relative changes in propeller RPM, shaft delivered power, and propulsive efficiency due to the installation of PSS. (PSS-Var-5, full scale).
| WT | without ESD | With PSS | Δ, % | |
|---|---|---|---|---|
| EXP | Model | 0.375 | 0.426 | 13.60 |
| Ship (ITTC scaling) | 0.312 | 0.363 | 16.35 | |
| CFD | Model | 0.38 | 0.425 | 11.84 |
| Ship | 0.294 | 0.357 | 21.43 | |
| t | without ESD | With PSS | Δ, % | |
| EXP | Model | 0.195 | --- | --- |
| Ship | 0.195 | --- | --- | |
| CFD | Model | 0.191 | 0.2 | 4.71 |
| Ship | 0.197 | 0.209 | 6.09 | |
| ηr | without ESD | With PSS | Δ, % | |
| EXP | Model | 1.006 | 1.002 | −0.40 |
| Ship | 1.006 | 1.002 | −0.40 | |
| CFD | Model | 0.992 | 0.989 | −0.30 |
| Ship | 0.991 | 0.99 | −0.10 |
© 2020 by the authors. Licensee MDPI, Basel, Switzerland. This article is an open access article distributed under the terms and conditions of the Creative Commons Attribution (CC BY) license (http://creativecommons.org/licenses/by/4.0/).
Share and Cite
MDPI and ACS Style
Koushan, K.; Krasilnikov, V.; Nataletti, M.; Sileo, L.; Spence, S. Experimental and Numerical Study of Pre-Swirl Stators PSS. J. Mar. Sci. Eng. 2020, 8, 47. https://doi.org/10.3390/jmse8010047
AMA Style
Koushan K, Krasilnikov V, Nataletti M, Sileo L, Spence S. Experimental and Numerical Study of Pre-Swirl Stators PSS. Journal of Marine Science and Engineering. 2020; 8(1):47. https://doi.org/10.3390/jmse8010047
Chicago/Turabian StyleKoushan, Kourosh, Vladimir Krasilnikov, Marco Nataletti, Lucia Sileo, and Silas Spence. 2020. "Experimental and Numerical Study of Pre-Swirl Stators PSS" Journal of Marine Science and Engineering 8, no. 1: 47. https://doi.org/10.3390/jmse8010047
Note that from the first issue of 2016, this journal uses article numbers instead of page numbers. See further details here.