How to Seize the Opportunities of New Technologies in Life Cycle Analysis Data Collection: A Case Study of the Dutch Dairy Farming Sector

PRé Consultants B.V., Stationsplein 121, 3818 LE Amersfoort, The Netherlands
*
Author to whom correspondence should be addressed.
Challenges 2019, 10(1), 8; https://doi.org/10.3390/challe10010008
Submission received: 31 October 2018
/
Revised: 21 December 2018
/
Accepted: 27 December 2018
/
Published: 17 January 2019
(This article belongs to the Special Issue Using Blockchain Technologies and Automized Digitalization for Data Collection in the Upstream Supply Chain)
Abstract
:Technologies such as blockchain, big data, and the Internet of Things provide new opportunities for improving and scaling up the collection of life cycle inventory (LCI) data. Unfortunately, not all new technologies are adopted, which means that their potential is not fully exploited. The objective of this case study is to show how technological innovations can contribute to the collection of data and the calculation of carbon footprints at a mass scale, but also that technology alone is not sufficient. Social innovation is needed in order to seize the opportunities that these new technologies can provide. The result of the case study is real-life, large-scale data collected from the entire Dutch dairy sector and the calculation of each individual farm’s carbon footprint. To achieve this, it was important to (1) identify how members of a community can contribute, (2) link their activities to the value it brings them, and (3) consider how to balance effort and result. The case study brought forward two key success factors in order to achieve this: (1) make it easy to integrate data collection in farmers’ daily work, and (2) show the benefits so that farmers are motivated to participate. The pragmatic approach described in the case study can also be applied to other situations in order to accelerate the adoption of new technologies, with the goal to improve data collection at scale and the availability of high-quality data.
1. Introduction
New technologies provide new opportunities. A common problem in life cycle assessment (LCA) is the low availability of life cycle inventory (LCI) data [1,2,3]. Aproximately 70–80% of the time and cost of an LCA can be attributed to data gathering for the inventory phase [4]. New technologies such as distributed ledger technology (e.g., blockchain), the Internet of Things (IoT), big data (BD), and artificial intelligence (AI) provide opportunities to revolutionize the collection of LCI data. These technologies can also prove to be useful for impact assessment modeling and the dissemination of LCA results at a large scale. It is important to have these environmental impact results, showing the effect of activities on climate change, in order to identify improvement opportunities, track any progress, and further reduce the footprint of activities.
Unfortunately, the potential that these new technologies provide for LCA is not fully utilized. The literature review in the following part of this article shows that most examples of the use of these technologies are either small in scale or theoretical. This article intends to show what is needed to seize the potential of these technologies at a large scale. In the literature review, we describe the current use and the future potential of new technologies. Next, we present the methodological approach to the diffusion of innovative technologies. Finally, the case study on the greenhouse gas (GHG) footprint of Dutch dairy farmers illustrates how social innovation was used to ensure the large-scale adoption of big data in LCA: a technology that allows unprecedented large-scale foreground data collection.
2. Literature Review
In LCI data, a distinction can be made between foreground data (primary data from the product system under study) and background data (secondary data from processes feeding into the product system under study). For background data, multiple LCI databases, such as ecoinvent, Agri-footprint, the United States (US) life cycle inventory database, and others, are available for LCA practitioners. Both LCA practitioners and researchers of LCI databases are looking for ways to incorporate new technologies, such as big data, into the data collection process [5]. Furthermore, within the field of life cycle analysis, we see a broadening of the object of analysis from products only to sectors or baskets of products, or to cities, economies, or even the planet. At the same time, the scope of indicators is also expanding: from environmental to economic and also to social impact analysis [6]. The expansion of both the scope and the object of analysis calls for different data sources and different technologies to enable data collection. Distributed ledger technology (DLT), IoT, big data, and artificial intelligence can provide more data for LCI and other parts of LCA studies in a more efficient way.
In the literature, a number of examples of the use of these technologies can be found. Davies, Nikolic, and Dijksma [2] are exploring possibilities for the more efficient and effective use of data in the field of industrial ecology. The writers argue that background data is often outdated, and the collection of foreground data is tedious and time-consuming work that is done over and over again for every study. The specifics of data collection, data manipulation, and data quality assurance are often not documented and shared properly, so other researchers working on the same topic will have to repeat the same work again and again. Information technology should be used more effectively to facilitate the reuse of data, information, and knowledge [2]. The following examples show some opportunities and first steps in using IoT, BD, AI, and DLT in LCA.
DLT (such as blockchain) is a decentralized way to store data and validate transactions using a peer-to-peer network. This technology can increase the efficiency of data collection in a secure way. Distributed ledgers could be used for supply chain traceability, for instance, but there is as yet little documentation about its technical implementation [7]. For data gathering in social LCA, transparency in the supply chain and the traceability of a product are some of the key challenges [3]. DLT could enable the complete transparency of a product’s supply chain, allowing data gathering on social issues throughout the supply chain [8]. Currently, most of the information about social impacts further down the supply chain of products is based on sustainability standards and certifications; the verification of these claims requires costly and time-consuming auditing. Data about the actual supply chain could greatly increase the reliability of social LCA studies.
The idea of the Internet of Things (IoT) was first mentioned 1999 when the Massachusetts Institute of Technology (MIT) Auto ID Center wrote a white paper on the combination of radio frequency identification (RFID) tags and the internet. The white paper envisions “a world in which all electronic devices are networked and every object, whether it is physical or electronic, is electronically tagged with information pertinent to that object” [9] (p. 4). The idea of the IoT developed beyond a network of RFID tags to include interactions between all types of tags, sensors, actuators, mobile phones, etc. [10]. Connecting many different sensors allows the IoT to provide live data from objects. Data from these sensors can be used for real-time LCA-based carbon footprints. Instead of using static LCI data about a certain vehicle type from a database to calculate the emissions of one km of transport, for instance, a connected emission sensor on the actual vehicle could provide specific data. With these sensors, regionally and temporally specific emission data could be included in the LCA model.
The concept of big data (BD) is receiving a lot of attention from society, researchers, and businesses. A variety of definitions exist. An extensive literature review of Samuel et al. shows that the concept includes data that has three, four, or five Vs. BD is characterized by its large Volume, great Variety, and data that is generated with high Velocity. Sometimes, large Veracity and high Value are added to the definition [11]. Currently, BD is used in impact assessment for fate and the transport modeling of substances. BD is also used for data collection in LCI data. However, the use of BD is not comprehensive [12]. Although BD is finding its way in LCA, many values in LCI data and impact assessment models are still obtained from a few or from single data points. BD could be used for more robust LCI data on production processes, and also for more guidance on behavioral data to model the use phase [5].
Lastly, artificial intelligence (pattern recognition, neural networks, scheduling, reasoning, fuzzy logic, rule-based systems, and machine learning) can support the collection of data and the automated incorporation of big data in LCA models [13].
The examples that we found are either theoretical or small-scale experiments, and incorporation of data from these “new” sources can be challenging and time consuming. What it takes to apply new technologies, including cloud services, to move LCI data collection from a static to a dynamic approach at a mass scale is not well documented. Xing et al. described one of the few examples of the application of dynamic LCI data collection [14]. The authors used a cloud-based platform that allows collaboration between supply chain partners in apparel production. This case study shows great potential for collaboration on supply chain data. The authors conclude that further development is needed on data conversion, exchange, and data synthesis, before the concept can move beyond early-stage empirical studies and anecdotal cases [14]. Our case study shows how cloud-based LCA analysis has moved beyond this stage: our model is currently being used by more than 12,000 farmers in the Netherlands.
3. Complication: Diffusion of Innovation
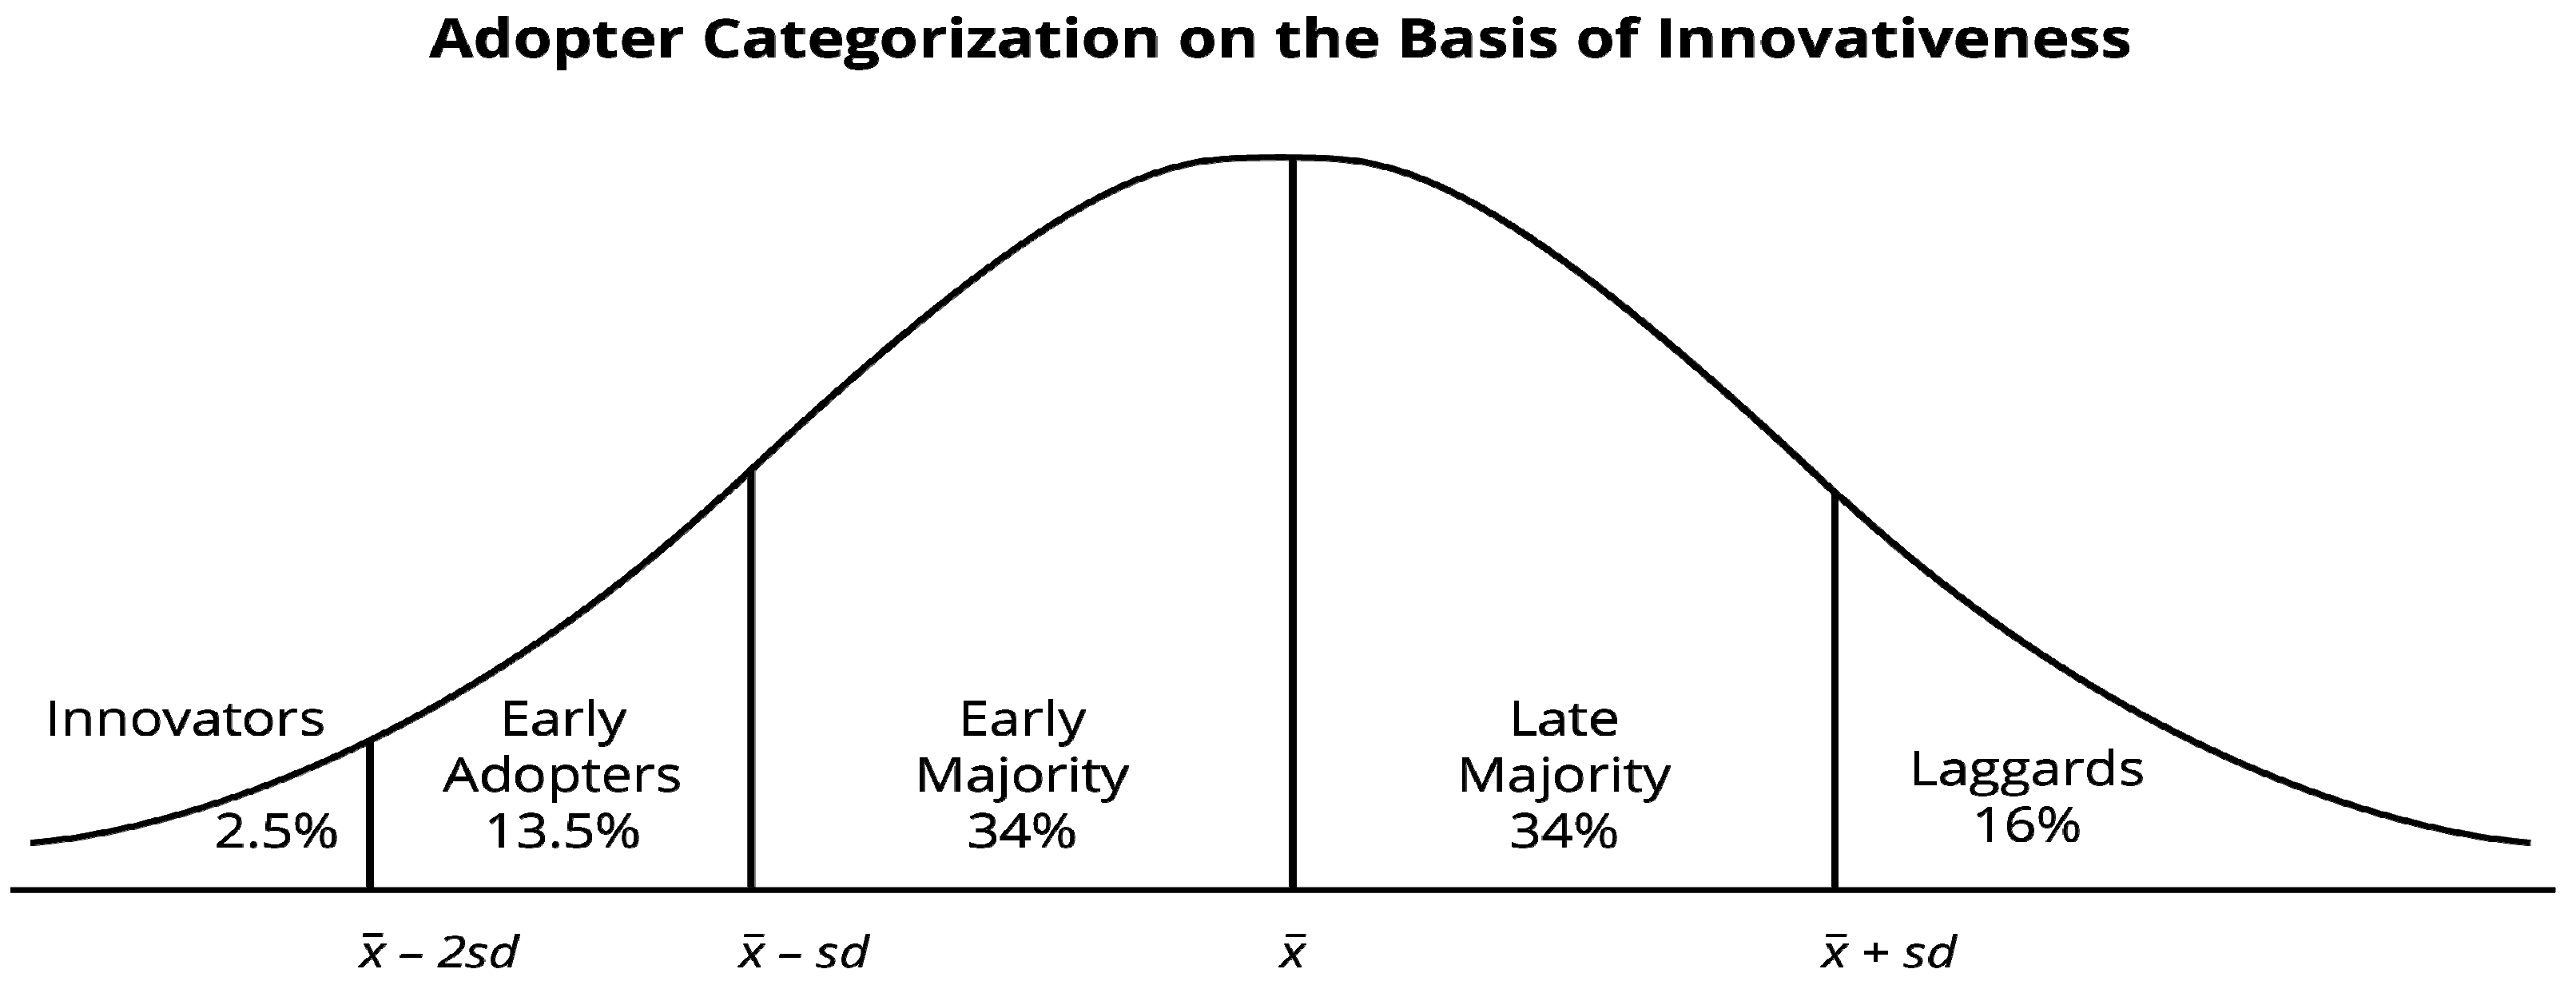
The technology for large-scale automated data collection is available, but at the moment, it is only used in small-scale experiments. Therefore, the main question this article will answer is what is needed to use these new technologies at mass scale. To answer that question, the theory of diffusion of innovation from Rogers [15] provides a framework for how technologies are adopted. It is well documented in research that the diffusion of new technologies among users follows several stages. First there are innovators; then, there are early adopters, early majority, late majority, and laggards [15]. The distribution of these groups is shown in Figure 1. The characteristics of these groups are quite distinct, as Rogers describes. Innovators are venturesome information seekers. They are highly interested in new ideas and have more cosmopolite social networks. They have a high ability to understand and apply new, complex technologies. They have to be able to cope with a higher degree of uncertainty about an innovation than other adopter categories. They also have to accept setbacks when new ideas are not as successful as expected. Last, but not least, they are the ones that launch new ideas into the system.
Early adopters are open to ideas and actively adopt new ideas. Thus, they decrease the uncertainty about the innovation. They are more integrated in local systems and are consulted for advice and information about innovations. Early adopters are the “people to check with” with a high degree of opinion leadership. In many cases, they serve as role models for other members, are respected by peers, and are successful.
The early majority will not be the first, but also not the last to adopt innovations. It takes them some time to adopt; they may deliberate for quite a long time before making a decision. However, they are an important linking pin between the early adopters and the late majority. They are not the opinion leaders, but they interact a lot with their peers. The late majority is more skeptical and cautious, and they will not adopt innovations until many others in their system have already done so. The weight of peer pressure is important to motivate adoption by this group [15].
The most difficult phase is moving from early adopters to early majority: the tipping point or a chasm. There are distinct differences between these two groups. While the early adopter is a change agent who likes to be the first and be part of a revolution, members of the early majority want to improve productivity in a smooth way that is in line with the way they are used to working [16].
When it comes to using new technologies for LCI data collection, it can be argued that it is relatively easy to find innovators and early adopters who want to use these technologies. They are the change agents. As they are in control of data collection, they can decide which tools to use. However, contributors of data collection will be found among a more diverse set of users. They have to work with the tools and technologies that others have decided upon for them, and not all of them will be innovators or early adopters. This group wants to know how a tool will improve their operations. To get their involvement, a different approach is needed that fits their characteristics. In other words, the technology might be there, but other aspects need to be tackled in order to make people use it.
To understand how to accelerate the adoption of prospective technologies for LCI data collection, it is important to understand how new technologies are adopted (the diffusion of innovation is at the level of society as a whole, while adoption is on an individual level [15]). Rogers describes that adoption takes place in five stages: knowledge, persuasion, decision, implementation, and confirmation. In the knowledge stage, the individual is exposed to the innovation, and gains an understanding of it. At the persuasion stage, the individual forms an attitude toward the new idea and seeks additional information about it. At the decision stage, the individual decides whether or not to try it. During the implementation stage, the individual puts the innovation to use. At the confirmation stage, the individual seeks reinforcement of the decision to make use of an innovation [15].
To make new technologies a success, it is necessary to make sure people move into the implementation and confirmation phase as soon as possible. As we have seen, most applications of new technologies for LCI data collection are still exploratory and theoretical. This creates knowledge and interest, but will not yet lead to bigger audiences trying them and putting them to use. Therefore, it is crucial to involve larger groups in implementation projects. Existing social networks play a role in this [17]. Agents in a social network influence each other, with a tendency toward imitation [18]. Activating existing communities is very important in the diffusion and adoption of new technologies. The power of a community is in using existing capabilities and opportunities. To do this, we need to identify what members of a community can contribute, link their activities to value, and consider how a balance can be found [19].
How implementation and the confirmation of new technologies for LCI data collection can be achieved in a social network is illustrated in the case study.
4. Solution
To make use of all of the possibilities that new technologies provide for LCI data collection, it is necessary to understand the behavior of all the people involved—both collectors and contributors—and make the technology’s benefits tangible so that users are aware of and interested in using them. Furthermore, it is crucial to make it simple and easy for users to try and adopt the new technologies, so it can become their new behavior.
The first step is to understand what people are currently doing and what their pains and gains are. The solution should tackle the pains and strengthen the gains. In a case study for the Dutch dairy sector, we will describe how that has been done and what the main findings are around social innovation.
4.1. Case Study: Background
The Dutch dairy sector has the ambition to reduce its GHG emissions by 20% in 2020 and grow in a climate-neutral way. Additionally, a growing number of dairy processers in the industry are distinguishing themselves with sustainability, and would like to have insight into the carbon footprint of their supplying farmers. To meet both objectives, the Dutch dairy sector wants to measure its GHG emissions in a robust and quantitative way. The main challenge was the large-scale adoption that is required to facilitate data collection for the entire sector. We wanted to facilitate as easy an adoption as possible in order to engage the entire sector and not only the early adopters. Currently, all of the farmers in the Netherlands are already obliged to complete the Annual Nutrient Cycle Assessment (Dutch: KringloopWijzer) tool to measure the input and output of all the nutrients on their farm. The KringloopWijzer was built and paid for by the Dutch dairy sector; it is freely available for the entire sector. To lower the acceptance barrier of GHG emission measurements as much as possible, we developed a solution that links the existing user-friendly KringloopWijzer for farmers with the expert LCA tool SimaPro. This integrates state-of-the-art GHG calculations into the Central Database of the KringloopWijzer, creating a user-friendly, widely used system for mineral bookkeeping.
4.2. Case Study: Approach and Methodology
To understand what the solution should look like, we first formulated the requirements that the developed solution would need to meet in order to allow data collection for the entire sector and facilitate easy adoption. The following key success factors for the tool were identified:
- Smooth integration of the online KringloopWijzer tool with LCA software and a highly complex sector-specific LCA model.
- High user-friendliness and accessibility for dairy farmers: a solution with a single online point of contact, so that farmers only need to fill in data on one platform.
- Opening up the expert LCA model for the unhindered import of data into and the export of results out of the expert LCA model.
- High level of flexibility to adapt and update the LCA model, method, and LCI data, while ensuring the robustness and soundness of the model and the life cycle inventory assessment (LCIA) results.
- Sufficient speed and capacity to manage between 12,000–36,000 LCA calculations per month, with a calculation time of no more than seconds.
- Giving farmers insight into their carbon footprint and the factors contributing to it in their own online user interface.
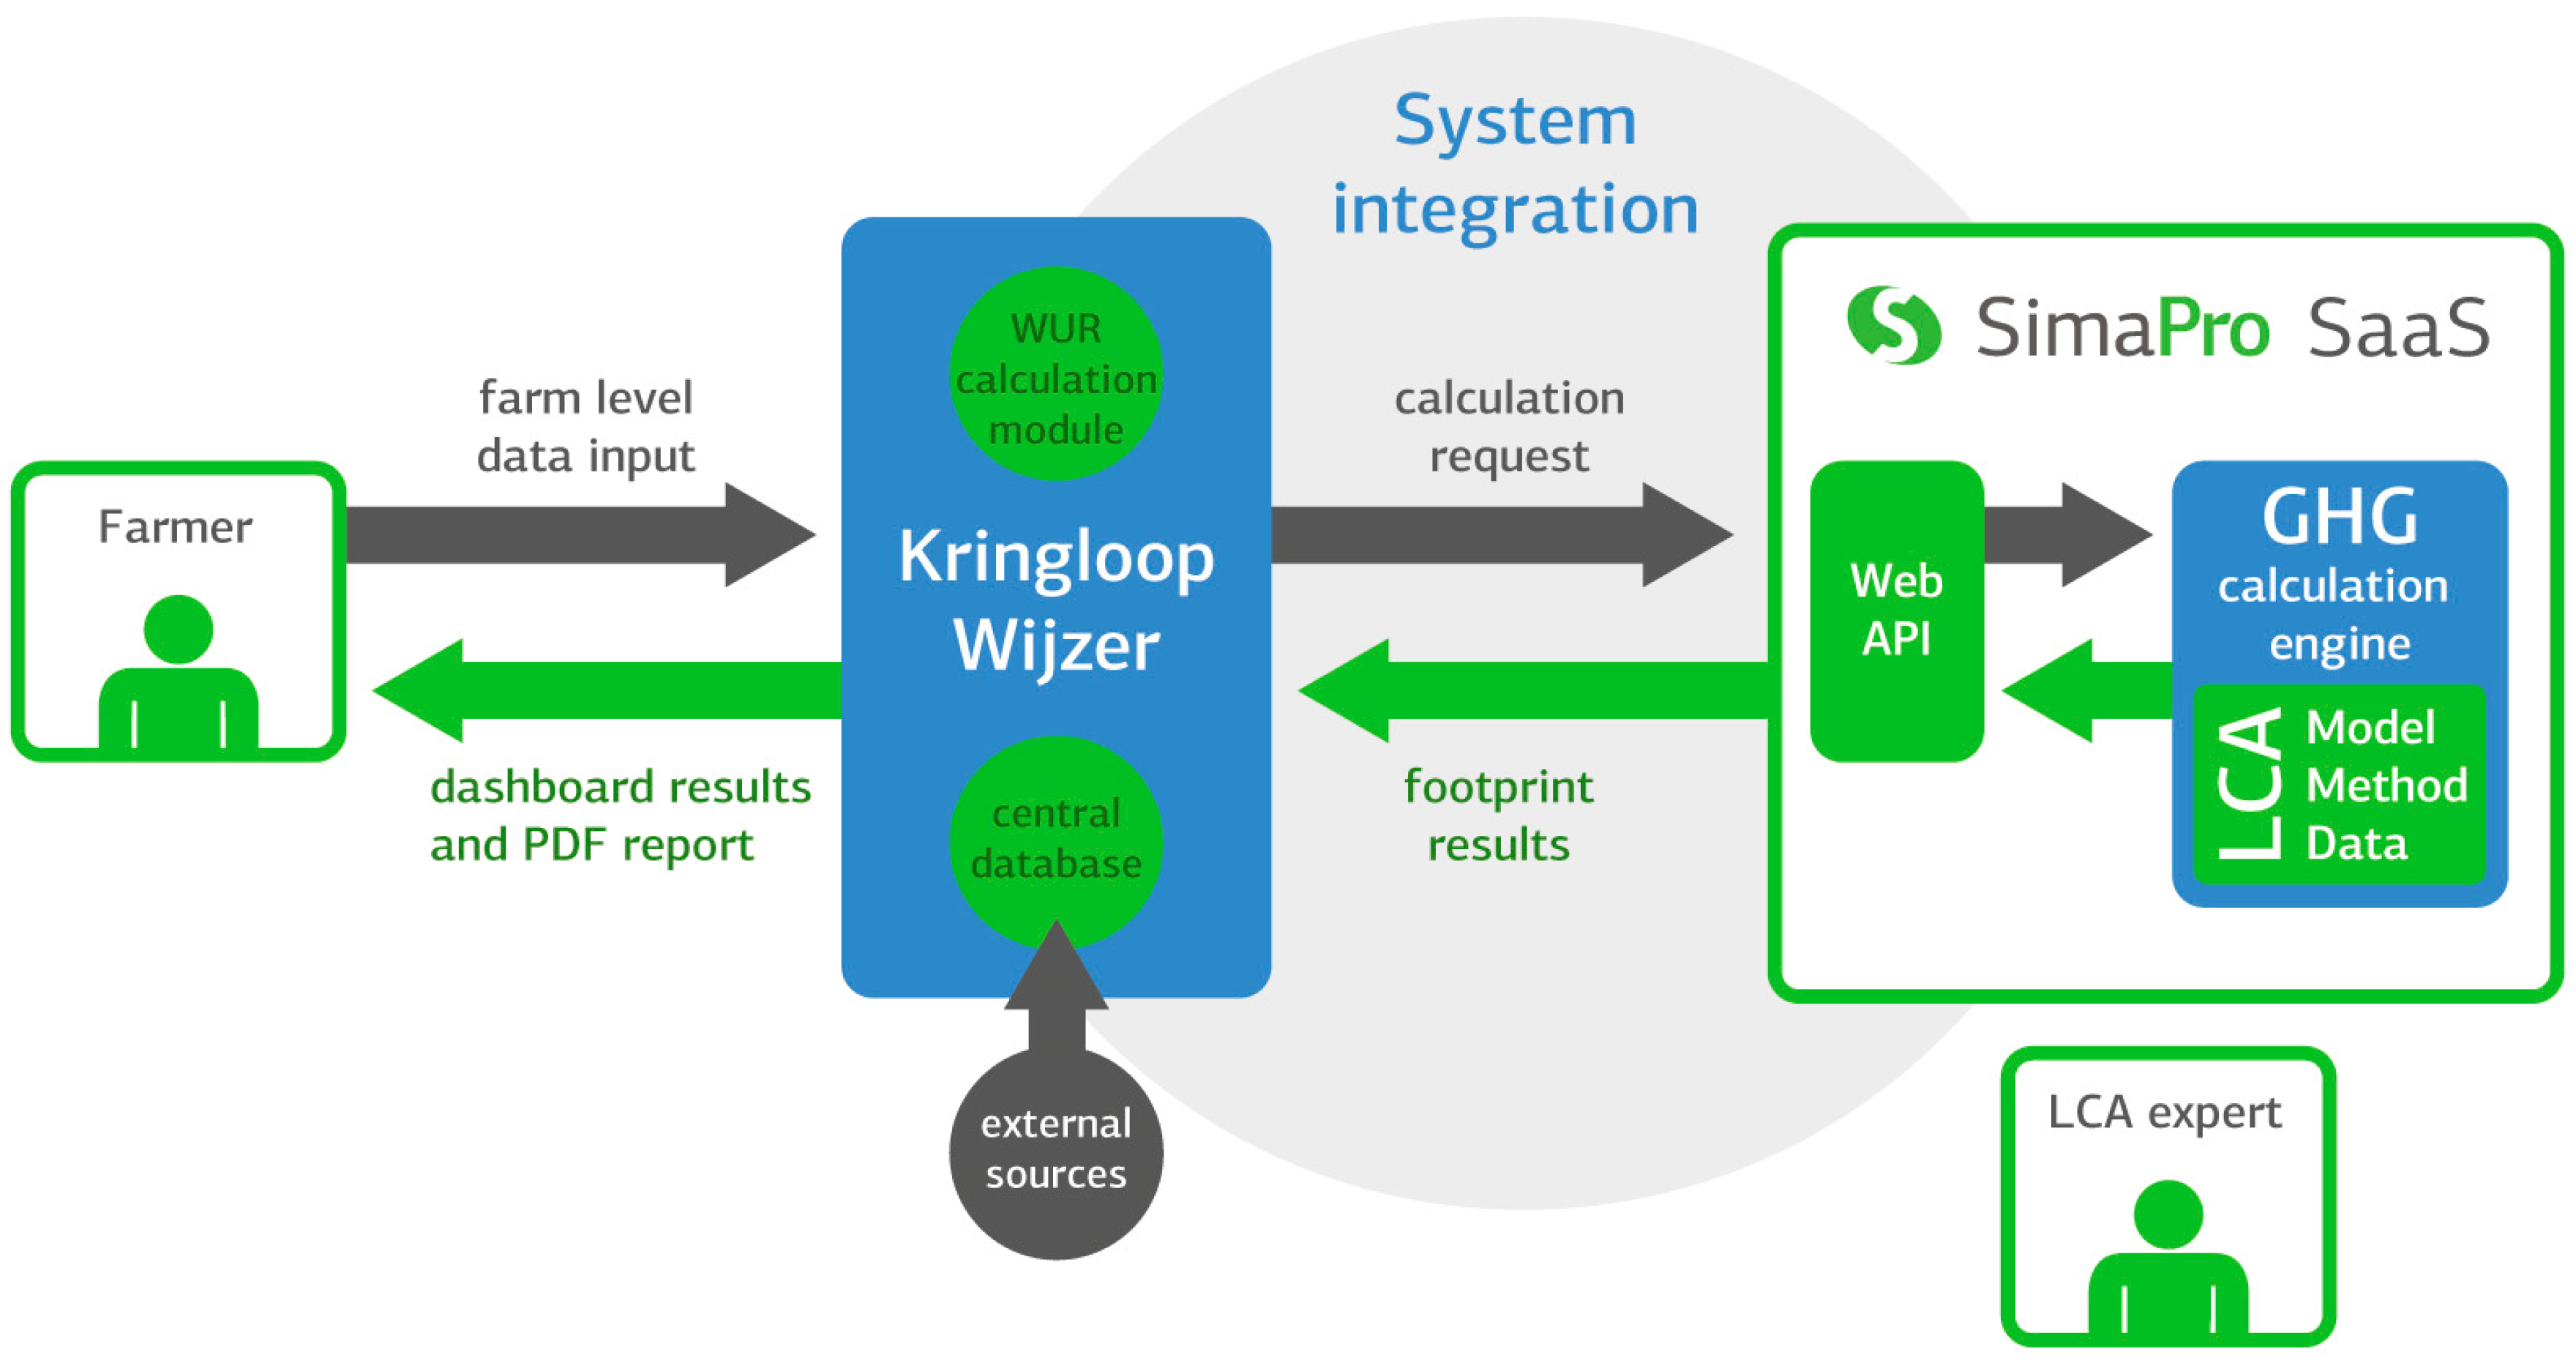
Based on these requirements, we developed a solution with an application programming interface (API) that enabled communication between the highly parameterized SimaPro LCA model and the interface of the KringloopWijzer and its central database. A schematic overview of the software architecture is shown in Figure 2. Data inputs from the KringloopWijzer are linked to parameters in the LCA model by parameter mapping. Farmers enter the primary data for the most relevant variables at the front end, while LCA experts can ensure the robustness of the model and the data entered at the back end. By parameterizing a robust LCA model and linking it to the KringloopWijzer via the API, we created a real-time LCA calculation service that empowers farmers with insight into their own carbon footprint and sector experts with insight into sector trends and averages.
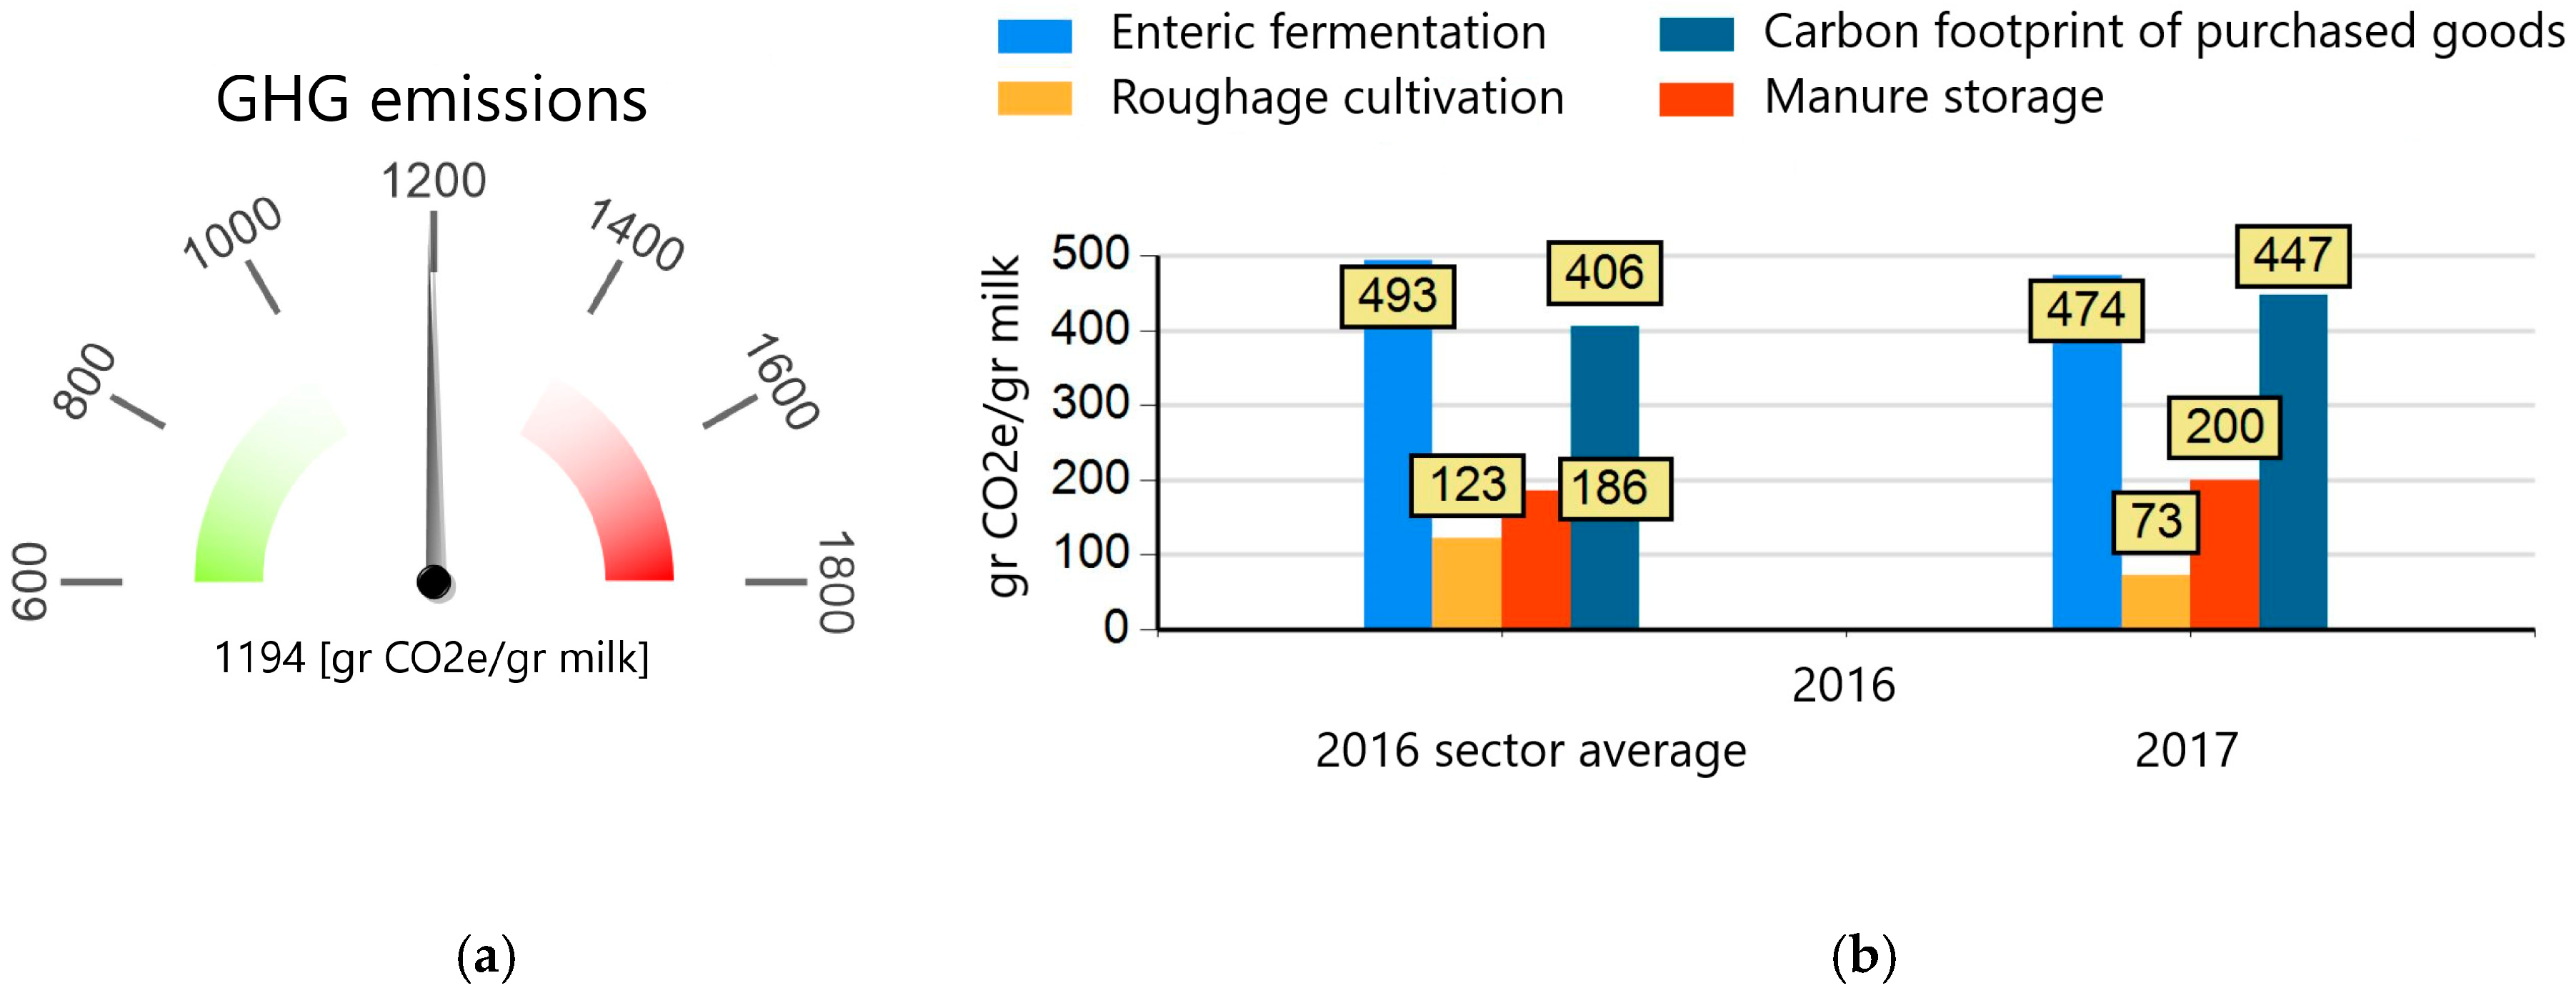
Figure 3 shows the tool’s output, which provides the dairy farmers with insight into the GHG emissions in grams of CO2-equivalent per kg of milk (a) and the source of their GHG emissions (b). The sources are divided into four categories, as illustrated in Figure 3.
The tool enables farmers to benchmark their GHG emissions to other, comparable, dairy farms. At the same time, it gives LCA experts from dairy processing companies insight into the average GHG emissions of their products and how variables such as soil type influence the GHG emissions.
4.3. Case Study: Main Results and Conclusion
The tool has gone live in January 2018 and adoption is very high, probably because the tool is integrated into an existing platform. Even though the farmers are not obliged to fill in their climate data, 12,200 of the approximately 16,000 farmers have filled in the tool. The quality of the data is high, as it comes directly from the source, and outliers can be detected. In 2018, the farms’ carbon footprint was measured for the first time. In the future, the data will be provided on a yearly basis so that progress can be tracked and the impact of corrective actions can be measured.
For the actors involved, automating the data collection and results generation provides a number of clear benefits:
- For the farmers, the tool gives insight into the carbon footprint of one kg of milk and the sources of its GHG emissions (enteric methane emissions, manure storage, production of purchased goods, and roughage cultivation on the farm). This allows benchmarking against the sector average, monitoring progress compared to previous years, and identifying improvement opportunities.
- LCA experts can now dig into a huge amount of valuable big data. By the time of writing this article, 12,200 dairy farmers had provided their data and received their farm’s individual carbon footprint calculation. The results show a large variation in GHG emissions, which can be analyzed in depth in order to identify best practices and the most influential hotspots and trends over the years. Usually, an LCA model is only used for one client or one LCA report. In our case study, the use of big data is facilitated by the SimaPro platform, allowing automated data gathering from more than 12,000 farmers, and instantly returning a carbon footprint to them.
- The Dutch dairy sector gains insight into the average footprint of a dairy farm, based on a high volume of primary data, and into best practices, hotspots, and determining factors for impact. These can be used for reduction and improvement opportunities at the individual and sector levels. The results can be monitored over the years to show the progress of the sector in reducing GHG emissions.
This shows that by expanding already used platforms for LCA data collection, the tipping point can easily be reached. Since there is already a support system for the KringloopWijzer, the tool insights were also easier to adopt and implement for the farmers.
5. Conclusions
New technologies for LCI data gathering are progressing beyond the early stages of development. Our case study on the Dutch dairy sector shows how—for the first time—a cloud-based LCA tool incorporates big data into LCI data gathering through an API, allowing the large-scale use of LCA models and the large-scale dissemination of results. The case study showed that the technological infrastructure is available to use big data in LCA. However, the technology alone would be useless if the stakeholders, in this case dairy farmers, would not have cooperated by supplying their data. The case study identified two crucial drivers for stakeholders to cooperate: (1) make it easy to integrate data collection in the daily work of your users, and (2) show them the benefits, so that they are motivated to participate.
The new LCI data collection and GHG emission footprint tool was introduced in the Dutch dairy sector. The design of the tool provides users with benefits so they are aware of it and interested in using it. Furthermore, the tool’s interface is simple enough for users to easily adopt the new technology. The cloud-based solution can calculate up to 10,000 farm-specific footprints simultaneously. The solution aimed to provide farmers with immediate benefits, so that it presented their GHG footprint as soon as the farmers entered their data. This means that not only does the tool facilitate data gathered at a large scale, it also allows for a much larger scale of results dissemination than conventional LCA studies. Currently, most LCA practitioners are spending a lot of time on data gathering, modeling, and writing the report of a single study for a single client. Our case study shows how LCA models can be used by 10,000 people at the same time. With new technology, we can get much more use out of existing models, results, and knowledge.
By making use of both technological and social innovation, our solution enables the use of big data in LCA. In the case study, the foreground data gathering is now instantaneous. For a typical LCA, the data-gathering phase takes weeks, or sometimes even months (in the case of more complicated processes). The time invested in setting up the data-gathering infrastructure was higher than data gathering for a regular LCA study, but it was in the same order of magnitude. However, the quantity of data that is gathered is a different order of magnitude (more than 12,000 datasets). For every additional farmer, no additional effort is needed, because the data gathering process is automated. The quality of the data is high because outliers can be detected.
6. Next Steps
The case study of the GHG footprint for Dutch dairy farmers confirms, in a real-life, large-scale situation, the potential of new technologies for LCI data gathering, the more effective use of LCA models, and the widespread dissemination of LCA results. Furthermore, the same combination of technological and social innovation could be used for background data gathering.
The data of 12,200 farmers can now be used to find out where the most emissions occur. The farmers with the lowest environmental footprints can help other farmers to identify improvement opportunities. The results can also be used by the entire dairy sector to see where they can work together for new technical solutions or changes in legislation that may result in lower GHG emissions. In the future, it will be possible to track the progress in reducing the carbon footprint of individual farmers and the sector as a whole.
The cloud-based platform can be combined with an API for user input, but it could also be linked to other sources such as a blockchain or IoT sensors measuring emissions, energy use, or other relevant inputs for LCA models. Using the cloud-based platform in this way would allow for LCI data gathering, use of the data in LCA models, and the dissemitaion of LCA results at an unprecedented scale.
The technology is there, whether it is DLT, IoT, big data, or artificial intelligence. Now we have to find applications that activate new ecosystems, so that we can use these technologies to make environmental impact results more widely available. That requires a pragmatic approach that makes the life of people easier and brings them clear benefits. This social dimension of innovation cannot be overlooked, and makes or breaks the diffusion of new technologies.
Author Contributions
Writing—Original Draft preparation, E.M.; introduction, D.K.; methodological framework, E.M.; case study, A.G.; Writing—Review and Editing D.K.
Funding
This research received no external funding.
Acknowledgments
The authors would like to thank Zuivel NL and FrieslandCampina for allowing to communicate about the tool and the work we have for them.
Conflicts of Interest
The authors declare no conflict of interest.
References
- Testa, F.; Nucci, B.; Tessitore, S.; Iraldo, F.; Daddi, T. Perceptions on LCA implementation: Evidence from a survey on adopters and nonadopters in Italy. Int. J. Life Cycle Assess. 2016, 21, 1501–1513. [Google Scholar] [CrossRef]
- Davis, C.; Nikolic, I.; Dijkema, G.P.J. Industrial Ecology 2.0. J. Ind. Ecol. 2010, 14, 707–726. [Google Scholar] [CrossRef] [Green Version]
- Benoît Norris, C. Data for social LCA. Int. J. Life Cycle Assess. 2014, 19, 261–265. [Google Scholar] [CrossRef]
- Miah, J.H.; Griffiths, A.; McNeill, R.; Halvorson, S.; Schenker, U.; Espinoza-Orias, N.; Morse, S.; Yang, A.; Sadhukhan, J. A framework for increasing the availability of life cycle inventory data based on the role of multinational companies. Int. J. Life Cycle Assess. 2018, 23, 1744–1760. [Google Scholar] [CrossRef]
- Hellweg, S.; Zah, R. What is new at the data front? Int. J. Life Cycle Assess. 2016, 21, 1215–1217. [Google Scholar] [CrossRef] [Green Version]
- Guinée, J.B.; Heijungs, R.; Huppes, G.; Zamagni, A.; Masoni, P.; Buonamici, R.; Ekvall, T.; Rydberg, T. Life Cycle Assessment: Past, Present, and Future. Environ. Sci. Technol. 2011, 45, 90–96. [Google Scholar] [CrossRef] [PubMed]
- Galvez, J.F.; Mejuto, J.C.; Simal-Gandara, J. Future challenges on the use of blockchain for food traceability analysis. TrAC Trends Anal. Chem. 2018, 107, 222–232. [Google Scholar] [CrossRef]
- Abeyratne, S.A.; Monfared, R.P. Blockchain ready manufacturing supply chain using distributed ledger. Int. J. Res. Eng. Technol. 2016, 5, 1–10. [Google Scholar] [CrossRef]
- Engels, D.W.; Foley, J.; Waldrop, J.; Sarma, S.E.; Brock, D.L. The networked physical world: an automated identification architecture. In Proceedings of the Second IEEE Workshop on Internet Applications, San Jose, CA, USA, 24 July 2001; pp. 76–77. [Google Scholar] [CrossRef]
- Tao, F.; Wang, Y.; Zuo, Y.; Yang, H.; Zhang, M. Internet of Things in product life-cycle energy management. J. Ind. Inf. Integr. 2016, 1, 26–39. [Google Scholar] [CrossRef]
- Fosso Wamba, S.; Akter, S.; Edwards, A.; Chopin, G.; Gnanzou, D. How ‘big data’ can make big impact: Findings from a systematic review and a longitudinal case study. Int. J. Prod. Econ. 2015, 165, 234–246. [Google Scholar] [CrossRef]
- Cooper, J.; Noon, M.; Jones, C.; Kahn, E.; Arbuckle, P. Big Data in Life Cycle Assessment: Big Data in Life Cycle Assessment. J. Ind. Ecol. 2013, 17, 796–799. [Google Scholar] [CrossRef]
- Stephan, A.; Crawford, R.H.; Bontinck, P.-A. A model for streamlining and automating path exchange hybrid life cycle assessment. Int. J. Life Cycle Assess. 2018, 1–16. [Google Scholar] [CrossRef]
- Xing, K.; Qian, W.; Zaman, A.U. Development of a cloud-based platform for footprint assessment in green supply chain management. J. Clean. Prod. 2016, 139, 191–203. [Google Scholar] [CrossRef]
- Rogers, E.M. Diffusion of Innovations, 4th ed.; Free Press: New York, NY, USA, 1995; ISBN 978-0-02-874074-4. [Google Scholar]
- Moore, G.A. Crossing the Chasm: Marketing and Selling Disruptive Products to Mainstream Customers, 3rd ed.; HarperBusiness: New York, NY, USA, 2014; ISBN 978-0-06-229298-8. [Google Scholar]
- Rogers, E.M.; Kincaid, D.L. Communication Networks: Toward a New Paradigm for Research; Free Press, Collier Macmillan: New York, NY, USA; London, UK, 1981; ISBN 978-0-02-926740-0. [Google Scholar]
- Valente, T.W. Social network thresholds in the diffusion of innovations. Soc. Netw. 1996, 18, 69–89. [Google Scholar] [CrossRef]
- Jonker, J. Nieuwe Business Modellen: Samen Werken Aan Waardecreatie; Academic Service: Amsterdam, The Netherlands, 2015; ISBN 978-94-6220-086-9. [Google Scholar]
Figure 1.
Adopter categorization on the basis of innovativeness (adapted from [15]).
Figure 1.
Adopter categorization on the basis of innovativeness (adapted from [15]).

Figure 2.
Representation of the solution.

Figure 3.
Example of the results dashboard showing (a) total greenhouse gas (GHG) emissions in gr CO2-equivalent per kg of milk and (b) a contribution analysis of the GHG emissions per source.
Figure 3.
Example of the results dashboard showing (a) total greenhouse gas (GHG) emissions in gr CO2-equivalent per kg of milk and (b) a contribution analysis of the GHG emissions per source.

© 2019 by the authors. Licensee MDPI, Basel, Switzerland. This article is an open access article distributed under the terms and conditions of the Creative Commons Attribution (CC BY) license (http://creativecommons.org/licenses/by/4.0/).
Share and Cite
MDPI and ACS Style
Mieras, E.; Gaasbeek, A.; Kan, D. How to Seize the Opportunities of New Technologies in Life Cycle Analysis Data Collection: A Case Study of the Dutch Dairy Farming Sector. Challenges 2019, 10, 8. https://doi.org/10.3390/challe10010008
AMA Style
Mieras E, Gaasbeek A, Kan D. How to Seize the Opportunities of New Technologies in Life Cycle Analysis Data Collection: A Case Study of the Dutch Dairy Farming Sector. Challenges. 2019; 10(1):8. https://doi.org/10.3390/challe10010008
Chicago/Turabian StyleMieras, Eric, Anne Gaasbeek, and Daniël Kan. 2019. "How to Seize the Opportunities of New Technologies in Life Cycle Analysis Data Collection: A Case Study of the Dutch Dairy Farming Sector" Challenges 10, no. 1: 8. https://doi.org/10.3390/challe10010008
Note that from the first issue of 2016, this journal uses article numbers instead of page numbers. See further details here.