The Mismatch between Anthropogenic CO2 Emissions and Their Consequences for Human Zinc and Protein Sufficiency Highlights Important Environmental Justice Issues

 , ,
, ,
Abstract
:1. Introduction
2. Results
3. Discussion
4. Materials and Methods
4.1. Data Sources
4.1.1. Increased Prevalence of Dietary Zinc and Protein Inadequacy with Elevated CO2 Concentrations
4.1.2. Country-Specific Cumulative CO2 Emissions
4.2. Statistical Analysis
5. Conclusions
Supplementary Materials
Author Contributions
Funding
Acknowledgments
Conflicts of Interest
References
- Althor, G.; Watson, J.E.; Fuller, R.A. Global mismatch between greenhouse gas emissions and the burden of climate change. Sci. Rep. 2016, 6, 20281. [Google Scholar] [CrossRef] [PubMed]
- USGCRP. The Impacts of Climate Change on Human Health in the United States: A Scientific Assessment; Crimmins, A.J., Balbus, J.L., Gamble, C.B., Beard, J.E., Bell, D., Dodgen, R.J., Eisen, N., Fann, M.D., Hawkins, S.C., Herring, L., et al., Eds.; Global Change Research Program: Washington, DC, USA, 2016; p. 312. [Google Scholar] [CrossRef] [Green Version]
- Haines, A.; Kovats, R.S.; Campbell-Lendrum, D.; Corvalán, C. Climate change and human health: Impacts, vulnerability and public health. Public Health 2006, 120, 585–596. [Google Scholar] [CrossRef] [PubMed]
- Ebi, K.L.; Ebi, K.L.; Balbus, J.M.; Luber, G.; Bole, A.; Crimmins, A.; Glass, G.; Saha, S.; Shimamoto, M.M.; Trtanj, J.; et al. Human health. In Impacts, Risks, and Adaptation in the United States: Fourth National Climate Assessment; Reidmiller, D.R., Avery, C.W., Easterling, D.R., Kunkel, K.E., Lewis, K.L.M., Maycock, T.K., Stewart, B.C., Eds.; Global Change Research Program: Washington, DC, USA, 2018; Volume II, pp. 539–571. [Google Scholar] [CrossRef]
- IPCC. Global Warming of 1.5 °C. An IPCC Special Report on the Impacts of Global Warming of 1.5 °C above Pre-Industrial Levels and Related Global Greenhouse Gas Emission Pathways, in the Context of Strengthening the Global Response to the Threat of Climate Change, Sustainable Development, and Efforts to Eradicate Poverty; Masson-Delmotte, V., Zhai, P., Pörtner, H.O., Roberts, D., Skea, J., Shukla, P.R., Pirani, A., Moufouma-Okia, W., Péan, C., Pidcock, R., et al., Eds.; IPCC: Geneva, Switzerland, 2018. [Google Scholar]
- IPCC. Climate Change 2014: Impacts, Adaptation, and Vulnerability. Part A: Global and Sectoral Aspects. Contribution of Working Group II to the Fifth Assessment Report of the Intergovernmental Panel on Climate Change; Field, C.B., Barros, V.R., Dokken, D.J., Mach, K.J., Mastrandrea, M.D., Bilir, T.E., Chatterjee, M., Ebi, K.L., Estrada, Y.O., Genova, R.C., et al., Eds.; Cambridge University Press: Cambridge, UK; New York, NY, USA, 2014. [Google Scholar]
- Wheeler, T.; Von Braun, J. Climate change impacts on global food security. Science 2013, 341, 508–513. [Google Scholar] [CrossRef] [PubMed]
- Parry, M.; Rosenzweig, C. The potential effects of climate change on world food supply. In Interacting Stresses on Plants in a Changing Climate; Springer: Berlin/Heidelberg, Germany, 1993; pp. 1–26. [Google Scholar]
- Long, S.P.; Ainsworth, E.A.; Leakey, A.D.; Nösberger, J.; Ort, D.R. Food for thought: Lower-than-expected crop yield stimulation with rising CO2 concentrations. Science 2006, 312, 1918–1921. [Google Scholar] [CrossRef] [PubMed]
- Myers, S.S.; Zanobetti, A.; Kloog, I.; Huybers, P.; Leakey, A.D.; Bloom, A.J.; Carlisle, E.; Dietterich, L.H.; Fitzgerald, G.; Hasegawa, T. Increasing CO2 threatens human nutrition. Nature 2014, 510, 139. [Google Scholar] [CrossRef] [PubMed]
- Medek, D.E.; Schwartz, J.; Myers, S.S. Estimated effects of future atmospheric CO2 concentrations on protein intake and the risk of protein deficiency by country and region. Environ. Health Perspect. 2017, 125, 087002. [Google Scholar] [CrossRef] [PubMed]
- Zhu, C.; Kobayashi, K.; Loladze, I.; Zhu, J.; Jiang, Q.; Xu, X.; Liu, G.; Seneweera, S.; Ebi, K.L.; Drewnowski, A. Carbon dioxide (CO2) levels this century will alter the protein, micronutrients, and vitamin content of rice grains with potential health consequences for the poorest rice-dependent countries. Sci. Adv. 2018, 4. [Google Scholar] [CrossRef] [PubMed] [Green Version]
- IPCC. Climate Change 2013: The Physical Science Basis. Contribution of Working Group I to the Fifth Assessment Report of the Intergovernmental Panel on Climate Change; Stocker, T.F., Qin, D., Plattner, G.-K., Eds.; Cambridge University Press: Cambridge, UK; New York, NY, USA, 2013; pp. 1395–1446. [Google Scholar]
- Smith, M.R.; Myers, S.S. Impact of anthropogenic CO2 emissions on global human nutrition. Nat. Clim. Chang. 2018, 8, 834. [Google Scholar] [CrossRef]
- Weyant, C.; Brandeau, M.L.; Burke, M.; Lobell, D.B.; Bendavid, E.; Basu, S. Anticipated burden and mitigation of carbon-dioxide-induced nutritional deficiencies and related diseases: A simulation modeling study. PLoS Med. 2018, 15, e1002586. [Google Scholar] [CrossRef] [PubMed]
- Black, R.E.; Allen, L.H.; Bhutta, Z.A.; Caulfield, L.E.; De Onis, M.; Ezzati, M.; Mathers, C.; Rivera, J.; Maternal and Child Undernutrition Study Group. Maternal and child undernutrition: Global and regional exposures and health consequences. Lancet 2008, 371, 243–260. [Google Scholar] [CrossRef]
- Black, R.E.; Victora, C.G.; Walker, S.P.; Bhutta, Z.A.; Christian, P.; De Onis, M.; Ezzati, M.; Grantham-McGregor, S.; Katz, J.; Martorell, R. Maternal and child undernutrition and overweight in low-income and middle-income countries. Lancet 2013, 382, 427–451. [Google Scholar] [CrossRef]
- World Bank County and Lending Groups. The World Bank Group. 2018. Available online: https://datahelpdesk.worldbank.org/knowledgebase/articles/906519-world-bank-country-and-lending-groups (accessed on 22 March 2018).
- World Population Prospects. The 2017 Revision. United Nations, Department of Economic and Social Affairs, Population Division. 2017. Available online: https://esa.un.org/unpd/wpp/ (accessed on 22 March 2018).
- Fleurbaey, M.; Kartha, S.; Bolwig, S.; Chee, Y.L.; Chen, Y.; Corbera, E.; Sagar, A.D. Sustainable development and equity. In Climate Change 2014: Mitigation of Climate Change. Contribution of Working Group III to the Fifth Assessment Report of the Intergovernmental Panel on Climate Change; Edenhofer, O.R., Pichs-Madruga, Y., Sokona, E., Farahani, S., Kadner, K., Seyboth, A., Adler, I., Baum, S., Brunner, P., Eickemeier, B., et al., Eds.; Cambridge University Press: Cambridge, UK; New York, NY, USA, 2014. [Google Scholar]
- CO2 Emissions. Global Carbon Atlas. 2018. Available online: http://www.globalcarbonatlas.org/en/CO2-emissions (accessed on 22 March 2018).
- Boden, T.A.; Andres, R.J.; Marland, G. Global, Regional, and National Fossil-Fuel CO2 Emissions (1751–2010); Carbon Dioxide Information Analysis Center (CDIAC); Oak Ridge National Laboratory (ORNL): Oak Ridge, TN, USA, 2013. [Google Scholar]
- United Nations Framework Convention on Climate Change. National Inventory Submission 2017. Available online: http://unfccc.int/national_reports/annex_i_ghg_inventories/national_inventories_submissions/items/9492.php (accessed on 22 March 2018).
- British Petroleum. Statistical Review of World Energy. Available online: http://www.bp.com/en/global/corporate/energy-economics.html (accessed on 22 March 2017).
- US Energy Information Administration (EIA). International Energy Outlook 2017. Available online: https://www.eia.gov/outlooks/archive/ieo17/ (accessed on 24 February 2018).
- US Energy Information Administration. World Energy Projection System Plus: Overview; US Department of Energy: Washington, DC, USA, 2017. Available online: https://www.eia.gov/outlooks/archive/m074(2017).pdf (accessed on 24 February 2018).
- McGrath, J.M.; Lobell, D.B. Regional disparities in the CO2 fertilization effect and implications for crop yields. Environ. Res. Lett. 2013, 8, 014054. [Google Scholar] [CrossRef] [Green Version]
- Smith, M.R.; Micha, R.; Golden, C.D.; Mozaffarian, D.; Myers, S.S. Global expanded nutrient supply (genus) model: A new method for estimating the global dietary supply of nutrients. PLoS ONE 2016, 11, e0146976. [Google Scholar] [CrossRef]
- Institute of Medicine. Subcommittee on the interpretation and uses of dietary reference intakes. In Applications in Dietary Assessment; National Academies Press: Washington, DC, USA, 2000. Available online: https://www.ncbi.nlm.nih.gov/books/NBK222898/ (accessed on 20 February 2020).


| Income Groups [18] | Population 2011 Excluding Countries with Missing Data (Thousands) a,b | Population 2050 Excluding Countries with Missing Data (Thousands) a,c | Population 2050 Complete Population Prospects (Thousands) c | Per Capita CO2 in 2011 (MtCO2) | Per Capita CO2 in 2050 (MtCO2) | Cumulative Per Capita CO2 (2011–2050) (MtCO2) | % Increase in Prevalence of Zinc Deficiency (95% CI) [14] | % Increase in Prevalence of Protein Deficiency (95% CI) [14] |
|---|---|---|---|---|---|---|---|---|
| Worldd | 6,576,127 | 8,864,390 | 9,770,817 | 4.3 | 4.6 | 172 | 1.8% (1.6–1.9) | 1.3% (1.2–1.4) |
| High-Income d | 1,157,231 | 1,296,592 | 1,352,321 | 12.0 | 10.8 | 433 | 0.7% (0.5–0.8) | 0.5% (0.4–0.5) |
| Australia | 22,480 | 33,187 | 33,187 | 18.0 | 16.4 | 639 | 0.3% (0.3–0.3) | 0.1% (0.1–0.2) |
| Canada | 34,539 | 44,949 | 44,949 | 16.2 | 14.9 | 618 | 0.6% (0.5–0.6) | 0.3% (0.2–0.4) |
| Japan | 128,505 | 108,794 | 108,794 | 9.8 | 8.7 | 346 | 1.5% (1.3–1.7) | 0.7% (0.5–1.0) |
| New Zealand | 4418 | 5711 | 5711 | 7.8 | 8.5 | 308 | 0.3% (0.2–0.3) | 0.1% (0.0–0.1) |
| South Korea | 49,745 | 50,457 | 50,457 | 11.8 | 18.4 | 587 | 1.2% (1.1–1.4) | 0.7% (0.4–1.0) |
| United States | 311,051 | 389,592 | 389,592 | 17.9 | 13.0 | 585 | 0.3% (0.2–0.3) | 0.5% (0.3–0.8) |
| Upper Middle-Income d | 2,477,165 | 2,757,330 | 2,769,833 | 6.1 | 6.5 | 250 | 1.5% (1.2–1.7) | 1.3% (1.1–1.4) |
| Brazil | 198,687 | 232,688 | 232,688 | 2.2 | 2.9 | 100 | 0.8% (0.7–0.9) | 0.5% (0.3–0.8) |
| China | 1,367,480 | 1,364,457 | 1,364,457 | 7.1 | 7.2 | 288 | 1.2% (1.0–1.5) | 1.6% (1.1–2.1) |
| Mexico | 119,090 | 164,279 | 164,279 | 4.1 | 3.3 | 133 | 2.2% (1.9–2.6) | 0.3% (0.2–0.5) |
| Russian Federation | 143,264 | 132,731 | 132,731 | 12.0 | 11.6 | 458 | 0.8% (0.7–0.9) | 1.0% (0.5–1.5) |
| Lower Middle-Income d | 2,503,334 | 3,817,825 | 4,126,176 | 1.4 | 2.2 | 69 | 2.3% (2.1–2.5) | 1.7% (1.4–1.9) |
| India | 1,247,236 | 1,658,978 | 1,658,978 | 1.5 | 3.0 | 87 | 2.7% (2.4–2.9) | 2.1% (1.4–2.9) |
| Low-Income d | 405,538 | 948,282 | 1,509,883 | 0.3 | 0.2 | 11 | 2.1% (1.8–2.3) | 1.0% (0.7–1.3) |
| Regressor | N | Slope (SE) a | R2 | p-Value |
|---|---|---|---|---|
| Risk of Zinc Deficiency | ||||
| Unweighted | 146 | −0.10 (0.03) | 0.06 | <0.01 * |
| Population-weighted b | 146 | −0.27 (0.04) | 0.27 | <0.001 * |
| Unweighted with outliers removed | 141 | −0.31 (0.05) | 0.25 | <0.001 * |
| Population-weighted with outliers removed b | 141 | −0.32 (0.04) | 0.32 | <0.001* |
| Risk of Protein Deficiency | ||||
| Unweighted | 146 | −0.06 (0.03) | 0.03 | 0.03 * |
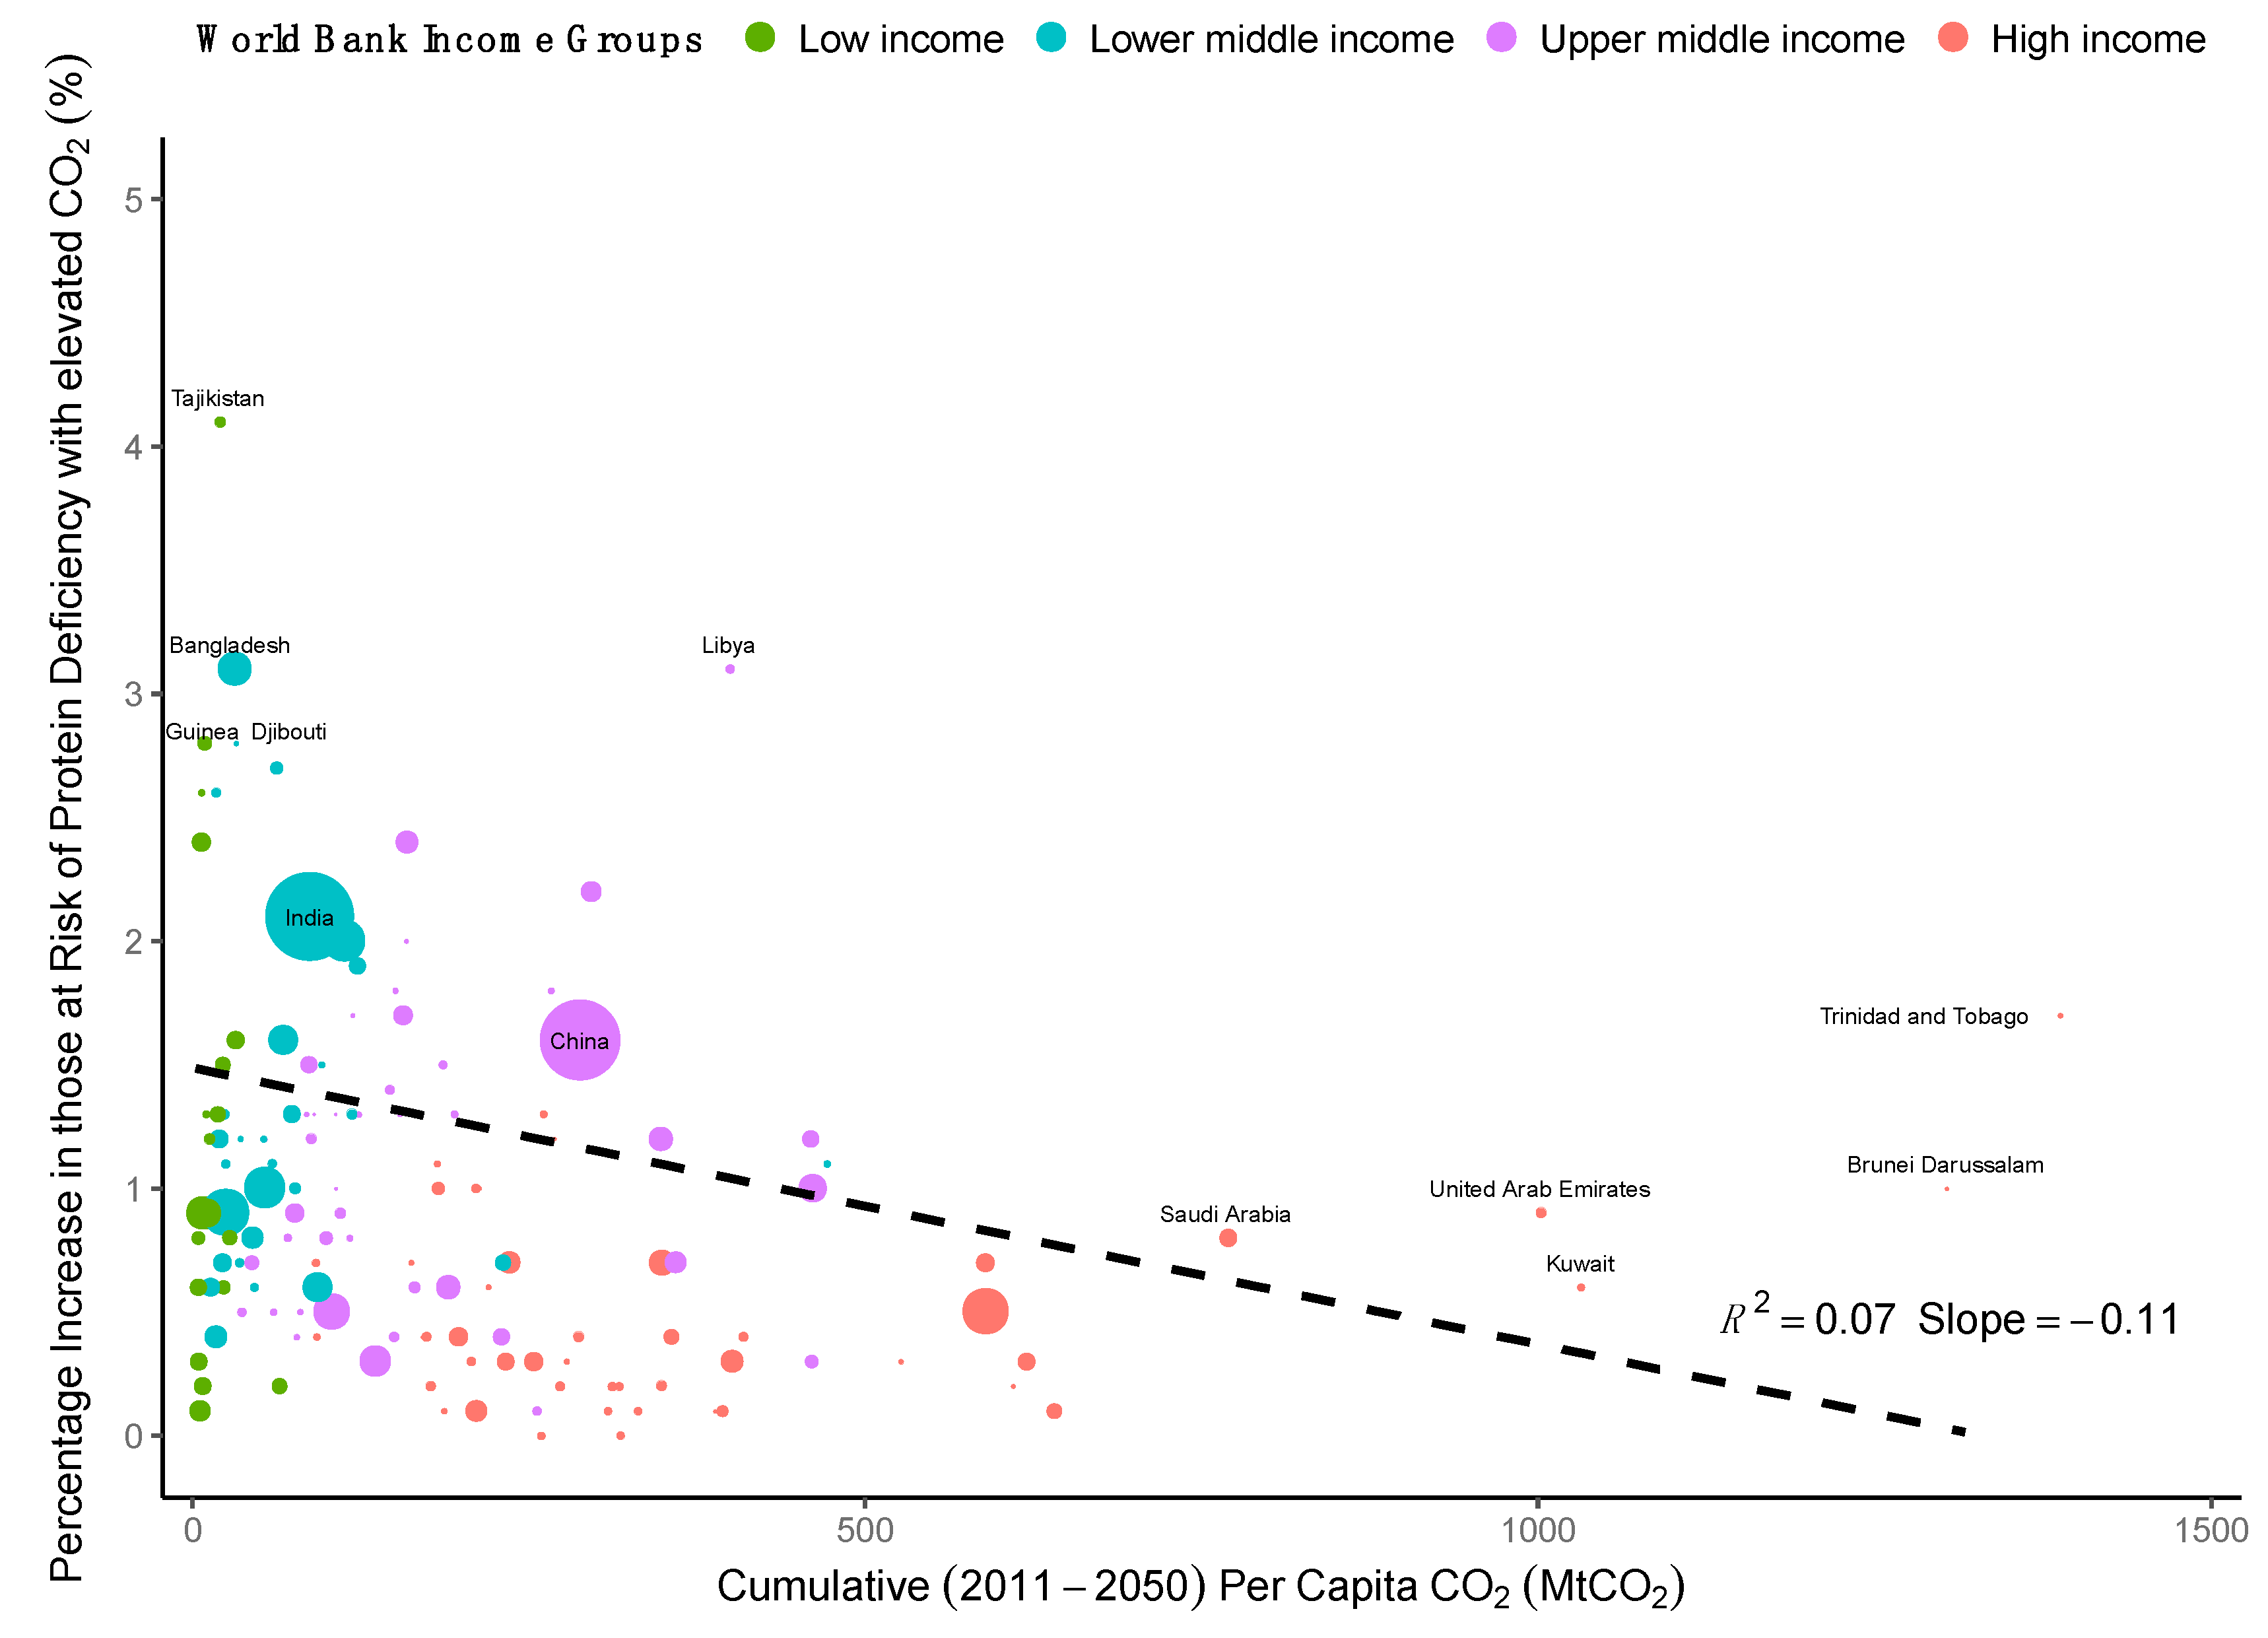
| Populated-weighted | 146 | −0.11 (0.03) | 0.07 | <0.01 * |
| Unweighted with outliers removed | 141 | −0.15 (0.04) | 0.09 | <0.001 * |
| Population-weighted with outliers removed b | 141 | −0.12 (0.04) | 0.07 | <0.01* |
© 2020 by the authors. Licensee MDPI, Basel, Switzerland. This article is an open access article distributed under the terms and conditions of the Creative Commons Attribution (CC BY) license (http://creativecommons.org/licenses/by/4.0/).
Share and Cite
Moore, E.R.H.; Smith, M.R.; Humphries, D.; Dubrow, R.; Myers, S.S. The Mismatch between Anthropogenic CO2 Emissions and Their Consequences for Human Zinc and Protein Sufficiency Highlights Important Environmental Justice Issues. Challenges 2020, 11, 4. https://doi.org/10.3390/challe11010004
Moore ERH, Smith MR, Humphries D, Dubrow R, Myers SS. The Mismatch between Anthropogenic CO2 Emissions and Their Consequences for Human Zinc and Protein Sufficiency Highlights Important Environmental Justice Issues. Challenges. 2020; 11(1):4. https://doi.org/10.3390/challe11010004
Chicago/Turabian StyleMoore, Elizabeth R. H., Matthew R. Smith, Debbie Humphries, Robert Dubrow, and Samuel S. Myers. 2020. "The Mismatch between Anthropogenic CO2 Emissions and Their Consequences for Human Zinc and Protein Sufficiency Highlights Important Environmental Justice Issues" Challenges 11, no. 1: 4. https://doi.org/10.3390/challe11010004