
Efficient Methane Production from Anaerobic Digestion of Cow Dung: An Optimization Approach
1
Department of Physics, Renewable Energy Research Centre, University of Fort Hare, Private Bag X1314, Alice 5700, South Africa
2
Fort Hare Institute of Technology, University of Fort Hare, Private Bag X1314, Alice 5700, South Africa
*
Author to whom correspondence should be addressed.
Challenges 2022, 13(2), 53; https://doi.org/10.3390/challe13020053
Submission received: 17 July 2022
/
Revised: 17 October 2022
/
Accepted: 19 October 2022
/
Published: 22 October 2022
(This article belongs to the Section Renewable Energies)
Abstract
:In the context of addressing the global challenge of facilitating a decision-making process based on methane production using a predictive model, the study seeks to evaluate the performance of a biogas digester in varying operating conditions for optimization purposes. One of the techniques for doing this is the application of constrained linear least-square optimization. This has been employed to optimize the input parameter with the corresponding measured desired response. The developed model was built from 430 measured data set points of all the predictors over an 18-day monitoring period with an interval of 30 min. The result showed that the difference between the optimized model and the general model output for methane production in the biogas digester was less than 4%. Hence, the performance of the model demonstrated a strong validity as the determination coefficient (R2) between the modeled, and optimized output was 0.968 for the volume of methane produced in the biogas digester. The obtained determination coefficient of the developed and optimized model suggests that the modeled value of the methane fits well with the measured value of methane for validation. Thus, from the test dataset, the optimized and modeled methane volume was reported as 28%. In this scenario, under the various operational parameters, an increase of 26.5% in methane was obtained when comparing the maximum volume of methane from the optimization process with the maximum methane volume (54.5%) produced in the real biogas digester. Interestingly, the biogas digester produced a maximum methane yield of 0.24 m3 and a methane composition of 60%. Evidently, methane yield was influenced by temperature as well as other meteorological factors in the developed model hence, these factors should be widely considered for sustainable biogas production.
1. Introduction
Anaerobic digestion of organic waste is an efficient process to produce biogas with high energy value. In recent times, this technology has attracted so much attention due to the added advantage of minimizing greenhouse gas emissions. The produced biogas serving as an alternative or supplement for fossil fuels products results in reduced emissions [1]. In addition, anaerobic digestion is considered an economical and effective technique due to the use of waste as a substrate. Organic waste such as animal waste, sewage sludge, industrial organic residue, and agricultural waste are usually employed with animal waste topping the list. Among animal waste, cow dung is mostly used as a substrate due to its universal abundance and availability. Not only does cow dung serve as a substrate, but it is also used for thermal insulation and as a fertilizer for soil conditioning. In terms of biogas production, previous studies have shown its effectiveness as a substrate. For instance, the effectiveness of cow dung for biogas production was carried out by Mukumba et al. [2]. The study revealed that cow dung produced a biogas yield with a 50% average methane composition. Interestingly, the study noted that the use of cow dung resulted in an early retention time with a high biogas yield. On a similar note, Obileke et al. [3] compared the performance of an aboveground and underground fixed dome digester using cow dung as substrate installed in the Eastern Cape Province. The findings showed that the optimum methane yield was 50% and 60% for aboveground and underground digester systems respectively. This is a further indication that the use of cow dung as substrate results in higher methane yield. Although studies have noted that the type of organic substrate used, plays a significant role in the composition of biogas produced. However, some other factors which are termed operational such as temperature is of great importance thus, bringing the need for process optimization.
Therefore, adjusting inputs to find the minimum or maximum output is referred to as optimization. Previous studies have used optimization tools such as artificial neural networks (ANN) and generic algorithms (GA) for poultry droppings [4], organic waste [5], and fertilizers [6] to produce biogas. Pei et al. [7], Optimized the production of biogas from substrates such as banana pseudo-stem fiber, a mixture of rapeseed residue and cow dung [8], and poultry manure [9] using the response surface method (RSM). Gueguim Kane et al. [10] study focused on the modeling and optimization of biogas production using a mixed substrate of sawdust, cow dung, banana stalks, rice bran, and paper waste using ANNGA couplings. In addition, Sathish and Vivekanandan [11] used both RSM and ANN to model and optimize biogas yields. According to their study, the prediction accuracy of ANN is superior to the prediction accuracy of RSM. ANN represents the complex relationship between input and output data, as in the case of anaerobic digestion. The beauty of artificial neural networks must deal with their high nonlinear relation to a large dataset due to their intrinsic nonlinearity, adaptability, noise immunity, generalization ability, and robustness. They are regarded as effective modeling data tools used to capture and represent complex predictor/response relationships for the stimulation and control of anaerobic digestion for biogas production [5]. For ANN to be successful, it needs to be integrated into optimization techniques. This identifies the optimal operating parameters for the biogas digester and the optimal combination of different substrates to increase biogas. As a result, optimization of biogas production can assist biogas fermenters as they function economically. GA, on the other hand, is a biologically inspired computational model based on modeling genetic recombination and natural selection. It processes various variables and processes numerically generated data, experimental data, or analytic functions. Therefore, there is no need to optimize the information about the structure of the function and use it as a black box [12].
On a global scale, the study addresses and contributes to planetary health (health, places, and planet) directly or indirectly. These three areas mutually affect each other, so that the final assessment can be made, and decision-making is taken based on the findings. Despite this, it has been the heartbeat of researchers and energy engineers in establishing an effective approach to optimize the input parameter with respect to the measured response. The establishment of this approach or technique creates a platform for arriving at the best design relative to a given set of constraints. To this end, an optimization approach via constrained linear least squares was employed which provides a breakthrough to the challenge. Optimum production of biogas attained using optimization via constrained linear least square technique tends to contribute towards the improvement of quality of life (health), reduces energy cost incurred (human being), and mitigates global greenhouse effect as well as less carbon dioxide emission (environment). Over time, these areas have been affected as related to the energy crisis which tends to be a global challenge. The utilization of the employed approach enhances the prediction accuracy and reliability of the developed model.
Having looked at the need for renewable energy, anaerobic digestion potential, previous studies on optimization of biogas production, and the significance of the study in addressing the global challenge, the present study aimed to optimize the input parameters corresponding to the measured desired response by the employment of the constrained linear least-squares technique for efficient optimization purposes. This technique is a general MATLAB optimization tool. In so doing, finding out the difference between the optimized model and general model output as well as the determination coefficient between the modeled and optimized output of the methane volume will be presented. The study provides novelty and originality in two ways; (1) the optimization of methane production using the constrained least square technique. (2), the use of mono-digestion of the substrate in solid anaerobic digestion as regards the recent studies involving co-digestion [1,12,13,14]. Therefore, the authors would like to state that, to the best of their knowledge, no study related to the present one has been published based on the scientific resources available. This study is of great essence as it will help facilitate the decision-making process, thereby providing a predictive model obtained which can be integrated into the real-life experience by the facility operator, engineers of the biogas facility, and renewable energy at large.
2. Materials and Methods
2.1. Preparation of Substrate and Set Up of the Biogas Digester
The collected fresh cow dung used as a substrate in the study was from a dairy farm at Fort Hare University. With the ratio of 1:1 (waste/water), the slurry was obtained by the dilution of solid waste and water, based on Obileke et al. [15] study (See Figure 1), which is the same as the ratio proportion reported by Zareei and Khodaei [16] study, The mixing process was conducted manually and stirring the mixture of cow dung and water in an open cylindrical container. The essence of mixing and stirring is to ensure homogeneity is achieved. The substrate was characterized using the following parameter: total solids (TS), volatile solids (VS), pH, chemical oxygen demand (COD), temperature, and calorific value as summarized in Table 1.
All these analytical determinations were carried out at the Microbiology Department, Fort Hare University, according to the standard methods APHA 2005 [17]. The biogas digester was fed 200 L of slurry on the first day and then the gas valve was left open for 72 h (3 days) from the first day of feeding. This is necessary to expel the air. Later, inoculum from existing biogas digestion tanks was introduced into the biogas digestion tanks, increasing the rate of biodegradation or fermentation. Then, in subsequent supplies, 50 L of the slurry was introduced every 3 days. Cow dung occupies about 55–60% of the total fermenter, leaving enough space for biogas to accumulate. The biogas digester chamber (2.15 m3) was fabricated from high-density polyethylene (HDPE) material and was executed by Ikusasa Green (Pty) Limited located at Stutterheim in Eastern Cape, South Africa. On the other hand, the inlet and outlet chamber was built with the use of clinker bricks. The volume of the digester was split into a 1.50 m3 operating part, 0.64 m3 gas storage, and 0.01 m3 neck volume where the gas valve is located. The internal diameter and peak of the digester were 1400 and 1700 mm respectively. The combination choice of the material provides novelty and innovation in terms of the design of the biogas digester which has in no way been utilized in any study. The biogas digester was operated as a continuous process with a liquid operating volume of 1.80 m3 and a hydraulic retention time of 18 days under mesophilic conditions. For complete-scale experiments, the production of biogas was recorded daily.
The gas, temperature, and pressure measurement sensor (GTPMS) and the data acquisition system (DAS) were built and designed to monitor the performance and collection of data for the biogas digester system. The GTPMS consisted of the gas sensor, pressure sensor, air pump, hydrophobic filter, and thermocouple modules. This could monitor the methane gas and the temperature of the slurry and gas. The precise equipment used for measuring the methane gas was a non-dispersive infrared (NDIR) sensor whereas the temperature was measured using a K-type thermocouple. pH measurement was done manually using the pH digital meter throughout the 18-day monitoring period. On the other hand, the DAS consisted of the data logger, power supply unit, circuit breaker, and converter. It was powered by the control unit and was used to store and collect data from the GTPMS, specifically for methane and temperature. The data collection was done over a monitoring period of 18 days with an interval of 30 min using a CR 1000 data logger.
2.2. Consideration of Parameters Used in the Study
The selection of parameters for the development of the model (Equation (1)) was based on factors that affect the input materials [18]. These include the following: pHr, Tg, Tb, and Tt as the indoor parameters while Ir, RHr, and Tam are referred to as the outdoor parameters. Both the indoor and outdoor parameter is known as predictors whereas the desired response is the produced methane. The definitions of these parameters are presented in Table 2 which is referred to as the set of effective parameters used in the development model.
Having looked at the material and methods used in the study, Table 3 presents the summary of the materials and equipment used in the study.
2.3. Development of the Mathematical Model
From the data acquisition system (DAS), as explained in Section 2.1, a total of 430 measured datasets of all the predictors or input parameters were collected. The 430 measured datasets were split into two, such that 286 (67%) were used as a trained dataset for the development of the model while 144 (33%) served as the test dataset for the validation of the model. The model in Equation (1), was developed from a linear combination of the product term of the affected input and the exponential combination of the desired input using MATLAB.
Equation (1) can be reduced into a more simplified form as presented in Equation (2).
where
V = A + Bx + CY
V = Volume of the desired response of the CH4 yield in %.
A = Forcing constant (%), referred to the lumped constant that caters to the possible input parameter that could impact the output but is not considered in the derivation of the mathematical equation.
= Linear combination term for the product of the relative input quantity (PHr, Ir, RHr), air temperature inputs quantities (Tg, Tam), and the slurry temperature inputs quantities (Tb, Tt). Its unit is (°C).
B = Scaling constant for x, and the unit is %/(°C). B is equated to a positive or negative real number known as the scaling value upon which the derivation of the mathematical model is developed.
= Exponential term for the summation of the relative input quantities (PHr, Ir, RHr) and has no unit.
C = Scaling constant for Y, and the unit is %. C is equated to a positive or negative real number called the scaling value upon which derivation of the mathematical model is developed [18].
The mathematical model (Equation (1)) contains multiple independent variables. Therefore, the least squares and maximum likelihood methods were used to estimate the parameters used to develop the model. Using the principle of least squares, the coefficients of the linear regression model were determined by minimizing the sum of squares of the difference between the approximate and observed values. On the other hand, the maximum likelihood was used to choose those which maximized the likelihood function [18].
2.4. Optimization and Validation of the Mathematical Model
This deals with employing a constrained linear least-squares optimization technique to optimize the input parameters corresponding to the measured desire response using the test dataset for the biogas digester. Furthermore, the implementation of the optimization of the test input dataset using the objective equation, which is equal to the derived mathematical model, aids in optimizing the set of input data values, which upon inputted into the model equation would give the specified output value [19].
The use of the constrained linear least-squares optimization in the optimization tool was possible because the custom non-linear model equation (See Equation (1)) for the methane volume of the systems was reduced to multiple linear regression models with the introduction of the lump input parameters as shown in Equation (2).
Furthermore, the optimized lump parameters for the methane for the biogas digester were used to produce the optimized predicted response. Therefore, to validate the model of gas production of the system, this was conducted between the modeled response from the test lump input dataset and the respective optimized model from the optimized input values obtained from the final point. The results demonstrated a strong correlation between the optimized model and the measured test response data points as opposed to the modeled response and the measured test response data points.
3. Results and Discussions
As seen in Section 2.3, 286 datasets of predictors and responses were used in the trained data set to build and derive the forcing and scaling constants for the development of the model (See Equation (1)). Therefore, Table 4 shows the model equation determination coefficient, forcing, and scaling constant of the methane production in volume.
It was observed in Table 5, that all three constants (A, B, and C) are positive and hence any increase in the lump input parameter (x or y) would result in a corresponding increase in the methane volume provided the other remained unchanged. Also, any decrease in the lump input predictors would result in a reduction in the volume of methane production. The lump input parameter (x and y) to the desired output is shown in Figure 1, presented in a 3D plot.
It can be depicted from Figure 1 that the plotted dataset points exhibited very good fits with the mesh surface model plot without outliers. Hence, the determination coefficient (R2) between the modeled methane volume and the measured methane volume production was 0.968 (See Table 4). This suggests that the modeled value of the methane fits well with the measured value of the methane used for the validation. Figure 1 is necessary as it represents all possible model outputs as regards the potential combination of the set of input values over a range of the trained data. Notably, the black solids circles in Figure 1 show the calculated methane yield in the biogas digester.
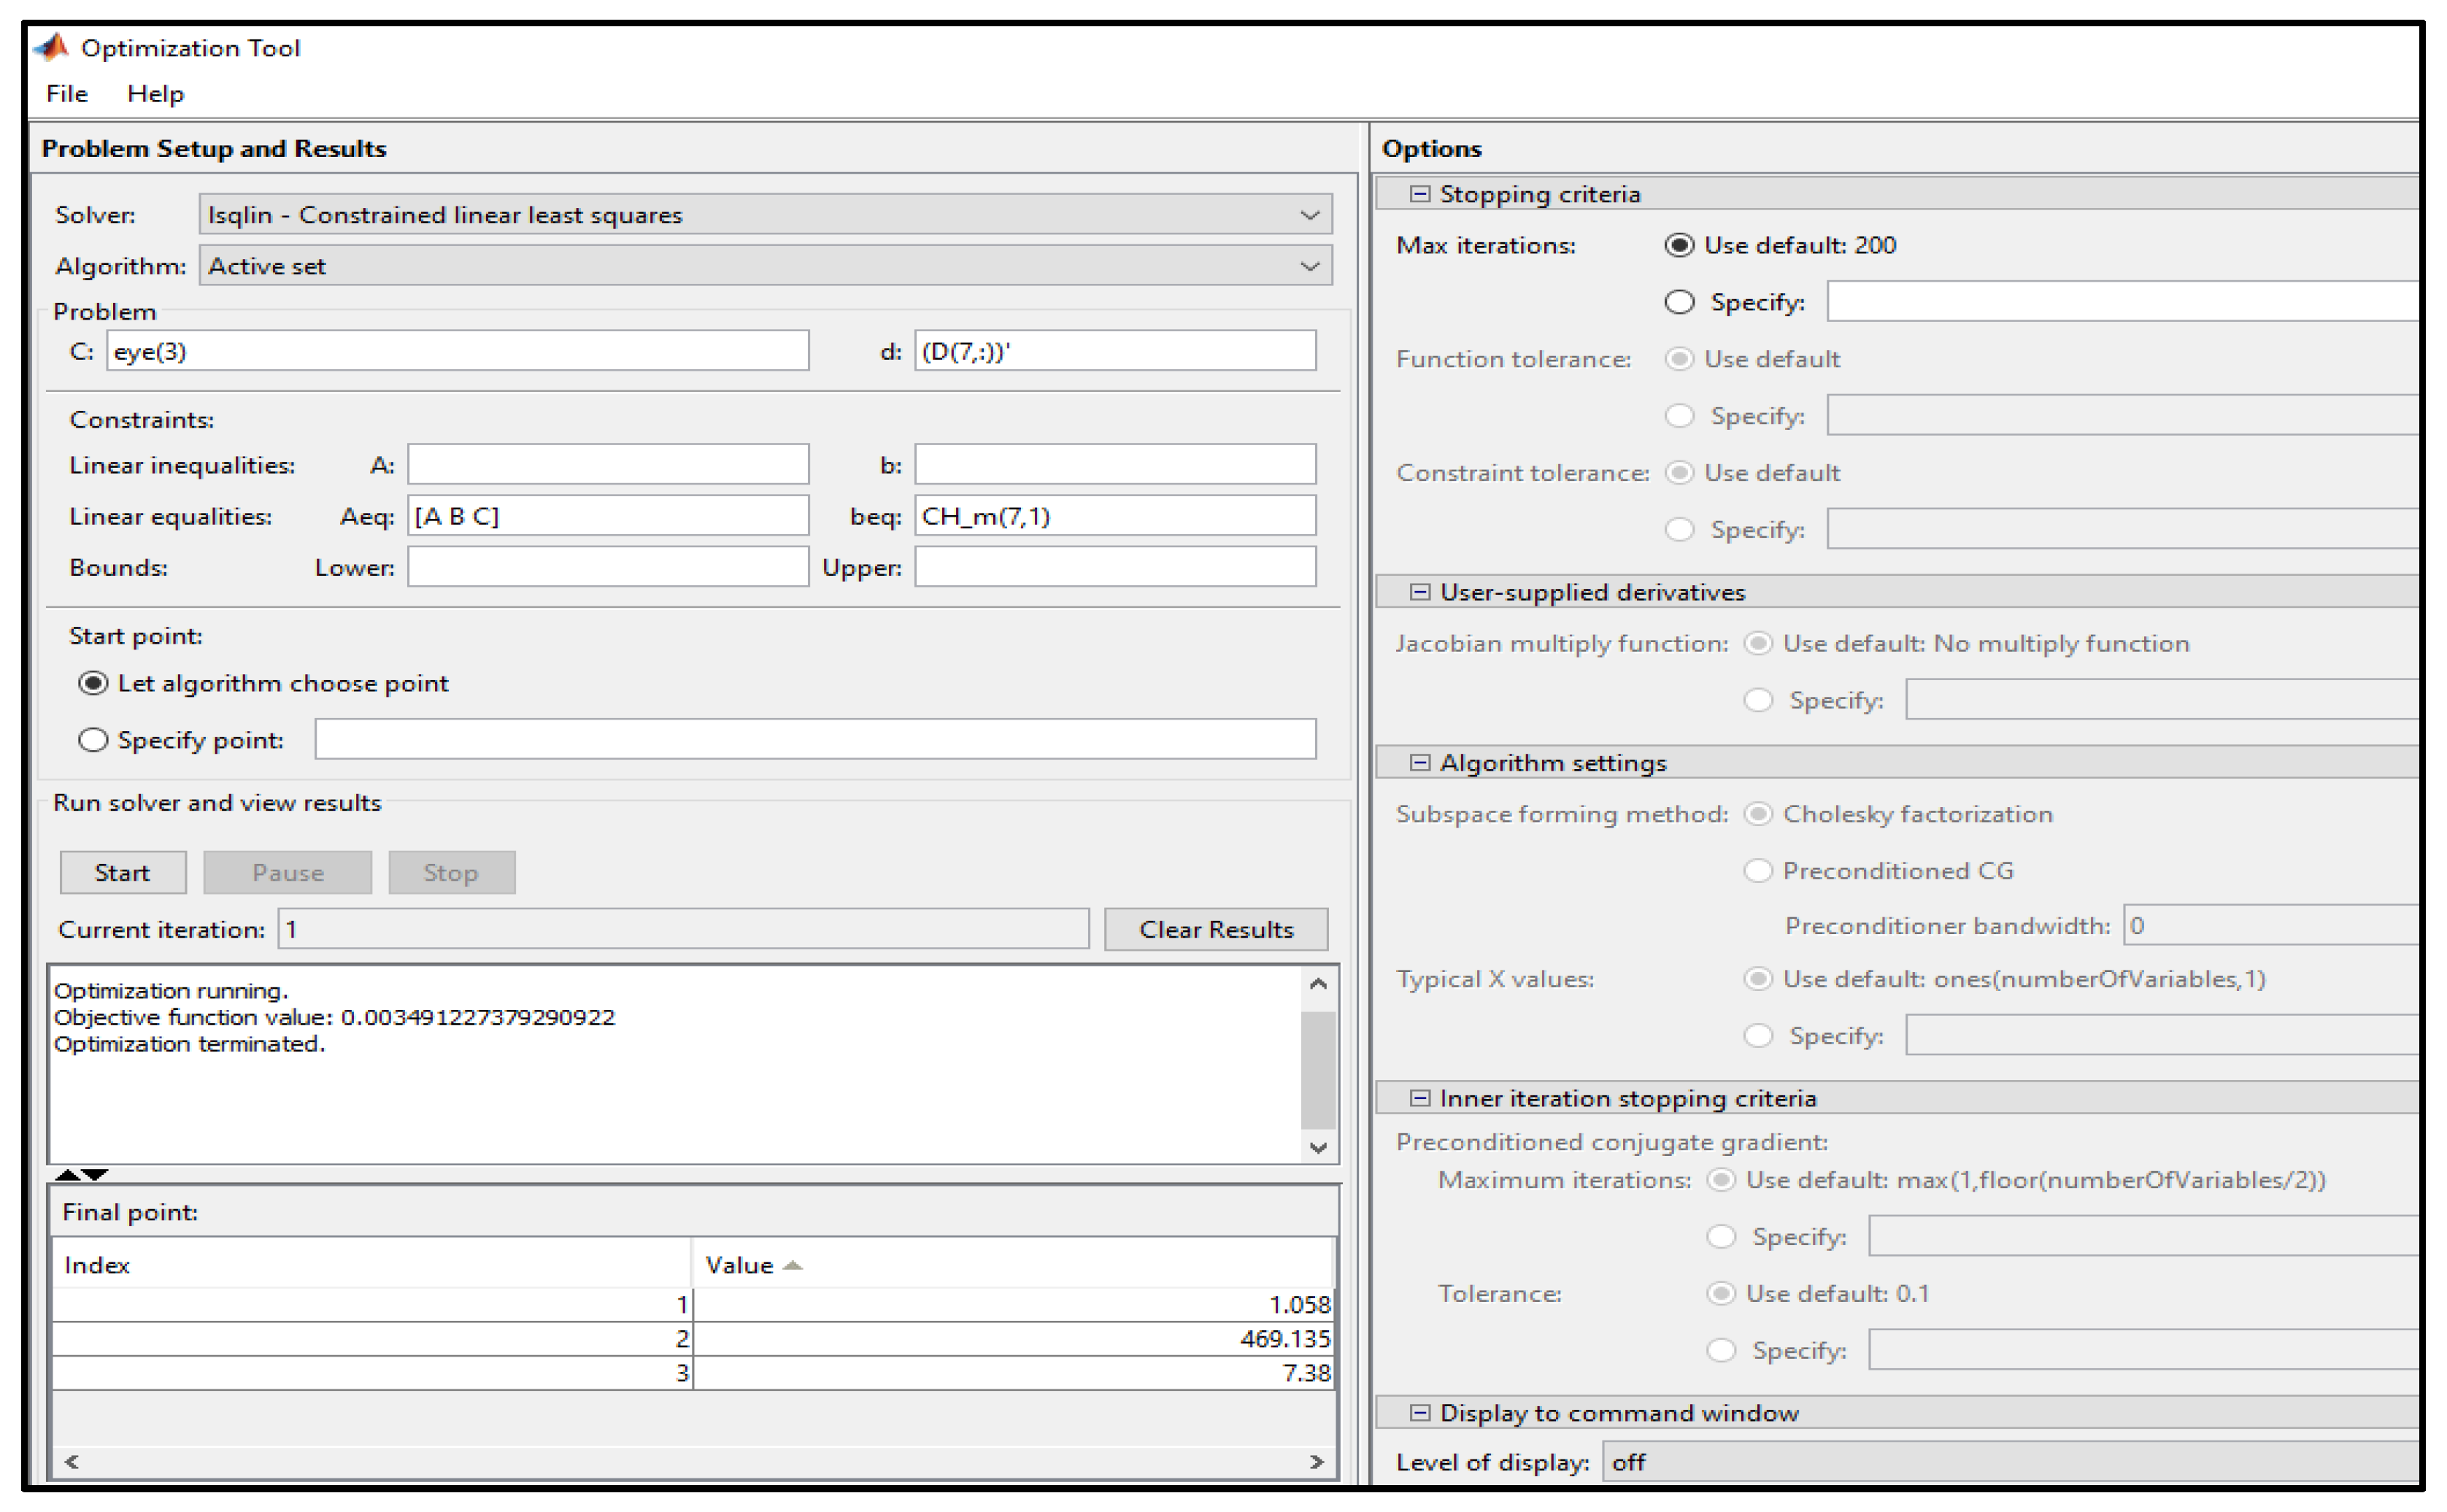
The constrained least squares method was invoked from the optimization tool as the solver to run the optimization. All the required boxes on the optimization tool graphical user interface (GUI) are completed using the lump input parameters (x and y), objective equation, and the desired response. These are associated with the test dataset and mathematical model equation for the biogas digester in predicting methane gas production. Upon completion of the set parameters, the optimization tool start button was clicked to run the optimization as shown in Figure 2.
Figure 2 shows the GUI of the optimization with the current iterations, objective function value, and final point displayed.
In Table 5, the modeled forcing constant multiplier, specific values for the lump parameters x and y, and the corresponding output value for a sample of the test data set are presented.
Table 6 shows the optimized modeled forcing constant multiplier, specific values for the lump input parameters x and y, and the corresponding optimized output value for a sample of the test dataset.
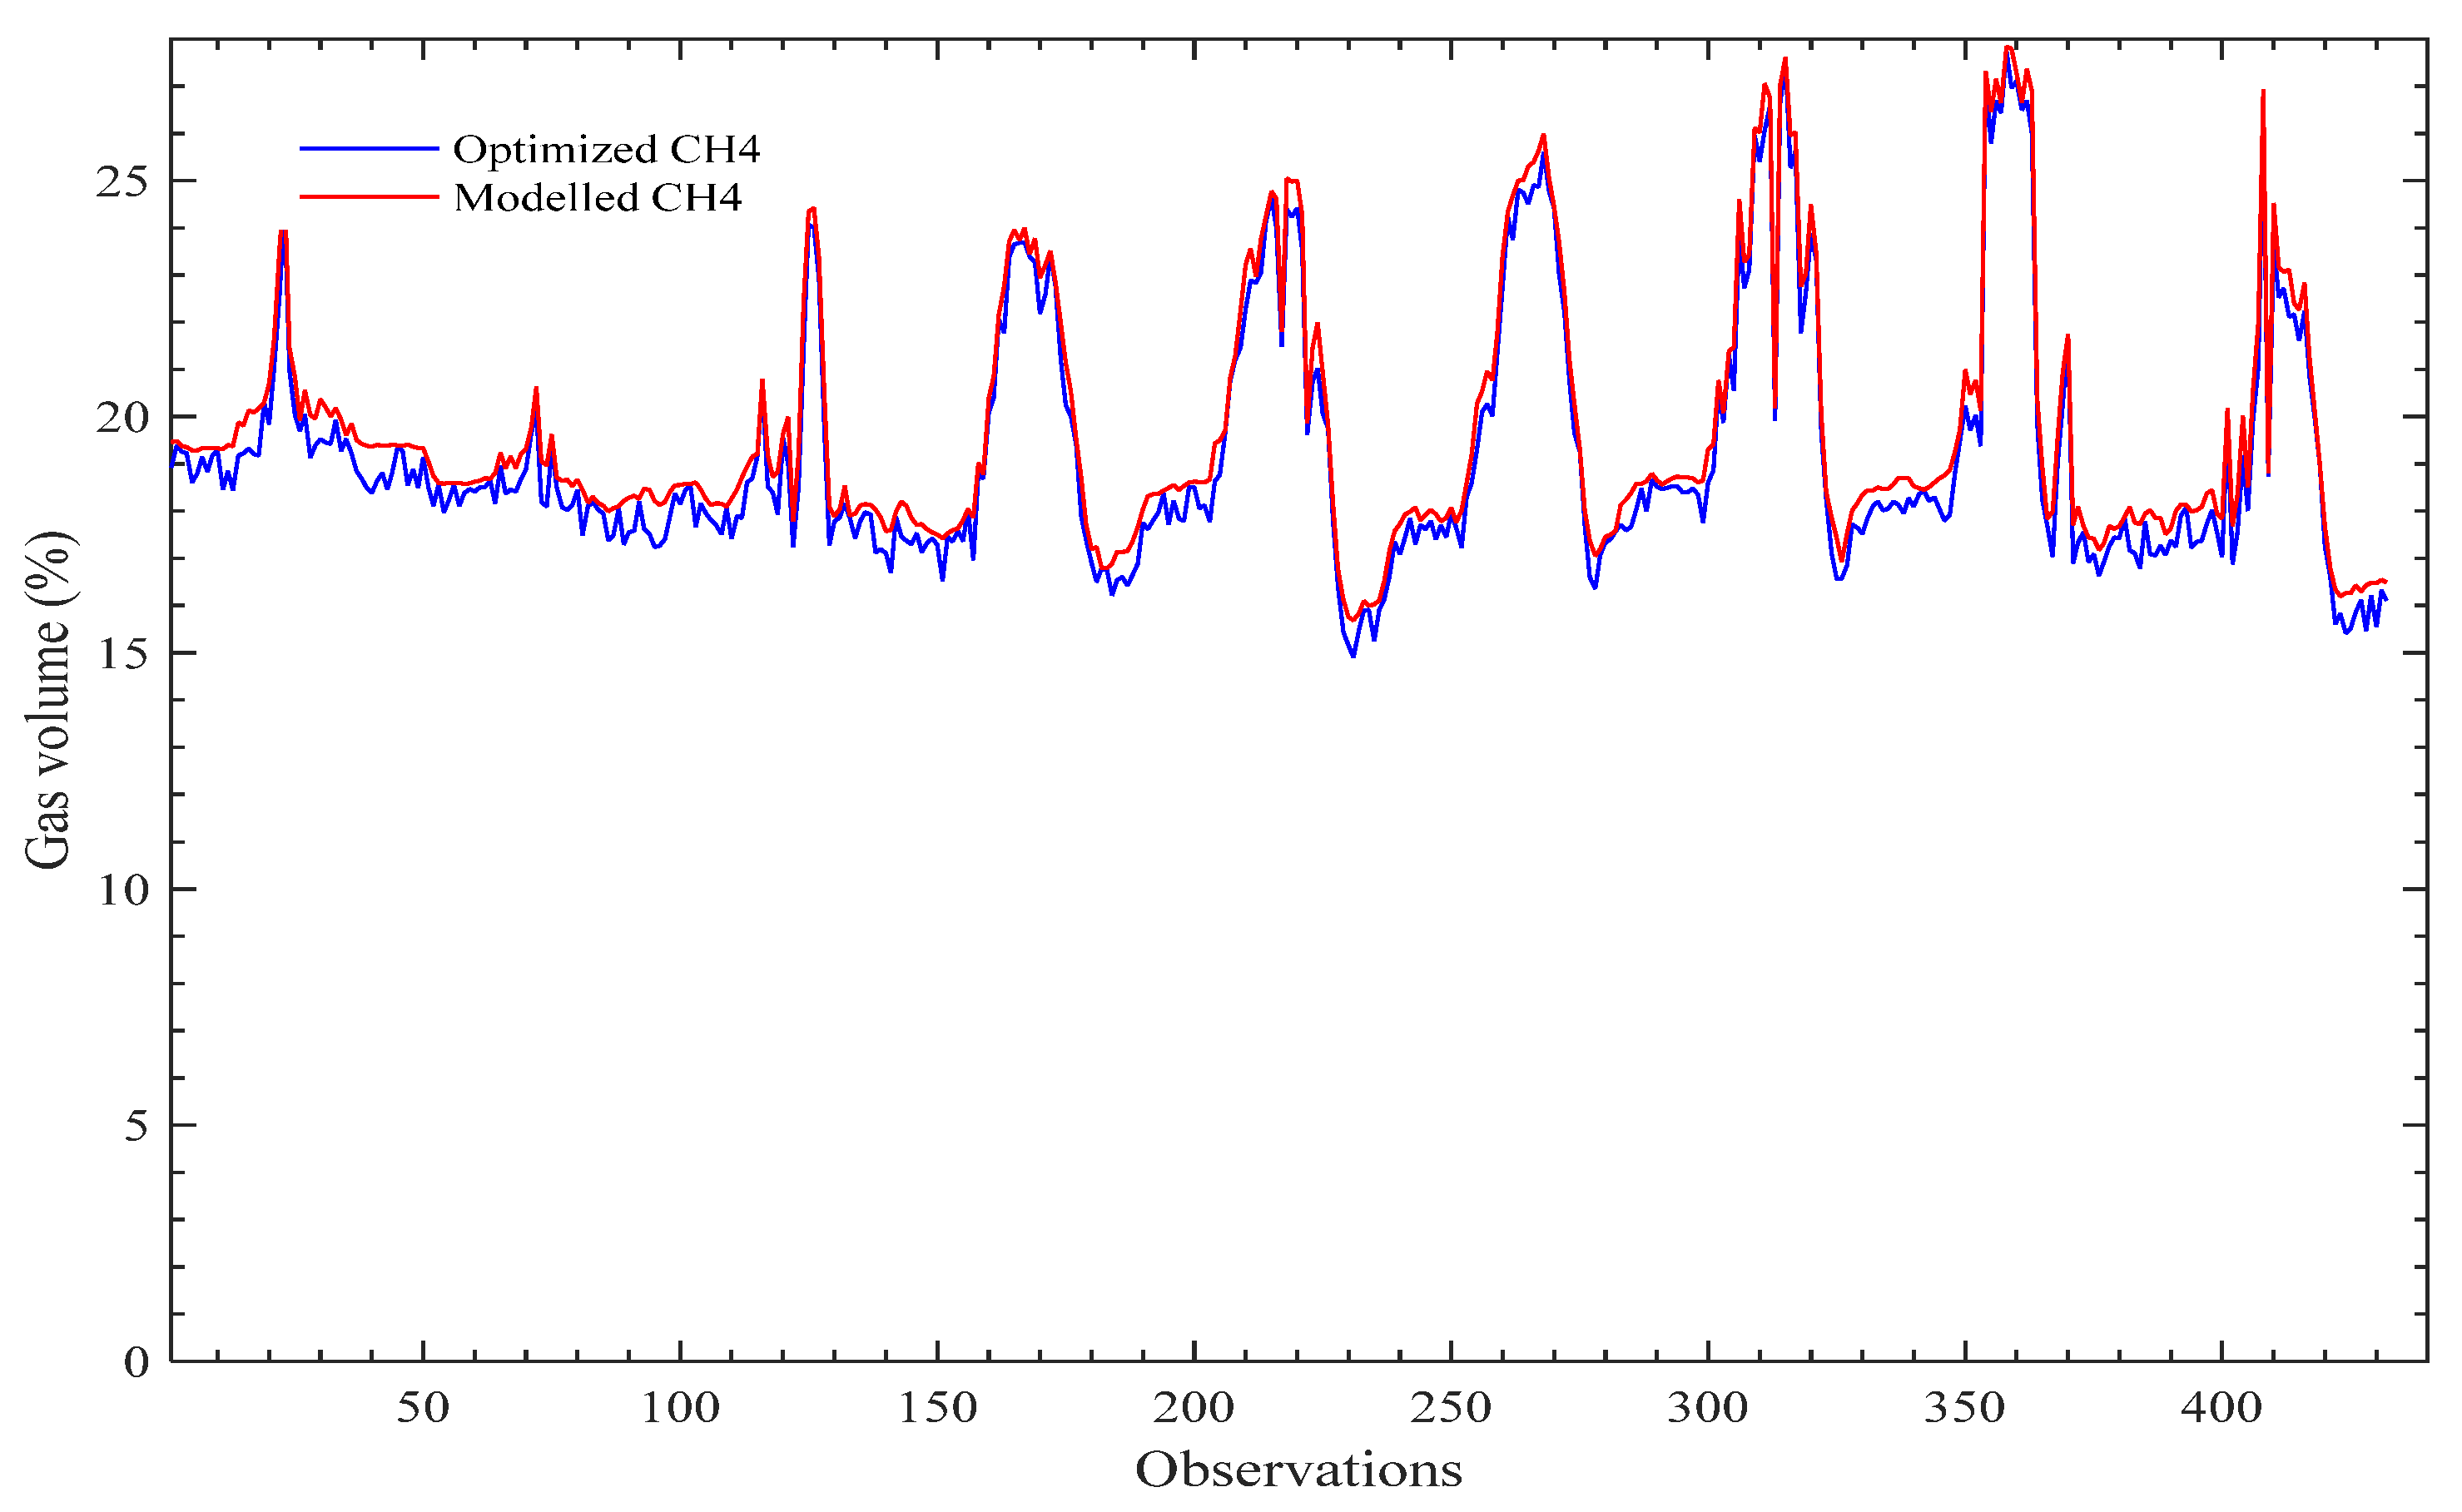
It can be observed from Table 5 and Table 6 that there was no change in the values of the sample’s lump input parameters and the optimized lump input parameters. Also, the optimized forcing constant for the samples test dataset was close to unity. The difference between the optimized model and the general model output as provided in Table 5 and Table 6, was less than 4%, which is similar to that of Zareel and Khodaei’s [16] study that reported 5% while Iweka et al. [1] obtained 0.2%. Figure 3 shows the 400 observations of the correlation performance behavior of the optimized and modeled methane yield from the developed model.
In Figure 3, the modeled output and optimized output based on sample observations from the test dataset were presented, thereby obtaining a maximum volume of 28% for methane. Comparing this with the total yield of 54.5% of the methane produced in the real biogas digester (Refer to Obileke et al. [3]), implies that the biogas digester is controlled by the operational parameters (temperature, pH, RH, and Ir) to an optimal level, which leads to increase of methane products by 26.5% by digesting the cow dung. Thus, the optimal value of the operational parameter includes temperature (35 °C), pH (7.00), RH (100%), and Ir (1340 W/m2).
As a result of the model, a strong validity was demonstrated as the determination coefficient between the developed model and the optimized output over the sample observation was 0.968. The very good determination coefficient reported on the rate of methane production means that the model could explain 96% of response variability thereby confirming how well the modeled methane fits with the measured methane. Hence, showing the validity of the established model. The determination coefficient reported differs from Iweka et al. [1] study, where the determination coefficient in their study was 0.996. On the other hand, the determination coefficient reported by Zareei and Khodaei [16] was 0.92 using 11 predictors. This affirms the reliability of the result in these studies. The result of Iweka et al. [1] is the same as that of Saghouri et al. [12] of 0.99 determination coefficients using 20 available datasets. However, the lines of best fit from Saghouri et al. [12], showed a strong positive correlation to the scatter plot data of the modeled and optimized values of methane gas production. It is interesting to know that the differences between the present study with other studies reported lie in the number of datasets and the type of digestion (mono or co-digestion) used for biogas production. Further on the regression, the obtained determination coefficient (R2) was of accepted ranges and hence, over 90% of the prediction could guarantee with 95% confidence level. Despite this, the p-value of the calculated and modeled methane yield was above 80% and demonstrated no significant difference. Interestingly from the regression, which reveals the strong correlation between the optimized and measured test dataset (Figure 3), it is established that the root means square bias error of the optimized and modeled methane was smaller than the minimum optimized methane yield from the measured test data set. On the other hand, during the performance monitoring of the biogas digester, a maximum methane yield and composition of 0.24 m3 and 60% respectively was generated (Refer to Obileke et al. [3]).
Application: Focusing on the wider application of the study, the nonlinear regression model provides a multi-purpose benefit as it could be used for the in-depth performance prediction of a system and universal model equation. This model predicts the performance of methane production of the same biogas digester volume but in different locations. Therefore, a different biogas digester design requires generating its forcing and scaling constant. Hence, provided others parameter used in the model remains constant. In a different development, looking at the biogas and gas application regarding models with a focus on actual work or system, Cheng et al. [20], developed a comprehensive consultation model for explosion risk (CCMER). The model is applicable in designing and minimizing possible fire and hazard explosions. Further to this, the application of CCMER predicts the explosion risk changing and track the gases because of underground mine gas explosion. The result from the model is used as a control measure for a sealed atmosphere rationally and economically. In the case of the model employed in our study, the CCMER provides versatile, reliable, and accurate results, especially in ventilation management. Referring to the maximum operation of the biogas digester in the study, similarly, Cheng et al. [21] develop a sealing material with excellent performance to ensure a long-term high efficiency of the operation of the gas drainage borehole. Based on the regression approach, great thermal stability, fluidity, and thixotropy were characterized as the new inorganic retarding sealing material for gas drainage boreholes.
4. Conclusions and Recommendations
The study successfully optimized the input parameters which correspond to the measured response by the application of the constrained least square method. Globally, as it relates to science, engineering, and planetary health, this is relevant. Focusing on science and engineering, it provides an idea for best design activities among various factors and parameters whereas in planetary health, improving quality of livelihood, cost of energy, and mitigation of global greenhouse effect and less carbon dioxide emission are taken into consideration. The development of the model involves the linear combination of the product term of the input and the exponential combination of the desired input. The benefit of the optimization technique used in the study enhances the prediction accuracy and reliability of the model developed. Hence, it guaranteed the predictor values that provided the required model constraint. Based on the reported determination coefficient of the developed and optimized model, the study revealed that the modeled methane value fits well with the measured methane value used for the validation. Notable, the integration of the customized non-linear model with constrained linear least square resulted in identifying the optimal operational digester parameter resulting in a 26.5% increase in methane volume. Therefore, the study shows that non-linear and constrained linear least squares are useful tools for modeling and optimizing methane production respectively from biogas digesters under various conditions. Conclusively, it can be stated that the performance of the model demonstrated a strong validity regarding the modeled and optimized output of the volume of methane in the biogas digester. Considering the application of the study based on the actual work system, further study is recommended and ongoing, focusing on the weak and feasibility of the model. This might include using different volumes of biogas digester to experiment in predicting the performance.
Author Contributions
Conceptualization: K.O., Writing Original draft: K.O. and N.N., Methodology: K.O., G.M. and N.N. Supervision/Resources/Project administration: G.M., Writing review and editing: K.O., G.M. and N.N. All authors have read and agreed to the published version of the manuscript.
Funding
This research received no external funding.
Institutional Review Board Statement
Not applicable.
Informed Consent Statement
Not applicable.
Data Availability Statement
The data presented in this study are available on the request from the corresponding author.
Acknowledgments
The authors wish to acknowledge the financial support from the Govan Mbeki Research and Development Centre (GMRDC), University of Fort Hare, South Africa.
Conflicts of Interest
The authors declare no conflict of interest.
References
- Iweka, S.; Owuama, K.; Chukwuneke, J.; Falowo, A. Optimization of biogas yield from anaerobic co-digestion of corn chaff and cow dung digestate: RSM and Python approach. Heliyon 2021, 7, e08255. [Google Scholar] [CrossRef] [PubMed]
- Mukumba, P.; Makaka, G. Biogas production from a field batch biogas digester using cow dung as a substrate. Int. J. Eng. Sci. Technol. 2015, 4, 1–10. [Google Scholar]
- Obileke, K.; Mamphweli, S.; Meyer, E.; Makaka, G.; Nwokolo, N.; Onyeaka, H. Comparative study on the performance of an aboveground and underground fixed dome biogas digester. Chem. Eng. Technol. 2019, 43, 68–74. [Google Scholar] [CrossRef]
- Oloko-Oba, M.; Taiwo, A.; Ajala, S.; Solomon, B.; Betiku, E. Performance evaluation of three different-shaped bio-digesters for biogas production and optimization by artificial neural network integrated with genetic algorithm. Sustain. Energy Technol. Assess. 2018, 26, 116–124. [Google Scholar] [CrossRef]
- Qdais, H.; Hani, K.; Shatnawi, N. Modelling and optimization of biogas production from a waste digester using artificial neural network and genetic algorithm. Resour. Conserv. Recycl. 2010, 54, 359–363. [Google Scholar] [CrossRef]
- Dach, J.; Koszela, K.; Boniecki, P.; Zaborowicz, M.; Lewicki, A.; Czekala, W.; Skwarcz, J.; Qiao, W.; Piekarska-Boniecka, W.; Bialobrzewski, I. The use of neural modelling to estimate the methane production from slurry fermentation processes. Renew. Sustain. Energy Rev. 2010, 56, 603–610. [Google Scholar] [CrossRef]
- Pei, P.; Zhang, C.; Li, J.; Chang, S.; Li, J.; Wang, M.; Zhao, J.; Li, M.; Yu, X.; Chen, X. Optimization of NaOH pre-treatment for enhancement of biogas production of banana pseudo-stem fibre using response surface methodology. Bio. Resour. 2014, 9, 5073–5087. [Google Scholar]
- Safari, M.; Abdi, R.; Adl, M.; Kafashan, J. Optimization of biogas productivity in lab-scale by response surface methodology. Renew. Energy 2018, 118, 368–375. [Google Scholar] [CrossRef]
- Yilmaz, S.; Sahan, T. Utilization of pumice for improving biogas production from poultry manure by anaerobic digestion: A modelling and process optimization study using response surface methodology. Biomass Bio. 2020, 138, 105601. [Google Scholar] [CrossRef]
- Gueguim Kana, E.; Oloke, K.; Lateef, A.; Adesiyan, M. Modelling and optimization of biogas production renewable energy on saw dust and other co-substrates using artificial neural network and genetic algorithm. Renew. Energy 2012, 46, 276–281. [Google Scholar] [CrossRef]
- Sathish, S.; Vivekanandan, S. Parametric optimization for floating drum anaerobic bio-digester using response. Alex. Eng. J. 2016, 55, 3297–3307. [Google Scholar] [CrossRef] [Green Version]
- Saghouri, M.; Abdi, R.; Ebrahimi-Nik, M.; Rohani, A.; Maysami, M. Modelling and optimization of bio-methane production from solid-state anaerobic co-digestion of organic fraction municipal solid waste and co-digestion. Energy Sources Part A Recovery Util. Environ. 2020, 1–19. [Google Scholar] [CrossRef]
- Matheri, A.; Ndiweni, M.; Belaid, M.; Muzanda, E.; Hubert, R. Optimizing biogas production from anaerobic co-digestion of chicken manure and organic fraction of municipal solid waste. Renew. Sustain. Energy Rev. 2017, 80, 756–764. [Google Scholar] [CrossRef]
- Shaibur, M.R.; Husain, H.; Huda Arpon, S. Utilization of cow dung residues of biogas plant for sustainable development of a rural community. Curr. Res. Environ. Sustain. 2021, 3, 100026. [Google Scholar] [CrossRef]
- Obileke, K.; Mamphweli, S.; Makaka, G.; Nwokolo, N. Slurry utilization and impact of mixing ratio in biogas production. Chem. Eng. Technol. 2017, 40, 1742–1749. [Google Scholar]
- Zareei, S.; Khodaei, J. Modelling and optimization of biogas production from cow manure and maize straw using an adaptive neuro-fizzy Interference system. Renew. Energy 2017, 114, 423–427. [Google Scholar] [CrossRef]
- APHA. Standard Methods for the Examination of Water and Wastewater, 21st ed.; American Public Health Association/American Water Works Association/Water Environment Federation: Washington, DC, USA, 2005. [Google Scholar]
- Obileke, K.; Mamphweli, S.; Meyer, E.; Makaka, G.; Nwokolo, N. Development of a mathematical model and validation for methane production using cow dung as substrate in the underground biogas digester. Processes 2021, 9, 643. [Google Scholar] [CrossRef]
- Wu, C.; Hamada, M. Planning, Analysis and Parameter Design Optimization; John and Wiley and Sons: Hoboken, NJ, USA, 2000. [Google Scholar]
- Cheng, J.; Mei, J.; Peng, S.; Qi, C.; Shi, Y. Comprehensive consultation model for explosion risk in mine atmosphere-CCMER. Saf. Sci. 2019, 120, 798–812. [Google Scholar] [CrossRef]
- Cheng, J.; Wang, Y.; Zhao, G.; Zheng, W.; Wang, H.; Lu, W.; Yang, H.; Wu, Y.; Wu, Y.; Sa, Z.; et al. Performance of new inorganic retarding sealing material for gas drainage boreholes. Min. Metall. Explor. 2022, 39, 1171–1181. [Google Scholar] [CrossRef]
Figure 1.
3D surface plot of the dataset points and the model mesh for methane yield. [CH4 reported in %, X and Y reported in %/°C, and % respectively].
Figure 1.
3D surface plot of the dataset points and the model mesh for methane yield. [CH4 reported in %, X and Y reported in %/°C, and % respectively].

Figure 2.
Optimization of a model predictor to optimize methane production in the biogas digester.

Figure 3.
Modelled and optimized methane volume for the biogas digester.


Table 1.
Characterization of cow dung used in the study.
| Total Solid (%) | Volatile Solids (%) | pH | COD (mg/L) | Calorific Value (CV) MJ·g−1 | Carbon/Nitrogen Ratio |
|---|---|---|---|---|---|
| 13.80 | 11.04 | 7.83 at 30 °C | 42,583 | 27.0 | 24 |
(Note: the characterization of cow dung (TS, VS and CV) was carried out on a wet basis analysis).
Table 2.
Factors used and considered in the study [18].
Table 2.
Factors used and considered in the study [18].
| Input Parameter | Definitions |
|---|---|
| pHr | pH (Relative): ratio of the absolute pH to the neutral |
| Ir | Global irradiance (Relative): ratio of absolute global solar irradiance to the maximum global irradiance (Imax) |
| RHr (%) | Humidity (Relative): ratio of absolute relative humidity to the maximum relative humidity (RHmax) |
| Tam (°C) | Ambient temperature: surrounding temperature in the vicinity of the biogas digester |
| Tg (°C) | Gas temperature: the temperature in the vicinity of the methane produced inside the biogas digester |
| Tb (°C) | Slurry temperature: the temperature at a lower level within the digester |
| Tt (°C) | Slurry temperature: the temperature at an upper level within the digester |
Table 3.
Summary of the material and equipment used in the study.
| Substrate | Cow Dung |
|---|---|
| Parameter considered for the substrate | Total solids/Volatile solids/Calorific value/Chemical oxygen demand and pH |
| Monitoring instrument | NDIR gas sensor, K-type thermocouple, pH metre etc. |
| Data capturing device | CR 1000 data logger |
| Optimization tool | Constrained linear least square technique |
| Software used | MATLAB |
| Type of plastic used for digester chamber | High-density polyethylene (HDPE) plastic |
Table 4.
Methane model equation constants and determination coefficient for the underground biogas digester.
Table 4.
Methane model equation constants and determination coefficient for the underground biogas digester.
| Lump Input Parameter | Constant Name | Constant Symbol | Constant Value | Desired Output (%) | Determination Coefficient (R2) |
|---|---|---|---|---|---|
| Forcing constant | A | 42.41 | CH4 vol | R2 = 0.968 | |
| Scaling constant | B | 0.0003999 | |||
| Scaling constant | C | 0.8976 |
Table 5.
Samples of lump input parameters from the test dataset and modeled methane for the biogas digester.
Table 5.
Samples of lump input parameters from the test dataset and modeled methane for the biogas digester.
| Forcing Constant Multiplier | Lump Input x | Lump Input y | Modelled CH4 |
|---|---|---|---|
| 1 | 3080.440 | 7.084 | 18.935 |
| 1 | 2569.645 | 7.055 | 18.862 |
| 1 | 5164.320 | 7.643 | 19.816 |
| 1 | 3661.732 | 7.131 | 19.034 |
| 1 | 2518.530 | 7.070 | 18.875 |
| 1 | 439.330 | 6.863 | 18.471 |
| 1 | 469.135 | 7.372 | 19.155 |
| 1 | 268.552 | 6.650 | 18.171 |
| 1 | 247.250 | 6.545 | 18.031 |
Table 6.
Sample of optimized lump input parameter from test data set and optimized modeled methane for the biogas digester.
Table 6.
Sample of optimized lump input parameter from test data set and optimized modeled methane for the biogas digester.
| Optimized Forcing Constant Multiplier | Optimized Lump Input x | Optimized Lump Input y | Optimized CH4 |
|---|---|---|---|
| 1.005 | 3080.440 | 7.084 | 18.933 |
| 0.990 | 2569.645 | 7.052 | 18.860 |
| 1.221 | 5164.320 | 7.675 | 19.860 |
| 1.285 | 3661.732 | 7.173 | 19.090 |
| 0.860 | 2518.530 | 7.047 | 18.850 |
| 0.960 | 439.330 | 6.860 | 18.463 |
| 1.060 | 469.135 | 7.380 | 19.167 |
| 0.790 | 268.552 | 6.620 | 18.130 |
| 0.795 | 247.245 | 6.515 | 17.991 |
Publisher’s Note: MDPI stays neutral with regard to jurisdictional claims in published maps and institutional affiliations. |
© 2022 by the authors. Licensee MDPI, Basel, Switzerland. This article is an open access article distributed under the terms and conditions of the Creative Commons Attribution (CC BY) license (https://creativecommons.org/licenses/by/4.0/).
Share and Cite
MDPI and ACS Style
Obileke, K.; Makaka, G.; Nwokolo, N. Efficient Methane Production from Anaerobic Digestion of Cow Dung: An Optimization Approach. Challenges 2022, 13, 53. https://doi.org/10.3390/challe13020053
AMA Style
Obileke K, Makaka G, Nwokolo N. Efficient Methane Production from Anaerobic Digestion of Cow Dung: An Optimization Approach. Challenges. 2022; 13(2):53. https://doi.org/10.3390/challe13020053
Chicago/Turabian StyleObileke, KeChrist, Golden Makaka, and Nwabunwanne Nwokolo. 2022. "Efficient Methane Production from Anaerobic Digestion of Cow Dung: An Optimization Approach" Challenges 13, no. 2: 53. https://doi.org/10.3390/challe13020053
Note that from the first issue of 2016, this journal uses article numbers instead of page numbers. See further details here.