

The Socio-Spatial Distribution and Equity of Access to Urban Parks: A Case Study of Bengaluru, India
1
School of Human Development, Indian Institute for Human Settlements, Bengaluru 560080, India
2
Geospatial Lab, Indian Institute for Human Settlements, Bengaluru 560080, India
*
Author to whom correspondence should be addressed.
Challenges 2024, 15(2), 20; https://doi.org/10.3390/challe15020020
Submission received: 28 February 2024
/
Revised: 5 April 2024
/
Accepted: 8 April 2024
/
Published: 16 April 2024
(This article belongs to the Special Issue Planetary Health: From Evidence to Action–Confronting Reality (Including Submissions Associated with the 2024 Planetary Health Summit (PHAM2024))
Abstract
:Given the effect of urbanization on land use and the allocation and implementation of urban green spaces, this paper attempts to analyze the distribution and accessibility of public parks in India’s Bengaluru city (previously known as Bangalore). Availability, accessibility, and utilization—the key measures of Urban Green Spaces (UGS)—are mostly used in health research and policy and are important components of Planetary Health Equity in the context of studying UGSs and health. A geo-spatial method was used for mapping the park’s distribution and measuring its accessibility, using road network data. To understand equitable access to the parks, four socio-economic parameters—population density, the percentage of the population below 6 years of age, the proxy wealth index, and scheduled caste population—were correlated with the parks’ accessibility. This spatial distribution revealed that 19 of 198 wards did not have a single park and that 36 wards only had one park. About 25–29% of wards did not have accessibility to neighborhood-level and community-level parks within a 400–800 m distance. These parks must be accessible within a walking distance of 400–800 m but were found to most likely be inaccessible on the periphery of the city where the population density is low and the children population is high, in comparison to the central part of the city. Similarly, parks were found to be inaccessible in the eastern part of the city where the scheduled caste population is high and also found to be inaccessible for the low-income neighborhoods residing in the western part and southern periphery of the city, indicating the uneven distribution of and inequitable access to public parks. Our study proposes a reshaping of both neighborhood parks and community parks in an attempt to look beyond biodiversity, through the planetary health equity approach, by noting that, while biodiversity indirectly has a positive effect on health, public parks should not only be considered as advancing environmental sustainability and climate resilience, but also as improving the health and wellbeing of the population. Affirmative action in terms of the availability of public parks with adequate area requirements and essential services at a neighborhood scale is required to redress the inequity of access; in addition, the accessibility of parks must be considered important during urban planning.
1. Introduction
“Green urban areas”, as defined by the Urban Atlas [1], are “public green areas used predominantly for recreation such as gardens, zoos, parks, and suburban natural areas and forests, or green areas bordered by urban areas that are managed or used for recreational purposes”. India’s urban greening guideline [2] clearly highlights the ecological, physical, social, and economic benefits of urban green spaces. The NITI Ayog report on Urban Planning Capacity in India [3] focused on built (green) infrastructure and health and one of its recommended programmatic interventions was the mapping of blue–green–grey infrastructure (including rivers, waterbodies, forests, parks, sanitation, water supply, solid waste management, etc.) in cities. It also emphasized the development of a special strategy to improve citizen’s well-being including their physical and mental health, by creating a healthy living environment, and measures to achieve cleaner air, water, and soil, as well as parameters to ensure a balance between the built and unbuilt environments. This strategy may likely bring about both sustainable and healthy cities. Therefore, urban green spaces (UGSs) must be considered as one of the important social and environmental health indicators of urban health. COVID-19 has revealed the urgent need to improve health in Indian cities, and this can be achieved by multi-sectoral efforts at the intersections of spatial planning, public health, and socio-economic development.
We have selected Bengaluru city (previously known as Bangalore city)—which is known as the Garden City of India and is also the capital of the southern state of Karnataka—for this study. A map of Karnataka state and Bengaluru city is provided in Supplementary Figure S1. Bengaluru is one of the cities/districts in the country from which healthy city movements and projects were launched and implemented in the late 90s.
During the 1990s, Bengaluru city had a variety of dense vegetation cover—ranging from reserved areas such as forests and national parks to open public green spaces such as district parks, neighborhood parks, and playgrounds—considering its population size, which was considerably low between 1951 and 1971 as compared to 1981–2011 [4]. The transition began in 1981, when the population growth rate increased by more than two-fold, indicative of the initiation of the growth of industries, which was influenced by urbanization and globalization [4]. This rapid growth of industries led Bengaluru to become home to information technology hubs and earn the title the Silicon Valley of India. Though the state government of Karnataka enacted the Karnataka Parks, Play-fields and Open Spaces (Preservation and Regulation) Act in 1985, rapid industrialization and demographic growth in the city led to changes in its land use pattern that have severely affected its vegetation cover, which declined from 68.27 percent in 1973 to 23.25 percent in 2012 [5]. In 2018, Bengaluru, with a population of about 13 million and a geographical area of 2196 km2, had only 3.31 m2 of green space, which is far below the optimal standard of 9 m2 per capita of green cover (please refer to Table S1) [6]. Therefore, the poor planning of green spaces in an urbanizing Bengaluru has not only eroded its identity as the “Garden City”, but has also affected its air quality, climate, and health, and the overall wellbeing of its population. This interconnectedness between green spaces and climate and health is greatly understood by planetary health equity. Therefore, it is important to promote studies that establish the linkage between green spaces and health outcomes.
Given that Bengaluru city is undergoing a rapid transition due to urbanization, this prompted us to understand the implications of this transition on green spaces by analyzing how public parks are spatially distributed in Bengaluru city and drawing various conclusions as to how their distribution and the equitable access to these parks is associated with the socio-economic status and health of the city’s population. In this study, we have considered parks that are publicly accessible for our analysis. Availability, accessibility, and utilization—the key measures of UGSs—are mostly used in health research and policy and are important components of Planetary Health Equity in the context of studying UGSs and health. In this study, we addressed the availability of and equitable access to public parks but failed to assess the utilization of these parks due to a lack of data on the physical and mental health outcomes of individuals utilizing these parks’ services at the city/ward level. By addressing the availability, accessibility, and utilization of green spaces, the concept of planetary health equity seeks to create environments that promote health and well-being for all, regardless of socioeconomic status, race, ethnicity, or geographical location. Hence, this study attempts to respond to the following questions:
- (i)
- What is the pattern of the distribution and accessibility of the public parks in Bengaluru city?
- (ii)
- How equitable is access to these public parks?
2. Materials and Methods
By attempting to build on the scarce data on public parks made available by the Bengaluru urban administration, the mapping of public parks was conducted using a geographical information system (GIS). This was further correlated with road network data to shed light on the parks’ range of accessibility for residents, correlating it with their socio-economic parameters. The geospatial technique used to map the parks draws on the methodology followed by Iraequi et al. [7]. We are, however, constrained by the unavailability of data on income, migrant populations, and age groups, at the ward level, from government sources. Only district-level data are available for these parameters, which are insufficient for this analysis. Therefore, ward-level 2011 Census data on population density, the percentage of children below the age of six years, the proxy wealth index, and scheduled caste population were considered to understand their association with the accessibility of public parks.
Further, the distance to a park, or its accessibility, has been added, based on the calculation provided by Van and Wiedemann [8]. The significance of this categorization becomes apparent in the latter half of the methodology section, as it gives context to the location of parks in the city and how accessible they are.
2.1. Spatial Data on Bengaluru’s Parks
The dataset published by the Bruhat Bengaluru Mahanagara Palike (BBMP) [9], i.e., Bengaluru’s city corporation or urban local body, on the public parks falling under its jurisdiction was used to perform the spatial distribution. This was the starting point of our methodological process. This dataset lists the name of the park, the zone it is in, its ward name and number, the area it covers and, for some, a description of its quality. We began spatially mapping these parks by first recording the 1288 of parks listed in the BBMP dataset (BBMP: https://site.bbmp.gov.in/documents/Detailsofparklist.pdf accessed on 19 September 2018). However, crucially, this list was last updated in 2015. Therefore, this list alone is woefully inadequate for obtaining an accurate picture of the green spaces in Bengaluru, especially considering the rapid pace at which the city is urbanizing and expanding outwards to its peripheries. This outdated official data necessitated georeferencing via high-resolution Google Earth Imagery. The detailed methodology followed for mapping the public parks to understand their spatial distribution has been provided in the methods section of the Supplementary Materials. Further, the spatial data of these parks was analyzed based on the hierarchy of the parks, shown in Table 1, with the ideal population coverage and service area requirements of different parks being based on the Urban and Regional Development Plans Formulation and Implementation (URDPFI) guidelines [10].
2.2. Measuring Accessibility Using Road Network Data
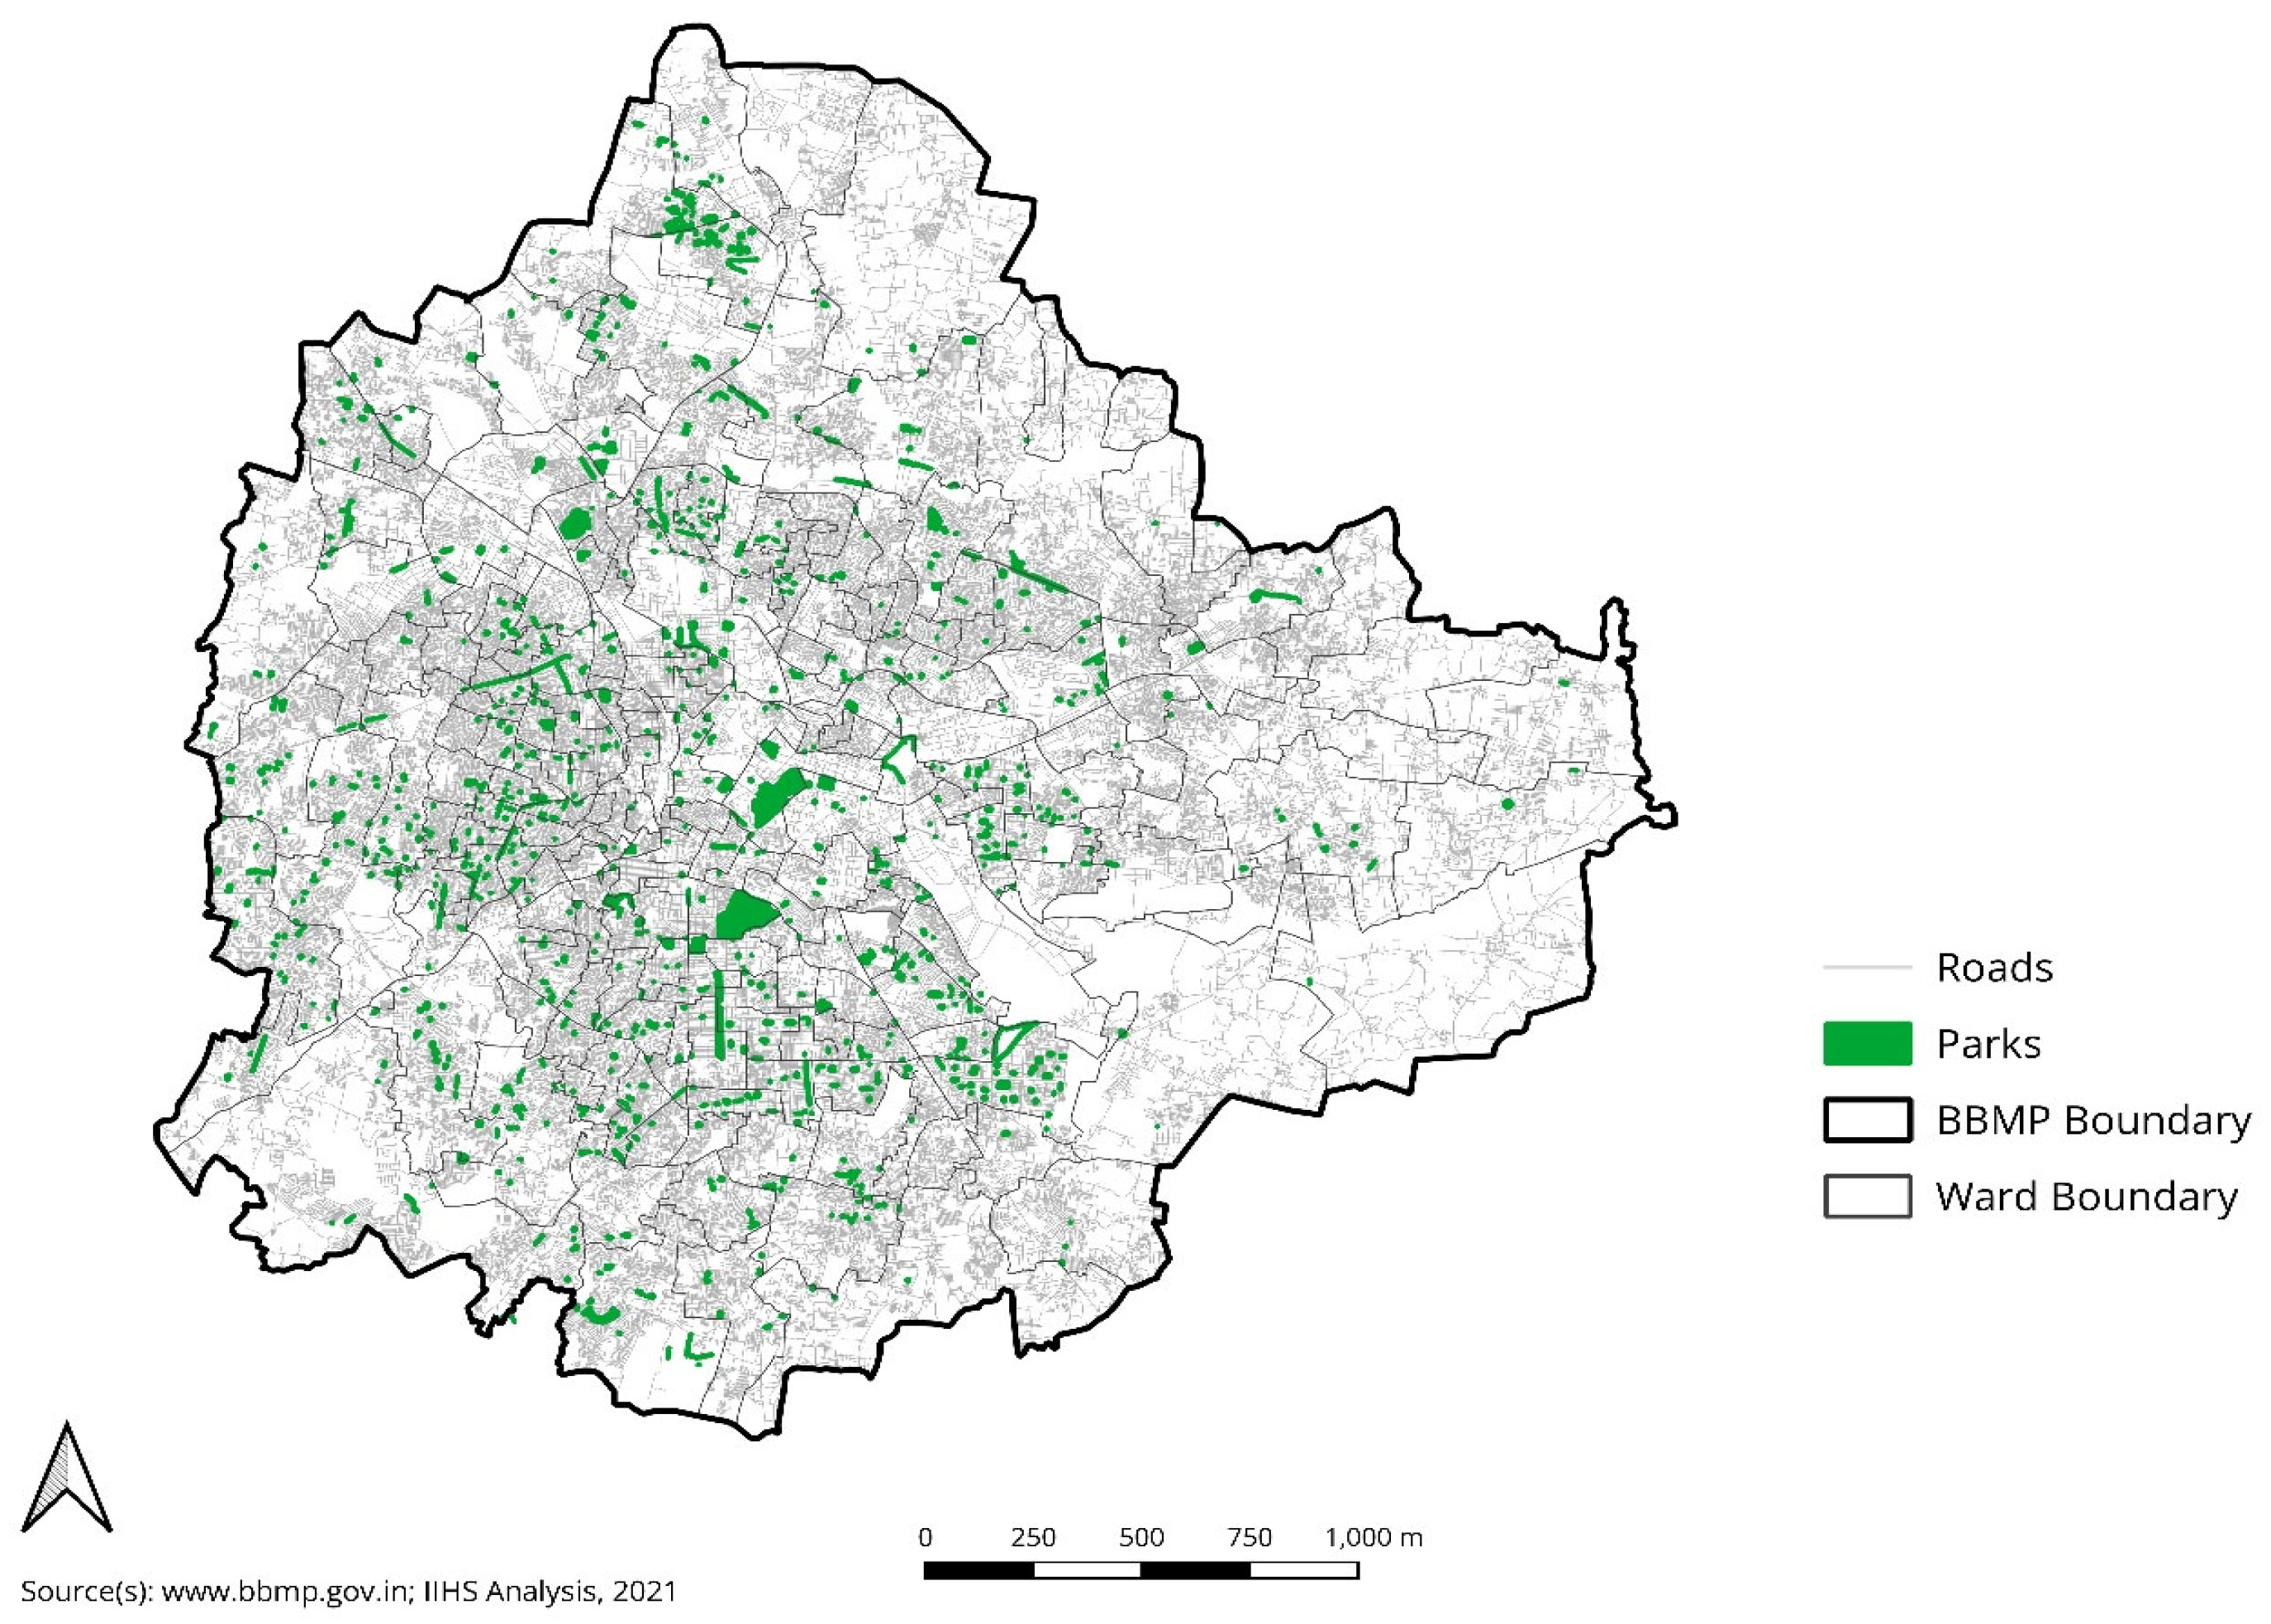
To perform an analysis of park accessibility, a network analysis was conducted. Network analysis uses a network-type layer that contains data about spatial movement and spatial topologies. The service area analysis tool in the Network Analysis extension of ArcGIS had been used to evaluate the accessibility of the green spaces in this study. The service area is the region that encompasses the accessible road network around a facility within a distance or travel time threshold, which is also called impedance [11,12,13]. In this study, the service area is mapped for the entrance points of public parks by using the accessibility thresholds mentioned in Table 1 for the different park categories. The road network data used for the service area analysis was acquired from Open Street Map (OSM) through the Quick OSM plugin of QGIS. Since this dataset does not contain detailed information about road types and one-way restrictions, the service area analysis was performed with the assumption that there are no directional restrictions, especially for walking. This allows for analyses that take into consideration physical impediments that might exist [7]. Regular line data depicting the road network are not helpful for this analysis. Therefore, this analysis uses the road network file from OSM. The downloaded road network data are established, using an ArcGIS Editor extension for ArcMap, resulting in network datasets compatible with the network analyst extension. The spatial distribution of parks, based on the road network, is depicted in Figure 1.
This research is centered on the aim to determine spatial variations in the accessibility of parks within Bengaluru city and, therefore, identifying park entrances and calculating the service area that is accessible from those points are essential steps towards reaching that aim. For each of the five park categories, the percentage of the ward area that falls under park service areas has been calculated to illustrate which parts of the city have unhindered access to public parks.
2.3. Socio-Economic Data
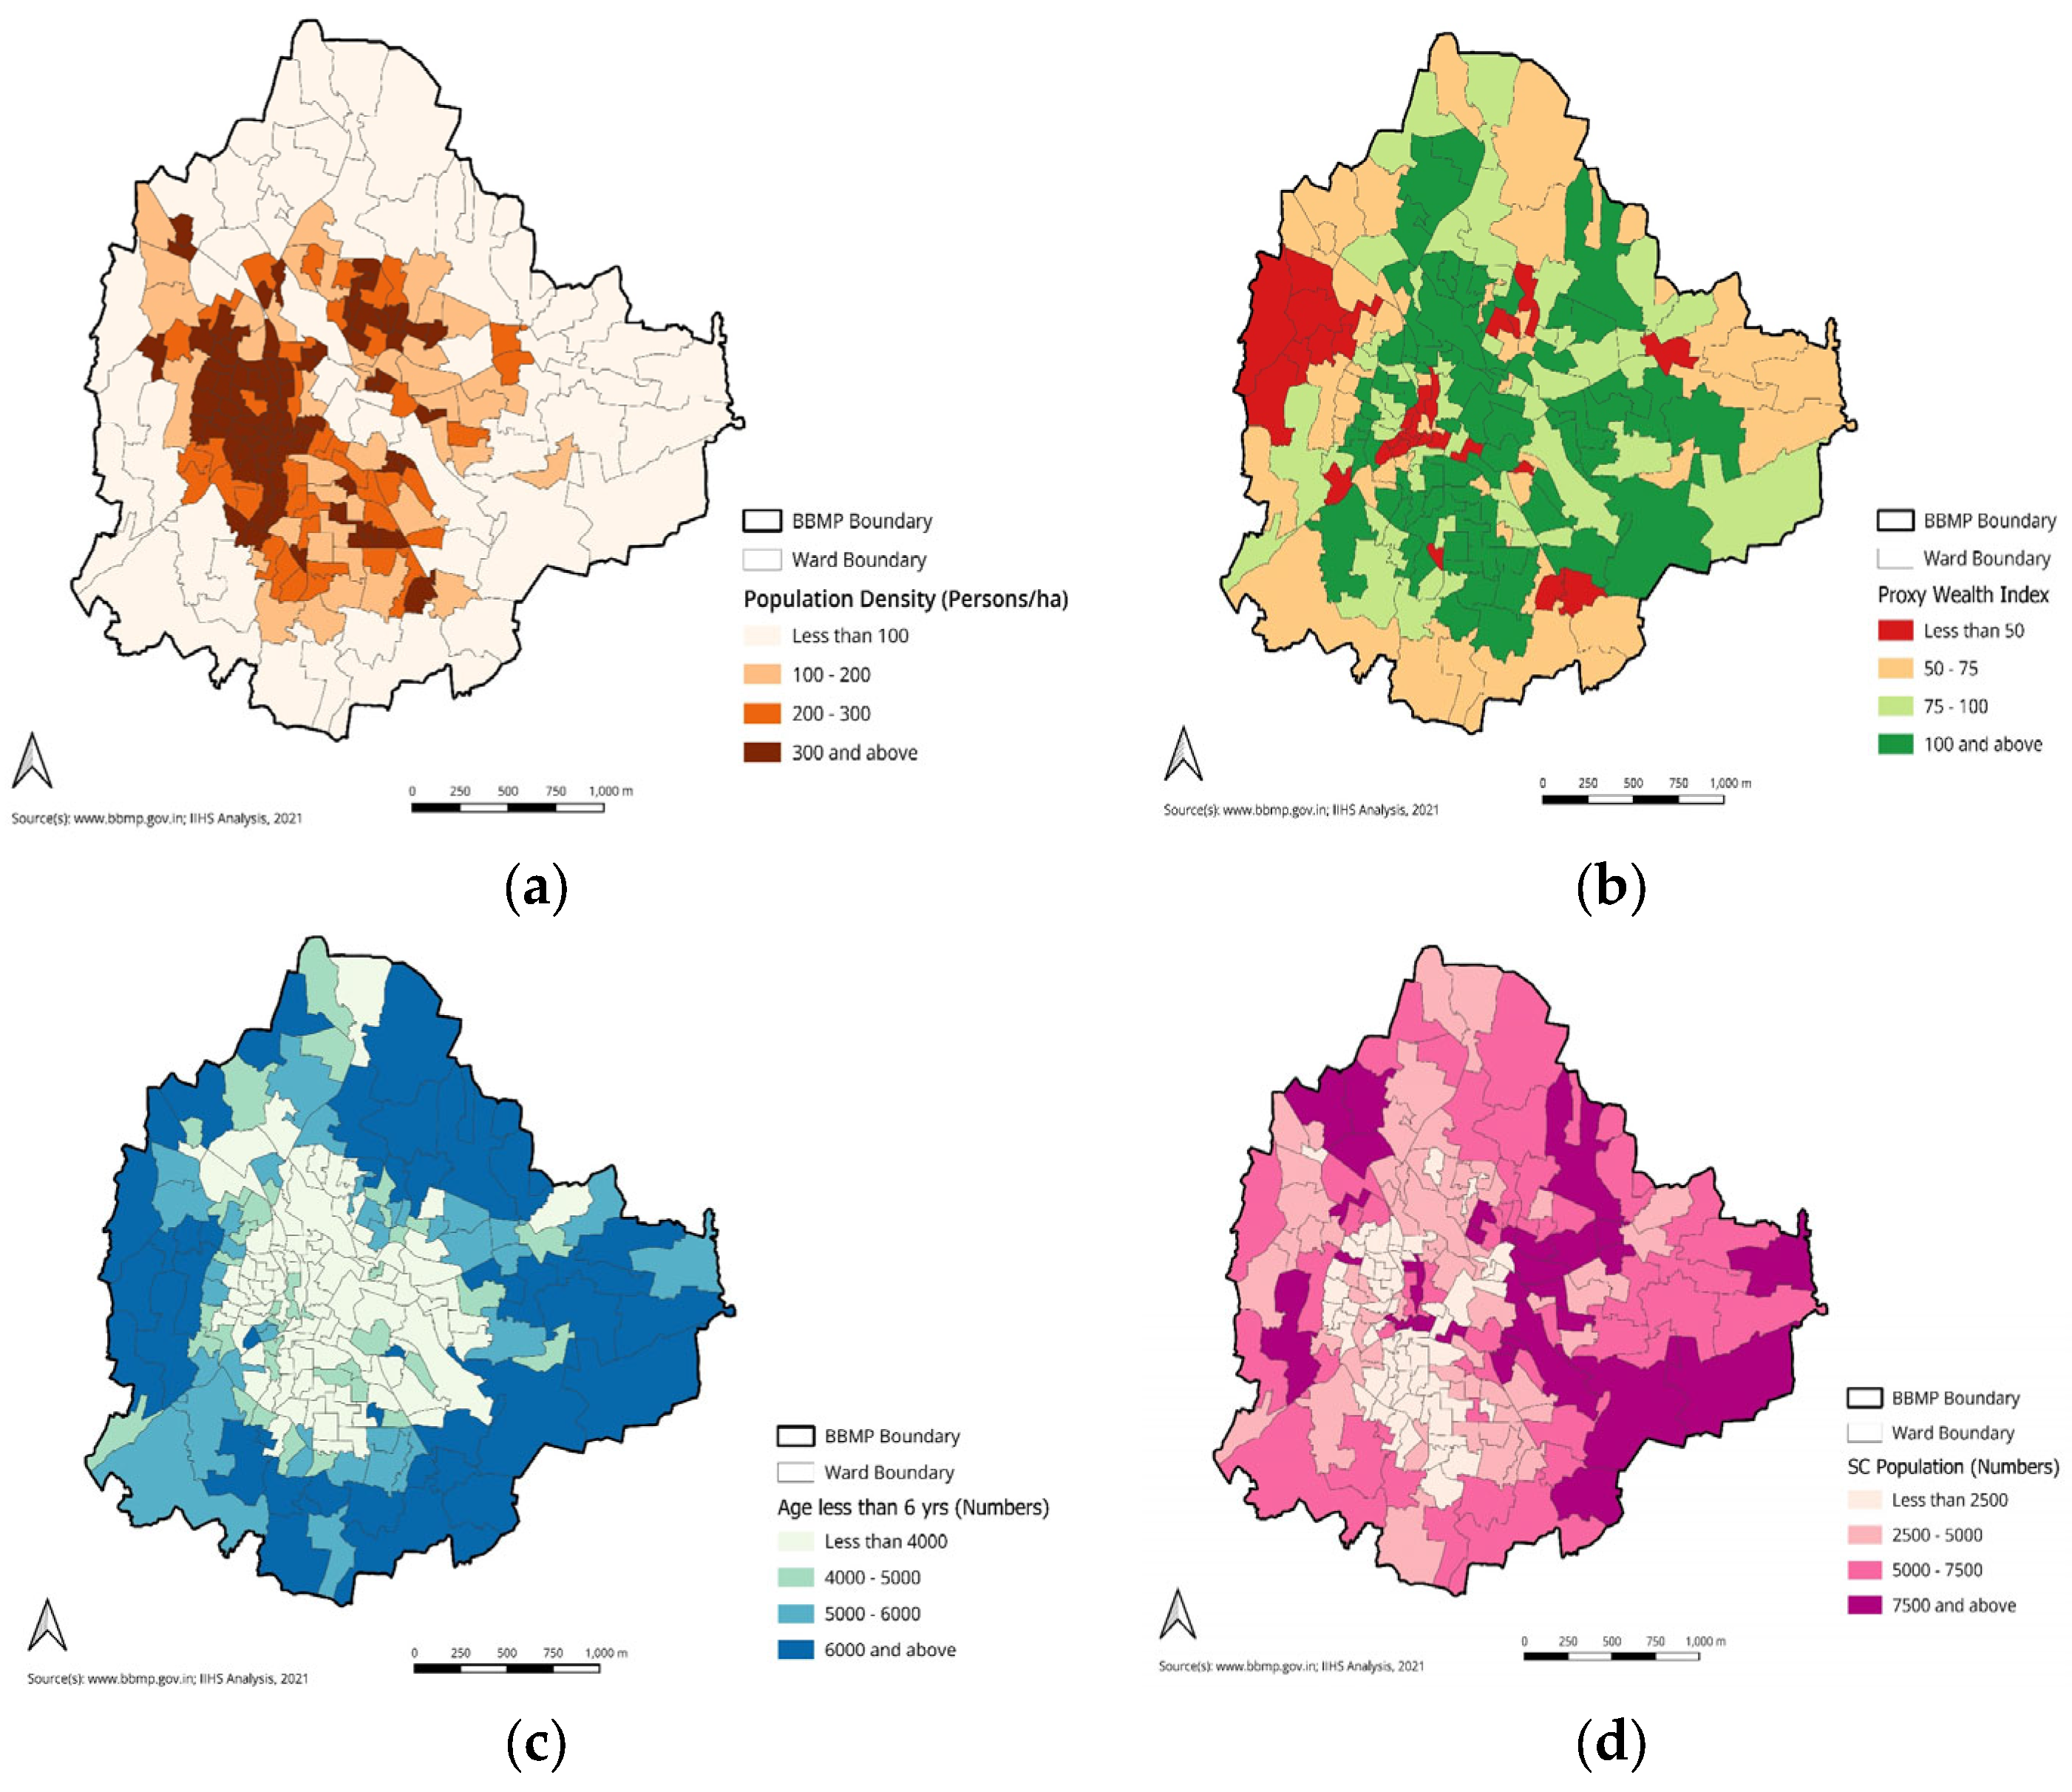
To evaluate the association between the accessibility of public parks and socio-economic disparity within the city, the data on four parameters from the 2011 Census [4], available at the ward level, have been used: population density (Figure 2a), proxy wealth index (for the proxy wealth index calculation, please refer to the methodology section of the study by Bhan and Jana [14]) (Figure 2b), the percentage of the population under six years of age (Figure 2c), and the scheduled caste (SC) population (Figure 2d). A description of these parameters is provided in the methods section of the Supplementary Materials. Further, a spatial correlation—i.e., Local Indicator of Spatial Association (LISA)—between the access to parks and these socio-economic parameters has been analyzed and mapped. The detailed method of Bivariate LISA Morgan-I statistics used is provided in the methods section of the Supplementary Materials. This result is meant to capture the accessibility to different types of parks of different socio-economic groups of residents in the city. These visualizations help in identifying areas deprived of public parks and also highlight whether there are urban planning attempts to cater to areas of high population density or whether the accessibility of public parks is skewed towards a specific socio-economic group.
3. Results
3.1. Findings of the Spatial Distribution of Public Parks in Bengaluru City
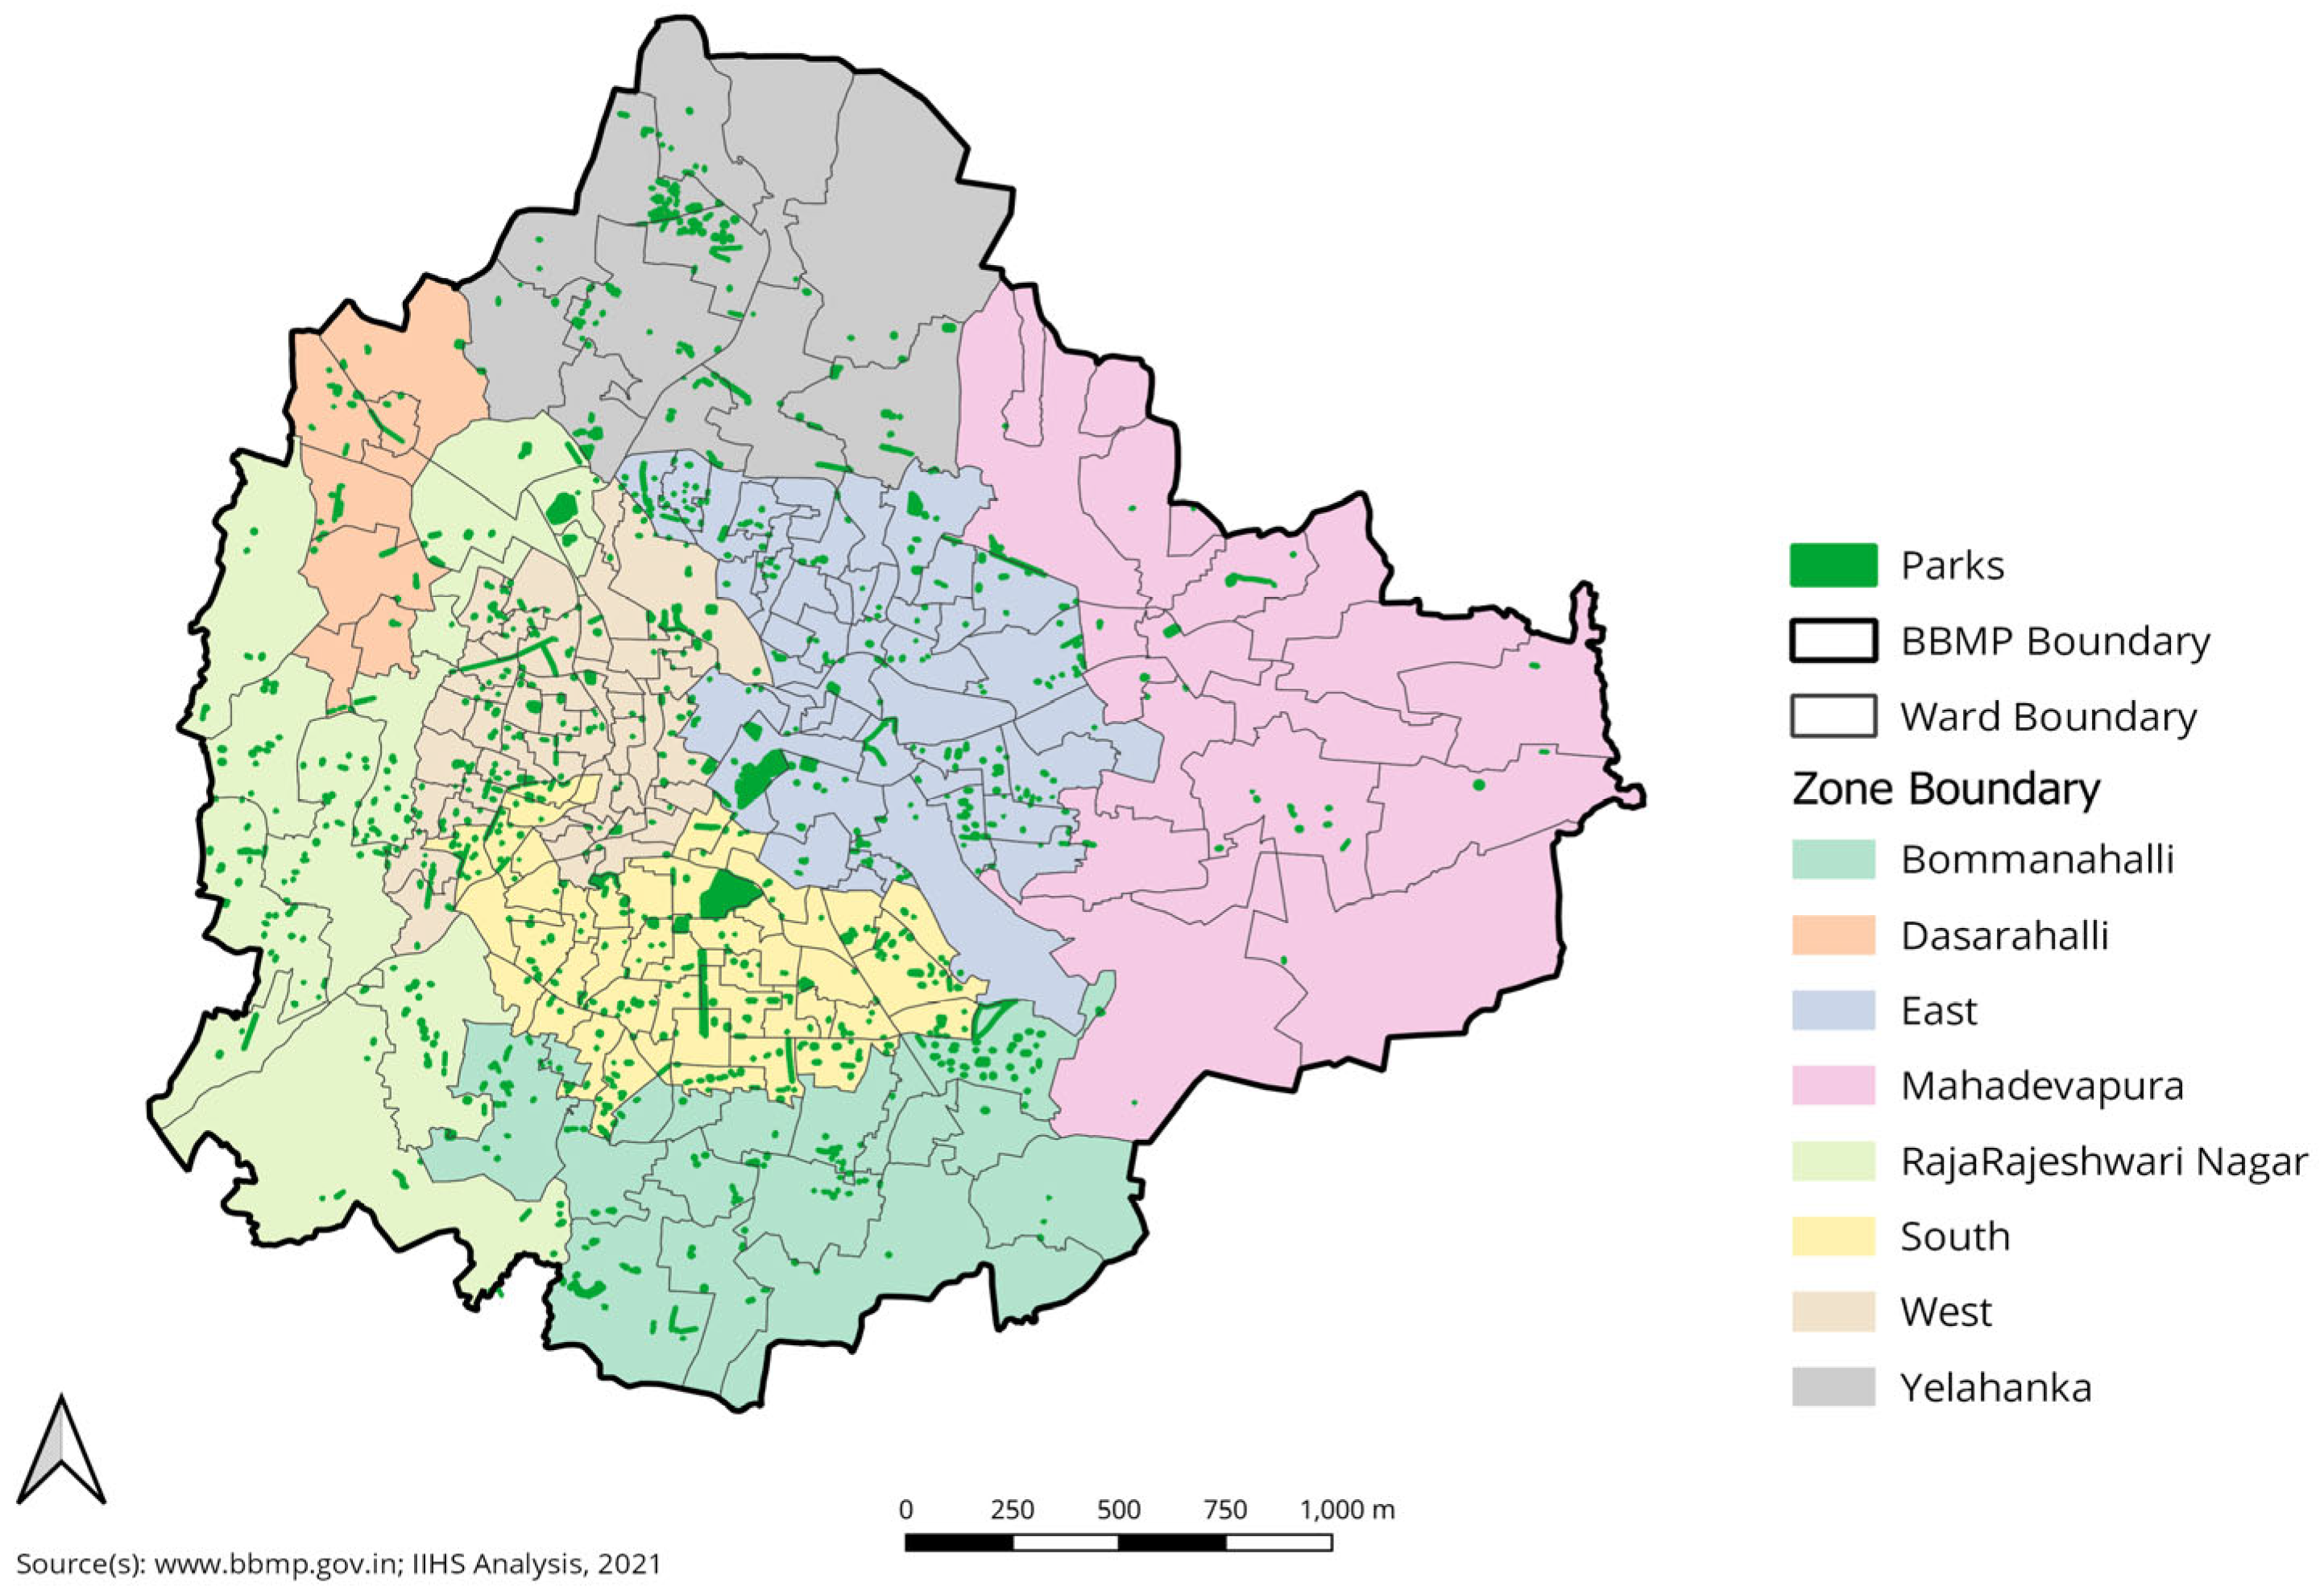
The city is divided into eight zones, namely, Bommanahalli, Dasarahalli, East, Mahadevapura, Rajarajeswari Nagar, South, West, and Yelahanka. The zone-wise spatial distribution of public parks under the jurisdiction of the BBMP is depicted in Figure 3. This distribution of parks revealed a larger number of parks in western compared to eastern Bengaluru. Among the 198 wards in the BBMP, 19 wards did not have single park—7 wards in the East zone, 5 wards in the West zone, 3 wards in the Mahadevapura zone, and 1 ward each in the South, Bommanahalli, Dasarahalli, and Rajarajeshwari Nagar zones—while 36 wards had only 1 park. The Atturu ward (in the Yelahanka zone) had the largest number of parks, accounting for 2 percent of the total area of parks in Bengaluru. The Vishvesapuram ward (in South zone) had the largest area covered by parks, which was 12 percent of the total park area across the wards.
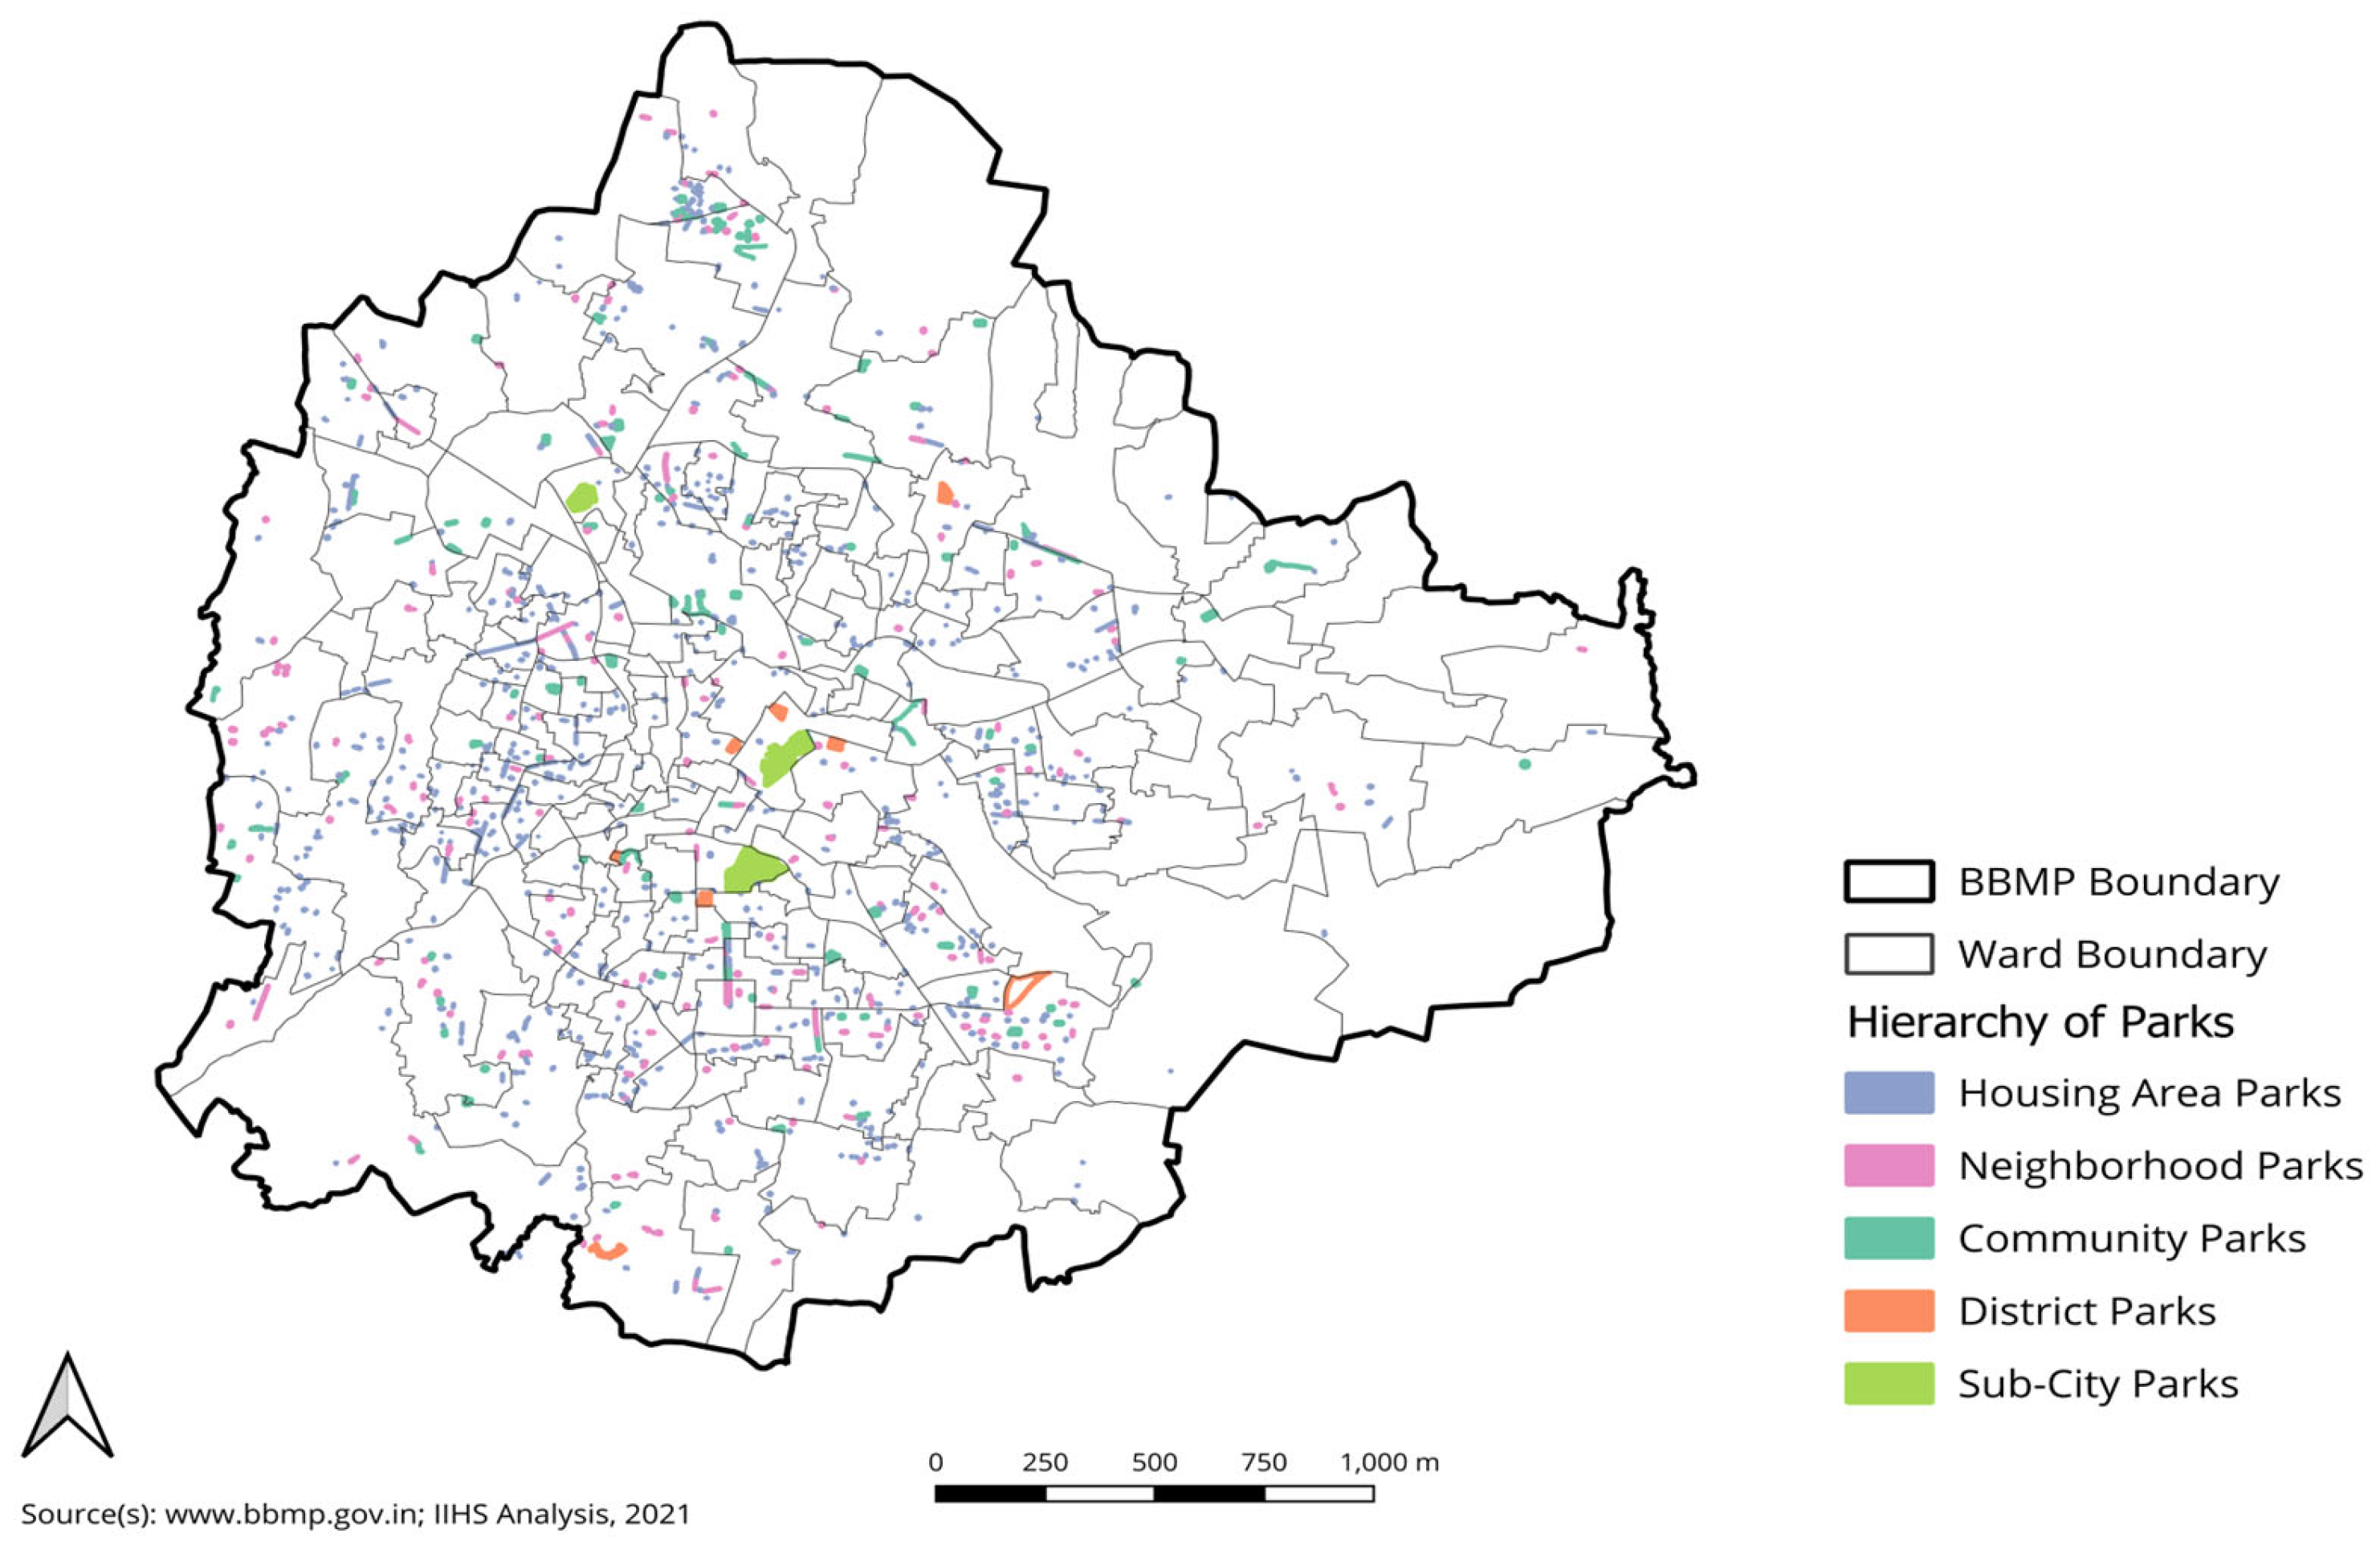
The total area covered by the public parks in the BBMP, based on the hierarchy of parks, is shown in Table 2. In the hierarchy of parks, community parks occupy the largest area, at 25 percent of the total area; followed by sub-city parks and housing area parks, at 24 percent each; while neighborhood parks cover 19 percent and district parks cover 8 percent. The sub-city parks, which are greater than 50 hectares in area, are Cubbon Park, Lalbagh Garden, and JP Park. The spatial distribution of public parks, based on the hierarchy of parks, is shown in Figure 4. Further, an analysis of these parks with respect to their proxy wealth index categories (in Table S2) revealed that the availability and accessibility of these parks is higher for the highly wealthy population compared to the less wealthy population.
The following observations are drawn from Figure 4. There were 72 wards featuring one of the five categories of parks, similarly, there were 58 wards with two of the five categories of parks, 43 wards with three of the five categories of parks, 4 wards with four of the five categories of parks, and only 1 ward which featured all five categories of parks. The Atturu ward has 36 parks, of which 25 parks are housing area parks, 7 are neighborhood parks, and 4 are community parks. The second highest number, 35 parks, was found to be located in HSR Layout (in the Bommanahalli zone), which has 17 housing area parks, 11 neighborhood parks, 4 community parks, and 1 district park.
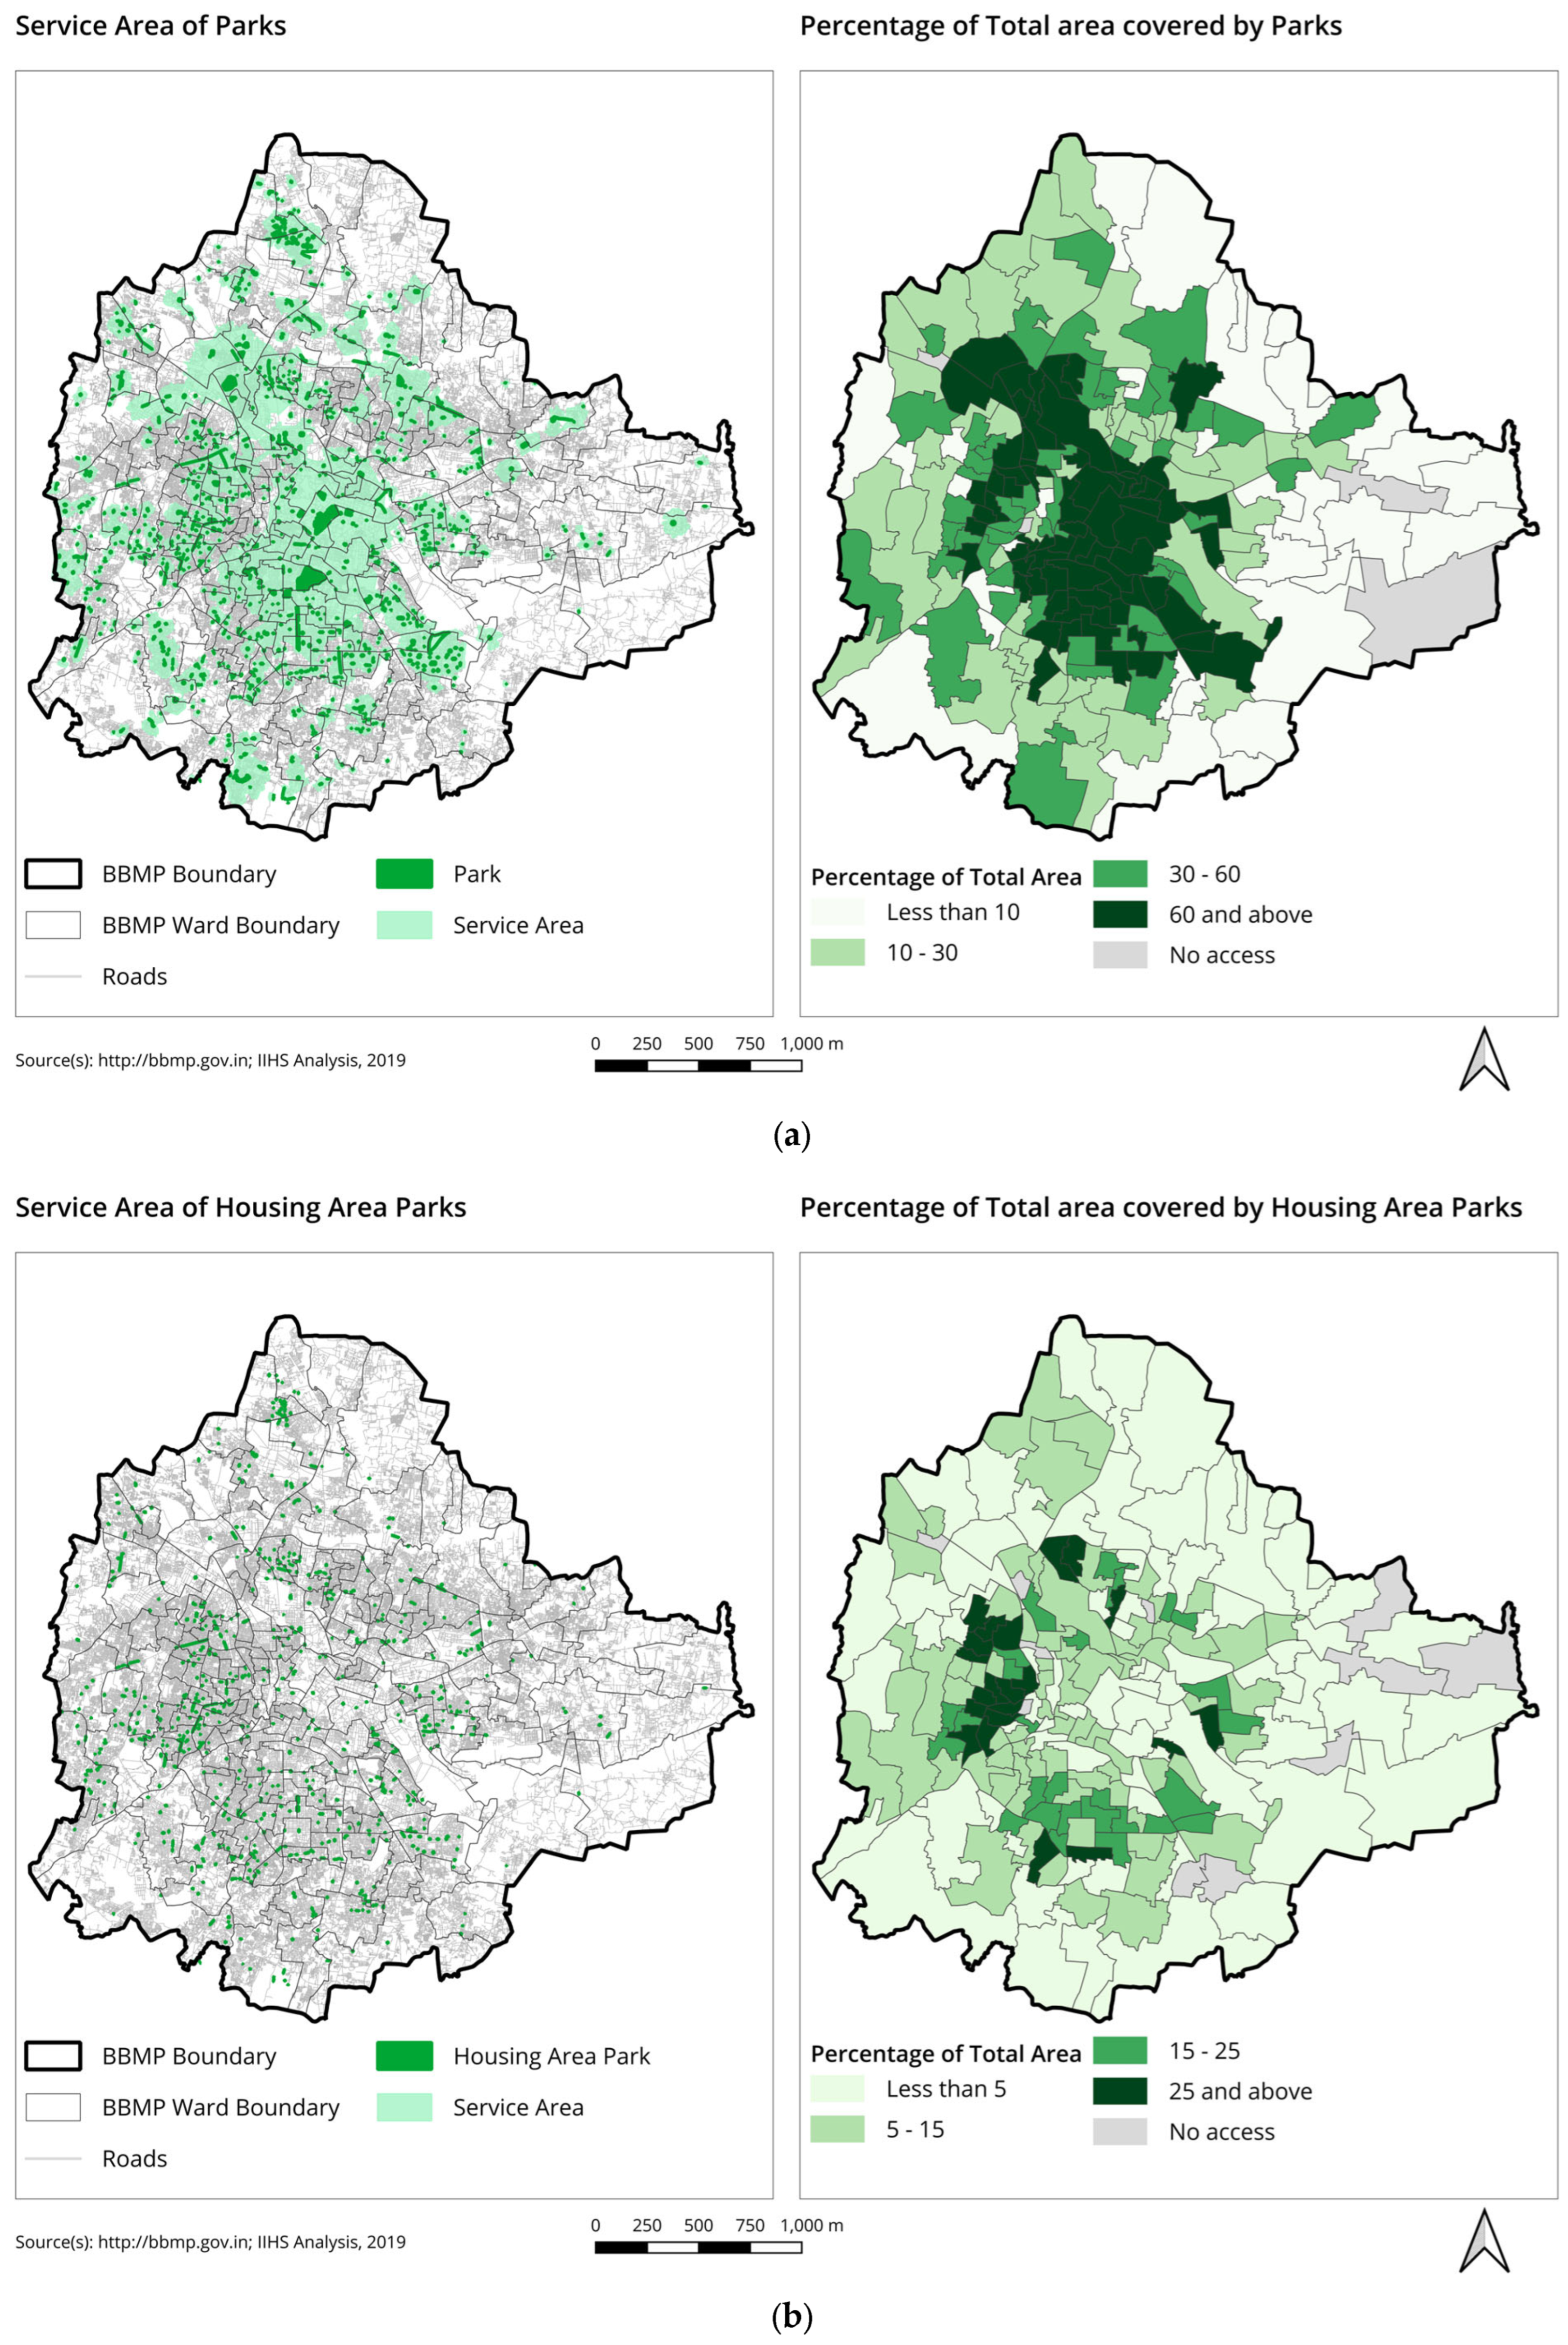
The overall accessibility of these parks, as depicted in Figure 5a, revealed that the central part of the city has 100 percent accessibility. The two parks located in the central part of the city, i.e., Lalbagh Garden and Cubbon Park, cover a larger service area because they are bigger in size and thus have a larger service area in terms of accessibility. The service area analysis of the hierarchy of parks is shown in Figure 5b–f. This service area analysis revealed that 178 (90 percent) wards are covered by at least 5 percent of the service area of housing area parks, 30 (15 percent) wards by 100 percent of the service area of sub-city parks, and 8 (4 percent) wards by 100 percent of the service area of district parks. The bigger the park, the better its accessibility.
The following observations are made based on our service area accessibility analysis. In the case of the accessibility of housing area parks (refer Figure 5b), 11 wards do not have access to a housing area park within a 150 m walking distance (i.e., 4 wards in the Mahadevapura zone, 2 in the Bommanahalli zone, 1 ward each in the South, East, West, Dasarahalli, and Rajarajeshwari Nagar zones), whereas 125 (63 percent) wards have at least a 10 percent accessibility coverage (spread across eight zones) and 13 (6.5 percent) wards have more than a 30 percent accessibility coverage (i.e., 4 wards in the East zone, 5 wards in the West zone, and 4 wards in the South zone). The Vijayanagar ward (in the South zone) has the best accessibility coverage of 58 percent.
In the case of the accessibility of neighborhood parks (refer Figure 5c), 58 (29 percent) wards from all eight zones do not have access to a neighborhood park within a 400 m walking distance, whereas 74 (73 percent) wards have at least a 10 percent accessibility coverage (spread across eight zones) and 20 (10 percent) wards have more than a 30 percent accessibility coverage (i.e., 12 wards in the South zone, 5 wards in the West zone, 2 wards in the East zone, and 1 ward in the Bommmanahalli zone). The Nagapura ward (West zone) has the best accessibility coverage of 59 percent.
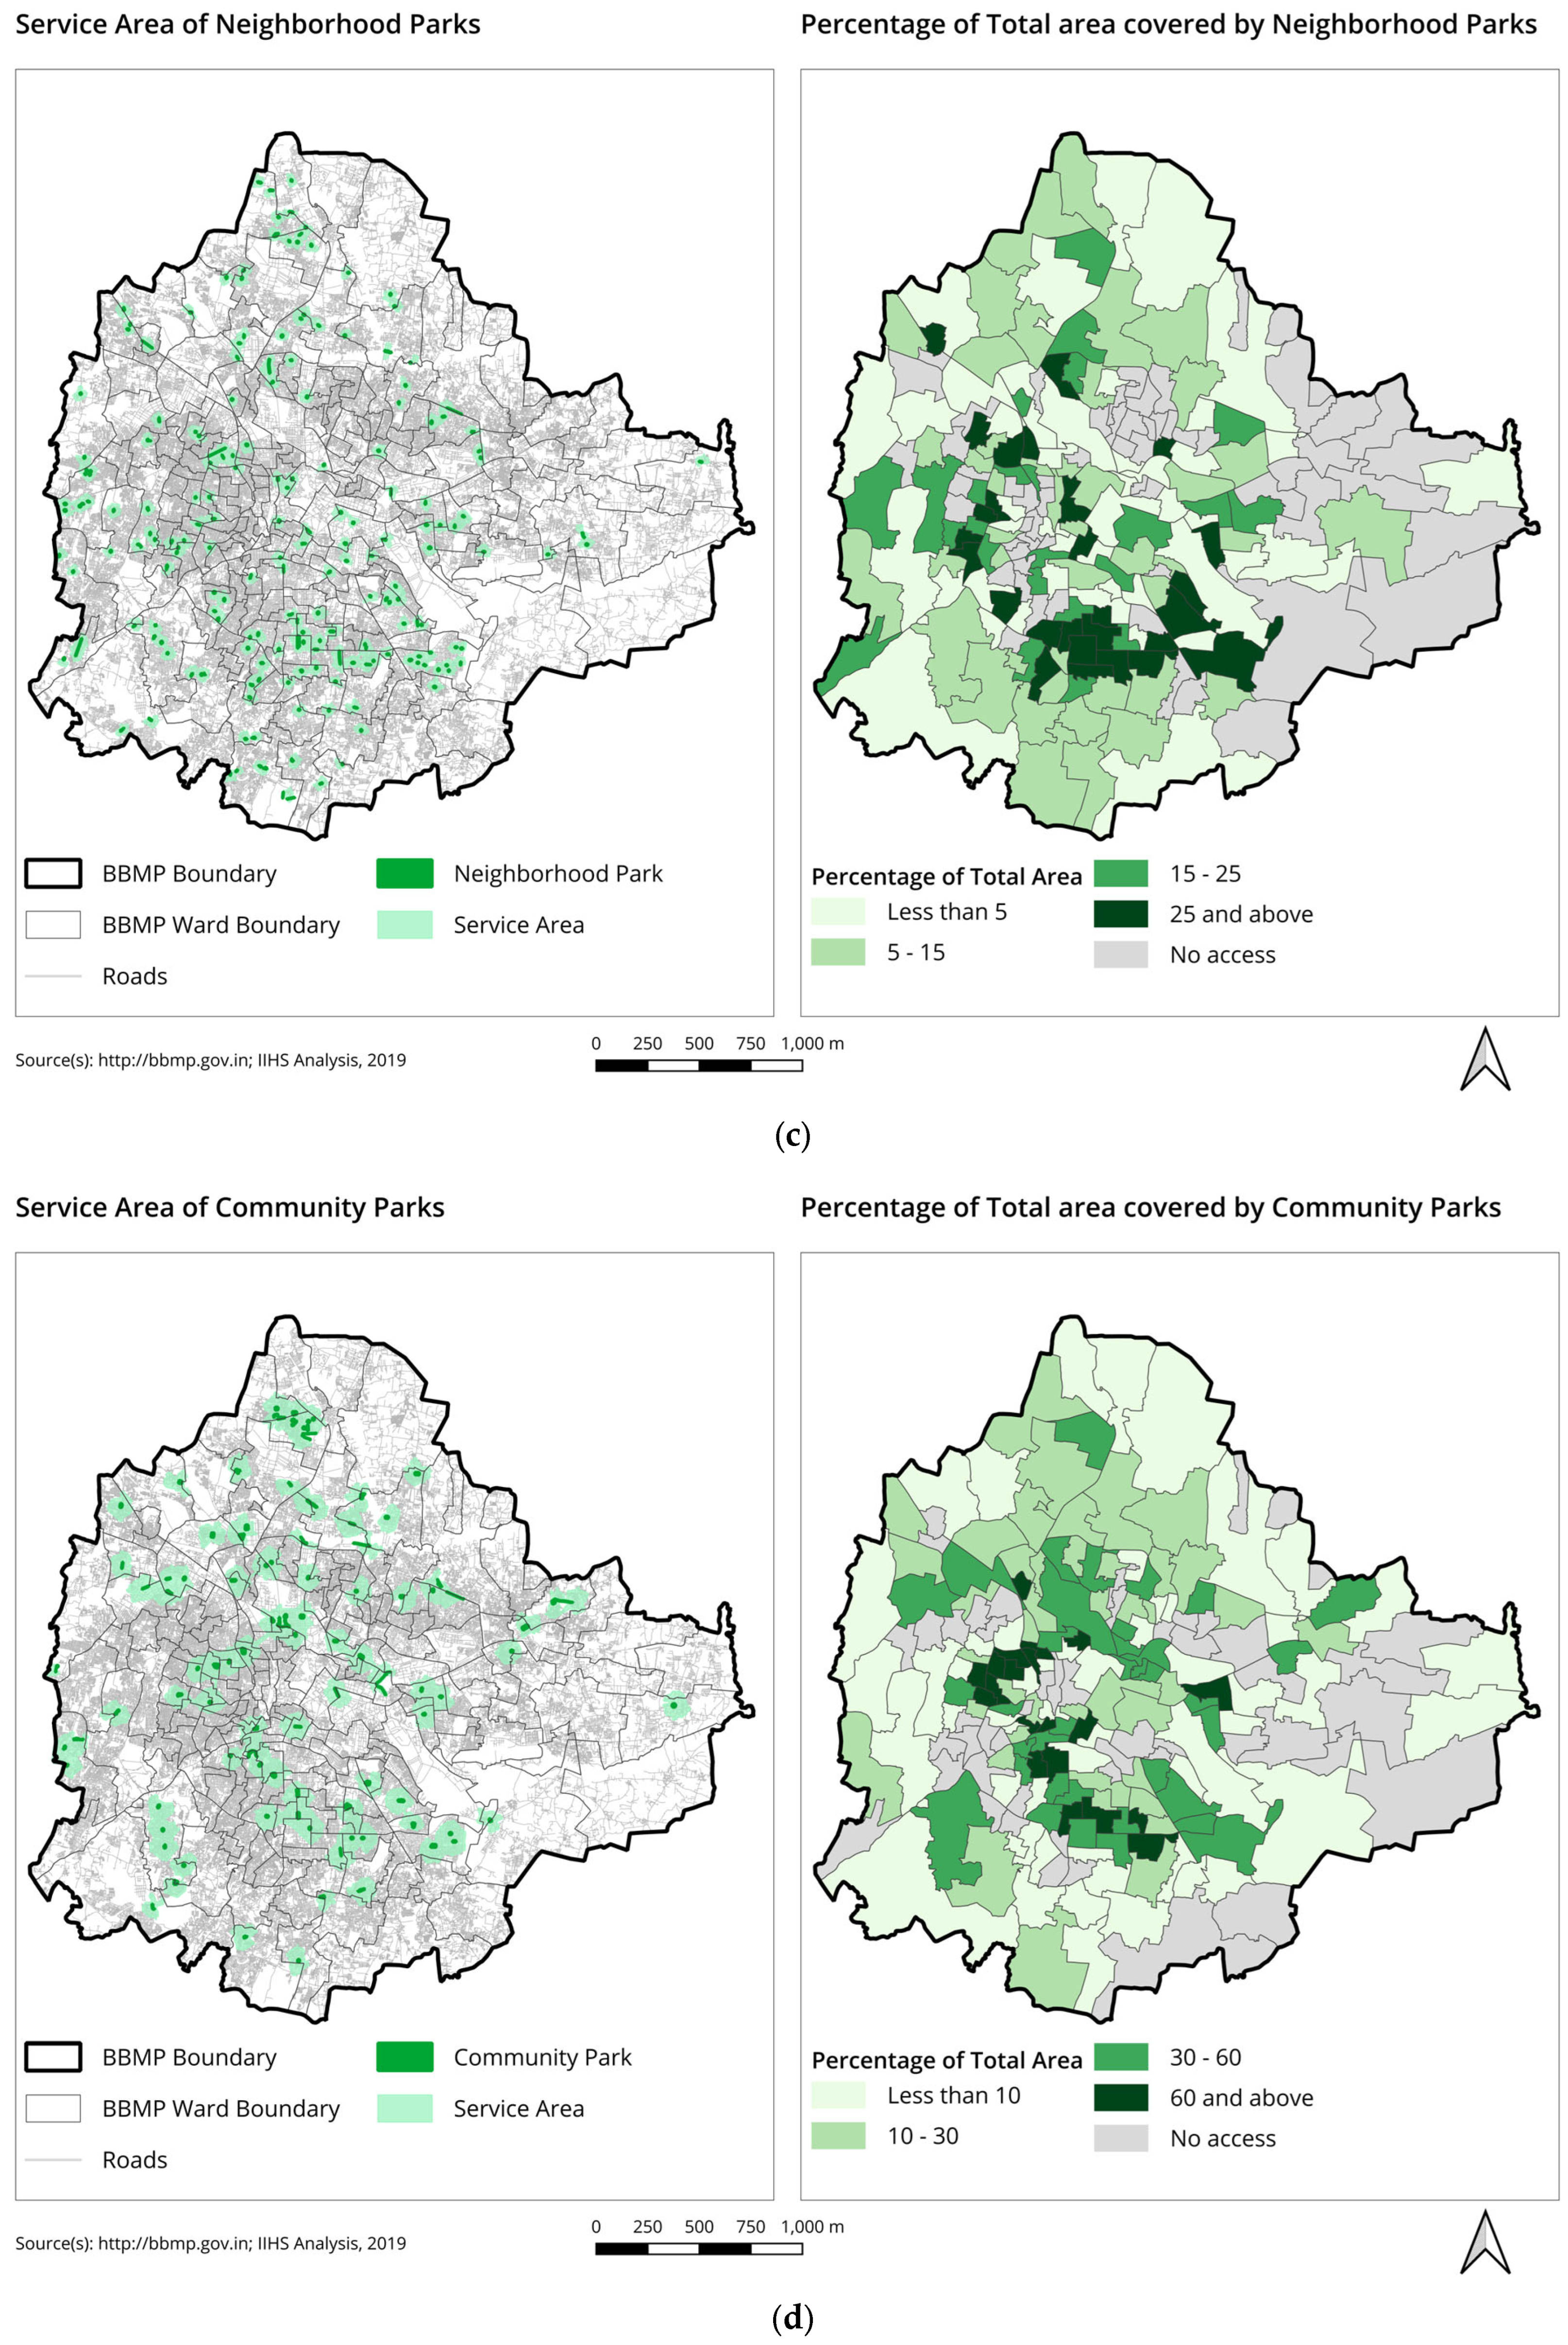
In the case of the accessibility of community parks (refer Figure 5d), 48 (24 percent) wards do not have access to a community park within an 800 m walking distance (spread across eight zones), whereas 53 (27 percent) wards have at least a 10 percent accessibility coverage (spread across eight zones) and 55 (27 percent) wards have more than a 30 percent accessibility coverage (these are mainly 17 wards located in the West and 18 wards in the South zones). The Basaveshwara Nagar ward (West zone) has the maximum accessibility coverage of 98 percent.
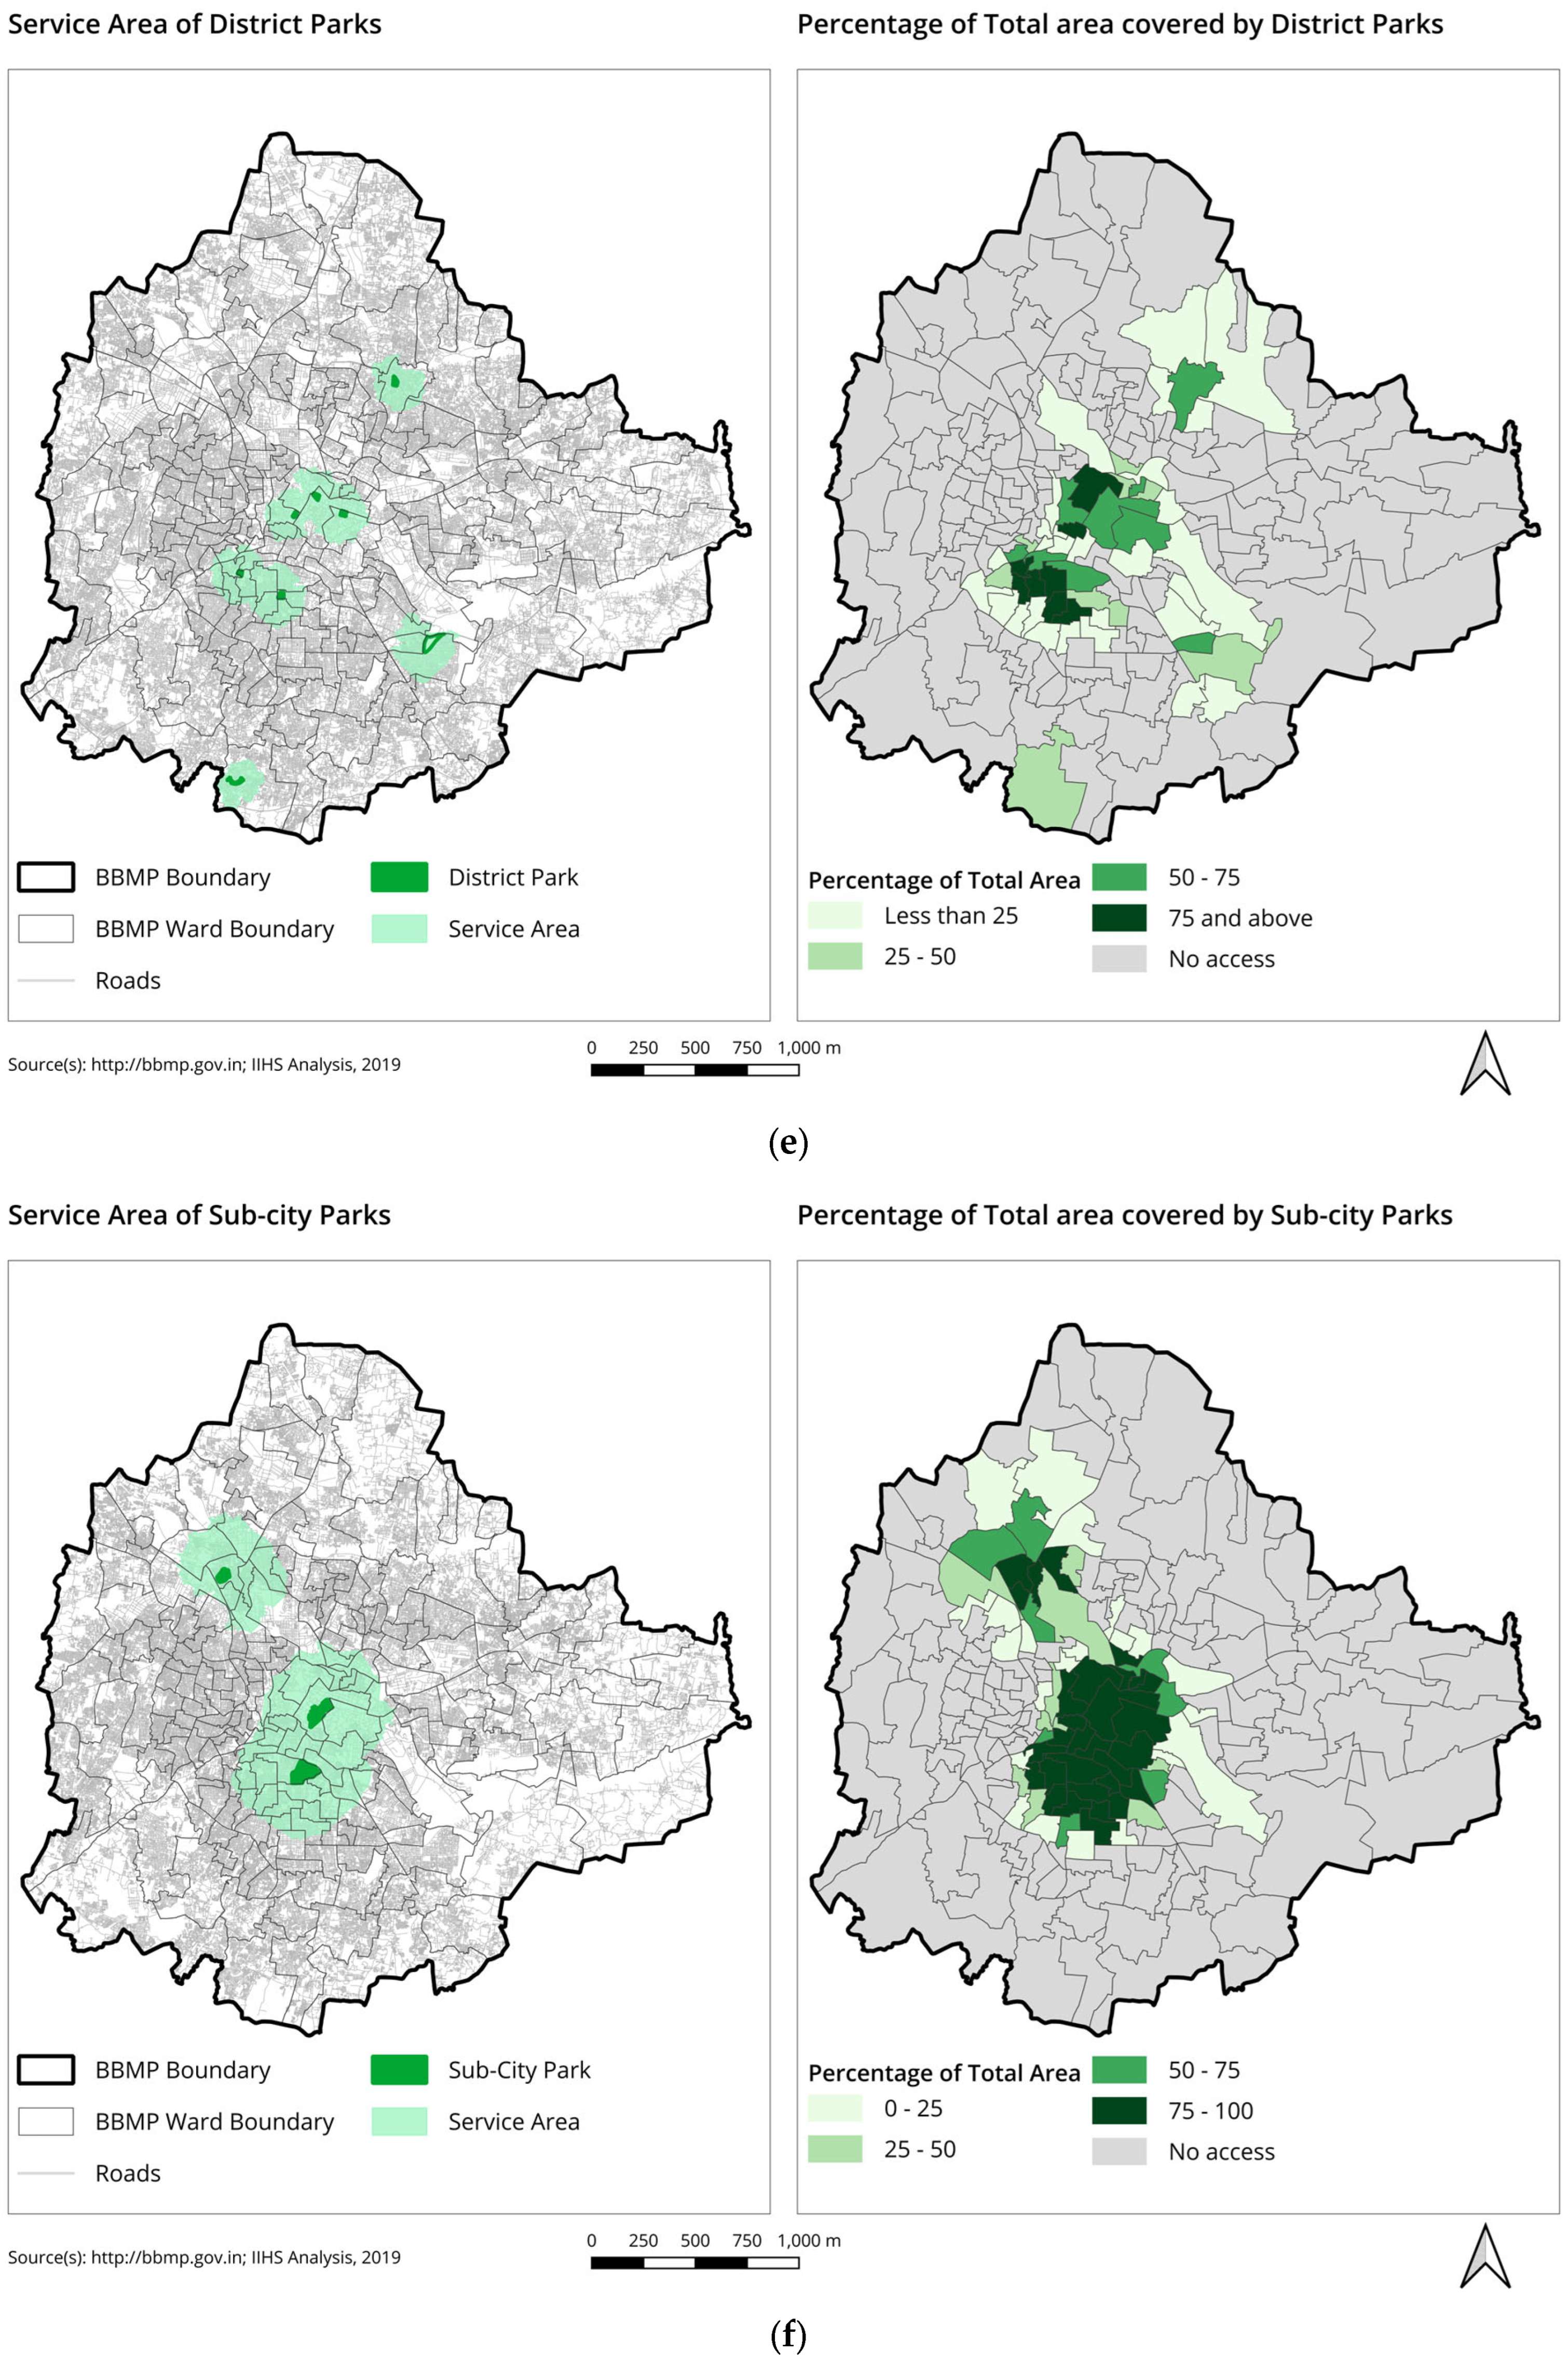
In the case of the accessibility of district parks (refer Figure 5e), 146 (74 percent) wards do not have access to a district park within a 1600 m walking distance (spread across eight zones), whereas 19 (9.5 percent) wards have at least a 10 percent accessibility coverage (i.e., 7 wards in the South zone, 4 wards in the East zone, 4 wards in the West zone, 2 wards in the Bommanahalli zone, and 1 ward each in the Yelahanka and Mahadevapura zones) and 33 (16 percent) wards have more than a 30 percent accessibility coverage (spread across 14 wards in the South zone, 8 wards in the West zone, 9 wards in the East zone, and 2 wards in the Bommanahalli zone). The Hanumanth Nagar and Azad Nagar wards (in the South and West zones) have the best accessibility coverage, at 100 percent.
In the case of the accessibility of sub-city parks (refer Figure 5f), 131 (66 percent) wards do not have access to a sub-city park within a 3200 m walking distance (across all eight zones), whereas 17 (8.5 percent) wards have at least a 10 percent accessibility coverage (including 5 wards in the West zone, 6 wards in the East zone, 2 wards in the South zone, 3 wards in the Yelahanka zone, and 1 ward in the Rajarajeshwari Nagar zone) and 42 (21 percent) wards have more than a 30 percent accessibility coverage (including 9 wards in the West zone, 16 wards in the South zone, 12 wards in the East zone, 4 wards in the Rajarajeshwari Nagar zone, and 1 ward in the Yelahanka zone). A total of 18 wards have a 100 percent accessibility coverage (including 9 wards in the South zone, 3 wards in the West zone, 4 wards in the East zone, and 2 wards in the Rajarajeshwari Nagar zone).
3.2. Equity of Parks’ Accessibility
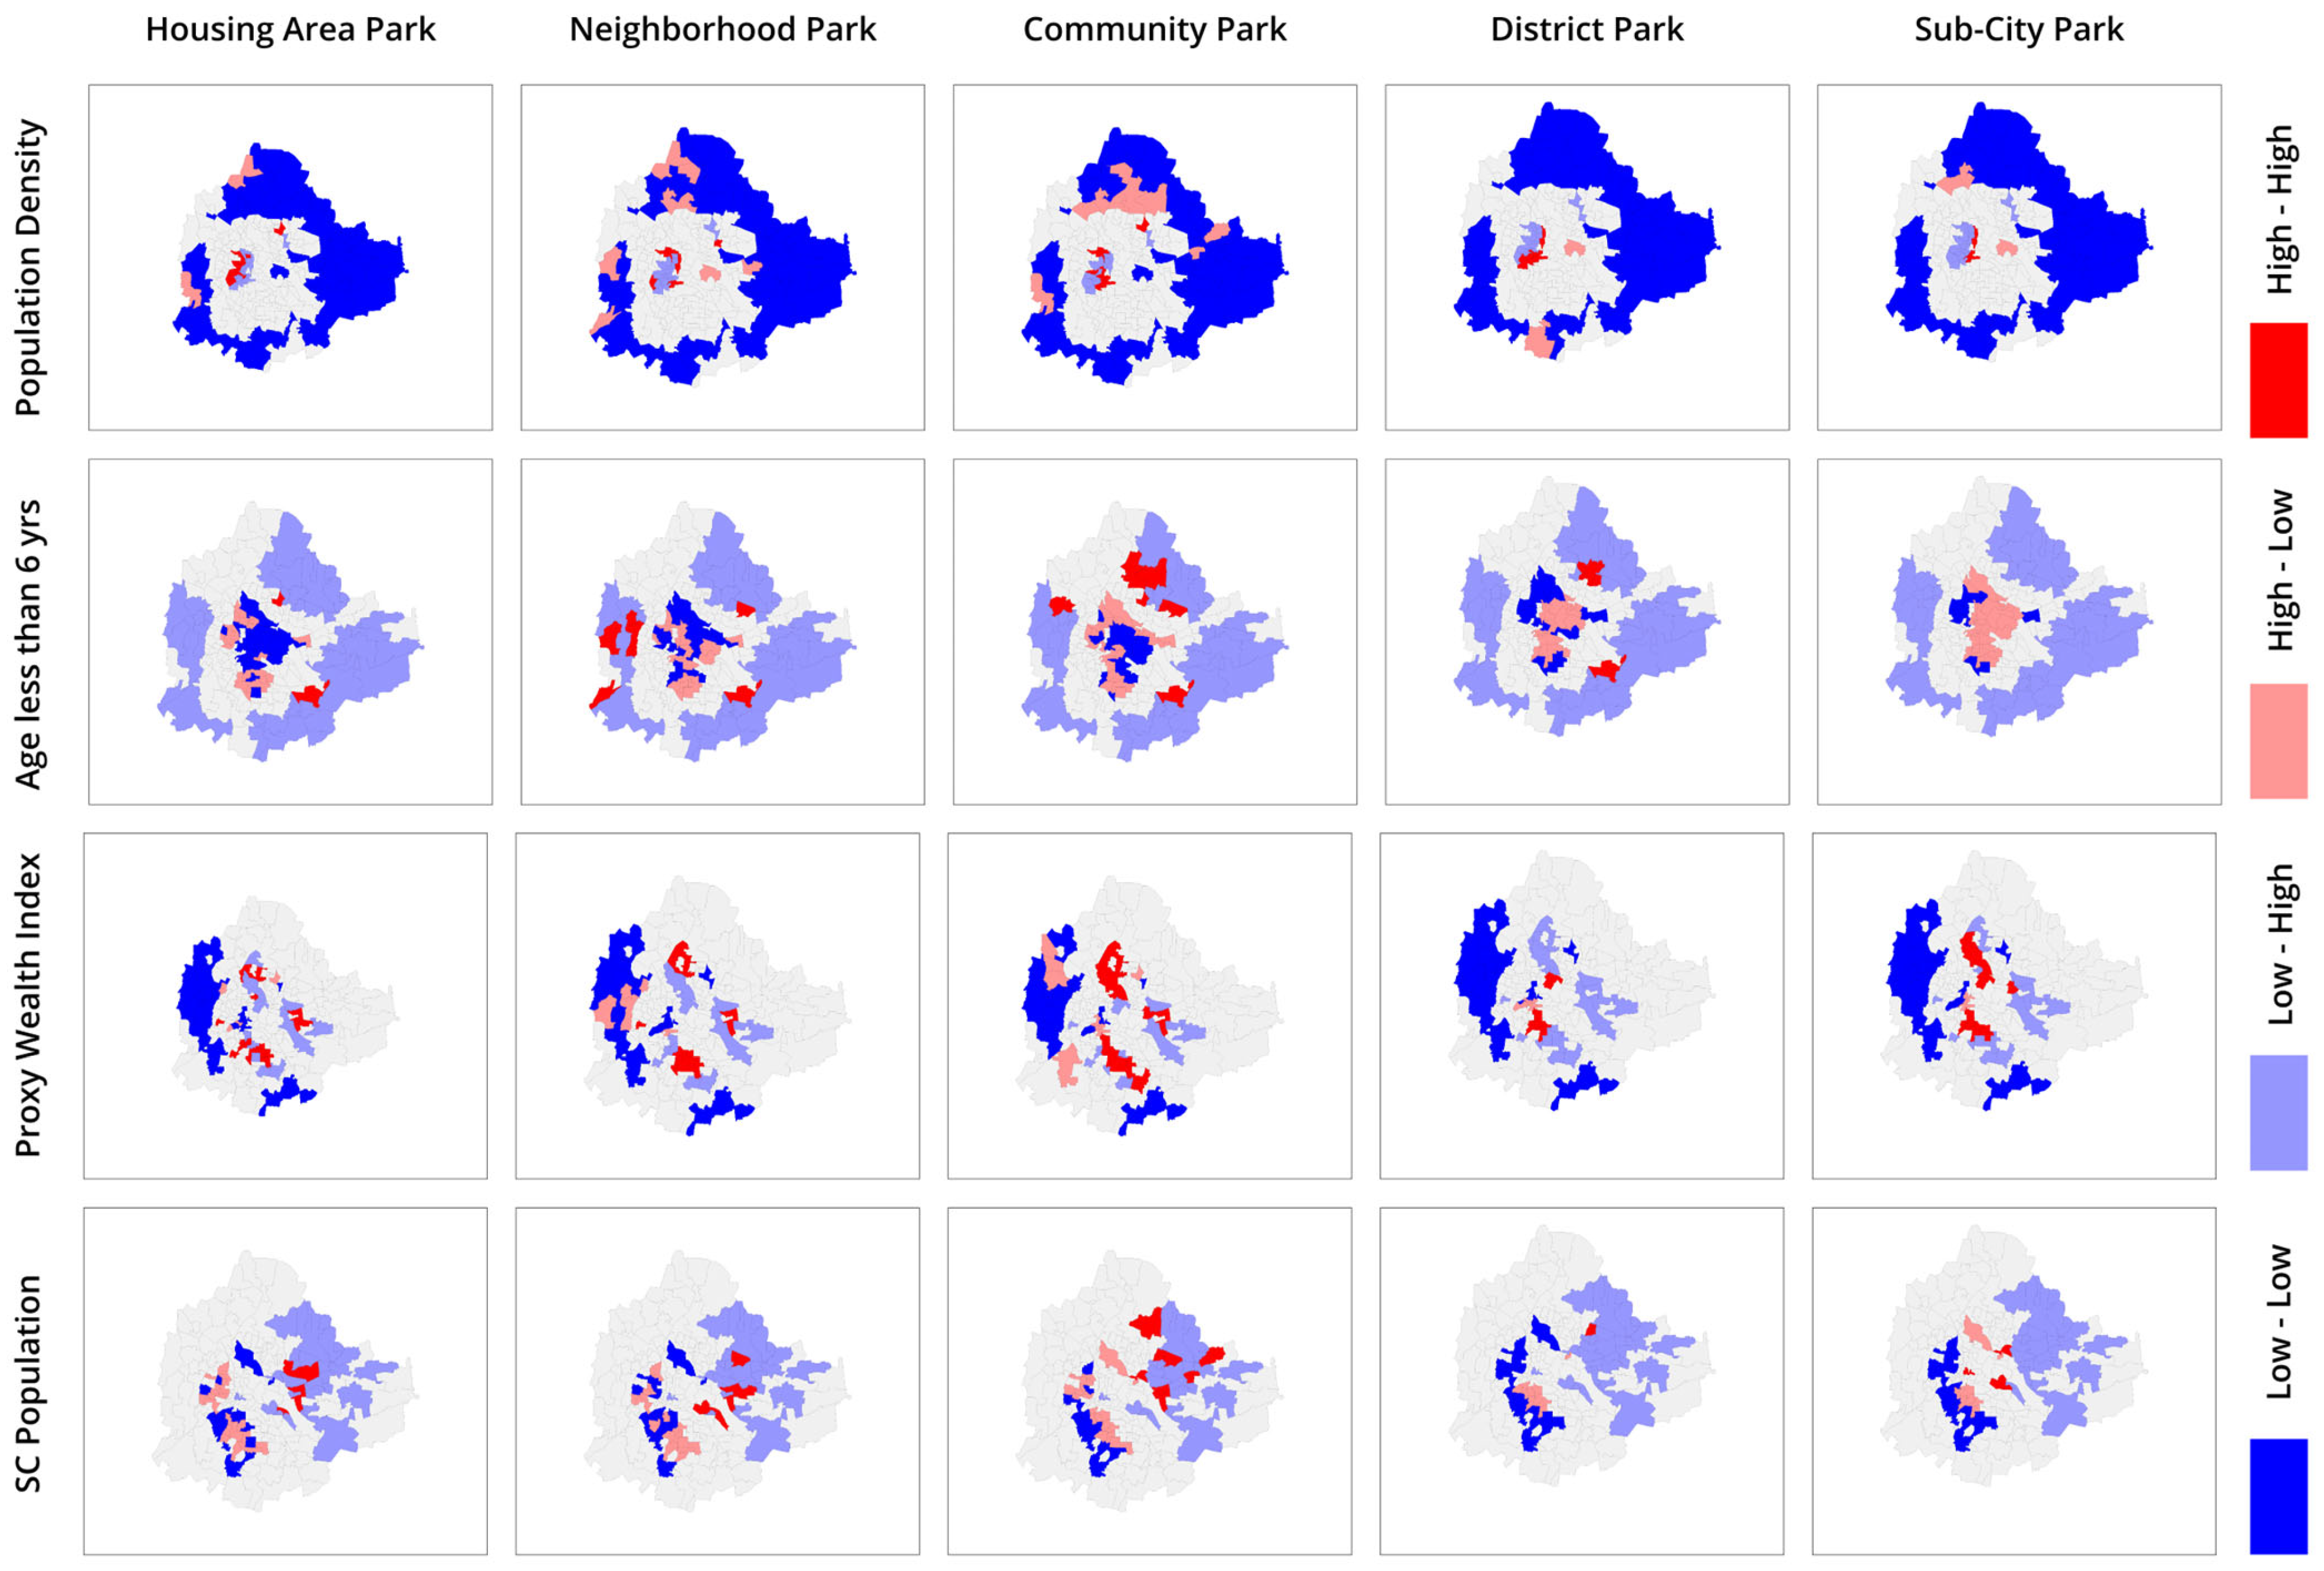
Figure 6 displays the LISA maps for each socio-economic parameter (in rows) and each one of the UGS categories (in columns). Therefore, the first row displays the significant co-occurrences of high/low accessibility and high/low population density across five different UGS categories. The neighborhoods shown in dark red (high–high) have high accessibility and a high value for their socio-economic parameter, whereas those in light red (high–low) have high accessibility and a low value for their socio-economic parameter. In addition, the areas shown in dark blue (low–low) have low accessibility and a low value for their socioeconomic parameter, while light blue areas (low–high) have low accessibility but a high value for their socioeconomic parameter. Only neighborhoods that are statistically significant are colored.
The following patterns emerge from Figure 6:
- (i)
- In the case of population density, the majority of the parks across the UGS categories are most likely inaccessible to the neighborhoods located in the peripheries of Bengaluru city, where the population density is low.
- (ii)
- In the case of children (aged less than 6 years), the majority of the parks across the UGS categories are most likely inaccessible to the neighborhoods located in the peripheries of Bengaluru city where the population of children is large. The center of the city is filled with light-red- and dark-blue-colored neighborhoods.
- (iii)
- In the case of the proxy wealth index, parks across the UGS categories are most likely inaccessible (except a few which are highly accessible) to low-income neighborhoods in the western areas and southern peripheries of the city. The center of the city is filled with few dark-red- and light-blue-colored neighborhoods.
- (iv)
- In the case of the scheduled caste population, parks across the UGS categories are most likely inaccessible to the neighborhoods located in the eastern areas of the city where the scheduled caste population is high.
4. Discussion
To understand the equitable distribution of public parks—one type of green space in urban settings—this study analyses the distribution and accessibility of public parks in Bengaluru city and proposes the health implications of inequitable access. Access to public parks matters as it positively affects human health by promoting physical activity, improving general health, and enhancing psychological well-being [15]. Further, the equitable distribution of and access to parks was measured by correlating the different categories of parks with four socio-economic parameters: population density, the percentage of the population less than 6 years old, the proxy wealth index, and the SC population.
Our study used a GIS to map public parks as there is lack of local data on green spaces. Studies on the availability of and equitable access to UGSs are rare in the Indian context. The study conducted by Gutiérrez et al. [11] in a metropolitan area of Mexico used a similar methodology to map green space distribution using ArcGIS and measured its accessibility using network analysis. Their results are consistent with our study: a low quantity of green spaces and their uneven distribution result in the inaccessibility of these spaces for a larger proportion of the city’s population. A similar study on the accessibility of UGSs in Mysuru city by Yashaswini and Shankar [16] showed almost consistent results. The uneven distribution of public parks in Bengaluru is clear from the spatial distribution analysis, which revealed, of a total of 198 wards, that about 19 wards have no parks and 36 wards have 1 park. Most of the neighborhood parks—which are most convenient to access by walking (within 400 m)—performed the worst with regard to their number, area coverage, and accessibility. It is often assumed that people utilize parks if they are accessible by walking, but this is inconsistent with the study by Paul and Nagendra [17] conducted in the national capital, Delhi, which revealed that 54 percent of visitors who accessed the surveyed parks visited from more than 1 km away and about 33 percent visited from more than 10 km. Therefore, based on our study, it cannot be concluded that the parks that are inaccessible are not utilized (as most of the neighborhood parks and community parks are inaccessible).
Our study’s results on the accessibility of parks based on different UGS categories reveal that more than 50 percent of wards (of 198 wards) do not have the minimum 10 percent accessibility coverage for the categories of housing area parks, neighborhood parks, and community parks, which is consistent with the study by Iraegui et al. [7], which found that residential and neighborhood UGSs were not accessible or within walking distances. Further, adding to the study conducted by Shi et al. [18] in Urumqi, China, on the accessibility of various categories of UGSs, such as neighborhood-level UGSs, district-level UGSs, and metro-level UGSs, it was found that there is an uneven distribution of UGSs among residents in terms of both spatial levels and UGS categories and that the distribution of accessibility was too uneven. The increase in the proportion and areas of three levels of UGSs in the built-up areas of Urumqi, between 2009 and 2019, was effective in improving the accessibility of UGSs, especially neighborhood-level UGSs.
Considering equitable access to UGSs, our study found that the majority of the public parks in the bottom of the parks’ hierarchy, such as housing area parks, neighborhood parks, and community parks (which must be accessible within walkable distance), are most likely inaccessible to all deprived groups such as children’s groups, the SC population, and low-income groups in the city. The study conducted by Astell-Burt et al. [19] in Australia’s most populous cities also found that an inequity in the access to green spaces persists in all cities when comparing disadvantaged versus affluent neighborhoods. Iraegui et al. [7] also revealed a similar result, i.e., higher income neighborhoods have more access to UGSs. Ferguson et al. [20] found a low accessibility to neighborhood green spaces in neighborhoods with a high proportion of Asian/Asian British residents compared to predominantly white and more affluent areas, and a high accessibility in neighborhoods with lower levels of deprivation.
There have been studies conducted based on users’ perceptions of the accessibility and benefits of green spaces. A study by Basu and Nagendra [21] in Hyderabad, India, found an uneven access to green spaces with gender and income inequalities. Paul and Nagendra [17] added that visitors used green spaces mostly for environmental benefits, followed by psychological and health benefits, social and recreational benefits, and biodiversity benefits. But there is a significant association between the perception of green space use and socio-demographic characteristics: older age groups use green spaces for environmental benefits and psychological and health benefits. Visitors’ education and occupation were also significantly associated with their psychological and health benefits. Bhattacharya et al. [22] also added that the use of green spaces has a positive impact on lifestyle. It is to be noted that our study does not measure the types of essential services available in these parks and their utilization benefits to users. Other than what is documented through research, government sources are unlikely to provide details on the kind of services available in these parks. However, essential services vary based on the park’s UGS category, indicating that fewer facilities are available in the parks with smaller area requirements, i.e., housing area parks. Therefore, neighborhood parks and community parks are ideal for the utilization of facilities which are not available at housing area parks, given the population they serve and their area requirement. A survey conducted on the parks in Bengaluru found that the parks need much improvement in the availability of public toilets, drinking water, garbage bins/debris, lighting, jogging tracks, seating areas, playing/exercise equipment, and security staff [23], indicating that the utilization of a UGS depends on the quality of the services that it provides. Therefore, even though a UGS is available and accessible, the unavailability of essential quality services might reduce the utilization of that UGS. Further a study conducted by Swamy [24] in Bengaluru proposed the planting of biodiversity-friendly plants in neighborhood parks. Our study looks beyond biodiversity, through the planetary health equity approach, by noting that, while biodiversity indirectly has a positive effect on health, public parks should not only be considered as advancing environmental sustainability and climate resilience, but also as improving the health and wellbeing of the population. This study’s findings are valuable in planning and implementing UGSs in cities. Given that the availability of UGSs is one of the essential components to protect cities and the planet from the ongoing severe impacts of climate change, local urban bodies must consider their accessibility and quality services to promote their utilization and periodic maintenance in city planning and their implementation.
5. Conclusions
The distribution and equitable access to public parks has been tremendously affected by the urbanizing of Bengaluru. We propose a reshaping of both neighborhood parks and community parks—with adequate area requirements, equitable access, and essential services at the neighborhood scale—to nurture their promotional services for physical health, mental health, social and recreational activities, exposure to biodiversity, and overall wellbeing. Affirmative action, in terms of the availability of public parks with adequate area requirements and essential services at a neighborhood scale, is required to redress the socioeconomic inequity of access to this important public health resource. In addition, accessibility must be considered important during urban planning. It is important to protect biodiversity at the local level through neighborhood and community parks. Therefore, to retain its green city title, the Bengaluru city corporation must prioritize and implement strategies to improve the availability and equitable access to public parks in its master plan for city planning. When considering the expansion of the city, it is also important that the master plan re-think its strategies, as the inclusion of rural areas into the city is high and these areas have very different characteristics. Developmental activities are also happening more in these areas. Further, this study also emphasizes that the city corporation must improve its information system for public parks, and this might positively improve the access to city/ward-level data to promote research and advocacy to protect public parks. This study is limited by a lack of data on the public parks in Bengaluru, and on income, migrant populations, and age groups at the city/ward level, from government sources such as local government and the Census. In the case of such limitations, the methodology of this study can be used in any context, and especially at the city/ward level, to assess the distribution and accessibility of UGSs. This study emphasizes the need for more research evidence on the distribution and equitable access to UGSs in Indian cities. Further research must also be promoted to generate evidence on UGSs’ utilization and their effect on the overall health and wellbeing of urban populations, using a planetary health approach.
Supplementary Materials
The following supporting information can be downloaded at https://www.mdpi.com/article/10.3390/challe15020020/s1: additional methods; Table S1. Major Indian cities with per capita green space; Table S2. Total mean area and percentage across the hierarchy of parks for each PWI category; Figure S1. Administrative map: (i) Karnataka State (ii) Bengaluru city [6,8,14,25,26].
Author Contributions
N.B. contributed to conceptualization, writing the introduction, the results and discussion, and editing and finalizing the manuscript. D.M. contributed to GIS mapping, analyzing the data, and also to writing the results. All authors have read and agreed to the published version of the manuscript.
Funding
This research received no external funding.
Data Availability Statement
The data can be made available on request from the authors when inquiries abide by institutional ethical guidelines and have a clear research purpose.
Acknowledgments
The authors would like to acknowledge the technical advice received from Gautam Bhan.
Conflicts of Interest
The authors declare no conflicts of interest.
References
- European Environment Agency. Mapping Guide for an European Urban Atlas; European Environment Agency: Copenhagen, Denmark, 2015. [Google Scholar]
- Government of India. Urban Greening Guidelines. Report, Ministry of Urban Development. 2014. Available online: https://mohua.gov.in/upload/uploadfiles/files/G%20G%202014(2).pdf (accessed on 17 November 2022).
- NITI Ayog: Government of India. Reforms in Urban Planning Capacity in India. 2021. Available online: https://www.niti.gov.in/sites/default/files/2021-09/UrbanPlanningCapacity-in-India-16092021.pdf (accessed on 15 January 2023).
- Census. Office of the Registrar. General and Census Commissioner of India; Government of India: New Delhi, India, 2011. [Google Scholar]
- Indian Institute of Science. Tree of Bengaluru: ENVIS Technical Report; Centre for Ecological Sciences, IISc: Bengaluru, India, 2014. [Google Scholar]
- Bowler, D.E.; Buyung-Ali, L.; Knight, T.M.; Pullin, A.S. Urban greening to cool towns and cities: A systematic review of the empirical evidence. Landsc. Urban Plan. 2010, 97, 147–155. [Google Scholar] [CrossRef]
- Iraegui, E.; Augusto, G.; Cabral, P. Assessing Equity in the Accessibility to Urban Green Spaces According to Different Functional Levels. ISPRS Int. J. Geo-Inf. 2020, 9, 308. [Google Scholar] [CrossRef]
- Van Herzele, A.; Wiedemann, T. A monitoring tool for the provision of accessible and attractive urban green spaces. Landsc. Urban Plan. 2003, 63, 109–126. [Google Scholar] [CrossRef]
- Bruhut Bengaluru Mahanagara Palike (BBMP). Available online: https://data-opencity.sgp1.cdn.digitaloceanspaces.com/Documents/Recent/BBMP-DetaliedListofParks.pdf (accessed on 26 July 2023).
- Government of India. Urban and Regional Development Plans Formulation and Implementation (URDPFI) Guidelines. Report, Ministry of Urban Development Volume-I. 2015. Available online: https://mohua.gov.in/upload/uploadfiles/files/URDPFI%20Guidelines%20Vol%20I(2).pdf (accessed on 17 November 2022).
- Gutiérrez, M.F.; Noguez, A.B.; Flamenco-Sandoval, A.; Serrano, A.M.; Flores-Torres, A.; Ramírez, A.K.G. Availability and accessibility of urban green spaces: The case of the urban zone of Queretaro Metropolitan Area, Mexico. J. Maps 2021, 17, 101–105. [Google Scholar] [CrossRef]
- Comber, A.; Brunsdon, C.; Green, E. Using a GIS-based network analysis to determine urban greenspace accessibility for different ethnic and religious groups. Landsc. Urban Plan. 2008, 86, 103–114. [Google Scholar] [CrossRef]
- Almohamad, H.; Knaack, A.L.; Habib, B.M. Assessing spatial equity and accessibility of public green spaces in Aleppo City, Syria. Forests 2018, 9, 706. [Google Scholar] [CrossRef]
- Bhan, G.; Jana, A. Reading Spatial Inequality in Urban India. Econ. Political Wkly. 2015, 50, 49–54. [Google Scholar]
- Wolch, J.; Jason, B.; Joshua, N. Urban green space, public health, and environmental justice: The challenge of making cities ‘just green enough’. Landsc. Urban Plan. 2014, 125, 234–244. [Google Scholar] [CrossRef]
- Yashaswini, S.; Shankar, B. Challenges of Urban Green Space and Its Accessibility in Planning District-12, Mysuru City. Int. J. Recent Technol. Eng. 2021, 10, 137–141. [Google Scholar]
- Paul, S.; Nagendra, H. Factors Influencing Perceptions and Use of Urban Nature: Surveys of Park Visitors in Delhi. Land 2017, 6, 27. [Google Scholar] [CrossRef]
- Shi, L.; Halik, U.; Abliz, A.; Mamat, Z.; Welp, M. Urban Green Space Accessibility and Distribution Equity in an Arid Oasis City: Urumqi, China. Forests 2020, 11, 690. [Google Scholar] [CrossRef]
- Astell-Burt, T.; Feng, X.; Mavoa, S.; Badland, H.M.; Giles-Corti, B. Do low-income neighbourhoods have the least green space? A cross-sectional study of Australia’s most populous cities. BMC Public Health 2014, 14, 292. [Google Scholar] [CrossRef] [PubMed]
- Ferguson, M.; Roberts, H.E.; McEachan, R.C.; Dallimer, M. Contrasting Distributions of Urban Green Infrastructure across Social and Ethno-racial Groups. Landsc. Urban Plan. 2018, 175, 136–148. [Google Scholar] [CrossRef]
- Basu, S.; Nagendra, H. Perceptions of park visitors on access to urban parks and benefits of green spaces. Urban For. Urban Green. 2021, 57, 126959. [Google Scholar] [CrossRef]
- Gandherva, D.; Bhattacharya, R.; Bhattacharya, P. Assessment of User’s Perception towards Urban Green Spaces: A Case Study of Delhi, India. J. Ecol. Nat. Resour. 2019, 3, 000156. [Google Scholar]
- Ichangemycity. Parks and Playgrounds Score of Bengaluru. Report, Janaagraha Centre for Citizenship & Democracy. 2017. Available online: http://janaagraha.org/files/publications/PARKS-PLAYGROUNDS-SCORE-OF-BENGALURU-2017.pdf (accessed on 17 November 2022).
- Swamy, S. Reshaping Neighbourhood Parks for Biodiversity and People: A study on pocket green spaces in Bangalore, India. In Social-Ecological Systems in Transition. Global Environmental Studies; Springer: Tokyo, Japan, 2012. [Google Scholar]
- Singh, A.; Pathak, P.K.; Chauhan, R.K.; Pan, W. Infant and child mortality in India in the last two decades: A geospatial analysis. PLoS ONE 2011, 6, e26856. [Google Scholar] [CrossRef] [PubMed]
- Anselin, L. Local Indicators of Spatial Association—LISA. Geogr. Anal. 1995, 27, 93–115. [Google Scholar] [CrossRef]
Figure 1.
Spatial distribution of public parks and the road network.

Figure 2.
Spatial distributions of the selected socio-economic parameters. (a) population density (b) proxy wealth index (c) population < 6 years of age (d) SC population.
Figure 2.
Spatial distributions of the selected socio-economic parameters. (a) population density (b) proxy wealth index (c) population < 6 years of age (d) SC population.

Figure 3.
Zone-wise spatial distribution of public parks.

Figure 4.
Spatial distribution of public parks based on their hierarchy.

Figure 5.
(a). Spatial distribution of service area of public parks (b). Spatial distribution of service area of housing area parks (c). Spatial distribution of service area of neighborhood parks (d). Spatial distribution of service area of community parks (e). Spatial distribution of service area of district parks. (f). Spatial distribution of service area of Sub-city parks.


Figure 6.
LISA maps showing the spatial distribution of public parks based on their hierarchy and by socio-economic parameter.
Figure 6.
LISA maps showing the spatial distribution of public parks based on their hierarchy and by socio-economic parameter.


Table 1.
Hierarchy of parks and their coverage and area requirements.
| Park Hierarchy | Population Served (per Unit) # | Area Requirement (in Hectares) # | Accessibility Distance (in Meters) * |
|---|---|---|---|
| Hierarchy 1: Housing Area Parks | 5000 | 0.50 | 150 |
| Hierarchy 2: Neighbourhood parks | 15,000 | 1.00 | 400 |
| Hierarchy 3: Community parks | 100,000 | 5.00 | 800 |
| Hierarchy 4: District parks | 500,000 | 25.00 | 1600 |
| Hierarchy 5: Sub-city parks | 1,000,000 | 100.00 | 3200 |
Source: # Government of India, 2015; * authors’ calculation (Van and Wiedemann, 2003 [8]).
Table 2.
Total area covered by public parks based on the parks’ hierarchy.
| Hierarchy of Parks | Area (sq.km.) | Percentage | Mean Area |
|---|---|---|---|
| Housing area parks | 1.87 | 24 | 0.23 |
| Neighborhood parks | 1.44 | 19 | 0.69 |
| Community parks | 1.90 | 25 | 1.85 |
| District parks | 0.60 | 8 | 7.59 |
| Sub-city parks | 1.85 | 24 | 61.76 |
Disclaimer/Publisher’s Note: The statements, opinions and data contained in all publications are solely those of the individual author(s) and contributor(s) and not of MDPI and/or the editor(s). MDPI and/or the editor(s) disclaim responsibility for any injury to people or property resulting from any ideas, methods, instructions or products referred to in the content. |
© 2024 by the authors. Licensee MDPI, Basel, Switzerland. This article is an open access article distributed under the terms and conditions of the Creative Commons Attribution (CC BY) license (https://creativecommons.org/licenses/by/4.0/).
Share and Cite
MDPI and ACS Style
Bhor, N.; Mayavel, D. The Socio-Spatial Distribution and Equity of Access to Urban Parks: A Case Study of Bengaluru, India. Challenges 2024, 15, 20. https://doi.org/10.3390/challe15020020
AMA Style
Bhor N, Mayavel D. The Socio-Spatial Distribution and Equity of Access to Urban Parks: A Case Study of Bengaluru, India. Challenges. 2024; 15(2):20. https://doi.org/10.3390/challe15020020
Chicago/Turabian StyleBhor, Nilanjan, and Dhananjayan Mayavel. 2024. "The Socio-Spatial Distribution and Equity of Access to Urban Parks: A Case Study of Bengaluru, India" Challenges 15, no. 2: 20. https://doi.org/10.3390/challe15020020
Note that from the first issue of 2016, this journal uses article numbers instead of page numbers. See further details here.