Article

Industrial Developmental Toxicants and Congenital Heart Disease in Urban and Rural Alberta, Canada

by
Deliwe P. Ngwezi
1,2,
Lisa K. Hornberger
1,2,3,*,
Jesus Serrano-Lomelin
3,
Charlene C. Nielsen
4,5,6,
Deborah Fruitman
7 and
Alvaro Osornio-Vargas
2,5,6
1
Division of Pediatric Cardiology, Fetal and Neonatal Cardiology Program, Department of Pediatrics, Stollery Children’s Hospital, University of Alberta, Edmonton, AB T6G 2B7, Canada
2
Women and Children’s Health Research Institute, University of Alberta, Edmonton, AB T6G 1C9, Canada
3
Department of Obstetrics and Gynecology, University of Alberta, Edmonton, AB T6G 2R7, Canada
4
Department of Earth and Atmospheric Sciences, University of Alberta, Edmonton, AB T6G 2E3, Canada
5
Division of Immunology, Hematology, Oncology, Palliative Care and Environmental Health, Department of Pediatrics, University of Alberta, Edmonton, AB T6G 1C9, Canada
6
inVIVO Planetary Health of the Worldwide Universities Network (WUN), West New York, NJ 07093, USA
7
Section of Pediatric Cardiology, Department of Pediatrics, Alberta Children’s Hospital, University of Calgary, AB T3B 6A8, Canada
*
Author to whom correspondence should be addressed.
Challenges 2018, 9(2), 26; https://doi.org/10.3390/challe9020026
Submission received: 17 May 2018 / Revised: 28 June 2018 / Accepted: 28 June 2018 / Published: 1 July 2018

Abstract

:
The etiology of congenital heart defects (CHD) is not known for many affected patients. In the present study, we examined the association between industrial emissions and CHD in urban and rural Alberta. We acquired the emissions data reported in the Canadian National Pollutant Release Inventory (n = 18) and identified CHD patients born in Alberta from 2003–2010 (n = 2413). We identified three groups of emissions after principal component analysis: Groups 1, 2, and 3. The distribution of exposure to the postal codes with births was determined using an inverse distance weighted approach. Poisson or negative binomial regression models helped estimate associations (relative risk (RR), 95% Confidence Intervals (CI)) adjusted for socioeconomic status and two criteria pollutants: nitrogen dioxide and particulate matter with a mean aerodynamic diameter of ≤2.5 micrometers. The adjusted RR in urban settings was 1.8 (95% CI: 1.5, 2.3) for Group 1 and 1.4 (95% CI: 1.3, 1.6) for both Groups 2 and 3. In rural postal codes, Groups 1 and 3 emissions had a RR of 2.6 (95% CI: 1.03, 7). Associations were only observed in postal codes with the highest levels of emissions and maps demonstrated that regions with very high exposures were sparse.

1. Introduction

Congenital heart disease (CHD) affects nearly 1% of newborns worldwide [1,2] and is the most common cause of neonatal death among babies with birth defects [3]. Although the etiology for some CHD can be directly attributed to known chromosomal anomalies, Mendelian syndromes, and non-syndromic single gene disorders [4,5], the majority are thought to be multifactorial and related to complex interactions between intrauterine exposures and developmental processes with or without a genetic predisposition [6,7].
With the lack of a defined etiology for most CHD, there has been an increasing interest in investigating the potential role of exposures to environmental toxicants; however, the results have been inconsistent and have focused primarily on urban criteria pollutants such as sulphur dioxide, nitrogen dioxide, carbon monoxide, particulate matter, and ozone [8]. Two recent meta-analyses examining studies that reported a relationship between criteria air pollutants and CHD found a consistent positive association between nitrogen dioxide and coarctation of the aorta [9,10]. Fewer studies have examined the association between industrial emissions and CHD, and of those, the most consistent positive associations for CHD have been with organic compounds (e.g., benzene, trichloroethylene, toluene) [11,12,13,14]. Finally, most investigations have concentrated on single pollutant exposures with only one previous report having examined the relationship between urban multipollutant exposures and CHD [15].
Over the past five decades, the province of Alberta has witnessed growing industrial development owing to the discovery and exploitation of the oil sands in the 1970s, which was accompanied by rapid population growth. Naturally, concerns have been raised about the adverse impact of industrial pollution sources on planetary health such as the health of ecosystems, biodiversity, and natural landscapes in which people live [16]. Human beings have a complex connection and dependency on the health of the ecosystems. If anthropogenic sources of environmental pollution challenge the natural systems, it results in adverse health effects that impact all living species. The Public Health Agency of Canada has documented that the prevalence of CHD in the province is greater than the national average [17]. Furthermore, Canada is part of the initiative established by the Organization for Economic Co-operation and Development (OECD) in 1996 to develop registries that capture toxic emissions from industries operating in those countries. Thus the government of Canada established a National Pollutant Release Inventory (NPRI) to capture and track emissions released onsite or offsite into air, water, and soil, for monitoring and management purposes. Given public access to the NPRI and the fact that we have centralized pediatric cardiology services with two referral centers in Alberta, we sought to investigate the potential exposure to multiple pollutant exposures on CHD development by assigning the sum of the inverse distance weighted emissions on the maternal residential postal code in urban and rural Alberta.

2. Results

2.1. Principal Component Analysis (PCA)

The PCA matrix revealed three groups of industrial emissions which were selected based on the correlation coefficient ≥0.6, highlighted in Table 1. Group 1 consisted of benzene, carbon disulfide, carbon monoxide, toluene, sulphur dioxide, toluene, and 1,3 butadiene; Group 2 consisted of ethylene oxide, methyl-isobutyl-ketone, methanol, chloroform, trichloroethylene, and 1,3 butadiene; Group 3 consisted of mercury, arsenic, hexachlorobenzene, lead, and cadmium (the chemicals are presented in the order of their correlation coefficient from the highest to lowest). Out of the 17 industrial sectors operating in Alberta, only 11 sectors reported emissions released to air to the NPRI for the study period (2003–2010). The total number of emitting facilities (EF) was greater in rural (n = 1172, 75%) compared to urban regions (n = 388, 25%). The rural postal codes had the highest proportion of emissions in tonnes (2,894,743, 60%) compared to urban (1,958,101, 40%) for the study period (Supplementary Figure S1A) and Group 1 emissions in amounts were dominant compared to Group 2 and 3 emissions. The mining, utilities, and manufacturing sectors contributed 99.6% of the total emissions in the province. The proportions of the emissions based on the three main sectors for the three multipollutant groups are shown in Supplementary Figure S1B. The mining sector contributed the largest proportion of the emissions followed by manufacturing and utilities sectors. The utilities sector was more dominant in rural postal codes.

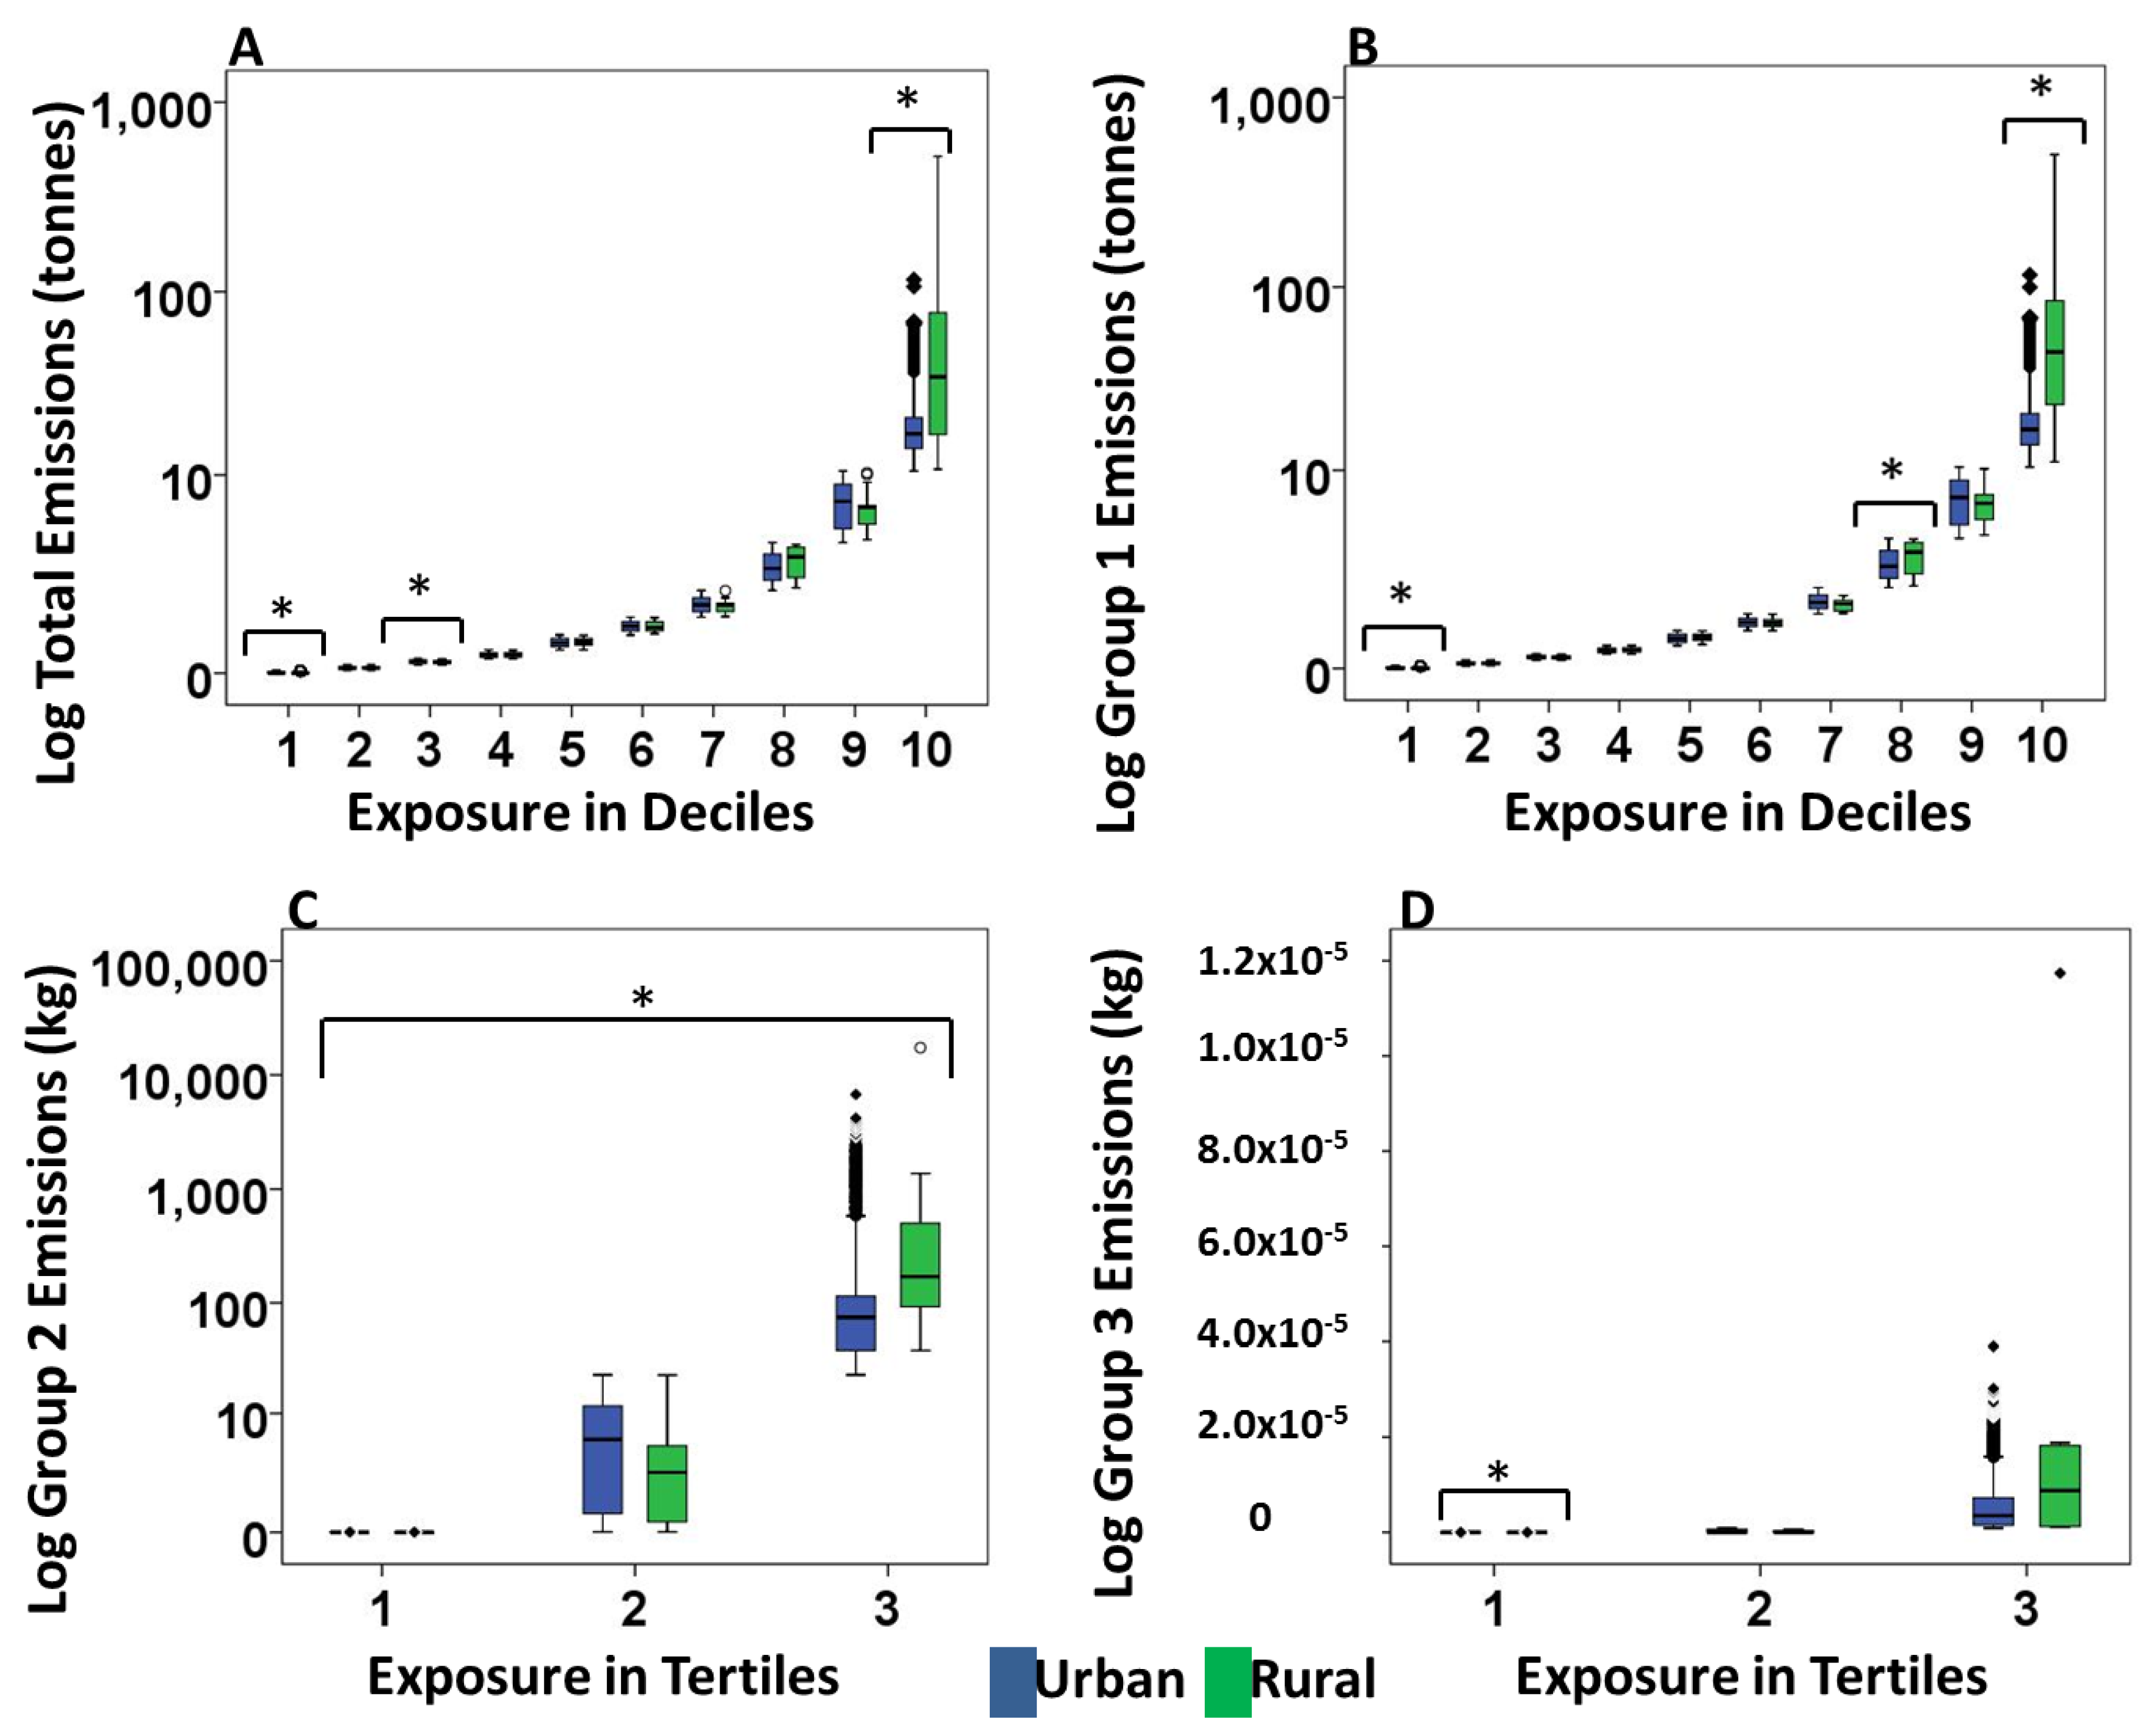
2.2. Distribution of Emitting Facilities and Exposure on Alberta Postal Codes

We worked with a total of 54,240 postal codes, where 52,077 postal codes had emitting facilities within a 10 km radius and 2163 other postal codes had emitting facilities beyond a 10 km radius. The postal codes with no facilities within the 10 km radius were included as part of the distribution of exposures fitting in the lowest category of exposure. Most of the postal codes (n = 53,561, 98.7%) were urban, whereas (n = 679, 0.01%) were rural (Table 2). However, because of the likelihood that an emitting facility could impact both urban and rural postal codes based on distance regardless of the location, we found that the median number of emitting facilities impacting urban postal codes was higher (n = 60, IQR 84) than the rural postal codes (n = 10, IQR 15) due to a larger number of postal codes with births in urban regions compared to rural postal codes. After calculating the inverse distance weighted (IDW) exposure by the facilities within 10 km of the postal codes of interest, the median total exposure was significantly higher in urban (0.6 tonnes, IQR 2.4) compared to rural postal codes (0.07 tonnes, IQR 0.3). Similarly, when considering the median exposure of the three multipollutant groups, it was significantly higher in urban compared to rural postal codes (Table 2). Figure 1 presents the decile distribution of the IDW exposure for all and Group 1 emissions and the tertile distribution of Groups 2 and 3, comparing urban and rural postal codes.

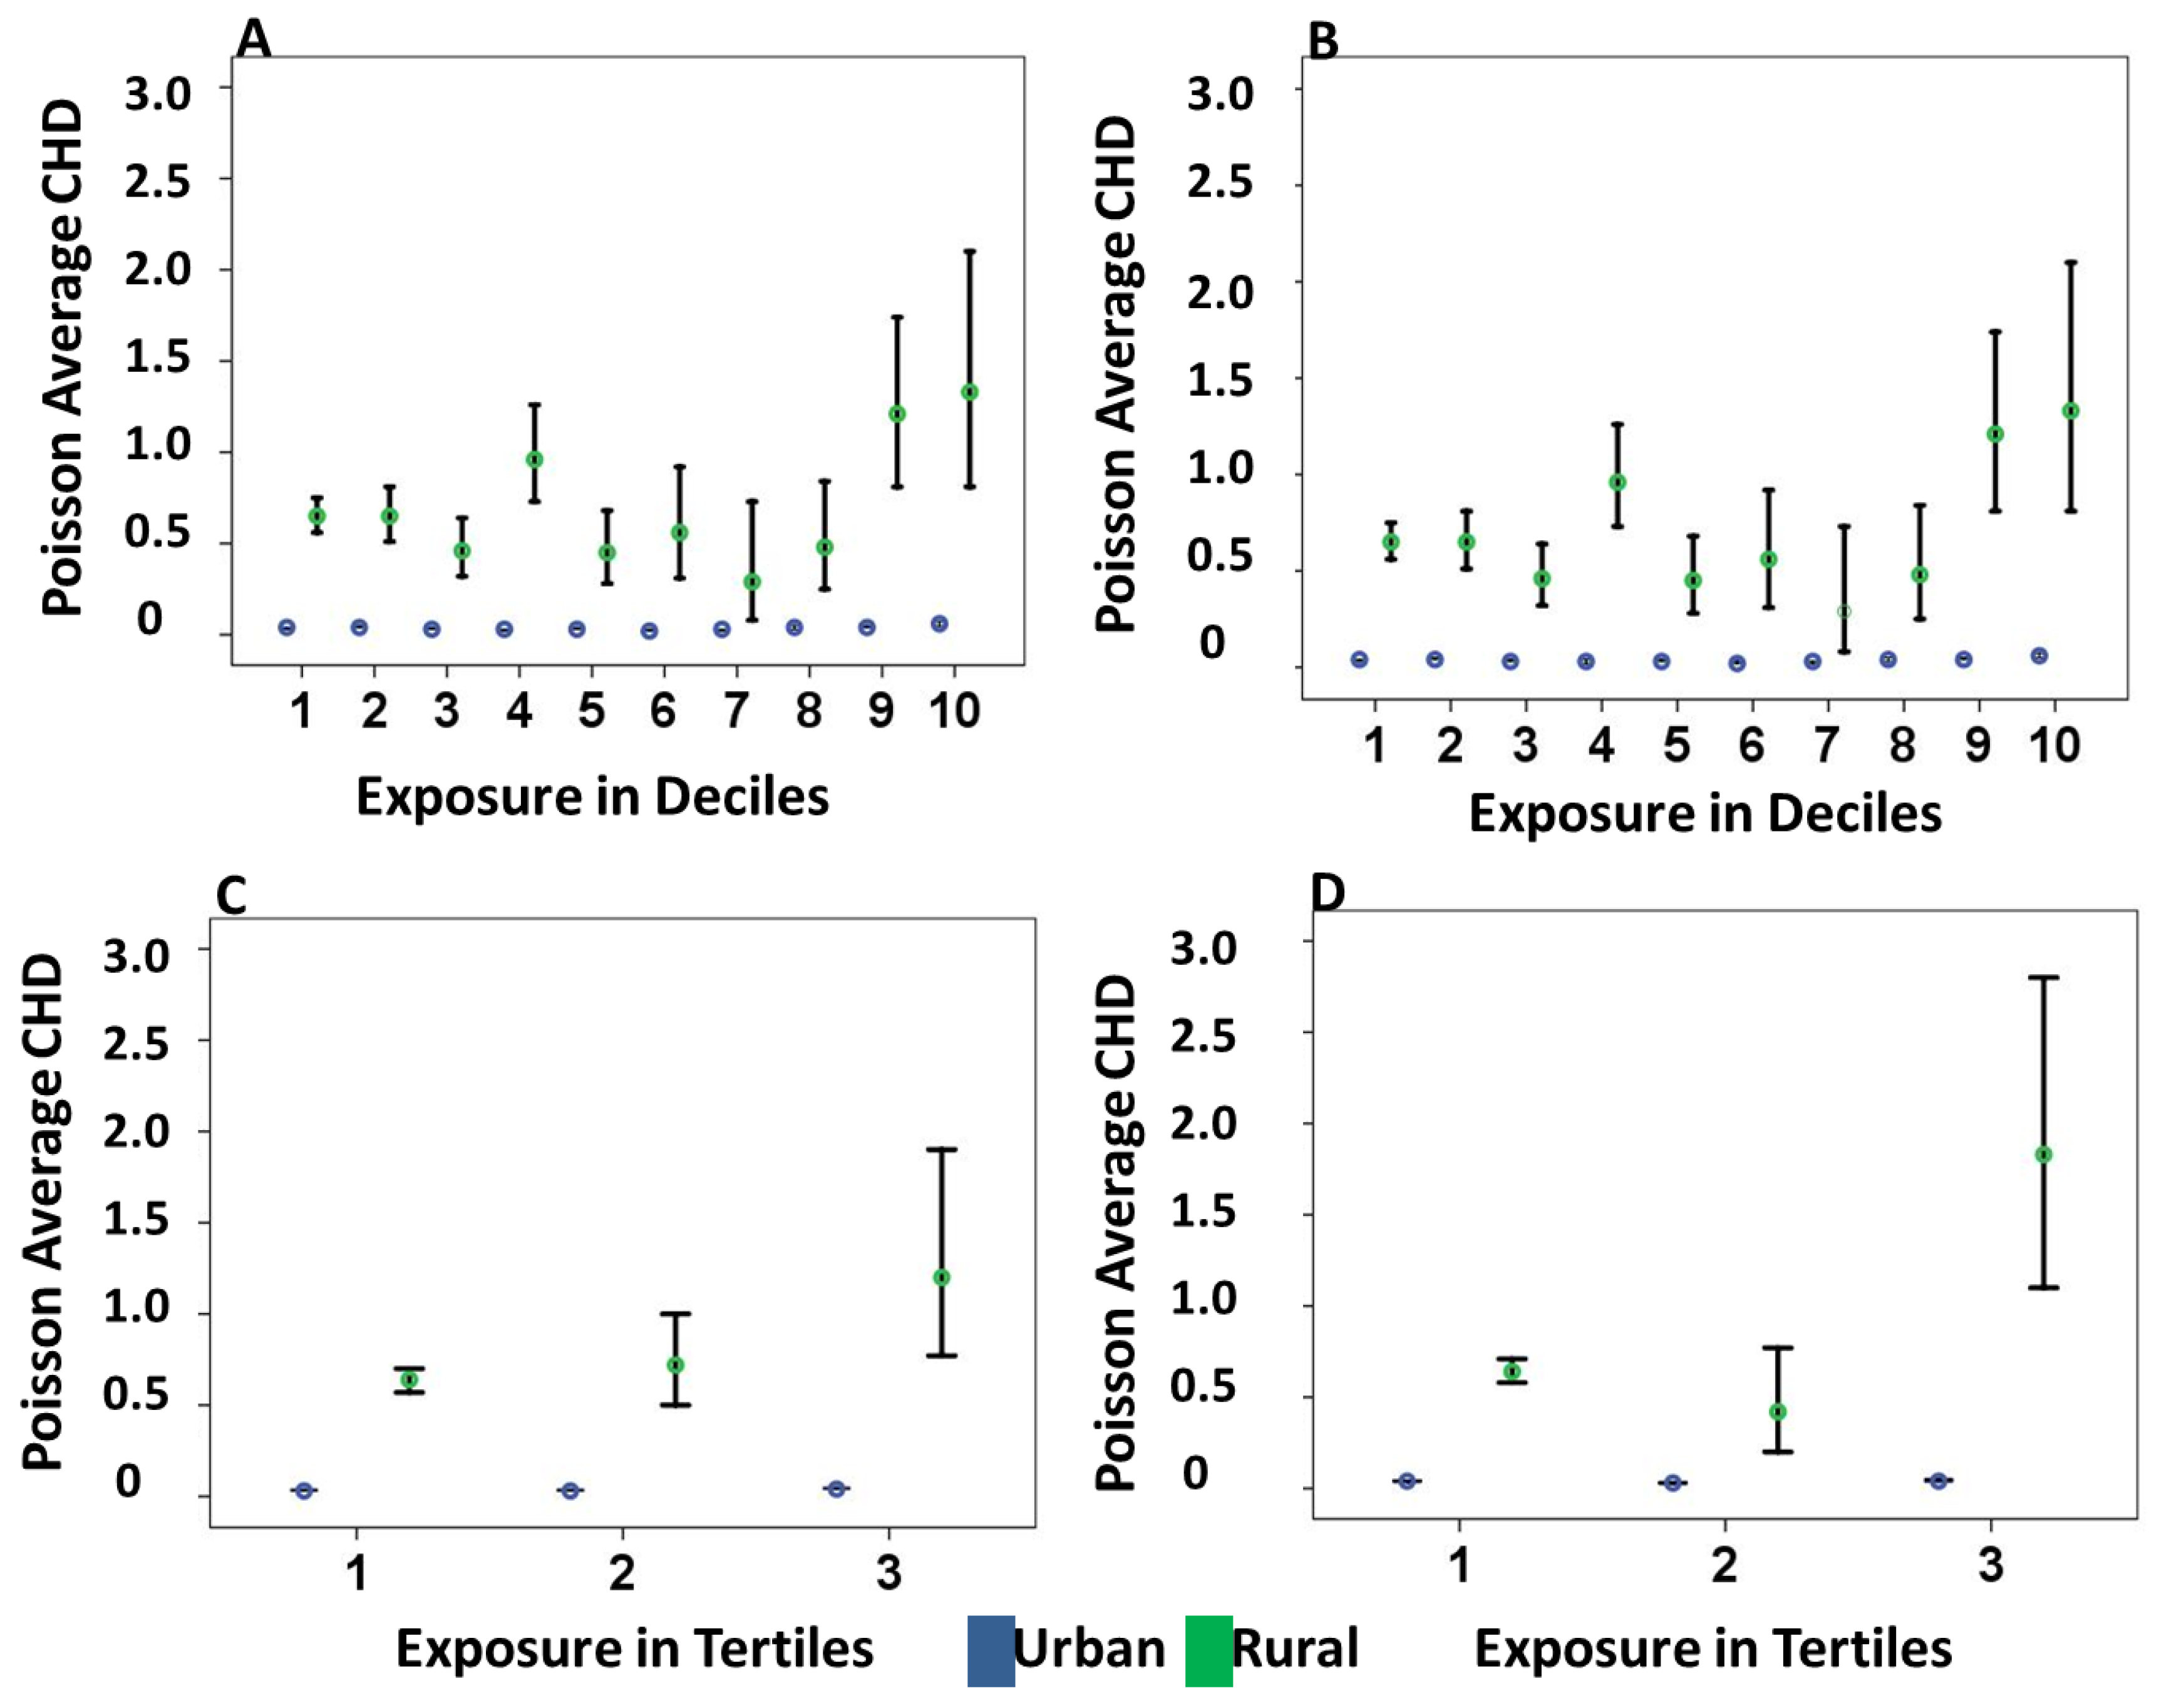
2.3. Distribution of CHD in Urban and Rural Alberta

There were a total of 2413 CHD cases that had an emitting facility within 10 km for the eight study years. The number of postal codes with CHD cases was higher in the urban (n = 1967, 82%) than in the rural regions (n = 446, 18%) (Table 2), consistent with the number of urban and rural postal codes and the distribution of the Alberta population (80% residing in urban and 20% in rural postal codes). Nevertheless, the Poisson mean CHD counts by postal code were higher in rural 0.66 (95% CI: 0.59, 0.72) compared to urban postal codes 0.04 (95% CI: 0.04, 0.04). CHD cases assigned to each one of the decile exposure categories (all and Group 1) and to the tertile categories (Groups 2 and 3) emissions are presented in Figure 2.

2.4. Adjusted Inverse Distance Weighted Exposure on CHD in Urban and Rural Postal Codes

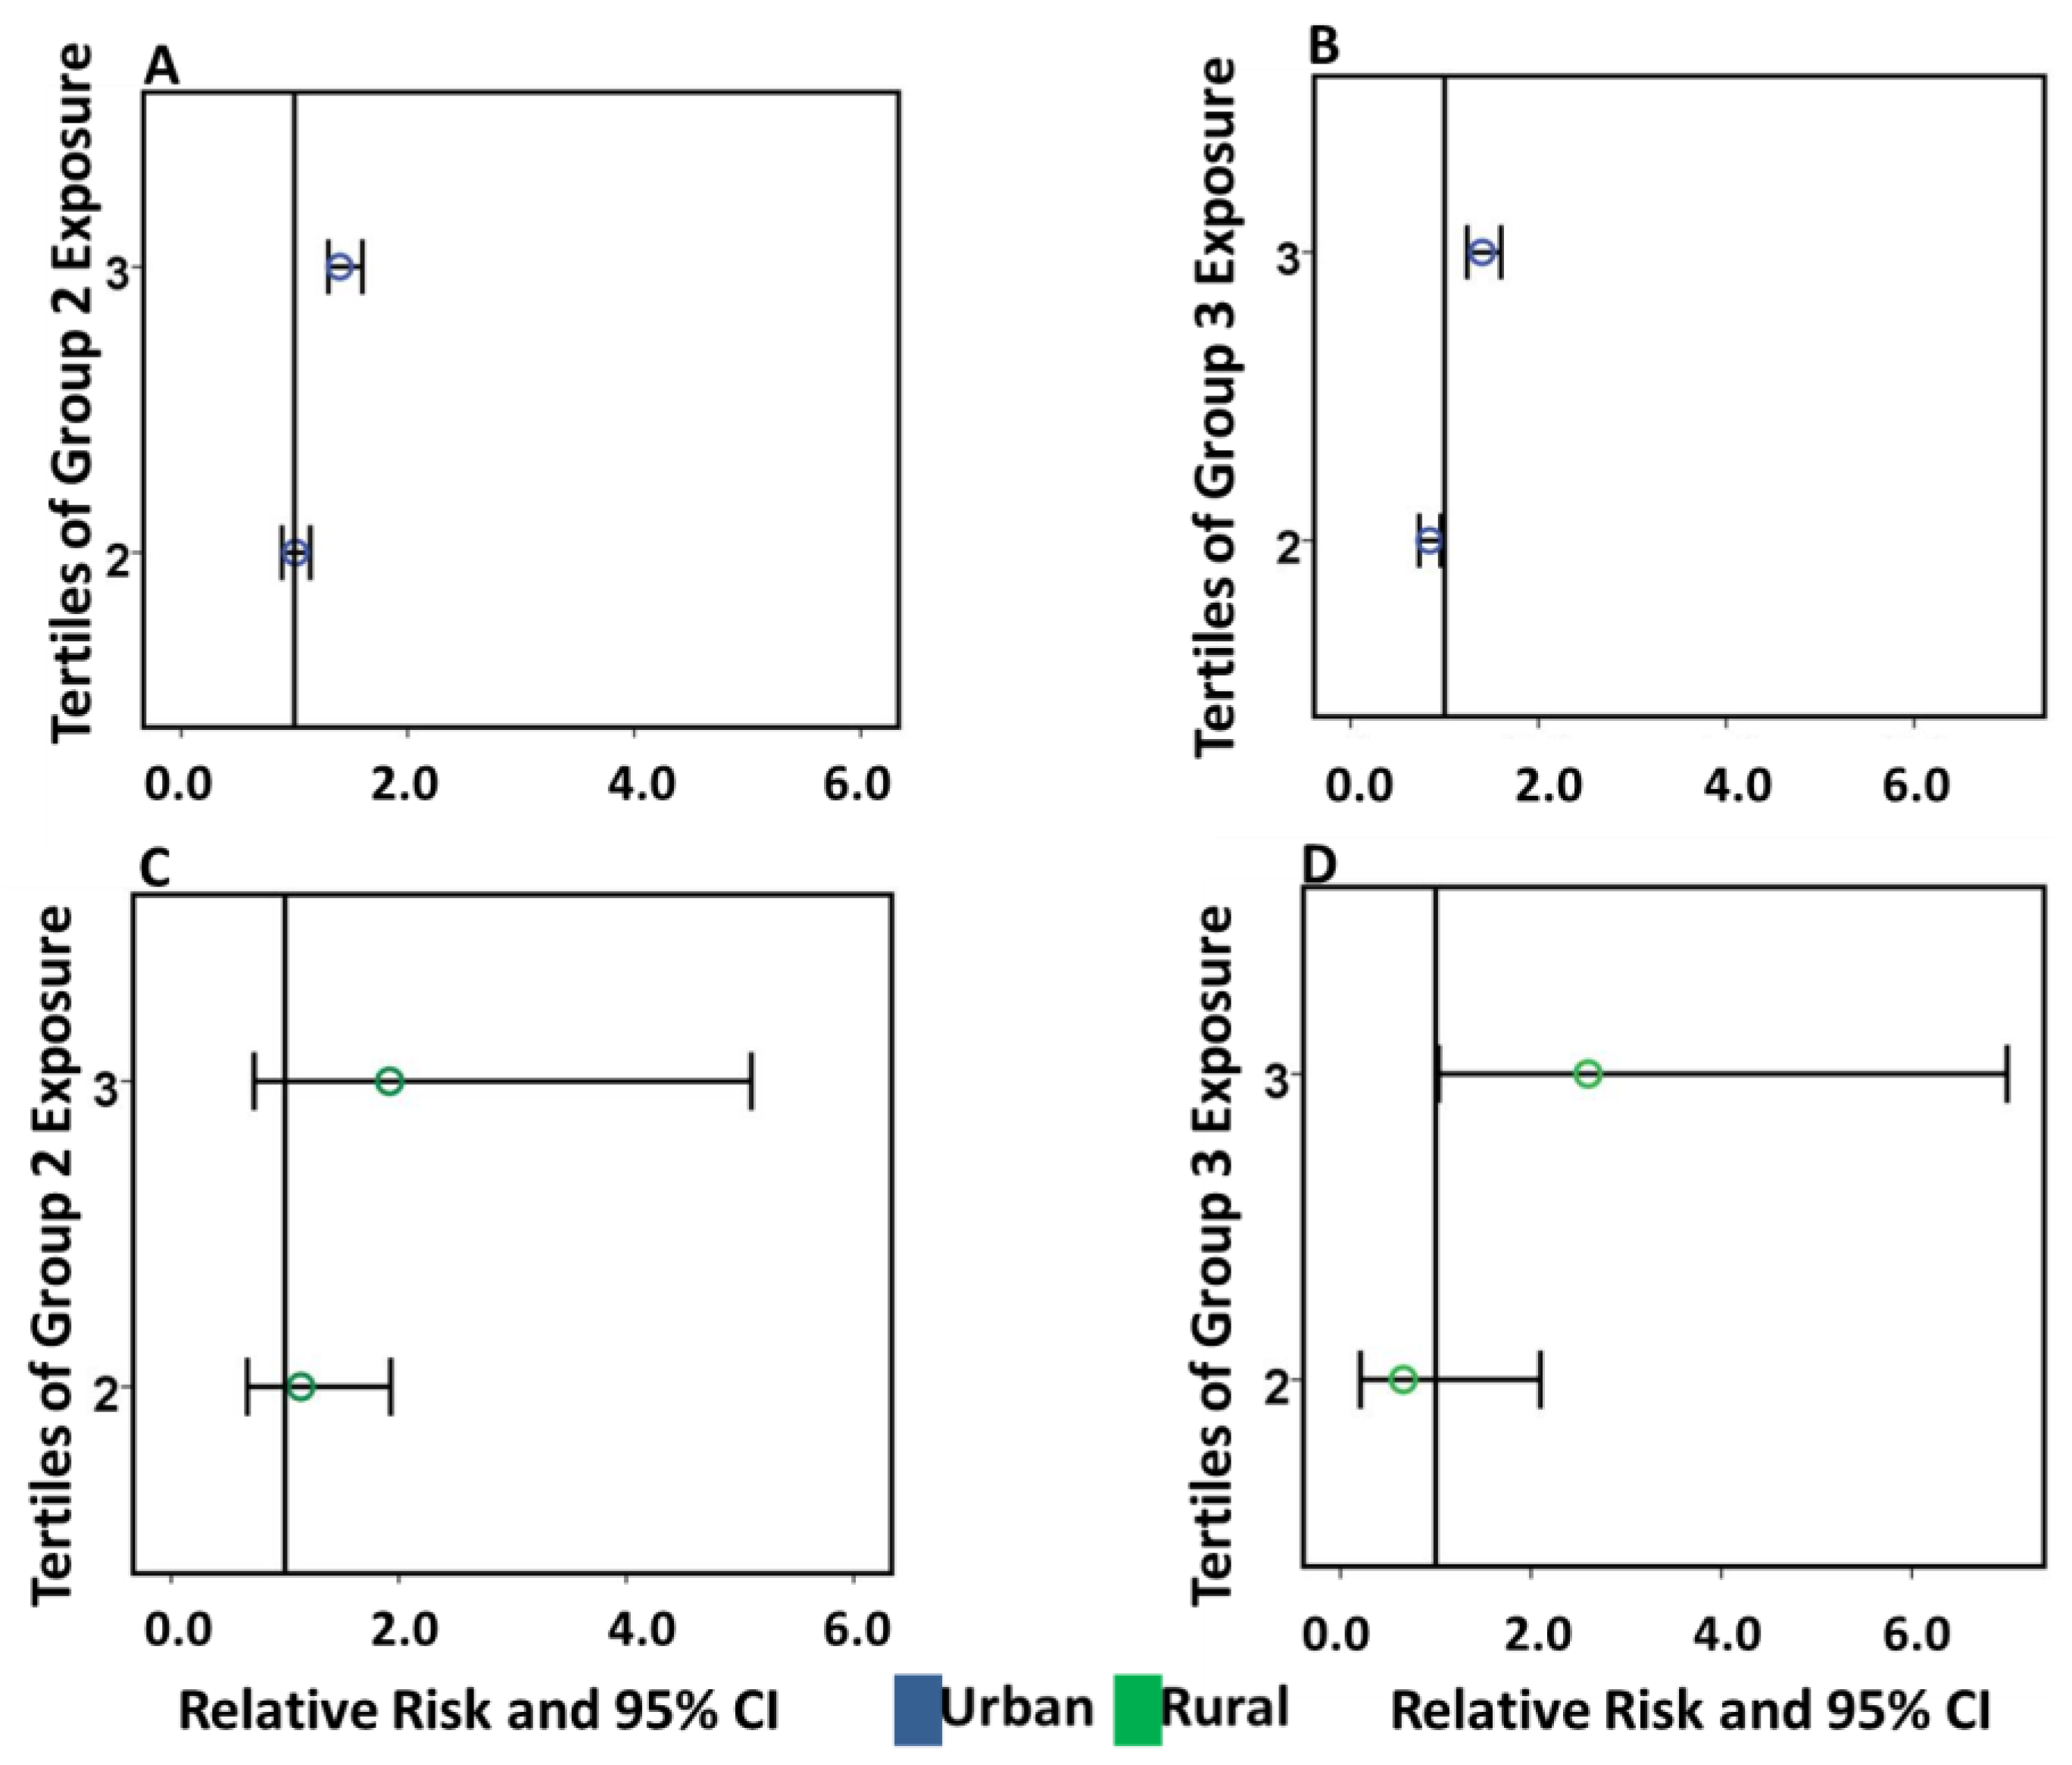
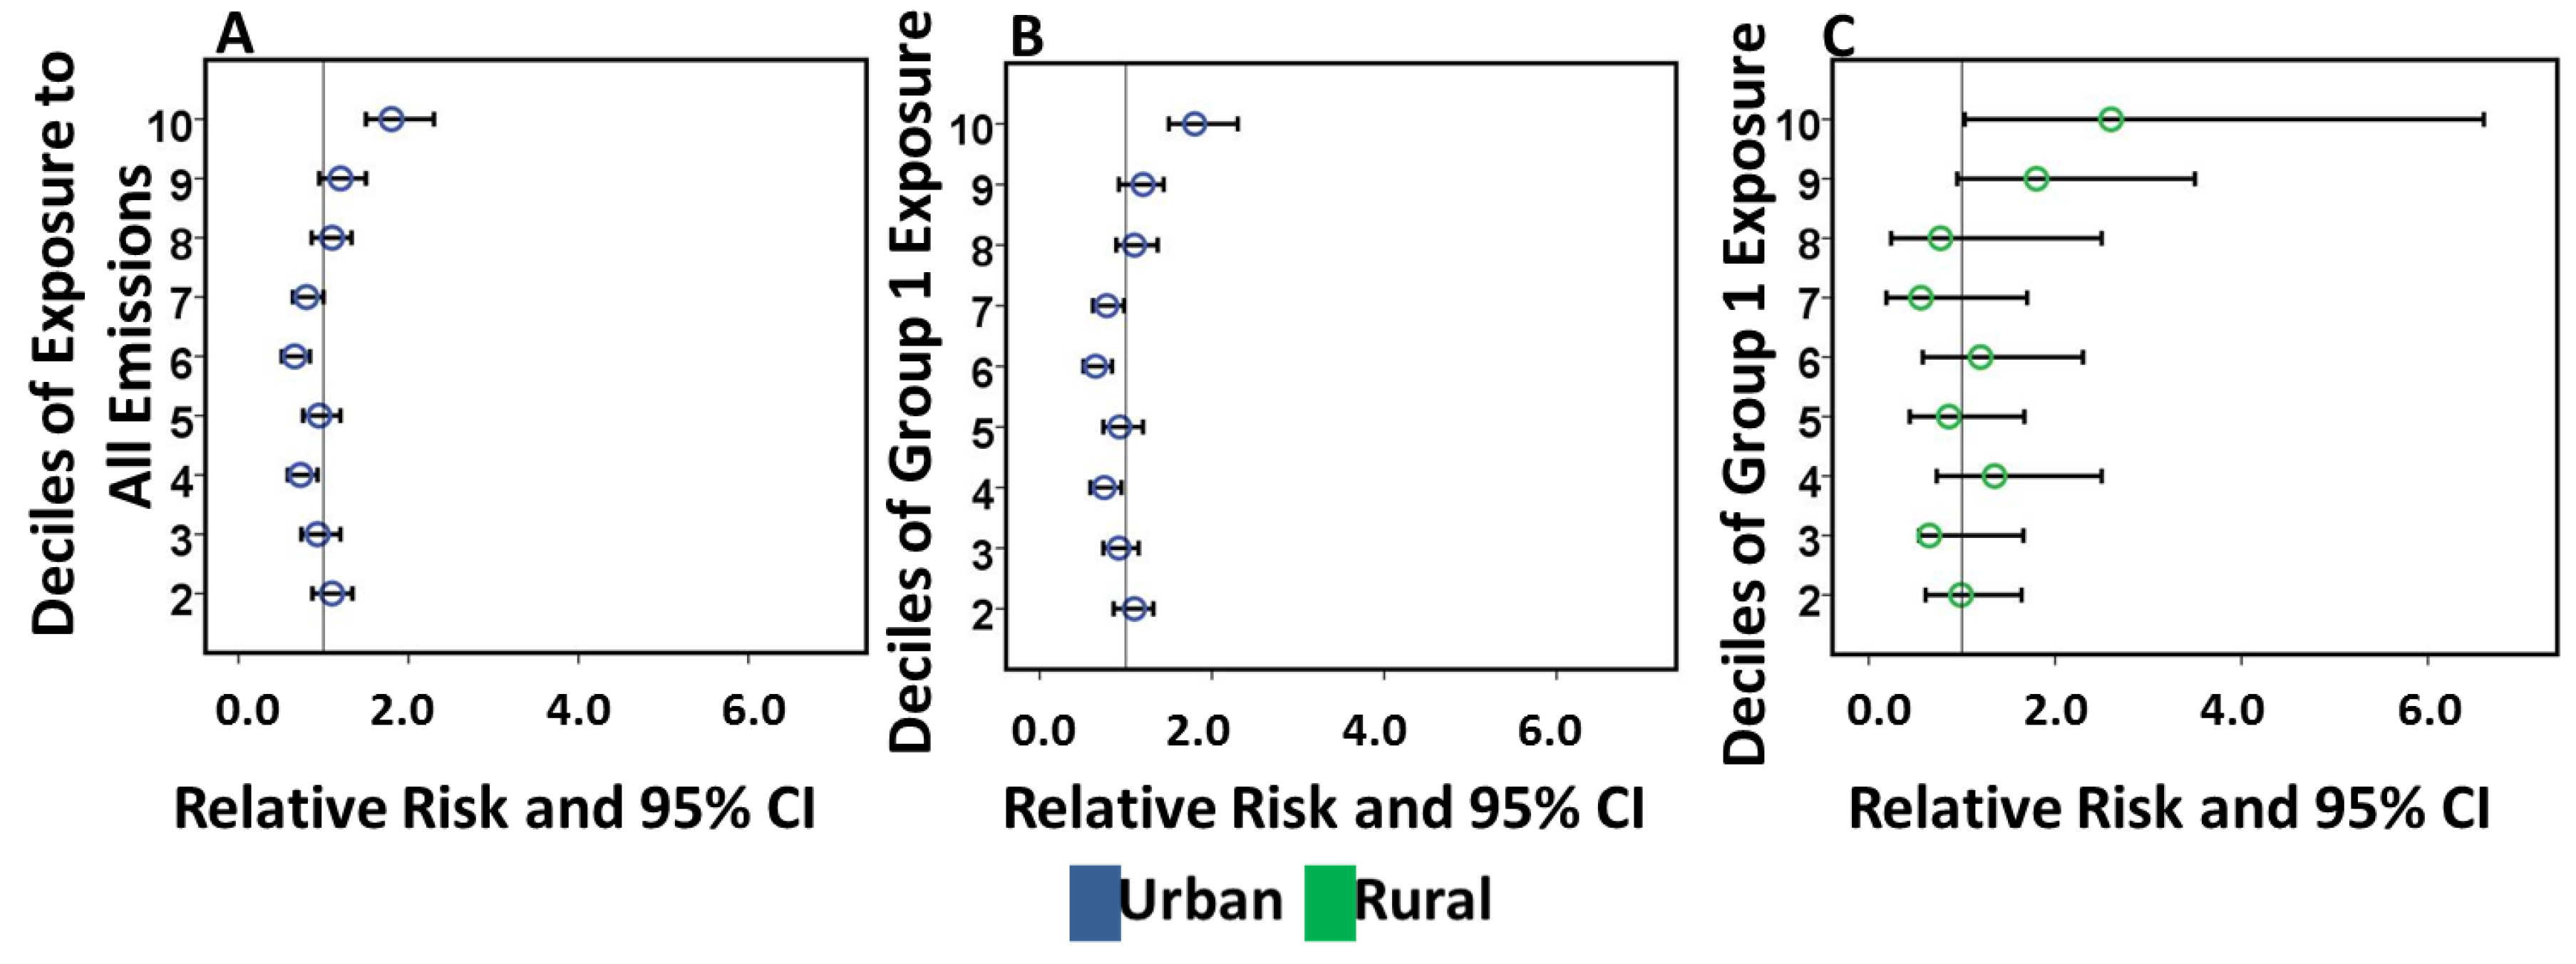
2.4.1. Urban Postal Codes

Adjusted values indicated an increased association with CHD in the highest decile of exposure to all and Group 1 emissions [RR = 1.8 (1.50, 2.3) for both] (Figure 3A,B). The postal codes with the highest exposures from all and Group 1 emissions equally accounted for 16% of all CHD urban cases, which were found in 10% of the urban postal codes (Supplementary Tables S1 and S2). In addition, there was a decreased association with CHD in the 4th and 6th decile of moderate exposure to all emissions [RR = 0.73 (0.58, 0.93), and RR = 0.66 (0.0.51, 0.84), respectively] (Figure 3A). Group 1 also showed decreased associations in the 4th, 6th, and 7th deciles [RR = 0.75 (0.59, 0.95), RR = 0.65 (0.51, 0.84) and RR = 0.78 (0.62, 0.98), respectively] (Figure 3B). Similar to all and to Group 1 emissions, Groups 2 and 3 also showed associations in the postal codes with the highest exposure [RR = 1.4 (1.3, 1.6) and RR = 1.4 (1.2, 1.6), respectively]. The postal codes in the highest tertile accounted for 40% of CHD cases and 34% of the postal codes (Supplementary Table S3). There was a decreased association with Group 3 in the 2nd tertile [RR = 0.84 (0.73, 0.96)] (Figure 4A,B).

2.4.2. Rural Postal Codes

Although there was no effect observed for all emissions combined and Group 2 emissions in rural postal codes, there was an increased association with CHD in the postal codes with the highest exposure to Group 1 emissions [relative risk (RR) = 2.6 (1.0, 6.6)] (Figure 3C). The postal codes with the highest exposure represented only 2% of rural postal codes and had 5% of all rural CHD cases (Supplementary Table S2). Postal codes exposed to Group 3 emissions also showed associations in the highest tertile [RR = 2.6 (1.0, 7)] (Figure 4D). The postal codes in this tertile included 2% of all rural postal codes and it contained 5% of all rural CHD cases (Supplementary Table S3).
The sensitivity analysis to explore the effects of changes in model specification did not show any difference with the results analyzed at 10 km. We retained the effects in urban postal codes for all emissions and the three groups of emissions when applying an eight or nine km radius. In the rural postal codes we gained effects for postal codes exposed to all the emissions and retained effects for Group 1 and 3 emissions. We attempted analysis at five km but only 35% of the CHD cases were within those areas and the models did not work because of the small sample size.

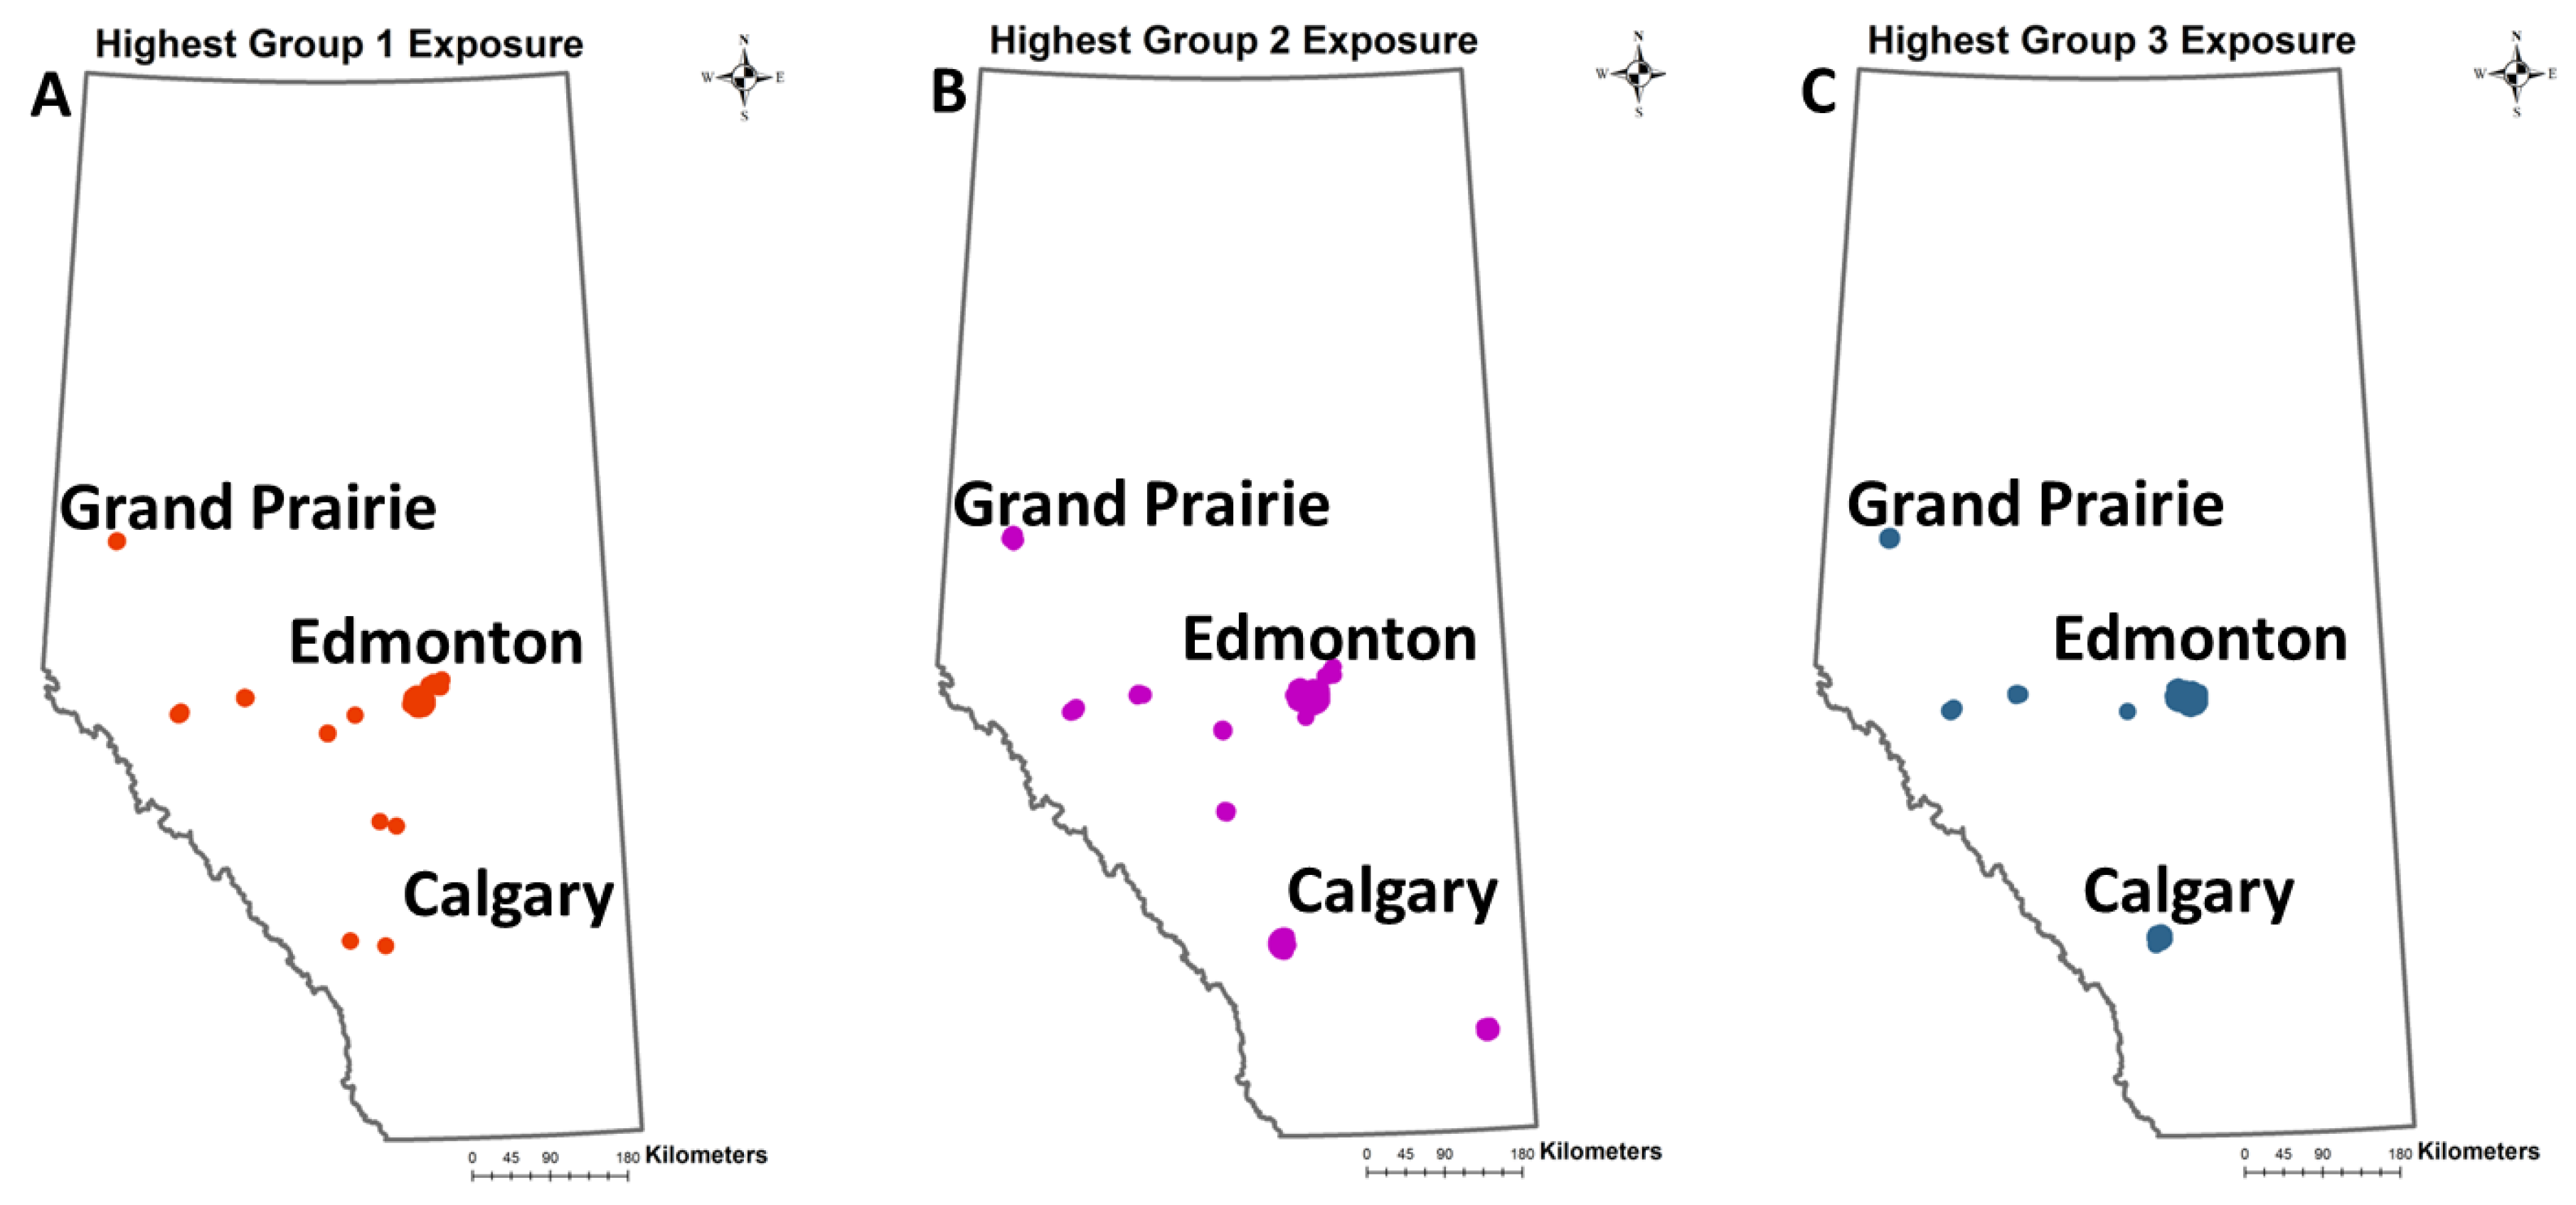
2.4.3. Geographic Distribution of Urban and Rural Postal Codes with the Highest Exposure to Emissions

In urban regions, there were a total of 5410 postal codes with the highest exposure to Group 1 emissions (Table 3) and (Figure 5A). However, all of the CHD cases in this category (n = 317) were located in only 293 (5%) of the postal codes (Table 3). For Group 2, the highest exposure tertile contained a total of 18,062 postal codes (Table 3) (Figure 5B), and only 730 (4%) contained all the CHD cases (n = 786) in this category (Table 3). For Group 3, the highest exposure tertile contained a total of 18,068 postal codes (Table 3) (Figure 5C), and only 741 (4%) contained all the CHD cases (n = 799) in this category (Table 3).
The postal codes for the individual three multipollutant groups showed similar distributions and were situated in the central, south, and western parts of Alberta, but mainly in the two largest cities of the province (Edmonton and Calgary).
In the rural regions, there were a total of 14 postal codes that had the highest exposure to Group 1 emissions (Table 3). Seven (50%) of the postal codes with the highest exposure had CHD cases (Table 3). Furthermore, there were a total of 12 postal codes in the highest exposure tertile to Group 3 emissions (Table 3) and six (50%) of the postal codes had CHD cases (Table 3).
The postal codes with the highest exposure to Groups 1 and 3 emissions were few and sparse. They were situated in the central and northern parts of Alberta. Because the rural postal codes had low numbers of cases, we cannot present a map displaying their location. Because of confidentiality concerns, the ethics approval for this work did not permit presentation of maps with postal codes having less than ten individuals.

3. Discussion

Our investigation found positive associations of CHD occurrence in the postal codes with the highest air emissions of multipollutant groups (identified by the principal component analysis) from industrial sources in the province. Specifically, we found associations with urban postal codes exposed to the highest levels of all emissions and the three multipollutant groups individually, whilst the rural postal codes had associations with highest exposures to Group 1 and 3 emissions. In addition, we found the associations to be stronger in rural compared to urban postal codes. We also observed a decreased association in urban postal codes with moderate exposure from all and Groups 1 and 3 emissions. Mapping the postal codes with the highest emissions revealed that very few postal codes were exposed to the highest levels of emissions.

3.1. Multipollutant Exposures and CHD

An advantage of our study is that we used a comprehensive list of chemicals emitted to the air (from the NPRI) that otherwise would not be available since not many chemicals are routinely monitored in the environment. Although our study did not examine the interactions of these chemicals in the atmosphere, the positive associations we observed were found in the context of independent groups of industrial emissions and not of chemicals acting individually. These new associations for groups of industrial emissions potentially support the notion of multipollutant human exposures and adverse health outcomes as a new paradigm that requires exploration by the research community [18].
To assess the association of emissions and CHD development, we modeled exposures of all air emissions released by industries in Alberta and a subset of three multipollutant groups we identified using Principal Component Analysis (PCA). This analysis only provides information about co-variating chemicals regardless of location, participation of multiple or single industrial facilities, or processes involved. PCA has been used in only one previously reported study to examine the role of groups of urban pollutants and CHD [15]. In that case-control study, three pollutant groups were identified: nitrogen dioxide and carbon monoxide; particulate matter and ozone; and sulphur dioxide alone. Although their results are not fully comparable to ours since they utilized urban monitored pollutants from various sources, they found positive associations which did not reach statistical significance with groups containing sulphur dioxide and carbon monoxide. This was consistent with our observations for Group 1 emissions which contained both gases. Interestingly and contrary to our study, the associations in their study were attenuated in the highest levels of exposure.
The combinations of pollutants we identified have not been previously reported to have an association with CHD and they were released by three main sectors (manufacturing, utilities, and mining) operating in urban and rural regions. However, other studies have explored the association between individual chemicals or categories of chemicals found among our multipollutant groups and CHD. For instance, an earlier study by Gilboa et al. examined the potential role of maternal occupational exposures to classes of organic solvents and CHD [19]. They had found positive associations of maternal exposure to any solvent or class of chlorinated solvents (e.g., trichloroethylene) with ventricular septal defects specifically. Of the single pollutant studies, only CO, SO2, and trichloroethylene have been associated with CHD [9,12,20]. Our study did not examine occupational exposures and we did not have the statistical power to examine subtypes of CHD; however, we identified heterogeneous groups and mixtures of toxicants which were associated with CHD in general. Group 1 emissions, which were more ubiquitous, consisted of volatile organic compound gases (VOCs) (1, 3 -butadiene, carbon disulfide, benzene, toluene) and other gases (SO2, CO) and these were emitted in large amounts compared to Group 2 and 3 emissions. Group 2 contained chlorinated solvents (chloroform, trichloroethylene), alcohol-based solvents (methanol, methyl-isobutyl-ketone), and a VOC (ethylene oxide) and Group 3 contained arsenic, cadmium, lead, mercury, and hexachlorobenzene. It is plausible that the positive associations we observed were driven by individual toxicants in the groups they cohabit, such as SO2 in Group 1; trichloroethylene in Group 2; and lead in Group 3. However, it is also possible that the combination of toxicants, given their covariation as defined by PCA, may have been equally or even more contributory.
In our study we found positive associations between heavy metals and CHD in both urban and rural postal codes. However, previous studies have shown inconsistent associations between heavy metals and CHD, reporting both negative and positive associations [14]. According to our PCA results, the participation of heavy metals in Group 1 and 2 was minimal based on the loading factors. Nevertheless, we do not know how they could interact with the other dominant chemicals in the groups they cohabit or whether they originate from the same industrial processes or are emitted by the same sources.
The proportion of the pollutant mixtures in terms of the dose and concentrations requires further exploration and determination in future studies. Overall, the urban postal codes showed positive associations with all three multipollutant groups in the highest levels of exposure whereas the associations in rural postal codes were only observed with highest levels of Groups 1 and 3 emissions. This observation suggests that the exposure from emissions is more in urban populations as this was also borne out by the positive associations with the overall sum of all the emissions. Interestingly, the size of the risk was higher in rural postal codes possibly related to higher concentrations of pollutants in the highest level of exposure in rural postal codes. The wide confidence interval including the large variance which was greater than the average of cases in rural postal codes is suggestive of clustering of CHD in some rural postal codes which require further geographic spatial analysis. Given our observations, we could suggest that the monitoring of emissions identified in this paper should initially focus on locations exposed to the highest levels of exposure in both urban and rural regions.

3.2. Negative Associations of Multipollutant Exposures and CHD in Urban Postal Codes

Urban postal codes presented us with both modest associations in the highest levels of exposure and smaller magnitude, but statistically significant, decreased associations in the moderately exposed postal codes, a phenomenon not observed in rural postal codes. These differences could potentially be due to other unmeasured variables such as wind dispersion, terrain, the effect of buildings and meteorological factors, and stack height that may protect some postal codes from the exposure of air pollutants in urban populations [21,22,23]. Our study assigned exposure to the maternal residential postal code by considering the influence of distance on the tonnes emitted by the surrounding industrial facilities. However, it has been shown that intra-urban differences in air pollutant dispersion do exist, and, as such, more sophisticated dispersion models should be undertaken to assign more accurate exposure estimates in environmental epidemiology studies [24,25,26].

3.3. Rural Higher Average of CHD by Postal Code

We found a consistently higher average of CHD in rural postal codes for all levels of exposure compared to urban postal codes. However, positive associations accounted only for those postal codes exposed to the highest emissions after adjusting for neighborhood socio-economic status (SES) and other predominantly traffic related confounders such as nitrogen dioxide (NO2) and particulate matter with a mean aerodynamic diameter ≤2.5 micrometers (PM2.5). Exposures to environmental hazards present in water or soil were not measured in our study. There are also unique genetic risks independent of or potentially contributing to the effect of emissions in the different ethnicities common in rural areas of Alberta (e.g., First Nations, Hutterite) that warrant further exploration.

3.4. Plausible Pathogenetic Mechanisms for Industrial Multipollutants and CHD

The groups of chemicals identified in the study present an opportunity for the discussion of potential pathogenic mechanisms that may require their interactions to culminate in abnormal cardiac morphogenesis. No previous experimental models have been used to examine the role of multipollutants in CHD. The cellular and molecular mechanisms responsible for cardiac dysmorphogenesis are known for some specific chemical/pollutant exposures. For instance, organic solvents including chlorinated solvents such as trichloroethylene, one of the pollutants in our study, have been shown to alter cardiac morphogenesis through oxidative stress-mediated dysregulation of developmental signals [19,27,28]. Genetic variations in the ability of the fetus or pregnant mother to eliminate some chemicals may explain abnormalities. Glutathione S-transferases (GSTs), for example, are enzymes essential for detoxification of many chemicals [8]. In a small number of human pregnancies exposed to organic solvents and resultant fetal pathology, Ronan et al. [29] found fetal genetic abnormalities in this enzyme to be associated with the occurrence of congenital anomalies which included CHD.
Epigenetic modifications of the DNA secondary to chemical exposures in children are now gaining attention. A literature review by Bitto et al. proposed that environmental toxicant exposures during the vulnerable period of fetal development and early childhood could be responsible for adverse health outcomes in children [30]. Interestingly, all of the heavy metals in Group 3 (cadmium, lead, mercury, arsenic) have been proposed to induce epigenetic alterations in children which could result in neurodevelopmental disorders such as autism, attention deficit disorders, and cancer or endocrine disorders [30]. Although there are currently no studies which have demonstrated epigenetic alterations due to chemical toxicant exposures in the context of CHD, including the reported chemicals in our study, preliminary investigations are emerging which document the relevance of epigenetic changes in synchrony with genetic transcription factors that play a crucial role in abnormal cardiac morphogenesis [31,32,33]. Further animal/translational investigations that explore the impact of exposure to pollutant mixtures on cardiac development are necessary to better define this relationship on a whole organ, cellular, and molecular level.

4. Materials and Methods

4.1. Study Population

We searched for all children with echocardiography confirmed CHD born in Alberta between January 2004 and August 2011 from the pediatric echocardiographic Xcelera (Philips, Markham, ON, Canada) regional databases. The databases covered every single case occurring in the province. Data for each case included only birth date and mothers’ residential postal code at time of diagnosis. We used the second digit of the first three characters of the Alberta postal code to identify cases in urban and rural areas as defined elsewhere [34]. Ethics approval was obtained from the participating institutions (Stollery and Alberta Children’s Hospitals). They included a clause indicating that privacy and confidentially regulation prevents displaying maps showing individual postal codes where a low number of cases exists.
Case ascertainment was performed by retrieving all echocardiographic and surgical reports to confirm a diagnosis of CHD. For patients with multiple echocardiographic examinations, the most consistent major umbrella diagnosis was accepted as the diagnosis, and when there was uncertainty regarding the primary embryological group, the echocardiogram was reviewed by a pediatric echocardiographer or the operative diagnosis was chosen. We considered all cases with structural heart abnormalities, including those with a patent ductus arteriosus present at >6 months and those with an atrial septal defect after one year or in whom surgical or device closure was necessary. We excluded patients with cardiomyopathies and no structural CHD, neonatal peripheral pulmonary stenosis, a patent ductus arteriosus at <6 months, an atrial septal defect at <1 year, and all cases born outside of the province.

4.2. Pollution Data

We accessed the NPRI to obtain annual reports of all chemicals released regardless of the processes involved, and the geographic coordinates of the emitting facilities in Alberta from 2003–2010. We then identified chemicals recognized as developmental toxicants but not known to have cardiac teratogenicity from the Proposition 65 list compiled by the Office of Environmental Health Hazard Assessment of the California Environmental Protection Agency [35] (referred for simplicity as industrial emissions/emissions/chemicals or pollutants throughout the manuscript). We found that overall, 99% of the emissions had been released to air, and therefore we focused on air emissions. In order to reduce the number of pollutant variables in the analyses and examine multipollutant groups, we applied principal components analysis (PCA) [36] to provincial amounts in tonnes. The correlation matrix of the PCA used standardized individual chemicals because of large variations in emitted amounts. To fulfill the required criteria that the number of observations should be greater than the number of variables [36], we selected the chemicals according to sectors using the North American Industrial Classification System at Level 2 [37]. We retained three rotated principal components which accounted for 74% of cumulative variability and 21% of variance for amounts released in tonnes. We selected chemicals with a correlation coefficient ≥│0.6│ to keep in the corresponding groups, which we named Group 1 to 3.

4.3. Exposure Assessment

As the study population consisted of CHD cases born between January 2004 and August 2011, we used the chemicals emitted to air in the year in which the first trimester occurred between 2003 and 2010, assuming that the cases were born at term. For the cases whose first trimester straddled two years, we assigned the case to the preceding year as the year of exposure. In order to obtain all the postal codes where a birth and a potential chemical exposure occurred, we accessed the Alberta Perinatal Health Program database [38]. We obtained partial data indicating the postal codes where at least one birth occurred, but not the number of births. We characterized the percentile distribution of the potentially exposed population, by assigning estimated chemical exposure to every postal code (see below) where at least one birth occurred during the study period. On the basis of postal code, we assigned the CHD cases to those categories of exposure for further analysis. We used the sum of the tonnes of chemicals emitted within 10 km of the postal code after weighting by the inverse distance from the emitting facilities (EF) to the centroid of the postal code of the maternal residence, as a proxy to account for higher or lower chemical exposures as a function of the proximity to emitting facilities. We first estimated the Euclidean distance from the population-weighted centroid of the postal codes obtained from Digital Mapping Technology Incorporated Spatial CanMap Postal Code Suite 2013 [39] to all the surrounding EF within a 10-km radius using ArcGIS 10.4, and calculated the inverse distance. Then, we multiplied the inverse distance by the tonnes emitted from each facility within the 10-km radius and summed the product for the postal codes for the eight-year study period (2003–2010). We used a 10-km radius because in our exploratory analysis we found that 90% of the CHD cases were within 10-km of an industrial emitting facility, and in our analysis, all the CHD cases were within 10 km. We analyzed the exposure to all chemicals emitted in the province and the identified multipollutant groups using percentile categories to define exposure gradients. Most of the postal codes (96% urban; 77% rural) were exposed to all and Group 1 chemicals allowing categorization in deciles. Since larger urban/rural differences were observed for Groups 2 and 3 (70% urban; 10% rural), we assigned these two groups of chemicals to tertile categories (most of the exposure was very small, approaching zero). The lowest exposure category was designated as the reference in the analysis.

4.4. Statistical Analysis

We examined overall counts of CHD in urban and rural postal codes and did not attempt to analyze according to subtypes of CHD as the sample sizes were small. We used descriptive statistics for the percentile distribution of the inverse distance weighed exposure at the postal code where births occurred and the corresponding counts of CHD cases per exposure category in urban and rural postal codes. Differences in exposure categories were measured using the non-parametric tests—Mann–Whitney U test (two groups) and Kruskal–Wallis (more than two groups)—because of non-normal distributions of the data. In addition to non-normal distributions, the fact that CHD is a rare disease and we only had CHD counts by postal code, we applied Poisson regression models for the urban postal codes. However, for the rural postal codes we used negative binomial regression models because the observed variance was greater than the mean of CHD cases by postal code, probably related to the small sample size. We reported adjusted associations of relative risk (RR) and (95% CI) between CHD occurrence and all emissions and the three multipollutant groups. Confounders included in the analysis were: (1) a previously developed socio-economic status (SES) index by Chan et al. [40] applied at the postal code level; and (2) land use regression models for nitrogen dioxide (NO2) and particulate matter with a mean aerodynamic diameter ≤2.5 micrometers (PM2.5) constructed by Hystad et al. [41] to estimate pollutant concentrations at the postal code level across Alberta. To assess whether our results were robust to changes in model specification with regards to exposure, we conducted sensitivity analyses including subsamples at distances <10 km. We used STATA 13 and IBM SPSS 24 for statistical analysis and ESRI ArcGIS 10.4 for mapping.

5. Strengths and Limitations

Because of the centralized pediatric cardiology services in Alberta, the strength of our study is that we used a database which captured all CHD cases born in Alberta with complete case ascertainment. Our study sheds light on a potential association between industrial air-emitted chemicals, Group 1 (benzene, carbon disulfide, toluene, 1, 3 butadiene, carbon monoxide, and sulphur dioxide); Group 2 (1, 3 butadiene, chloroform, ethylene oxide, methanol, methyl-isobutyl-ketone and trichloroethylene), and Group 3 (arsenic, cadmium, mercury, lead, and hexachlorobenzene) and CHD, but certain limitations must be recognized. Being an ecological study, the observations made at aggregate level cannot be inferred to individuals. Given our source of patient data, we were unable to account for other variables associated with CHD including genetic abnormalities, maternal health, and exposure to drugs, the exposure of folic acid supplementation, and meteorological data [42]. We may have underestimated the CHD counts because we did not include stillbirths and terminated pregnancies with fetal CHD; however, we had previously observed no increase in pregnancy terminations for CHD in the province during the study period and absolute termination rates are quite low in our province [43]. In addition, associations with specific subtypes of CHD were not examined because of the small number of cases.
We did not have data on gestational age at birth and yet some of our CHD cases could have been delivered prematurely, which could have resulted in exposure misclassification. The chemical exposure assigned to the postal code in tonnes is the sum of all distance weighted emissions from the neighboring facilities over a period of eight years. However, the actual dose that would potentially reach the human population requires precise pollutant measurements in addition to biomonitoring data.
Another limitation of the study is that because the emissions were reported annually in the NPRI, we were unable to assign the precise exposure to the critical window of cardiomorphogenesis. We did not have a maternal residential history at the time of conception and the first trimester of pregnancy. We obtained the postal code address given at the time of the initial echocardiogram and assumed it to be the same address as the first trimester of pregnancy which would be the period of cardiomorphogenesis. Previous studies have shown that a minority of women move during pregnancy [44,45], but we still acknowledge the existence of a potential exposure misclassification.
Another source of exposure misclassification is the fact that we had a measurement bias of the emissions because we used annual estimates reported in the NPRI and not monitored pollutants data. Our work represents an initial approach motivated by the fact that there is no existing comprehensive database of as many chemicals monitored in the environment as the ones reported in the NPRI.

6. Conclusions and Recommendations

We found regional variation in associations between the sum of all emissions and multipollutant groups in the postal codes with the highest exposure and CHD. The maps indicated that few postal codes were exposed to high emissions. The exposed urban postal codes concentrated in the main cities of the province and had positive associations with the sum of all the emissions and the three groups of the pollutants, whilst for the rural postal codes, the associations were detected for Group 1 and 3 pollutants only, perhaps as the number of postal codes exposed in these regions was extremely small. Furthermore, the other rural postal codes which had higher numbers of CHD cases not explained by chemicals require ongoing exploration of other potential contributors.
The findings from our study support the need to conduct more robust epidemiological studies which will include maternal risk factors and meteorological data to further validate these findings. We recommend that future studies should investigate the role of multiple pollutants in the evolution of CHD. The fact that we found associations only in the highest exposure categories in both urban and rural postal codes suggests the presence of a threshold of exposure to pollutants for CHD to develop not confounded by SES or other urban pollutants. This observation warrants future investigations to determine the threshold which would require the use of more precise data (e.g., monitored data) to identify the critical concentration of exposure in which CHD may occur.
Finally, we have shown potential associations between mixtures of industrial emissions and children’s heart maldevelopment. However, there is still a need to incorporate the findings from other species (e.g., [46,47]) to capture the complexity involved on the planetary health implications of environmental pollution.

Supplementary Materials

The following are available online at https://www.mdpi.com/2078-1547/9/2/26/s1. Figure S1. (A) Shows the proportion and trends of 18 chemicals in tonnes for urban and rural postal odes. The rural postal codes had the highest proportion of emissions released to air for the period 2003–2010. (B) Shows the distribution of the three groups of emissions derived from principal component analysis and the 3 main sectors (mining, manufacturing and utilities) which emitted the chemicals in urban and rural postal codes. Table S1. Regional Decile Distribution of the Sum of All Inverse Distance Weighted (IDW) Emissions and Congenital Heart Disease (CHD), Table S2. Regional Decile Distribution of Group1 Inverse Distance Weighted (IDW) Emissions and Congenital Heart Disease, Table S3. Regional Tertile Distribution of Group 2 and 3 Inverse Distance Weighted (IDW) Emissions and Congenital Heart Disease (CHD).

Author Contributions

Deliwe P. Ngwezi, contributed to the conceptualization, design, acquisition of data, analysis of the data and wrote the paper. Lisa K. Hornberger contributed to the conceptualization, design, acquisition of data, resources and reviewed the manuscript. Jesus Serrano-Lomelin contributed to the conceptualization, assisted with database management, statistical analysis and reviewed the manuscript. Charlene Nielsen assisted with the spatial analysis and reviewed the manuscript. Deborah Fruitman provided the data and reviewed the manuscript. Alvaro Osornio-Vargas contributed to the conceptualization, design, acquisition of data, resources and reviewed the manuscript.

Funding

All phases of this study were supported by the: Hamilton Naki Clinical Scholarship, funded by Netcare (South Africa); Women and Children’s Health Research Institute Innovation Grant and Studentship; Emerging Research Team Grant, Faculty of Medicine and Dentistry, University of Alberta-Alberta Health Services and a CIHR/NSERC Collaborative Health Research Grant (Funding Reference Number: 127789).

Acknowledgments

The authors thank the Alberta Health Services information technology specialist, Brad Saretsky, for assisting with the retrieval of the CHD study population.

Conflicts of Interest

The authors declare no conflict of interest.

Ethics Approval

Ethics approval was obtained from the two participating institutions’ boards: University of Alberta’s Health Research Ethics Board-Health Panel approved the study and assigned it a project number, Study ID: Pro00025428; University of Calgary’s Conjoint Health Research Ethics Board of the Faculties of Medicine, Nursing and Kinesiology, Ethics ID: E-24758.

Declarations

The air pollution dataset generated for the current study is publicly available from the Government of Canada’s National Pollutant Release Inventory, https://www.ec.gc.ca/inrp-npri/. Accessed 5 May 2018. The congenital heart disease dataset is not publicly available due to privacy and confidentiality clauses of the Government of Alberta’s Health Information Act Section 2.

Abbreviations

CHDCongenital Heart Disease
EFEmitting Facility
IDWInverse Distance Weight
NPRINational Pollutant Release Inventory
PCAPrincipal Component Analysis
RRRelative Risk
SESSocio-Economic Status

References

  1. Hoffman, J.I.; Kaplan, S. The incidence of congenital heart disease. J. Am. Coll. Cardiol. 2002, 39, 1890–1900. [Google Scholar] [CrossRef]
  2. Van der Linde, D.; Konings, E.E.; Slager, M.A.; Witsenburg, M.; Helbing, W.A.; Takkenberg, J.J.; Roos-Hesselink, J.W. Birth Prevalence of Congenital Heart Disease Worldwide. J. Am. Coll. Cardiol. 2011, 58, 2241–2247. [Google Scholar] [CrossRef] [PubMed] [Green Version]
  3. Khairy, P.; Ionescu-Ittu, R.; Mackie, A.S.; Abrahamowicz, M.; Pilote, L.; Marelli, A.J. Changing mortality in congenital heart disease. J. Am. Coll. Cardiol. 2010, 56, 1149–1157. [Google Scholar] [CrossRef] [PubMed]
  4. Gorini, F.; Chiappa, E.; Gargani, L.; Picano, E. Potential effects of environmental chemical contamination in congenital heart disease. Pediatr. Cardiol. 2014, 35, 559–568. [Google Scholar] [CrossRef] [PubMed]
  5. Liu, S.; Joseph, K.S.; Lisonkova, S.; Rouleau, J.; Van den Hof, M.; Sauve, R.; Kramer, M.S.; Canadian Perinatal Surveillance System (Public Health Agency of Canada). Association between maternal chronic conditions and congenital heart defects: A population-based cohort study. Circulation 2013, 128, 583–589. [Google Scholar] [CrossRef] [PubMed]
  6. Bishop, J.B.; Witt, K.L. Genetic toxicities of human teratogens. Mutat. Res. 1997, 396, 9–43. [Google Scholar] [CrossRef] [Green Version]
  7. Zhu, H.; Kartiko, S.; Finnell, R.H. Importance of gene-environment interactions in the etiology of selected birth defects. Clin. Genet. 2009, 75, 409–423. [Google Scholar] [CrossRef] [PubMed]
  8. Vecoli, C.; Pulignani, S.; Andreassi, M.G. Genetic and Epigenetic Mechanisms Linking Air Pollution and Congenital Heart Disease. J. Cardiovasc. Dev. Dis. 2016, 3, 32. [Google Scholar] [CrossRef] [PubMed]
  9. Vrijheid, M.; Martinez, D.; Manzanares, S.; Dadvand, P.; Schembari, A.; Rankin, J.; Nieuwenhuijsen, M. Ambient air pollution and risk of congenital anomalies: A Systematic Review and Meta-Analysis. Environ. Health Perspect. 2011, 119, 598–606. [Google Scholar] [CrossRef] [PubMed]
  10. Chen, E.K.; Zmirou-Navier, D.; Padilla, C.; Deguen, S. Effects of Air Pollution on the Risk of Congenital Anomalies: A Systematic Review and Meta-Analysis. Int. J. Environ. Res. Public Health 2014, 11, 7642–7668. [Google Scholar] [CrossRef] [PubMed] [Green Version]
  11. McKenzie, L.M.; Guo, R.; Witter, R.Z.; Savitz, D.A.; Newman, L.S.; Adgate, J.L. Birth outcomes and maternal residential proximity to natural gas development in rural Colorado. Environ. Health Perspect. 2014, 122, 412–417. [Google Scholar] [CrossRef] [PubMed]
  12. Langlois, P.H.; Brender, J.D.; Suarez, L.; Zhan, F.B.; Mistry, J.H.; Scheuerle, A.; Moody, K. Maternal residential proximity to waste sites and industrial facilities and conotruncal heart defects in offspring. Paediatr. Perinat. Epidemiol. 2009, 23, 321–331. [Google Scholar] [CrossRef] [PubMed]
  13. Yauck, J.S.; Malloy, M.E.; Blair, K.; Simpson, P.M.; McCarver, D.G. Proximity of residence to trichloroethylene-emitting sites and increased risk of offspring congenital heart defects among older women. Birth Defects Res. (Part A) Clin. Mol. Teratol. 2004, 70, 808–814. [Google Scholar] [CrossRef] [PubMed]
  14. Wigle, D.T.; Arbuckle, T.E.; Turner, M.C.; Bérubé, A.; Yang, Q.; Liu, S.; Krewski, D. Epidemiologic evidence of relationships between reproductive and child health outcomes and environmental chemical contaminants. J. Toxicol. Environ. Health Part B 2008, 11, 373–517. [Google Scholar] [CrossRef] [PubMed]
  15. Stingone, J.A.; Luben, T.J.; Daniels, J.L.; Fuentes, M.; Richardson, D.B.; Aylsworth, A.S.; Herring, A.H.; Anderka, M.; Botto, L.; Correa, A.; et al. Maternal Exposure to Criteria Air Pollutants and Congenital Heart Defects in Offspring: Results from the National Birth Defects Prevention Study. Environ. Health Perspect. 2014, 122, 863–872. [Google Scholar] [CrossRef] [PubMed] [Green Version]
  16. Beck, E.M.; Smits, J.E.G.; St Clair, C.C. Evidence of low toxicity of oil sands process affected water to birds invites re-evaluation of avian protection strategies. Conserv. Physiol. 2015, 3, cov038. [Google Scholar] [CrossRef] [PubMed]
  17. Canada Public Health Agency. Congenital Anomalies in Canada: A Perinatal Health Surveillance Report; Canada Public Health Agency: Ottawa, ON, Canada, 2013.
  18. Mauderly, J.L.; Burnett, R.T.; Castillejos, M.; Ozkaynak, H.; Samet, J.M.; Stieb, D.M.; Vedal, S.; Wyzga, R.E. Is the air pollution health research community prepared to support a multipollutant air quality management framework? Inhal. Toxicol. 2010, 22, 1–19. [Google Scholar] [CrossRef] [PubMed]
  19. Gilboa, S.M.; Desrosiers, T.A.; Lawson, C.; Lupo, P.J.; Riehle-Colarusso, T.J.; Stewart, P.A.; van Wijngaarden, E.; Waters, M.A.; Correa, A.; National Birth Defects Prevention Study. Association between maternal occupational exposure to organic solvents and congenital heart defects, National Birth Defects Prevention Study, 1997–2002. Occup. Environ. Med. 2012, 69, 628–635. [Google Scholar] [CrossRef] [PubMed] [Green Version]
  20. Gianicolo, E.A.; Mangia, C.; Cervino, M.; Bruni, A.; Andreassi, M.G.; Latini, G. Congenital anomalies among live births in a high environmental risk area—A case-control study in Brindisi (southern Italy). Environ. Res. 2014, 128, 9–14. [Google Scholar] [CrossRef] [PubMed]
  21. Carpenter, S.B.; Montgomery, T.L.; Leavitt, J.M.; Colbaugh, W.C.; Thomas, F.W. Principal Plume Dispersion Models: TVA Power Plants. J. Air Pollut. Control Assoc. 1971, 21, 491–495. [Google Scholar] [CrossRef] [Green Version]
  22. Thomas, F.W.; Carpenter, S.B.; Gartrell, F.E. Stacks-How High? J. Air Pollut. Control Assoc. 1963, 13, 198–204. [Google Scholar] [CrossRef] [PubMed]
  23. Macdonald, R. Theory and Objectives of Air Dispersion Modelling. Available online: http://www.hazmatoklahoma.com/documents/Theory_and_Objectives_of_Air_Dispersion_Modelling.pdf (accessed on 28 June 2018).
  24. Lateb, M.; Meroney, R.N.; Yataghene, M.; Fellouah, H.; Saleh, F.; Boufadel, M.C. On the use of numerical modelling for near-field pollutant dispersion in urban environments—A review. Environ. Pollut. 2016, 208, 271–283. [Google Scholar] [CrossRef] [PubMed]
  25. Korek, M.; Johansson, C.; Svensson, N.; Lind, T.; Beelen, R.; Hoek, G.; Pershagen, G.; Bellander, T. Can dispersion modeling of air pollution be improved by land-use regression? An example from Stockholm, Sweden. J. Expo. Sci. Environ. Epidemiol. 2017, 27, 575–581. [Google Scholar] [CrossRef] [PubMed]
  26. Cui, P.-Y.; Li, Z.; Tao, W.-Q. Buoyancy flows and pollutant dispersion through different scale urban areas: CFD simulations and wind-tunnel measurements. Build. Environ. 2016, 104, 76–91. [Google Scholar] [CrossRef]
  27. Hansen, J.M. Oxidative stress as a mechanism of teratogenesis. Birth Defects Res. (Part C) Embryo Today 2006, 78, 293–307. [Google Scholar] [CrossRef] [PubMed]
  28. Brender, J.D.; Shinde, M.U.; Zhan, F.B.; Gong, X.; Langlois, P.H. Maternal residential proximity to chlorinated solvent emissions and birth defects in offspring: A case-control study. Environ. Health 2014, 13, 96. [Google Scholar] [CrossRef] [PubMed]
  29. Ronan, G.; Chevrier, C.; Cordier, S.; Celebi, C.; Cordier, S. Combined effect of prenatal solvent exposure and GSTT1 or GSTM1 polymorphisms in the risk of birth defects. Birth Defects Res. (Part A) Clin. Mol. Teratol. 2012, 94, 481–485. [Google Scholar]
  30. Bitto, A.; Pizzino, G.; Irrera, N.; Galfo, F.; Squadrito, F. Epigenetic Modifications Due to Heavy Metals Exposure in Children Living in Polluted Areas. Curr. Genom. 2014, 15, 464–468. [Google Scholar] [CrossRef] [PubMed]
  31. Serra-Juhé, C.; Cuscó, I.; Homs, A.; Flores, R.; Torán, N.; Pérez-Jurado, L.A. DNA methylation abnormalities in congenital heart disease. Epigenetics 2015, 10, 167–177. [Google Scholar] [CrossRef] [PubMed] [Green Version]
  32. Rosenquist, T.H. Folate, homocysteine and the cardiac neural crest. Dev. Dyn. 2013, 242, 201–218. [Google Scholar] [CrossRef] [PubMed]
  33. Chowdhury, S.; Erickson, S.W.; MacLeod, S.L.; Cleves, M.A.; Hu, P.; Karim, M.A.; Hobbs, C.A. Maternal Genome-Wide DNA Methylation Patterns and Congenital Heart Defects. PLoS ONE 2011, 6, e16506. [Google Scholar] [CrossRef] [PubMed]
  34. Anatomy of Canadian Postal Codes. Available online: http://aix1.uottawa.ca/~rroberge/postal%20codes.htm (accessed on 5 February 2018).
  35. Office of Environmental Health Hazard Assessment Proposition 65 California: State of California Environmental Protection Agency. 2014. Available online: http://www.oehha.org/prop65/prop65_list/Newlist.html (accessed on 5 February 2018).
  36. Legendre, P.; Legendre, L. Ordination in reduced space. In Numerical Ecology, 3rd ed.; Legendre, P., Legendre, L., Eds.; Elsevier: New York, NY, USA, 2012; pp. 425–520. [Google Scholar]
  37. Statistics Canada North American Industrial Classification System. Available online: http://www.statcan.gc.ca/subjects-sujets/standard-norme/naics-scian/2012/introduction-eng.htm (accessed on 5 February 2018).
  38. Alberta Health Services. Alberta Perinatal Health Program. Available online: http://aphp.dapasoft.com/Lists/HTMLPages/aboutUs.aspx (accessed on 5 February 2018).
  39. DMTI Spatial CanMap. 2013. Available online: https://www.dmtispatial.com/canmap/ (accessed on 5 February 2018).
  40. Chan, E.; Serrano, J.; Chen, L.; Stieb, D.M.; Jerrett, M.; Osornio-Vargas, A. Development of a Canadian socioeconomic status index for the study of health outcomes related to environmental pollution. BMC Public Health 2015, 15, 714. [Google Scholar] [CrossRef] [PubMed]
  41. Hystad, P.; Setton, E.; Cervantes, A.; Poplawski, K.; Deschenes, S.; Brauer, M.; van Donkelaar, A.; Lamsal, L.; Martin, R.; Jerrett, M.; et al. Creating National Air Pollution Models for Population Exposure Assessment in Canada. Environ. Health Perspect. 2011, 119, 1123–1129. [Google Scholar] [CrossRef] [PubMed] [Green Version]
  42. Colapinto, C.K.; O’Connor, D.L.; Tremblay, M.S. Folate status of the population in the Canadian Health Measures Survey. CMAJ 2011, 182, E100–E106. [Google Scholar] [CrossRef] [PubMed]
  43. Trines, J.; Fruitman, D.; Zuo, K.J.; Smallhorn, J.F.; Hornberger, L.K.; Mackie, A.S. Effectiveness of Prenatal Screening for Congenital Heart Disease: Assessment in a Jurisdiction with Universal Access to Health Care. Can. J. Cardiol. 2013, 29, 879–885. [Google Scholar] [CrossRef] [PubMed]
  44. Miller, A.; Siffel, C.; Correa, A. Residential mobility during pregnancy: Patterns and correlates. MCH 2010, 14, 625–634. [Google Scholar] [CrossRef] [PubMed]
  45. Canfield, M.A.; Ramadhani, T.A.; Langlois, P.H.; Waller, D.K. Residential mobility patterns and exposure misclassification in epidemiologic studies of birth defects. J. Expo. Sci. Environ. Epidemiol. 2006, 16, 538–543. [Google Scholar] [CrossRef] [PubMed] [Green Version]
  46. Incardona, J.P.; Carls, M.G.; Holland, L.; Linbo, T.L.; Baldwin, D.H.; Myers, M.S.; Peck, K.A.; Tagal, M.; Rice, S.D.; Scholz, N.L. Very low embryonic crude oil exposures cause lasting cardiac defects in salmon and herring. Sci. Rep. 2015, 5, 13499. [Google Scholar] [CrossRef] [PubMed] [Green Version]
  47. DeWitt, J.C.; Millsap, D.S.; Yeager, R.L.; Heise, S.S.; Sparks, D.W.; Henshel, D.S. External heart deformities in passerine birds exposed to environmental mixtures of polychlorinated biphenyls during development. Environ. Toxicol. Chem. 2006, 25, 541–551. [Google Scholar] [CrossRef] [PubMed]
Figure 1. Distribution of inverse distance weighted (IDW) exposure in urban and rural Alberta. (A) Total sum of exposure from all emissions showed significantly higher medians in urban 1st and 3rd deciles and higher median in rural 10th decile. (B) Group 1 showed significantly higher median differences in urban 1st and 8th deciles and rural 10th decile. (C) Tertiles of Group 2 emissions with significantly higher median in urban 1st and 2nd tertiles and rural 3rd tertile. (D) Tertiles of Group 3 emissions with significantly higher median in urban 1st tertile (Mann Whitney U test, * p < 0.05).
Challenges 09 00026 g001
Figure 2. Distribution of the Poisson average of congenital heart defect (CHD) cases and 95% confidence intervals (CI) in urban and rural postal codes exposed to the percentile categories of inverse distance weighted (IDW) emissions. Rural postal codes had a larger average and variability of CHD cases per postal code in all the deciles for the sum of all emissions (A) and Group 1 emissions (B). The overall distributions in both Figure 2A,B were similar, and in urban postal codes, the average and variability were constant. For Group 2 (C) and Group 3 emissions (D), the average and variability of CHD cases by postal code was high in rural compared to urban postal codes, with the highest average in the 3rd tertile where the exposure was the highest.
Challenges 09 00026 g002
Figure 3. Adjusted relative risk of postal codes exposed to the sum of all and Group 1 only emissions in urban and rural regions. (A) Shows a significant increased risk ratio in the 10th decile with the highest exposure and inverse associations in the 4th and 6th deciles with modest exposure in urban postal codes. (B) Shows an increased risk ratio in the 10th decile with the highest exposure and inverse associations in the 4th, 6th and 7th deciles with modest exposure in urban postal codes. (C) Shows a significantly increased risk ratio in the 10th decile with the highest exposure in rural postal codes.
Challenges 09 00026 g003
Figure 4. Adjusted relative risk of postal codes exposed to Group 2 and 3 emissions on CHD in urban and rural regions. (A,B) show increased risk ratio in the 3rd tertile with the highest exposure to Group 2 and 3 in urban postal codes. Group 3 also showed a significant inverse association in the 2nd tertile of exposure. (C) Shows the rural postal codes exposed to Group 2 emissions with no effect which may have been related to the small sample size. (D) Shows increased risk ratio (RR) of exposure to Group 3 in the 3rd tertile in rural postal codes.
Challenges 09 00026 g004
Figure 5. Geographic location of urban postal codes with the highest exposure to emissions. (A) Displays postal codes exposed to Group 1 emissions (5410). (B) Displays postal codes exposed to Group 2 emissions (18,062). (C) Displays postal codes exposed to Group 3 emissions (18,068). Similar patterns are observed for the three groups and most the exposed postal codes are situated in the two main cities of the province: Edmonton and Calgary.
Challenges 09 00026 g005
Table 1. Principal Component Analysis matrix of the 18 industrial emissions included in the study.
Industrial EmissionsPrincipal Components
Group 1Group 2Group 3
Benzene0.980.110.01
Carbon Disulfide0.95−0.09−0.04
Carbon Monoxide0.950.210.12
Sulphur Dioxide0.86−0.110.47
Toluene0.86−0.040.04
1,3-Butadiene0.640.660.01
Chloroform0.020.850.04
Ethylene Oxide0.170.960.06
Methanol0.030.860.06
Methyl-isobutyl-ketone0.110.900.05
Trichloroethylene0.110.790.05
Arsenic0.160.110.95
Cadmium0.360.060.60
Hexachlorobenzene−0.15−0.050.91
Lead0.290.290.72
Mercury−0.52−0.080.97
2-Ethoxyethanol−0.05−0.04−0.08
N-Methyl-2-Pyrrolidone−0.030.040.01
Industrial emissions with a correlation coefficient ≥0.6 (bold italics) were selected and kept in the principal component they represent.
Table 2. Descriptive statistics of the emissions, postal codes exposed to the emissions, and congenital heart defect (CHD) counts in urban and rural Alberta.
VariableUrbanRural* p Value
Total postal codes53,561679
Number of postal codes with EF in a 10 km radius51,546531
Number of postal codes without EF in a 10 km radius2015148
Count of EF per Postal Code (Min)11
Count of EF per Postal Code (Max)252183
Median number of EF impacting each postal code (IQR)60 (84)10 (15)
Sum total IDW emissions in tonnes170,4971632
Sum Group 1 IDW emissions in tonnes168,4341608
Sum Group 2 IDW emissions in kg205,089,52623,689
Sum Group 3 IDW emissions in kg904321
Median total emissions in tonnes (IQR)0.6 (2.4)0.07 (0.3)<0.001
Median Group 1 emission in tonnes (IQR)0.6 (2.3)0.07 (0.3)<0.001
Median Group 2 emissions in kg (IQR)6 (39)0.0000 (0.00) <0.001
Median Group 3 emissions in kg (IQR)2.2 × 10⁻⁹ (1.5 × 10⁻⁷)0.0000 (0.00) <0.001
Total CHD counts n = 2413 (%)1967 (81.5)446 (18.4)
Poisson mean of CHD counts (95% CI)0.04 (0.04, 0.04)0.66 (0.59, 0.72)
* p < 0.005 = statistically significant. EF = Emitting Facilities. IDW = Inverse Distance Weight. CI = Confidence Intervals. IQR = Interquartile range. = Group 2 and 3 were emitted in small quantities in rural postal codes and are represented in kilograms.
Table 3. Distribution of postal codes exposed to the highest emissions and CHD in Alberta.
RegionExposure CategoryTotal Postal Codes CountPostal Codes with CHD (%)Number of CHD CasesMin CasesMax CasesMin Exposure
(tonnes)
Max Exposure
(tonnes)
UrbanGroup 1 in 10th Decile5410293 (5)3171410116
Group 2 in 3rd Tertile18,062730 (4)78614232461
Group 3 in 3rd Tertile18,068741 (4)799140.0913.9
RuralGroup 1 in 10th Decile147 (50)201911500
Group 2 in 3rd Tertile186(33)22193817,340
Group 3 in 3rd Tertile126 (50)22190.112
= Group 2 and 3 emissions were emitted in small amounts and were not detectable in tonnes, therefore we chose to show them in kilograms.

