Review

Application of Information—Theoretic Concepts in Chemoinformatics

Department of Life Science Informatics, B-IT, Rheinische Friedrich-Wilhelms-Universität, Dahlmannstr. 2, D-53113 Bonn, Germany
*
Author to whom correspondence should be addressed.
Information 2010, 1(2), 60-73; https://doi.org/10.3390/info1020060
Submission received: 1 September 2010 / Revised: 26 September 2010 / Accepted: 16 October 2010 / Published: 20 October 2010
(This article belongs to the Special Issue What Is Information?)

Abstract

:
The use of computational methodologies for chemical database mining and molecular similarity searching or structure-activity relationship analysis has become an integral part of modern chemical and pharmaceutical research. These types of computational studies fall into the chemoinformatics spectrum and usually have large-scale character. Concepts from information theory such as Shannon entropy and Kullback-Leibler divergence have also been adopted for chemoinformatics applications. In this review, we introduce these concepts, describe their adaptations, and discuss exemplary applications of information theory to a variety of relevant problems. These include, among others, chemical feature (or descriptor) selection, database profiling, and compound recall rate predictions.

Graphical Abstract

1. Introduction

Chemoinformatics is still evolving as a research field and is, from a methodological point of view, closely related to bioinformatics. Whereas bioinformatics typically deals with genes, proteins, and other large biomolecules, pharmaceutically-oriented chemoinformatics focuses on small (synthetic) molecules, their interactions with targets, and their biological activity [1]. In more general terms, we can rationalize chemoinformatics as a discipline that processes any form of chemical information with the aid of computational methods. Similar to bioinformatics, the management, use, and analysis of large quantities of information is central to the field of chemoinformatics [2]. A prime objective of chemoinformatics methods is the identification of compounds with desired biological activities that might ultimately become drug candidates.
Information theoretical concepts can be applied to chemoinformatic problems at very different levels and in diverse contexts. On the one hand, the concepts from information theory can be directly applied to different representations of small molecules in order to quantify their chemical “information content” [3]. On the other hand, information-theoretic approaches can be employed in statistical analysis, data mining, and machine learning, which currently play a vital role in chemoinformatics research [4]. Herein, we will first provide an overview of how the concept of information can be applied to molecules. Then we focus on statistical analysis of compound databases and the use of information-theoretic concepts for applications such as virtual compound screening.

2. Chemical Descriptors and Shannon Entropy

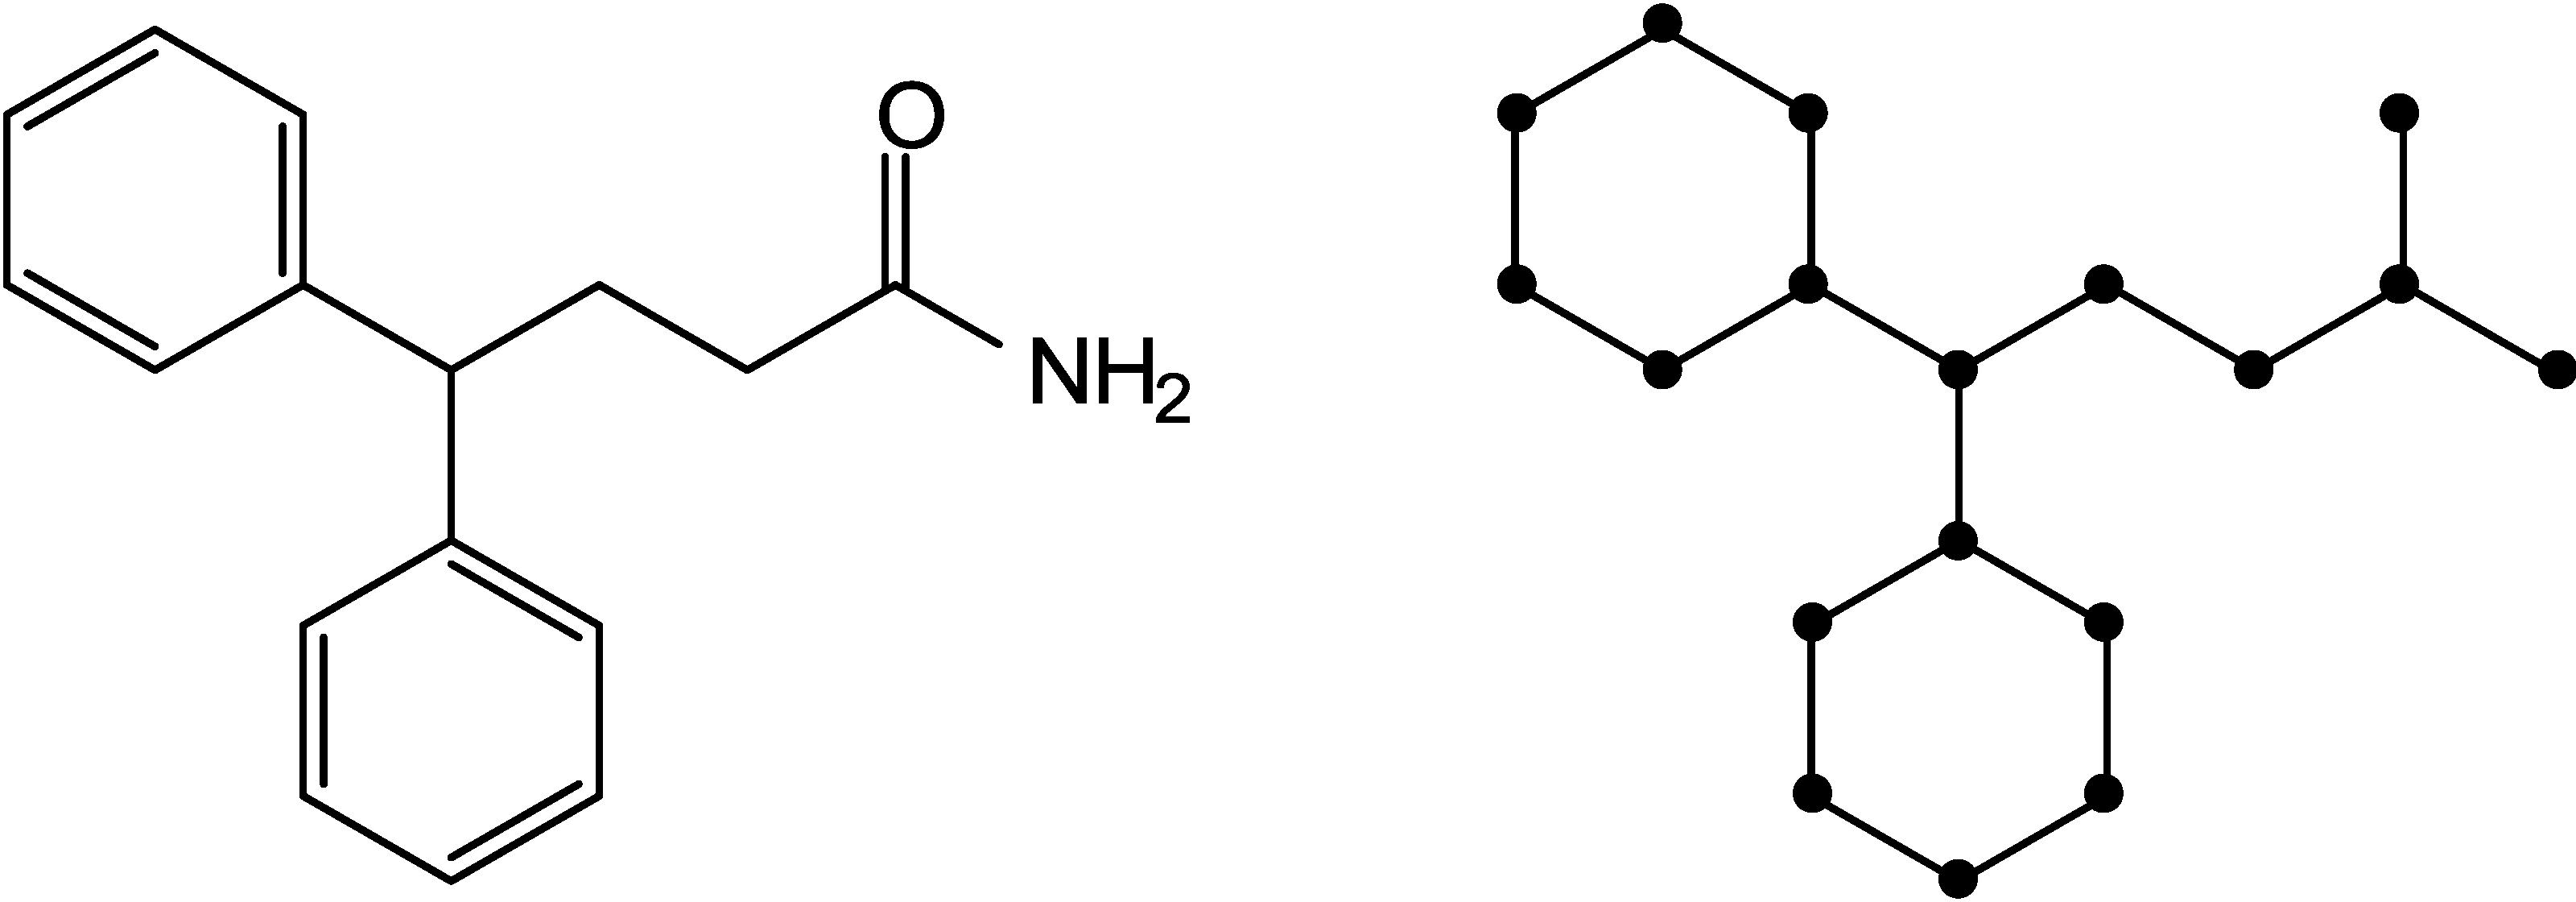
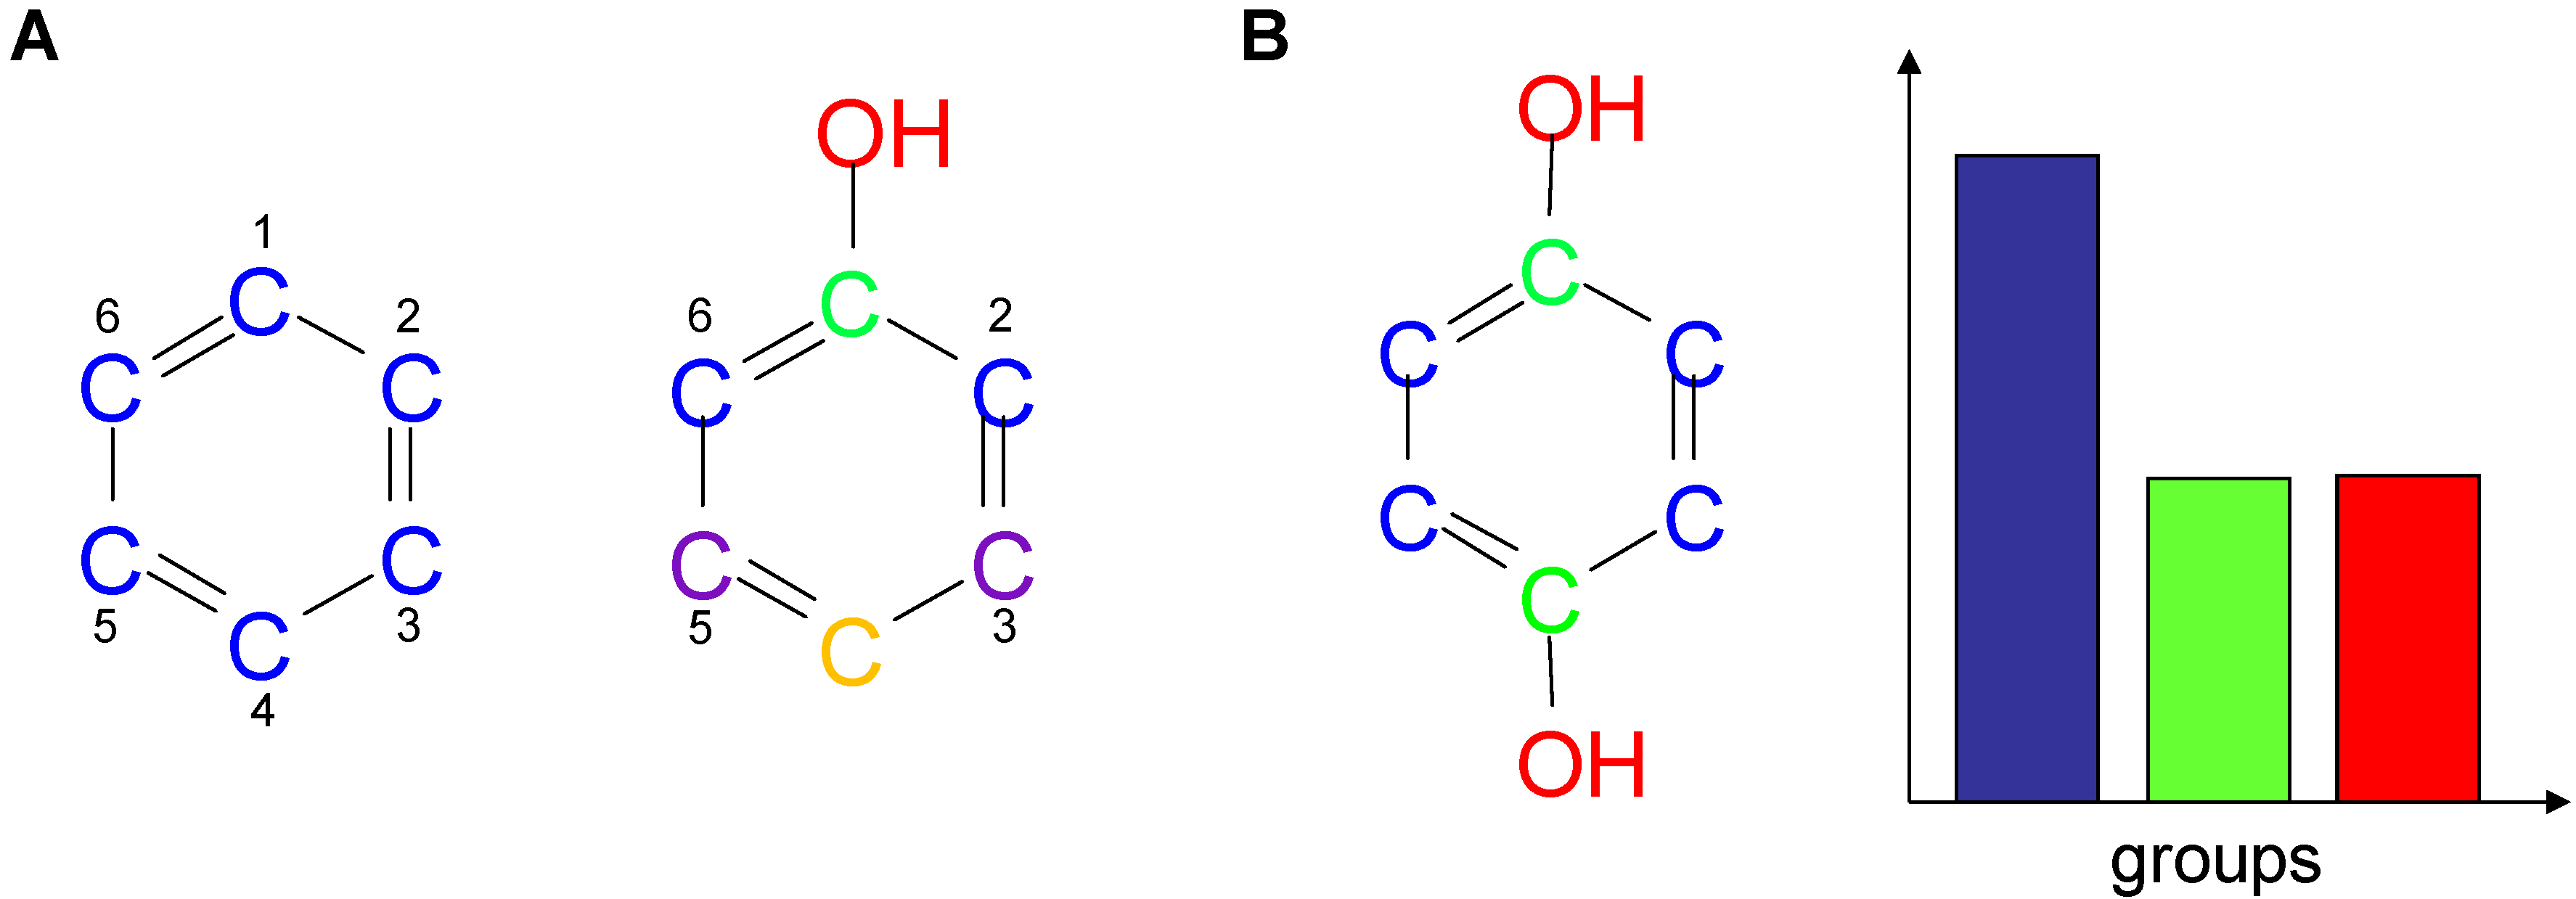
2.1. Information-Theoretic Concepts for Characterizing Topological Properties of Molecules

Probably the most well-known description of chemical compounds is the chemical graph representation. In a chemical graph, the atoms composing a molecule are represented as nodes and bonded atoms are connected by edges indicating the type of bond, e.g., a single, double, or aromatic bond (Figure 1). A chemical graph does not represent three-dimensional structure information but its topology. The graph can also be annotated with stereochemical information, which defines the relative spatial arrangements of selected atoms. In graph representation of a molecule, hydrogen atoms are often “suppressed”, i.e., they are not shown as separate nodes and are also not directly considered when extracting information from the graph.
Figure 1. Abstract representation of a molecule as a mathematical graph. Topological properties of molecules are typically derived from a hydrogen-supressed representation by reducing molecules to their connectivity information and disregarding atom type and bond order.
Information 01 00060 g001
An early application of information-theoretic concepts in chemoinformatics has been the determination of chemical “information content” from graph representations. The basic idea here is to calculate the Shannon entropy [5] of a probability distribution that is induced by invariants of the underlying graph. A graph invariant is a property that is only dependent on the abstract structure of a graph and not on specific representations. For instance, the adjacency matrix of a graph is not an invariant because it depends on the order of the nodes. On the other hand, the characteristic polynomial of the adjacency matrix is an invariant because it does not depend on the order.
This concept was first introduced in the 1950s by Rashevsky [6] and further developed by Trucco [7,8] and Mowshowitz [9,10,11,12]. The basic idea is to measure the complexity of a graph by considering its symmetries. For instance, benzene is a highly symmetrical graph where all carbon atoms are topologically indistinguishable. However, when we consider phenol, only the carbon atoms at positions 2 and 6 and at positions 3 and 5 are indistinguishable [Figure 2 (a)]. If we add another hydroxyl group at position 4 (i.e., benzene-1,4-diol), the four carbons at positions 2, 3, 5, and 6, the carbon pair 1 and 4, and the two hydroxyl groups become indistinguishable. If such topologically “indistinguishable” nodes are grouped together the relative size of the groups induces a probability distribution, as shown for benzene-1,4-diol in Figure 2 (b).
Figure 2. Partitioning of atoms into sets of indistinguishable atoms. Atoms of a molecule are grouped together if they are topologically indistinguishable. For each molecule, atoms belonging to the same group are shown in the same color. (a) All (non-hydrogen) atoms of benzene are indistinguishable. When a hydroxyl group is added, the carbons in positions 2 and 6 as well as those in positions 3 and 5 positions are indistinguishable, as indicated by the color code. (b) For benzene-1,4-diol, groups of indistinguishable atoms are shown in the same color and the probability distribution resulting from the partitioning is reported.
Information 01 00060 g002
The Shannon entropy of this distribution then defines the topological information content of the graph. If n is the total number of non-hydrogen atoms in a molecule and the molecule is partitioned into k sets of topological indistinguishable atoms of respective size ni, i=1…k, the values n i n can be treated as probabilities of a discrete probability distribution and the topological information index is defined as:
I TOP = i = 1 k n i n log 2 n i n = log 2 n 1 n i = 1 k n i log 2 n i
For the benzene of Figure 2 (a) all atoms are indistinguishable, so n=6, k=1, n1=6, and:
ITOP(benzene) = 0.
For phenol, n=7, k=5, n1=1, n2=1, n3=1, n4=2, n5=2 and:
I TOP ( phenol ) = - 3 7 log 2 1 7 4 7 log 2 2 7 = 2.236
Finally, for benzene-1,4-diol [Figure 2 (b)], n=8, k=3, n1=2, n2=2, n3=4 and:
I TOP ( benzene-1,4-diol ) = - 2 4 log 2 1 4 1 2 log 2 1 2 = 1.5
Thus, due to its limited symmetry phenol has the highest index of these three molecules. In mathematical terms, nodes of a graph are indistinguishable if they are contained in the same orbit with respect to the automorphism group. An automorphism of a graph is a permutation of the nodes that preserves the adjacency relationships of the nodes. The automorphism group is the set of all automorphisms of a graph. Two nodes belong to the same orbit if there is an automorphism that maps one node onto the other. The information content is solely based on the relative sizes of the orbits and is also called orbital information content [3]. Variants of the topological information can be defined, for instance, by considering edges instead of nodes (edge orbital information content) or connections, i.e., paths of length 2 (connection orbital information content) [13,14].
The idea of calculating the Shannon entropy on an observed or modeled probability distribution has been applied to a variety of other graph invariants in order to describe the topological shape of molecules [15,16]. Among others, these include the adjacency matrix, the respective characteristic polynomial, the distance matrix, or their respective edge counterparts (see [3] for a more comprehensive listing).

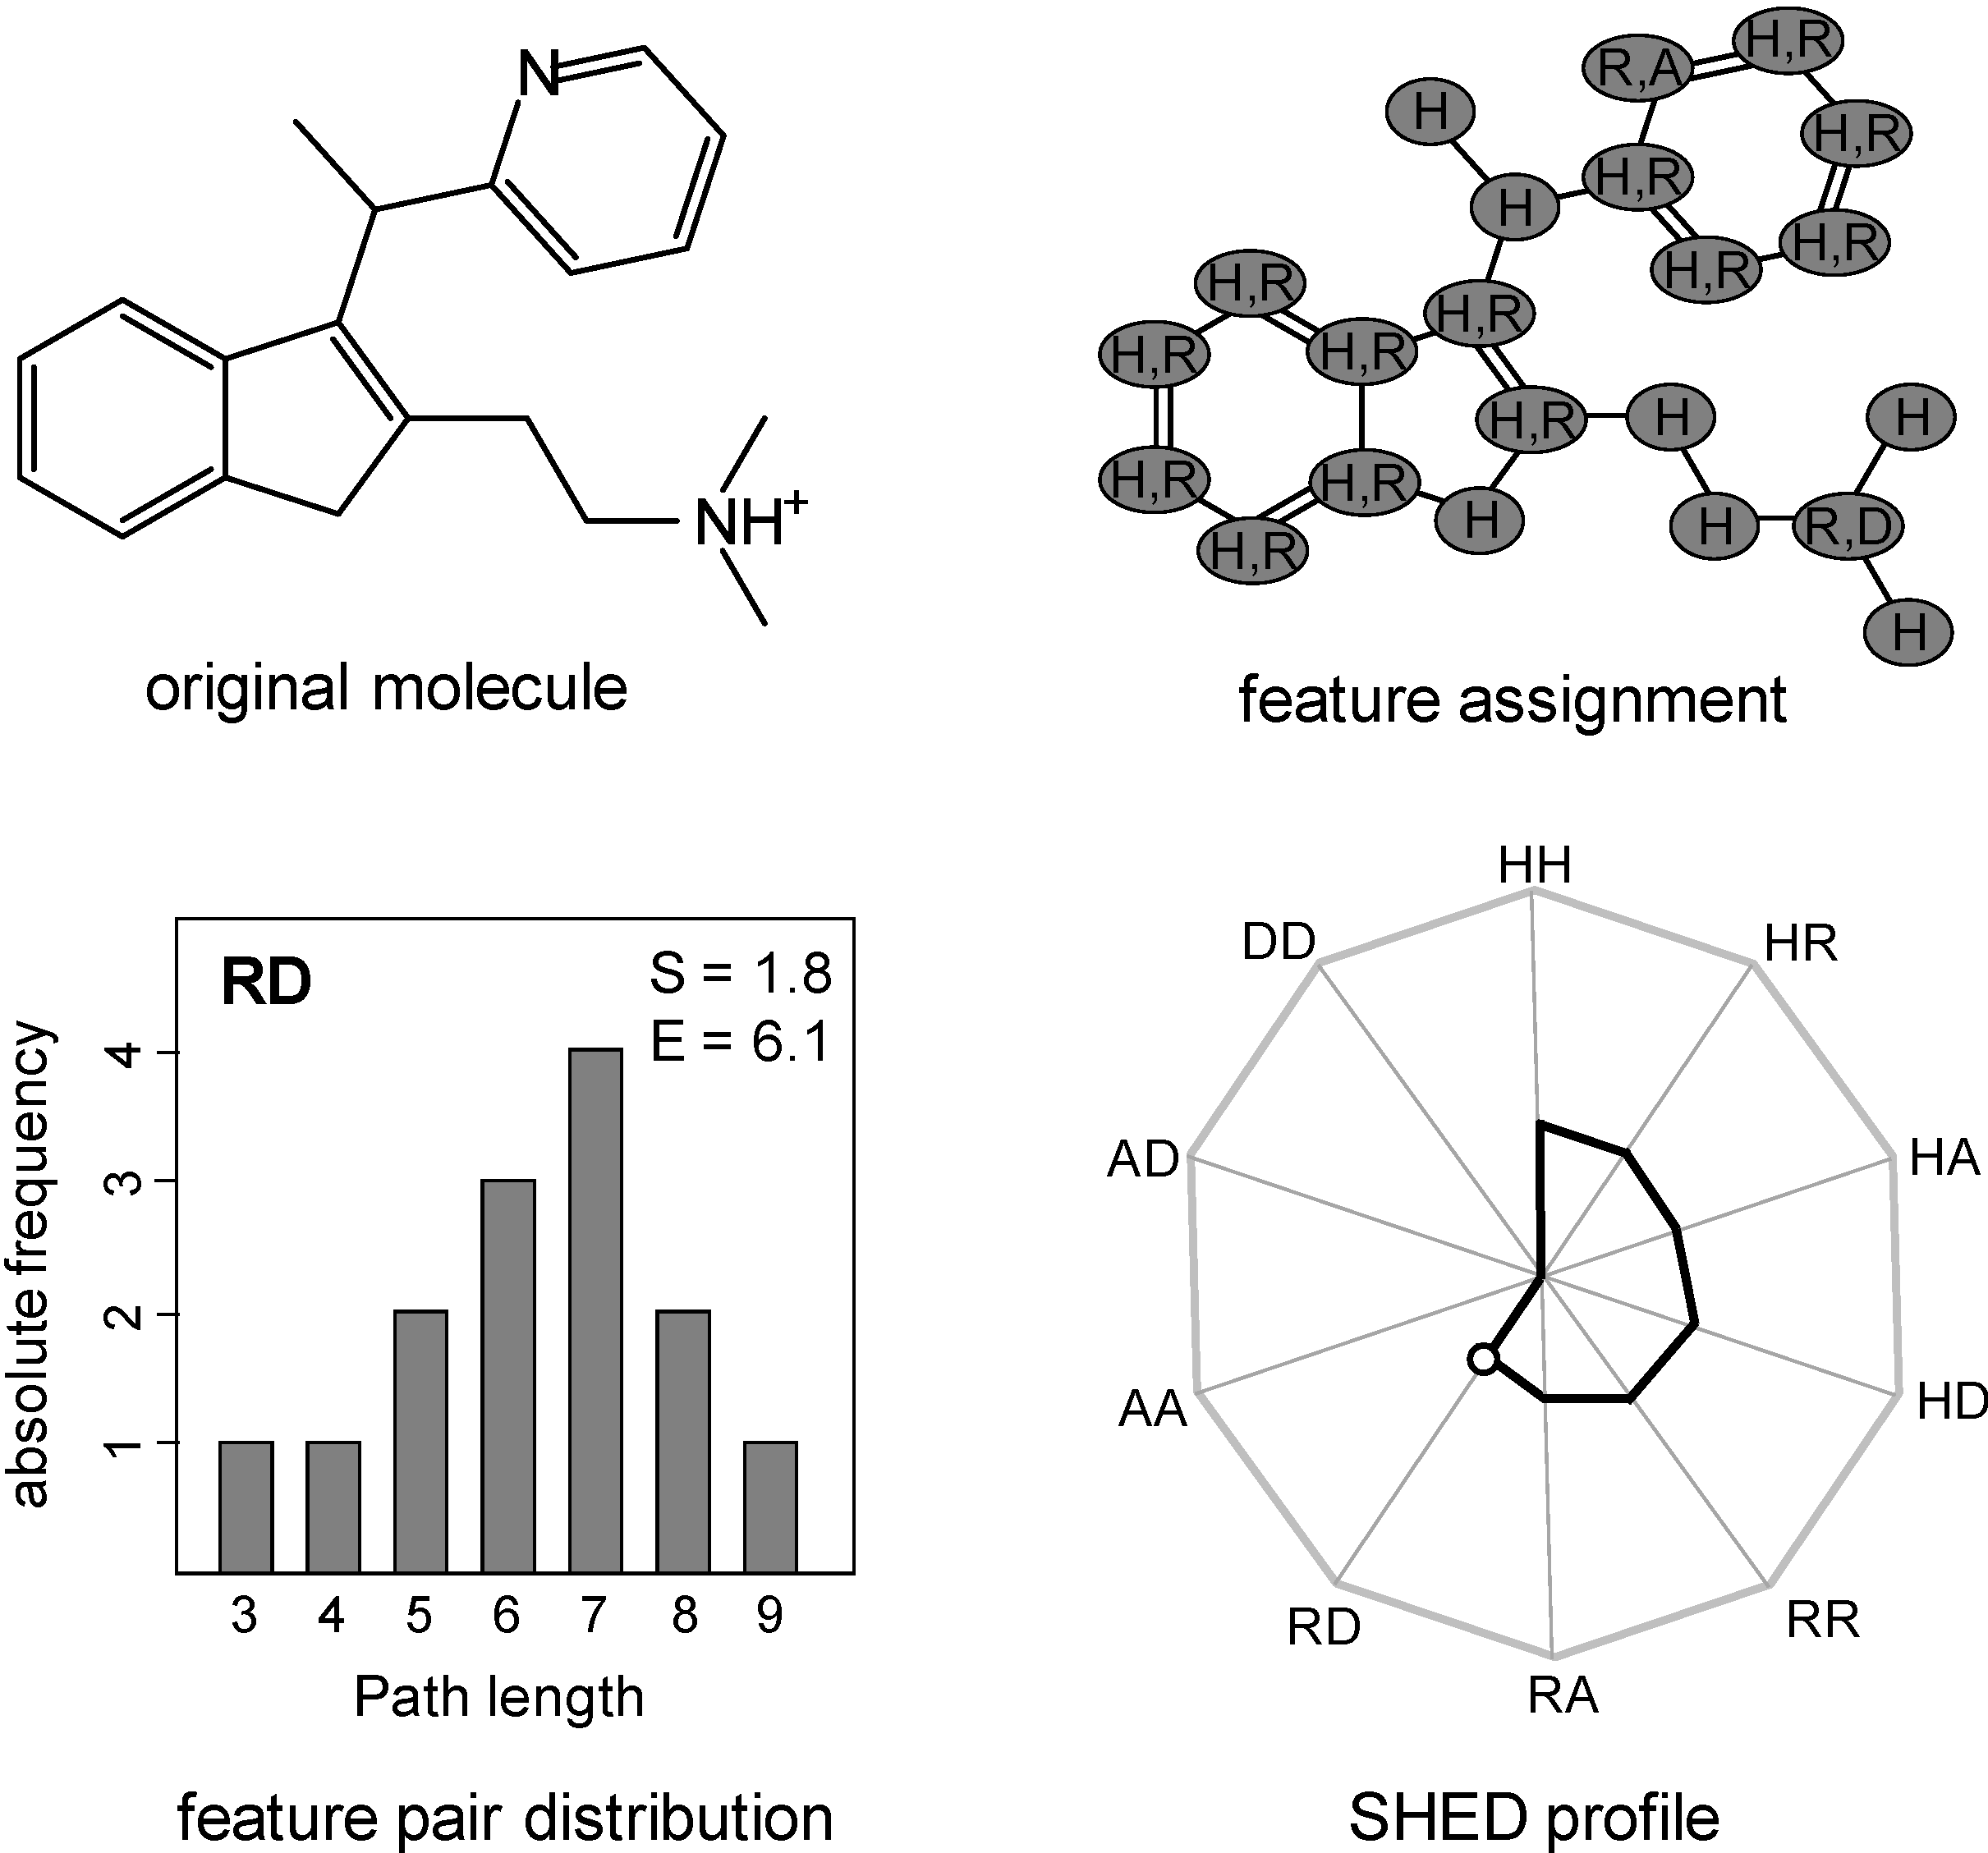
2.2. Shannon Entropy Descriptors (SHED)

The majority of chemoinformatics methods rely on the representation of molecular structure and properties by numerical descriptors. Typically, combinations of descriptors are calculated for molecular data sets that then constitute chemical references spaces where each mathematical model (feature, descriptor) adds a dimension to the space. The projection of molecules into chemical reference spaces is a pre-requisite for the application of statistical and data mining methods. Literally thousands of different molecular descriptors of greatly varying mathematical complexity are available. Many descriptor spaces that are utilized in chemoinformatics are high-dimensional. However, for applications such as compound classification, the dimensionality of chemical reference spaces is often reduced in order to focus on features that are most descriptive- and predictive- for a given data set and to provide a basis for chemical interpretation of the results.
Given the wealth of chemical descriptors that are available, the topological information content and its variations, as discussed above, only characterize molecules with regard to their topological complexity. It is of course also important to characterize molecules with regard to their physicochemical properties, e.g., by assessing their hydrophobic character or the distribution of hydrogen bond donors. For the analysis of structure-activity relationships, a central theme in chemoinformatics, it is of critical importance to represent small molecules using descriptors that are relevant for and responsive to specific biological activities.
The information entropy concept has also been applied to design molecular descriptors, termed Shannon entropy descriptors (SHED) [17], which characterize the distribution of potentially activity-relevant atomic features in a molecule. Sets of atomic features that are responsible for a molecule’s biological activity constitute a pharmacophore. More precisely, a pharmacophore describes the spatial arrangement of groups of functionalities in a molecule that determine its biological activity. An active molecule must possess features that are highly complementary to the binding site of its target protein, e.g., hydrogen bond donor and/or acceptor functions. In order to capture relevant pharmacophore features, SHED are based on the calculation of pairs of atomic features and their topological distances in a molecule. Therefore, each atom of a molecule is assigned to one or more of four atom-centered features: hydrophobic, aromatic, hydrogen bond acceptor, or hydrogen bond donor. The combination of two of these four features yields 10 different possible feature pairs. For each feature pair, all atom pairs representing this feature pair and their topological distances, i.e., the shortest path lengths (number of bonds) between them, are determined. This yields a distribution of topological distances ranging from 1 to 20. Distances larger than 20 bonds are included in topological distance 20. Considering the relative frequency with which each distance occurs yields a probability distribution for each feature pair for which the Shannon Entropy S is calculated. The S values for all 10 feature pairs are further transformed into projected entropy values E, E = e S , that form the SHED profile of a test compound. Pairwise similarity of molecules is assessed by calculating the Euclidean distance of their SHED profiles. It was shown that molecules with a similar SHED profile were often likely to possess the same biological activity [17], which is a typical way to assess descriptor relevance. The calculation of SHED profiles is outlined in Figure 3.

3. Information Theory-Based Assessment of Feature Significance in Active Compounds

The methods discussed above focus on the application of information-theoretic measures to individual molecules to characterize their properties. In this section, other chemoinformatics approaches are described that make use of information theory for data mining and analysis in a statistical context.
In ligand-based virtual screening [18], known bioactive compounds (the reference set) are used to mine databases for novel compounds active against the same biological target. The concept is based on the similarity property principle (SPP) [19] stating that overall structurally similar molecules should have similar biological properties. This concept is simple at first glance, but requires a bridge between chemical similarity and activity similarity, which presents a major challenge for chemoinformatics methods. For similarity assessment, compounds are represented by a set of descriptors, as discussed above. Due to their effectiveness and computational efficiency, fingerprints that encode the features of molecules as bit string representations are widely applied in similarity searching [20]. They are a special form of a complex descriptor that captures feature distributions mostly (but not always) in a binary format. Fingerprints can usually be characterized as two- or three-dimensional (2D, 3D) according to the dimensionality of the molecular representation from which they are derived. This means that 2D fingerprints are calculated from the chemical graph and 3D fingerprints from the 3D structural representation of a molecule [4]. For example, in simple 2D structural fingerprint designs, each bit accounts for the presence (i.e., the bit is set to one) or absence (the bit is set to zero) of a predefined structural fragment, as illustrated in Figure 4. Irrespective of the specific search methodology used for database mining, fingerprint overlap between active and database compounds is generally used to quantify molecular similarity—and utilized as a measure of predicted activity similarity [20].
Figure 3. Calculation of SHED descriptors. Each atom in a molecule is assigned one or more of the following atomic features: hydrophobic (H), aromatic (R), hydrogen bond acceptor (A), or hydrogen bond donor (D). The pairwise combination of these features results into 10 possible feature pairs. For each pair, the distribution of topological distances between atoms with the respective features is determined. Here, the distribution is shown for the aromatic-donor feature (RD) pair. As can be seen, there is only one donor atom in the molecule. To obtain the RD distribution, the shortest path lengths (number of bonds) of the donor atom to 14 aromatic atoms present in the molecule are calculated. From this distribution, the Shannon entropy for the feature pair is derived and further transformed into a projected Shannon entropy value, i.e. E-value. The projected entropies of the 10 feature pair distributions are graphically displayed in a wheel chart. The small circle in the chart indicates the E-value for the RD feature pair.
Information 01 00060 g003
Fingerprints typically combine, and test for, many different chemical features. Often, individual features are associated with defined bit positions, forming a one-to-one correspondence. However, it has been shown that usually not all bit positions contribute equally to search performance [21]. Furthermore, fingerprint search performance is strongly compound class-dependent, which is typically observed for molecular descriptors and similarity search tools, regardless of their design and specific methodological features. Fingerprint search performance can often be improved if the fingerprint format is edited in a compound class-specific manner. For example, dependent on the search strategy that is applied, the elimination of bits from fingerprints can increase the recall of active compounds [22]. In general, the determination of optimal bit subsets for individual compound classes requires the assessment of the discriminatory power of individual bit positions to distinguish between active and inactive database compounds. Two information-theoretic concepts that can be applied to assign a relevance score to a given descriptor are the Kullback-Leibler divergence [23] and mutual information [24].
Figure 4. Schematic substructural fingerprint. A substructural fingerprint consists of a predefined set of substructural features represented by specific positions in a binary string. If a feature is present in a molecule the bit is set on in its fingerprint; otherwise it is set off. The bit pattern is illustrated by the bar where each square corresponds to a specific substructural feature, as indicated for five different fragments. The molecule shown at the top contains two of the five fragments. For these fragments, the corresponding bits are set on (filled square), whereas the bits for the three other substructures that do not occur in the molecule are set off (empty square).
Information 01 00060 g004

3.1. Kullback-Leibler (KL) Divergence

Fingerprints v = ( v i ) i = 1 k consist of k bits that are either set on or off and thus fingerprint bits can be modeled as random binary variables following a Bernoulli distribution. The probabilities p i A and p i B that bit i is set on for active and inactive compounds, respectively, can be estimated from the relative frequency of the bit being set on within the active reference set (A) and the background database (B).
p i A = # { v A | v i = 1 } m   and   p i B = # { v B | v i = 1 } n
Here, m denotes the number of active and n the number of database compounds. Although database compounds are usually not confirmed inactive molecules, they can readily serve as an approximation for our estimate because only very few compounds in a large database are likely to display a specific biological activity so that their influence on the statistics becomes negligible.
Furthermore, as active reference sets are usually rather small, a Laplacian correction can be applied to avoid that the estimated probabilities become zero:
p ^ i A = m p i A + p i B m + 1 p ^ i B = n p i B + p i A n + 1
Accordingly, the probability that a bit is set off is given by q ^ = 1 p ^ .
KL divergence quantifies the difference between corresponding bit probability distributions for two classes of compounds. The KL divergence of an individual fingerprint feature can hence be used to assess its significance with respect to the amount of information it contains about an activity class A relative to a compound database B:
D [ p ( v i | A ) p ( v i | B ) ] = p ^ i A log p ^ i A p ^ i B + q ^ i A log q ^ i A q ^ i B
In a recent simulated virtual screening study [25], fingerprints of different complexity and design were subjected to KL divergence analysis for 27 different activity classes with 20 active reference compounds each and bit positions achieving highest KL divergence scores were combined into subsets of increasing size such that compound-class specific fingerprints of variable length were generated. These reduced fingerprints and the full-length fingerprints were then used for Bayesian virtual screening [26]. Using bit distributions of active and inactive reference molecules, the likelihood of test compounds to exhibit a desired activity was estimated on the basis of a log-odds scoring function that is conceptually related to the KL divergence analysis [27]:
log ( R ( v ) ) = i = 1 k v i ( log p ^ i A p ^ i B log q ^ i A q ^ i B ) + const
This scoring function can be derived from Bayesian principles using the common assumption that the features are independently distributed. A conventional performance measure of virtual screening benchmark trials is the recall (or recovery) rate, i.e., the number of active compounds retrieved in the selected (top-scoring) database subset divided by the total number of actives in the compound database. It was shown that for all 27 compound classes, KL-divergence analysis was able to identify subsets of bits, often consisting of only a few positions, which determined fingerprint search performance and, in many instances, increased the recall rate of active compounds in top-scoring database selection sets in comparison to the full-length fingerprints [25]. In subsequent studies, preferred bit subsets from different fingerprint types were identified based on KL divergence analysis of active compounds and the background database and then combined to build “hybrid” fingerprints that were then used in similarity searching [28,29]. Systematic simulated virtual screening trials showed that hybrid fingerprints consistently outperformed their parental fingerprints with respect to both the number of retrieved compounds and the chemical diversity of the identified hits. Hence, as different fingerprints capture different aspects of molecular structure, the combination of discriminatory features from different fingerprints can lead to a substantial gain in chemical information that is exploited in the search for novel active compounds.
KL divergence analysis can also be applied to estimate the expected recall rate for different activity classes [30,31]. The KL divergence for an entire fingerprint is the sum of the KL divergences obtained for individual bit positions and corresponds to the expected score of the log-likelihood ratio log ( R ( v ) ) for activity class A. The higher the KL divergence the more the fingerprint should be able to distinguish between classes A and B and the higher is the expected recall rate for that activity class. In order to exploit this relationship for compound recall rate prediction, simulated virtual screening trials were carried out to determine recall rates for 40 different activity classes. Then a linear regression model was built by relating the logarithms of KL divergences to corresponding recall rates. Subsequently, the so derived model was used to predict recall rates for seven external test classes that, indeed, corresponded well to recall rates obtained by virtual screening experiments [30].

3.2. Mutual Information (MI)

In addition to KL divergence, the concept of mutual information (MI) has been successfully applied to feature assessment and selection. MI answers the question of how much information about a class C, is contained in a feature F describing that molecule. This information might be the biological activity shared by compounds belonging to this class.
Formally, if the values of feature F are distributed according to a probability distribution p(x) and the class C has two possible values A (active) and B (inactive) with probabilities p(A) and p(B), the (average) MI can be defined as:
M I ( F ; C ) = H ( F ) H ( F | C )
where H ( F ) = i p ( x i ) log p ( x i ) is the Shannon entropy and:
H ( F | C ) = p ( A ) H ( F | C = A ) + p ( B ) H ( F | C = B )
is the conditional entropy of F with respect to C [32]. Note that MI can also be expressed as the KL divergence between the joint distribution and the product distribution, i.e.:
M I ( F ; C ) = D [ p ( x , c ) | | p ( x ) p ( c ) ] = x , c p ( x , c ) log p ( x , c ) p ( x ) p ( c )
This MI formalism is distinct from the KL divergence in the previous section where in equation (4) the KL divergence of the two conditional distributions p ( x | A ) and p ( x | B ) forms the basis for descriptor selection. The MI is also known as ‘information gain’ and is an important criterion in the design of descriptor-based trees [24].
A related quantity is the so-called pointwise (or specific) mutual information:
S I ( x , y ) = p ( x , c ) log p ( x , c ) p ( x ) p ( c )
According to equation (8), the MI is simply the expected value of SI. Liu [33] investigated different feature selection strategies for compound classification and found average MI-based feature selection to compare favorably to pointwise MI-based feature selection and a number of other statistical selection methods, especially for Bayesian classification. MI has also been successfully applied to feature selection for QSAR (in combination with genetic algorithms) [34]. Furthermore, feature selection strategies can play an important role in virtual screening using high-dimensional binary fingerprints. Combinatorial fingerprints of large databases (e.g., 1,000,000 compounds and more) can contain a total of several 100,000 different features [35], although each molecule is usually described by less than 100 features. Thus, most features occur only rarely and the selection of relevant features is highly activity class-specific. In this context, MI has been used successfully for Bayesian screening [36].
A principal problem in applying MI for feature selection is that it depends on the estimation of the probabilities for activity p(A). Usually, these probabilities are estimated from training data. In the context of virtual screening, it is very difficult to estimate the number of potentially active compounds contained in a screening database. Usually, only a small number of active molecules are known (tens to hundreds of molecules). These small sets of active compounds usually do not provide a representative sample of the relevant chemical space. Active molecules are often obtained by replacing substituents in previously known active molecules, thereby producing so-called analog series of structurally very similar compounds, which further restricts the representation of activity-relevant chemical space. In general, only a very small fraction of the compounds in a large database can be expected to display a specific biological activity. On the other hand, the discriminatory power of a feature can be assessed regardless of the frequency of active compounds in a database. To this end, for the purpose of feature selection or prioritization, the actual feature probability distribution is not relevant and the probability can be arbitrarily set to p(A)=0.5. Under these assumptions [using equation (5)], equation (4) becomes:
M I ( F ; C ) = H ( F ) 1 2 ( H ( F | C = A ) + H ( F | C = B ) )
This quantity is also known as the Jensen-Shannon divergence of the feature distributions of active and inactive compounds [37] and can be easily calculated from the entropies of the feature distributions for active and inactive compounds, taking their average and subtracting the value from the entropy of the joint distribution calculated as:
p ( f ) = 1 2 ( p ( f | A ) + p ( f | B ) )
As a consequence of setting p ( A ) = p ( B ) = 0.5 , MI exhibits desired properties when assessing the significance of descriptors. First, one should note that the value of the MI in equation (7) only depends on the feature distributions for class A and B. Second, the Shannon Entropy H(C) becomes 1 and hence, given that 0 M I ( F ; C ) H ( C ) = 1 , MI is normalized to the range 0 to 1. Thus, the significance of descriptors can be readily interpreted regardless of the prior probabilities p(A). A conceptually similar but numerically different approach, termed differential Shannon entropy (DSE), has also been exploited [38] to assess differences in the variability of descriptors in different databases and also as a feature selection strategy for building binary QSAR models for classifying natural products and synthetic molecules [39].

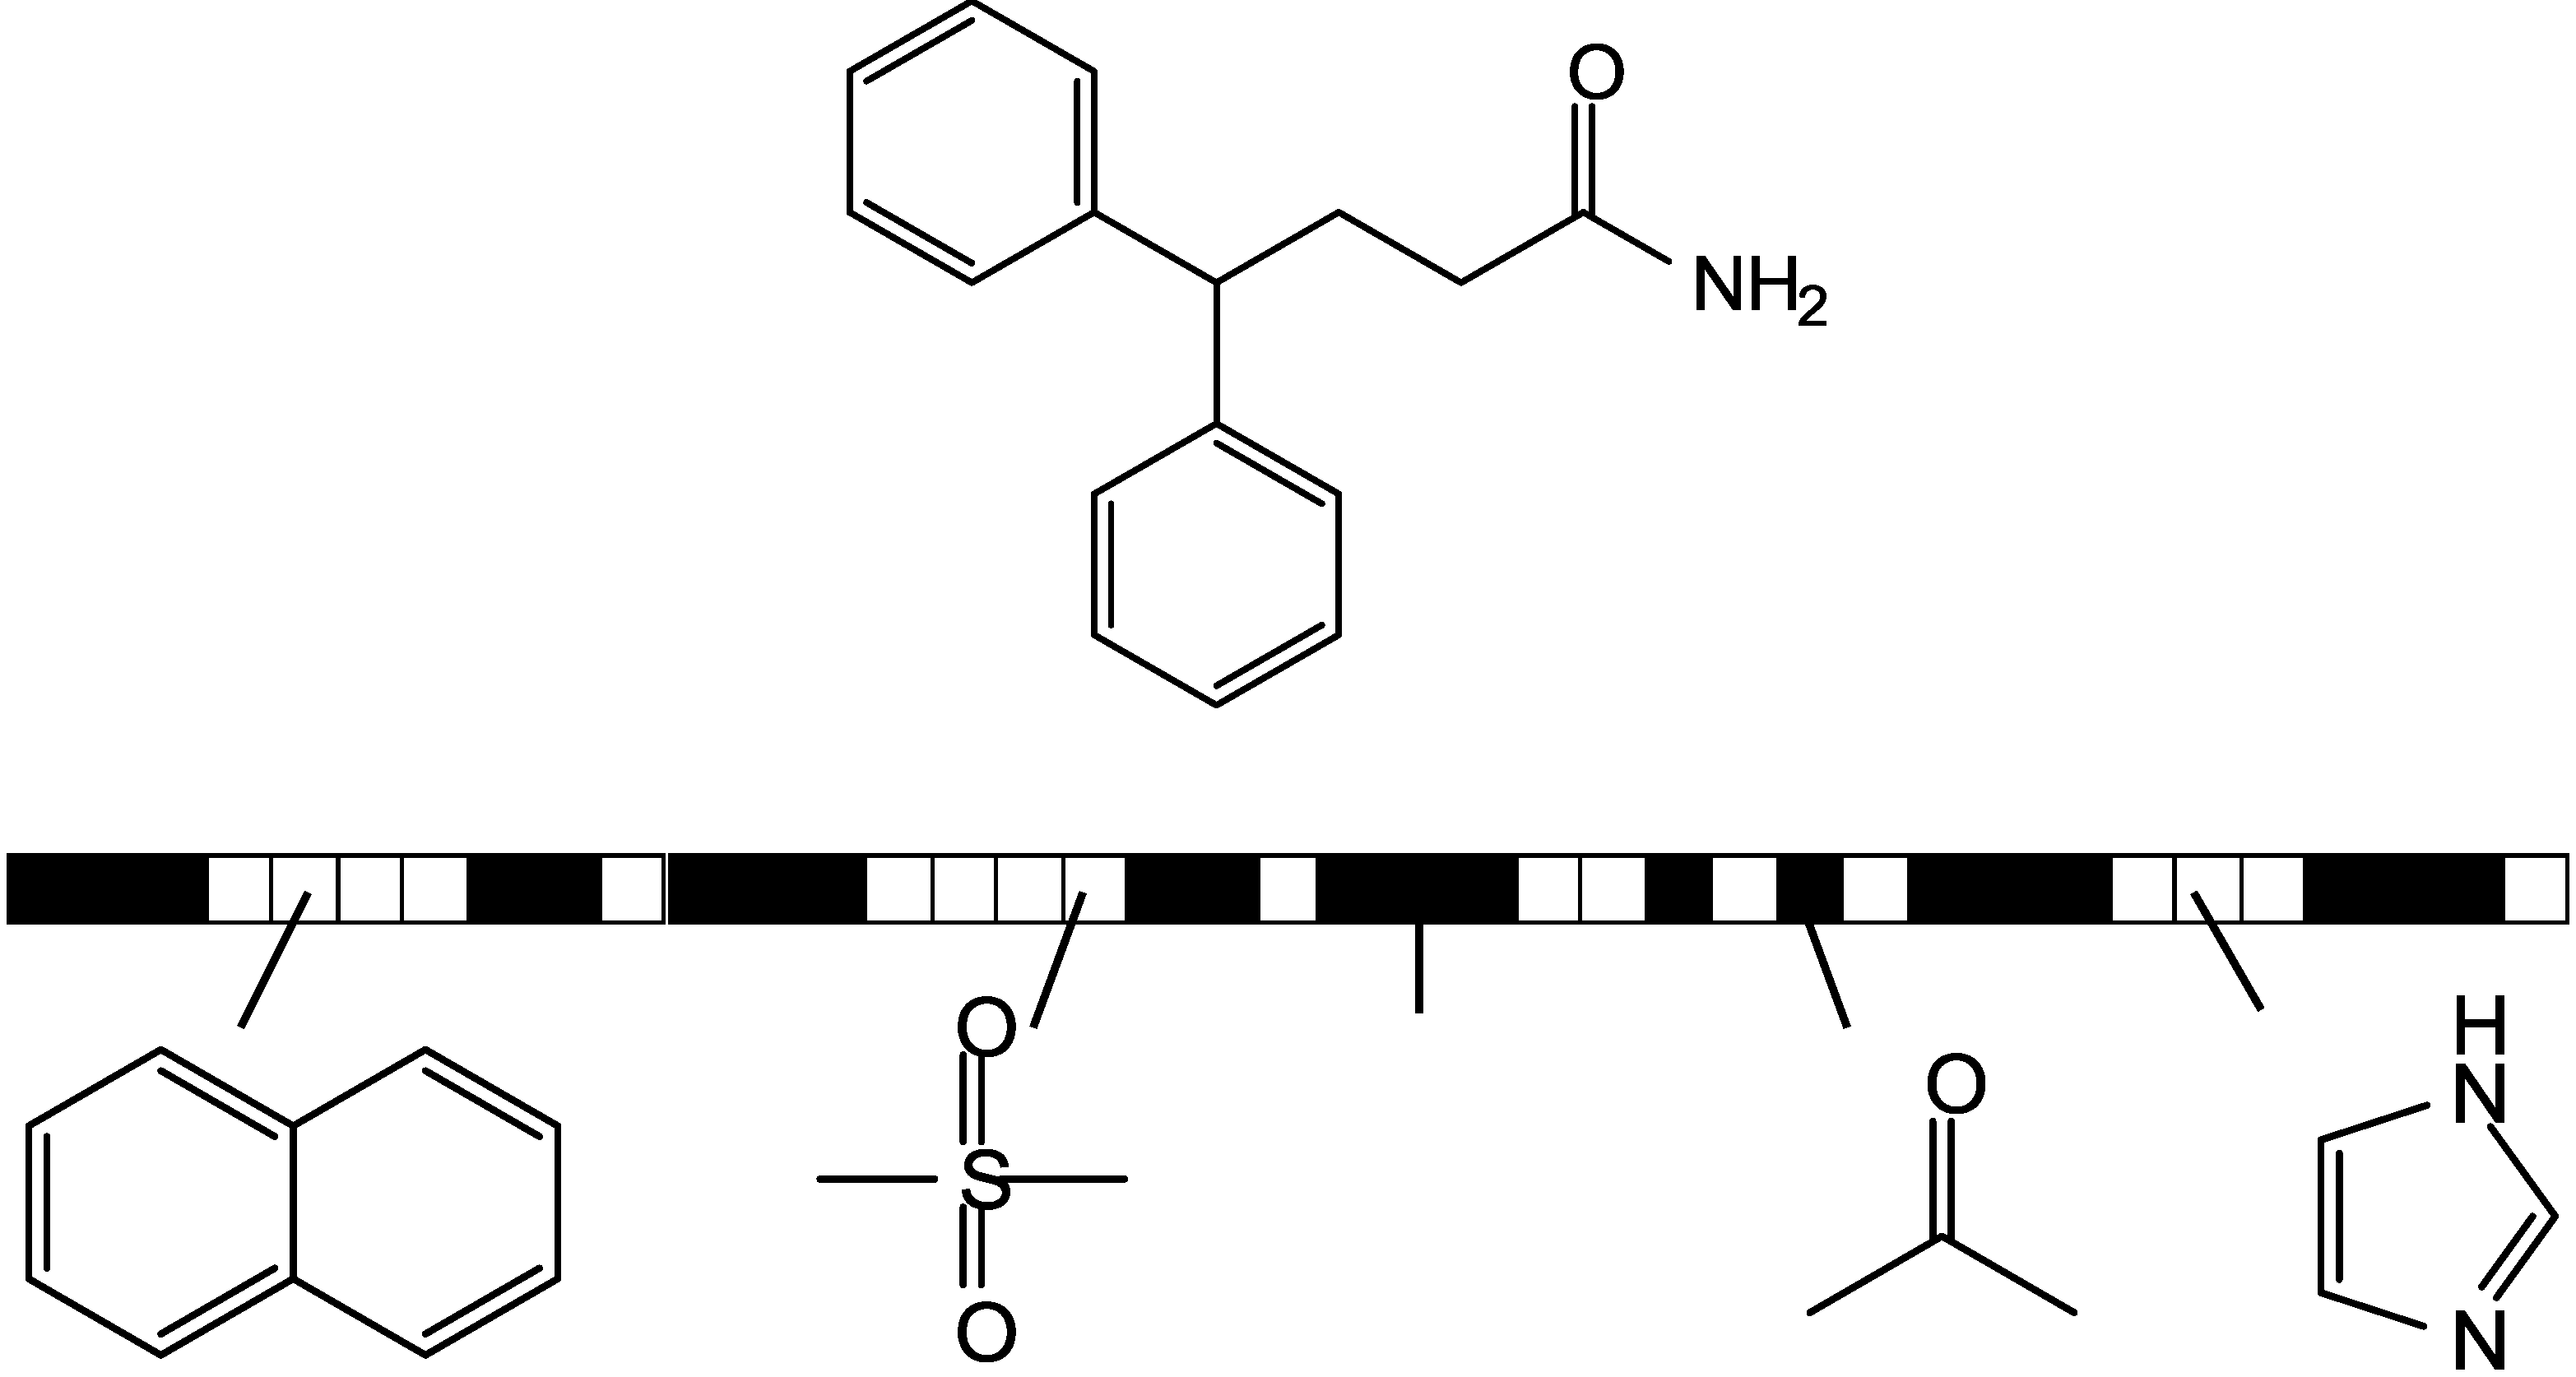
3.3. Shannon Entropy-Based Fingerprint Similarity Search Strategy

The final section presents an SE-based similarity search strategy [40] that, albeit not widely applied in chemoinformatics, is discussed because of its conceptual novelty. The approach uses an SE-based similarity measure to determine the similarity of a database compound to an active reference set.
As for most search strategies the underlying idea of the SE-based fingerprint similarity search strategy [40] is that active compounds share a characteristic bit pattern (or consensus bit positions). The variability of a single fingerprint feature in a set of active compounds can be obtained by calculating the SE value for this bit position considering the feature as a random variable with the two possible values 0 (absence) or 1 (presence). Again, probabilities in SE calculations are replaced by observed relative frequencies. Under the assumption that individual bits in the fingerprint are uncorrelated, SE values obtained for single bit positions are then summed up to yield the SE of the complete fingerprint for the ligand set (Figure 5). The lower the SE for the fingerprint, the more regular is the bit pattern produced by the active compounds. When a database compound that departs from consensus bit positions is added to the set of active compounds the SE of the complete fingerprint increases, whereas the addition of a compound that matches the consensus bit pattern results in no or only a slight modification of the original SE value, as shown in Figure 5. Hence, the fingerprint SE value obtained after addition of a database compound reflects its similarity to the reference compounds, and sorting database compounds in the order of increasing SE values provides a database ranking in the order of decreasing similarity. Virtual screening trials including eight different activity classes showed that the SE method could further improve the similarity search performance of current state-of-the-art approaches [40] such as nearest-neighbor or fingerprint averaging strategies [41].
Figure 5. Shannon entropy-based fingerprint similarity. The fingerprint Shannon entropy score (SE) is calculated as the sum of the Shannon entropies of individual bit positions (left). The SE of a reference set of four acetylcholine esterase (ACE) inhibitors is shown on the right. The SE is recalculated when individual test compounds are added to the set. For active compounds, the SE value changes only very little (top three compounds), but for inactive compounds, the SE increases notably (bottom three compounds).
Information 01 00060 g005

4. Conclusions

Herein we have provided a brief review of how information-theoretic concepts have thus far been applied in chemoinformatics. Initially, we have described how the information content of single molecules can be estimated. Other key applications include the adaptation of the Shannon entropy concept for descriptor design and database profiling and the use of Kullback-Leibler divergence and Mutual Information for feature significance analysis. In addition, we have discussed similarity search concepts that utilize an information theory framework. Information-theoretic concepts are expected to play an increasingly important role in chemoinformatics research, in particular, for fingerprint engineering applications, molecular similarity assessment, and large-scale information content analysis of steadily growing chemical databases.

References

  1. Engel, T. Basic overview of chemoinformatics. J. Chem. Inf. Model. 2006, 46, 2267–2277. [Google Scholar] [CrossRef] [PubMed]
  2. Brown, F.K. Chemoinformatics: What is it and how does it impact drug discovery. Annu. Rep. Med. Chem. 1998, 33, 375–384. [Google Scholar]
  3. Todeschini, R.; Consonni, V. Handbook of Molecular Descriptors; Wiley-VCH: Weinheim, Germany, 2000. [Google Scholar]
  4. Bajorath, J. Integration of virtual and high-throughput screening. Nat. Rev. Drug. Discov. 2002, 1, 882–894. [Google Scholar] [CrossRef] [PubMed]
  5. Shannon, C.E.; Weaver, W. The Mathematical Theory of Communication; University of Illinois Press: Urbana, IL, USA, 1963. [Google Scholar]
  6. Rashevsky, N. Life, information theory, and topology. Bull. Math. Biophys. 1955, 17, 229–235. [Google Scholar] [CrossRef]
  7. Trucco, E. A note on the information content of graphs. Bull. Math. Biophys. 1956, 18, 129–135. [Google Scholar] [CrossRef]
  8. Trucco, E. On the information content of graphs: Compound symbols; Different states for each point. Bull. Math. Biophys. 1956, 8, 237–253. [Google Scholar] [CrossRef]
  9. Mowshowitz, A. Entropy and the complexity of graphs: I. An index of the relative complexity of a graph. Bull. Math. Biophys. 1968, 30, 175–204. [Google Scholar] [CrossRef] [PubMed]
  10. Mowshowitz, A. Entropy and the complexity of graphs: II. The information content of digraphs and infinite graphs. Bull. Math. Biophys. 1968, 30, 225–240. [Google Scholar] [CrossRef] [PubMed]
  11. Mowshowitz, A. Entropy and the complexity of graphs: III. Graphs with prescribed information content. Bull. Math. Biophys. 1968, 30, 387–414. [Google Scholar] [CrossRef]
  12. Mowshowitz, A. Entropy and the complexity of graphs: IV. Entropy measures and graphical structure. Bull. Math. Biophys. 1968, 30, 533–546. [Google Scholar] [CrossRef]
  13. Bertz, S.H. The first general index of molecular complexity. J. Am. Chem. Soc. 1981, 103, 3599–3601. [Google Scholar] [CrossRef]
  14. Bertz, S.H. On the complexity of graphs and molecules. Bull. Math. Biol. 1983, 45, 849–855. [Google Scholar] [CrossRef]
  15. Bonchev, D.; Kamenski, D.; Kamenska, V. Symmetry and information content of chemical structures. Bull. Math. Biol. 1976, 38, 119–133. [Google Scholar] [CrossRef]
  16. Bonchev, D.; Trinajstić, N. Information theory, distance matrix, and molecular branching. J. Chem. Phys. 1977, 67, 4517–4533. [Google Scholar] [CrossRef]
  17. Gregori-Puigjané, E.; Mestres, J. SHED: Shannon entropy descriptors from topological feature distributions. J. Chem. Inf. Model. 2006, 46, 1615–1622. [Google Scholar] [CrossRef] [PubMed]
  18. Eckert, H.; Bajorath, J. Molecular similarity analysis in virtual screening: foundations, limitations and novel approaches. Drug Discov. Today 2007, 12, 225–233. [Google Scholar] [CrossRef] [PubMed]
  19. Johnson, M.A.; Maggiora, G. (Eds.) Concepts and Applications of Molecular Similarity; John Wiley & Sons: New York, NY, USA, 1990.
  20. Willett, P.; Barnard, J.M.; Downs, G.M. Chemical similarity searching. J. Chem. Inf. Comput. Sci. 1998, 38, 983–996. [Google Scholar] [CrossRef]
  21. Wang, Y.; Bajorath, J. Bit silencing in fingerprints enables the derivation of compound class-directed similarity metrics. J. Chem. Inf. Model. 2008, 48, 1754–1759. [Google Scholar] [CrossRef] [PubMed]
  22. Hu, Y.; Lounkine, E.; Bajorath, J. Improving the performance of extended connectivity fingerprints through activity-oriented feature filtering and application of a bit density-dependent similarity function. ChemMedChem. 2009, 4, 540–548. [Google Scholar] [CrossRef] [PubMed]
  23. Kullback, S. Information Theory and Statistics; Dover Publications: Mineola, MN, USA, 1997. [Google Scholar]
  24. Quinlan, J.R. Induction of decision trees. Mach. Learn. 1986, 1, 81–106. [Google Scholar]
  25. Nisius, B.; Vogt, M.; Bajorath, J. Development of a fingerprint reduction approach for Bayesian similarity searching based on Kullback-Leibler divergence analysis. J. Chem. Inf. Model. 2009, 49, 1347–1358. [Google Scholar] [CrossRef] [PubMed]
  26. Vogt, M.; Godden, J.W.; Bajorath, J. Bayesian interpretation of a distance function for navigating high-dimensional descriptor spaces. J. Chem. Inf. Model. 2007, 47, 39–46. [Google Scholar] [CrossRef] [PubMed]
  27. Vogt, M; Bajorath, J. Bayesian similarity searching in high-dimensional descriptor spaces combined with Kullback-Leibler descriptor divergence analysis. J. Chem. Inf. Model. 2008, 48, 247–255. [Google Scholar] [CrossRef] [PubMed]
  28. Nisius, B.; Bajorath, J. Molecular fingerprint recombination: generating hybrid fingerprints for similarity searching from different fingerprint types. ChemMedChem 2009, 4, 1859–1863. [Google Scholar] [CrossRef] [PubMed]
  29. Nisius, B.; Bajorath, J. Reduction and recombination of fingerprints of different design increase compound recall and the structural diversity of hits. Chem. Biol. Drug Des. 2010, 75, 152–160. [Google Scholar] [CrossRef] [PubMed]
  30. Vogt, M.; Bajorath, J. Introduction of an information-theoretic method to predict recovery rates of active compounds for Bayesian in silico screening: Theory and screening trials. J. Chem. Inf. Model. 2007, 47, 337–341. [Google Scholar] [CrossRef]
  31. Vogt, M.; Bajorath, J. Introduction of a generally applicable method to estimate retrieval of active molecules for similarity searching using fingerprints. ChemMedChem 2007, 2, 1311–1320. [Google Scholar] [CrossRef] [PubMed]
  32. Cover, T.M.; Thomas, J.A. Elements of Information Theory; John Wiley & Sons, Inc.: New York, NY, USA, 1991. [Google Scholar]
  33. Liu, Y. A Comparative study on feature selection methods for drug discovery. J. Chem. Inf. Model. 2004, 44, 1823–1828. [Google Scholar]
  34. Venkatraman, V.; Dalby, A.R.; Yang, Z.R. Evaluation of mutual information and genetic programming for feature selection in QSAR. J. Chem. Inf. Comput. Sci. 2004, 44, 1686–1692. [Google Scholar] [CrossRef] [PubMed]
  35. Rogers, D.; Hahn, M. Extended-connectivity fingerprints. J. Chem. Inf. Model. 2010, 50, 742–754. [Google Scholar] [CrossRef] [PubMed]
  36. Bender, A; Mussa, H.Y.; Glen, R.C.; Reiling, S. Similarity searching of chemical databases using atom environment descriptors (MOLPRINT 2D): Evaluation of performance. J. Chem. Inf. Comput. Sci. 2004, 44, 1708–1718. [Google Scholar] [CrossRef] [PubMed]
  37. Lin, J. Divergence measures based on Shannon entropy. IEEE Trans. Inf. Theory 1991, 37, 145–151. [Google Scholar] [CrossRef]
  38. Godden, J.W.; Bajorath, J. Differential Shannon entropy as a sensitive measure of differences in database variability of molecular descriptors. J. Chem. Inf. Comput. Sci. 2001, 41, 1060–1066. [Google Scholar] [CrossRef] [PubMed]
  39. Stahura, F.L.; Godden, J.W.; Bajorath, J. Differential Shannon entropy analysis identifies molecular property descriptors that predict aqueous solubility of synthetic compounds with high accuracy in binary QSAR calculations. J. Chem. Inf. Comput. Sci. 2002, 42, 550–558. [Google Scholar] [CrossRef] [PubMed]
  40. Wang, Y.; Geppert, H.; Bajorath, J. Shannon entropy-based fingerprint similarity search strategy. J. Chem. Inf. Model. 2009, 49, 1687–1691. [Google Scholar] [CrossRef] [PubMed]
  41. Hert, J.; Willett, P.; Wilton, D.J.; Acklin, P.; Azzaoui, K.; Jacoby, E.; Schuffenhauer, A. Comparison of fingerprint-based methods for virtual screening using multiple bioactive reference structures. J. Chem. Inf. Comput. Sci. 2004, 44, 1177–1185. [Google Scholar] [CrossRef] [PubMed]

